


方案详情
文
采用LaVision的FlowMaster粒子成像测速系统,Religa Heart PED 45 VAD 模型进行了流体速度矢量场的测量。采用DaVis8.2软件平台进行数据处理分析。研究分析了气动心室辅助装置停滞的测定方法
方案详情

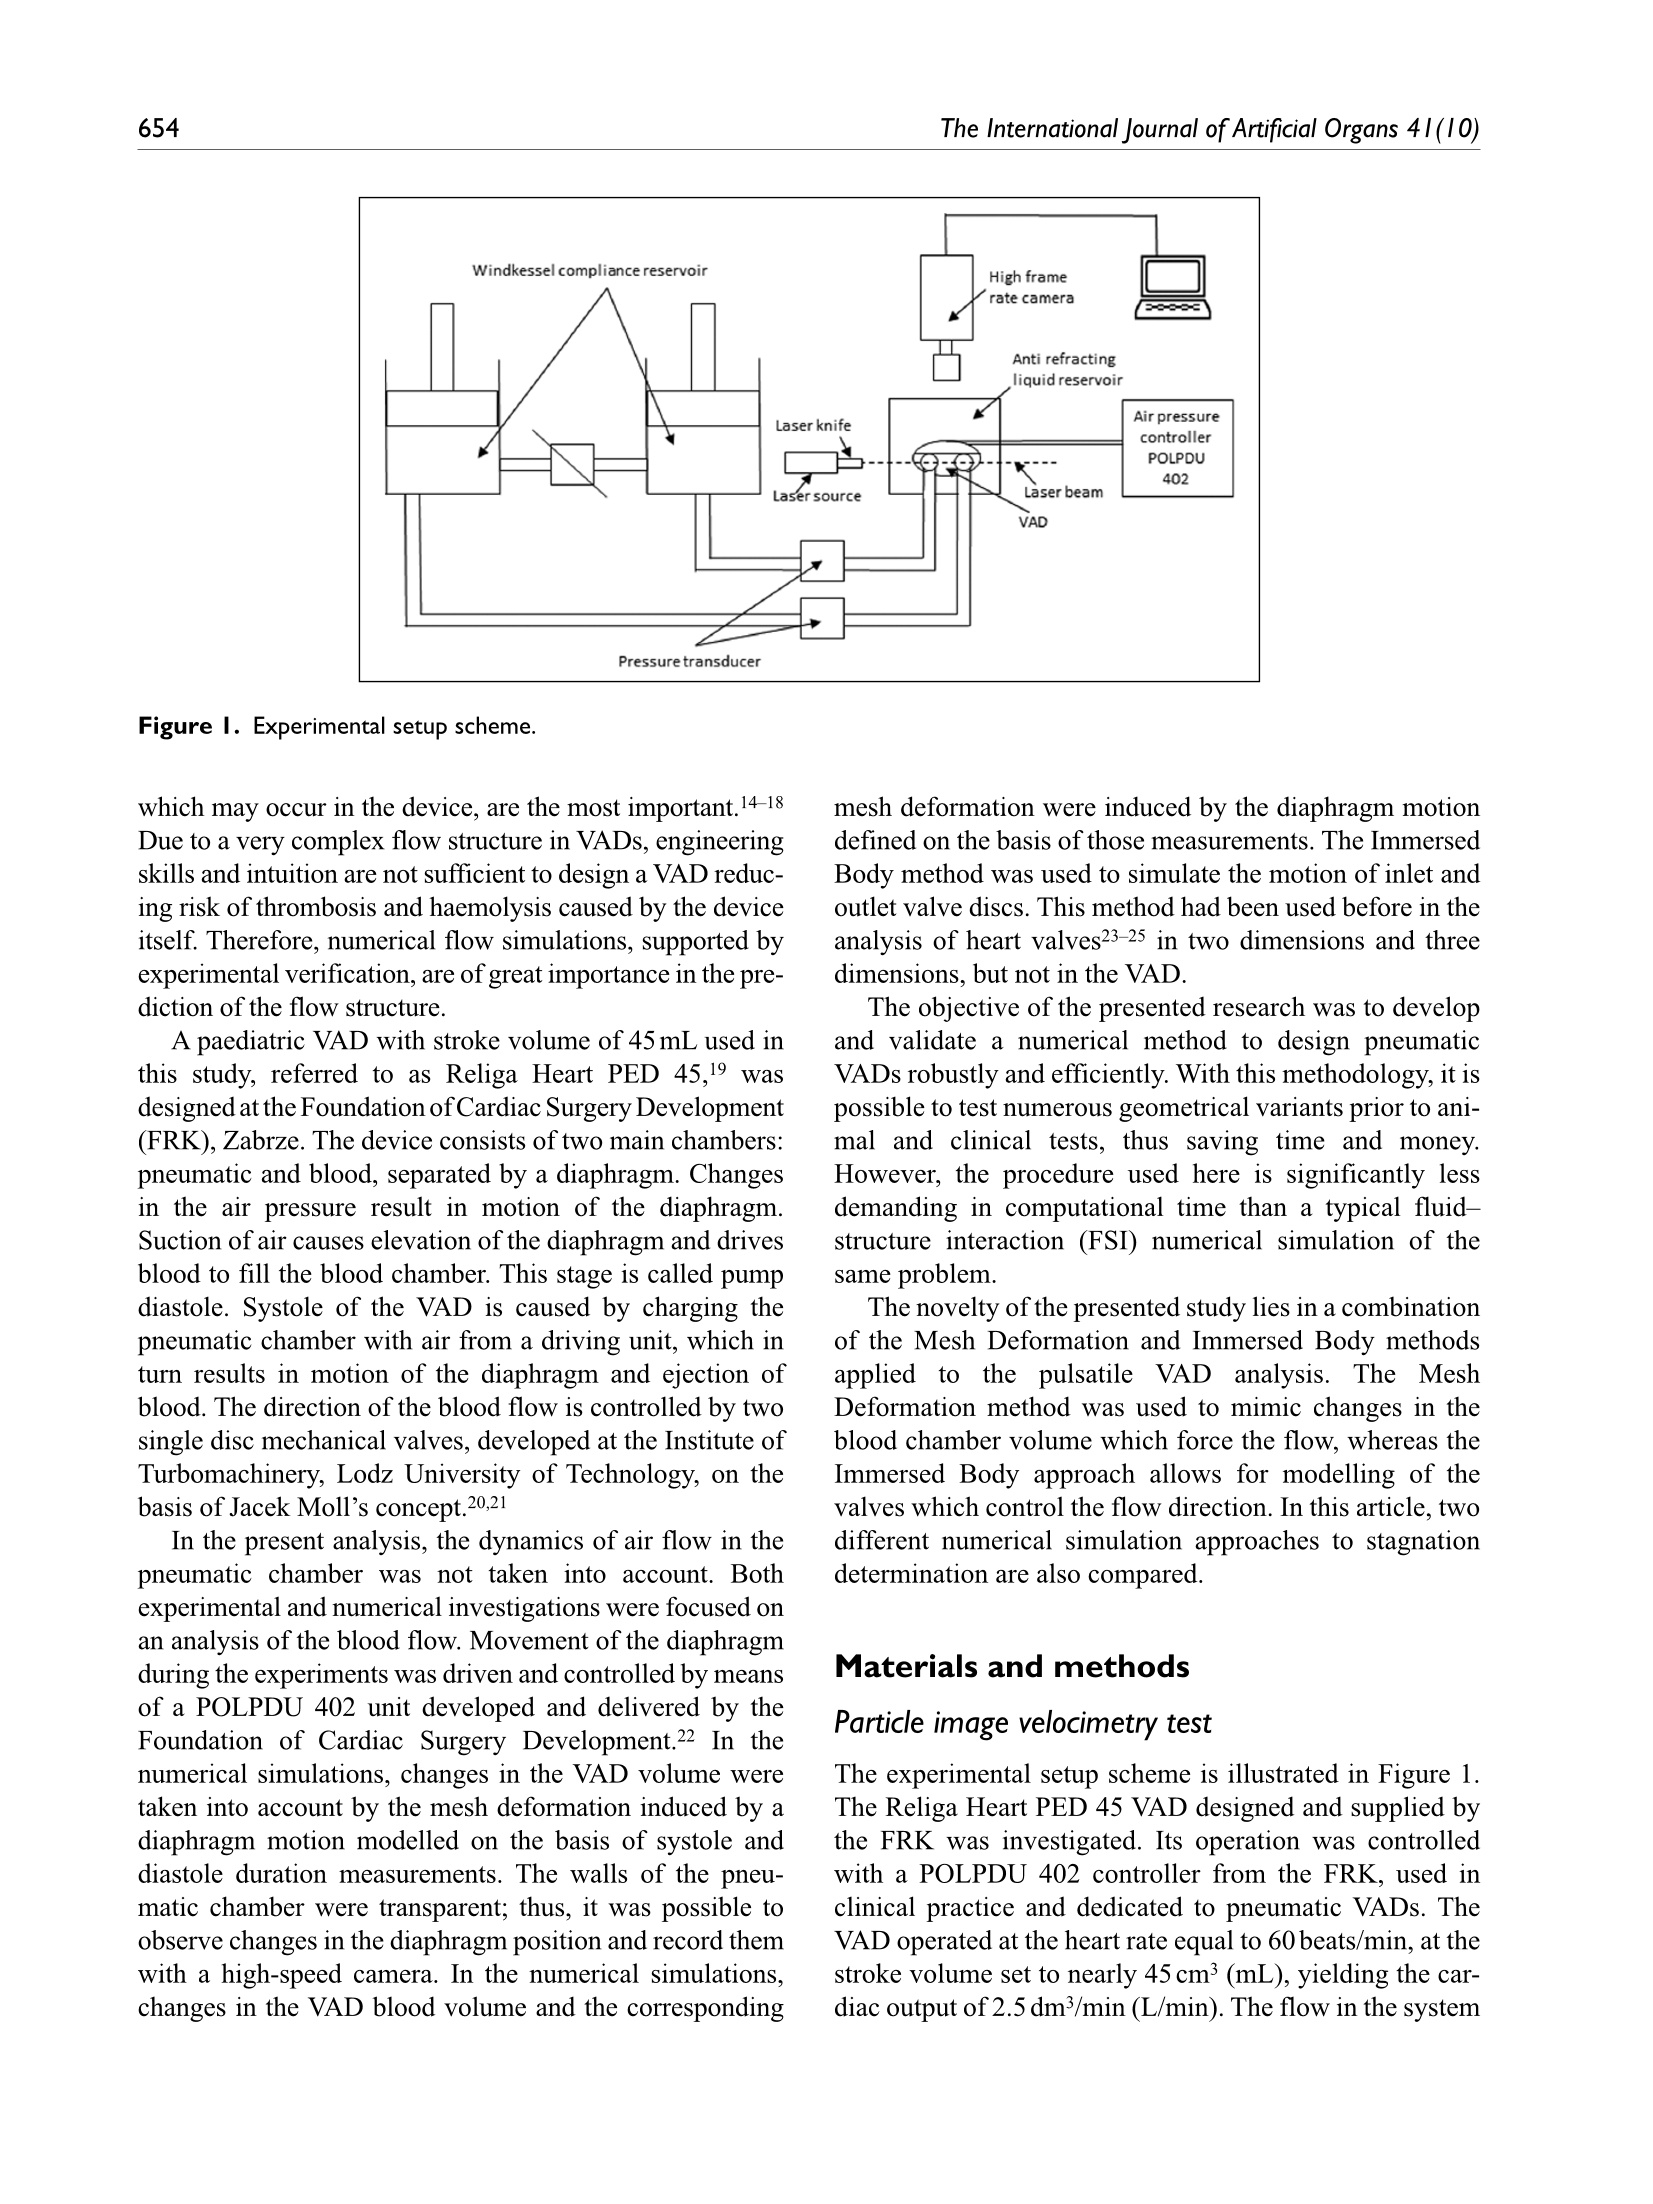
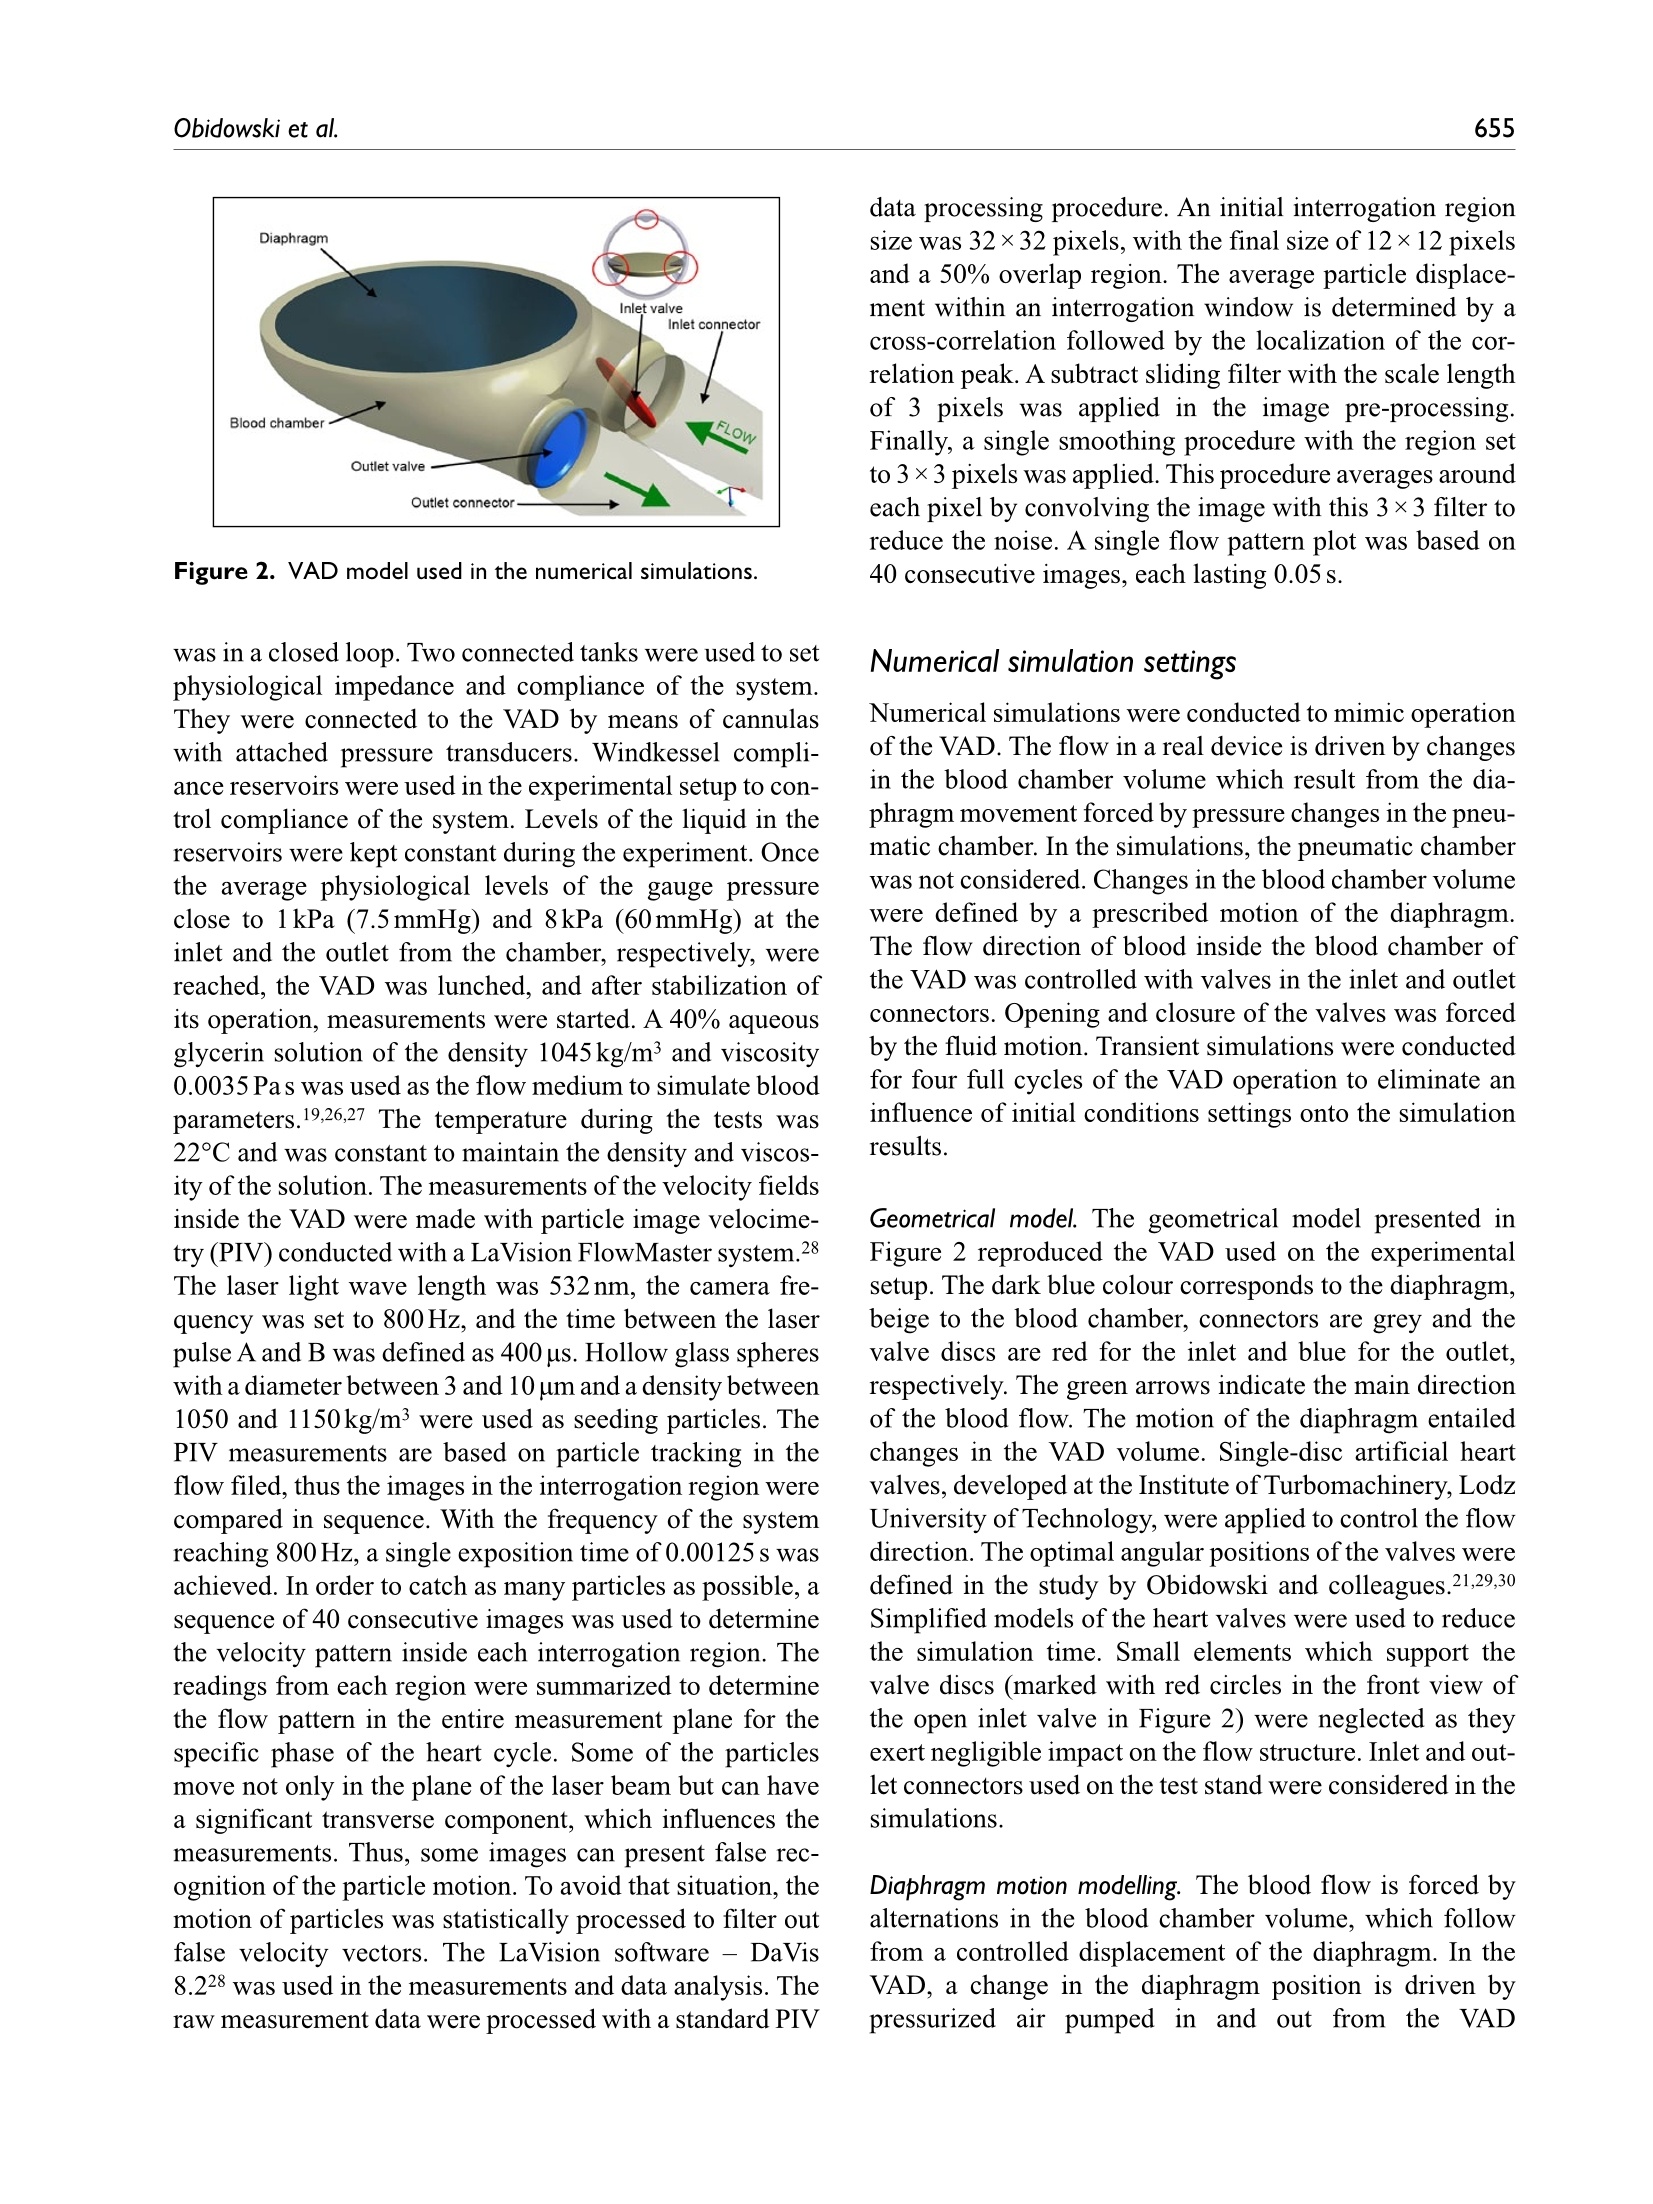
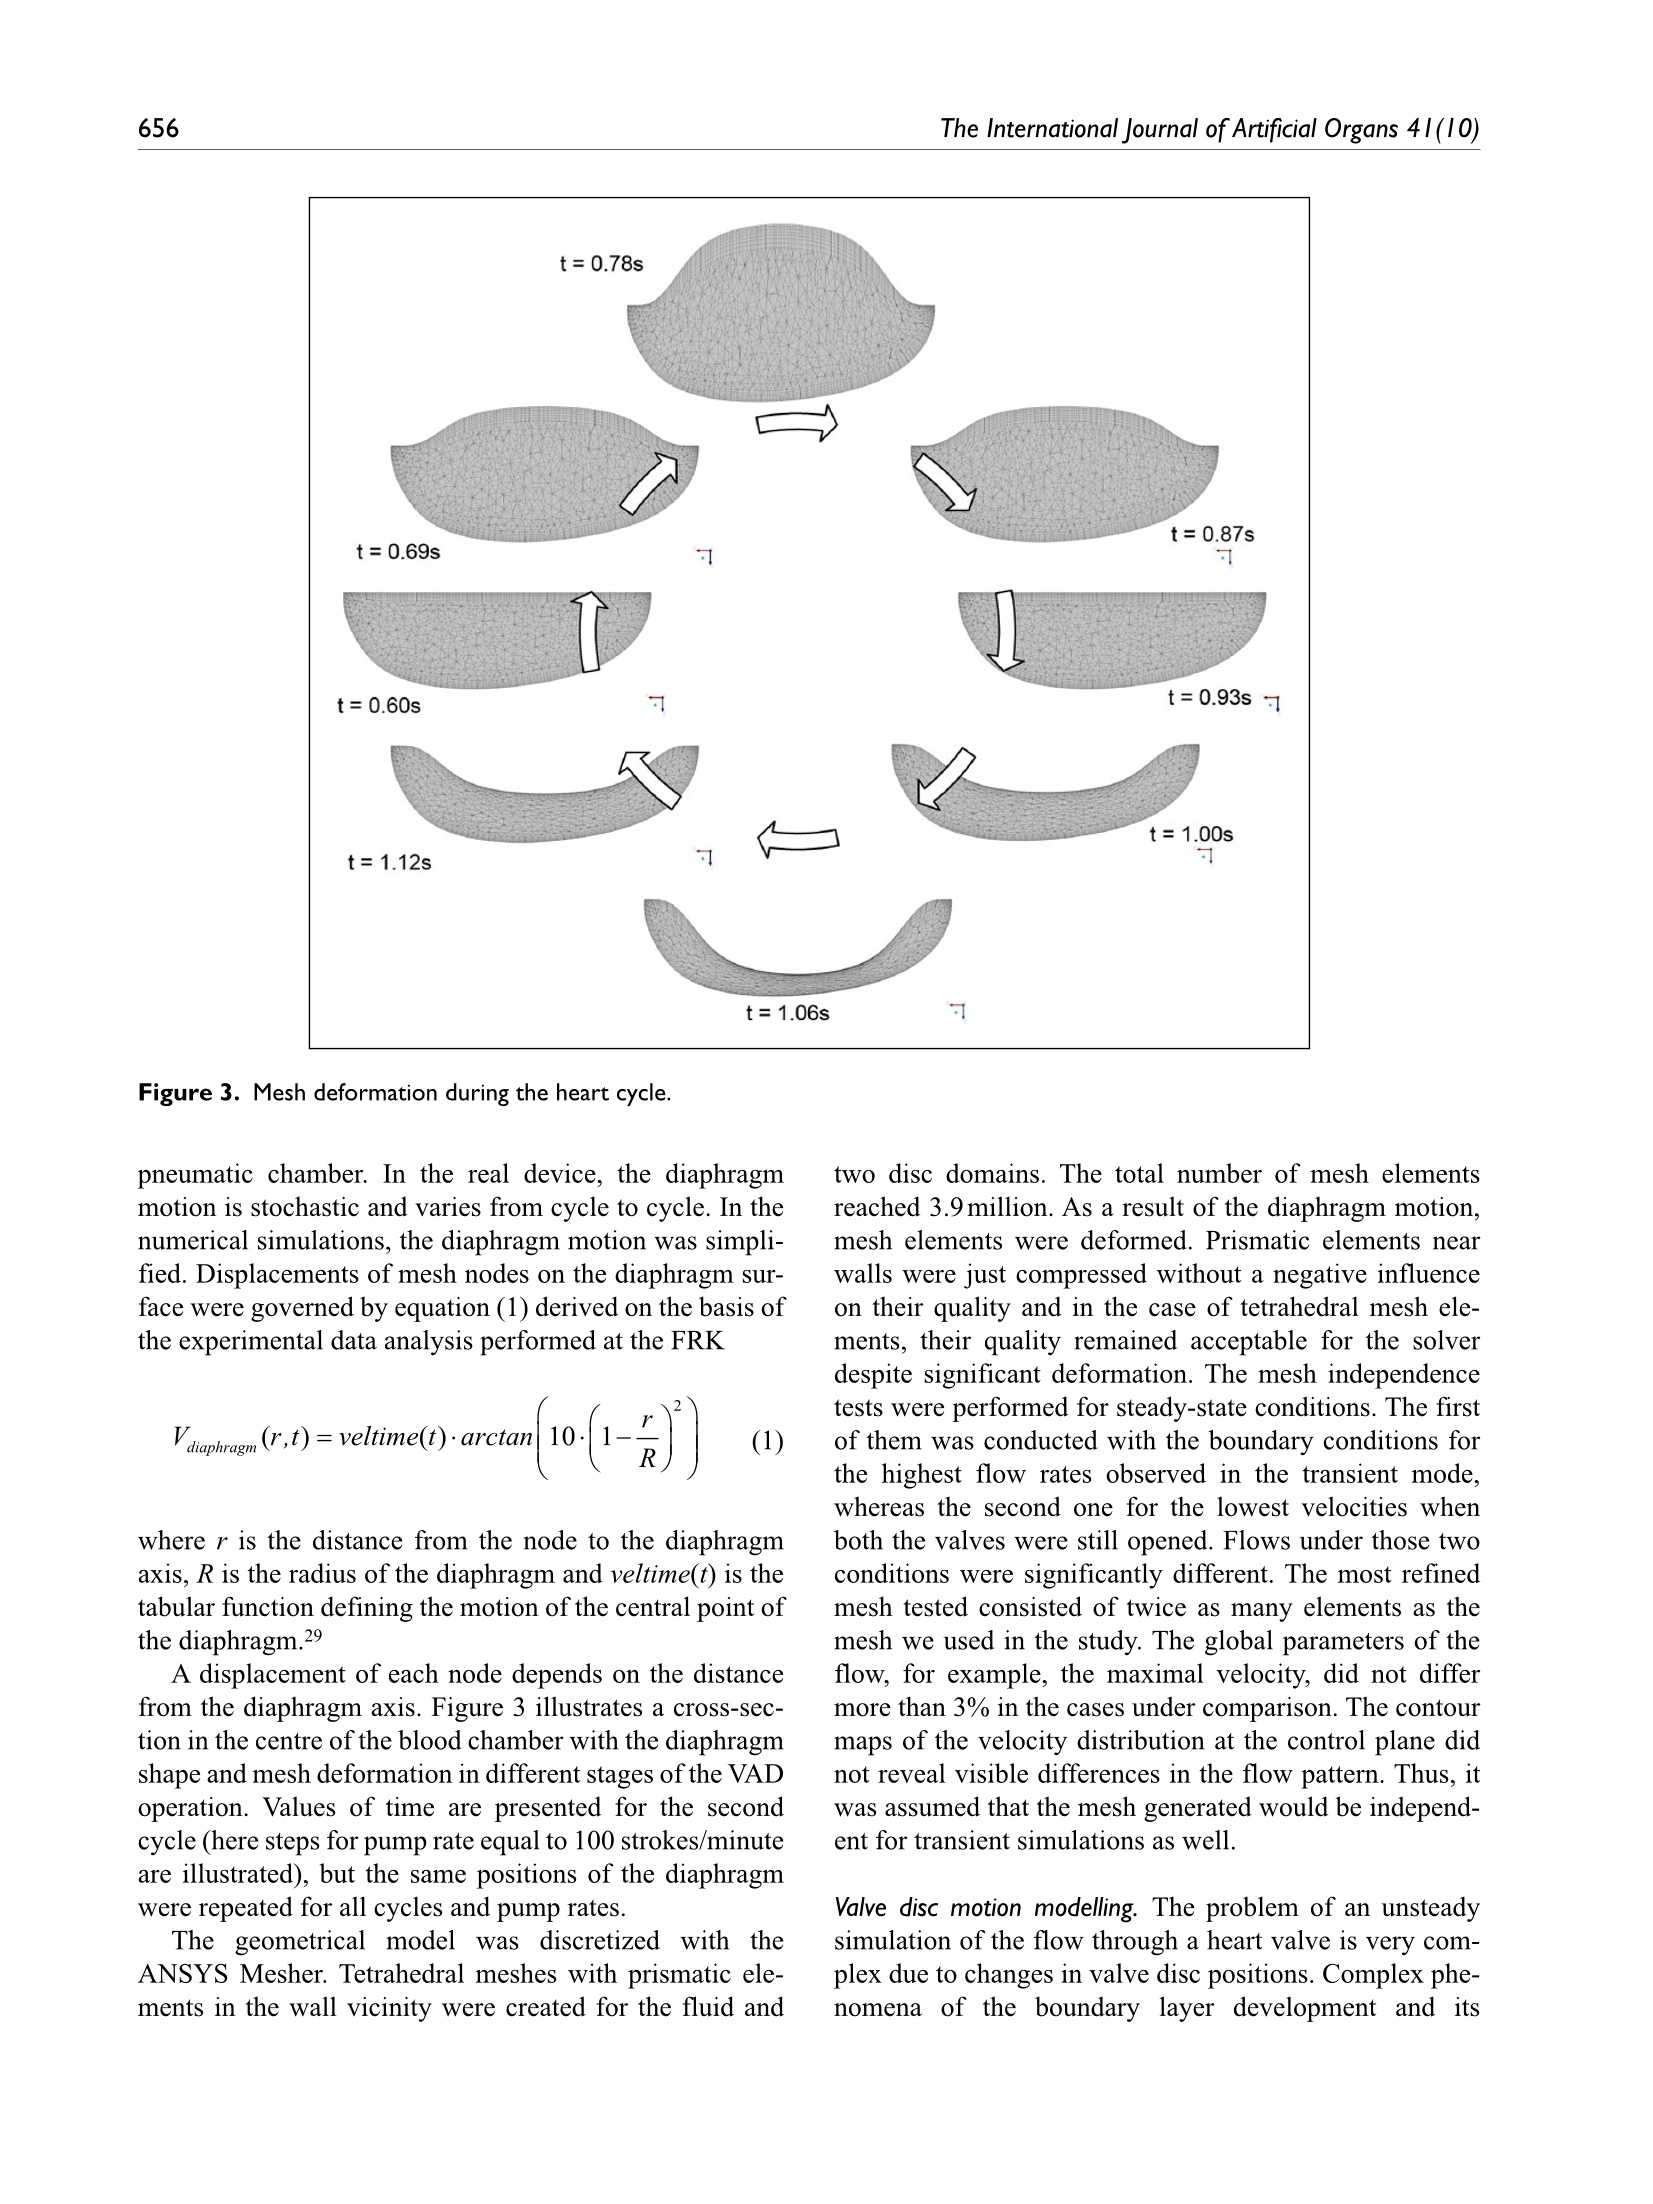
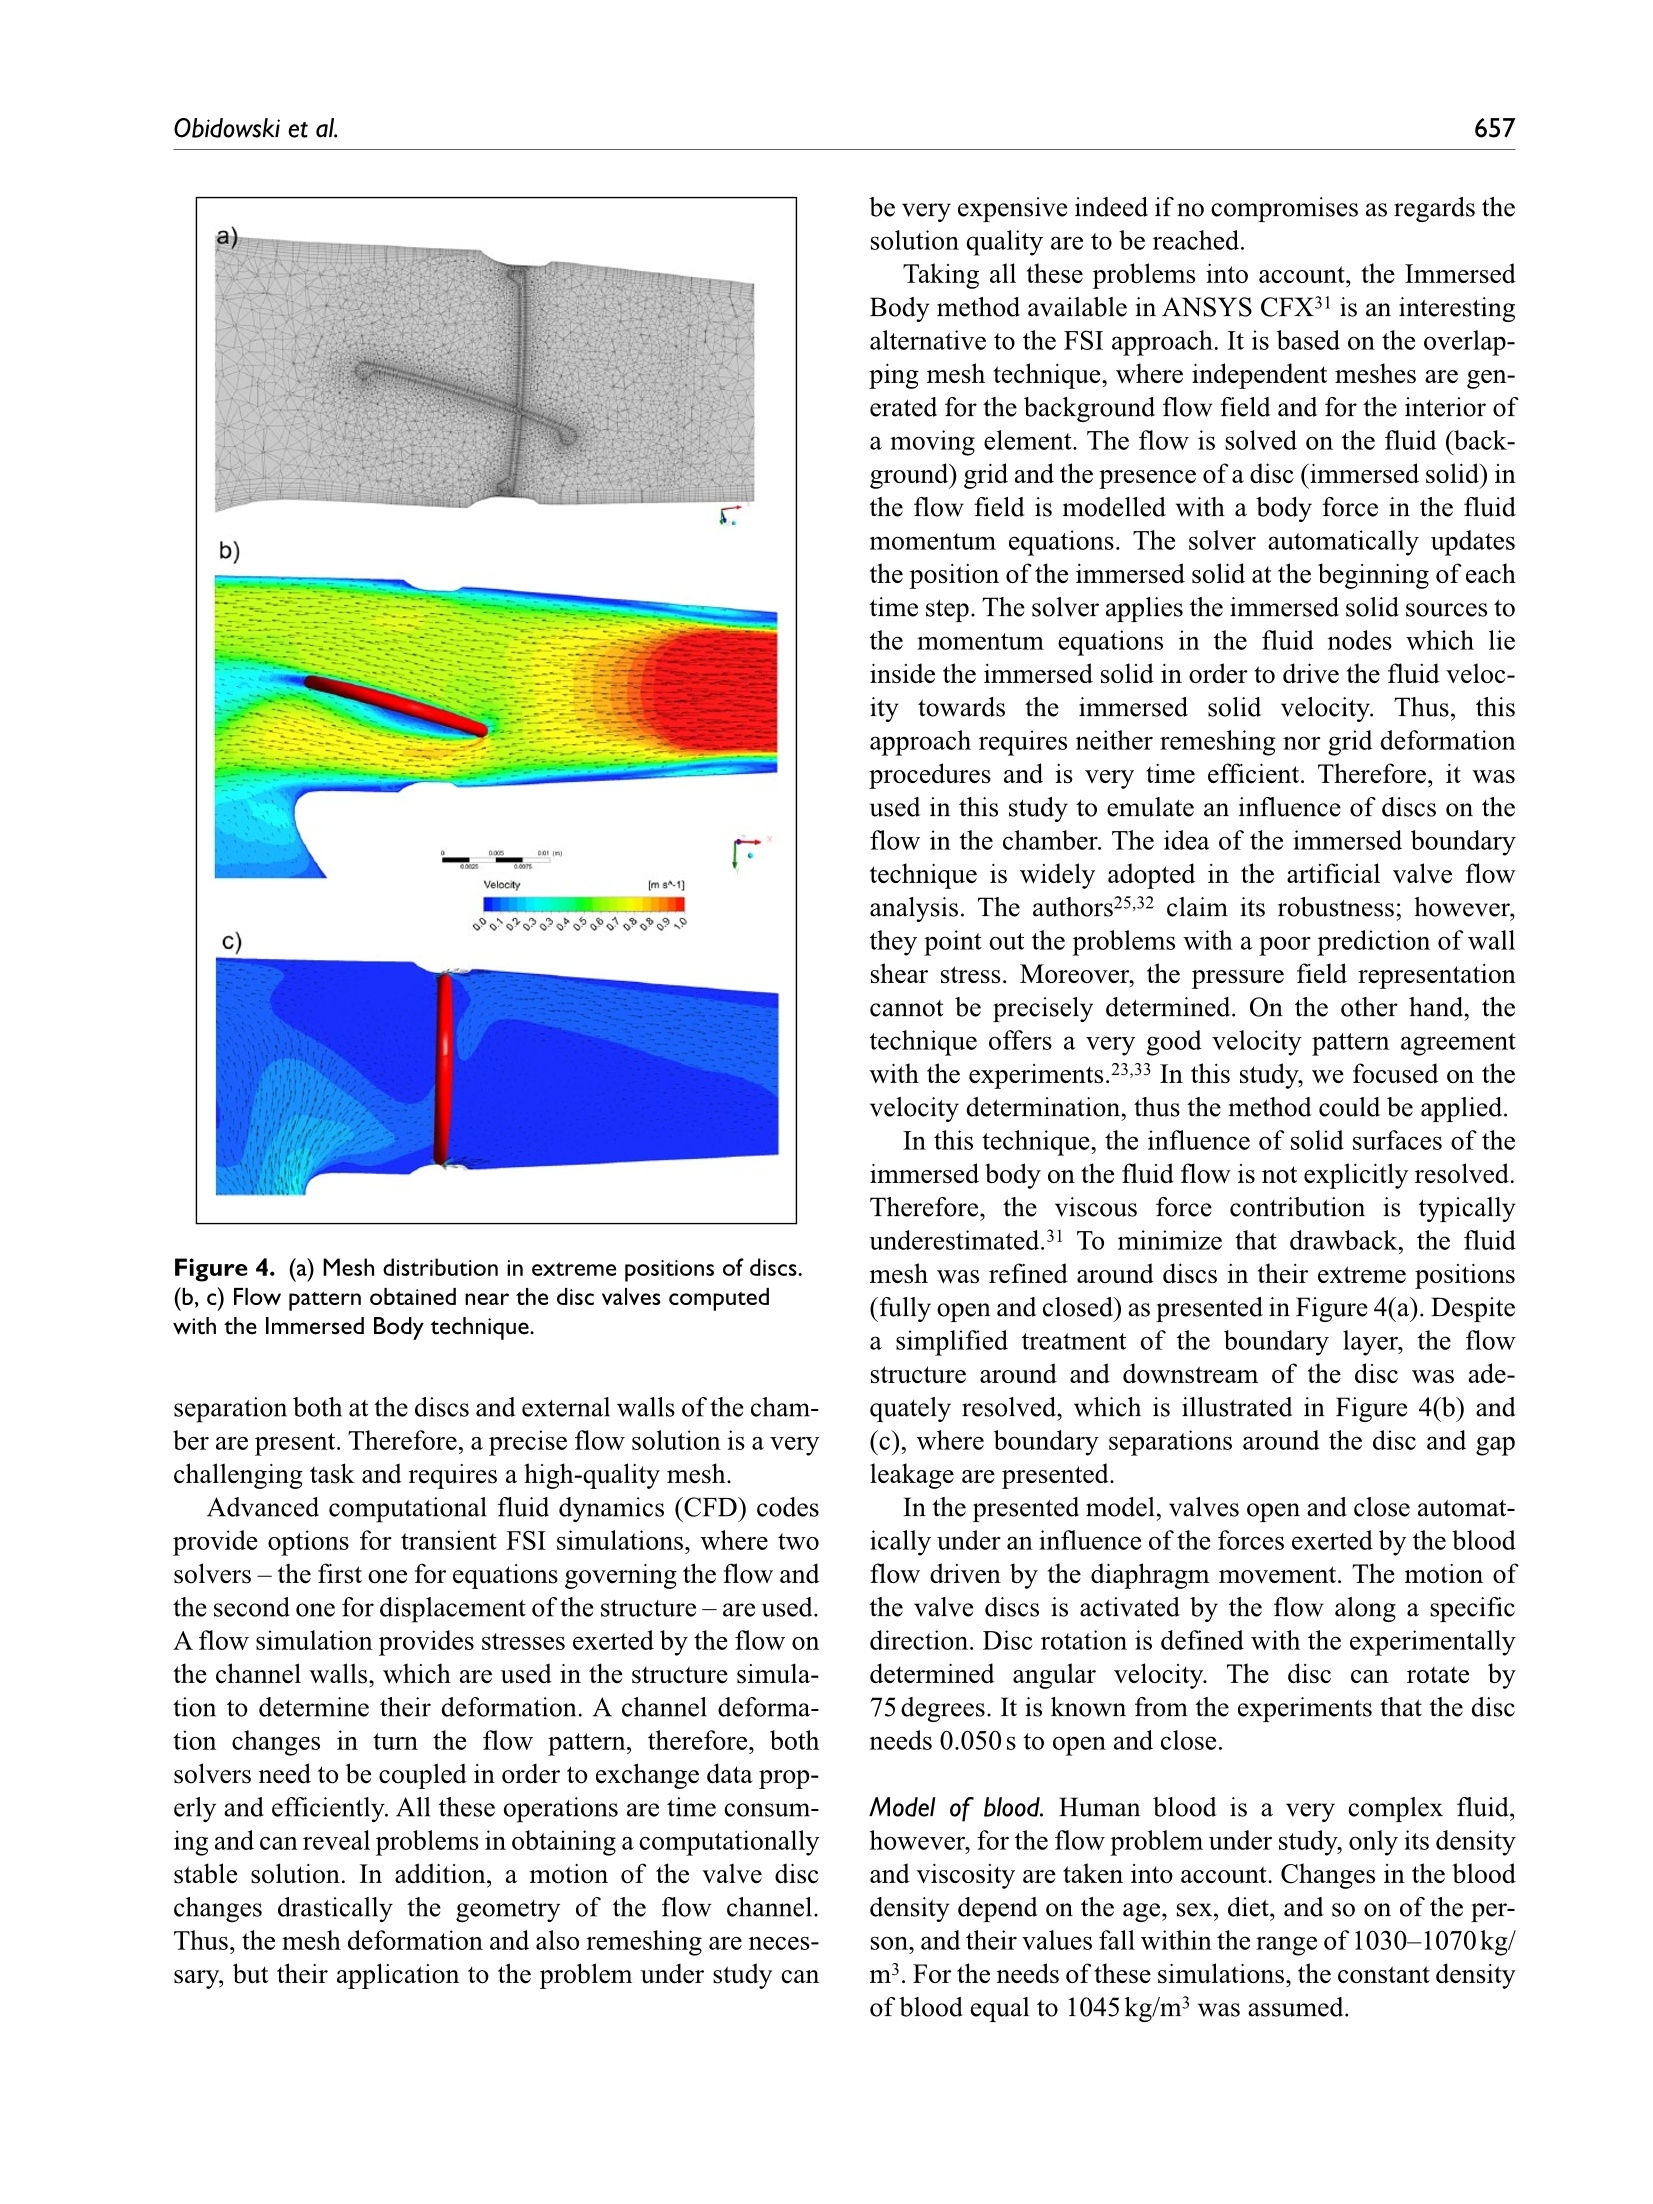
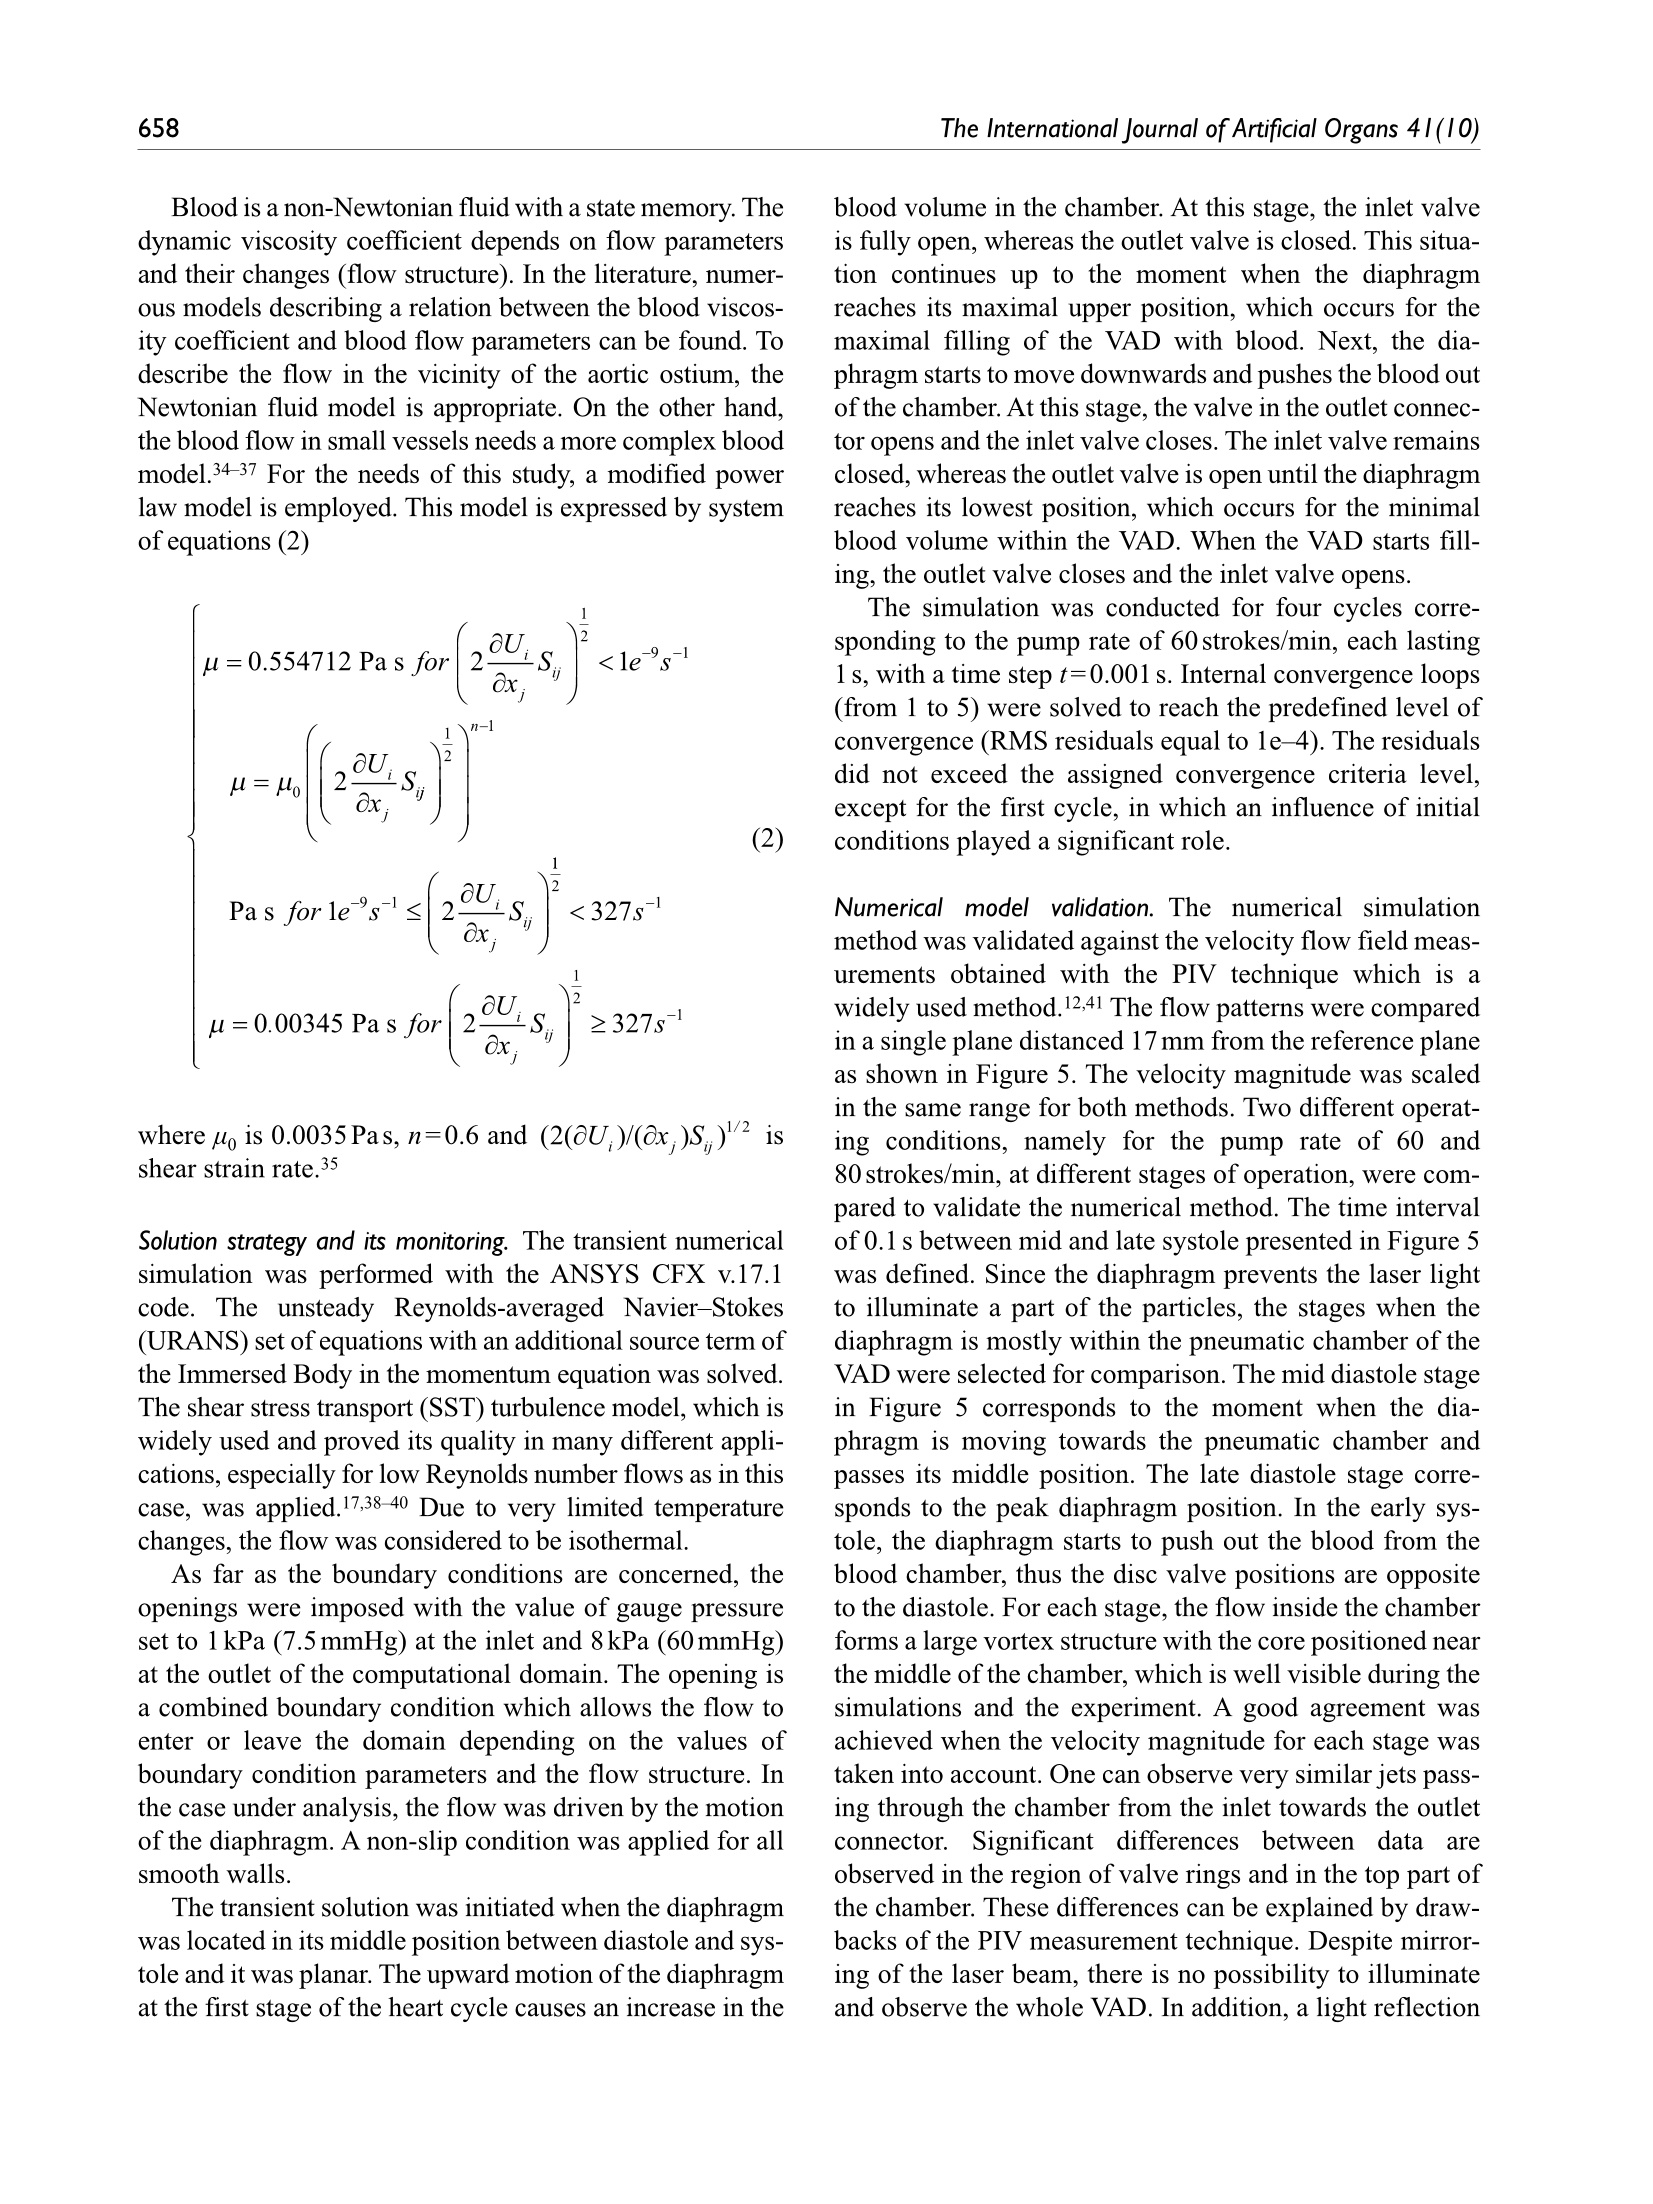
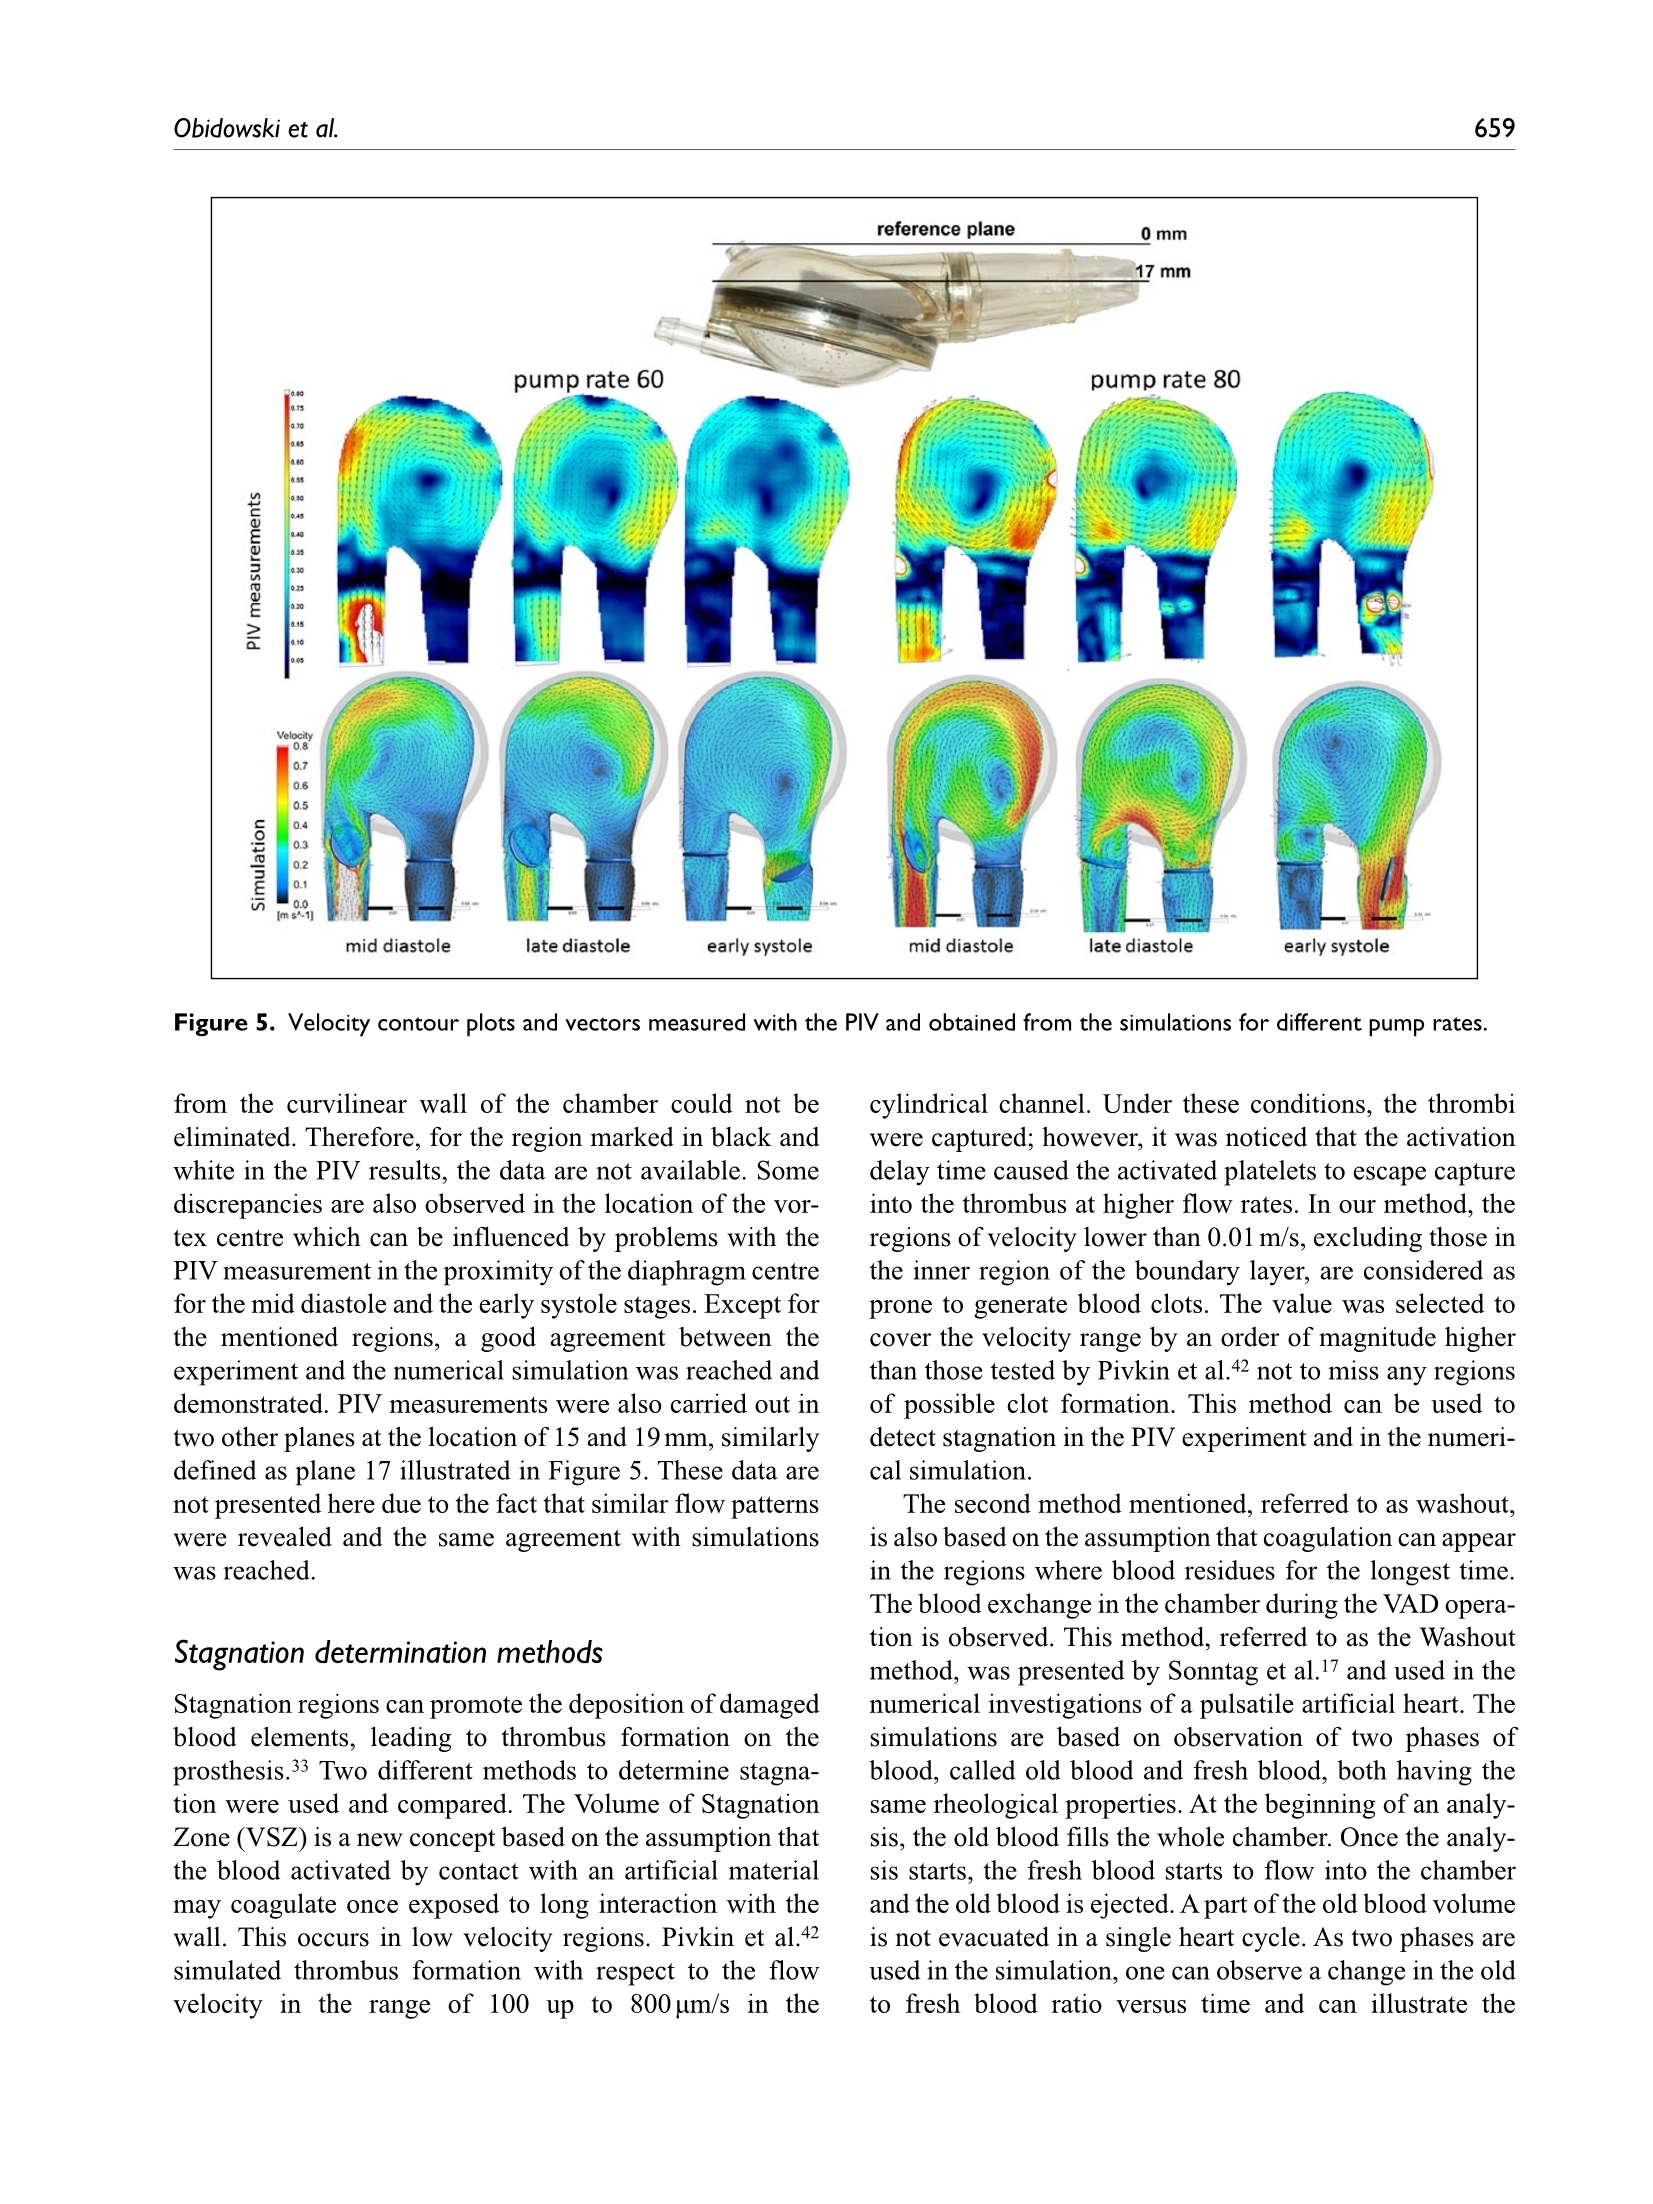
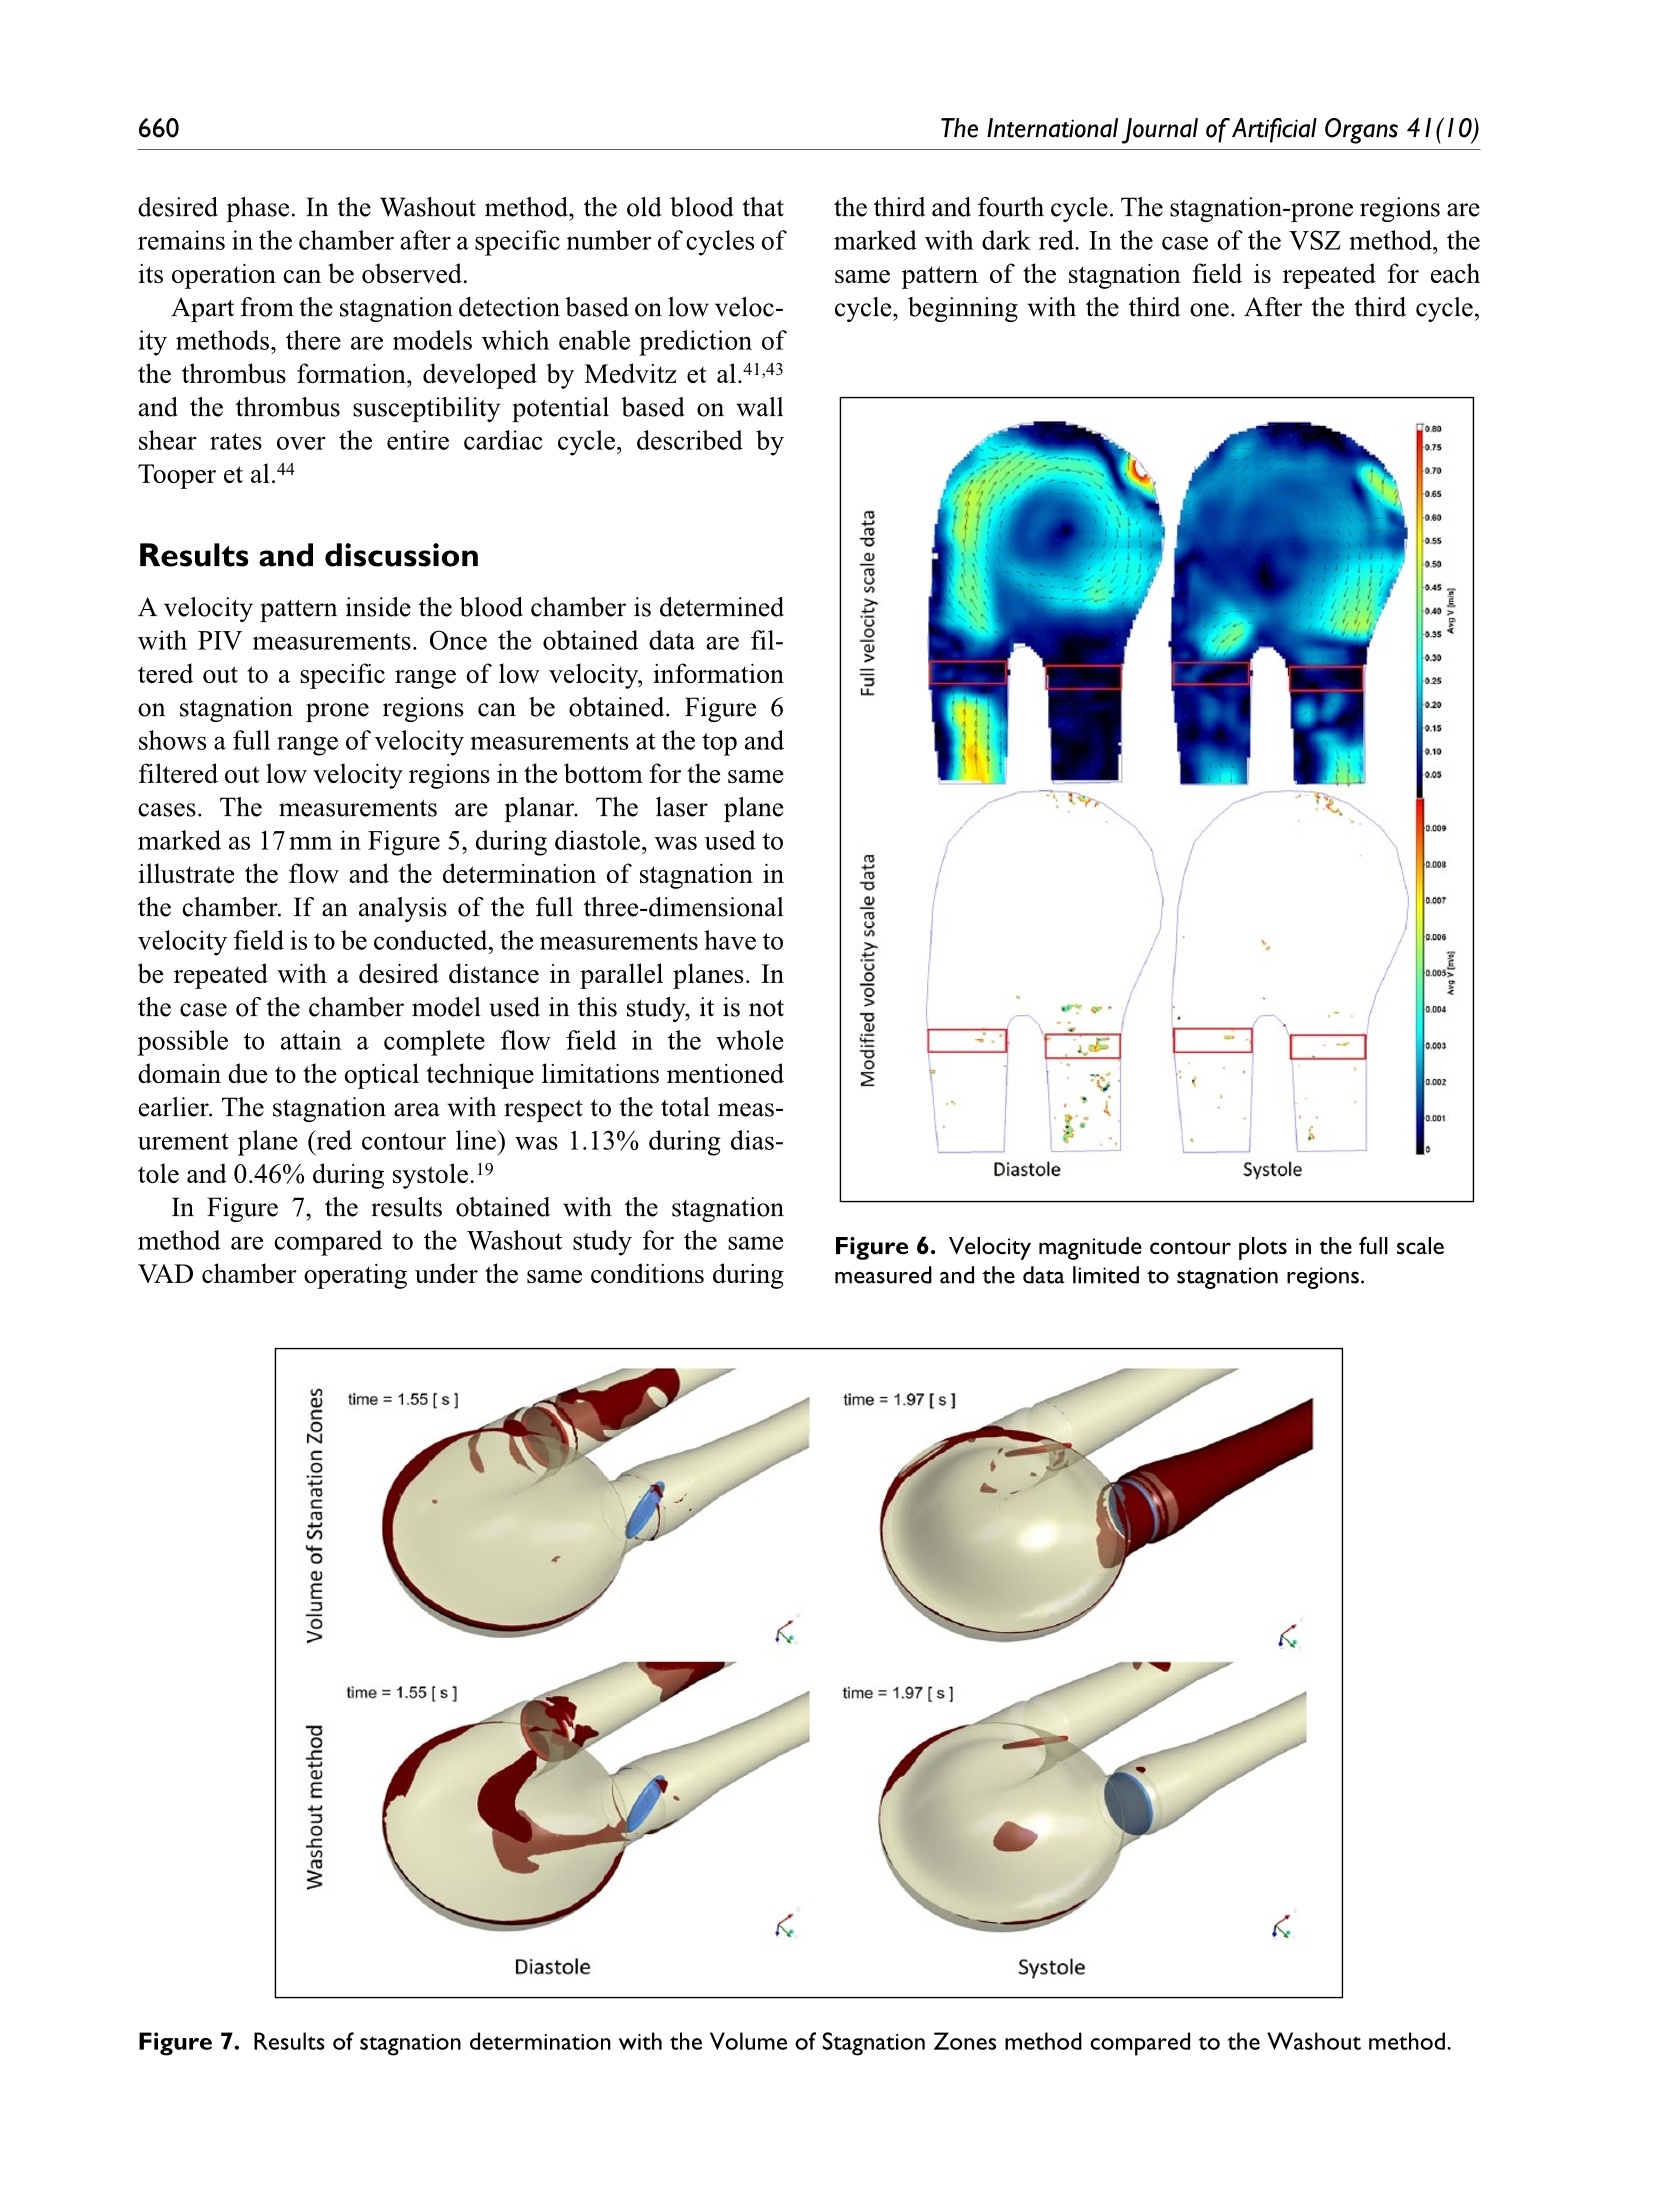
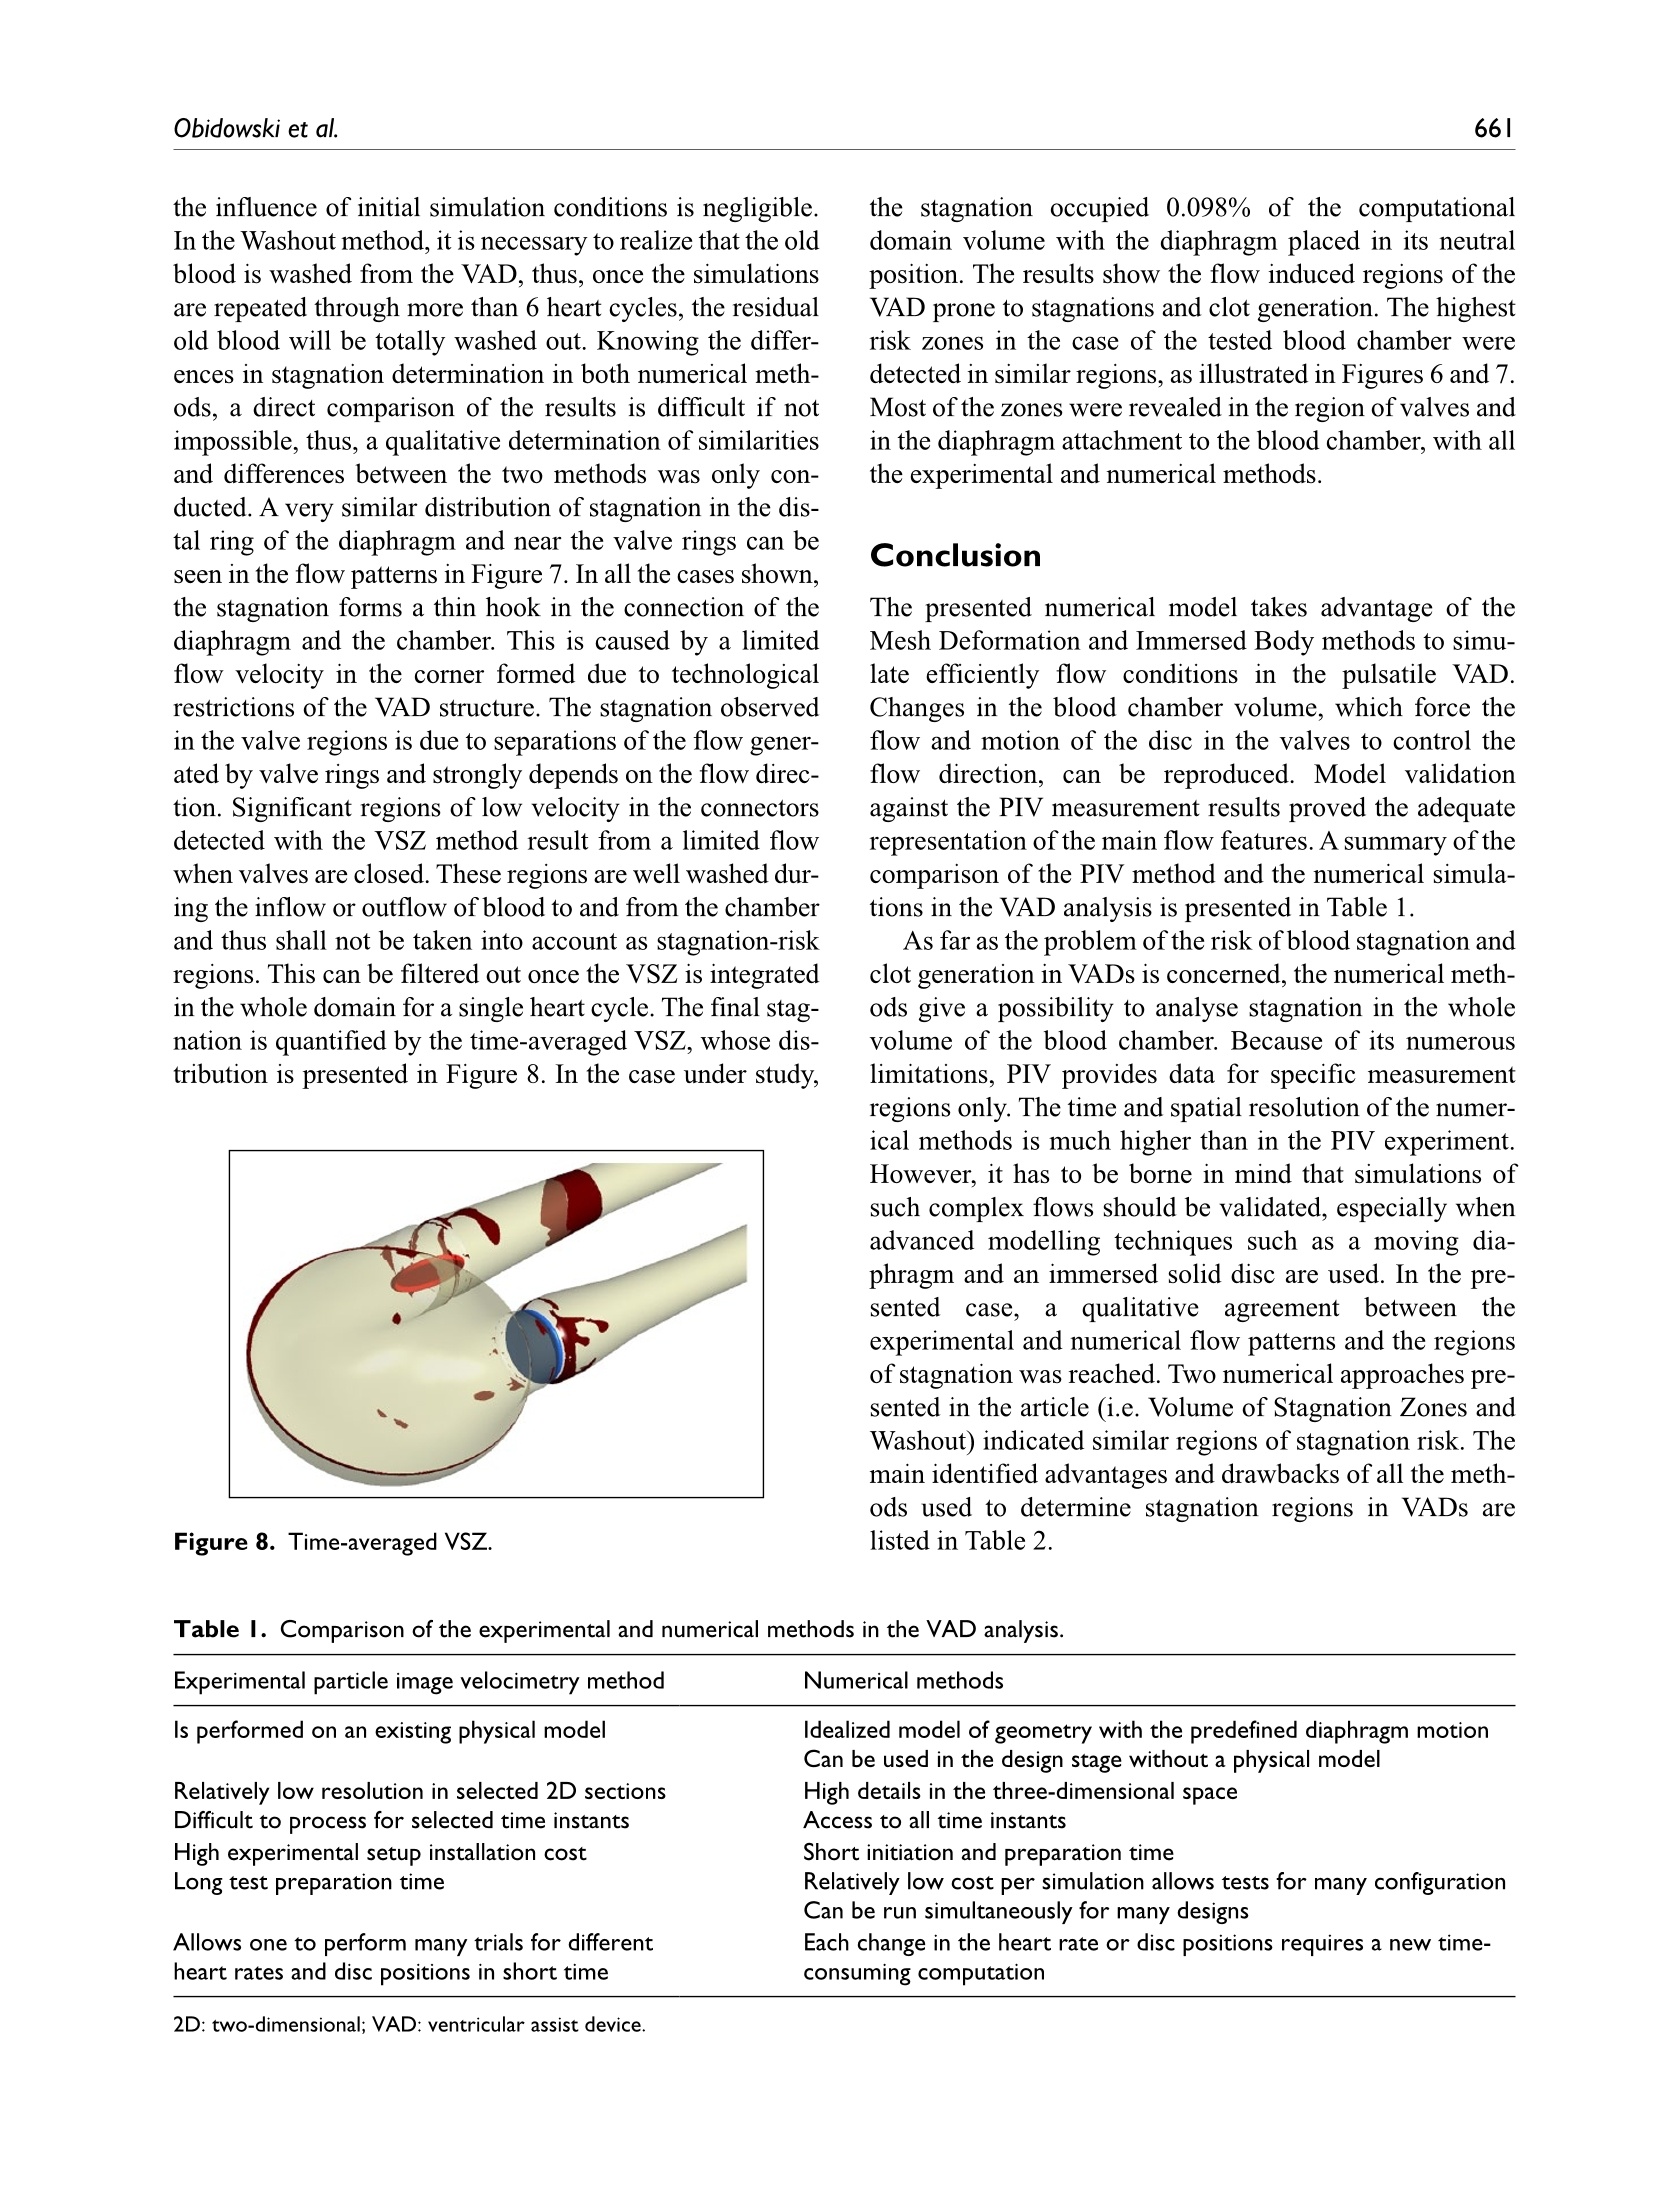
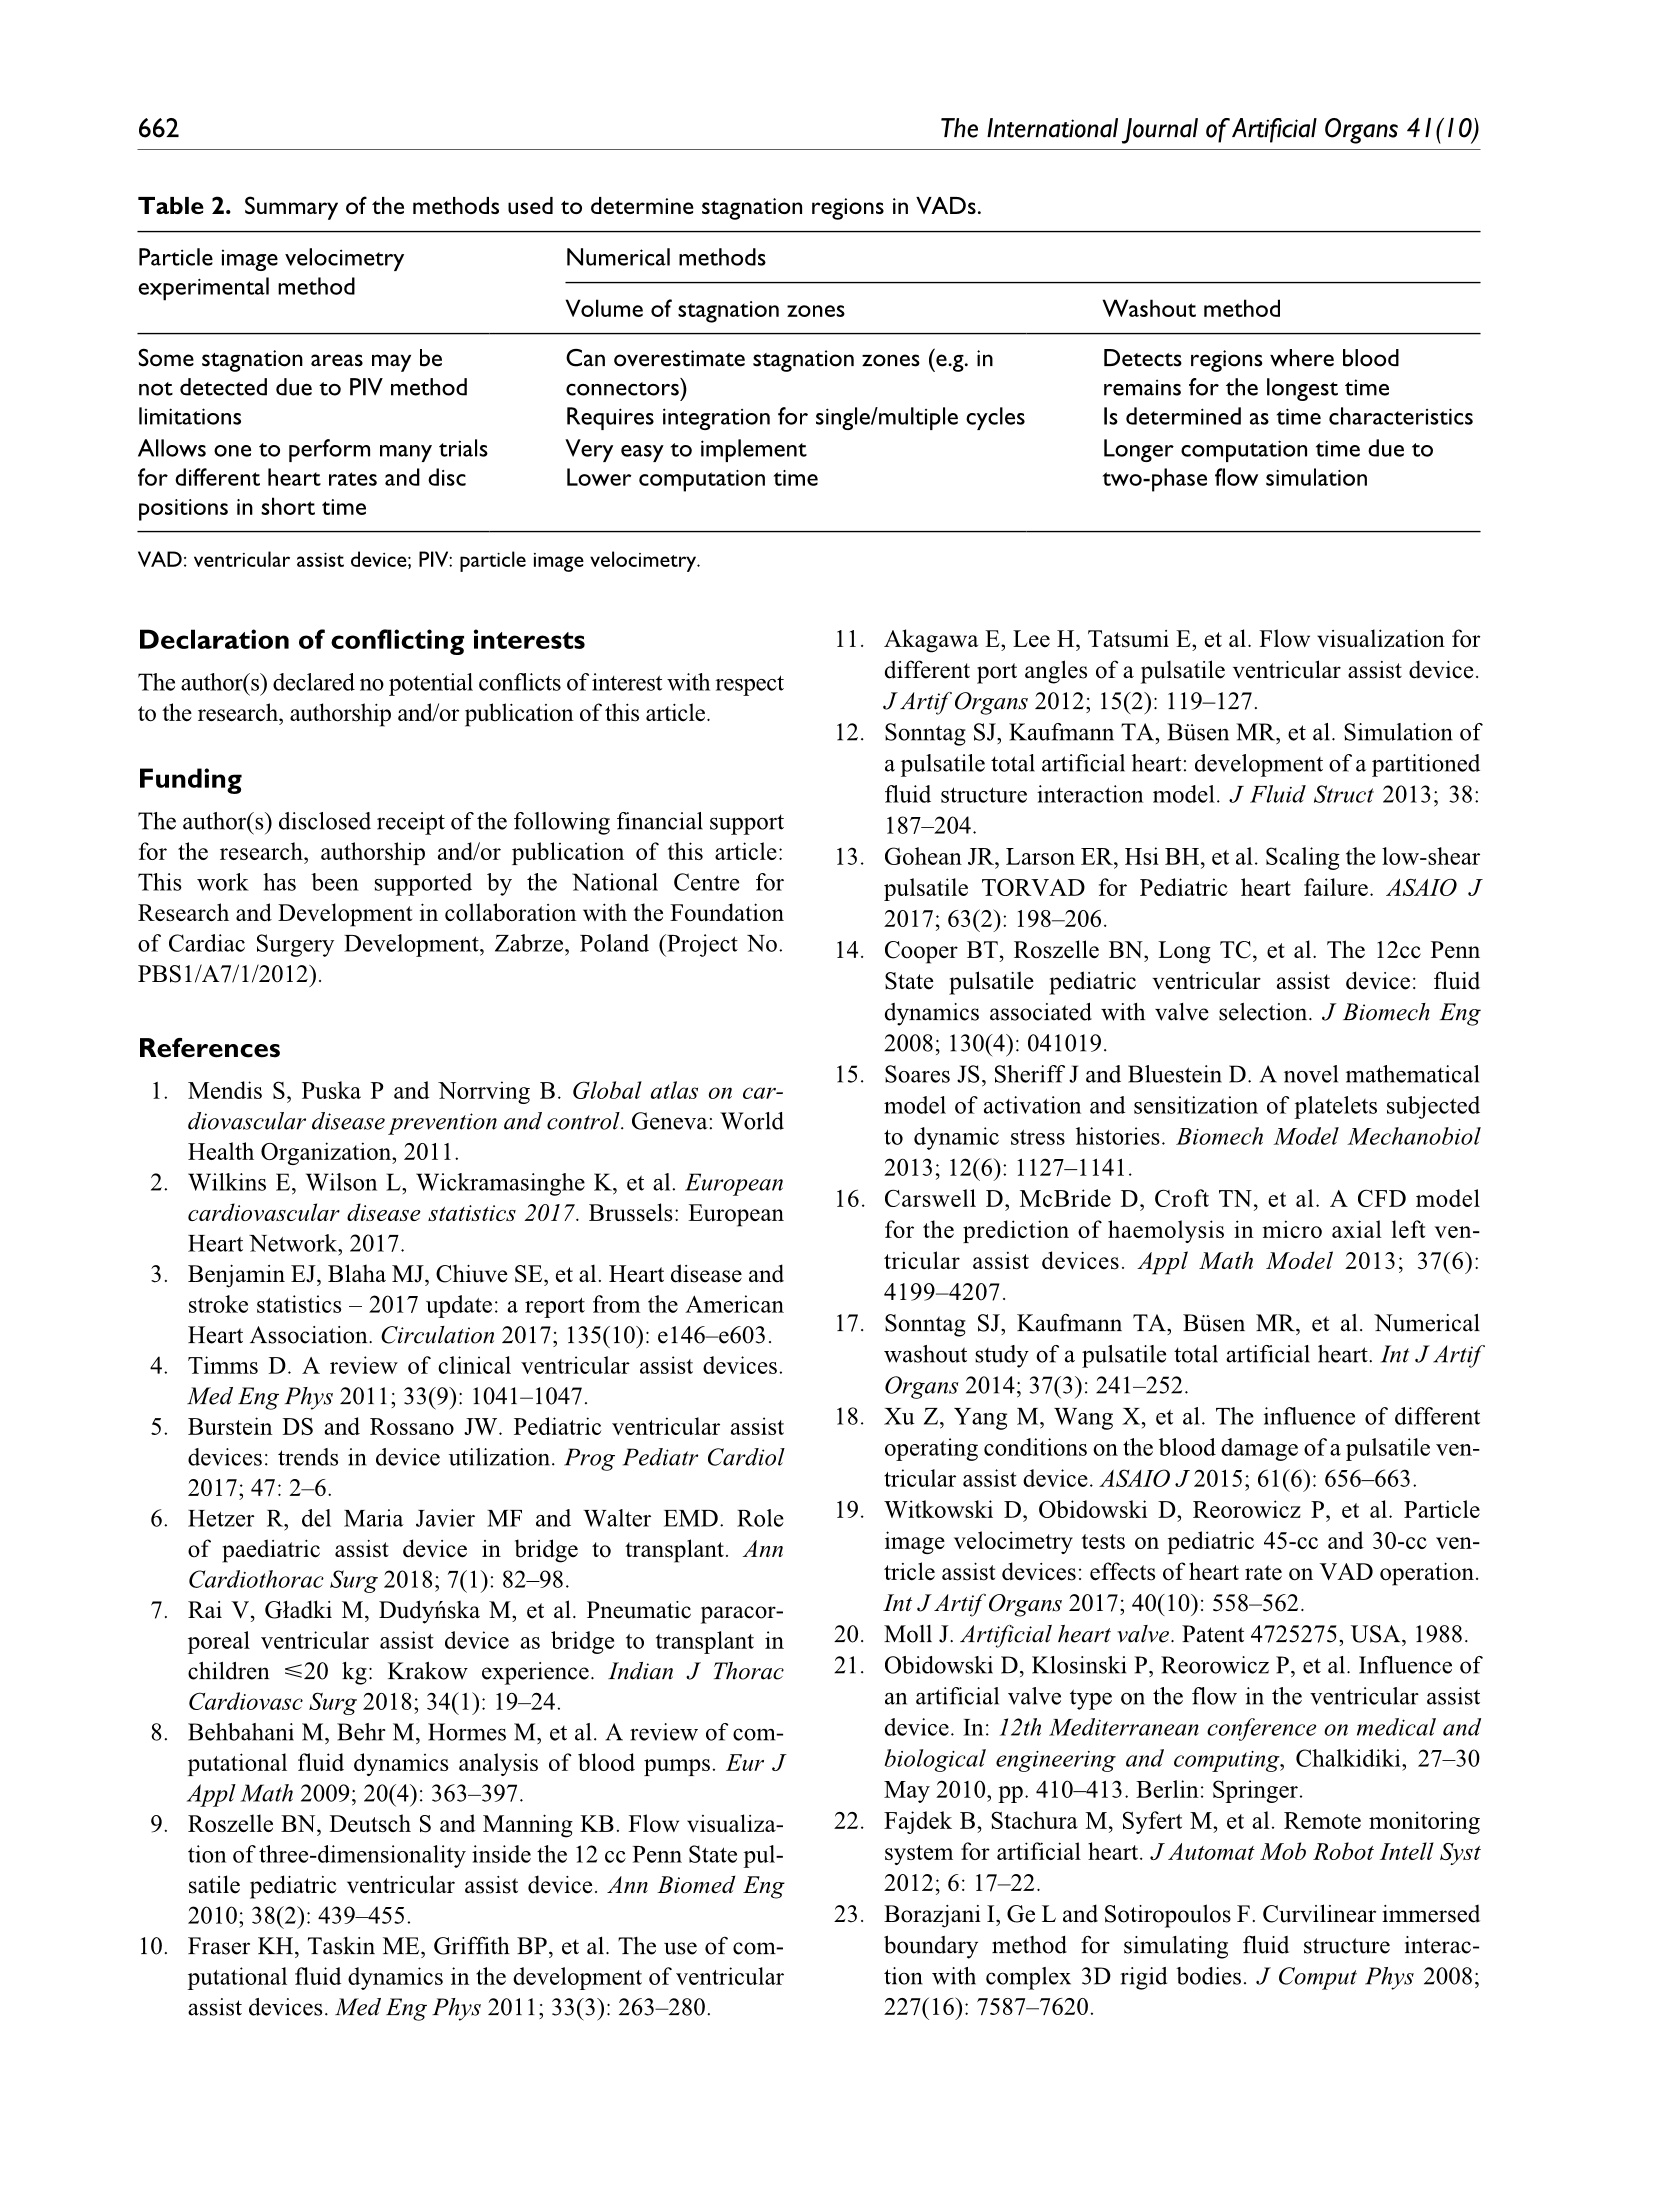
Check for updatesOriginal research article 654The International Journal of Artificial Organs 41(10) The International Journal of Artificial Organs 2018, Vol. 41(10) 653-663 C The Author(s) 2018 ①BY NC Article reuse guidelines: sagepub.com/journals-permissions DOI: 10.1177/0391398818790204 journals.sagepub.com/home/jao OSAGE Damian Obidowski, Piotr Reorowicz,Dariusz Witkowski, Krzysztof Sobczak and Krzysztof Jozwik Abstract Background: A pneumatic paediatric ventricular assist device developed at the Foundation of Cardiac SurgeryDevelopment, Zabrze,equipped with valves based on J. Moll’s design, with later modifications introduced at the Instituteof Turbomachinery, Lodz University of Technology, was tested numerically and experimentally. The main aim of thoseinvestigations was to detect stagnation zones within the ventricular assist device and indicate advantages and limitationsof both approaches. Methods: In the numerical transient test, a motion of the diaphragm and discs was simulated. Two different methodswere used to illustrate stagnation zones in the ventricular assist device. The flow pattern inside the chamber wasrepresented by velocity contours and vectors to validate the results using images obtained in the laser particle imagevelocimetry experiment. Results: The experimental light-based method implied problems with proper illumination of regions in the wall vicinity.High-resolution flow data and other important parameters as stagnation regions or flow patterns in regions not accessiblefor light in the particle image velocimetry method are derived in the numerical solution. However, computations of asingle case are much more time-consuming if compared to a single experiment conducted on a well-calibrated stand.Conclusion: The resulting main vortexes in the central part of the pump chamber and the velocity magnitudes arecorrelated in both methods, which are complementary and when used together offer better insight into the flowstructure inside the ventricular assist device and enable a deeper analysis of the results. Keywords Pulsatile ventricular assist device, numerical flow simulation, particle image velocimetry, stagnation Introduction Cardiovascular diseases are one of the leading reasons ofdeath in the world.1-3 In Poland, mortality is still higher thanin other EU countries and reaches from 363 to 443 in100,000 males. A ventricular assist device (VAD) is oftenthe only solution for patients with a heart failure to supportthe cardiac function, as the number of donors is alwaysinsufficient in comparison to that of potential recipients.Although significant improvement in the design and dura-bility ofVADs was achieved,5 they are still subjected to con-tinuous modifications. VADs used in clinics can be dividedinto two main groups: continuous and pulsatile flow pumps.In continuous flow pumps (axial or centrifugal), the bloodflow is forced by a rotating impeller, whereas in pulsatilepumps, the flow is forced by displacement of the diaphragmand its direction is controlled by a set of valves. Continuous flow recipients have higher survival and lower complicationrates in comparison to pulsatile flow devices in adults.However, due to the fact that they are designed and opti-mized for high flow rates, in the case of small children(weight≤20kg), pulsatile devices are still used predomi-nantly.5-7 Engineers apply state-of-the-art methods to makethe flow in the pulsatile VAD more efficient.8-13 As far as thedevice operation is concerned, the phenomena of coagula-tion, activation of platelets, haemolysis and cavitation, Division of Medical Apparatus, Institute of Turbomachinery, LodzUniversity of Technology, Lodz, Poland Corresponding author: ( Krzysztof Jozwik, D i vision of Medical Apparatus, Institute of T urbomachinery, L o dz University of Technology,219/223 Wolczanska Street, 90-924 Lodz, P oland. ) Email: krzysztof.jozwik@p.lodz.pl which may occur in the device, are the most important.14-18Due to a very complex flow structure in VADs, engineeringskills and intuition are not sufficient to design a VAD reduc-ing risk of thrombosis and haemolysis caused by the deviceitself. Therefore, numerical flow simulations, supported byexperimental verification, are of great importance in the pre-diction of the flow structure. A paediatric VAD with stroke volume of 45 mL used inis chthis study, referred to as Religa Heart PED 45,19 wasdesigned at the Foundation of Cardiac Surgery Development(FRK), Zabrze. The device consists oftwo main chambers:pneumatic and blood, separated by a diaphragm. Changesin the air pressure result in motion of the diaphragm.Suction of air causes elevation of the diaphragm and drivesblood to fill the blood chamber. This stage is called pumpdiastole. Systole of the VAD is caused by charging thepneumatic chamber with air from a driving unit, which inturn results in motion of the diaphragm and ejection ofblood. The direction of the blood flow is controlled by twosingle disc mechanical valves, developed at the Institute ofTurbomachinery, Lodz University of Technology, on thebasis of Jacek Moll’s concept.20,21 In the present analysis, the dynamics of air flow in thepneumatic chamber was not taken into account. Bothexperimental and numerical investigations were focused onan analysis of the blood flow. Movement of the diaphragmduring the experiments was driven and controlled by meansof a POLPDU 402 unit developed and delivered by theFoundation of Cardiac Surgery Development.22 In thenumerical simulations, changes in the VAD volume weretaken into account by the mesh deformation induced by adiaphragm motion modelled on the basis of systole anddiastole duration measurements. The walls of the pneu-matic chamber were transparent; thus, it was possible toobserve changes in the diaphragm position and record themwith a high-speed camera. In the numerical simulations,changes in the VAD blood volume and the corresponding mesh deformation were induced by the diaphragm motiondefined on the basis of those measurements. The ImmersedBody method was used to simulate the motion of inlet andoutlet valve discs. This method had been used before in theanalysis of heart valves23-25 in two dimensions and threedimensions, but not in the VAD. The objective of the presented research was to developand validate a numerical method to design pneumaticVADs robustly and efficiently. With this methodology, it ispossible to test numerous geometrical variants prior to ani-mal and clinical tests, thus saving time and money.However, the procedure used here is significantly lessdemanding in computational time than a typical fluid-structure interaction (FSI) numerical simulation of thesame problem. The novelty of the presented study lies in a combinationof the Mesh Deformation and Immersed Body methodsapplied to the pulsatile:VAD analysis. The MeshDeformation method was used to mimic changes in theblood chamber volume which force the flow, whereas theImmersed Body approach allows for modelling of thevalves which control the flow direction. In this article, twodifferent numerical simulation approaches to stagnationdetermination are also compared. Materials and methods Particle image velocimetry test The experimental setup scheme is illustrated in Figure 1.The Religa Heart PED 45 VAD designed and supplied bythe FRK was investigated. Its operation was controlledwith a POLPDU 402 controller from the FRK, used inclinical practice and dedicated to pneumatic VADs. TheVAD operated at the heart rate equal to 60 beats/min, at thestroke volume set to nearly 45cm’(mL), yielding the car-diac output of 2.5 dm’/min (L/min). The flow in the system Figure 2. VAD model used in the numerical simulations. was in a closed loop. Two connected tanks were used to setphysiological impedance and compliance of the system.They were connected to the VAD by means of cannulaswith attached pressure transducers. Windkessel compli-ance reservoirs were used in the experimental setup to con-trol compliance of the system. Levels of the liquid in thereservoirs were kept constant during the experiment. Oncethe average physiological levels of the gauge pressureclose to 1kPa (7.5mmHg) and 8kPa (60mmHg) at theinlet and the outlet from the chamber, respectively, werereached, the VAD was lunched, and after stabilization ofits operation, measurements were started. A 40% aqueousglycerin solution of the density 1045kg/m’and viscosity0.0035 Pas was used as the flow medium to simulate bloodparameters.19,26,27 The temperature during the tests was22°C and was constant to maintain the density and viscos-ity of the solution. The measurements of the velocity fieldsinside the VAD were made with particle image velocime-try (PIV) conducted with a LaVision FlowMaster system.28The laser light wave length was 532nm, the camera fre-quency was set to 800 Hz, and the time between the laserpulse A and B was defined as 400 us. Hollow glass sphereswith a diameter between 3 and 10 um and a density between1050 and 1150kg/m’ were used as seeding particles. ThePIV measurements are based on particle tracking in theflow filed, thus the images in the interrogation region werecompared in sequence. With the frequency of the systemreaching 800 Hz, a single exposition time of 0.00125 s wasachieved. In order to catch as many particles as possible, asequence of 40 consecutive images was used to determinethe velocity pattern inside each interrogation region. Thereadings from each region were summarized to determinethe flow pattern in the entire measurement plane for thespecific phase of the heart cycle. Some of the particlesmove not only in the plane of the laser beam but can havea significant transverse component, which influences themeasurements. Thus, some images can present false rec-ognition of the particle motion. To avoid that situation, themotion of particles was statistically processed to filter outfalse velocity vectors. The LaVision software -DaVis8.228 was used in the measurements and data analysis. Theraw measurement data were processed with a standard PIV data processing procedure. An initial interrogation regionsize was 32×32 pixels, with the final size of 12×12 pixelsand a 50% overlap region. The average particle displace-ment within an interrogation window is determined by across-correlation followed by the localization of the cor-relation peak. A subtract sliding filter with the scale lengthof 3 pixels was applied in the image pre-processing.Finally, a single smoothing procedure with the region setto 3×3pixels was applied. This procedure averages aroundeach pixel by convolving the image with this 3×3 filter toreduce the noise. A single flow pattern plot was based on40 consecutive images, each lasting 0.05 s. Numerical simulation settings Numerical simulations were conducted to mimic operationof the VAD. The flow in a real device is driven by changesin the blood chamber volume which result from the dia-phragm movement forced by pressure changes in the pneu-matic chamber. In the simulations, the pneumatic chamberwas not considered. Changes in the blood chamber volumewere defined by a prescribed motion of the diaphragm.The flow direction of blood inside the blood chamber ofthe VAD was controlled with valves in the inlet and outletconnectors. Opening and closure of the valves was forcedby the fluid motion. Transient simulations were conductedfor four full cycles of the VAD operation to eliminate aninfluence of initial conditions settings onto the simulationresults. Geometrical model. The geometrical model presented inFigure 2 reproduced the VAD used on the experimentalsetup. The dark blue colour corresponds to the diaphragm,beige to the blood chamber, connectors are grey and thevalve discs are red for the inlet and blue for the outlet.respectively. The green arrows indicate the main directionof the blood flow. The motion of the diaphragm entailedchanges in the VAD volume. Single-disc artificial heartvalves, developed at the Institute of Turbomachinery,LodzUniversity of Technology, were applied to control the flowdirection. The optimal angular positions of the valves weredefined in the study by Obidowski and colleagues.21,29,30Simplified models of the heart valves were used to reducethe simulation time. Small elements which support thevalve discs (marked with red circles in the front view ofthe open inlet valve in Figure 2) were neglected as theyexert negligible impact on the flow structure. Inlet and out-let connectors used on the test stand were considered in thesimulations. Diaphragm motion modelling. The blood flow is forced byalternations in the blood chamber volume, which followfrom a controlled displacement of the diaphragm. In theVAD, a change in the diaphragm position is driven bypressurized air pumped in and out from the VAD pneumatic chamber. In the real device, the diaphragmmotion is stochastic and varies from cycle to cycle. In thenumerical simulations, the diaphragm motion was simpli-fied. Displacements of mesh nodes on the diaphragm sur-face were governed by equation (1) derived on the basis ofthe experimental data analysis performed at the FRK where r is the distance from the node to the diaphragmaxis, R is the radius of the diaphragm and veltime(t) is thetabular function defining the motion of the central point ofthe diaphragm.29 A displacement of each node depends on the distancefrom the diaphragm axis. Figure 3 illustrates a cross-sec-tion in the centre of the blood chamber with the diaphragmshape and mesh deformation in different stages of the VADoperation. Values of time are presented for the secondcycle (here steps for pump rate equal to 100 strokes/minuteare illustrated), but the same positions of the diaphragmwere repeated for all cycles and pump rates. Theie geometrical model was discretized with theANSYS Mesher. Tetrahedral meshes with prismatic ele-ments in the wall vicinity were created for the fluid and two disc domains. The total number of mesh elementsreached 3.9million. As a result of the diaphragm motion,mesh elements were deformed. Prismatic elements nearwalls were just compressed without a negative influenceon their quality and in the case of tetrahedral mesh ele-ments, their quality remained acceptable for the solverdespite significant deformation. The mesh independencetests were performed for steady-state conditions. The firstof them was conducted with the boundary conditions forthe highest flow rates observed in the transient mode,whereas the second one for the lowest velocities whenboth the valves were still opened. Flows under those twoconditions were significantly different. The most refinedmesh tested consisted of twice as many elements as themesh we used in the study. The global parameters of theflow, for example, the maximal velocity, did not differmore than 3% in the cases under comparison. The contourmaps of the velocity distribution at the control plane didnot reveal visible differences in the flow pattern. Thus, itwas assumed that the mesh generated would be independ-ent for transient simulations as well. Valve disc motion modelling. The problem of an unsteadysimulation of the flow through a heart valve is very com-plex due to changes in valve disc positions. Complex phe-nomena of the boundary layer development and its Figure 4. (a) Mesh distribution in extreme positions of discs.(b, c) Flow pattern obtained near the disc valves computedwith the Immersed Body technique. separation both at the discs and external walls of the cham-ber are present. Therefore, a precise flow solution is a verychallenging task and requires a high-quality mesh. Advanced computational fluid dynamics (CFD) codesprovide options for transient FSI simulations, where twosolvers- the first one for equations governing the flow andthe second one for displacement of the structure-are used.A flow simulation provides stresses exerted by the flow onthe channel walls, which are used in the structure simula-tion to determine their deformation. A channel deforma-tion changes in turn the flow pattern, therefore, bothsolvers need to be coupled in order to exchange data prop-erly and efficiently. All these operations are time consum-ing and can reveal problems in obtaining a computationallystable solution. In addition, a motion of the valve discchanges drastically the geometry of the flow channel.Thus, the mesh deformation and also remeshing are neces-sary, but their application to the problem under study can be very expensive indeed if no compromises as regards thesolution quality are to be reached. Taking all these problems into account, the ImmersedBody method available in ANSYS CFX31 is an interestingalternative to the FSI approach. It is based on the overlap-ping mesh technique, where independent meshes are gen-erated for the background flow field and for the interior ofa moving element. The flow is solved on the fluid (back-ground) grid and the presence of a disc (immersed solid) inthe flow field is modelled with a body force in the fluidmomentum equations. The solver automatically updatesthe position of the immersed solid at the beginning of eachtime step. The solver applies the immersed solid sources tothe momentum equations in the fluid nodes which lieinside the immersed solid in order to drive the fluid veloc-ity towards the immersed solid velocity. Thus, thisapproach requires neither remeshing nor grid deformationprocedures and is very time efficient. Therefore, it wasused in this study to emulate an influence of discs on theflow in the chamber.The idea of the immersed boundarytechnique is widely adopted in the artificial valve flowanalysis. The authors25,32 claim its robustness; however,they point out the problems with a poor prediction of wallshear stress. Moreover, the pressure field representationcannot be precisely determined. On the other hand, thetechnique offers a very good velocity pattern agreementwith the experiments.23,33 In this study, we focused on thevelocity determination, thus the method could be applied. In this technique, the influence of solid surfaces of theimmersed body on the fluid flow is not explicitly resolved.Therefore, the viscous force contribution is typicallyunderestimated.31 To minimize that drawback, the fluidmesh was refined around discs in their extreme positions(fully open and closed) as presented in Figure 4(a). Despitea simplified treatment of the boundary layer, the flowstructure around and downstream of the disc was ade-quately resolved, which is illustrated in Figure 4(b) and(C), where boundary separations around the disc and gapleakage are presented. In the presented model, valves open and close automat-ically under an influence of the forces exerted by the bloodflow driven by the diaphragm movement. The motion ofthe valve discs is activated by the flow along a specificdirection. Disc rotation is defined with the experimentallydetermined angular velocity. The disc can rotate by75 degrees. It is known from the experiments that the discneeds 0.050s to open and close. Model of blood. Human blood is a very complex fluid,however, for the flow problem under study, only its densityand viscosity are taken into account. Changes in the blooddensity depend on the age, sex, diet, and so on of the per-son, and their values fall within the range of 1030-1070kg/m3. For the needs of these simulations, the constant densityof blood equal to 1045 kg/m’ was assumed. Blood is a non-Newtonian fluid with a state memory. Thedynamic viscosity coefficient depends on flow parametersand their changes (flow structure). In the literature, numer-ous models describing a relation between the blood viscos-ity coefficient and blood flow parameters can be found. Todescribe the flow in the vicinity of the aortic ostium, theNewtonian fluid model is appropriate. On the other hand,the blood flow in small vessels needs a more complex bloodmodel.34-37 For the needs of this study, a modified powerlaw model is employed. This model is expressed by systemof equations (2) where po is 0.0035 Pas, n=0.6 and (2(0U,)/(āx )S,)/2 isshear strain rate.35 Solution strategy and its monitoring. The transient numericalsimulation was performed with the ANSYS CFX v.17.1code. The unsteady Reynolds-averaged Navier-Stokes(URANS) set ofequations with an additional source term ofthe Immersed Body in the momentum equation was solved.The shear stress transport (SST) turbulence model, which iswidely used and proved its quality in many different appli-cations, especially for low Reynolds number flows as in thiscase, was applied.17,38-40 Due to very limited temperaturechanges, the flow was considered to be isothermal. As far as the boundary conditions are concerned, theopenings were imposed with the value of gauge pressureset to 1kPa (7.5mmHg) at the inlet and 8kPa (60mmHg)at the outlet of the computational domain. The opening isa combined boundary condition which allows the flow toenter or leave the domain depending on the values ofboundary condition parameters and the flow structure. Inthe case under analysis, the flow was driven by the motionof the diaphragm. A non-slip condition was applied for allsmooth walls. The transient solution was initiated when the diaphragmwas located in its middle position between diastole and sys-tole and it was planar. The upward motion of the diaphragmat the first stage of the heart cycle causes an increase in the blood volume in the chamber. At this stage, the inlet valveis fully open, whereas the outlet valve is closed. This situa-tion continues up to the moment when the diaphragmreaches its maximal upper position, which occurs for themaximal filling of the VAD with blood. Next, the dia-phragm starts to move downwards and pushes the blood outof the chamber. At this stage, the valve in the outlet connec-tor opens and the inlet valve closes. The inlet valve remainsclosed, whereas the outlet valve is open until the diaphragmreaches its lowest position, which occurs for the minimalblood volume within the VAD. When the VAD starts fill-ing, the outlet valve closes and the inlet valve opens. The simulation was conducted for four cycles corre-sponding to the pump rate of 60 strokes/min, each lasting1s, with a time step t=0.001 s. Internal convergence loops(from 1 to 5) were solved to reach the predefined level ofconvergence (RMS residuals equal to 1e-4). The residualsdid not exceed the assigned convergence criteria level,except for the first cycle, in which an influence of initialconditions played a significant role. Numerical model validation. The numerical simulationmethod was validated against the velocity flow field meas-urements obtained with the PIV technique which is awidely used method.12,41 The flow patterns were comparedin a single plane distanced 17 mm from the reference planeas shown in Figure 5. The velocity magnitude was scaledin the same range for both methods. Two different operat-ing conditions, namely for the pump rate of 60 and80 strokes/min, at different stages of operation, were com-pared to validate the numerical method. The time intervalof 0.1 s between mid and late systole presented in Figure 5was defined. Since the diaphragm prevents the laser lightto illuminate a part of the particles, the stages when thediaphragm is mostly within the pneumatic chamber of theVAD were selected for comparison. The mid diastole stagein Figure 5 corresponds to the moment when the dia-phragm is moving towards the pneumatic chamber andpasses its middle position. The late diastole stage corre-sponds to the peak diaphragm position. In the early sys-tole, the diaphragm starts to push out the blood from theblood chamber, thus the disc valve positions are oppositeto the diastole. For each stage, the flow inside the chamberforms a large vortex structure with the core positioned nearthe middle of the chamber, which is well visible during thesimulations and the experiment. A good agreement wasachieved when the velocity magnitude for each stage wastaken into account. One can observe very similar jets pass-ing through the chamber from the inlet towards the outletconnector. Significant differencesbetween data areobserved in the region of valve rings and in the top part ofthe chamber. These differences can be explained by draw-backs of the PIV measurement technique. Despite mirror-ing of the laser beam, there is no possibility to illuminateand observe the whole VAD. In addition, a light reflection Figure 5. Velocity contour plots and vectors measured with the PIV and obtained from the simulations for different pump rates. from the curvilinear wall of the chamber could not beeliminated. Therefore, for the region marked in black andwhite in the PIV results, the data are not available. Somediscrepancies are also observed in the location of the vor-tex centre which can be influenced by problems with thePIV measurement in the proximity of the diaphragm centrefor the mid diastole and the early systole stages. Except forthe mentioned regions, a good agreement between theexperiment and the numerical simulation was reached anddemonstrated.PIV measurements were also carried out intwo other planes at the location of 15 and 19 mm, similarlydefined as plane 17 illustrated in Figure 5. These data arenot presented here due to the fact that similar flow patternswere revealed and the same agreement with simulationswas reached. Stagnation determination methods Stagnationregions can promote the deposition of damagedblood elements, leading to thrombus formation on theprosthesis.33 Two different methods to determine stagna-tion were used and compared. The Volume of StagnationZone (VSZ)is a new concept based on the assumption thatthe blood activated by contact with an artificial materialmay coagulate once exposed to long interaction with thewall. This occurs in low velocity regions. Pivkin et al.42simulated thrombus formation with respect to the flowvelocity in the range of 100 up to 800 um/s in the cylindrical channel. Under these conditions, the thrombiwere captured; however, it was noticed that the activationdelay time caused the activated platelets to escape captureinto the thrombus at higher flow rates. In our method, theregions of velocity lower than 0.01 m/s, excluding those inthe inner region of the boundary layer, are considered asprone to generate blood clots. The value was selected tocover the velocity range by an order of magnitude higherthan those tested by Pivkin et al.42 not to miss any regionsof possible clot formation. This method can be used todetect stagnation in the PIV experiment and in the numeri-cal simulation. The second method mentioned, referred to as washout,is also based on the assumption that coagulation can appearin the regions where blood residues for the longest time.The blood exchange in the chamber during the VAD opera-tion is observed. This method, referred to as the Washoutmethod, was presented by Sonntag et al.17 and used in thenumerical investigations of a pulsatile artificial heart. Thesimulations are based on observation of two phases ofblood, called old blood and fresh blood, both having thesame rheological properties. At the beginning of an analy-sis, the old blood fills the whole chamber.Once the analy-sis starts, the fresh blood starts to flow into the chamberand the old blood is ejected. A part of the old blood volumeis not evacuated in a single heart cycle. As two phases areused in the simulation, one can observe a change in the oldto fresh blood ratio versus time and can illustrate the desired phase. In the Washout method, the old blood thatremains in the chamber after a specific number of cycles ofits operation can be observed. Apart from the stagnation detection based on low veloc-ity methods, there are models which enable prediction ofthe thrombus formation, developed by Medvitz et a1.41,43and the thrombus susceptibility potential based on wallshear rates over the entire cardiac cycle, described byTooper et a1.44 Results and discussion A velocity pattern inside the blood chamber is determinedwith PIV measurements. Once the obtained data are fil-tered out to a specific range of low velocity, informationon stagnation prone regions can be obtained. Figure 6shows a full range of velocity measurements at the top andfiltered out low velocity regions in the bottom for the samecases. The measurements are planar. The laser planemarked as 17 mm in Figure 5, during diastole, was used toillustrate the flow and the determination of stagnation inthe chamber. If an analysis of the full three-dimensionalvelocity field is to be conducted, the measurements have tobe repeated with a desired distance in parallel planes. Inthe case of the chamber model used in this study, it is notpossible to attain a complete flow field in the wholedomain due to the optical technique limitations mentionedearlier. The stagnation area with respect to the total meas-urement plane (red contour line) was 1.13% during dias-tole and 0.46% during systole.19 In Figure 7, the results obtained with the stagnationmethod are compared to the Washout study for the sameVAD chamber operating under the same conditions during the third and fourth cycle. The stagnation-prone regions aremarked with dark red. In the case of the VSZ method, thesame pattern of the stagnation field is repeated for eachcycle, beginning with the third one. After the third cycle, Figure 6. Velocity magnitude contour plots in the full scalemeasured and the data limited to stagnation regions. the influence of initial simulation conditions is negligible.In the Washout method, it is necessary to realize that the oldblood is washed from the VAD, thus, once the simulationsare repeated through more than 6 heart cycles, the residualold blood will be totally washed out. Knowing the differ-ences in stagnation determination in both numerical meth-ods, a direct comparison of the results is difficult if notimpossible, thus, a qualitative determination of similaritiesand differences between the two methods was only con-ducted. A very similar distribution of stagnation in the dis-tal ring of the diaphragm and near the valve rings can beseen in the flow patterns in Figure 7. In all the cases shown,the stagnation forms a thin hook in the connection of thediaphragm and the chamber. This is caused by a limitedflow velocity in the corner formed due to technologicalrestrictions of the VAD structure. The stagnation observedin the valve regions is due to separations of the flow gener-ated by valve rings and strongly depends on the flow direc-tion. Significant regions of low velocity in the connectorsdetected with the VSZ method result from a limited flowwhen valves are closed. These regions are well washed dur-ing the inflow or outflow of blood to and from the chamberand thus shall not be taken into account as stagnation-riskregions. This can be filtered out once the VSZ is integratedin the whole domain for a single heart cycle. The final stag-nation is quantified by the time-averaged VSZ, whose dis-tribution is presented in Figure 8. In the case under study, Figure 8. Time-averaged VSZ the stagnation occupied 0.098% of the computationaldomain volume with the diaphragm placed in its neutralposition. The results show the flow induced regions of theVAD prone to stagnations and clot generation. The highestrisk zones in the case of the tested blood chamber weredetected in similar regions, as illustrated in Figures 6 and 7.Most of the zones were revealed in the region of valves andin the diaphragm attachment to the blood chamber, with allthe experimental and numerical methods. Conclusion The presented numerical model takes advantage of theMesh Deformation and Immersed Body methods to simu-late efficiently flow conditions in the pulsatile VAD.Changes in the blood chamber volume, which force theflow and motion of the disc in the valves to control theflow direction, can be reproduced. Model validationagainst the PIV measurement results proved the adequaterepresentation of the main flow features. A summary of thecomparison of the PIV method and the numerical simula-tions in the VAD analysis is presented in Table 1. As far as the problem of the risk of blood stagnation andclot generation in VADs is concerned, the numerical meth-ods give a possibility to analyse stagnation in the wholevolume of the blood chamber. Because of its numerouslimitations, PIV provides data for specific measurementregions only. The time and spatial resolution of the numer-ical methods is much higher than in the PIV experiment.However, it has to be borne in mind that simulations ofsuch complex flows should be validated, especially whenadvanced modelling techniques such as a moving dia-phragm and an immersed solid disc are used. In the pre-. sented case, a qualitativeagreementbetween theexperimental and numerical flow patterns and the regionsof stagnation was reached. Two numerical approaches pre-sented in the article (i.e. Volume of Stagnation Zones andWashout) indicated similar regions of stagnation risk. Themain identified advantages and drawbacks of all the meth-ods used to determine stagnation regions in VADs arelisted in Table 2. Table I. Comparison of the experimental and numerical methods in the VAD analysis. Experimental particle image velocimetry method Numerical methods Is performed on an existing physical model Idealized model of geometry with the predefined diaphragm motion Can be used in the design stage without a physical model Relatively low resolution in selected 2D sections High details in the three-dimensional space Difficult to process for selected time instants Access to all time instants High experimental setup installation cost Short initiation and preparation time Long test preparation time Relatively low cost per simulation allows tests for many configuration Can be run simultaneously for many designs Allows one to perform many trials for different Each change in the heart rate or disc positions requires a new time- heart rates and disc positions in short time consuming computation Table 2. Summary of the methods used to determine stagnation regions in VADs. Particle image velocimetry Numerical methods experimental method Volume of stagnation zones Washout method Some stagnation areas may be Can overestimate stagnation zones (e.g. in Detects regions where blood not detected due to PIV method connectors) remains for the longest time limitations Requires integration for single/multiple cycles Is determined as time characteristics Allows one to perform many trials Very easy to implement Longer computation time due to for different heart rates and disc Lower computation time two-phase flow simulation positions in short time Declaration of conflicting interests The author(s) declared no potential conflicts of interest with respectto the research, authorship and/or publication of this article. Funding The author(s) disclosed receipt of the following financial supportfor the research, authorship and/or publication of this article:This work has been supported by the National Centre forResearch and Development in collaboration with the Foundationof Cardiac Surgery Development, Zabrze, Poland (Project No.PBS1/A7/1/2012). References ( 1. M endis S, Puska P a n d N o rrving B. Global atlas o n c a r- diovascular disease prevention and control . Geneva: World Health Organization, 2011. ) ( 2. Wilkins E, Wilson L, Wickramasinghe K, et al. European cardiovascular d i sease statistics 2 017. B r ussels: E u ropean Heart Network, 2017. ) 3. BEenjamin EJ, Blaha MJ, Chiuve SE,et al. Heart disease andstroke statistics -2017 update: a report from the AmericanHeart Association. Circulation 2017; 135(10):e146-e603. 4.Timms D. A review of clinical ventricular assist devices.Med Eng Phys 2011;33(9):1041-1047. 5. BEurstein DS and Rossano JW. Pediatric ventricular assistdevices: trends in device utilization. Prog Pediatr Cardiol2017;47:2-6. 6.Hetzer R, del Maria Javier MF and Walter EMD. Roleof paediatric assist device in bridge to transplant. AnnCardiothorac Surg 2018;7(1): 82-98. 7. RFai V, Gladki M, Dudynska M, et al. Pneumatic paracor-poreal ventricular assist device as bridge to transplant inchildren ≤20 kg: Krakow experience. Indian J ThoracCardiovasc Surg 2018; 34(1):19-24. 8.Behbahani M, Behr M, Hormes M, et al. A review of com-putational fluid dynamics analysis of blood pumps. Eur JApplMath 2009;20(4):363-397. 9.. RFoszelle BN, Deutsch S and Manning KB. Flow visualiza-tion of three-dimensionality inside the 12 cc Penn State pul-satile pediatric ventricular assist device. Ann Biomed Eng2010;38(2):439-455. 10. FFraser KH, Taskin ME, Griffith BP, et al. The use of com-putational fluid dynamics in the development of ventricularassist devices. Med Eng Phys 2011;33(3):263-280. l1. Akagawa E, Lee H, Tatsumi E, et al. Flow visualization fordifferent port angles of a pulsatile ventricular assist device.J ArtifOrgans 2012;15(2):119-127. 12.Sonntag SJ, Kaufmann TA, Busen MR, et al. Simulation ofa pulsatile total artificial heart: development of a partitionedfluid structure interaction model. J Fluid Struct 2013;38:187-204. 13. Gohean JR, Larson ER, Hsi BH, et al. Scaling the low-shearpulsatile TORVAD for Pediatric heart failure. ASAIO J2017;63(2):198-206. 14.Cooper BT, Roszelle BN, Long TC, et al. The 12cc PennState pulsatile pediatric ventricular assist device: fluiddynamics associated with valve selection. J Biomech Eng2008;130(4):041019. 15.Soares JS. Sheriff J and Bluestein D. A novel mathematicalmodel of activation and sensitization of platelets subjectedto dynamic stress histories. Biomech Model Mechanobiol2013;12(6):1127-1141. 16.Carswell D, McBride D, Croft TN, et al. A CFD modelfor the prediction of haemolysis in micro axial left ven-tricular assist devices. Appl Math Model 2013; 37(6):4199-4207. 17. SSonntag SJ, Kaufmann TA, Buisen MR, et al. Numericalwashout study of a pulsatile total artificial heart. Int J ArtifOrgans2014;37(3):241-252. 18.5.Xu Z, Yang M, Wang X, et al. The influence of differentoperating conditions on the blood damage of a pulsatile ven-tricular assist device. ASAIO J 2015; 61(6):656-663. 19. Witkowski D, Obidowski D, Reorowicz P, et al. Particleimage velocimetry tests on pediatric 45-cc and 30-cc ven-tricle assist devices: effects of heart rate on VAD operation.Int JArtifOrgans 2017;40(10): 558-562. 20.M1oll J. Artificial heart valve. Patent 4725275,USA, 1988. 21. Obidowski D, Klosinski P, Reorowicz P, et al. Influence ofan artificial valve type on the flow in the ventricular assistdevice. In: 12th Mediterranean conference on medical andbiological engineering and computing, Chalkidiki, 27-30May 2010, pp. 410-413. Berlin: Springer. 22.1Fajdek B, Stachura M, Syfert M, et al. Remote monitoringsystem for artificial heart. J Automat Mob Robot Intell Syst2012;6:17-22. 23.Borazjani I, Ge L and Sotiropoulos F. Curvilinear immersedboundary method for simulating fluid structure interac-tion with complex 3D rigid bodies. J Comput Phys 2008;227(16):7587-7620. 24.G(il AJ, Carrefio AA, Bonet J, et al. The immersed structuralpotential method for haemodynamic applications. J ComputPhys 2010; 229(22): 8613-8641. 25.2Zakaria MS, Ismail F, Tamagawa M, et al. Review of numer-ical methods for simulation of mechanical heart valves andthe potential for blood clotting. Med Biol Eng Comput 2017;55(9): 1519-1548. 26.SSegur J. Viscosity of glycerol and its aqueous solutions.Chicago, IL: The Miner Laboratories, 1951. 27.G(lycerine Producers’Association. Physical properties ofglycerine and its solutions. New York: Glycerine Producers’Association, 1963. 28.LaVision GmbH. In product-manual flowmaster gettingstarted, http://www.lavision.de/en/downloads/manuals/system.php (accessed 16 June 2017). 29.. RFeorowicz P, Obidowski D,Klosinski P, et al. Flow modellingin the pneumatic ventricular assist device with mesh deforma-tion and immersed body techniques - investigation of stagna-tion zones. In: 5th European conference ofthe internationalfederation for medical and biological engineering, Budapest,14-18 September 2011, pp.446-449. Berlin: Springer. 30.Jodko D, Obidowski D,Reorowicz P, et al. Angular posi-tion determination of heart valves in the pediatric ventricu-lar assist device with use of computational fluid dynamics.Aktual Probl Biomech 2014; 8: 57-62. 31.1ANSYS. CFX-solver modeling guide (ANSYS Release17.1). Canonsburg, PA: ANSYS,2016. 32. BIavo AM,Rocatello G, Iannaccone F, et al. Fluid-structureinteraction simulation of prosthetic aortic valves: compari-son between immersed boundary and arbitrary Lagrangian-Eulerian techniques for the mesh representation. PLoS ONE2006;11(4):e0154517. 33. Krishnan S, Udaykumar HS, Marshall JS, et al. Two-dimensional dynamic simulation of platelet activation dur-ing mechanical heart valve closure. Ann Biomed Eng 2006;34(10):1519-1534. 34.JJohnston BM, Johnston PR, Corney S,et al. Non-Newtonianblood flow in human right coronary arteries: steady statesimulations. J Biomech 2004; 37:709-720. 35.Jozwik K and Obidowski D. Numerical simulations of theblood flow through vertebral arteries. J Biomech 2010;43:177-185. 36.RIeorowicz P, Obidowski D, Klosinski P, et al. Numericalsimulations of the blood flow in the patient-specific arte-rial cerebral circle region. J Biomech 2014; 47(7):1642-1651. 37..Jodko D, Obidowski D, Reorowicz P, et al. Numericalinvestigations of the unsteady blood flow in the end-to-side arteriovenous fistula for hemodialysis. Acta BioengBiomech 2016;18(4):3-13. 38.Jasinski P. Numerical study of thermo-hydraulic character-istics in a circular tube with ball turbulators. Part 3: ther-mal performance analysis. Int J Heat Mass Tran 2017; 107:1138-1147. 39.Jodko D, Obidowski D,Reorowicz P,et al. Blood flows inend-to-end arteriovenous fistulas: unsteady and steady statenumerical investigations of three patient-specific cases.Biocybern Biomed Eng 2017;37:528-539. 40.Kacprzak K and Sobczak K. Computational assessment ofthe influence of the overlap ratio on the power characteris-tics of a classical savonius wind turbine.Open Eng 2015;5(1): 314-322. 41.Medvitz RB, Kreider JW, Manning KB, et al.Developmentand validation of a computational fluid dynamics methodol-ogy for simulation of pulsatile left ventricular assist devices.ASAIOJ2007;53(2):122-131. 42.PIivkin IV, Richardson PD and Karniadakis G. Blood flowvelocity effects and role of activation delay time on growthand form of platelet thrombi. Proc Natl Acad Sci U S A2006;103(46):17164-17169. ( 43. M 1edvitz RB, Reddy V, Deutsch S, et a l . V alidation ofa CFD methodology for p ositive displacement LVADanalysis using PIV data. J Biomech E ng 2009; 1 3 1(10):111009. ) 44.Topper SR, Navitsky MA, Medvitz RB, et al. The use offluid mechanics to predict regions of microscopic throm-bus formation in pulsatile VADs. Cardiovasc Eng Technol2014;5(1):54-69. Background: A pneumatic paediatric ventricular assist device developed at the Foundation of Cardiac Surgery Development, Zabrze, equipped with valves based on J. Moll’s design, with later modifications introduced at the Institute of Turbomachinery, Lodz University of Technology, was tested numerically and experimentally. The main aim of those investigations was to detect stagnation zones within the ventricular assist device and indicate advantages and limitations of both approaches.Methods: In the numerical transient test, a motion of the diaphragm and discs was simulated. Two different methods were used to illustrate stagnation zones in the ventricular assist device. The flow pattern inside the chamber was represented by velocity contours and vectors to validate the results using images obtained in the laser particle image velocimetry experiment.Results: The experimental light-based method implied problems with proper illumination of regions in the wall vicinity. High-resolution flow data and other important parameters as stagnation regions or flow patterns in regions not accessible for light in the particle image velocimetry method are derived in the numerical solution. However, computations of asingle case are much more time-consuming if compared to a single experiment conducted on a well-calibrated stand.Conclusion: The resulting main vortexes in the central part of the pump chamber and the velocity magnitudes are correlated in both methods, which are complementary and when used together offer better insight into the flow structure inside the ventricular assist device and enable a deeper analysis of the results.
确定
还剩9页未读,是否继续阅读?

产品配置单


北京欧兰科技发展有限公司为您提供《Religa Heart PED 45 VAD 模型中流体速度矢量场检测方案(粒子图像测速)》,该方案主要用于内脏器官中流体速度矢量场检测,参考标准--,《Religa Heart PED 45 VAD 模型中流体速度矢量场检测方案(粒子图像测速)》用到的仪器有德国LaVision PIV/PLIF粒子成像测速场仪、LaVision DaVis 智能成像软件平台
推荐专场


相关方案
更多
该厂商其他方案
更多