


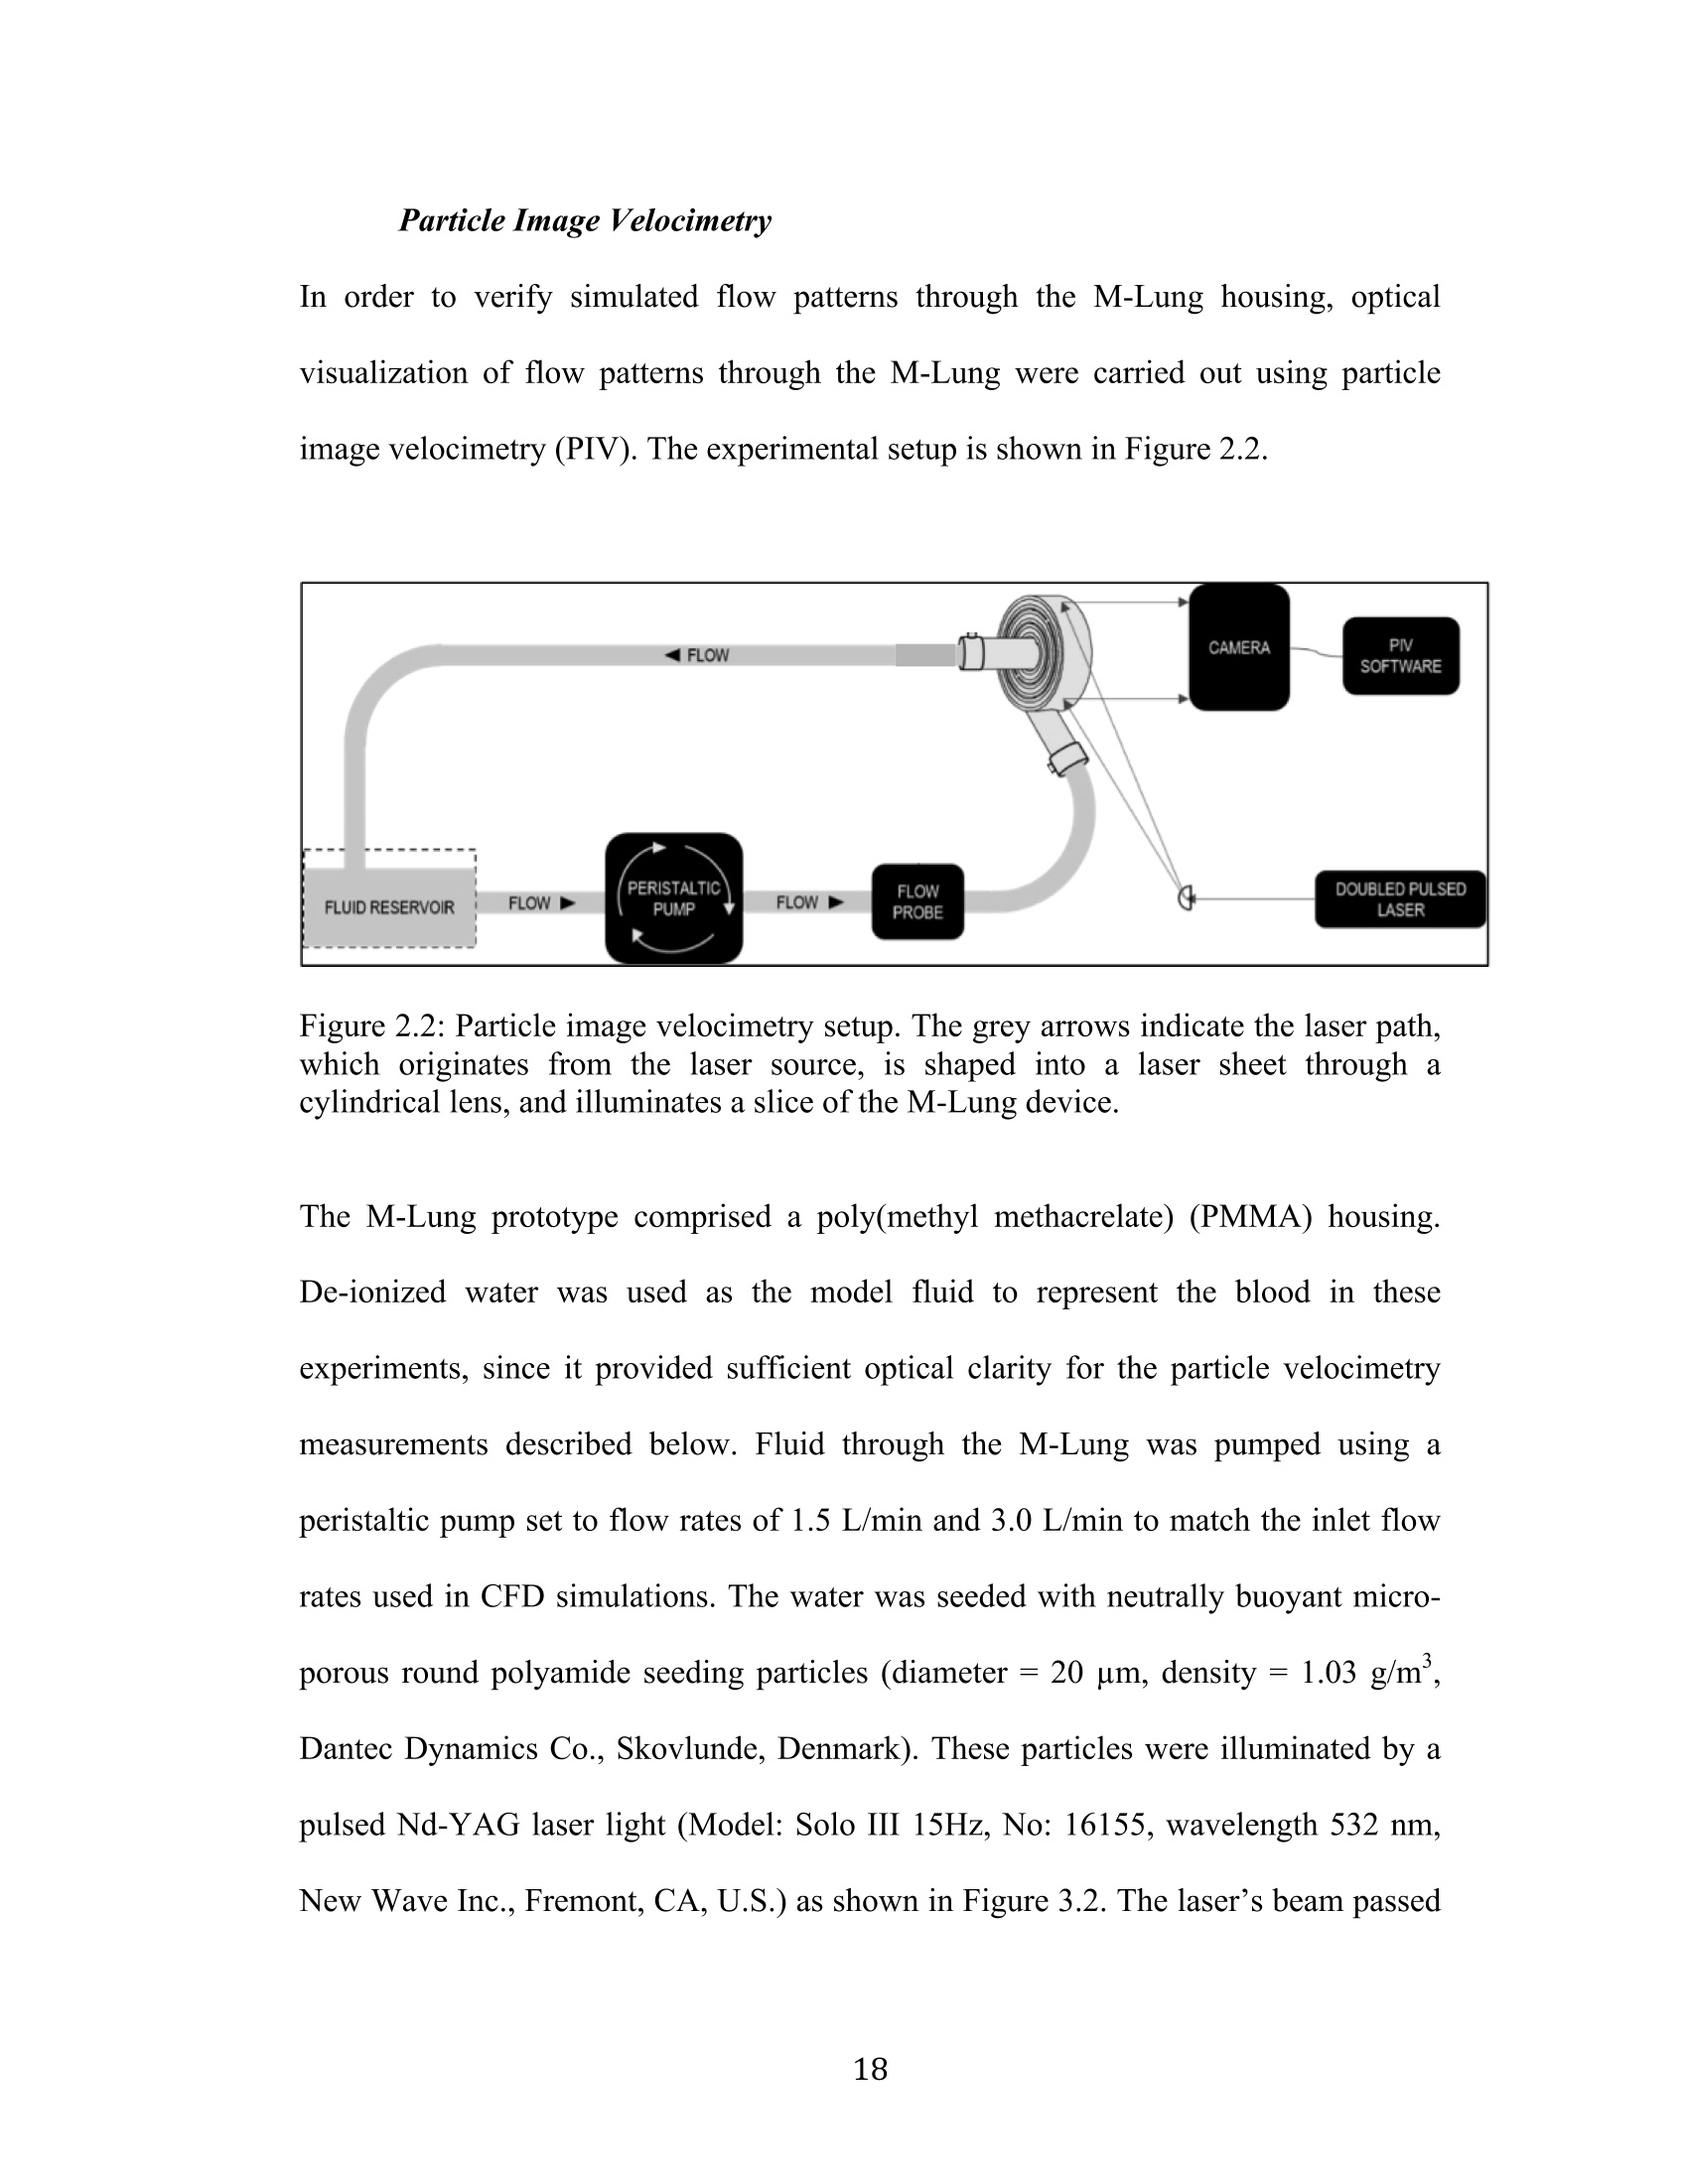
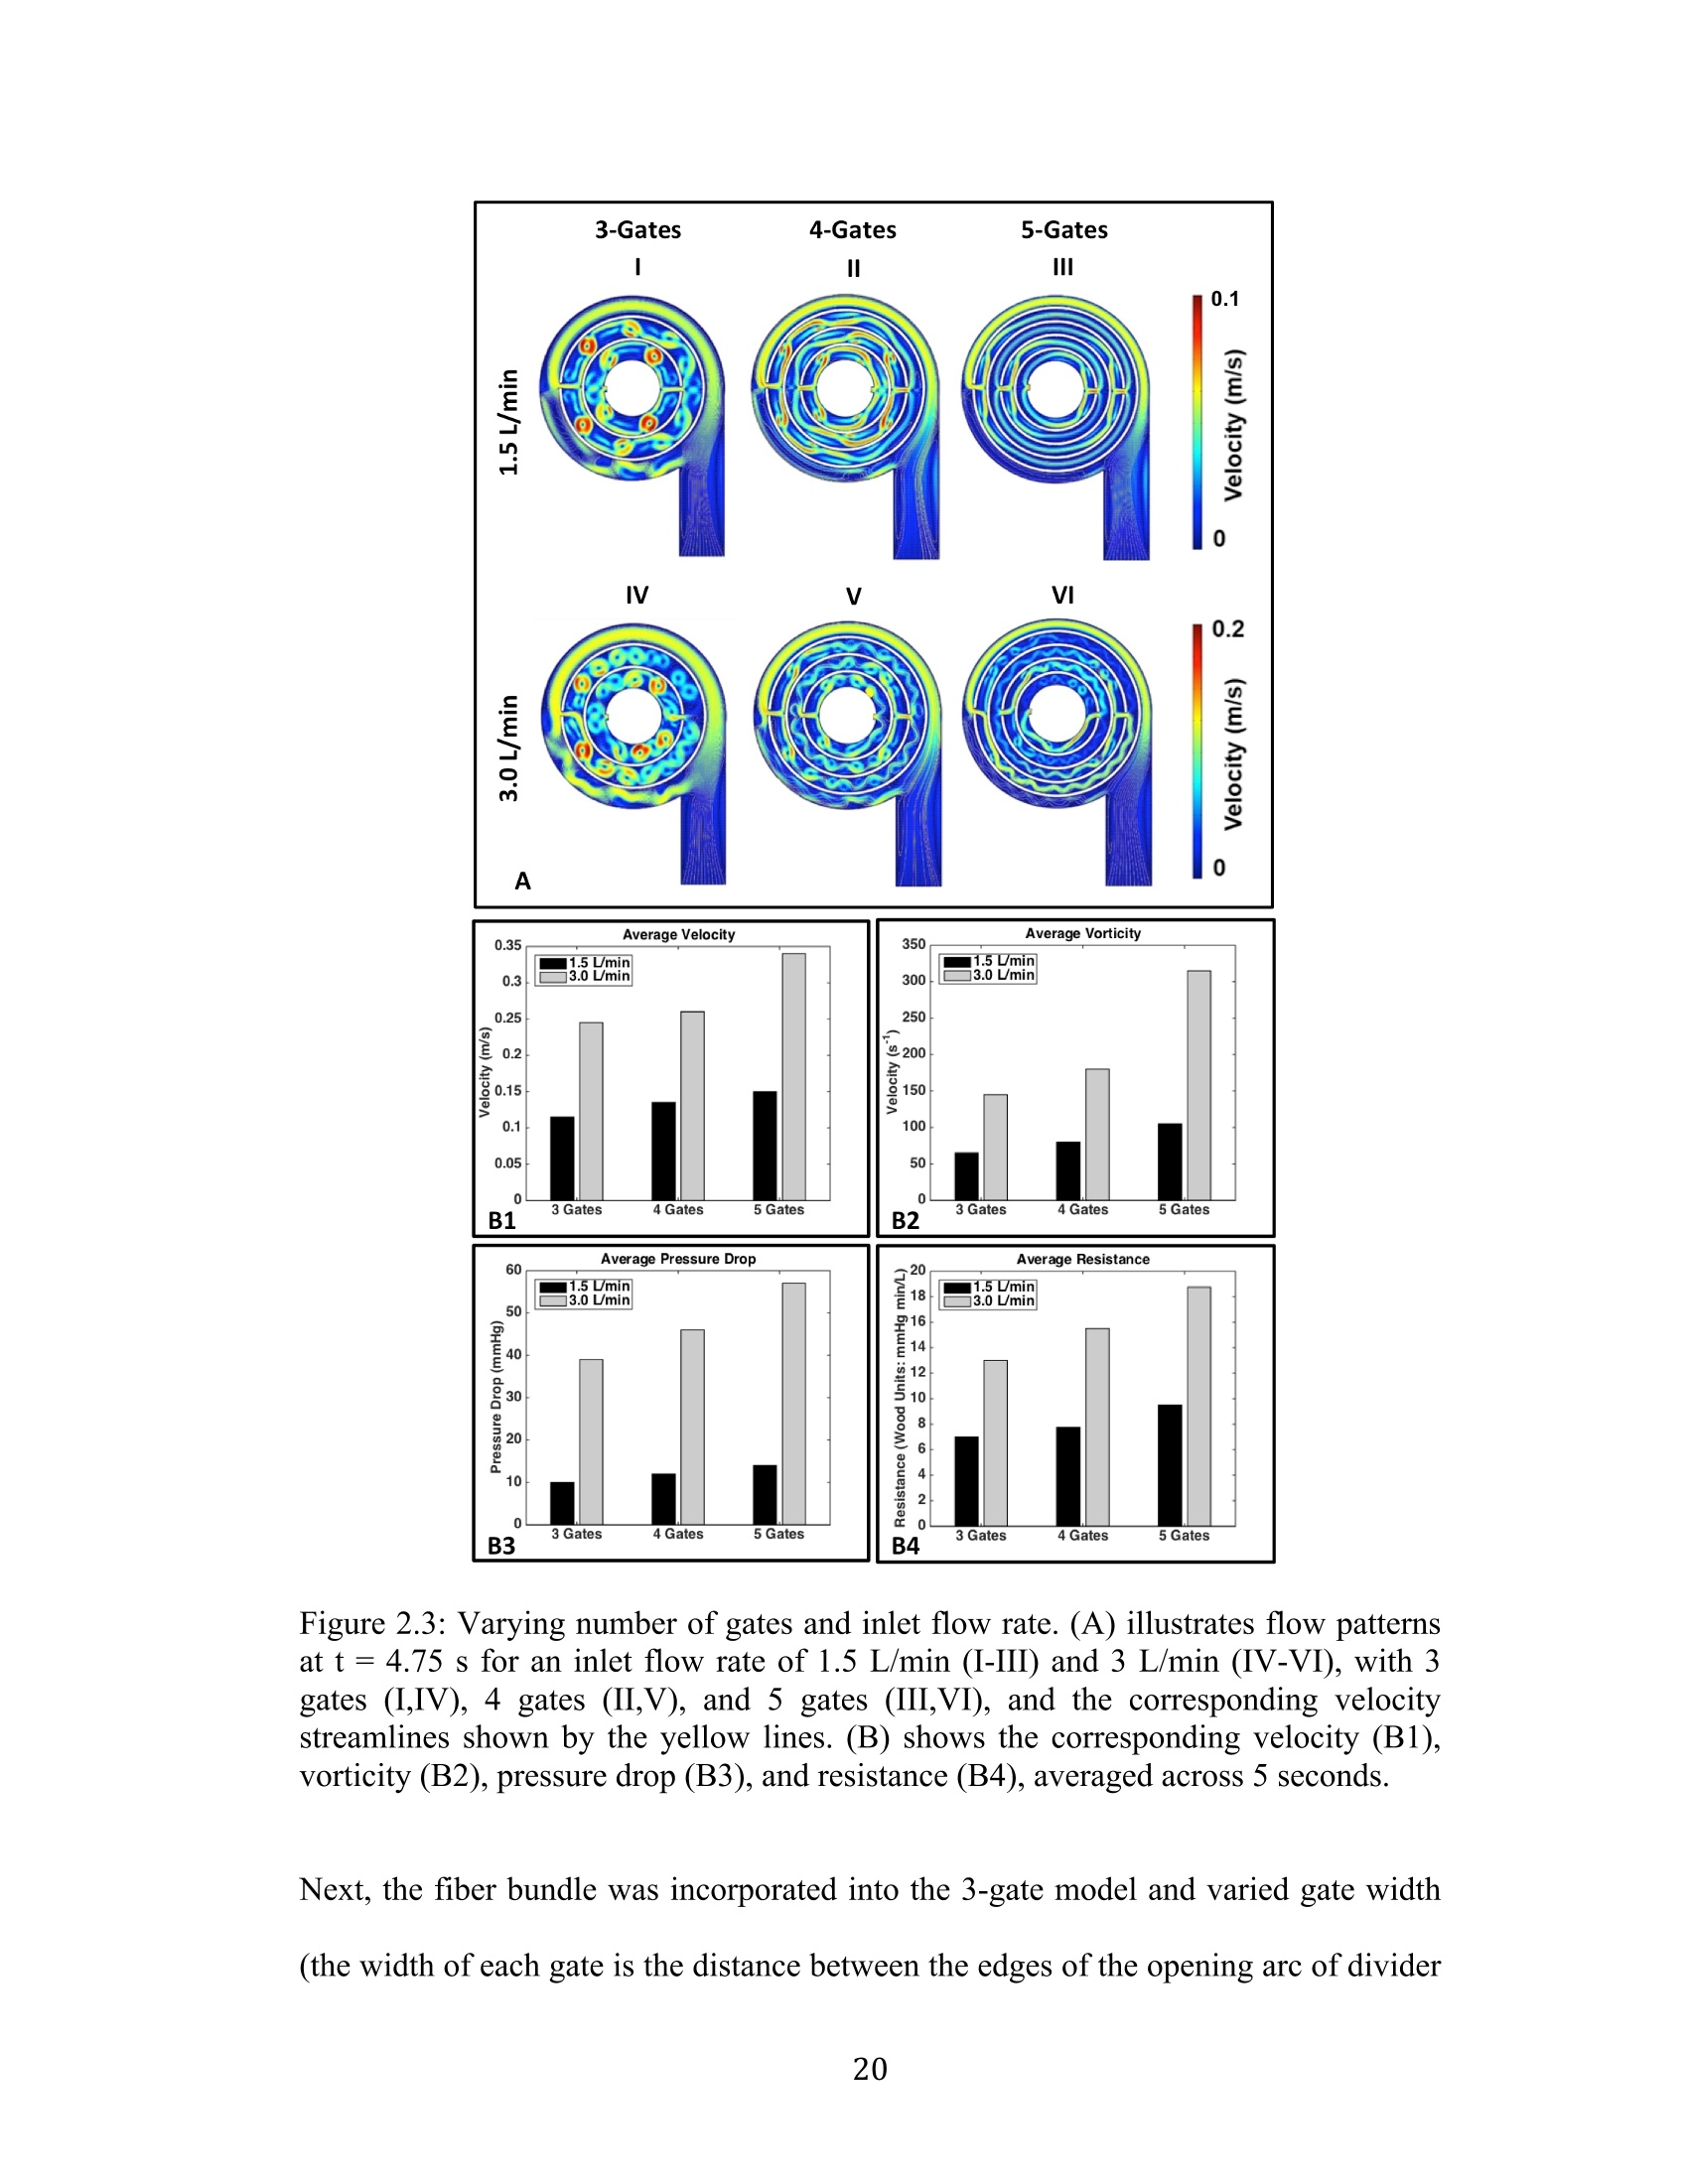
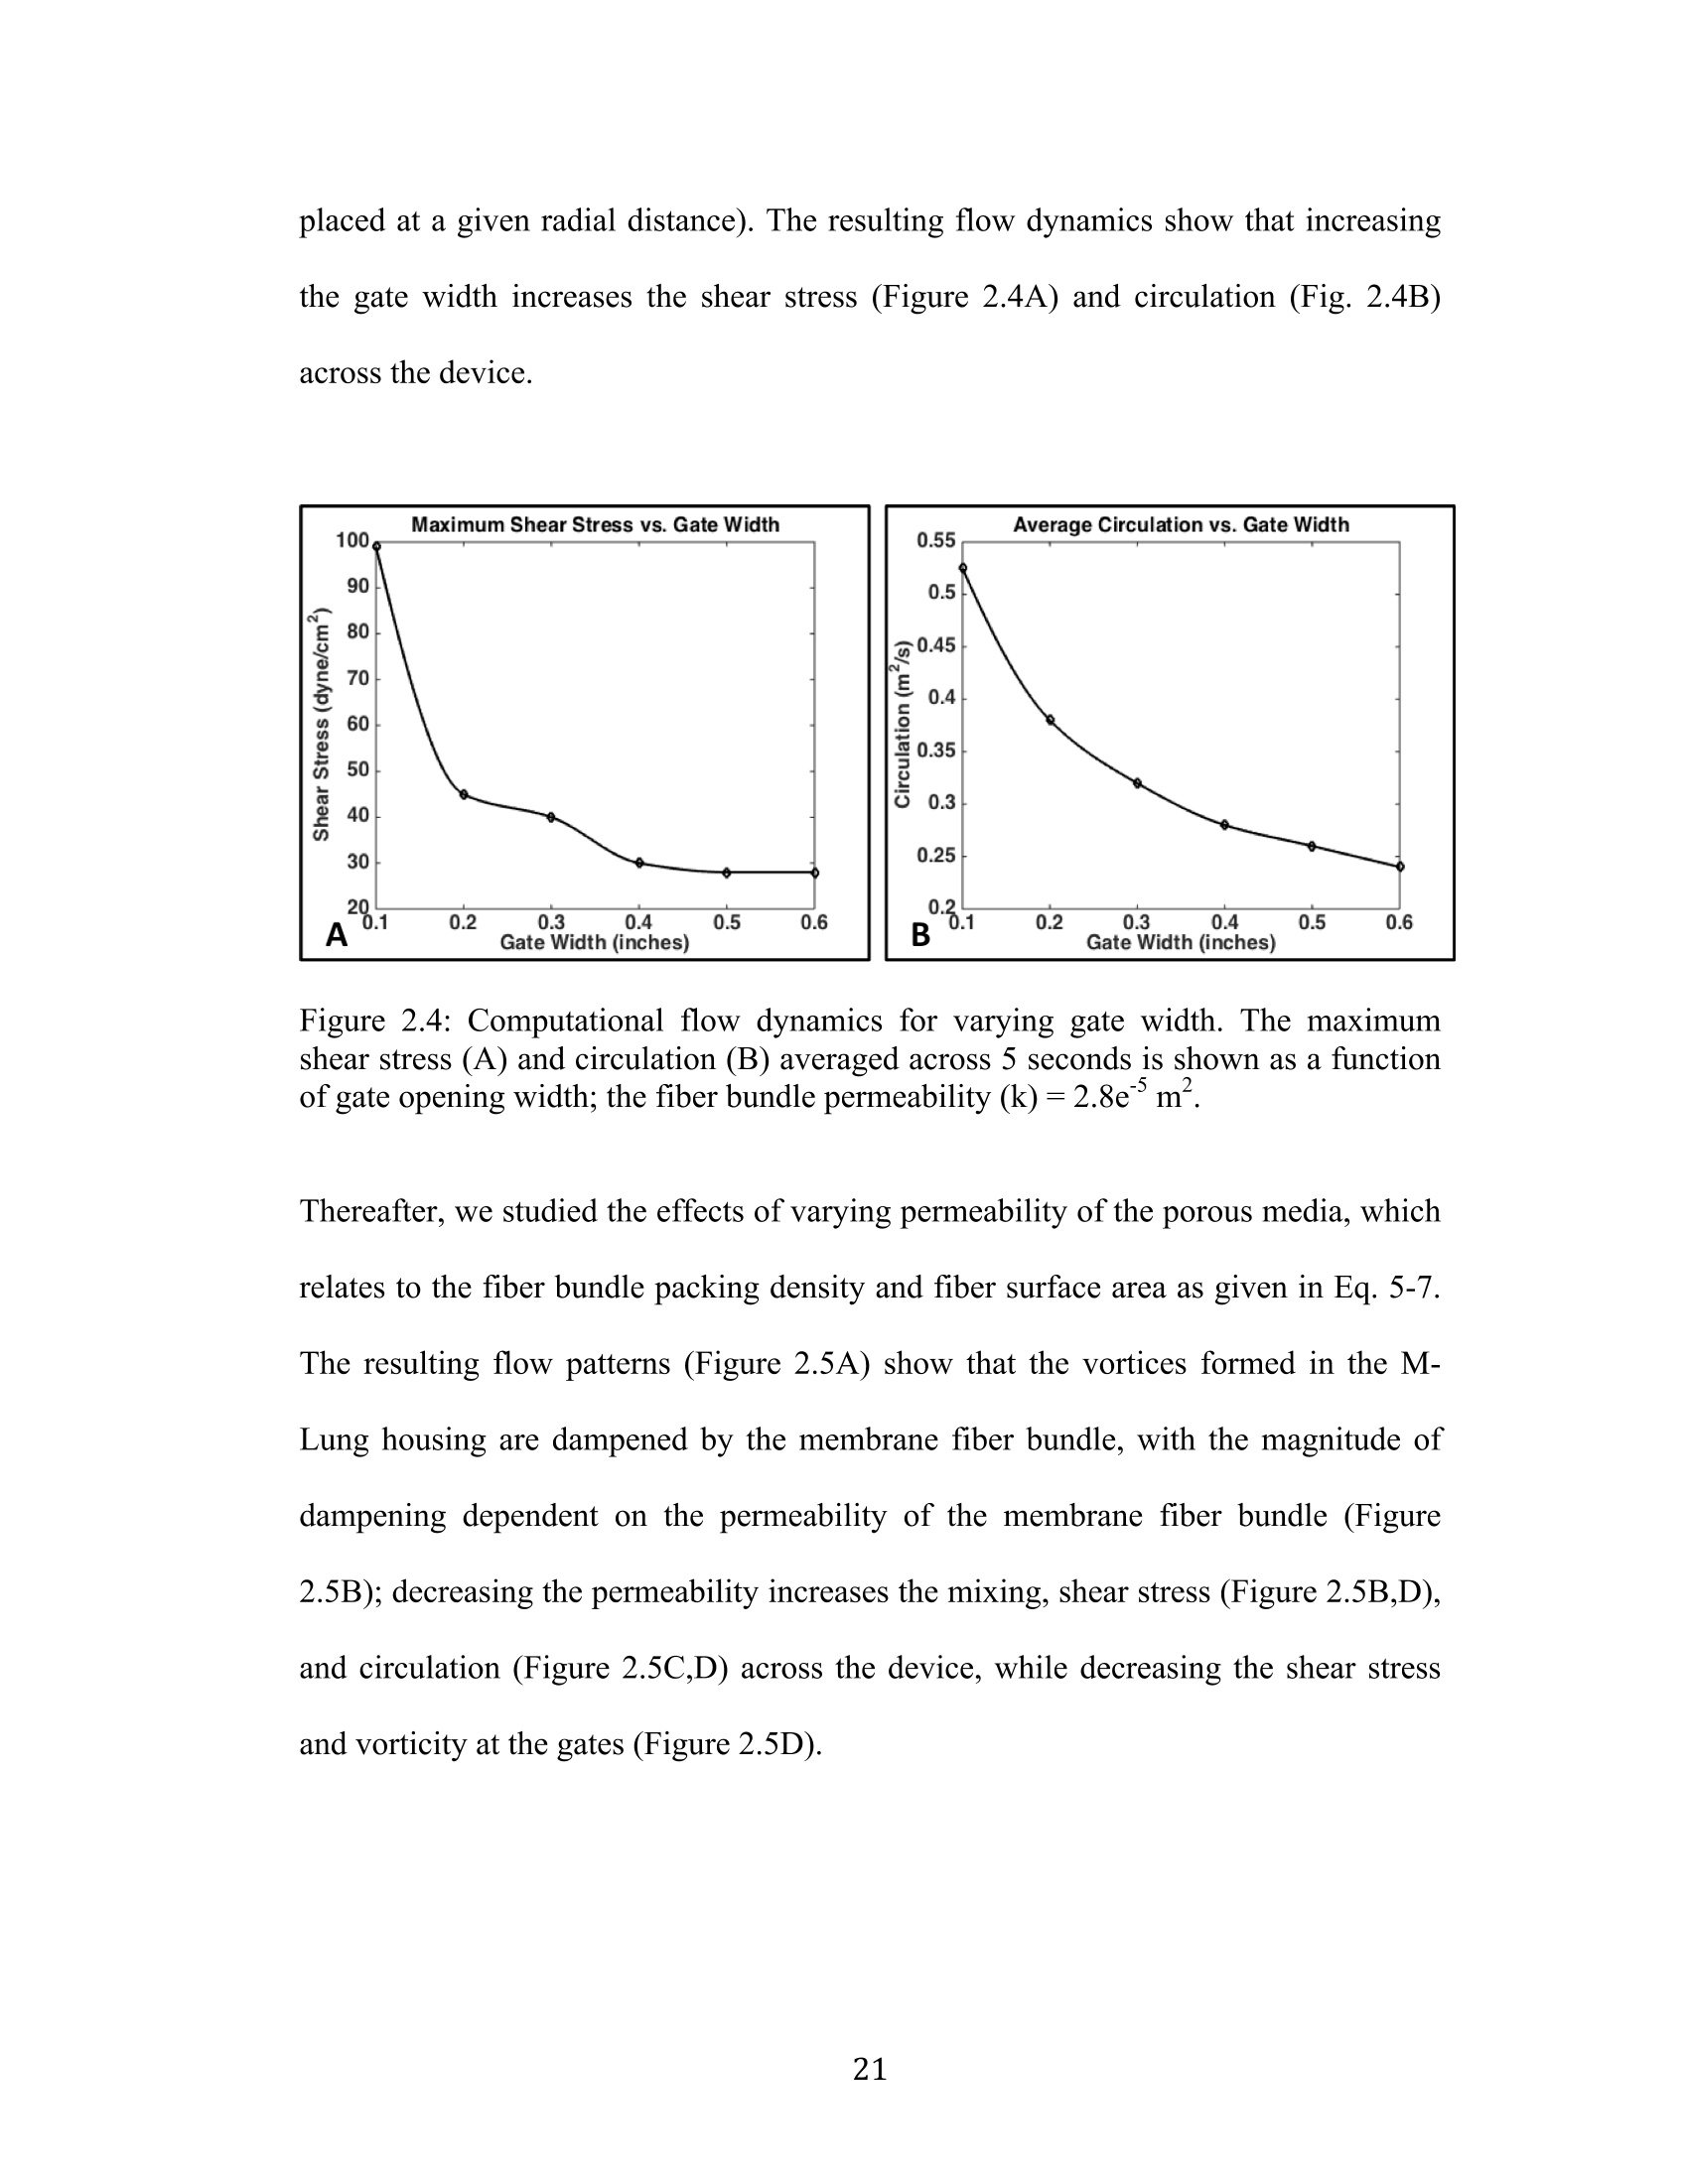
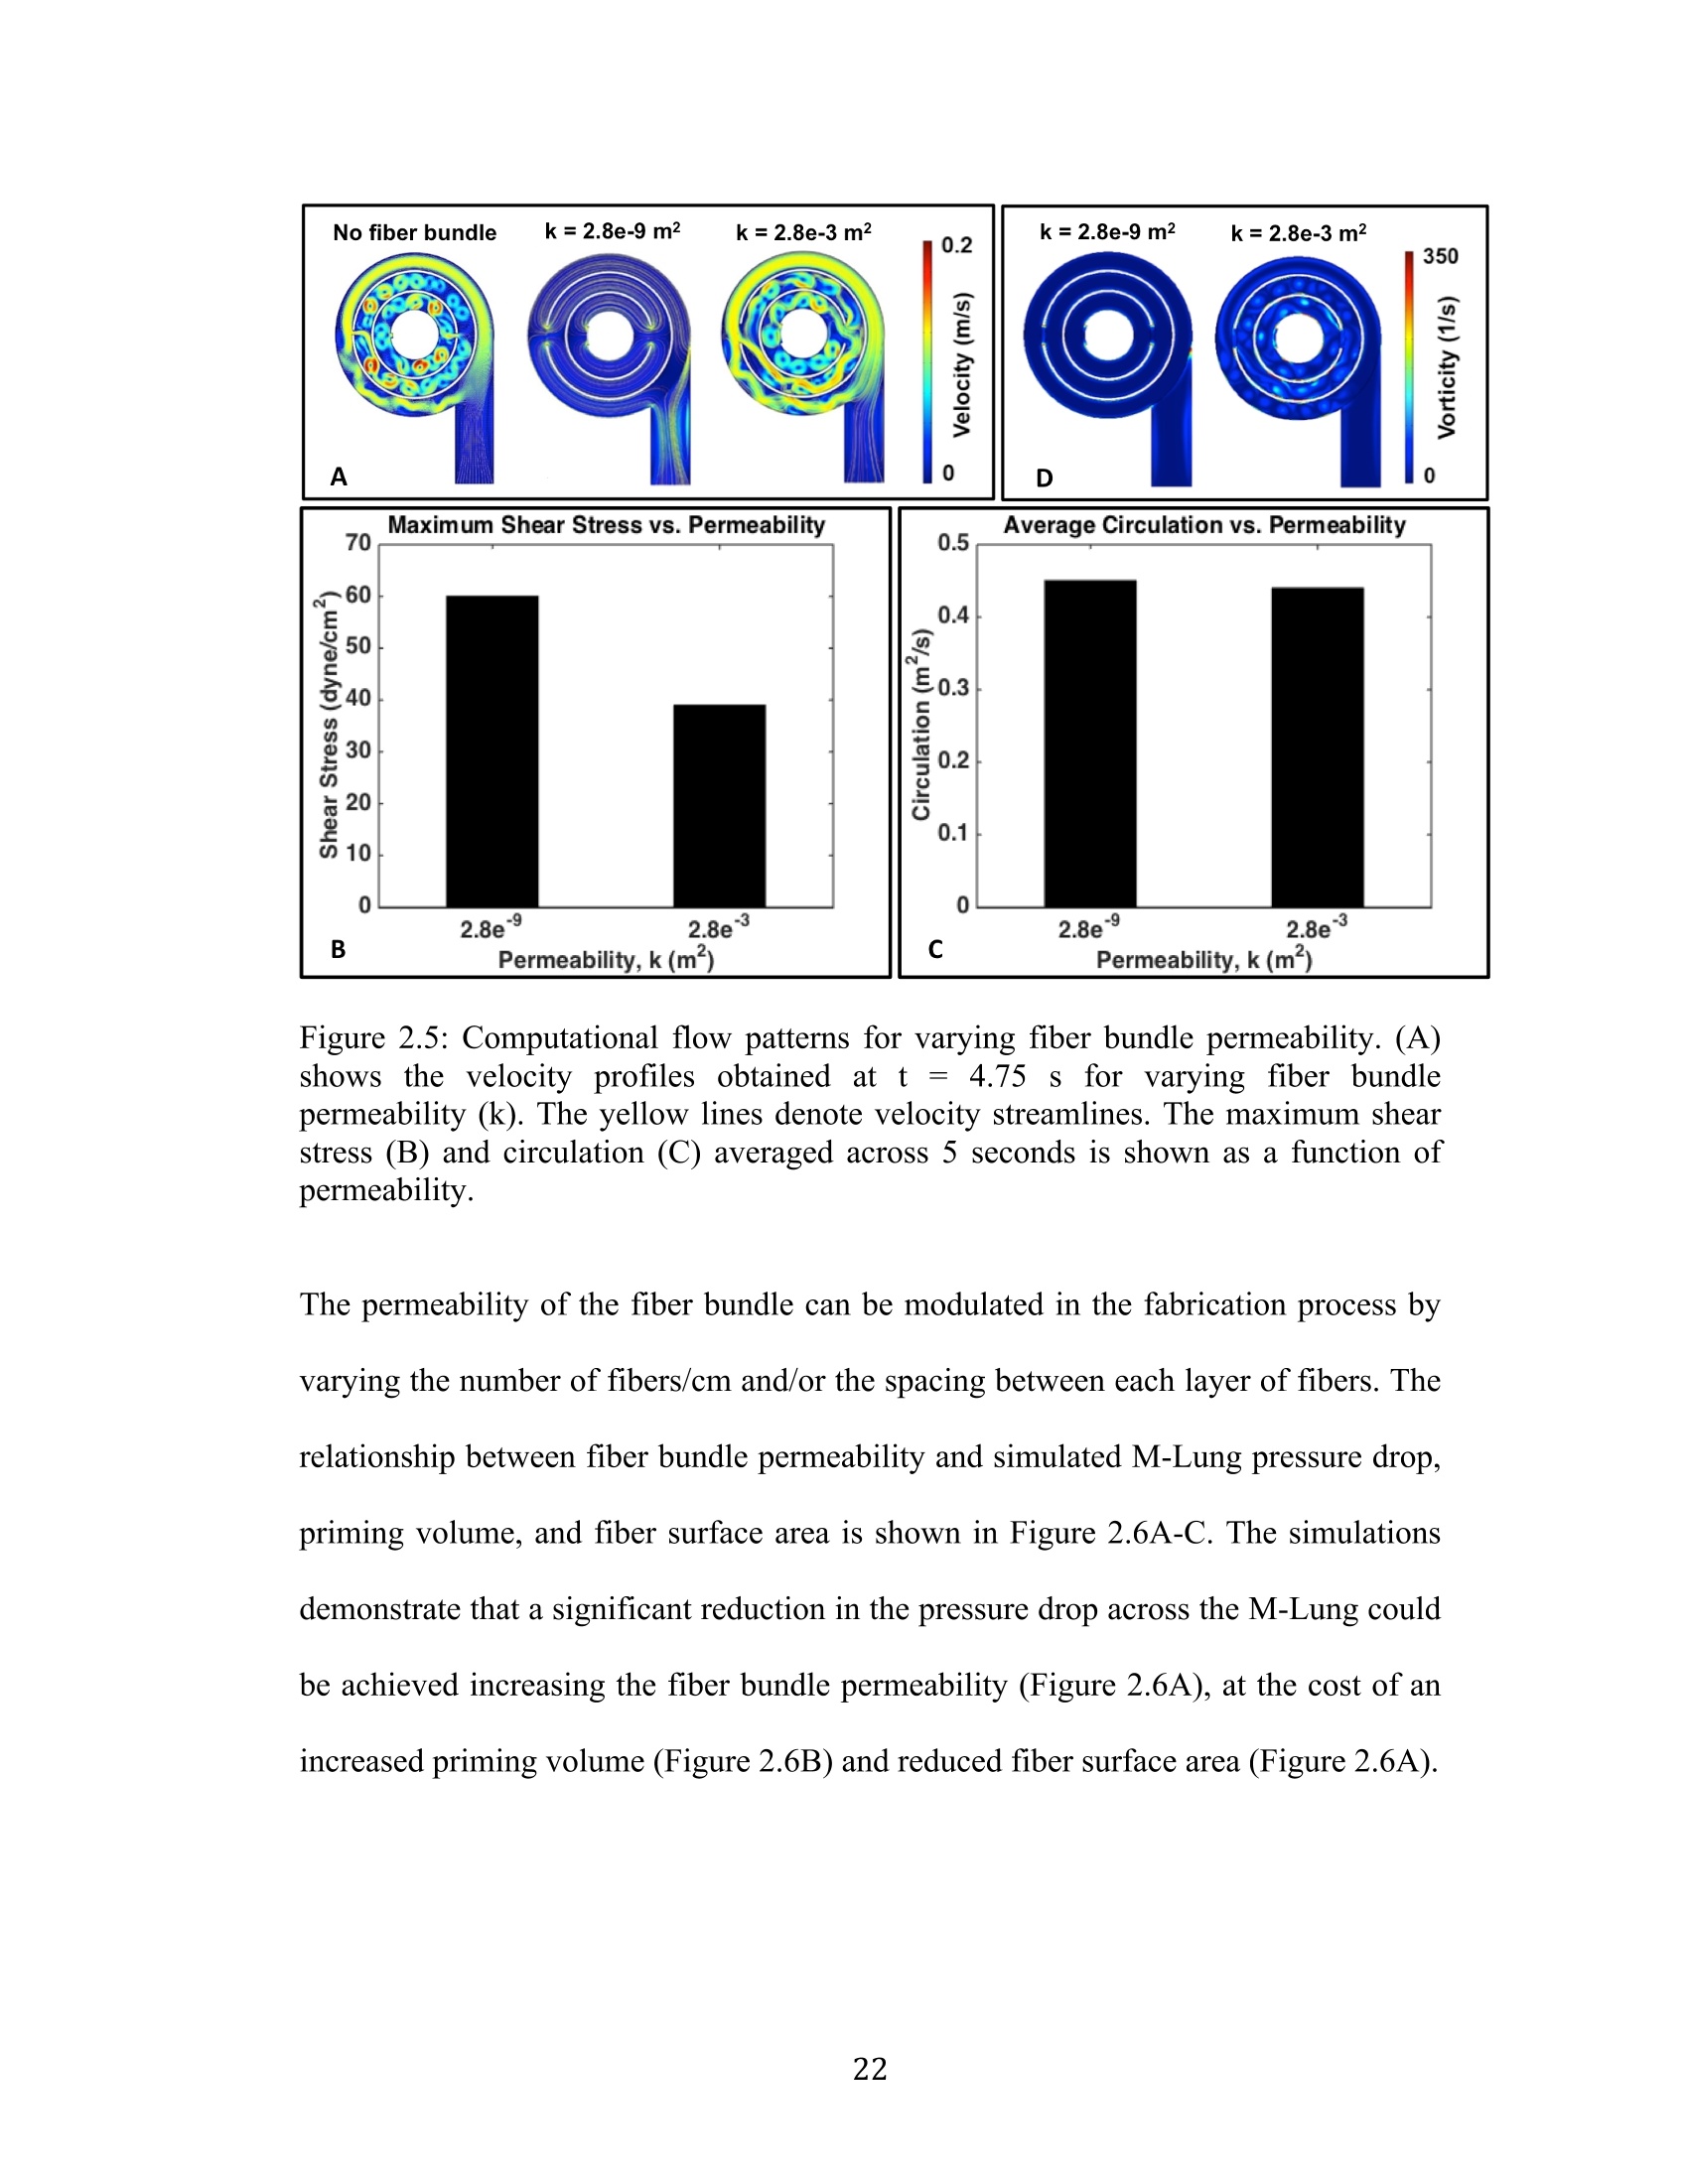
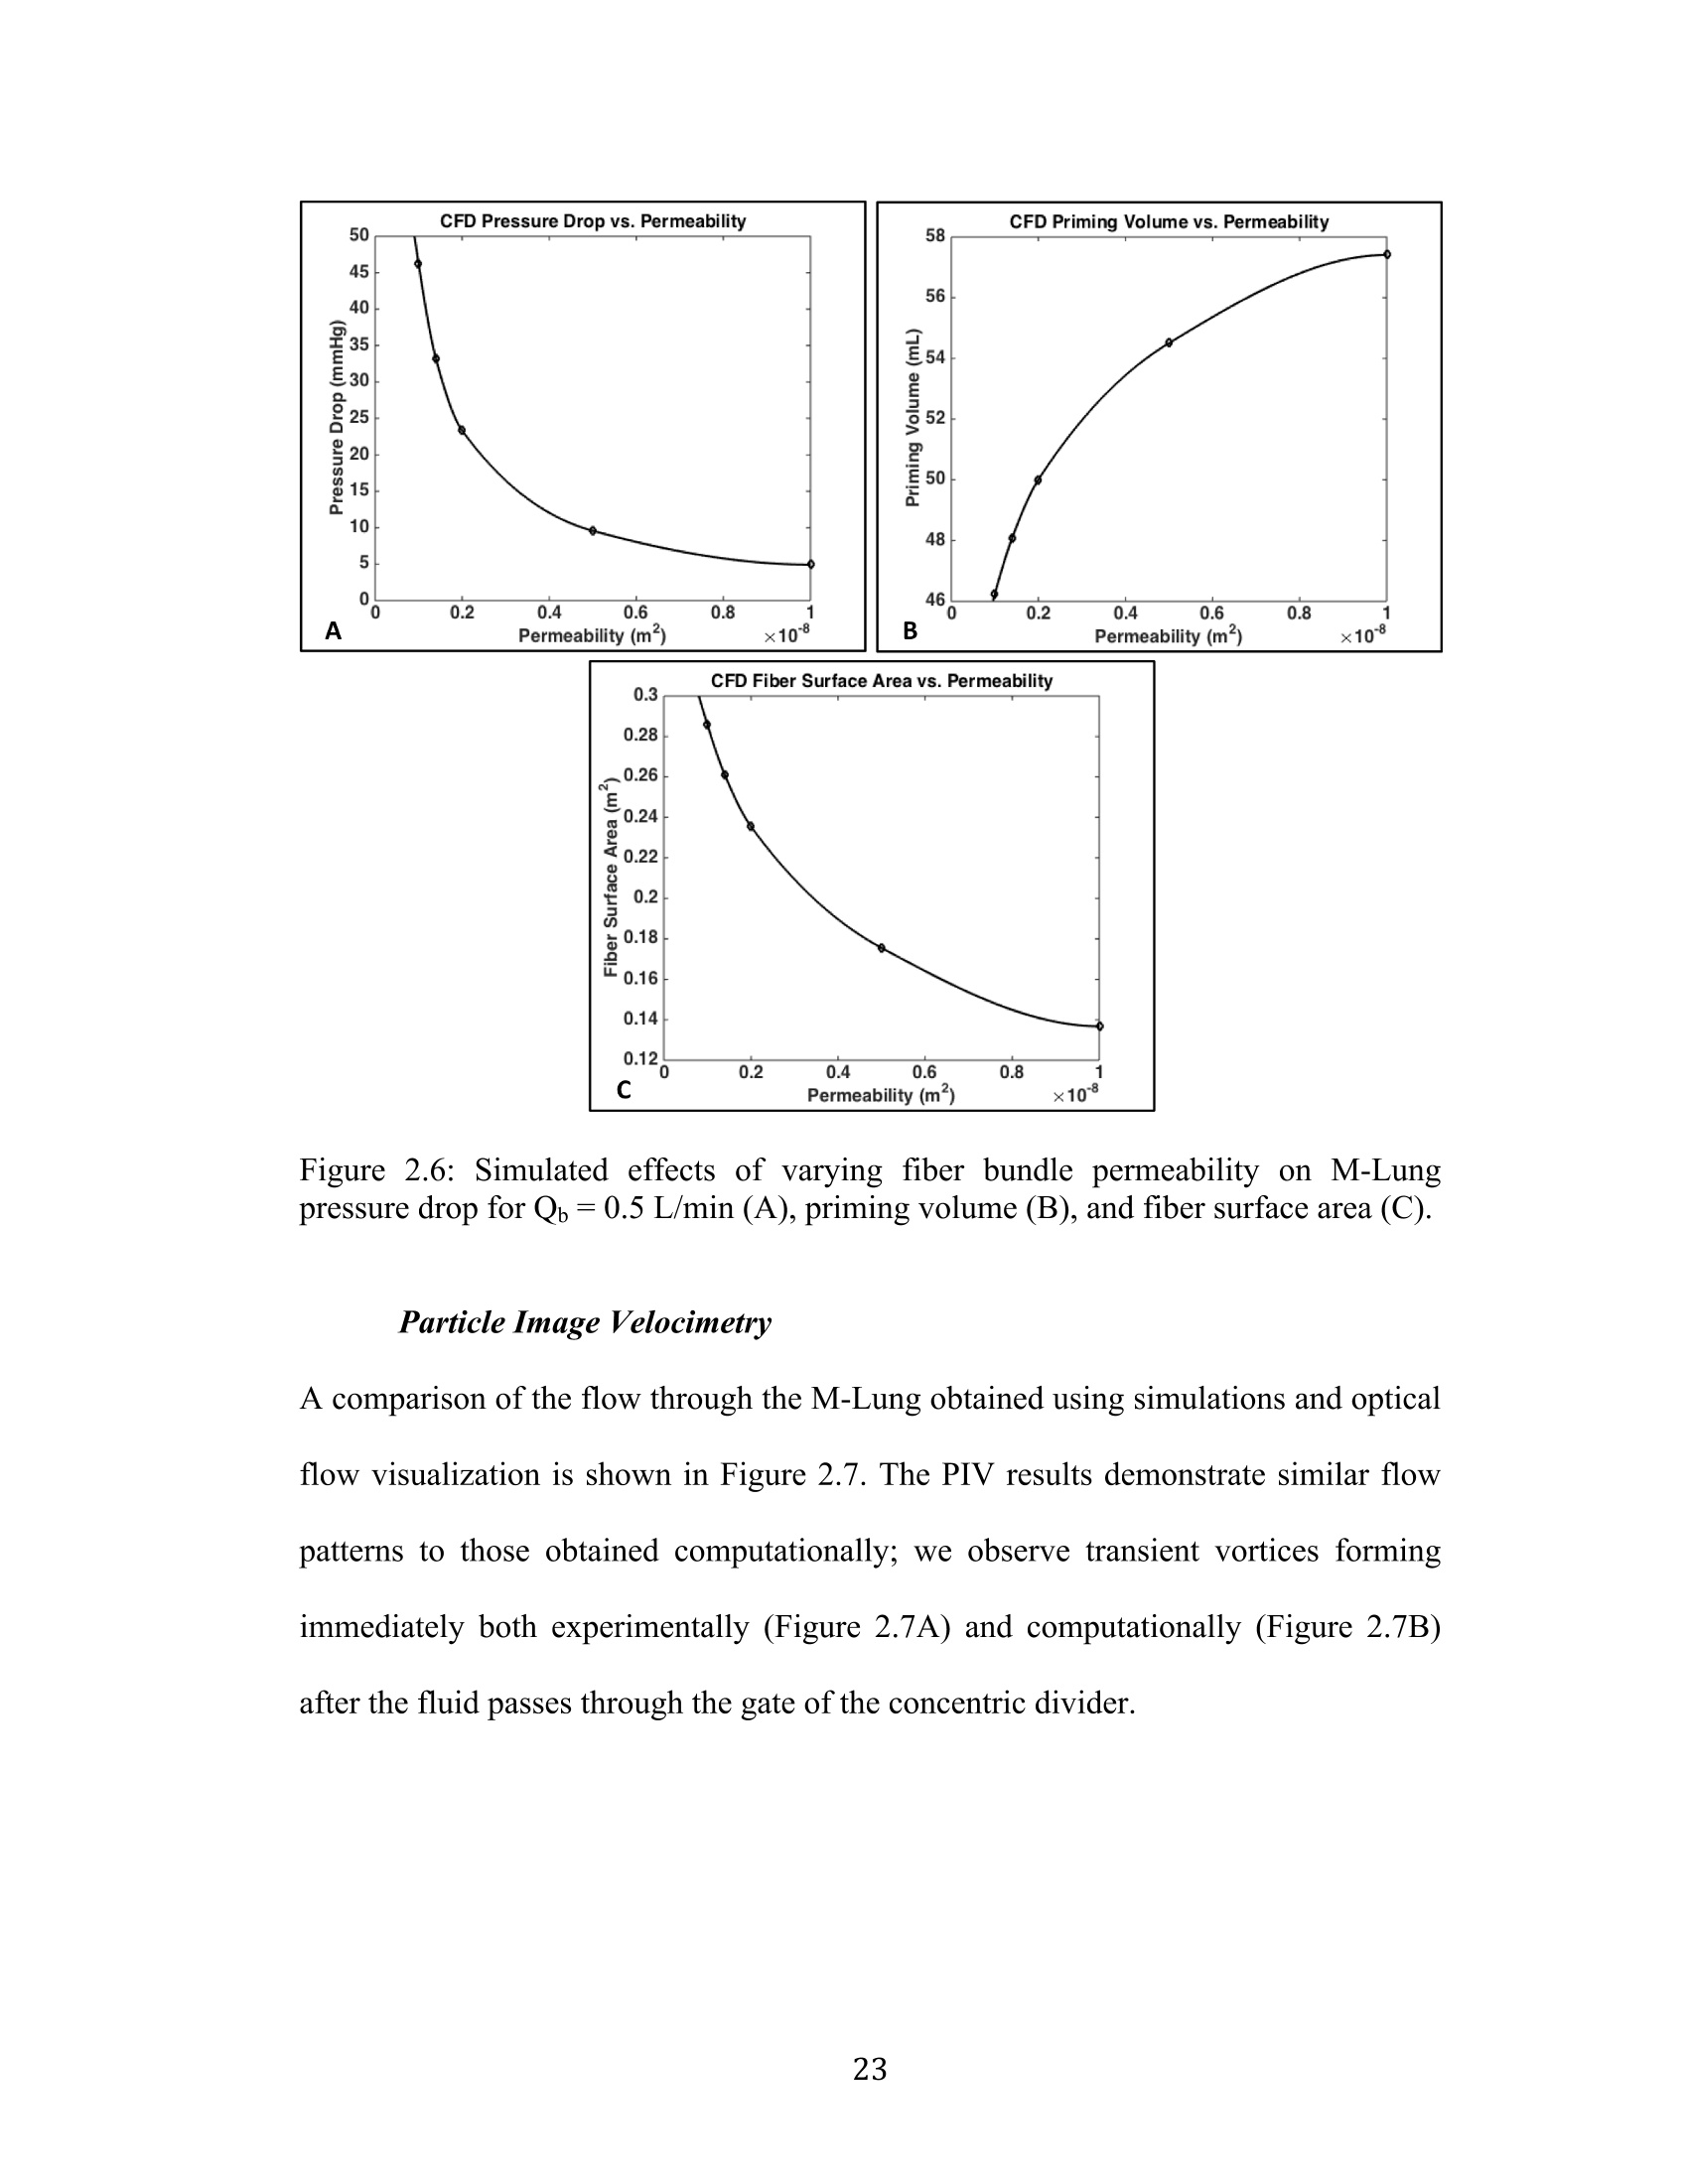
方案详情
文
采用laVision公司的DaVis6.2图像采集和处理软件平台,FlowMaster-S相机,以及Solo III型 15Hz Nd-YAG PIV 激光器。构成了一套粒子成像测速系统,并利用该系统测量了新研制的人工膜肺内的空气流场。
方案详情

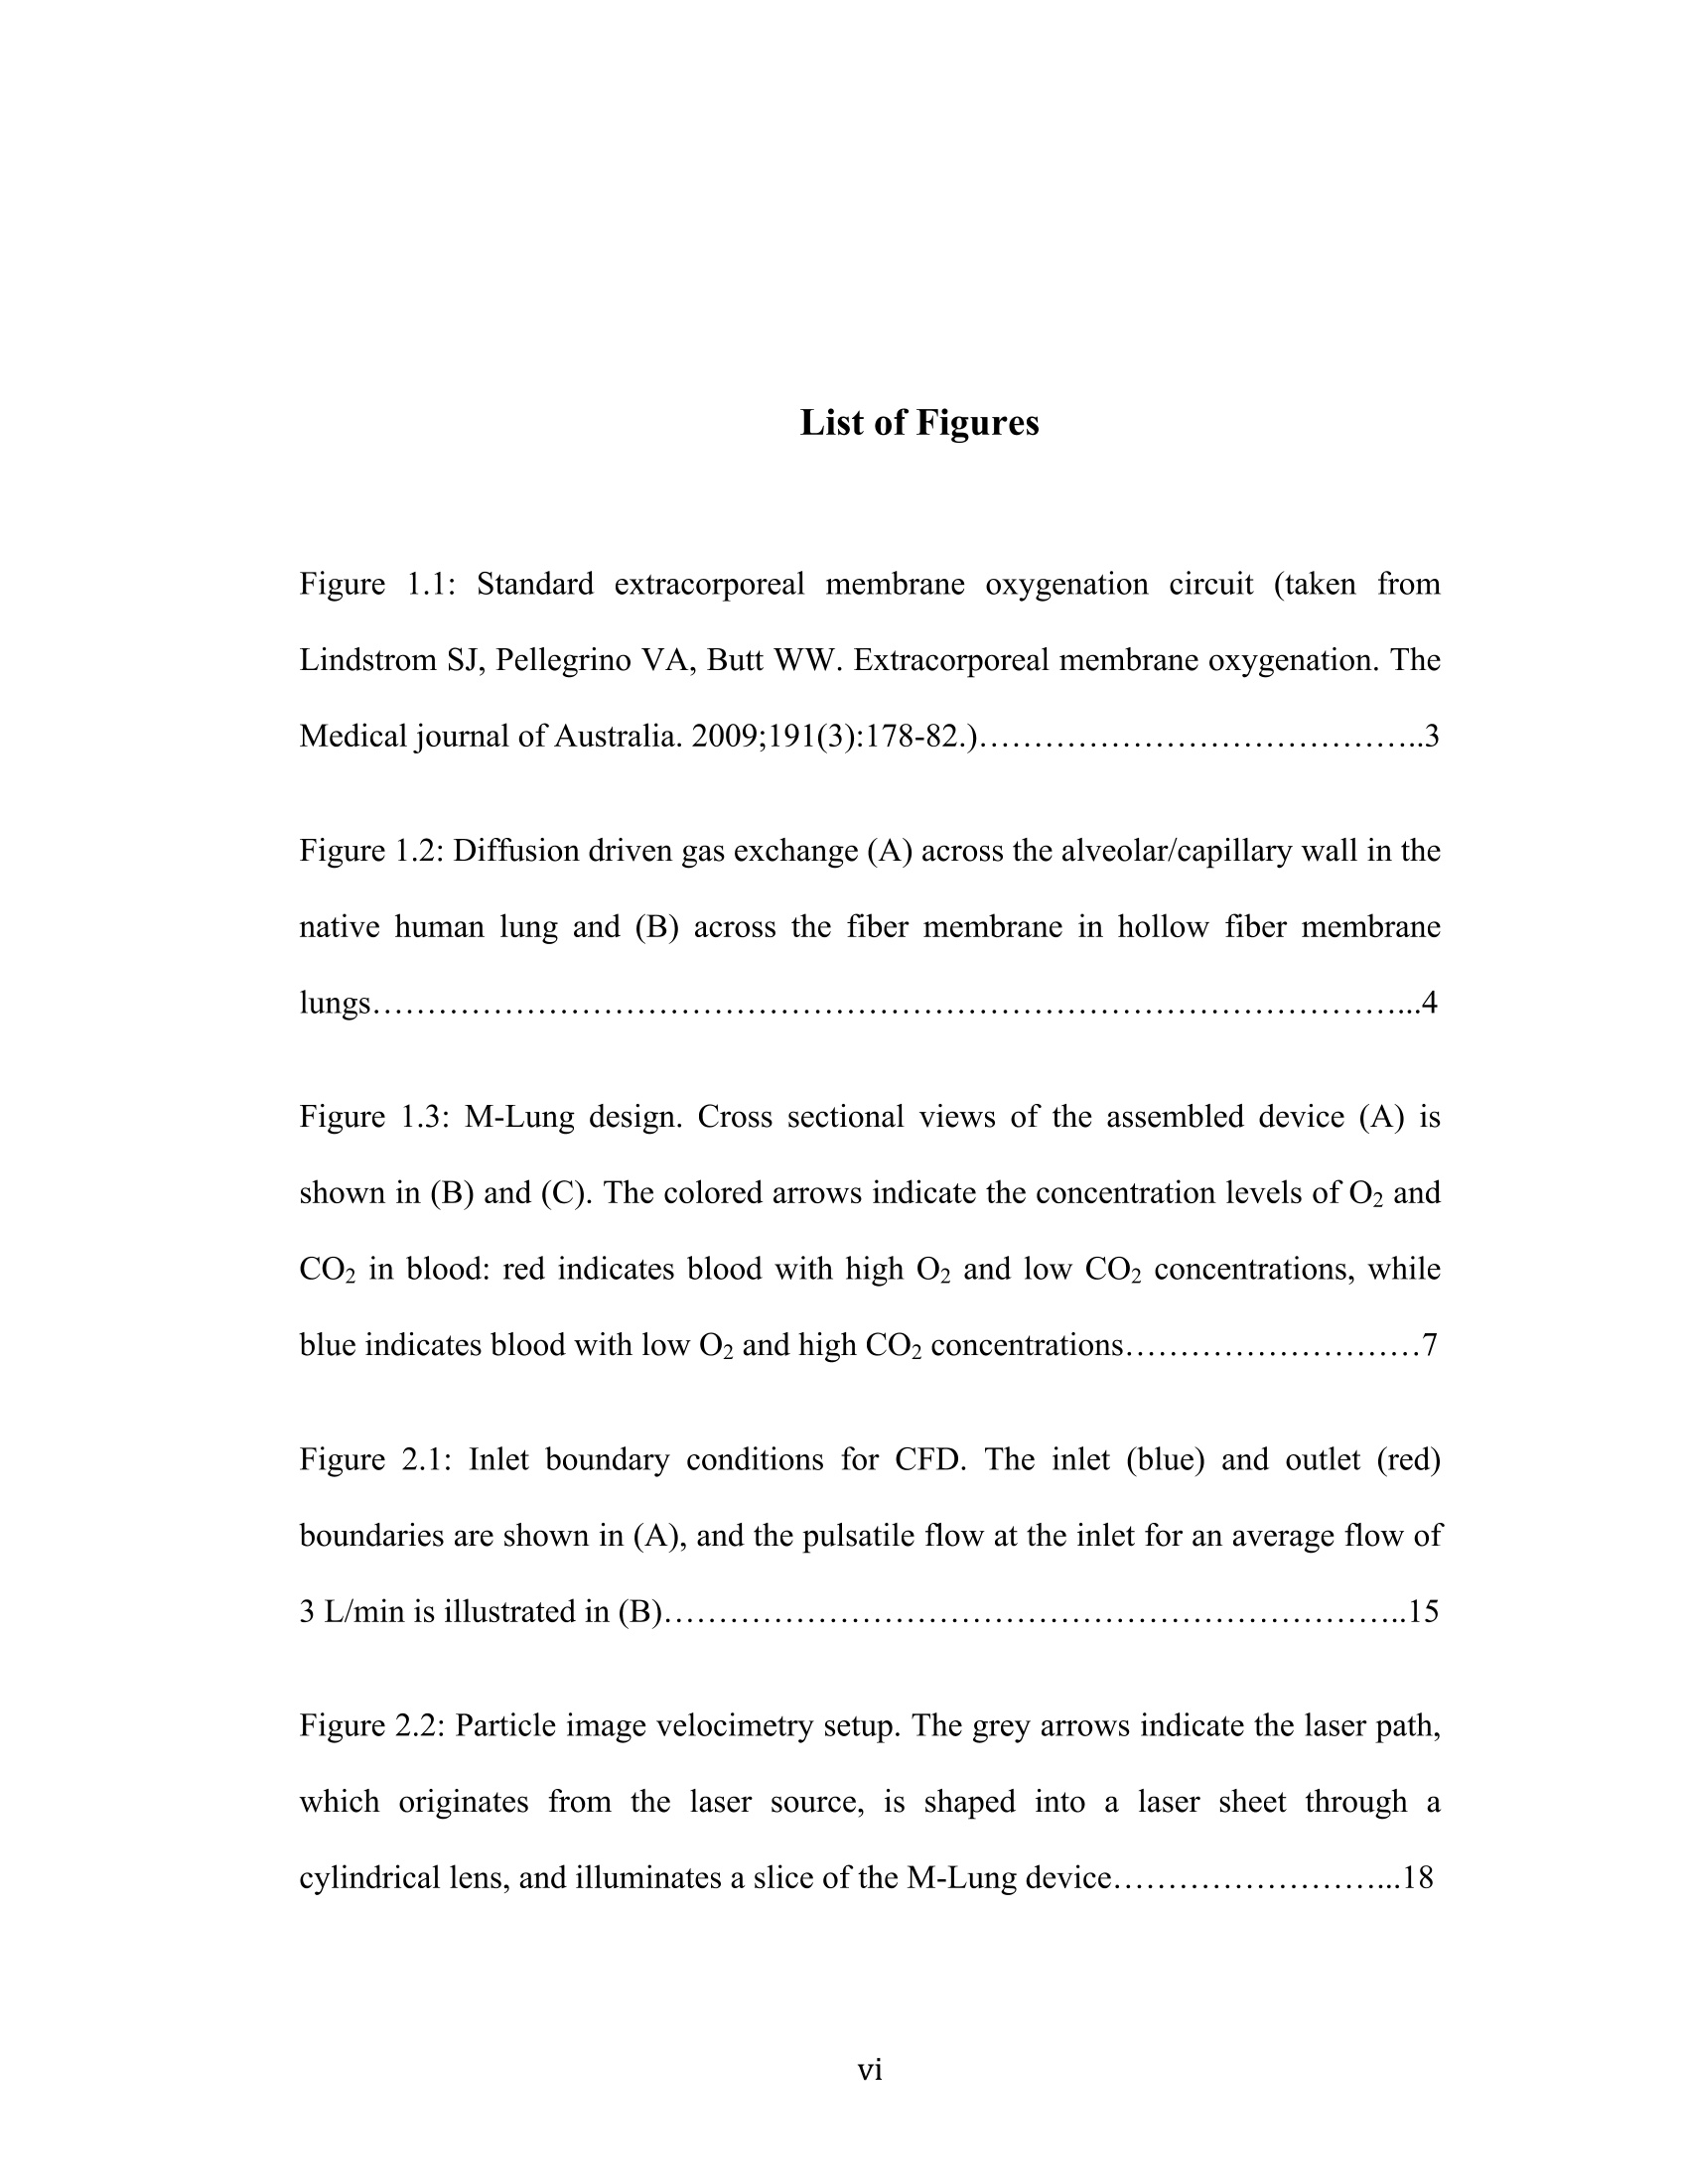
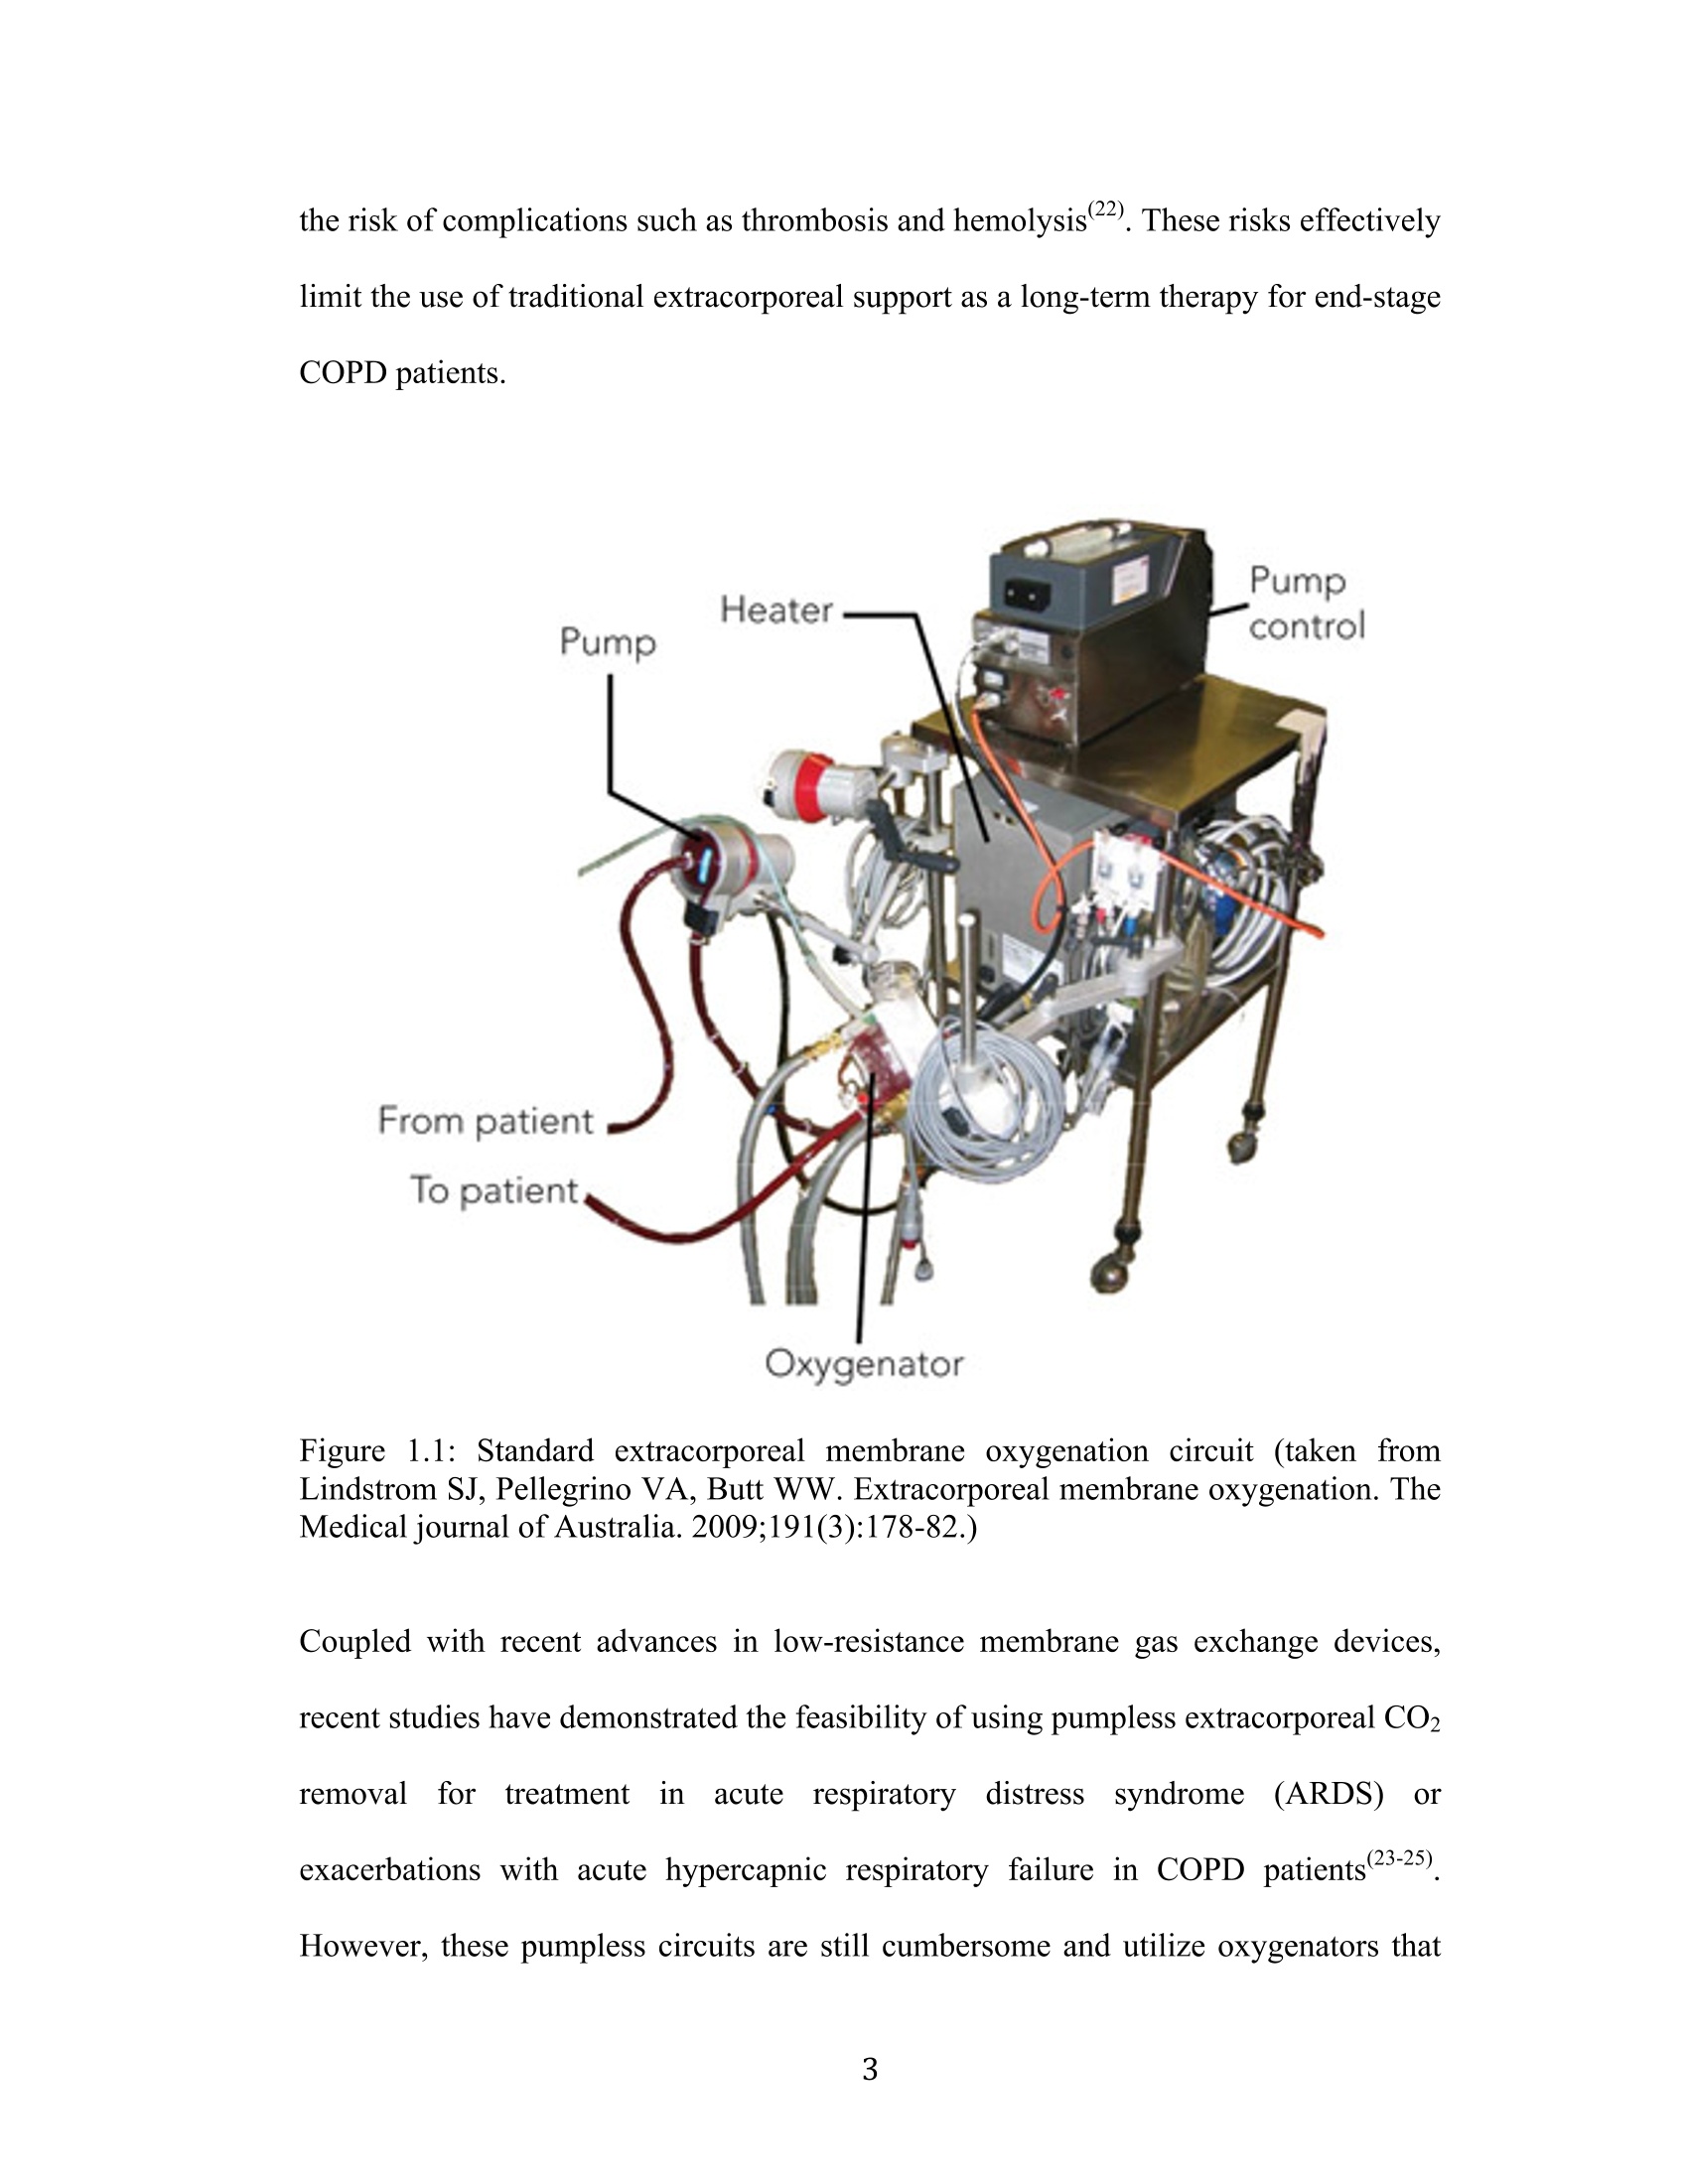
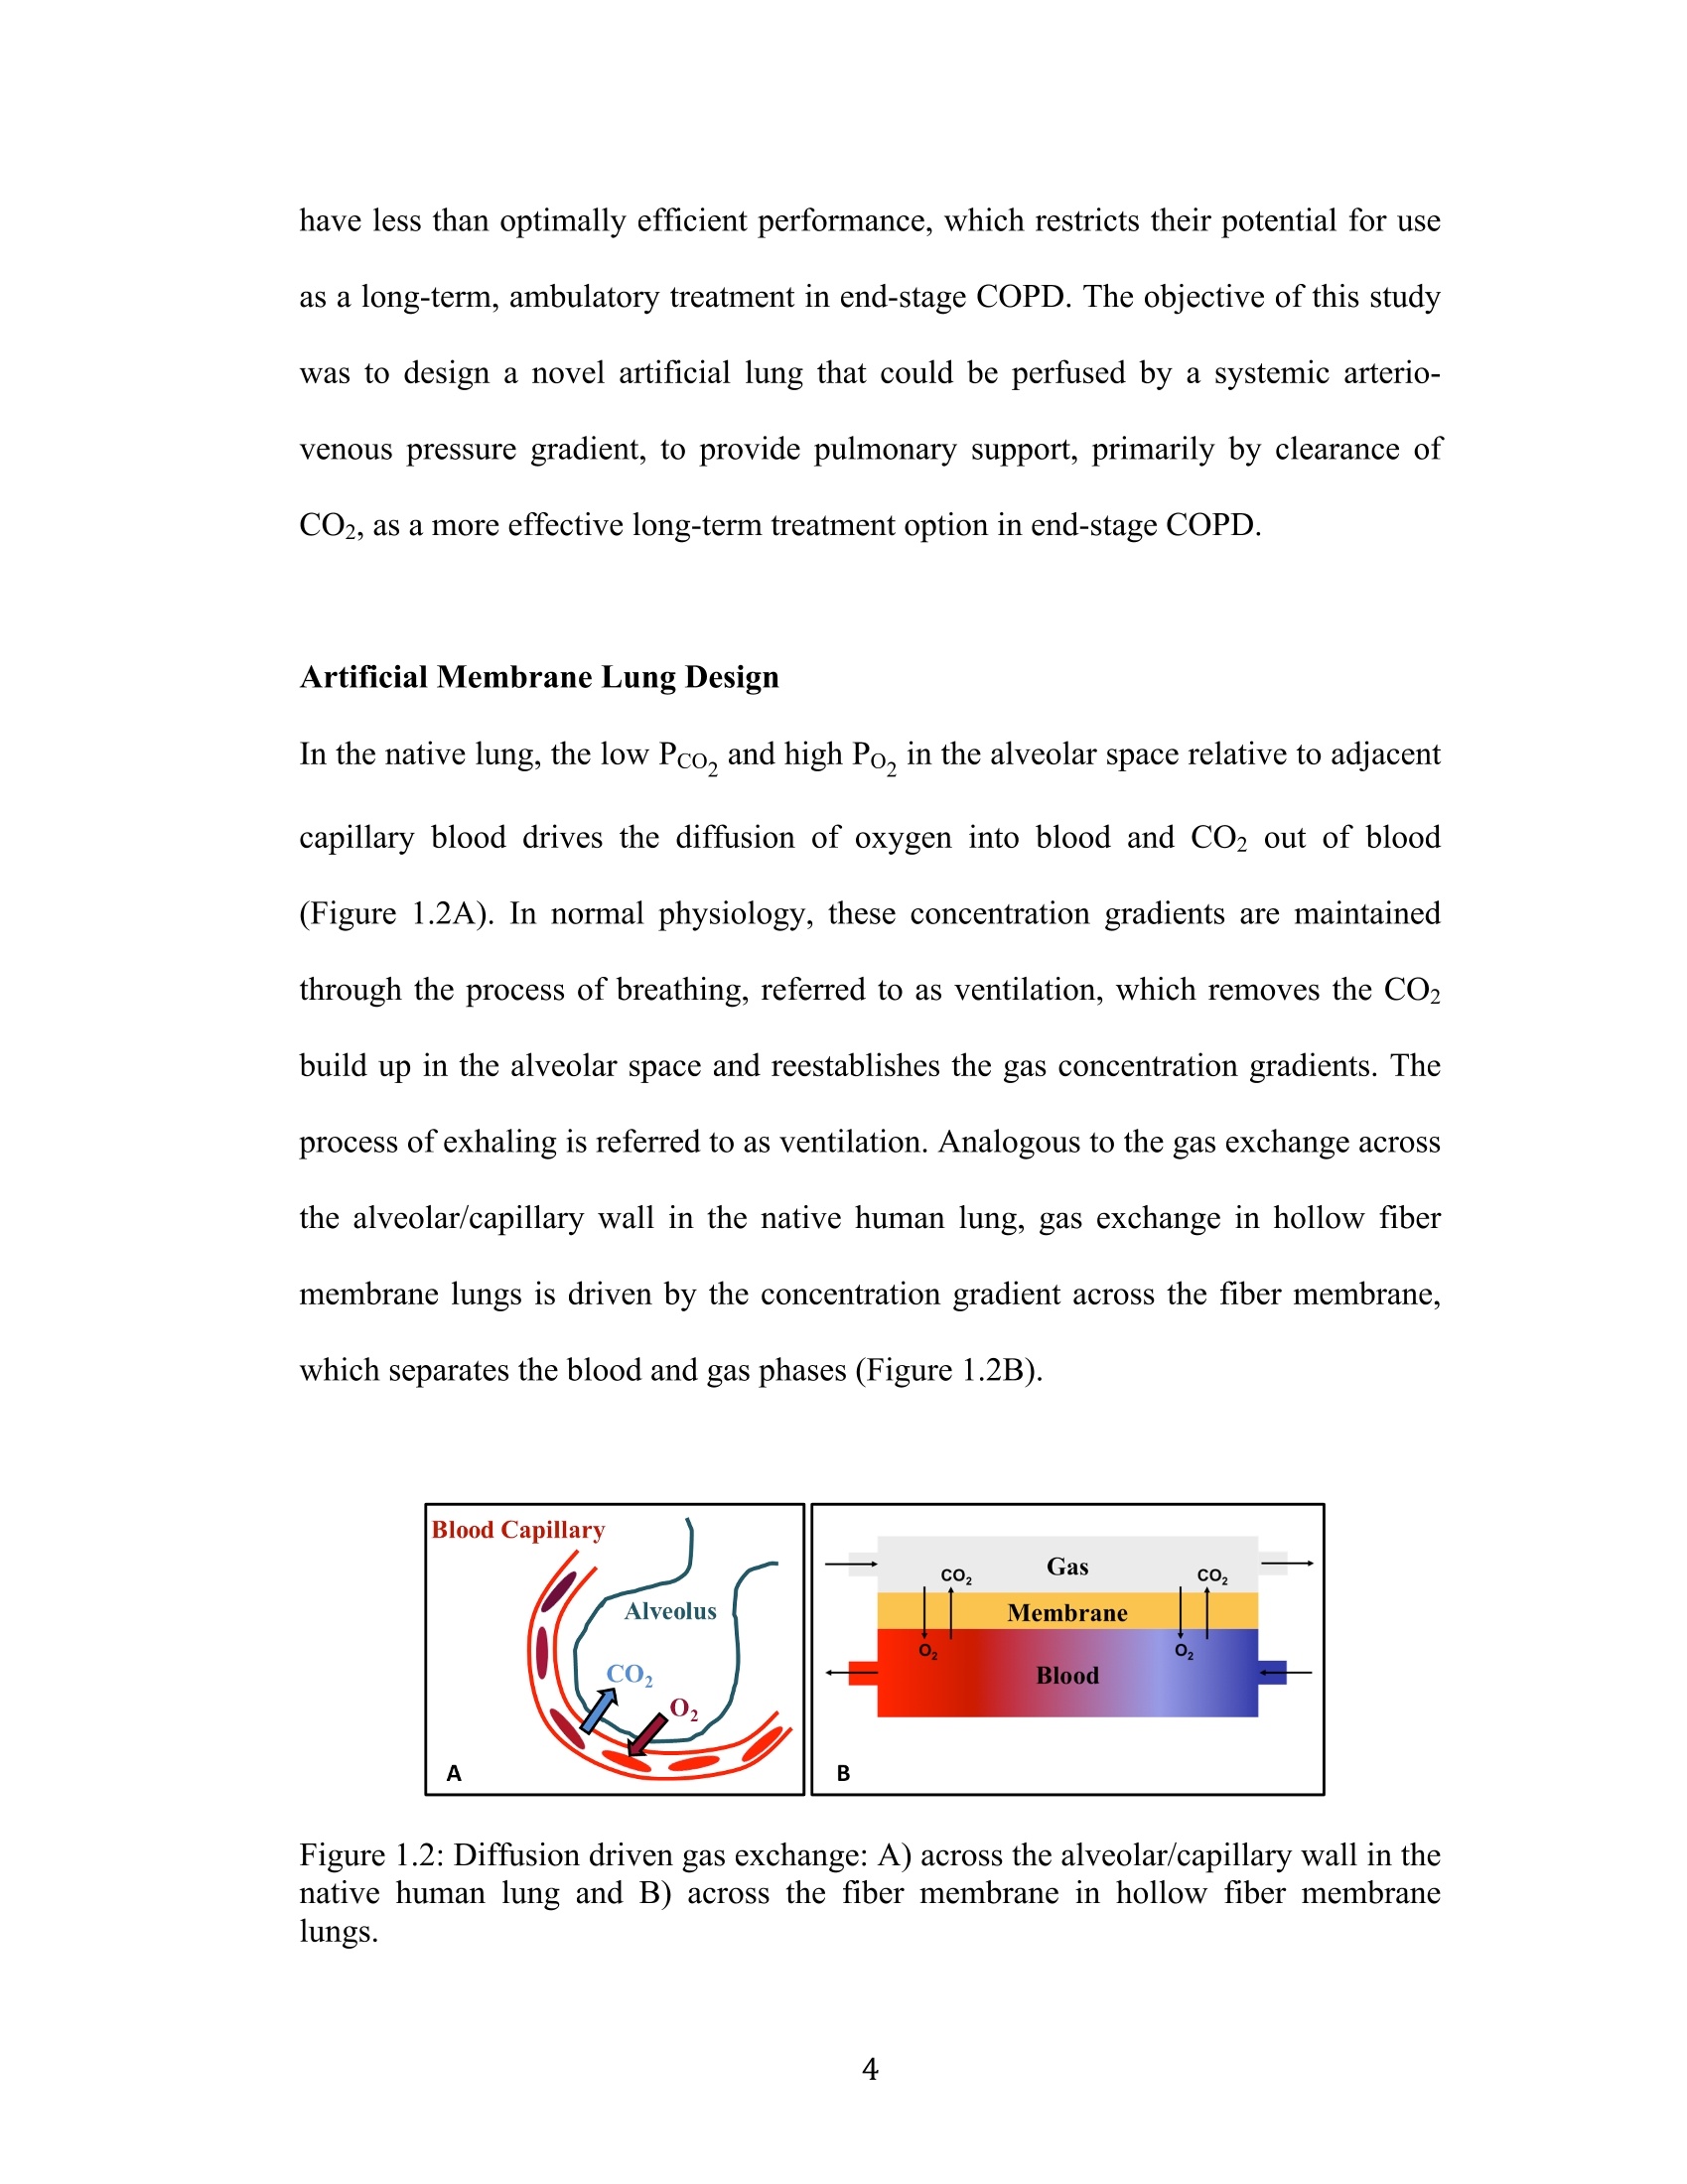
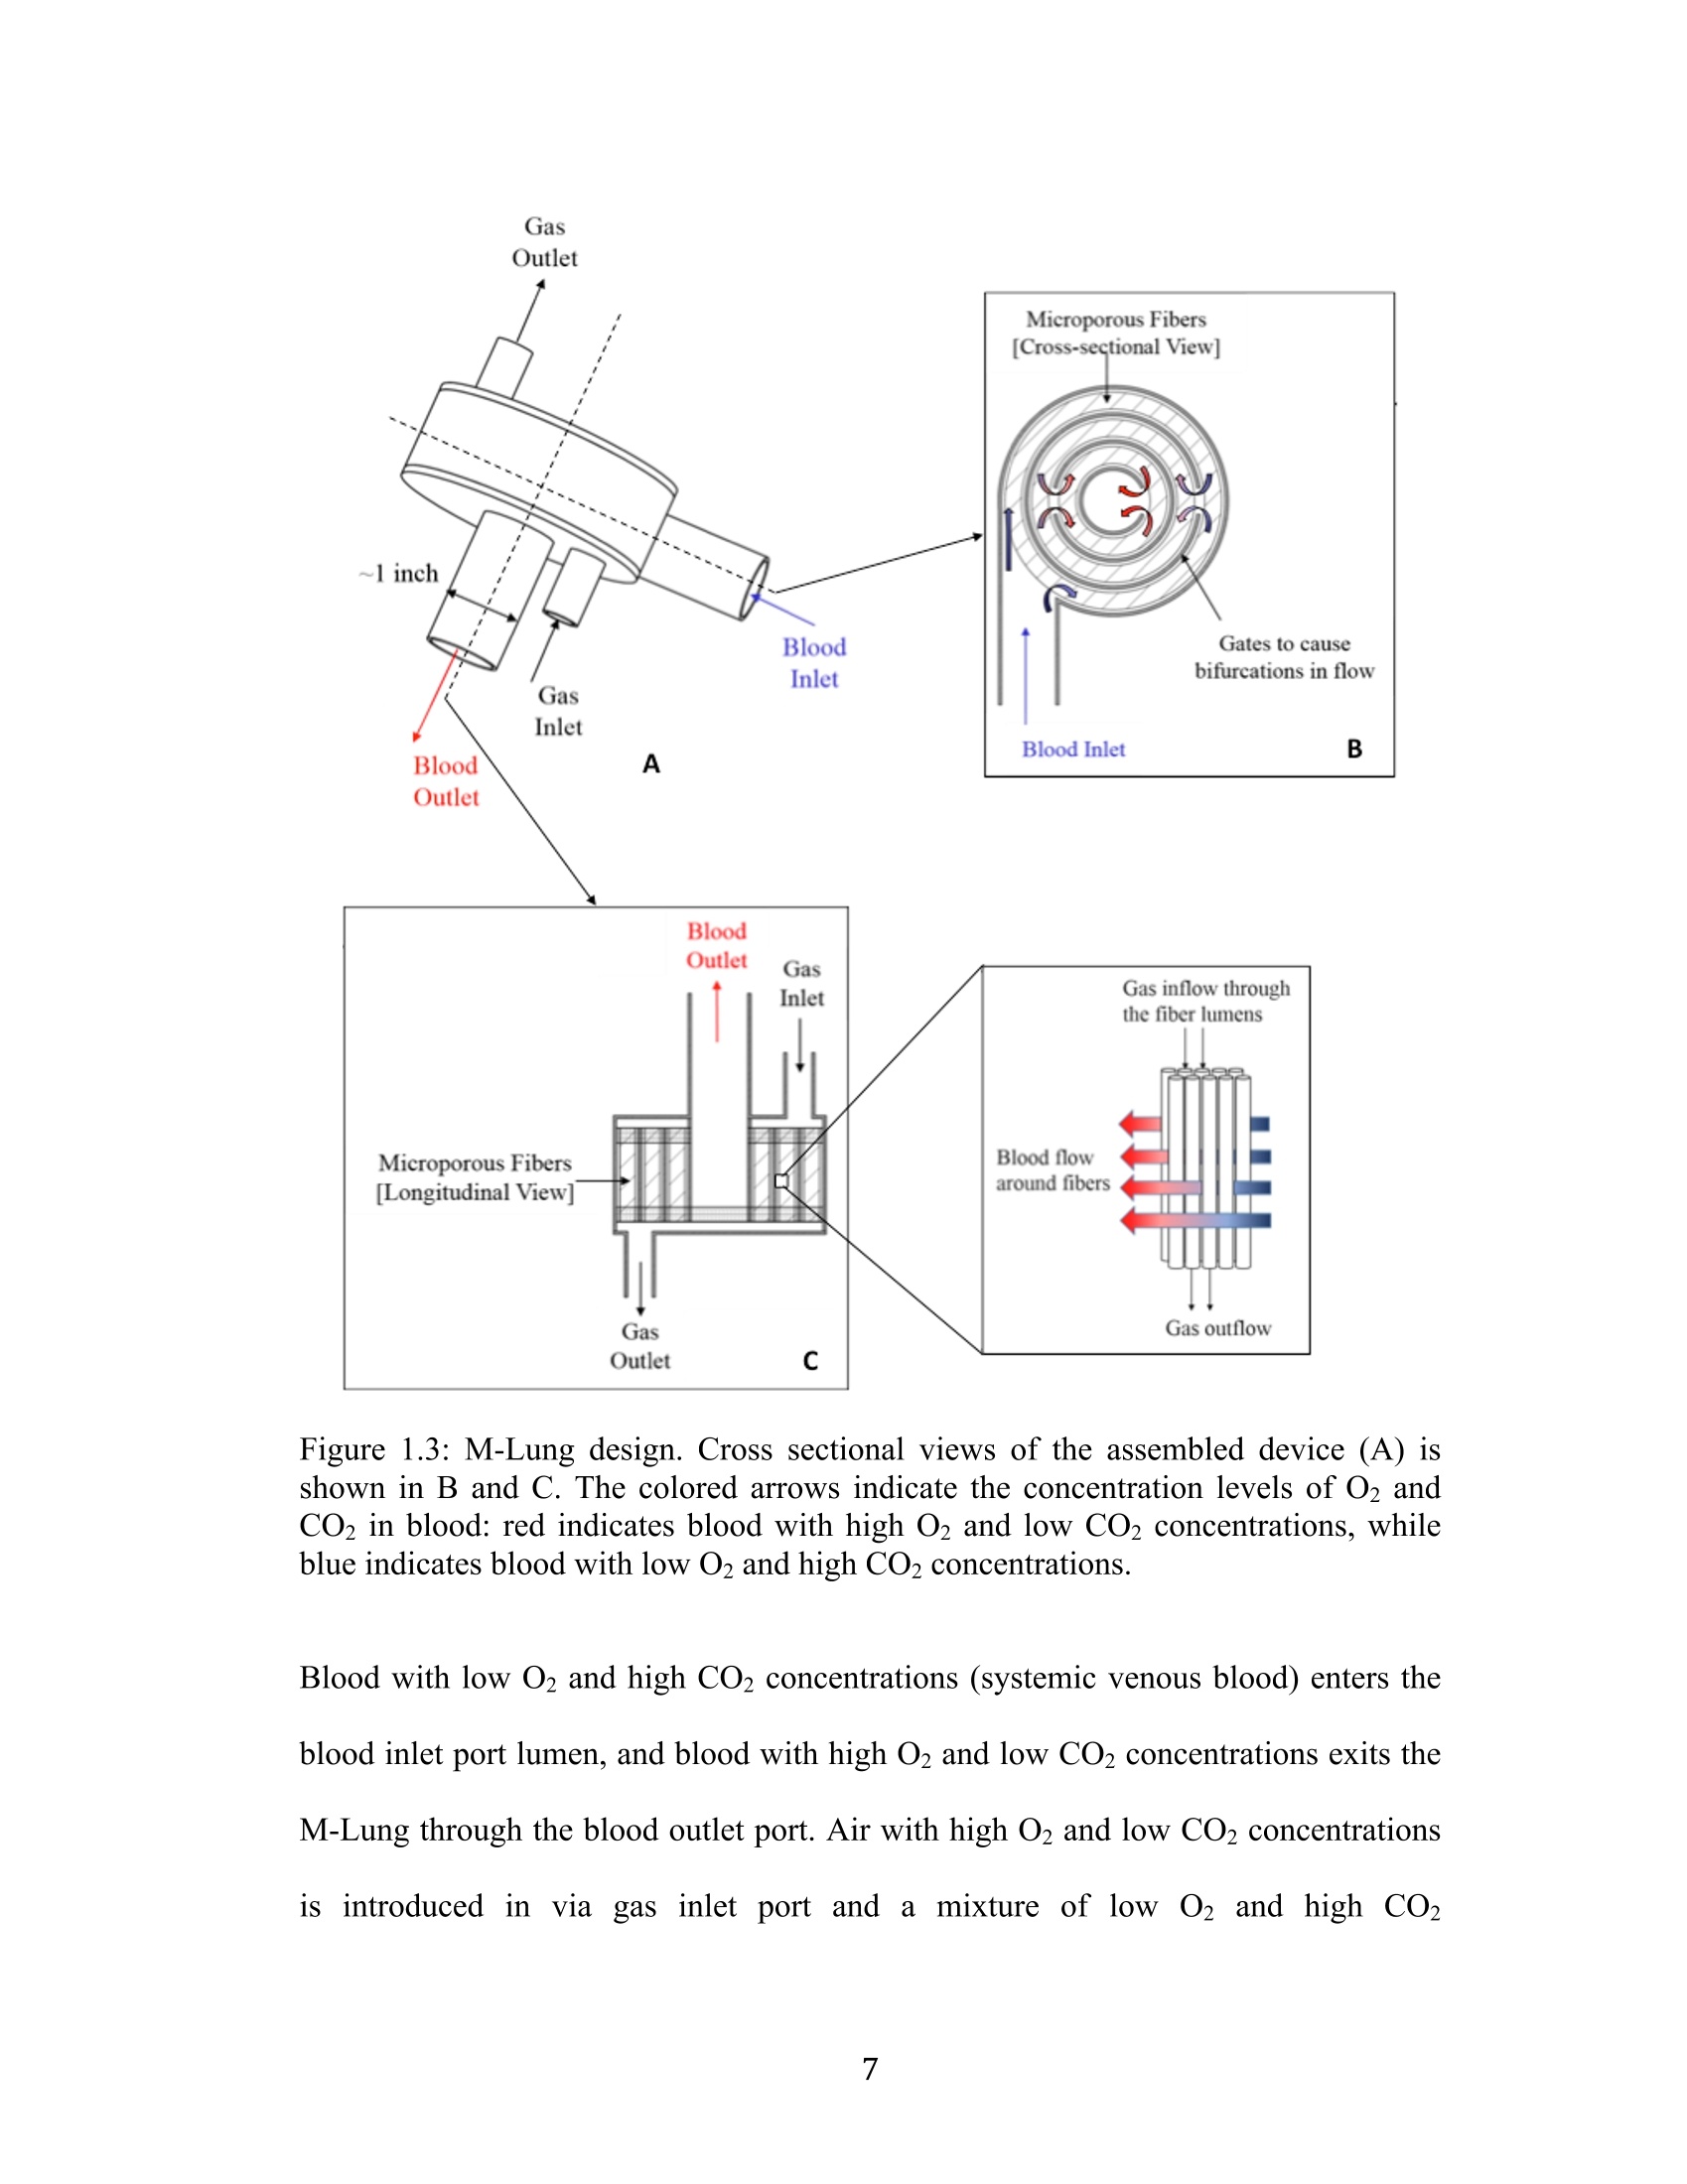
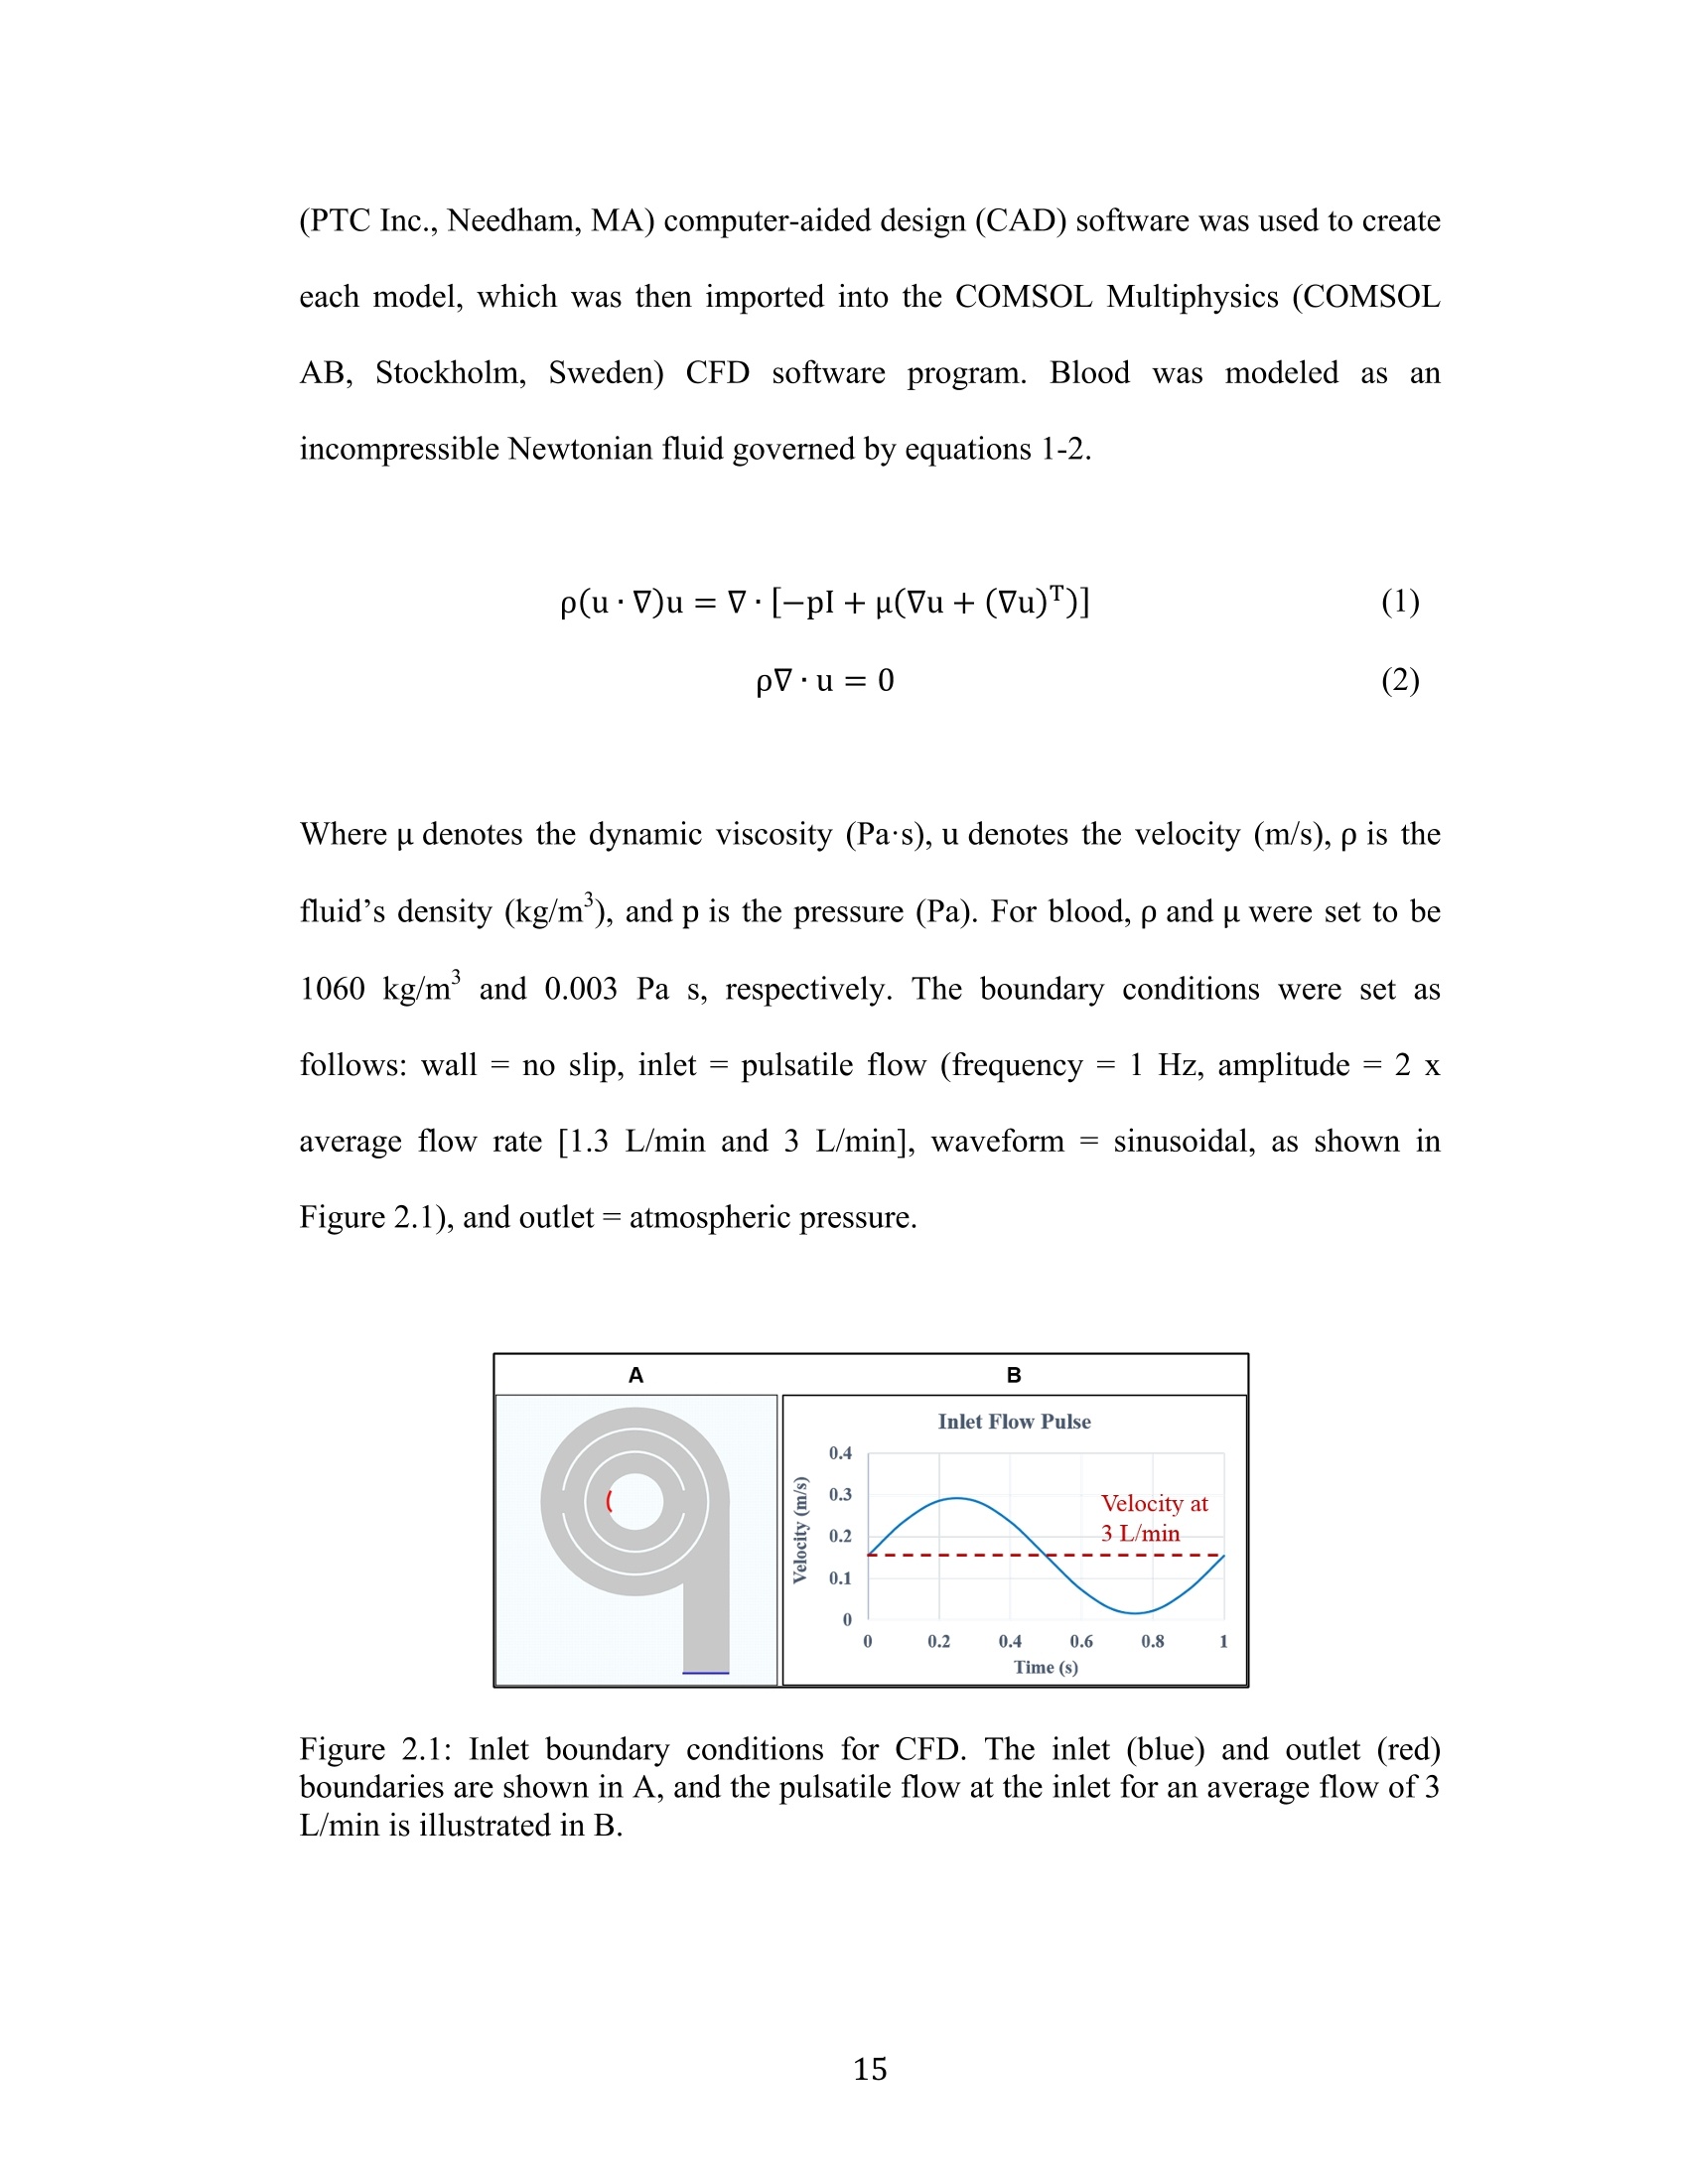
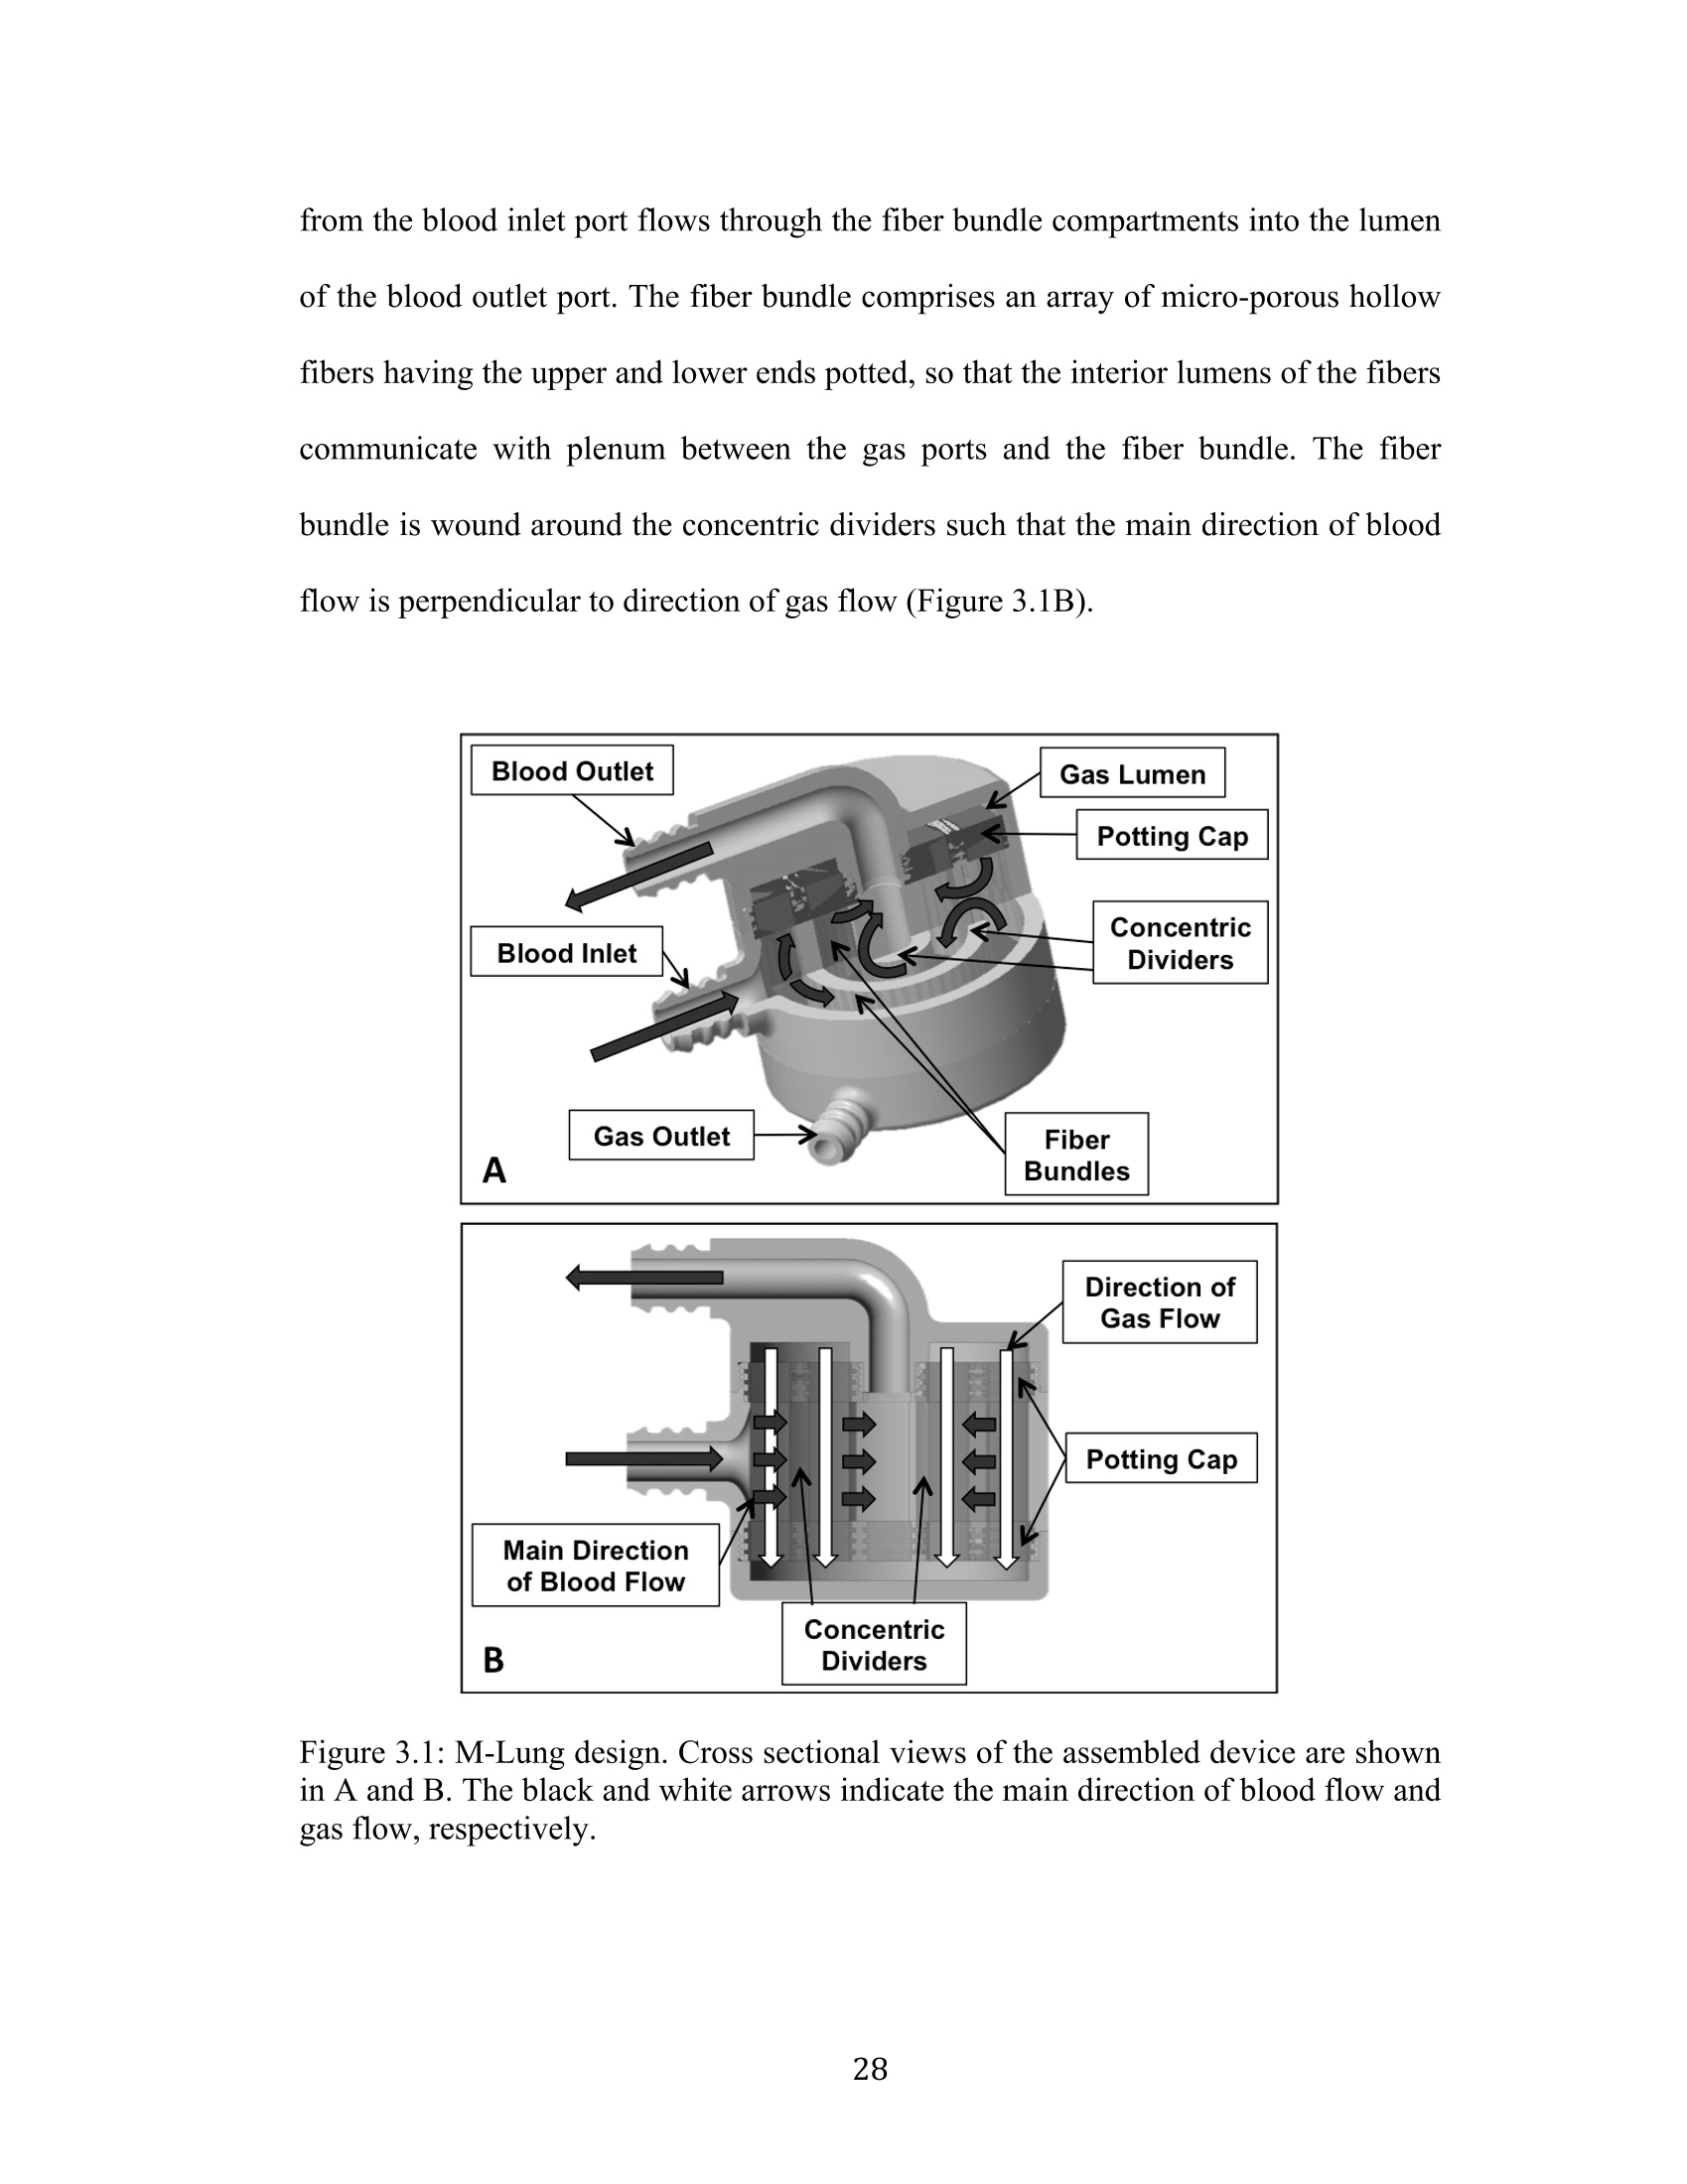
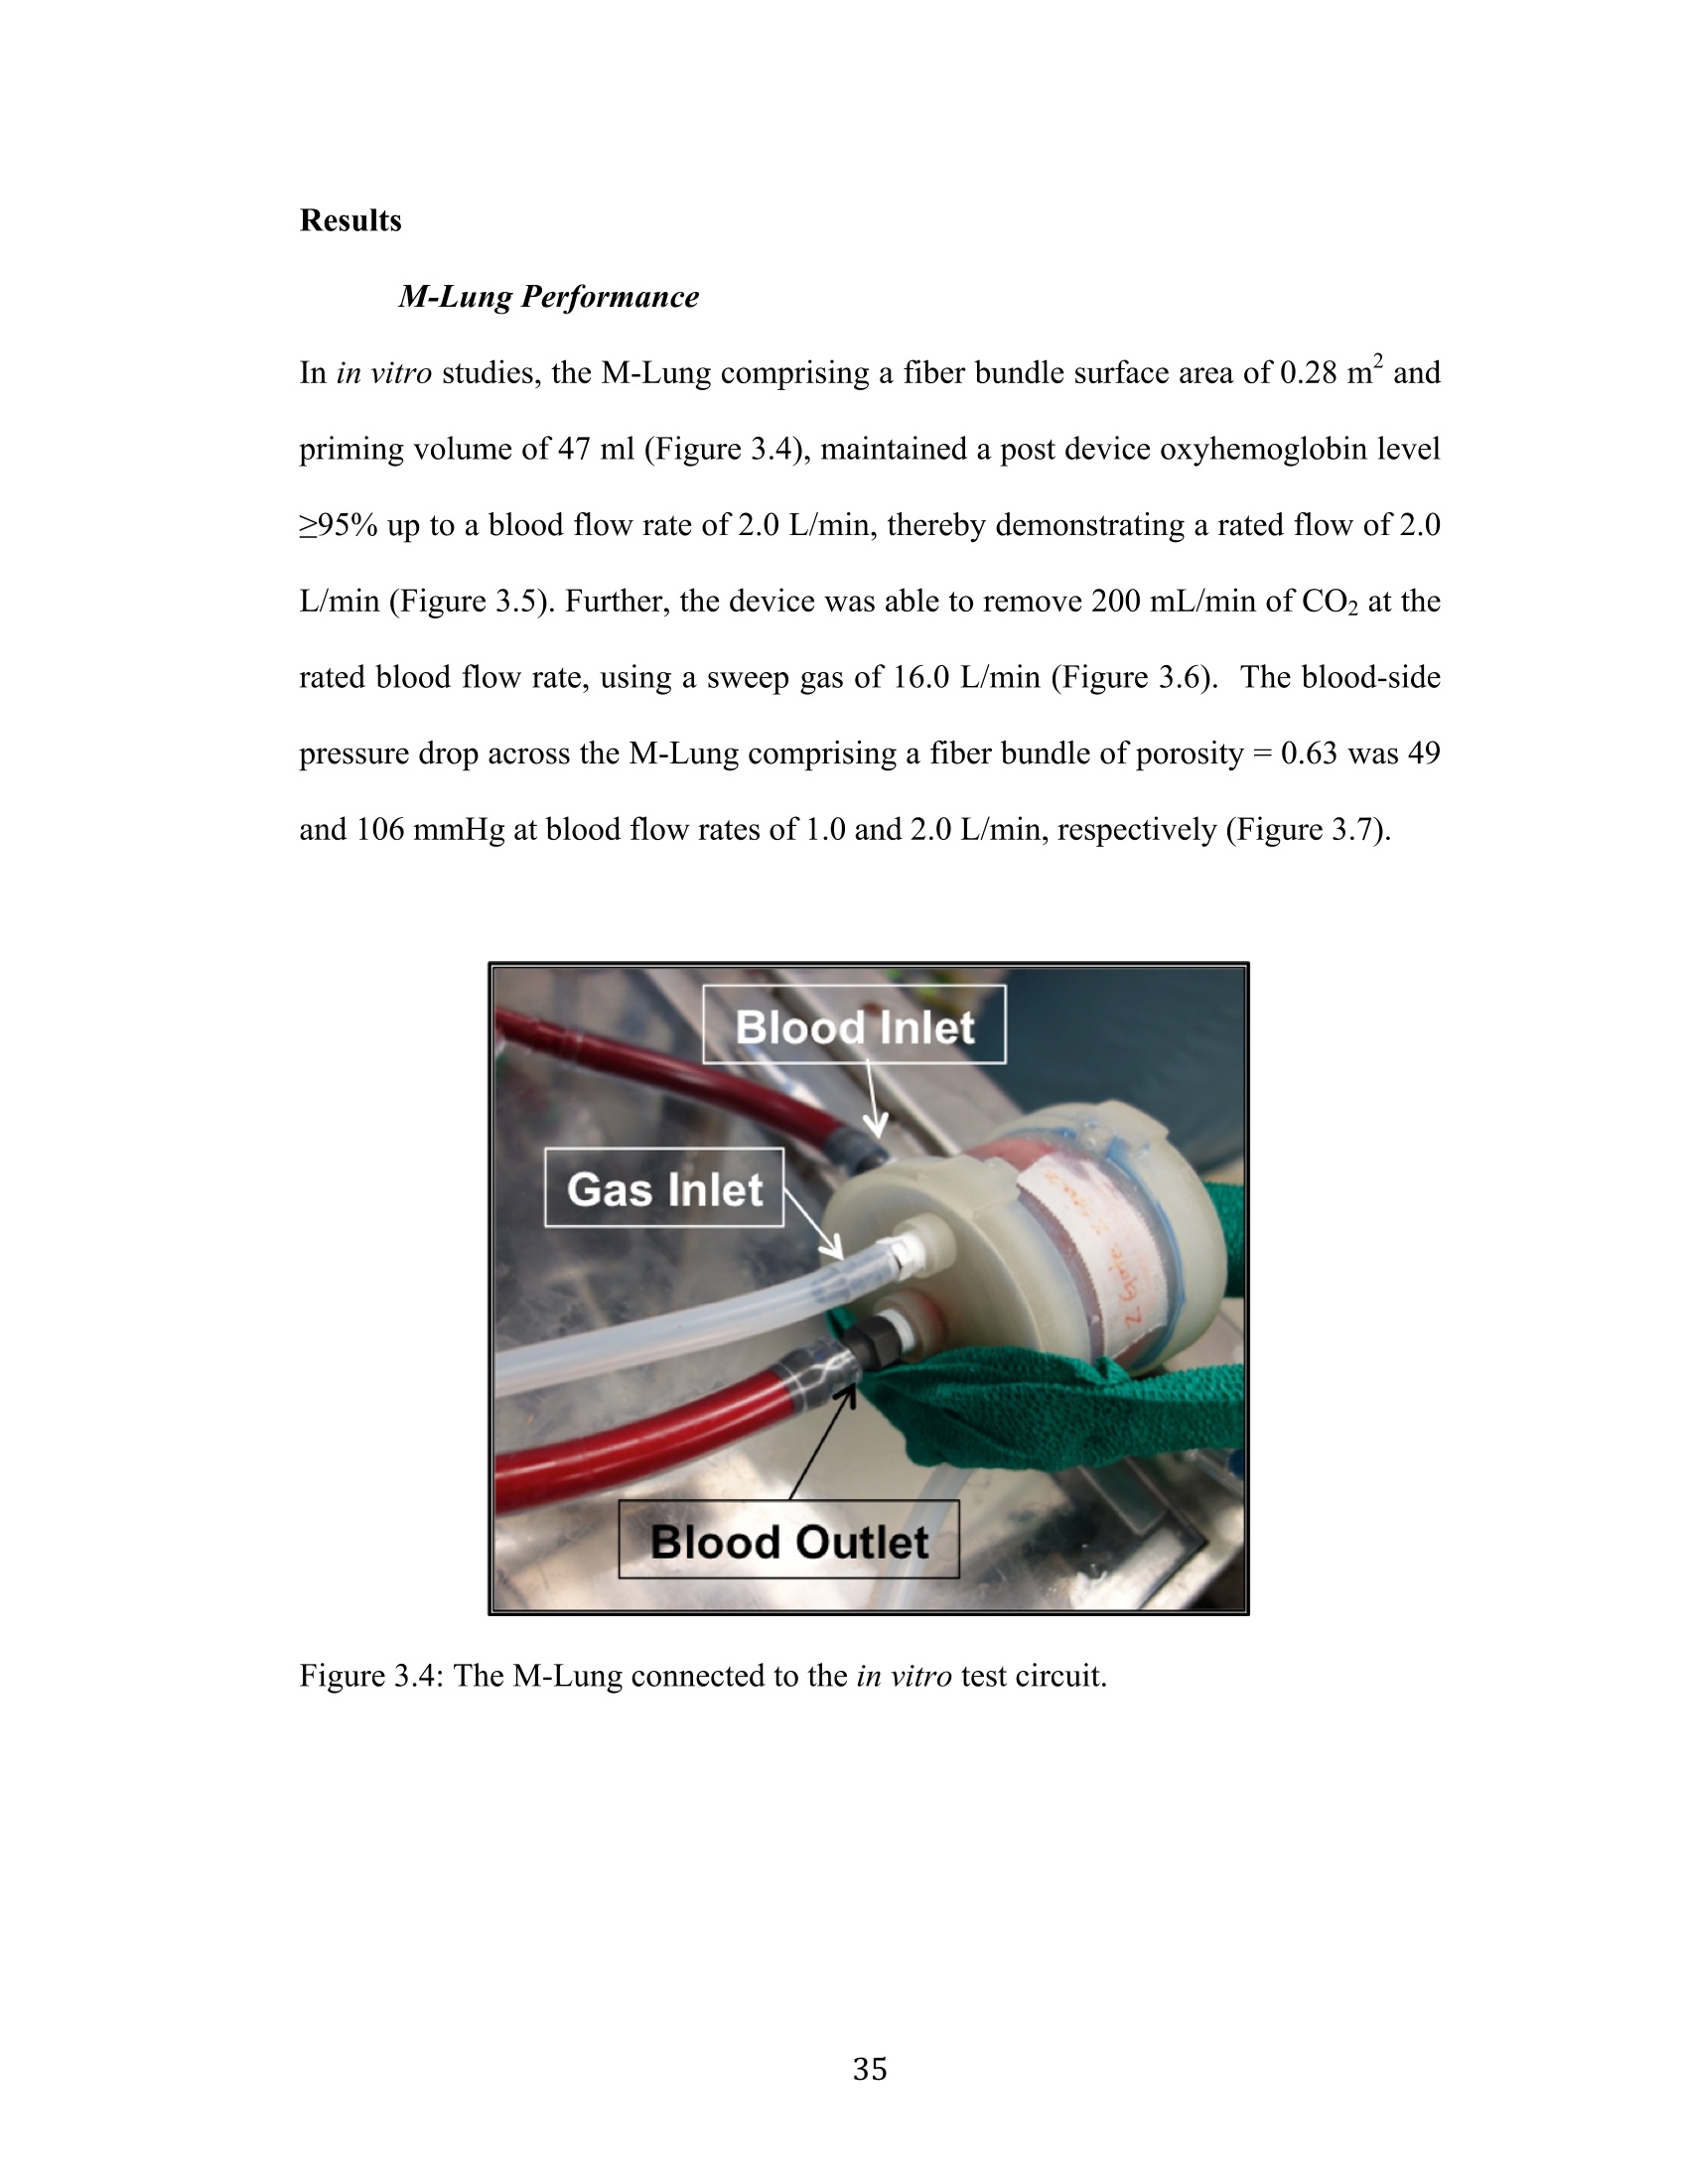
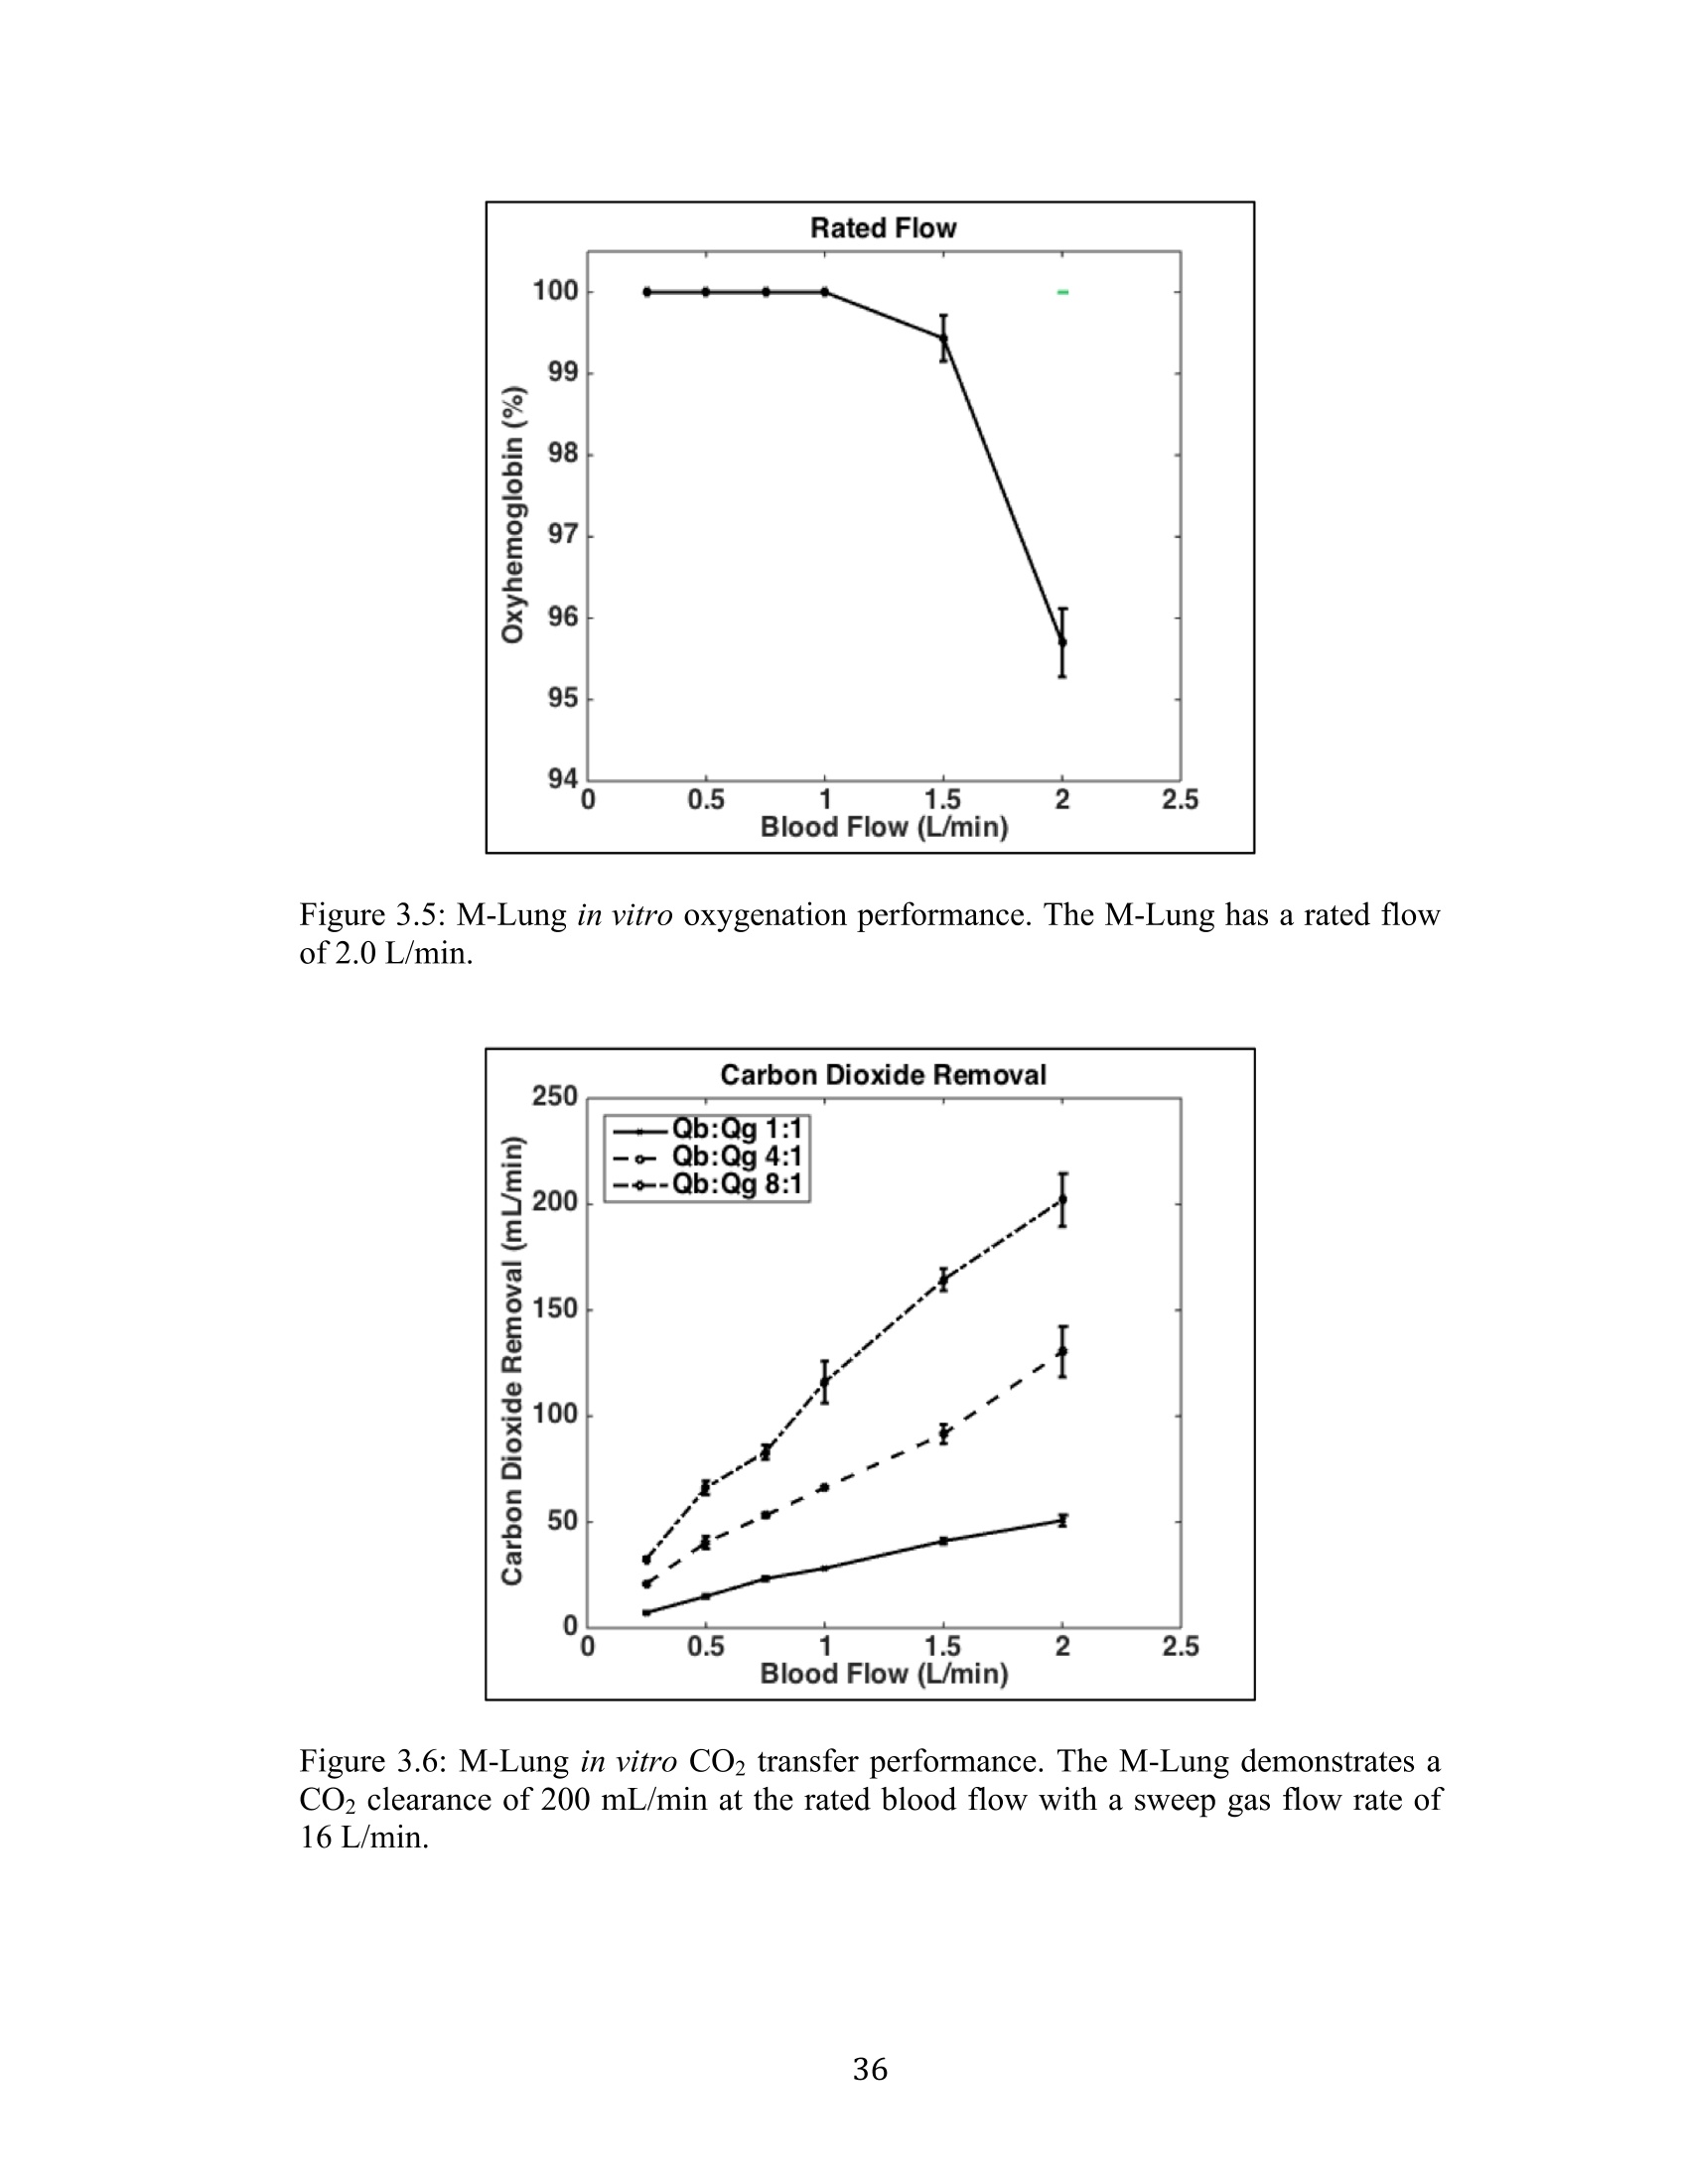
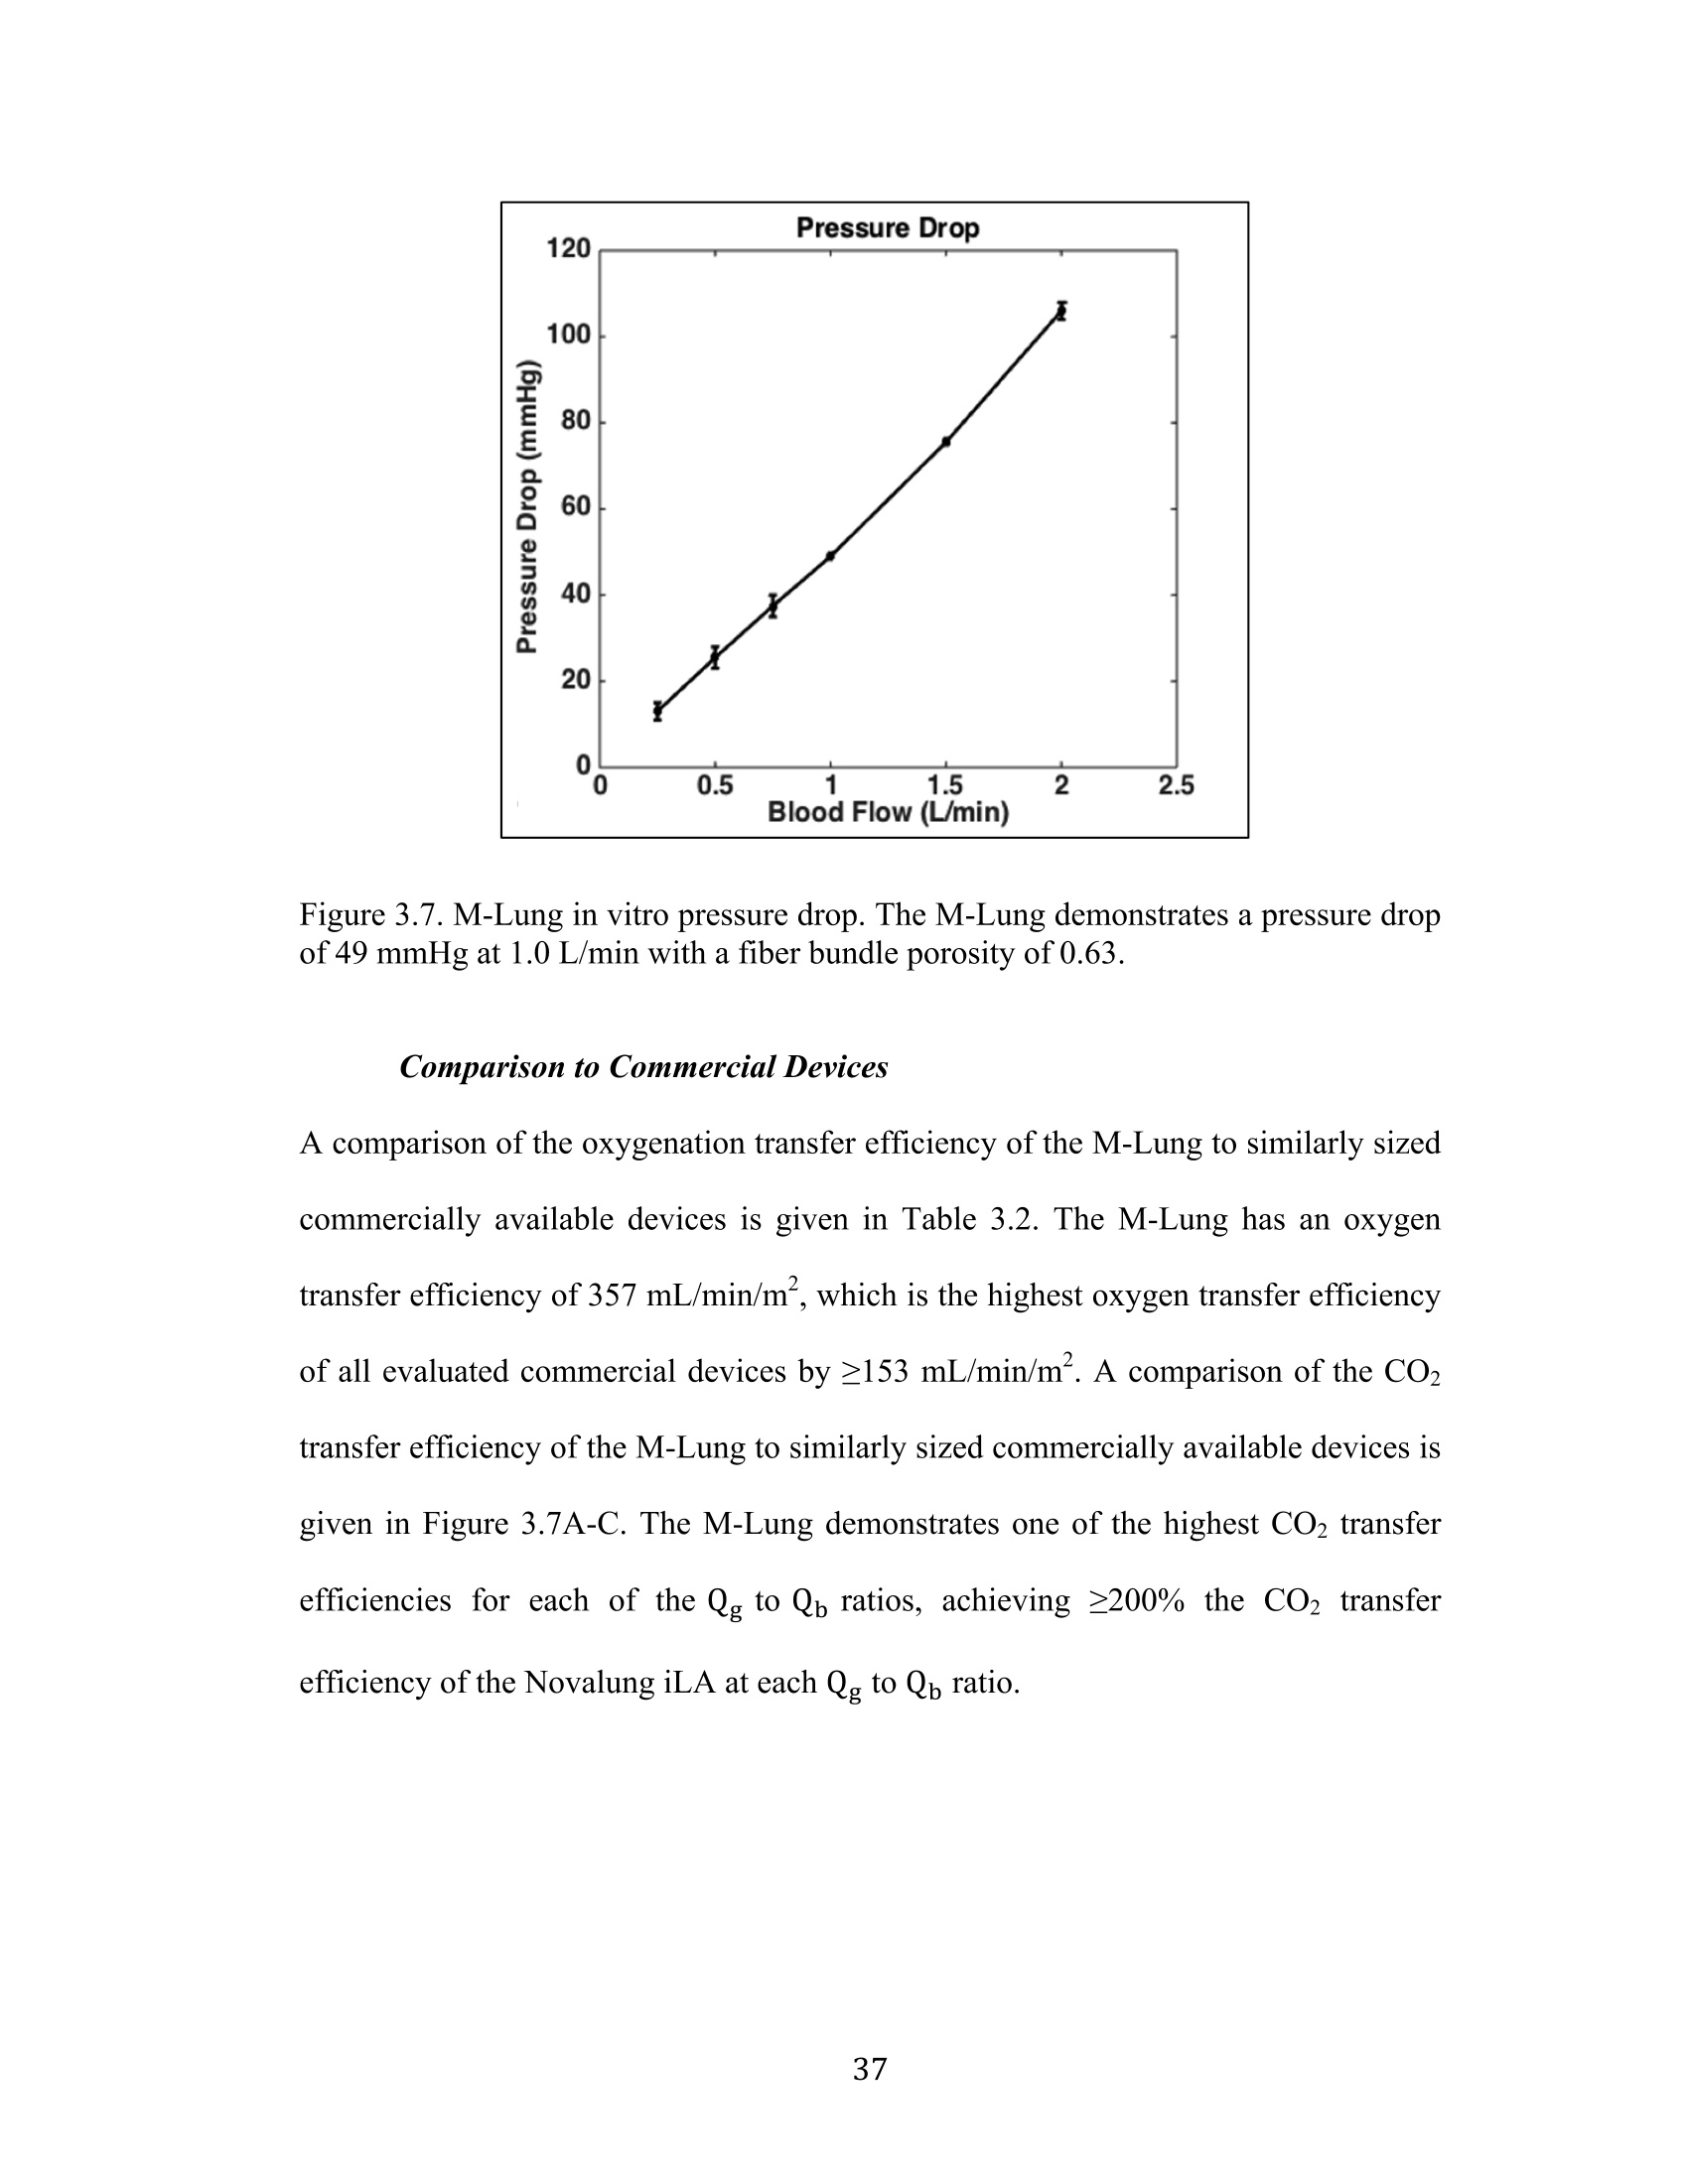
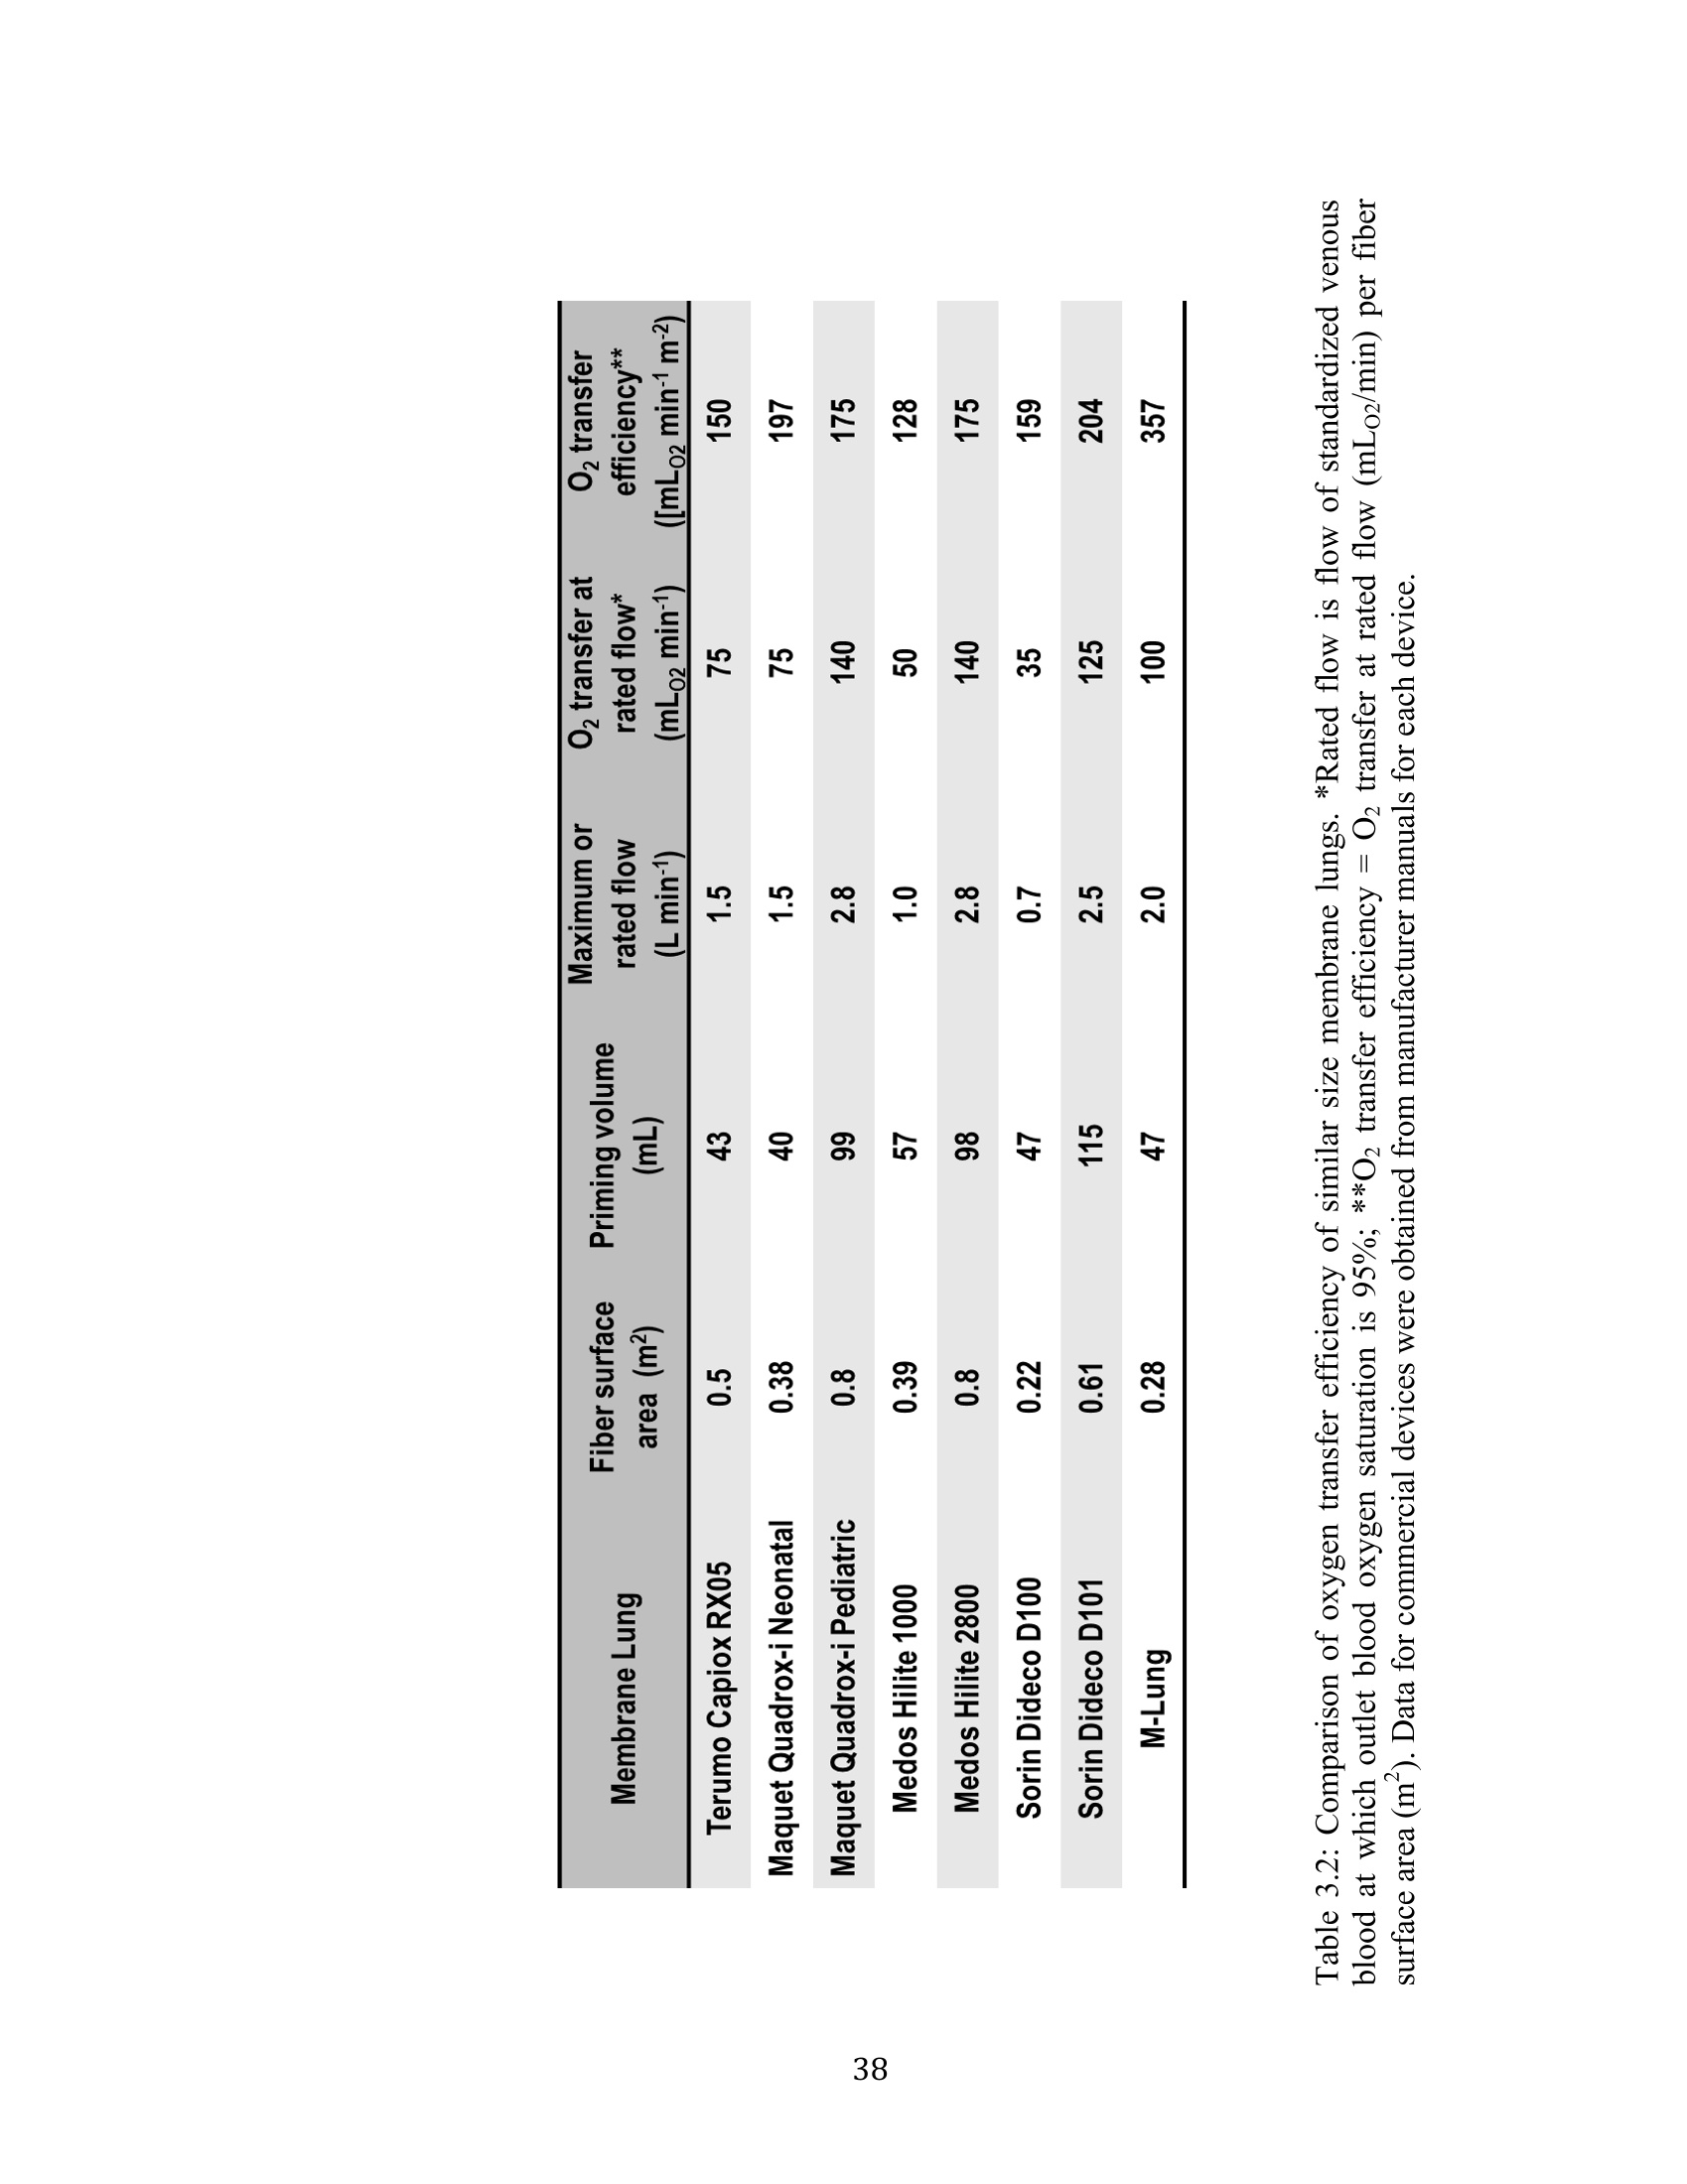
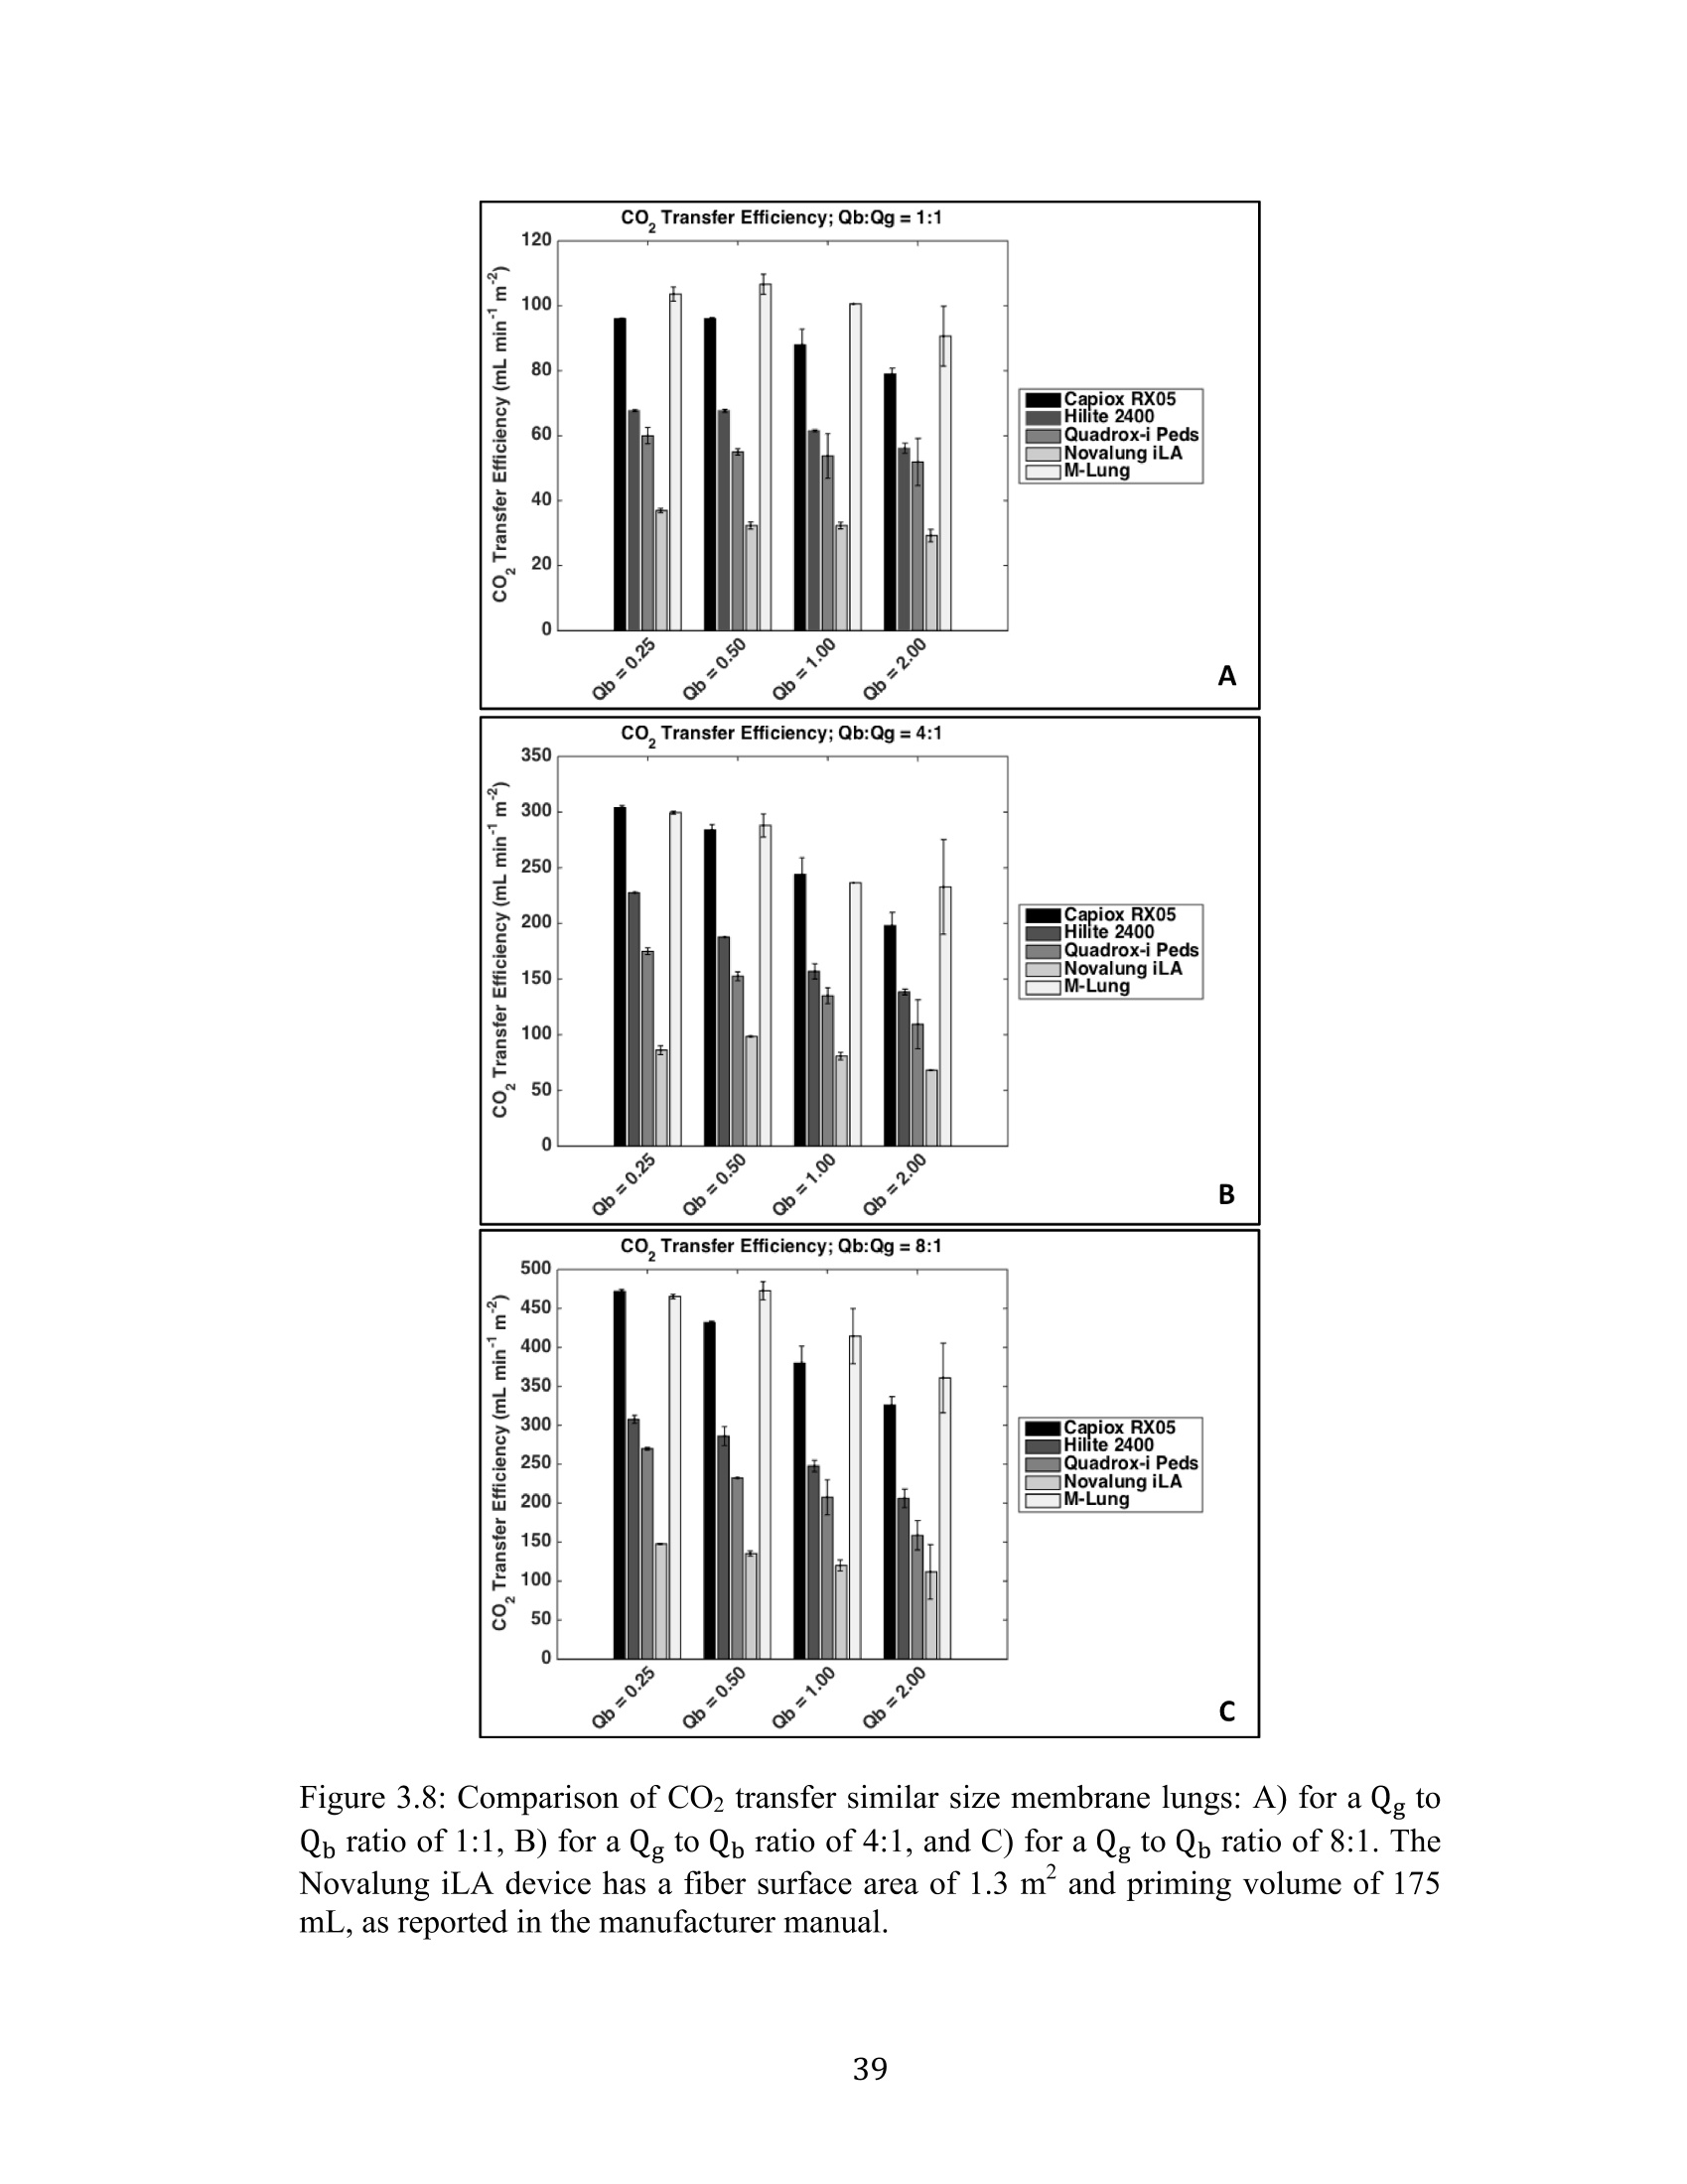
Development Of An Artificial Membrane Lung byUditha Piyumindri Fernando A dissertation submitted in partial fulfillment of the requirements for the degree ofDoctor of Philosophy(Biomedical Engineering) in the University of Michigan 2017 Doctoral Committee: Emeritus Professor Robert H. Bartlett, Co-Chair Professor Joseph L. Bull, Co-Chair Associate Professor William R. Lynch Professor Mark E. Meyerhoff Associate Professor Parag G. Patil ◎ Uditha Piyumindri Fernando 2017 Acknowledgements I would like to thank my committee for all their support and guidance throughout thisprocess; you have each made an invaluable contribution to the progress of this projectand my professional growth. I would especially like to thank my advisors, Dr. Bartlettand Dr. Bull, for their unfailing help, constant encouragement, and amazing foresight,which have been critical to this research as well as my professional life. They havebeen the foundation of my inspiration throughout this project. Thank you-foreverything. I would also like to thank all my mentors and colleagues in the ECLS lab, includingAlvaro, Cindy, Marie, JT, Terry, Dr. Hirschl, Dr. Potkay,Alex, Liz, Nikki, Megan,Joe C, Ben, Jenn, Mere, Hannah, Hayley, Tommy, Fares, Elena, Alice, Jake, and JoeP, as well as my colleagues in the Biotransport lab: John, David, and Robinson-you,along with all other countless PIs, fellows, techs, and students have helped meimmeasurably along the way, for which I am grateful. You have not only played avital role in this research, but also have been my family away from home.To mycolleagues in Aachen: Jutta, Andy, Felix, Peter, Georg, and Lotte-without you, thisresearch would not be where it is today. Not only has your thoughtful help been vitalin overcoming many critical obstacles in building lungs, but also the warm welcomeyou extended during my stay in Aachen has given me fond memories I will carry with me for life. To my undergraduate mentors at Yale, including Dr. Saltzman, Master Laurans, Dr.Batista, as well as my mentors at the Max Planck Institute in Goettingen: Dr. Hell,and Dr. Eggeling: I am forever grateful for the opportunities and guidance youprovided me and thank you for fostering in me academic curiosity. To my dear friend,Eli: thank you for being my constant pillar of support throughout my time in AnnArbor. You continue to inspire me to challenge the status quo in all facets of life. ToChad, who has enriched my life in ways he may not realize: thank you for your love.Your patience, ever-available support, and much-needed calming influence havesustained me in even the most trying times these last few years. Without you, I maynever have finished this dissertation. Most importantly, I would like to thank my family, to whom I owe everything.Ammi, Thathi, and Aiya, your constant love, encouragement, and confidence fromafar has powered me through all my life, and this work is dedicated to you. .Table of Contents Acknowledgements...ii List of Figures.. vi List of Tables.. ..X ABSTRACT. xi Chapter 1: Introduction... Motivations and Objectives... Artificial Membrane Lung Design.... .4 The M-Lung Design... .6 Summary Of The Study.... .8 .References...9 Chapter 2:M-Lung Design... .14 Introduction.... 14 Methods.. ..114 Computational Fluid Dynamics. .14 Particle Image Velocimetry... .18 Results.. 19 .Computational Fluid Dynamics.. l9 Particle Image Velocimetry.··.23 Discussion... .24 References. .26 Chapter 3: M-Lung Design... .27 Introduction.... .27 Methods5... 27 Prototype Fabrication.... .29 In vitro Testing..... .330 Comparison to Commercial Devices.. .33 Results.. .35 M-Lung Performance.. .35 Comparison to Commercial Devices.. .37 Discussion... .40 .References. .42 Chapter 4: Conclusion.. 43 Conclusions.. .43 Future Work.. .45 List of Figures Figure 1.1: Standard extracorporeal membrane oxygenation circuit (taken fromLindstrom SJ, Pellegrino VA, Butt WW. Extracorporeal membrane oxygenation. TheMedical journal of Australia. 2009;191(3):178-82.)..m. .3 Figure 1.2: Diffusion driven gas exchange (A) across the alveolar/capillary wall in thenative human lung and (B) across the fiber membrane in hollow fiber membranelungs... 4 Figure 1.3: M-Lung design. Cross sectional views of the assembled device (A) isshown in (B) and (C). The colored arrows indicate the concentration levels of O2 andCO2 in blood: red indicates blood with high O2 and low CO2 concentrations, whileblue indicates blood with low O2 and high CO2 concentrations... .7 Figure 2.1: Inlet boundary conditions for CFD. The inlet (blue) and outlet (red)boundaries are shown in (A), and the pulsatile flow at the inlet for an average flow of3 L/min is illustrated in (B)... 15 Figure 2.2: Particle image velocimetry setup. The grey arrows indicate the laser path,which originates from the laser source, is shaped into a laser sheet through acylindrical lens, and illuminates a slice of the M-Lung device.. .18 Figure 2.3: Varying number of gates and inlet flow rate. (A) illustrates flow patternsat t=4.75 s for an inlet flow rate of 1.5 L/min (I-III) and 3 L/min (IV-VI), with 3gates (I,IV),4 gates (II,V), and 5 gates (III,VI), and the corresponding velocitystreamlines shown by the yellow lines. (B) shows the corresponding velocity (B1),vorticity (B2), pressure drop (B3), and resistance (B4), averaged across 5 s........ .20 Figure 2.4: Computational flow dynamics for varying gate width. The maximumshear stress (A) and circulation (B) averaged across 5 seconds is shown as a functionof gate opening width; the fiber bundle permeability (k)=2.8em. .21 Figure 2.5: Computational flow patterns for varying fiber bundle permeability. (A)showrss the velocity profiles obtained at t = 4.75 s for varying fiber bundlepermeability (k). The yellow lines denote velocity streamlines. The maximum shearstress (B) and circulation (C) averaged across 5 seconds is shown as a function ofpermeability....· .22 Figure 2.6: Simulated effects of varying fiber bundle permeability on M-Lung on (A)pressure drop for Qb=0.5 L/min, (B) priming volume, and (C) fiber surface area...23 Figure 2.7: Comparison of simulated and experimental flow through the M-Lunghousing. The experimental PIV results (A) demonstrate similar flow patterns to thoseobtained computationally (B)..... 24 Figure 3.1: M-Lung design. Cross sectional views of the assembled device are shownin (A) and(B). The black and white arrows indicate the main direction of blood flowand gas flow, respectively.... .28 Figure 3.2: Manufacturing functional M-Lung prototypes. (A) shows the fiber matwound with the divider in place, while (B) shows the assembled device. A zoomed-inview of the patent potted fibers is given in (C). The blue regions in (B) and (C)indicates the potting material.. .30 Figure 3.3: In vitro test circuit schematic. During the conditioning process, the testdevice is isolated from the circuit using clamps at the points denoted by arrows A1and A2. During the testing process,the blood is directed through the test device aloneand into a separate collection carboy using clamps at points denoted by arrows A2,B1, and B2,thereby comprising a single-pass test circuit.. .31 Figure 3.4: The M-Lung connected to the in vitro test circuit... .35 Figure 3.5: M-Lung in vitro oxygenation performance. The M-Lung has a rated flowof 2.0 L/min.... .36 Figure 3.6: M-Lung in vitro CO2 transfer performance. The M-Lung demonstrates aCO2 clearance of 200 mL/min at the rated blood flow with a sweep gas flow rate of.16 L/min... .36 Figure 3.7. M-Lung in vitro pressure drop. The M-Lung demonstrates a pressure dropof 49 mmHg at 1.0 L/min with a fiber bundle porosity of 0.63. .337 Figure 3.8: Comparison of CO2 transfer efficiency of similar sized membrane lungsfor: A) a Qg to Qb ratio of 1:1, B) a Qg to Qb ratio of 4:1, and C) a Qg to Qb ratio of 8:1. The Novalung iLA device has a fiber surface area of 1.3 m² and priming volumeof 175 mL, as reported in the manufacturer manual.. .339 List of Tables Table 3.1: Blood Target Specifications. 32 Table 3.2: Comparison of oxygen transfer efficiency of similar size membrane lungs.*Rated flow is flow of standardized venous blood at which outlet blood oxygensaturation is 95%; **02 transfer efficiency=O2 transfer at rated flow (mLo2/min) perfiber surfacearea(m)).. Data. for commercialldeviceswereobtainediffrommanufacturer manuals for each device.... .38 ABSTRACT Development Of An Artificial Membrane LungbyUditha Piyumindri Fernando Co-chair: Robert H. Bartlett Co-chair: Joseph L. Bull End-stage lung disease due to chronic obstructive pulmonary disease (COPD) is aleading cause of death across the world. However, treatment options for end-stageCOPD are extremely limited. An artificial membrane lung designed to providepulmonary support, primarily by clearance of CO2, is a promising alternativetreatment for end-stage COPD patients. Current hollow fiber membrane lungs featurea predominantly straight blood path length across the fiber bundle, resulting in limitedoxygen transfer efficiency due to the boundary layer effect. Furthermore, these lungsalso utilize long gas fibers relative to the blood path length, resulting in a limited CO2clearance efficiency due to the build-up of CO2 within the fiber lumens. Using computational fluid dynamics and optical flow visualization methods, a uniquehollow fiber membrane lung was designed and created comprising concentric circularblood flow paths connected by gates, in addition to a short gas path length, referred toas the M-Lung. The M-Lung, comprising a fiber surface area of 0.28 mand primingvolume of 47 mL, has a rated flow of2 L/min and the oxygenation efficiency is 357mL/min/m. The CO2 clearance of the lung is 200 mL/min at the rated blood flow.Given its high gas transfer efficiency, as well as its compact size, low primingvolume, and propensity for minimal thrombogenecity, this lung design has thepotential to be used in a range of acute and chronic respiratory support applications,including providing CO2 clearance and partial oxygenation in adults with end-stageCOPD as well as total respiratory support for infants and small children. Chapter 1 Introduction Motivations and Objectives End-stage lung disease due to chronic obstructive pulmonary disease (COPD) is thethird leading cause of death in the United States, and affects over 12 million adultseach year. In addition, COPD inflicts a significant national economic burden, costing$50 billion in 2010 in direct and indirect costs. coPD is a term that encompassesboth chronic bronchitis and emphysema. These two diseases are characterized byobstruction to airflow that interferes with normal breathing. End-stage COPD, definedas Global Initiative for Chronic Obstructive Lung Disease (GOLD) stage 4: verysevere2), is characterized by progressively worsening CO2 retention and concomitantdyspnea during activities of daily living, and finally even at rest, resulting in aseverely diminished quality of life. Concomitantly, the clinical and economic cost ofCOPD increases with the severity of the disease, with end-stage COPD requiring theby far largest proportion of health-care resources due to excessive hospitalization,exacerbation and mortality rates(3-5). The only currently available curative therapy forend-stage COPD is lung transplantation(6-9). The demand for lungs, however, farexceeds the donor supply, resulting in long wait-times and ineligibility(8-10), in 2011,COPD accounted for over 140,000 deaths, while fewer than 2000 lung transplants were performed in the United States, including transplants for conditions other thanCOPD(11,12). The median wait time for a lung transplant is 4 months, and over 15% ofpatients die while awaiting a transplant . Further, many other patients sufferingfrom COPD may not be eligible for transplantation due to comorbidities or functionalstatus.3. C(urrent alternative treatment options ffor management of COPD2arepharmacological therapy (primarily bronchodilators and corticosteroids), pulmonaryrehabilitation, oxygen therapy, ventilator support, and lung volume reduction surgery(LVRS). However, these have limited efficacy in end-stage COPD(2), do not addressCO retention, do not improve the quality of life(14), or are contraindicated for patientswith severely impaired lung function or comorbidities(15, 16) These limitationshighlight the need for a better alternative treatment option for end-stage COPD thataddresses stabilization of the chronic disease and prevention of acute exacerbation,while allowing the patient to maintain a better quality of life. Extracorporeal support for oxygenation was first proposed in 1972 by Hill et al.,and in 1978, Kolobow et al. demonstrated the feasibility of extracorporeal support forCo2 removal(18). Traditionally, the extracorporeal circuit is comprised of a membraneoxygenator, through which blood is pumped using a mechanical pump, as shown inFigure 1.1 19). While this circuit is effective in both oxygenating and removing CO2and resolving related symptoms, the use of a mechanical pump necessitates a stay inan intensive care unit for the duration of the treatment. In addition to limiting apatient’s activity, this exposes the patients to an increased risk of nosocomialinfections(20,21). Furthermore, the use of extracorporeal membrane oxygenators carries the risk of complications such as thrombosis and hemolysis(22. These risks effectivelylimit the use of traditional extracorporeal support as a long-term therapy for end-stageCOPD patients. Figure 1.1: Standard extracorporeal membrane oxygenation circuit (taken fromLindstrom SJ, Pellegrino VA, Butt WW. Extracorporeal membrane oxygenation. TheMedical journal of Australia.2009;191(3):178-82.) Coupled with recent advances in low-resistance membrane gas exchange devices,recent studies have demonstrated the feasibility of using pumpless extracorporeal CO2removal fortreatmentinini aacuterespiratoryy ddistresssyndrom(eARDS) orexacerbations with acute hypercapnic respiratory failure in COPD patients(23-25)However, these pumpless circuits are still cumbersome and utilize oxygenators that have less than optimally efficient performance, which restricts their potential for useas a long-term, ambulatory treatment in end-stage COPD. The objective of this studywas to design a novel artificial lung that could be perfused by a systemic arterio-venous pressure gradient, to provide pulmonary support, primarily by clearance ofCO2, as a more effective long-term treatment option in end-stage COPD. Artificial Membrane Lung Design In the native lung, the low Pco, and high Po, in the alveolar space relative to adjacentcapillary blood drives the diffusion of oxygen into blood and CO2 out of blood(Figure 1.2A). In normal physiology, these concentration gradients are maintainedthrough the process of breathing, referred to as ventilation, which removes the CO2build up in the alveolar space and reestablishes the gas concentration gradients. Theprocess of exhaling is referred to as ventilation. Analogous to the gas exchange acrossthe alveolar/capillary wall in the native human lung, gas exchange in hollow fibermembrane lungs is driven by the concentration gradient across the fiber membrane,which separates the blood and gas phases (Figure 1.2B). Figure 1.2: Diffusion driven gas exchange: A) across the alveolar/capillary wall in thenative human lung and B) across the fiber membrane in hollow fiber membranelungs. In current hollow fiber membrane lungs, the primary blood path is straight flowdirected across the fiber bundle. Only the red blood cells that are in contact with thegas exchange surface of each fiber are oxygenated; this is known as the diffusionboundary layer effect.(26) Mixing of the flowing blood to disrupt the boundary layer isachieved by the small secondary flows induced as the blood contacts each successivefiber.This results in 100-160 mL oxygen exchange per minute per square meter atrated flow.(28) The rated flow is the flow of standardized venous blood that leaves themembrane lung at 95% oxyhemoglobin saturation. This project investigates thedesign and development of a novel paracorporeal M-Lung from the initial designphase through validation of the device in a large animal model. The induction of secondary flows in a circular chamber, which could decrease thediffusion boundary layer effect, ultimately reaching the diffusion limit of the PDMS(silicone rubber) membrane, was described previously by Bartlett et al. and Drinker eta1.(29-31) Blood was simulated by rapidly moving the membrane surface of the circularchamber against static or slowly flowing blood. A membrane lung using flat sheetPDMS formed into concentric circular chambers connected by gates, which reachedmembrane limitation for oxygen diffusion for PDMS. Secondary flows were createdby mechanical oscillation of the device.The oxygen transfer efficiency was 205mL/min/m² for a 5 mm PDMS membrane. The fabrication problems and noise madethe design impractical for clinical use, but demonstrated that oxygen transferefficiency is based on the extent of secondary flows. Similar secondary flows are generated when blood flows through a static circularchamber with a curved flow path.(32,33) The higher the flow, the more intense thesecondary flow vortices formed. Therefore, we hypothesized that a membrane lungwith concentric circular blood flow paths connected by gates would have highoxygenation efficiency created by secondary flows inherent in the design. The physiological mechanism of CO2 removal is distinct from that of oxygenationand therefore feature distinct optimal design criteria. While oxygenation is limitedprimarily by diffusion, CO2 is limited primarily by ventilation. Hence, a key criterionof a lung designed for optimal CO2 removal should be optimal ventilation. Clinically,CO2 in enhanced by increasing the ventilation flow rate. However, the risk of fatal airemboli poses an upper limit to the ventilation flow rate.. 1A more robust way ofenhancing CO2 ventilationiisby maintaining shortt ga;s fibers.We thereforehypothesized that a membrane lung featuring short fibers (as opposed to fewer longerfibers) would have a high CO2 removal efficiency as a result of minimizing CO2build-up in the gas phase. Based on these hypotheses, we designed a novel membranelung, referred to as the M-Lung. The M-Lung Design The M-Lung design is shown in Figure 1.3. The device has an outer shell comprisinga blood inlet port, blood outlet port, gas inlet port, and gas outlet port (Figure 1.3A"). ( " A full International Patent Application h as been f i led for the M -Lung design on beh a lf of the Regents of the University of Michigan through the University of Michigan T echnology T r ansfer Office by Harness, Dickey & Pierce, P . L.C. T h e in v entors listed a r e R o bert H . Bartlett, J oseph L . B u ll, andUditha Piyumindri Fernando. ) Gas Figure 1.3: M-Lung design. Cross sectional views of the assembled device (A) isshown in B and C. The colored arrows indicate the concentration levels of O2 andCO2 in blood: red indicates blood with high O2 and low CO2 concentrations, whileblue indicates blood with low O2 and high CO2 concentrations. Blood with low O2 and high CO2 concentrations (systemic venous blood) enters theblood inlet port lumen, and blood with high O2 and low CO concentrations exits theM-Lung through the blood outlet port. Air with high O2 and low CO2 concentrationsis introduced in via gas inlet port and a mixture of low O and high CO concentrations exits the M-Lung via gas outlet port lumen, as shown in Figure1.3A,C. As shown in Figure 1.3B, the oxygenator outer shell encloses a fiber bundleand a number of circular dividers radially separating the fiber bundle. Each dividerhas a single gate opening, allowing the blood to flow through the fiber bundlecompartments; the blood from the blood inlet port flows through the fiber bundlecompartments into the lumen of the blood outlet port. The fiber bundle (Figure 1B,C)comprises an array of micro-porous hollow fibers having the upper and lower endspotted, so that the lumens of the fibers communicate with plenum between the gasports and the fiber bundle. The fiber bundle is wound around the innermost dividersuch that the cross section of each fiber is parallel to the cross-sectional plane inFigure 1.3B. Summary Of The Study The goal of this work was to design and build a novel, highly efficient, and compactartificial lung that could be perfused by the heart (via systemic arterio-venouspressure gradient), which had the potential to serve as a more effective long-termtreatment option in end-stage COPD. Computational and experimental methods wereused to develop the lung from the initial design phase through validation of the devicein vitro. First, the design concept is developed and the underlying fluid dynamics isinvestigatedboththeoretically and experimentally.Next,we the functionalperformance of the M-Lung is tested in vitro. Finally, the functional efficiency oftheM-Lung is compared to similarly sized commercial oxygenators. References 1. Guarascio AJ,Ray SM, Finch CK, Self TH. The clinical and economic burdenof chronic obstructive pulmonary disease in the USA. ClinicoEconomics andoutcomes research : CEOR. 2013:5:235-45. 2. Global Strategy For The Diagnosis, Management, And Prevention Of ChronicObstructive Pulmonary Disease. 2014. 3. Chapman KR, Mannino DM,Soriano JB, Vermeire PA, Buist AS, Thun MJ,ett al. Epidemiology and costs of chronic obstructive pulmonary disease. TheEuropean respiratory journal. 2006;27(1):188-207. 4. Budweiser S, Jorres RA, Pfeifer M. Treatment of respiratory failure in COPD.International journal of chronic obstructive pulmonary disease. 2008;3(4):605-18. 5. Ambrosino N, Simonds A. The clinical management in extremely severeCOPD. Respiratory medicine. 2007;101(8):1613-24. 6. Nathan SD. Lung transplantation: disease-specific considerations for referral.Chest. 2005;127(3):1006-16. 7. Lin YC, Brant DO, Bartlett RH, Hirschl RB, Bull JL. Pulsatile flow past acylinderr:: aln eexxperimentalmodelof flowv in an artificialllung.ASAIO.J.2006;52(6):614-23. 8. Patel N, DeCamp M, Criner GJ. Lung transplantation and lung volumereduction surgery versus transplantation in chronic obstructive pulmonary disease.Proceedings of the American Thoracic Society. 2008;5(4):447-53. 9. Mora JI,HadjiliadisD. Lungvolume rreductionsurgery.andlungtransplantation in chronic obstructive pulmonary disease. International Journal ofChronic Obstructive Pulmonary Disease. 2008;3(4):629-35. 10. Janssen DJ, Spruit MA, Does JD, Schols JM, Wouters EF. End-of-life care ina COPD patient awaiting lung transplantation: a case report. BMC Palliative Care.2010;9:6. 11. Hoyert DL, Xu J. Deaths: preliminary data for 2011. National vital statisticsreports : from the Centers for Disease Control and Prevention, National Center forHealth Statistics, National Vital Statistics System. 2012;61(6):1-51. 12. Data. Organ Procurement and Transplantation Network, U.S. Department ofHealth and Human Services Health Resources and Services Administration,2011. 13. Annual Data Report of the US Organ Procurement and TransplantationNetwork (OPTN) and the Scientific Registry of Transplant Recipients (SRTR).Introduction. American journal of transplantation: official journal of the AmericanSociety of Transplantation and the American Society of Transplant Surgeons.2013;13 Suppl 1:8-10. 14. McEvoy RD, Pierce RJ, Hillman D, Esterman A, Ellis EE, Catcheside PG, etal.Nocturnal non-invasive nasal ventilation in stablee hypercapnic COPD:arandomised controlled trial. Thorax. 2009;64(7):561-6. 15. Fishman A, Martinez F, Naunheim K, Piantadosi S, Wise R, Ries A, et al. Arandomized trial comparing lung-volume-reduction surgery with medical therapy forsevere emphysema. The New England Journal of Medicine. 2003;348(21):2059-73. 16. Patients at high risk of death after lung-volume-reduction surgery. The NewEngland journal of medicine. 2001;345(15):1075-83. 17. Hill JD, O'Brien TG, Murray JJ, Dontigny L, Bramson ML, Osborn JJ, et al.Prolonged extracorporeal oxygenation for acute post-traumatic respiratory failure(shock-lung syndrome). Use of the Bramson membrane lung. The New Englandjournal of medicine. 1972;286(12):629-34. 18. Kolobow T, Gattinoni L, Tomlinson T, Pierce JE. An alternative to breathing.The Journal of thoracic and cardiovascular surgery. 1978;75(2):261-6. 19. LindstromSJ,PellegrinoVA.1IButt WW.Extracorporealmembraneoxygenation. The Medical journal of Australia. 2009;191(3):178-82. 20. Witer LH, R.; Trahanas, J.; Bryner, B.; Hoffman, H.; Rojas, A.; Bartlett, R.;Lynch, W.;. Large Animal Model of a Pumpless Arteriovenous Extracorporeal CO2Removal via Subclavian Vessels. 2014:[In Preparation]. 21. Vincent JL, Bihari DJ, Suter PM, Bruining HA, White J, Nicolas-ChanoinMH, et al. The prevalence of nosocomial infection in intensive care units in Europe.Results of the European Prevalence of Infection in Intensive Care (EPIC) Study.EPIC International Advisory Committee. Jama. 1995;274(8):639-44. 22. Zwischenberger JB, Nguyen TT, Upp JR, Jr., Bush PE, Cox CS, Jr., Delosh T,et al. Complications of neonatal extracorporeal membrane oxygenation. Collectiveexperience from the Extracorporeal Life Support Organization. The Journal ofthoracic and cardiovascular surgery. 1994;107(3):838-48; discussion 48-9. 23. Lund LW, Federspiel WJ. Removing extra CO2 in COPD patients. Currentrespiratory care reports. 2013;2:131-8. 24. Cove ME, MacLaren G, Federspiel WJ, Kellum JA. Bench to bedside review:Extracorporeaclarbon dioxide removal, pastpresent and1future. CCrit Care.2012;16(5):232. 25. Hamid IA, Hariharan AS, Shankar NR. The advent of ECMO and pumplessextracorporeal lung assist in ARDS. Journal of emergencies, trauma, and shock.2011;4(2):244-50. 26. Peirce EC, Dibelius NR. Membrane Lung - Studies with a New HighPermeability Co-Polymer Membrane. T Am Soc Art Int Org. 1968;14(Apr):220-&. 27. Zwischenberger JB, Anderson CM, Cook KE, Lick SD, Mockros LF, BartlettRH. Development of an implantable artificial lung: challenges and progress. ASAIOjournal. 2001;47(4):316-20. 28. Stanzel RD, Henderson M. Clinical evaluation of contemporary oxygenators.Perfusion.2016;31(1):15-25. 29. Bartlett RH, Kittredge D,Noyes BS, Willard RH, Drinker PA. Developmentof a Membrane Oxygenator -Overcoming Blood Diffusion Limitation. J ThoracCardiov Sur. 1969;58(6):795-+. 30. Drinker PA, Bartlett RH, Bialer RM, Noyes BS, Jr. Augmentation ofmembrane gas transfer by induced secondary flows. Surgery. 1969;66(4):775-81. 31. Benn JA, Drinker PA, Mikic B, Shults MC, Lacava EJ, Kopf GS, et al.Predictive Correlation of Oxygen and Carbon Dioxide Transfer ina BloodOxygenator with InducedSecondaryFlows.5. T AmnSoc Art Int Org.1971;17(Apr):317-&. 32. Berger SA, Talbot L, Yao LS. Flow in Curved Pipes.Annu Rev Fluid Mech.1983;15:461-512. 33. Nandakumar K, Masliyah JH. Bifurcation in Steady Laminar-Flow throughCurved Tubes. J Fluid Mech. 1982;119(Jun):475-90. Chapter 2M-Lung Design Introduction In Chapter 1, the basis for the M-Lung design is described; it was hypothesized that amembrane lung with concentric circular blood flow paths connected by gates wouldhave high oxygenation efficiency created by secondary flows inherent in the design,while a membrane lung featuring short fibers would have a high CO2 removalefficiency as a result of minimizing CO2 build-up in the gas phase. In this chapter, theflow dynamics within the M-Lung is evaluated using both computational and opticalvisualization methods to understand the effect of design parameters on flow dynamicsand optimize the design of the M-Lung. Methods Computational Fluid Dynamics In order to evaluate and optimize flow patterns through the M-Lung housing, the flowthrough the M-Lung housing was simulated both with and without the fiber bundle,for a variety of models with varying gate widths, numbers of gates, and placements,and inlet flow rates. The following parameters were evaluated:velocity, vorticity,pressure drop, resistance, shear stress, circulation, fiber surface area, and primingvolume. SolidWorks (Dassault Systemes SolidWorks Corp., Concord, MA) and Creo (PTC Inc., Needham, MA) computer-aided design (CAD) software was used to createeach model, which was then imported into the COMSOL Multiphysics (COMSOLAB, Stockholm, Sweden) CFD software program. Blood was nmodeled asanincompressible Newtonian fluid governed by equations 1-2. Where denotes the dynamic viscosity (Pas), u denotes the velocity (m/s), p is thefluid’s density (kg/m’), and p is the pressure (Pa). For blood, pand u were set to beand 0.003 Pa s, respectively. The boundary conditions were set asfollows: wall= no slip, inlet = pulsatile flow (frequency =1 Hz, amplitude =2 xaverage flow rate [1.3 L/min and 3 L/min], waveform = sinusoidal, as shown inFigure 2.1), and outlet = atmospheric pressure. Figure 2.1: Inlet boundary conditions for CFD. The inlet (blue) and outlet (red)boundaries are shown in A, and the pulsatile flow at the inlet for an average flow of 3L/min is illustrated in B. A finite element formulation based on the Galerkin method was used to solve for thegoverning equations. The convergence criterion was set to be a relative tolerance of0.001and 0.01 for stationary and time-dependent solutions, respectively. Thevelocity, vorticity, and pressure of the flow are found directly using the software,while resistance, shear stress, and circulation are calculated as given in Eq. 3-5, wherer denotes resistance (), Q denotes volumetric flow rate (m’/s), t denotes shear stress(Pa), y denotes shear rate (1/s), C denotes circulation, and v denotes vorticity (1/s): In addition, the hollow membrane fiber bundle was incorporated into our model as aporous media, governed by Darcy’s lawwith the Brinkman and Forchheimerextensions, shown in Eq.6-9. (1,2) The Brinkman extension accounts for momentumtransport by macroscopic viscous effects as well as pressure gradients, while theForchheimer extension accounts for the turbulent contribution to the resistance toflow in the porous domain. Where k denotes the permeability of the porous medium (m’), ep is the porosity(dimensionless), and r, the Forchheimer coefficient, is given by Eq. 9, where Cr isthe dimensionless friction coefficient (Eq. 8). The effects; of varying the fiber bundle density were studied by varying thepermeability of the porous medium. The permeability and porosity of the fiber bundleregion is related to the total fiber surface area, Afiber (m), as shown in Eq. 10-12(3-): D-D片 Where dHFM denotes the fiber membrane outer diameter (m), Nfiber is total number offibers, Diand D, are the inner and outer diameter of each fiber bundle, and H is theheight of the fibers. Particle Image Velocimetry In order to verify simulated flow patterns through the M-Lung housing, opticalvisualization of flow patterns through the M-Lung were carried out using particleimage velocimetry (PIV). The experimental setup is shown in Figure 2.2. Figure 2.2: Particle image velocimetry setup. The grey arrows indicate the laser path,which originates from the laser source, is shaped into a. laser sheet through acylindrical lens, and illuminates a slice of the M-Lung device. The M-Lung prototype comprised a poly(methyl methacrelate) (PMMA) housing.De-ionized water was used as the model fluid to represent the blood in theseexperiments, since it provided sufficient optical clarity for the particle velocimetrymeasurements described below. Fluid through the M-Lung was pumped using aperistaltic pump set to flow rates of 1.5 L/min and 3.0 L/min to match the inlet flowrates used in CFD simulations. The water was seeded with neutrally buoyant micro-porous round polyamide seeding particles (diameter = 20 um, density = 1.03 g/m,Dantec Dynamics Co., Skovlunde, Denmark). These particles were illuminated by apulsed Nd-YAG laser light (Model: Solo II 15Hz, No: 16155, wavelength 532 nm,New Wave Inc., Fremont, CA, U.S.) as shown in Figure 3.2. The laser’s beam passed through a cylindrical lens (Modular Focus, f=-6mm, Rodenstock Co., Munich,Germany) and then shaped into a laser light sheet (<1 mm thickness and 100 mm inwidth) that illuminated the area of interest. The images were captured by a CCDcamera (Flowmaster 3S. resolution: 1280x1024 pixels, LaVision Inc., Goettingen,Germany), which was positioned as shown in Figure 2.2. Successive pairs of singleexposed images were then processed employing PIV software (Davis 6.2, LaVisionInc., Goettingen, Germany).Each of the images was divided into small interrogationareas of 32x32 pixels, and was cross-correlated with each other with a 50% overlap.A time sequence of the velocity field was obtained by capturing successive pairs ofimages and repeating the image cross correlations. The experimental velocity fieldimages were then compared with previously obtained computational velocity fieldsthrough the M-Lung housing (without fibers). Results Computational Fluid Dynamics The CFD results, as shown in Figure 2.3, show a well-distributed blood flow profilethrough the device with minimal regions of low blood flow and demonstrate theformation of transient flow vortices through the M-Lung housing. The resulting flowspredict that increasing the flow rate at the inlet increases the mixing, pressure drop,and resistance across the device. Furthermore, increasing the number of gates alsoresults in an increased velocity (since the effective flow path is elongated), mixing,pressure drop, and resistance across the device. 4 Gates 5 Gates B3 B4 Figure 2.3: Varying number of gates and inlet flow rate. (A) illustrates flow patternsat t= 4.75 s for an inlet flow rate of 1.5 L/min (I-III) and 3 L/min (IV-VI), with 3gates (I,IV), 4 gates (II,V), and 5 gates (III,VI), and the corresponding velocitystreamlines shown by the yellow lines. (B) shows the corresponding velocity (B1),vorticity (B2), pressure drop (B3), and resistance (B4), averaged across 5 seconds. Next, the fiber bundle was incorporated into the 3-gate model and varied gate width(the width of each gate is the distance between the edges of the opening arc of divider placed at a given radial distance). The resulting flow dynamics show that increasingthe gate width increases the shear stress (Figure 2.4A) and circulation (Fig. 2.4B)across the device. Figure 2.4: Computational flow dynamics for varying gate width. The maximumshear stress (A) and circulation (B) averaged across 5 seconds is shown as a functionof gate opening width; the fiber bundle permeability (k)=2.8em². Thereafter, we studied the effects of varying permeability of the porous media, whichrelates to the fiber bundle packing density and fiber surface area as given in Eq. 5-7.The resulting flow patterns (Figure 2.5A) show that the vortices formed in the M-Lung housing are dampened by the membrane fiber bundle, with the magnitude ofdampening dependent on the permeability of the membrane fiber bundle (Figure2.5B); decreasing the permeability increases the mixing, shear stress (Figure 2.5B,D),and circulation (Figure 2.5C,D) across the device, while decreasing the shear stressand vorticity at the gates (Figure 2.5D). Figure 2.5: Computational flow patterns for varying fiber bundle permeability. (A)shows the velocity profiles obtained at t= 4.75 s for varying fiber bundlepermeability (k). The yellow lines denote velocity streamlines. The maximum shearstress (B) and circulation (C) averaged across 5 seconds is shown as a function ofpermeability. The permeability of the fiber bundle can be modulated in the fabrication process byvarying the number of fibers/cm and/or the spacing between each layer of fibers. Therelationship between fiber bundle permeability and simulated M-Lung pressure drop,priming volume, and fiber surface area is shown in Figure 2.6A-C. The simulationsdemonstrate that a significant reduction in the pressure drop across the M-Lung couldbe achieved increasing the fiber bundle permeability (Figure 2.6A), at the cost of anincreased priming volume (Figure 2.6B) and reduced fiber surface area (Figure 2.6A). Figure 2.6: Simulated effects of varying fiber bundle permeability on M-Lungpressure drop for Qb=0.5 L/min (A), priming volume (B), and fiber surface area (C). Particle Image Velocimetry A comparison of the flow through the M-Lung obtained using simulations and opticalflow visualization is shown in Figure 2.7. The PIV results demonstrate similar flowpatterns to those obtained computationally; we observe transient vortices formingimmediately both experimentally (Figure 2.7A) and computationally (Figure 2.7B)after the fluid passes through the gate of the concentric divider. Figure 2.7: Comparison of simulated and experimental flow through the M-Lunghousing. The experimental PIV results (A) demonstrate similar flow patterns to thoseobtained computationally (B). Discussion The CFD results show a well-distributed blood flow profile through the M-Lung withminimal regions of low blood flow. The results also demonstrate the formation oftransient flow vortices through the M-Lung housing, suggesting that the gated designpromotes passive secondary flow mixing. Experiemental PIV results demonstrate asimilar vortex pattern to those obtained computationally. While increasing thenumber of gates results in a longer effective blood path and increase in mixing, theresulting increase in resistance poses an upper limit to the number of gates that couldbe supported by systemic arterio-venous perfusion. The mixing within the M-Lung housing is dampened by the membrane fiber bundle,with the magnitude of dampening dependent on the permeability of the membranefiber bundle. The simulations demonstrate that an increase in secondary flow mixing and a significant reduction in the pressure drop across the M-Lung could be achievedby increasing the fiber bundle permeability, at the cost of an increased primingvolume and reduced fiber surface area. The specific pattern of secondary flows generated depends on a variety of factors,including inlet flow rate and pulsatility and specific configuration of dividers andgates. Since the inlet flow rate and pulsatility are dependent on the perfusion system(pump or native circulation) variations of this design will incorporate a variety ofdivider and gate configurations to meet flow requirements. In conclusion, using CFD and optical flow visualization methods, a unique hollowfiber membrane lung with passive secondary flow generation based on concentriccircular blood flow paths connected by gates was designed and optimized. Inprototype testing, flow patterns across the M-Lung matched those predicted by CFD.In the next chapter, a functional prototype of the optimal M-Lung design is builtbased on these simulations, and its performance is evaluated in vitro. References 1. Amiri A, Vafai K. Transient analysis of incompressible flow through a packedbed. Int J Heat Mass Tran. 1998;41(24):4259-79. 2. ErgunS.Fluid FlowthroughPackedi (Columns. ChemEngProg.1952;48(2):89-94. 3. Khanafer K, Cook K, Marafie A. The Role of Porous Media in ModelingFluid Flow within Hollow Fiber Membranes of the Total Artificial Lung. J PorousMedia. 2012;15(2):113-22. 4. Vafai K. Convective Flow and Heat-Transfer in Variable-Porosity Media. JFluid Mech. 1984;147(Oct):233-59. 5 Vafai K. Analysis of the Channeling Effect in Variable Porosity Media. JEnerg Resour-Asme. 1986;108(2):131-9. Chapter 3Membrane Lung Fabrication and Performance Introduction In Chapter 2, the flow dynamics within the M-Lung was evaluated using bothcomputational and optical visualization methods and optimized the design of the M-Lung. In this chapter, functional prototypes of the M-Lung are built based on theoptimized design and evaluated the functional performance of the M-Lung in vitro.The performance of the M-Lung is then compared to similarly sized commercialoxygenators in order to test our hypothesis that the unique M-Lung design comprisinga concentric circular blood path and short gas path relative to blood path results in anincreased efficiency of both oxygenation and CO2 clearance. Methods A schematic of the CFD-optimized M-Lung is shown in Figure 3.1. The device has anouter shell comprising a blood inlet, blood outlet, gas inlet, and gas outlet ports, asshown in Figure 3.1A. This outer shell encloses a fiber bundle separated intocompartments radially by concentric, circular dividers. Each divider has agateopening, allowing the blood to flow through the fiber bundle compartments; the blood from the blood inlet port flows through the fiber bundle compartments into the lumenof the blood outlet port. The fiber bundle comprises an array of micro-porous hollowfibers having the upper and lower ends potted, so that the interior lumens of the fiberscommunicate with plenum between the gas ports and the fiber bundle. The fiberbundle is wound around the concentric dividers such that the main direction of bloodflow is perpendicular to direction of gas flow (Figure 3.1B). Figure 3.1: M-Lung design. Cross sectional views of the assembled device are shownin A and B. The black and white arrows indicate the main direction of blood flow andgas flow, respectively. The specifications for the lung design were as follows: a rated flow 1 L/min, oxygentransfer at rated flow ≥50 mL/min, pressure drop at rated flow of 60 mmHg, and CO2clearance that is four times oxygen transfer. The specifications were chosen based oncharacteristics of existing commercial pediatric size membrane lungs for directcomparison among devices. Furthermore, a membrane lung with these specificationswould provide total gas exchange for a 10 kg child and total systemic CO2 removalfor an adult. The following parameters were evaluated: rated flow, surface area,oxygen transfer efficiency, priming volume, pressure drop, and CO2 clearance. Prototype Fabrication In order to evaluate the blood gas-exchange performance of the M-Lung, functionalprototypes, shown in Figure 3.2, were fabricated as follows: The M-Lung housingwas manufactured using stereolithography (Objet Eden 350v, material: photopolymer“Full Cure 720), and the fiber bundle comprised a cross-wound mat (Figure 3.2A) ofhollow micro-porous ppolypropylene (PP) membrane fibers (Membrana GmbH,Wuppertal, Germany) with 17 fibers/cm, resulting in a fiber bundle porosity of 0.63,fiber surface area of 0.28 m , fiber length of 2 cm, and priming volume of 47 mL. Anin-house built centrifuge was used for potting each end of the M-Lung; the M-Lunghousing, with with the wound fiber bundles and gates in place, were centrifuged at aspeed of 800 RPM and temperature of 50c for 1 hour, following which the potteddevicesVwere allowed to cure at50℃ for 24I urs. As potting material, abiocompatible, addition-curing silicone rubber (Wacker Chemie AG, Munich,Germany) was utilized, as shown in Figure 3.2B, C. Figure 3.2: Manufacturing functional M-Lung prototypes. (A) shows the fiber matwound with the divider in place, while (B) shows the assembled device. A zoomed-inview of the patent potted fibers is given in (C). The blue regions in (B) and (C)indicates the potting material. In vitro Testing The functional performance of the M-Lung was evaluated in vitro in accordance withthe) Foodand1LDrugAdministratioin Guidance for Cardiopulmonary BypassOxygenators 510(k) guidelines using a test circuit as shown in Figure 3.3. Freshbovine blood was anti-coagulated with heparin to obtain an activated clotting time(ACT)> 480 s and filtered through a 70-120 um screen filter into a clean carboy.The circuit was primed and de-aired using a 0.9% sodium chloride (saline) solution,which was displaced by filtered blood from the filtration reservoir. The circuit totalhemoglobin was measured and adjusted with saline solution to 12±1 g/dL. Gas linesfrom the three gas flow controllers (O2, N2, and CO2) were connected to theconditioning device (Novalung iLA, Xenios AG, Heilbronn, Germany), and theoverall gas mixture was controlled by controlling the flow rate of these individualgases during the conditioning process. A flow probe (Transonic, Ithaca,NY) wasused to monitor and control the blood flow rate through the circuit, while pressure transducers were connected to the blood inlet and blood outlet sites of the test deviceto monitor the pressure drop across the M-Lung. A heat exchanger connected to thecircuit was used to warm circuit blood to 37±1℃. The blood was pumped andrecirculated through the conditioning device until the blood pool reached venousconditions, as outlined in Table 3.1. The conditioned blood flow was then directed tothe test device alone, and the outflow of the test device was directed to the secondcarboy, comprising a single pass test. The test device was ventilated using a sweepgas comprised of 100% 02. Figure 3.3: In vitro test circuit schematic. During the conditioning process, the testdevice is isolated from the circuit using clamps at the points denoted by arrows A1and A2. During the testing process, the blood is directed through the test device aloneand into a separate collection carboy using clamps at points denoted by arrows A2,B1, and B2, thereby comprising a single-pass test circuit. Parameter Units Target Value Hemoglobin g/dl 12±1 02 Saturation % 65±5 pCO2 mmHg 45±5 Base Excess mmol/L 0±5 pH 7.4±0.1 Glucose mg/dl 100-300 Activated Clotting Time seconds >480 Temperature °C 37±2 Table 3.1: Blood Target Specifications The performance of the M-Lung was evaluated over a range of inlet blood flow rate(Qb) and sweep gas flow rates (Qg). For each combination of Qb and Qg, a blood inlet,blood outlet, and gas outlet sample were obtained, and the inlet and outlet bloodpressures were recorded. Between test intervals, the test device was flushed with100% O2 to prevent water condensation in the gas phase compartment of the testdevice. All samples were analyzed using a blood gas analyzer (ABL 800 Flex,Radiometer, Copenhagen, Denmark). The rated was determinedaasitthemaximum flow at which the test device outlet hemoglobin O2 saturation was ≥95%.The O2 transfer rate (VO2, mL/min) at rated flow was calculated as shown in Eq. 13-15(2,3). Where Coxy = O2 concentrationinb1lood(mLo2 Lblood ), tHb = hemoglobinconcentration (g dL"),%SAT=hemoglobin O2 saturation (%), Qb= blood flow rate(L/min); Coxy-post= post-oxygenator Oz concentration (mLo2 Lblood ), and Coxy-prepre-oxygenator O2 concentration (mL02 Lblood ). The CO2 transfer rate (VCO2,mL/min) was calculated as given in Eq. 16: Where AC02=% CO2 in the outlet gas sample and Qg=sweep gas flow rate (L/min).The error bars denote the standard error of mean for each measurement. Comparison to Commercial Devices In order to compare the oxygen transfer efficiency of the M-Lung to similarly sizedcomm al devices, the following commercially available c were used:Capiox RX05 (Terumo Corporation, Tokyo, Japan), Maquet Quadrox-i Neonatal(Gettinge Group, Rastatt, Germany), Maquet Quadrox-i Pediatric (Gettinge Group,Rastatt, Germany), Medos Hilite 1000 (Xenios AG, Heilbronn, Germany), MedosHilite 2800 (Xenios AG, Heilbronn, Germany), Dideco D100 (Sorin Group, Milan,Italy), and Dideco D101 (Sorin Group, Milan, Italy). We obtained the maximum orrated flow (Qrated) and fiber surface area (Afiber) from the manufacturer manual foreach of the commercial devices. The O2 transfer at rated flow (VOz-rated) in mL/min was calculated using Equations 13 and 14, and the subsequent O2 transfer efficiency(Eo2) in mL/min/m’ was calculated as given in Equation 17 for each device,including the M-Lung. CO2removal.isdependent on the Qg to Qb ratio. However, differentmanufacturers report CO2 removal data for varying Qg to Qb ratios. In order toobtain comparable CO2 removal data and thereby compare the CO2 transferefficiency of the M-Lung to similarly sized commercial devices, the CO2removal of each of the following commercially available devices was tested invitro using the same methods as described in the previous section for the M-Lung: Capiox RX05 (Terumo Corporation, Tokyo, Japan), Medos Hilite 2800(Xenios AG, Heilbronn, Germany), Maquet Quadrox-i Pediatric (GettingeGroup, Rastatt, Germany), and Novalung iLA (Xenios AG, Heilbronn,Germany). The CO transfer efficiency (Eco2) for each device, including theM-Lung, was calculated for each Qg to Qb ratio as given in Equation 18. Results M-Lung Performance In in vitro studies, the M-Lung comprising a fiber bundle surface area of 0.28 m andpriming volume of 47 ml (Figure 3.4), maintained a post device oxyhemoglobin level295% up to a blood flow rate of 2.0 L/min, thereby demonstrating a rated flow of 2.0L/min (Figure 3.5). Further, the device was able to remove 200 mL/min of CO2 at therated blood flow rate, using a sweep gas of 16.0 L/min (Figure 3.6). The blood-sidepressure drop across the M-Lung comprising a fiber bundle of porosity= 0.63 was 49and 106 mmHg at blood flow rates of 1.0 and 2.0 L/min, respectively (Figure 3.7). Figure 3.4: The M-Lung connected to the in vitro test circuit. Rated Flow 100 9998E9796 95 94 0 0.5 1 1.5 2 2.5 Blood Flow (L/min) Figure 3.5: M-Lung in vitro oxygenation performance. The M-Lung has a rated flowof 2.0L/min. Figure 3.6: M-Lung in vitro CO2 transfer performance. The M-Lung demonstrates aCO2 clearance of 200 mL/min at the rated blood flow with a sweep gas flow rate of16 L/min. Figure 3.7. M-Lung in vitro pressure drop. The M-Lung demonstrates a pressure dropof 49 mmHg at 1.0 L/min with a fiber bundle porosity of 0.63. Comparison to Commercial Devices A comparison of the oxygenation transfer efficiency of the M-Lung to similarly sizedcommercially available devices is given in Table 3.2. The M-Lung has an oxygentransfer efficiency of 357 mL/min/m, which is the highest oxygen transfer efficiencyof all evaluated commercial devices by 153 mL/min/m. A comparison of the COtransfer efficiency of the M-Lung to similarly sized commercially available devices isgiven in Figure 3.7A-C. The M-Lung demonstrates one of the highest CO2 transferefficiencies for each of the Qg to Qb ratios, achieving ≥200% the CO transferefficiency of the Novalung iLA at each Qg to Qb ratio. Membrane Lung Fiber surface Priming volume Maximum or 02 transfer at 02 transfer rated flow rated flow* efficiency** area (m²) (mL) (L min-1) (mLo2 min-1) ([mL02 min1m2) Terumo Capiox RX05 0.5 43 1.5 75 150 Maquet Quadrox-i Neonatal 0.38 40 1.5 75 197 Maquet Quadrox-i Pediatric 0.8 99 2.8 140 175 Medos Hilite 1000 0.39 57 1.0 50 128 Medos Hilite 2800 0.8 98 2.8 140 175 Sorin Dideco D100 0.22 47 0.7 35 159 Sorin Dideco D101 0.61 115 2.5 125 204 M-Lung 0.28 47 2.0 100 357 ( Table 3.2: Comparison of oxygen transfer efficiency of similar size membrane lungs. *Rated f l ow is flow o f s t andardized venousblood at which outlet blood oxygen saturation is 9 5 %; **02 tra n sfer efficiency=02 transfer at rated flow(mLo2/ m in) per fibersurface area(m). Data for commercial devices were obtained from manufacturer manuals for each device. ) Figure 3.8: Comparison of CO2 transfer similar size membrane lungs: A) for a Qg toQb ratio of 1:1,B) for a Qg to Qb ratio of 4:1, and C) for a Qgto Qb ratio of 8:1. TheNovalung iLA device has a fiber surface area of 1.3 m’and priming volume of 175mL, as reported in the manufacturer manual. Discussion The key to maximize oxygen transfer per surface area in membrane lungs is mixing,and thereby disrupting the diffusion boundary layer, through an increase in vorticityand secondary flows.) Flow through circular paths will induce secondary flows tocreate mixing, yet a long circular spiral has high resistance. Concentric circlesconnected by gates created secondary flows without increasing resistance. The effectof the mixing is shown in Table 2. The oxygen transfer efficiency (mLo2/m’min’) ofthe M-Lung prototype is 357 mL02/m’ min. The oxygen transfer efficiency ofsimilar devices with predominantly straight flow path is 128-204 mLo2/m²min. In vitro studies demonstrate highly efficient gas exchange within the M-Lung: thedevice was able to maintain an oxygen saturation of ≥95% for blood flow rates up to2.0 L/min with a fiber bundle surface area of 0.28 m’and priming volume of 47 ml.Further, the device was able to remove >180 mL/min of CO2 at the rated flow. TheCO2 clearance is largely dependent on the sweep gas flow rate to blood flow rate ratioand can be further increased by increasing the sweep gas flow. The relatively shortgas exchange fibers allow the M-Lung to maintain a sufficiently low gas side pressuredrop at higher sweep flows and minimize water accumulation in gas phase, therebyenhancing the CO2 removal efficiency/capacity of the device. In comparison with similarly sized commercial devices, the M-Lung uniquelymaintains one of the highest efficiencies for both oxygen and CO transfer,demonstrating the effect of optimizing the lung design for overcoming both the diffusion-limitation in oxygen transfer by means of secondary flow mixing andventilation limitation in CO2 transfer by means of a relatively short gas path length. Despite its low priming volume and efficient gas exchange, the M-Lung maintains asufficiently low blood-side pressure drop across the relevant range of blood flowrates. At a blood flow rate of 1.0 L/min, the M-Lung had a blood-side pressure drop<50 mmHg, which is within the range supported by a systemic arterio-venouspressure gradient. At its rated flow of 2.0 L/min, the M-Lung had a pressure drop of106 mmHg, which is well within the range supported by a blood pump. A comparisonof the simulations in Chapter 2 and experimental pressure drop across the M-Lungsuggestsatfiiber bundle permeability of 2.8e’ m² for the currentM-Lungconfiguration. References 1. Guidance for Cardiopulmonary Bypass Oxygenators 510(k) Submissions;Final Guidance for Industry and FDA Staff [Internet]. Food and Drug Administration.2000 「cited October 1. 2016 . Available from:http://www.fda.gov/MedicalDevices/DeviceRegulationandGuidance/GuidanceDocuments/ucm073668.htm. 2. Bartlett RH. Physiology of Gas Exchange During ECMO for RespiratoryFailure. Journal of intensive care medicine. 2016. 3. Benn JA, Drinker PA, Mikic B, Shults MC, Lacava EJ, Kopf GS, et al.Predictive Correlation of Oxygenn aalndd (CarbonDioxideeTransfer ina BloodOxygenatorwith InducedSecondaryFlows. T AAm Soc Art Int Org.1971;17(Apr):317-&. 4. Zwischenberger JB, Anderson CM, Cook KE, Lick SD, Mockros LF, BartlettRH. Development of an implantable artificial lung: challenges and progress. ASAIOjournal.2001;47(4):316-20. Chapter 4 Conclusion Conclusions In conclusion, using CFD and optical flow visualization methods we designed aunique hollow fiber membrane lung based on concentric circular blood flow pathsconnected by gates, referred to as the M-Lung. Based on these analyses, the optimalM-Lung design was prototyped and tested in vitro in accordance with regulatoryguidelines. The performance and efficiency of the M-Lung was then compared tosimilarly sized commercially available devices in order to evaluate the effectivenessof our design. Based on these studies, it can be concluded that: 1.The concentric circular blood flow paths connected by gates result inincreased secondary flow mixing within the M-Lung housing; similar vortexformation was observed in both computational and experimental methods. 2.The circular design minimizes stagnant regions and resultsin awelldistributed flow profile. 3.. Increasing the number of gates results in a longer blood path and cumulativemixing at the cost of an increased pressure drop and resistance across thedevice. 4.. In an optimized M-Lung housing, the incorporation of the fiber bundle results in asignificant increase of pressure drop and dampening of secondary flow mixing.However, the magnitude of these effects can be minimized by increasing thepermeability and porosity of the fiber bundle, at the cost of a reduced fiber surfacearea and increased priming volume. 5.The M-Lung comprises a fiber surface area of 0.28 m’ and priming volume of 47mL. 6.The M-Lung has rated flow of 2 L/min and a CO, clearance of 200 mL/min at therated blood flow. 7..The blood-side pressure drop of the M-Lung is <50 mmHg at a blood flow rate of1.0 L/min, which is within the range supported by a systemic arterio-venouspressure gradient. At its rated flow of 2.0 L/min, the M-Lung had a pressure dropof 106 mmHg, which is well within the range supported by a blood pump. 8.'The M-Lung has an oxygenation efficiency of 357 mL/min/mandCO, clearanceefficiency that is more than 2 times that of the Novalung iLA (a commercial lungdesigned for CO, clearance). In comparison with similarly sized commercialdevices, the M-Lung uniquely maintains one of the highest efficiencies for bothoxygen and CO, transfer. This M-Lung design meets the functional requirements for providing systemic CO,removal support in adults as well as total respiratory support for infants and smallchildren; in addition to sufficient gas transfer, it comprises a low priming volume,allowing for minimal hemodilution and rapid transit time. The rapid transit time at rated flow and tthee 2absence of corners where bloodcan stagnateshould minimizethrombogenicity. Furthermore,given its compact size, controllable resistance, andpotential for low thrombogenicity, the M-Lung has potential for providing long-termambulatory respiratory support, in arterio-venous mode for clearance of CO, for patientswith end-stage COPD or pulmonary artery to left atrium mode for total lung support. Future Work Future work will evaluate the performance of a clinical M-Lung in an in vivo model tofurther assess its biocompatibility and chronic performance. Using a disease animalmodel, the chronic performance and efficacy of the M-Lung could be evaluated intreating the pathophysiology of end-stage lung disease. Future studies will also investigate the incorporation of antithrombogenic materials suchas nitric oxide (NO), which minimizes platelet adhesion and activation, coupled withargatroban, which is a direct thrombin inhibitor, in the M-Lung housing and sweep gas inan effort to eliminate systemic anticoagulation. The M-Lung design could be scaled up to achieve total adult respiratory support. Scalingup to adult size devices will be done with a return to CFD and PIV to optimize theproperties of a device with a 5 L/min rated flow,pressure drop <60 mmHg at rated flow,and CO, transfer 2 times oxygen transfer at rated flow. We expect that this will require0.6 to 0.8 m’ of gas transfer surface, in contrast with current adult devices, whichcomprise 1.5-1.8 m. ii iii End-stage lung disease due to chronic obstructive pulmonary disease (COPD) is a leading cause of death across the world. However, treatment options for end-stage COPD are extremely limited. An artificial membrane lung designed to provide pulmonary support, primarily by clearance of CO2, is a promising alternative treatment for end-stage COPD patients. Current hollow fiber membrane lungs feature a predominantly straight blood path length across the fiber bundle, resulting in limited oxygen transfer efficiency due to the boundary layer effect. Furthermore, these lungs also utilize long gas fibers relative to the blood path length, resulting in a limited CO2 clearance efficiency due to the build-up of CO2 within the fiber lumens. Using computational fluid dynamics and optical flow visualization methods, a unique hollow fiber membrane lung was designed and created comprising concentric circular blood flow paths connected by gates, in addition to a short gas path length, referred to as the M-Lung. The M-Lung, comprising a fiber surface area of 0.28 m2 and priming volume of 47 mL, has a rated flow of 2 L/min and the oxygenation efficiency is 357 mL/min/m2. The CO2 clearance of the lung is 200 mL/min at the rated blood flow. Given its high gas transfer efficiency, as well as its compact size, low priming volume, and propensity for minimal thrombogenecity, this lung design has the potential to be used in a range of acute and chronic respiratory support applications, including providing CO2 clearance and partial oxygenation in adults with end-stage COPD as well as total respiratory support for infants and small children.
确定


还剩56页未读,是否继续阅读?

产品配置单


北京欧兰科技发展有限公司为您提供《人工膜肺中速度场检测方案(CCD相机)》,该方案主要用于内脏器官中速度场检测,参考标准--,《人工膜肺中速度场检测方案(CCD相机)》用到的仪器有德国LaVision PIV/PLIF粒子成像测速场仪、LaVision DaVis 智能成像软件平台
推荐专场


相关方案
更多
该厂商其他方案
更多