


方案详情
文
利用脉冲Nd:YAG激光器作光源,采用三台CMOS相机做成像器件,用组合的粒子图像PIV和跟踪测速PTV技术研究了砂砾动力学。
方案详情

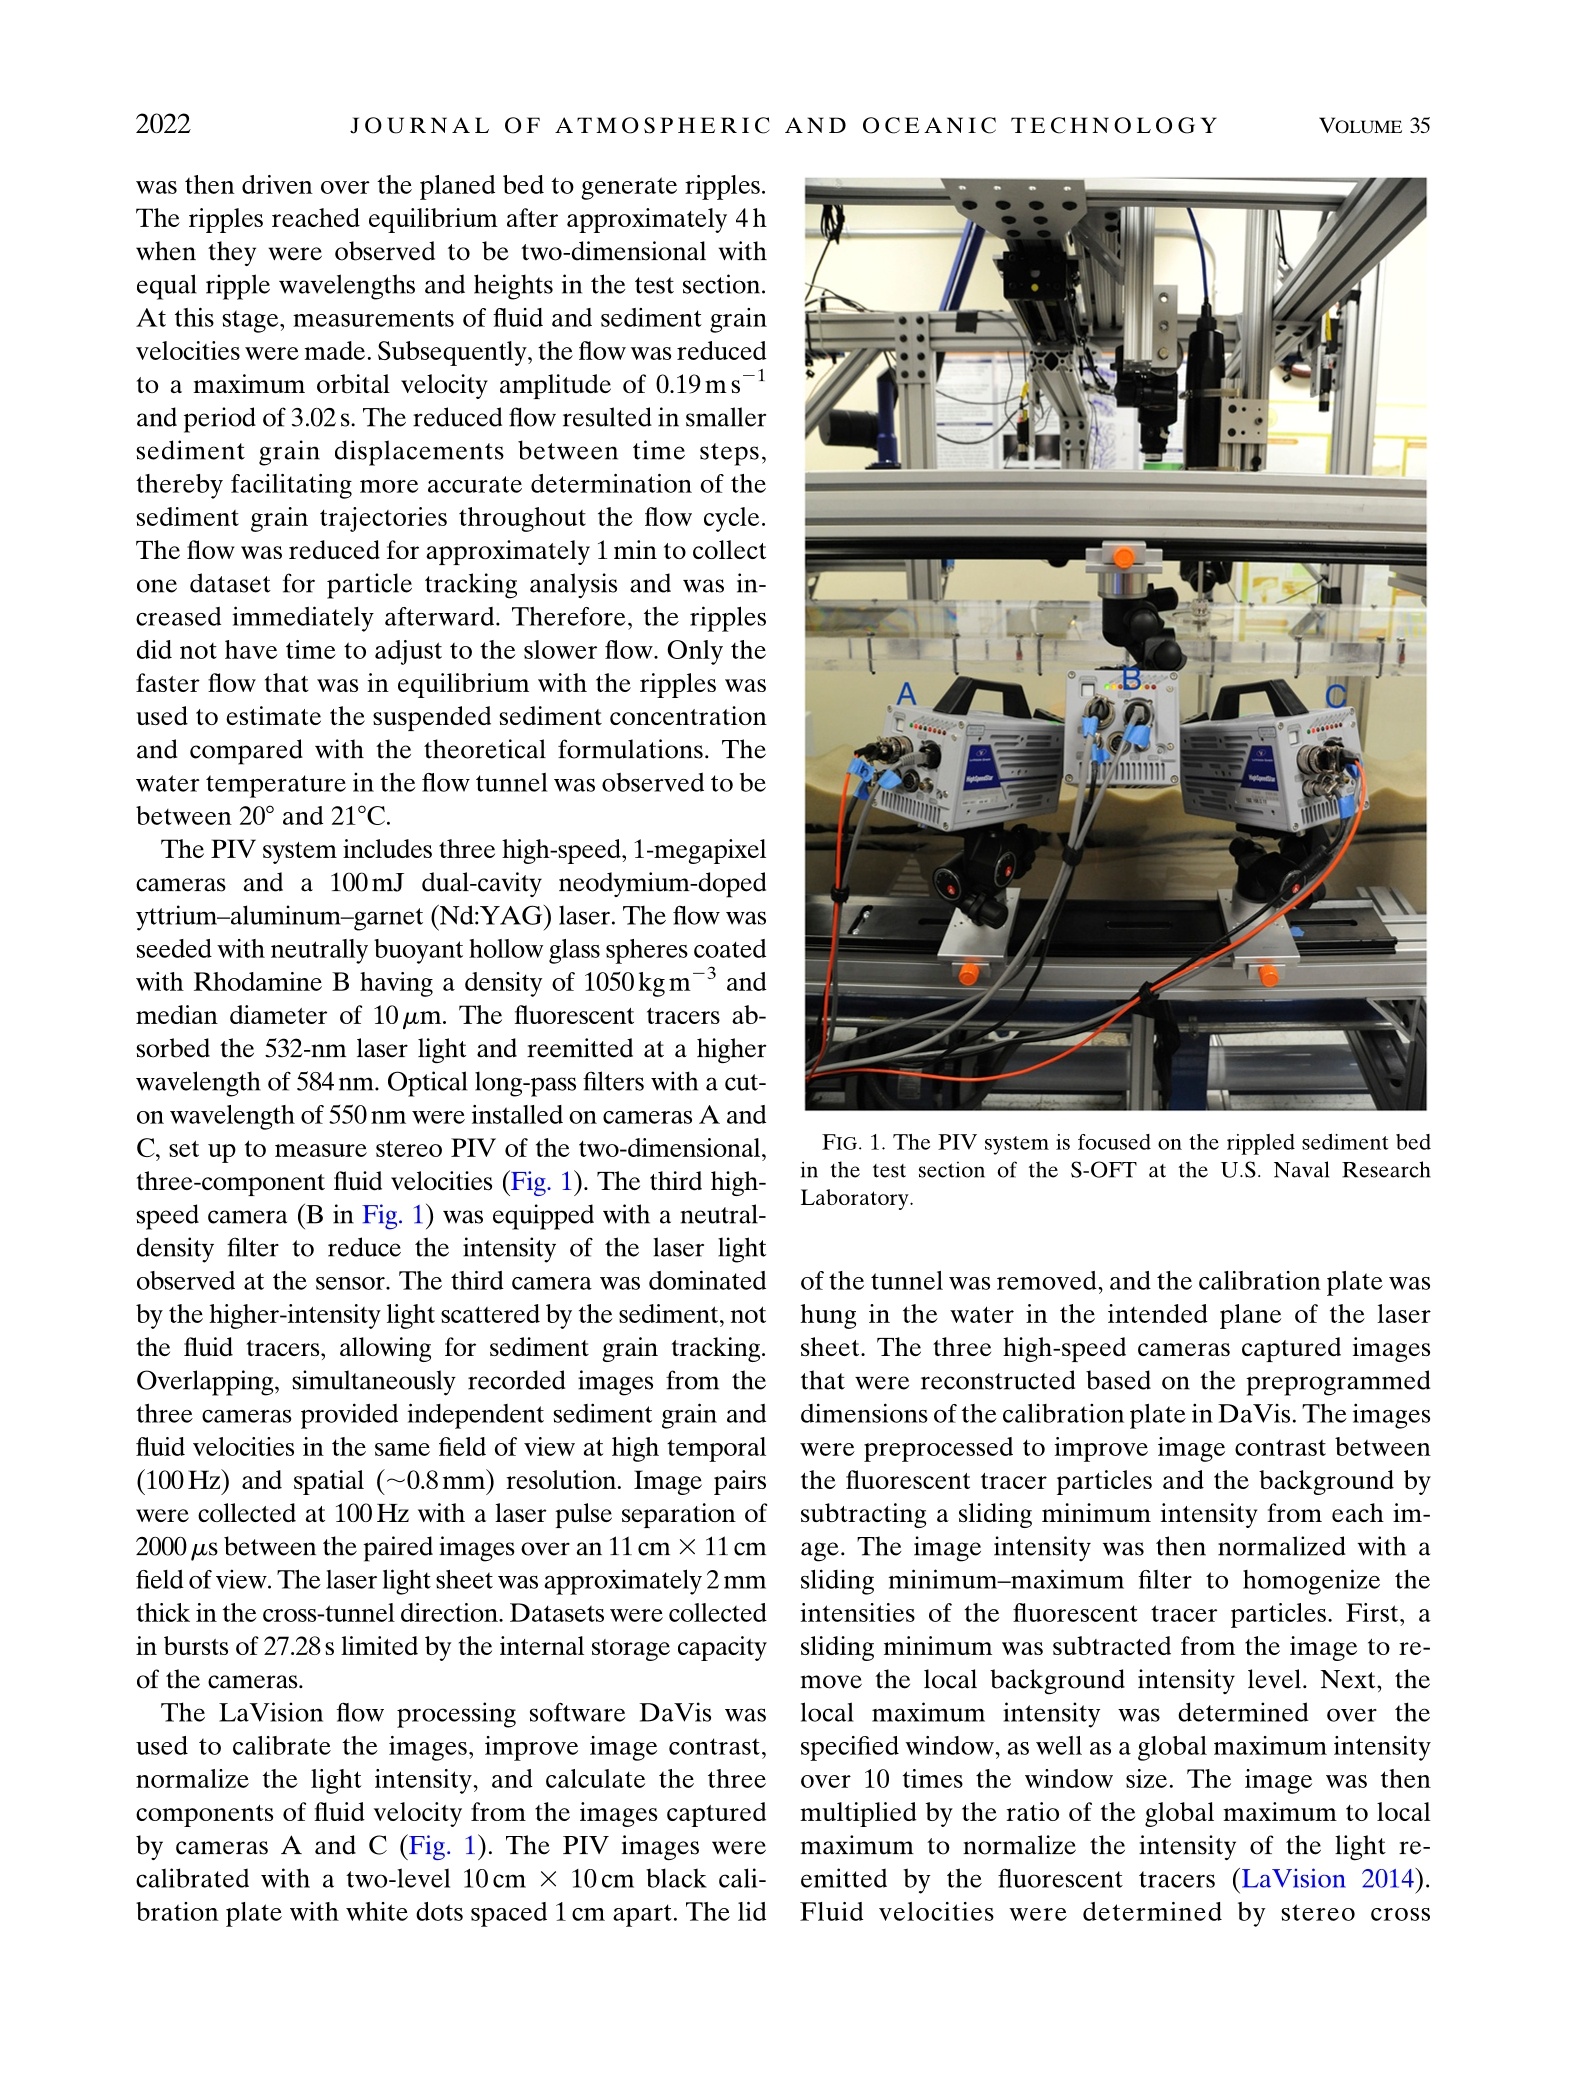
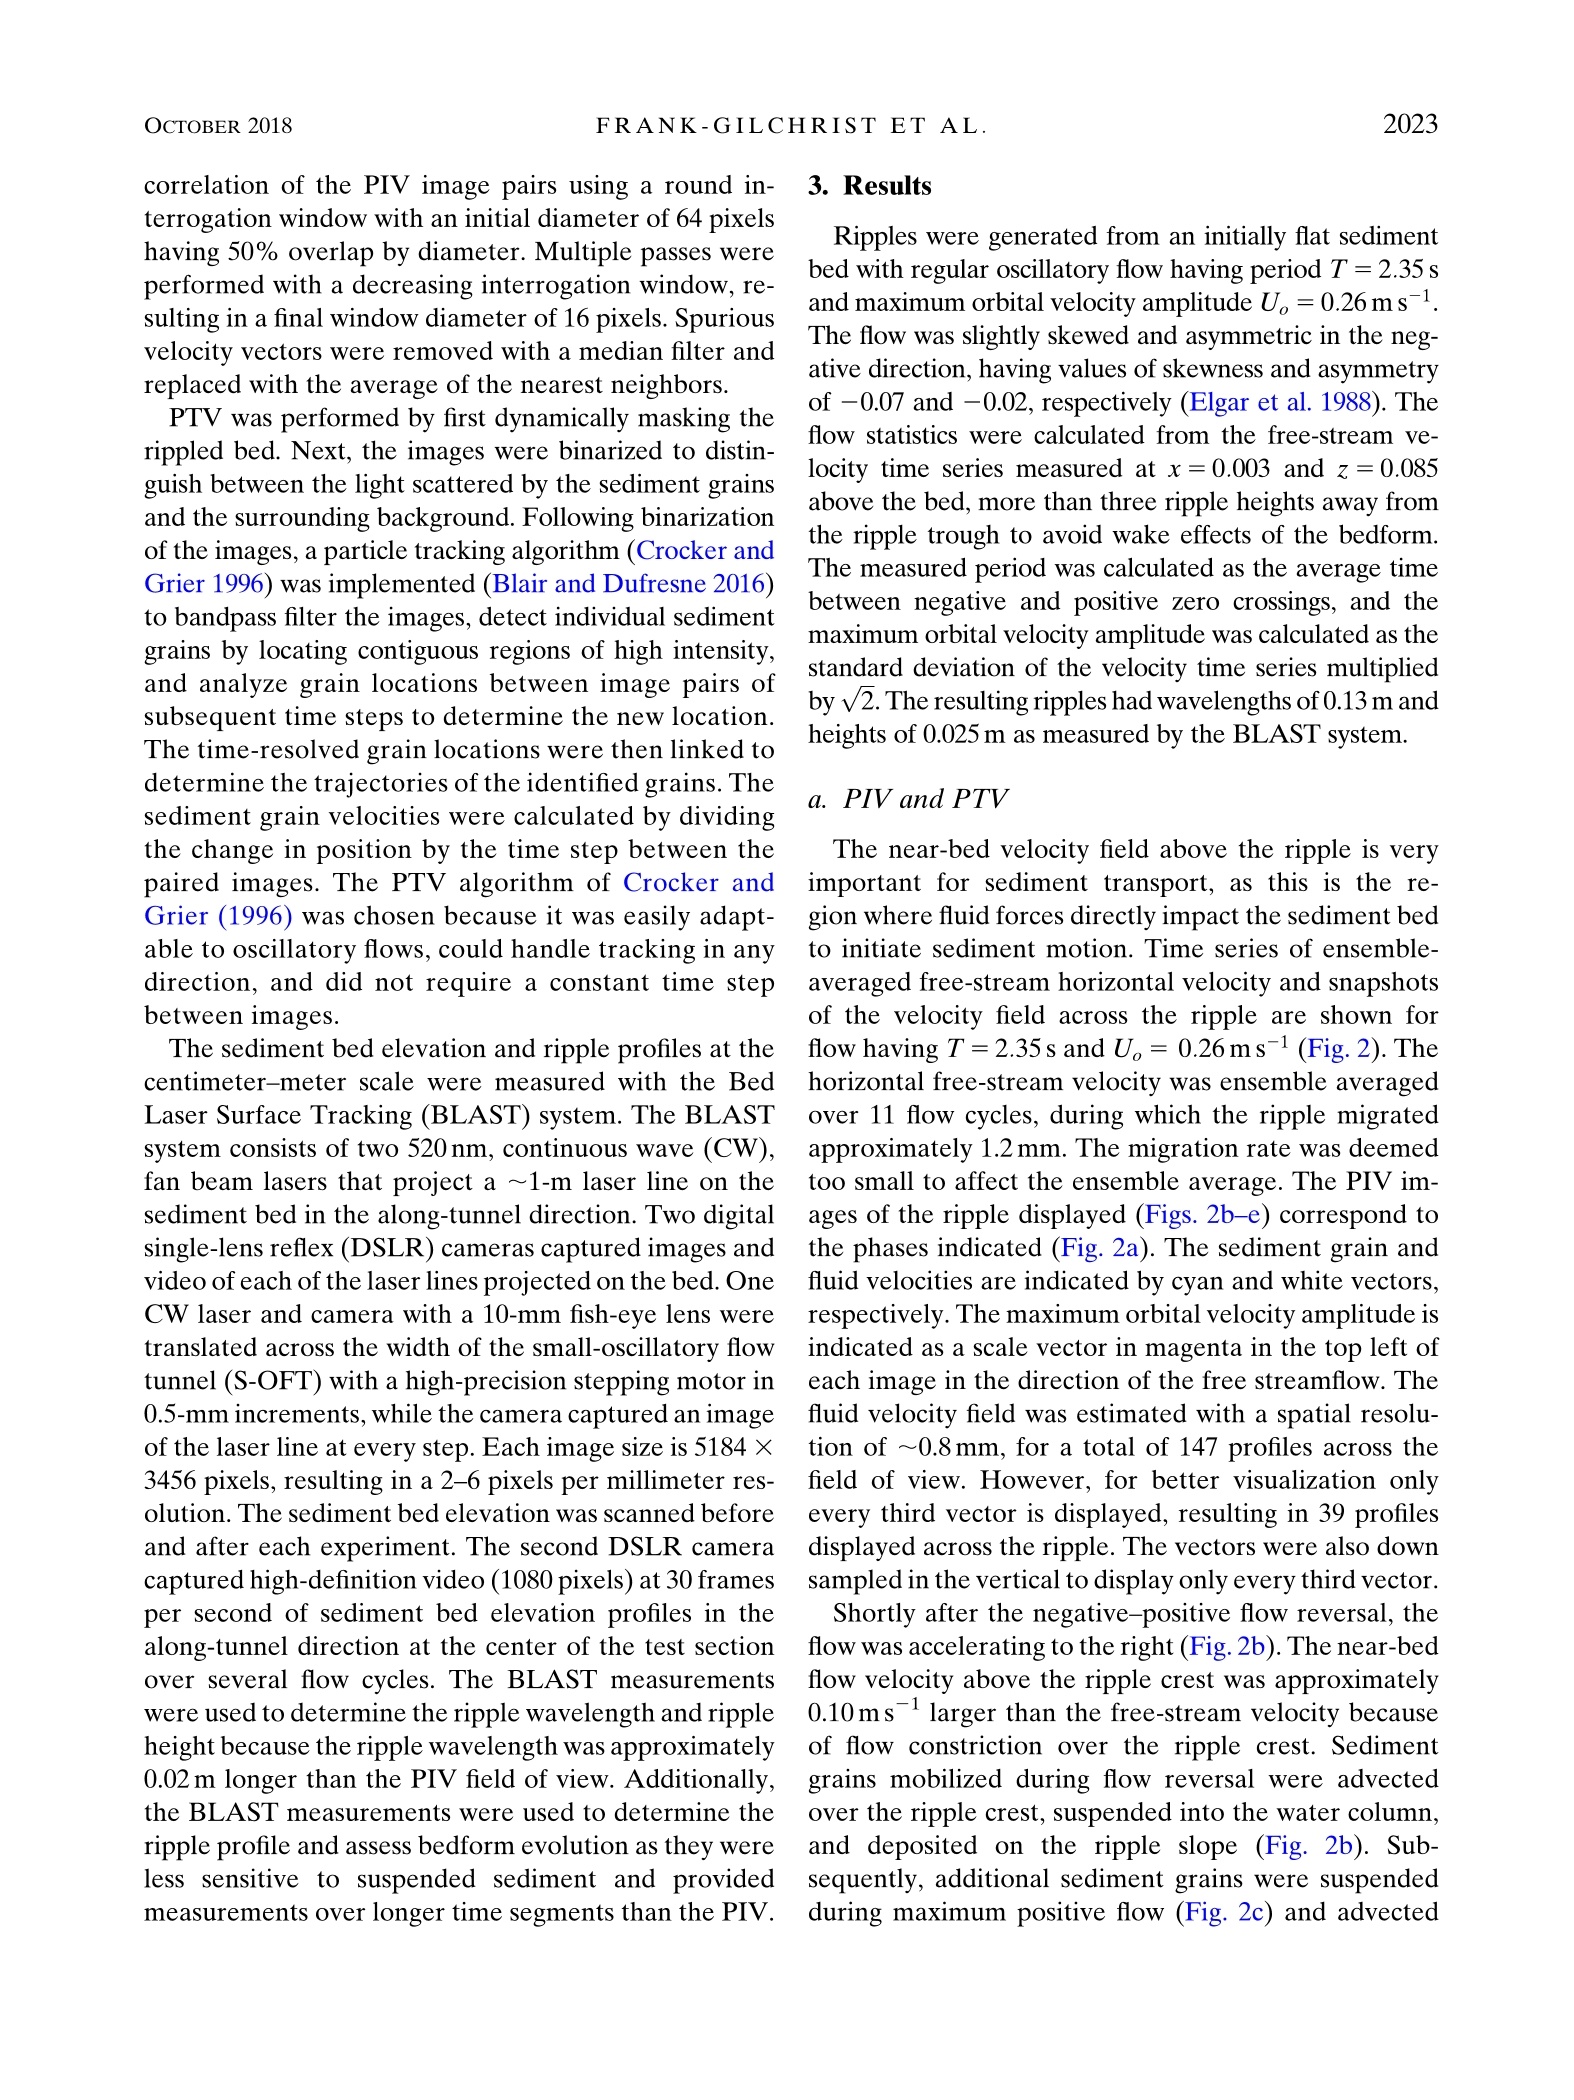
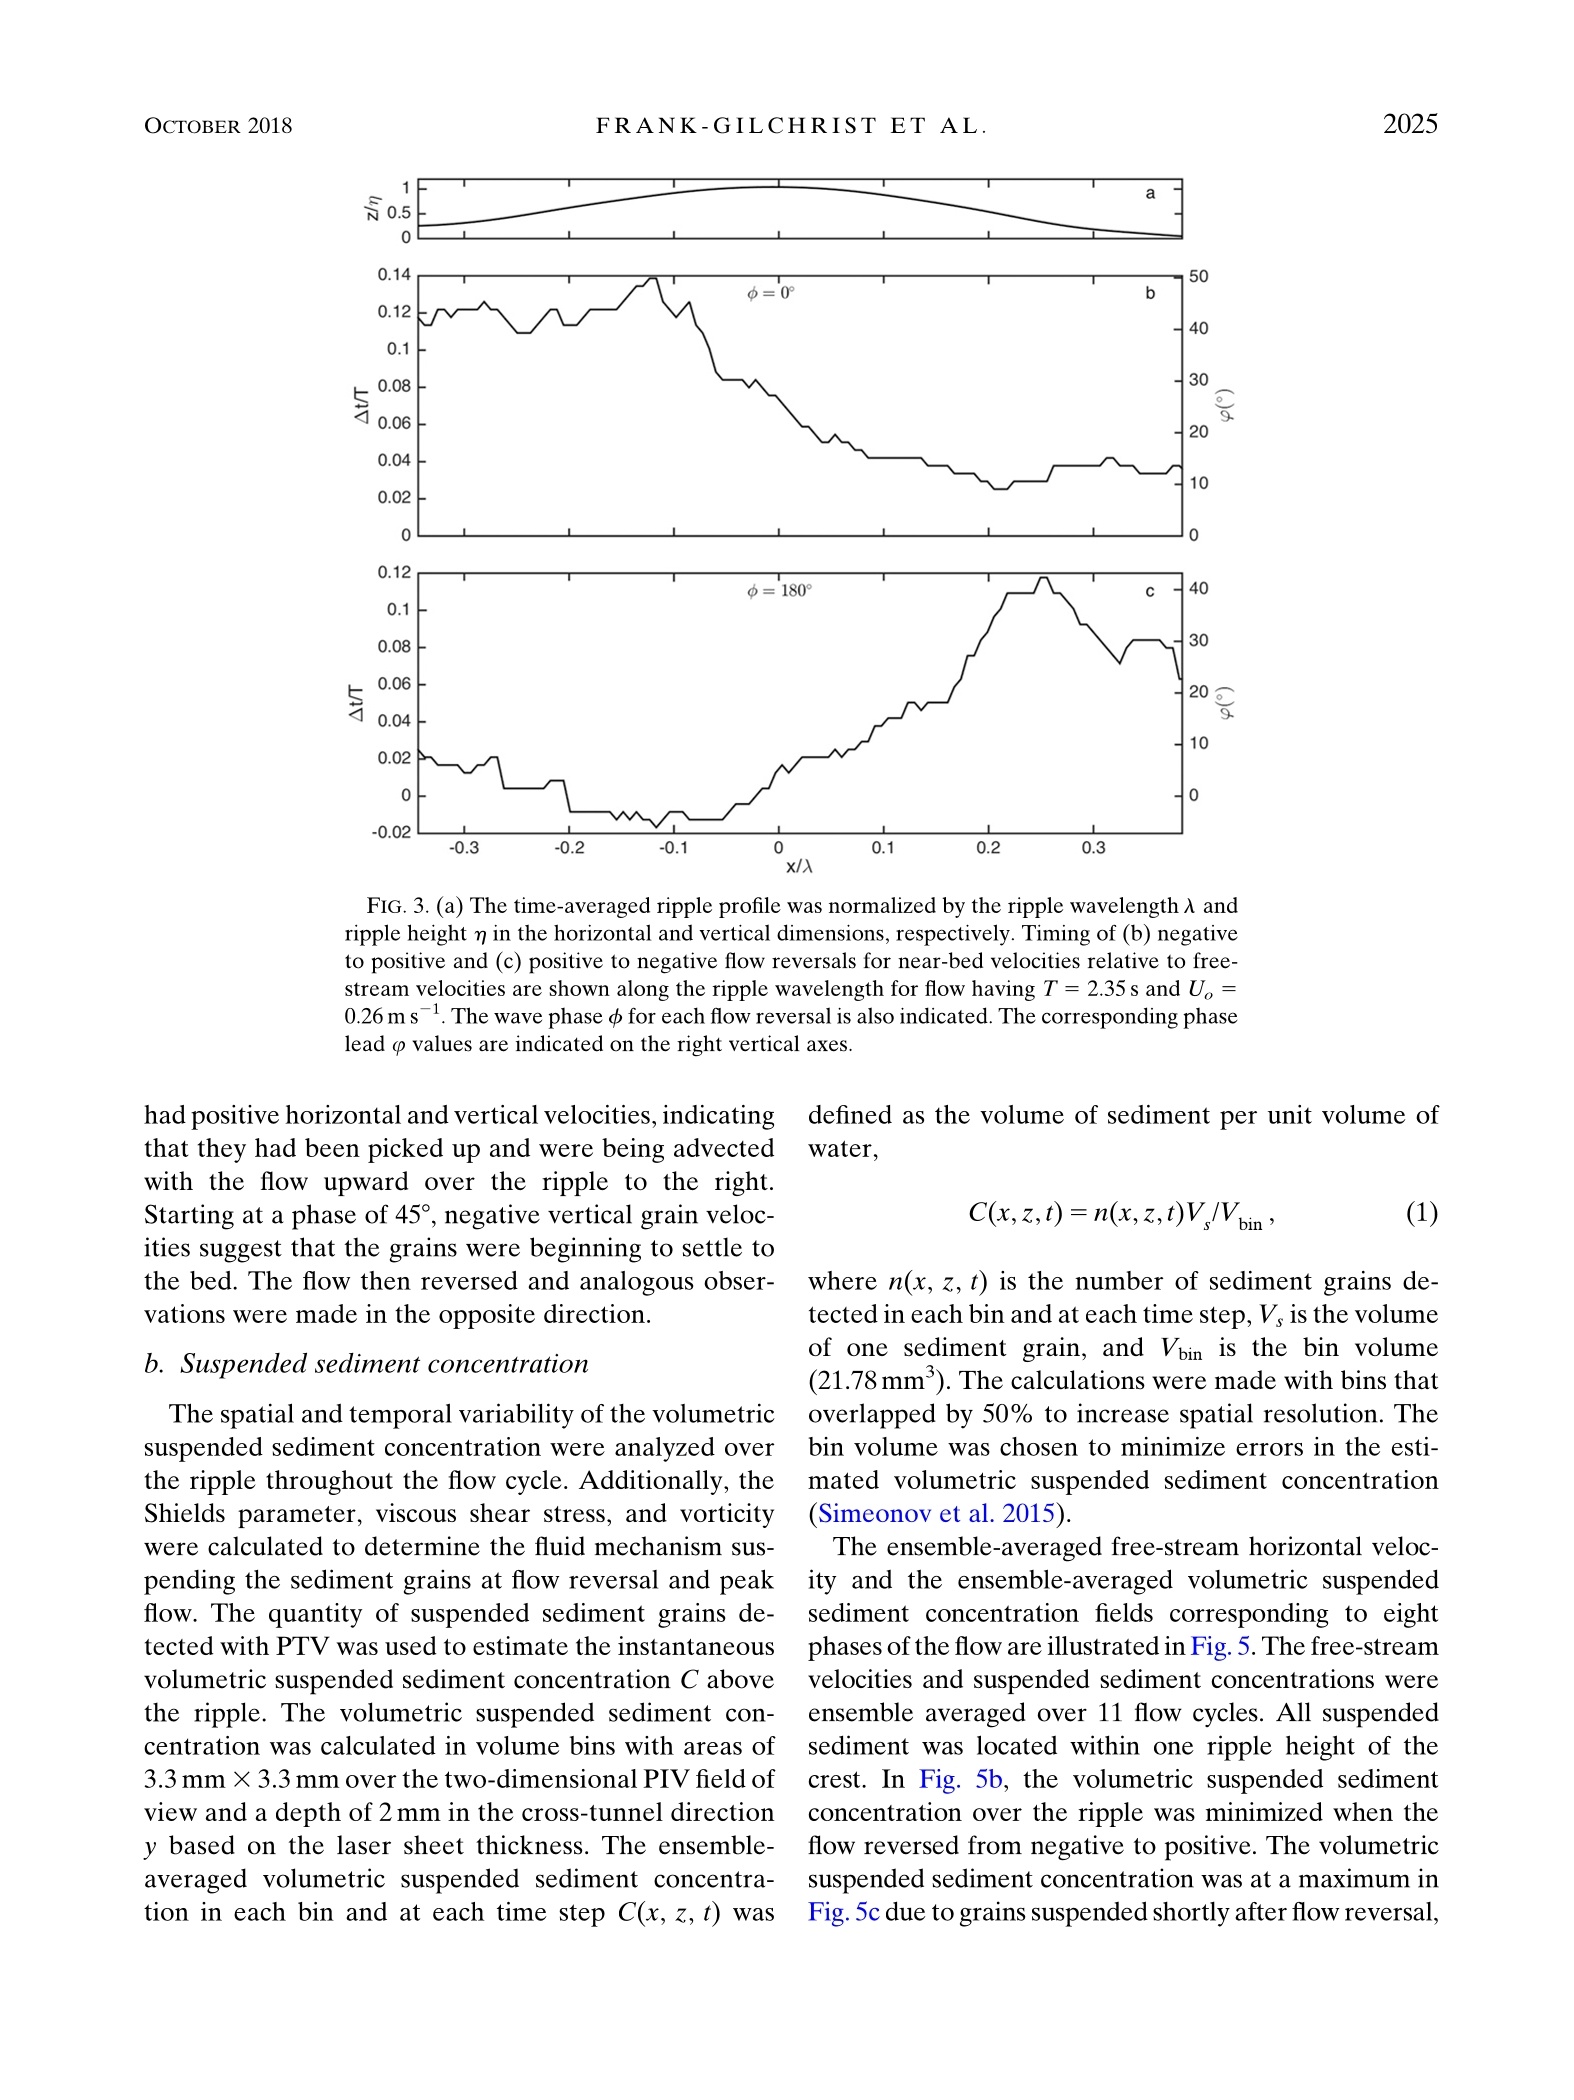
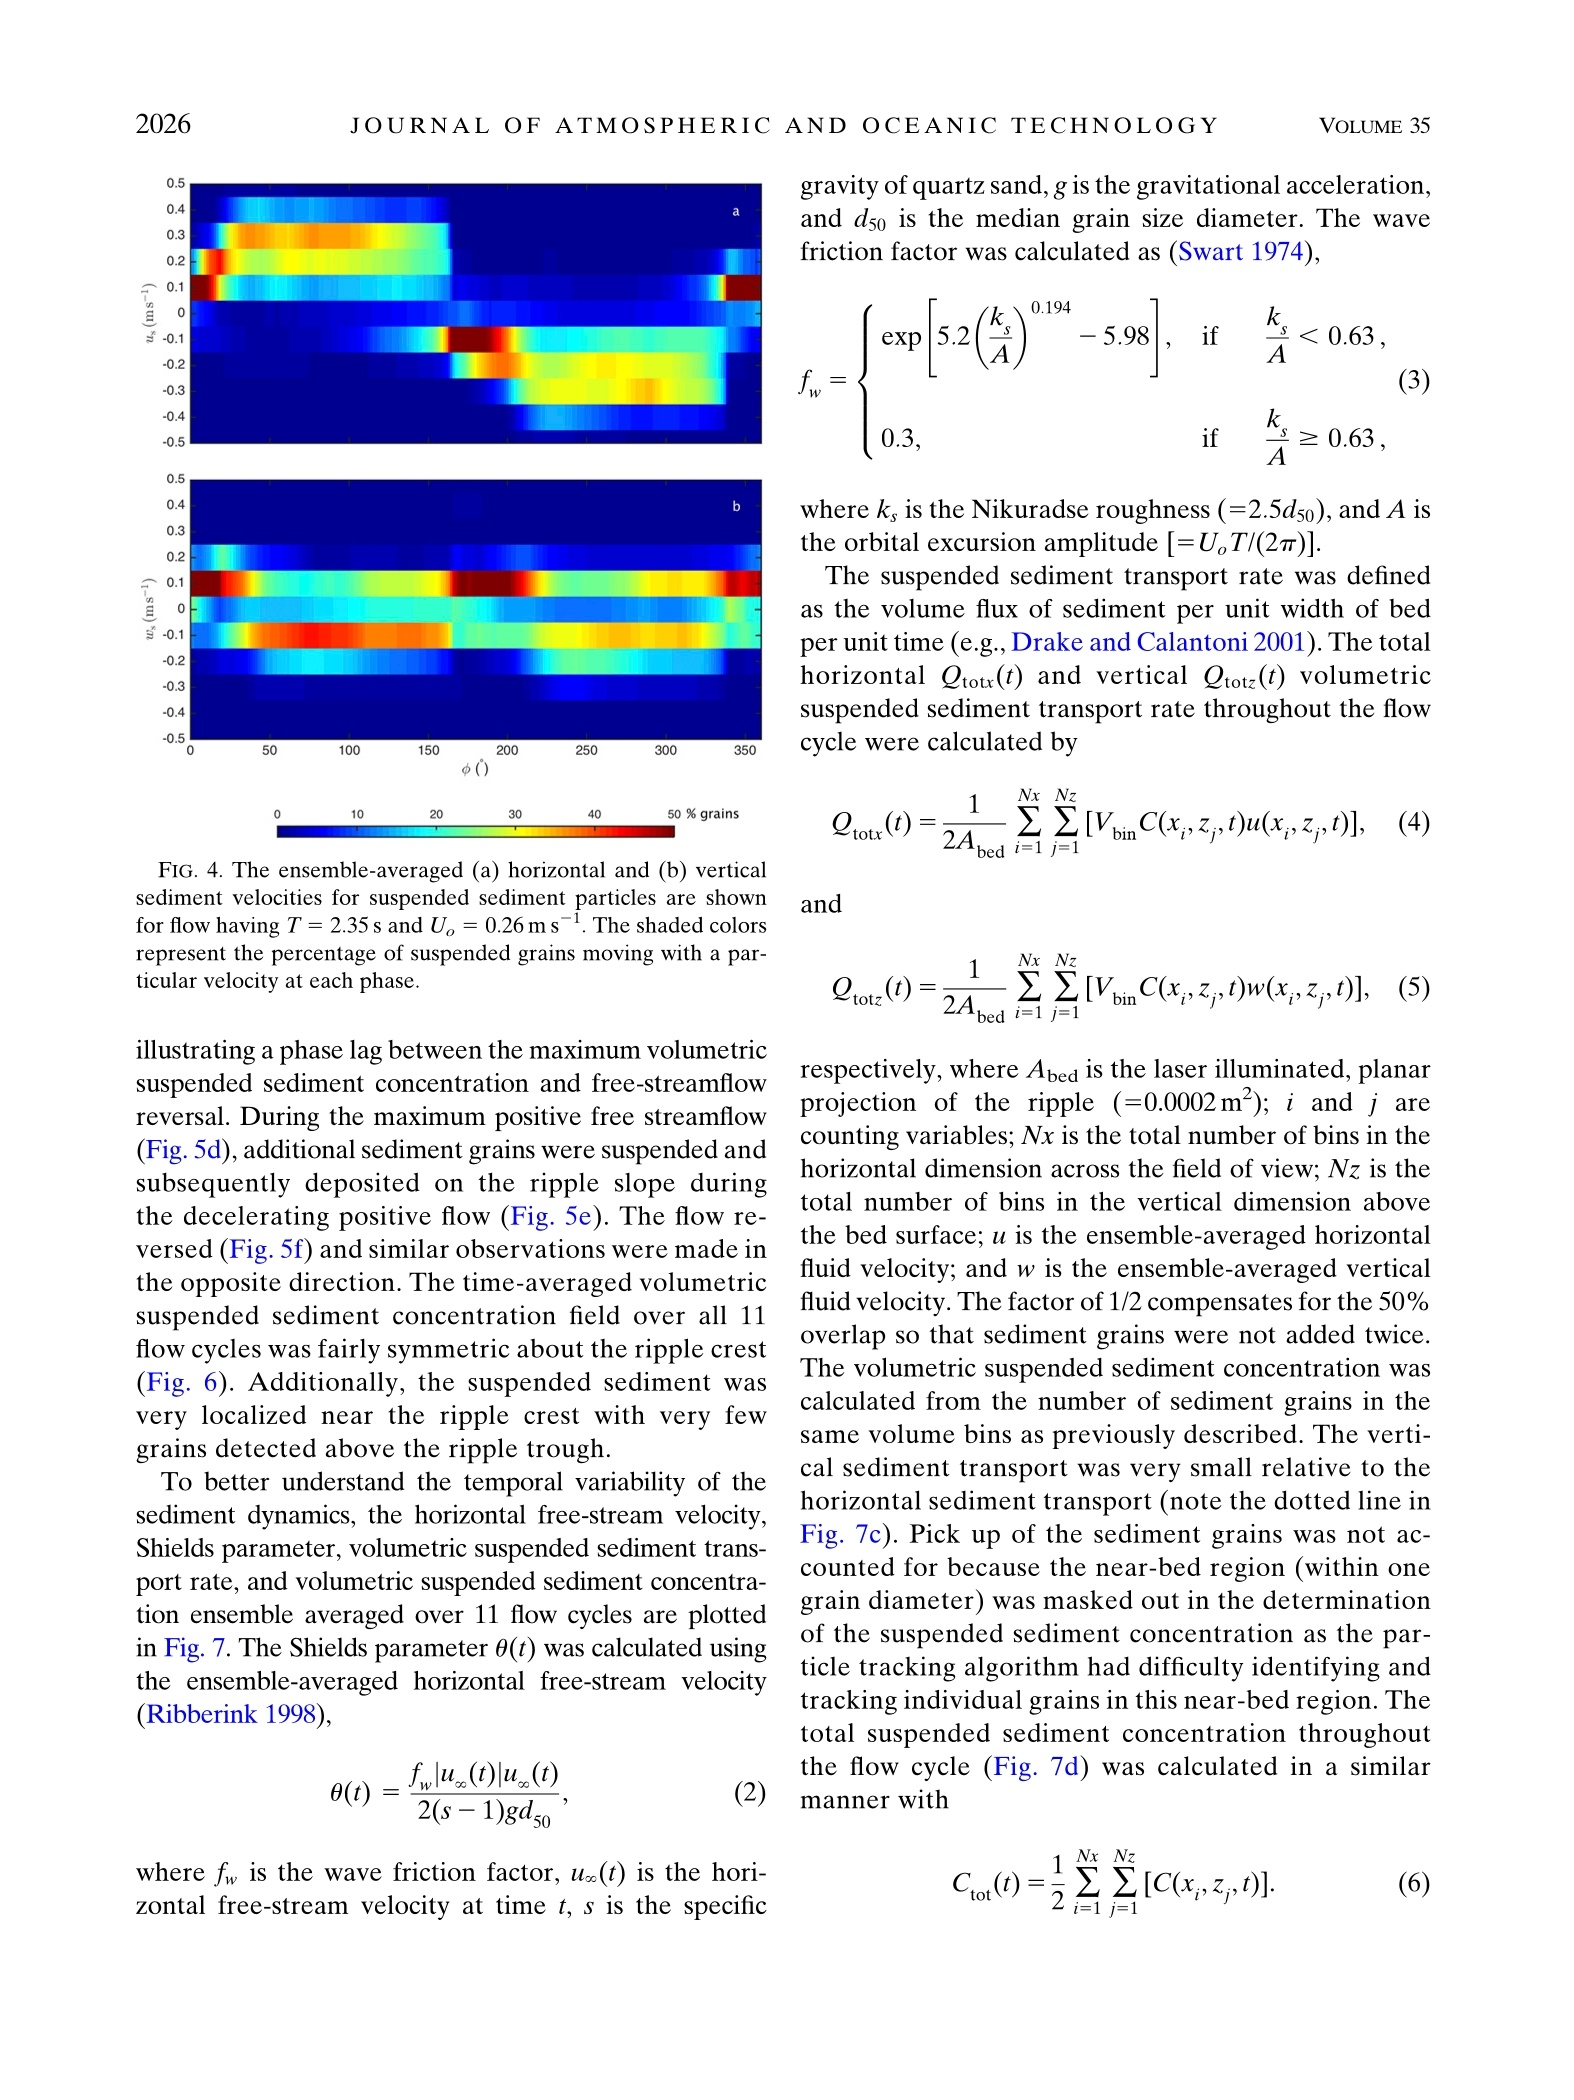
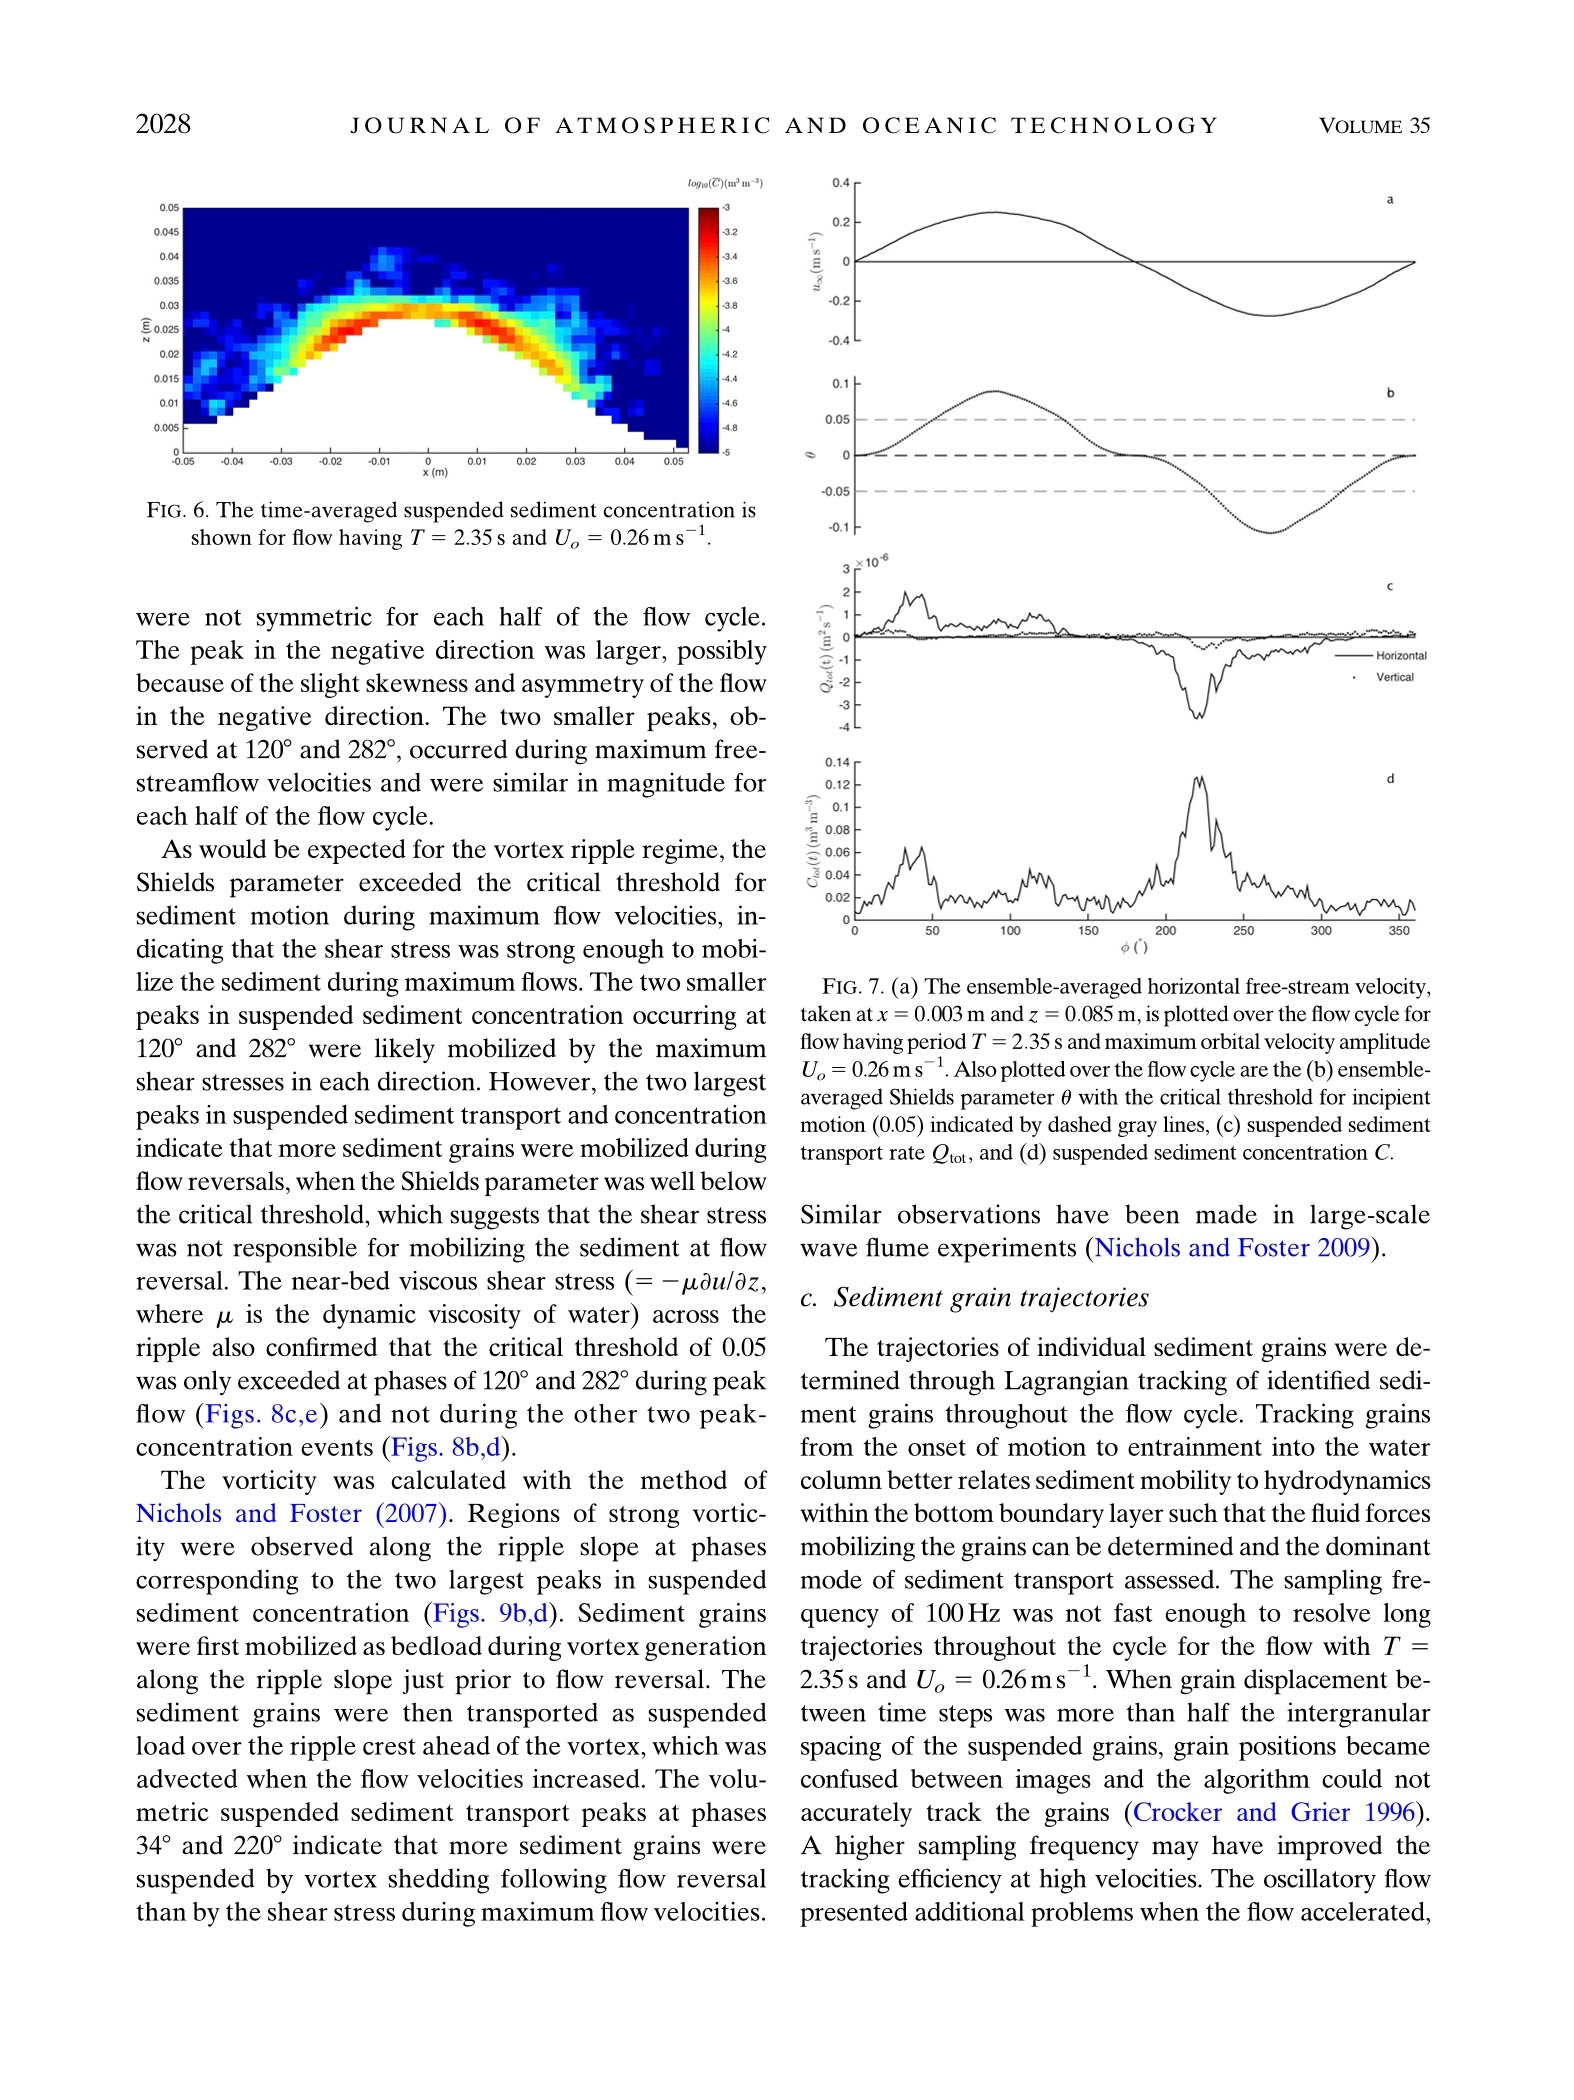
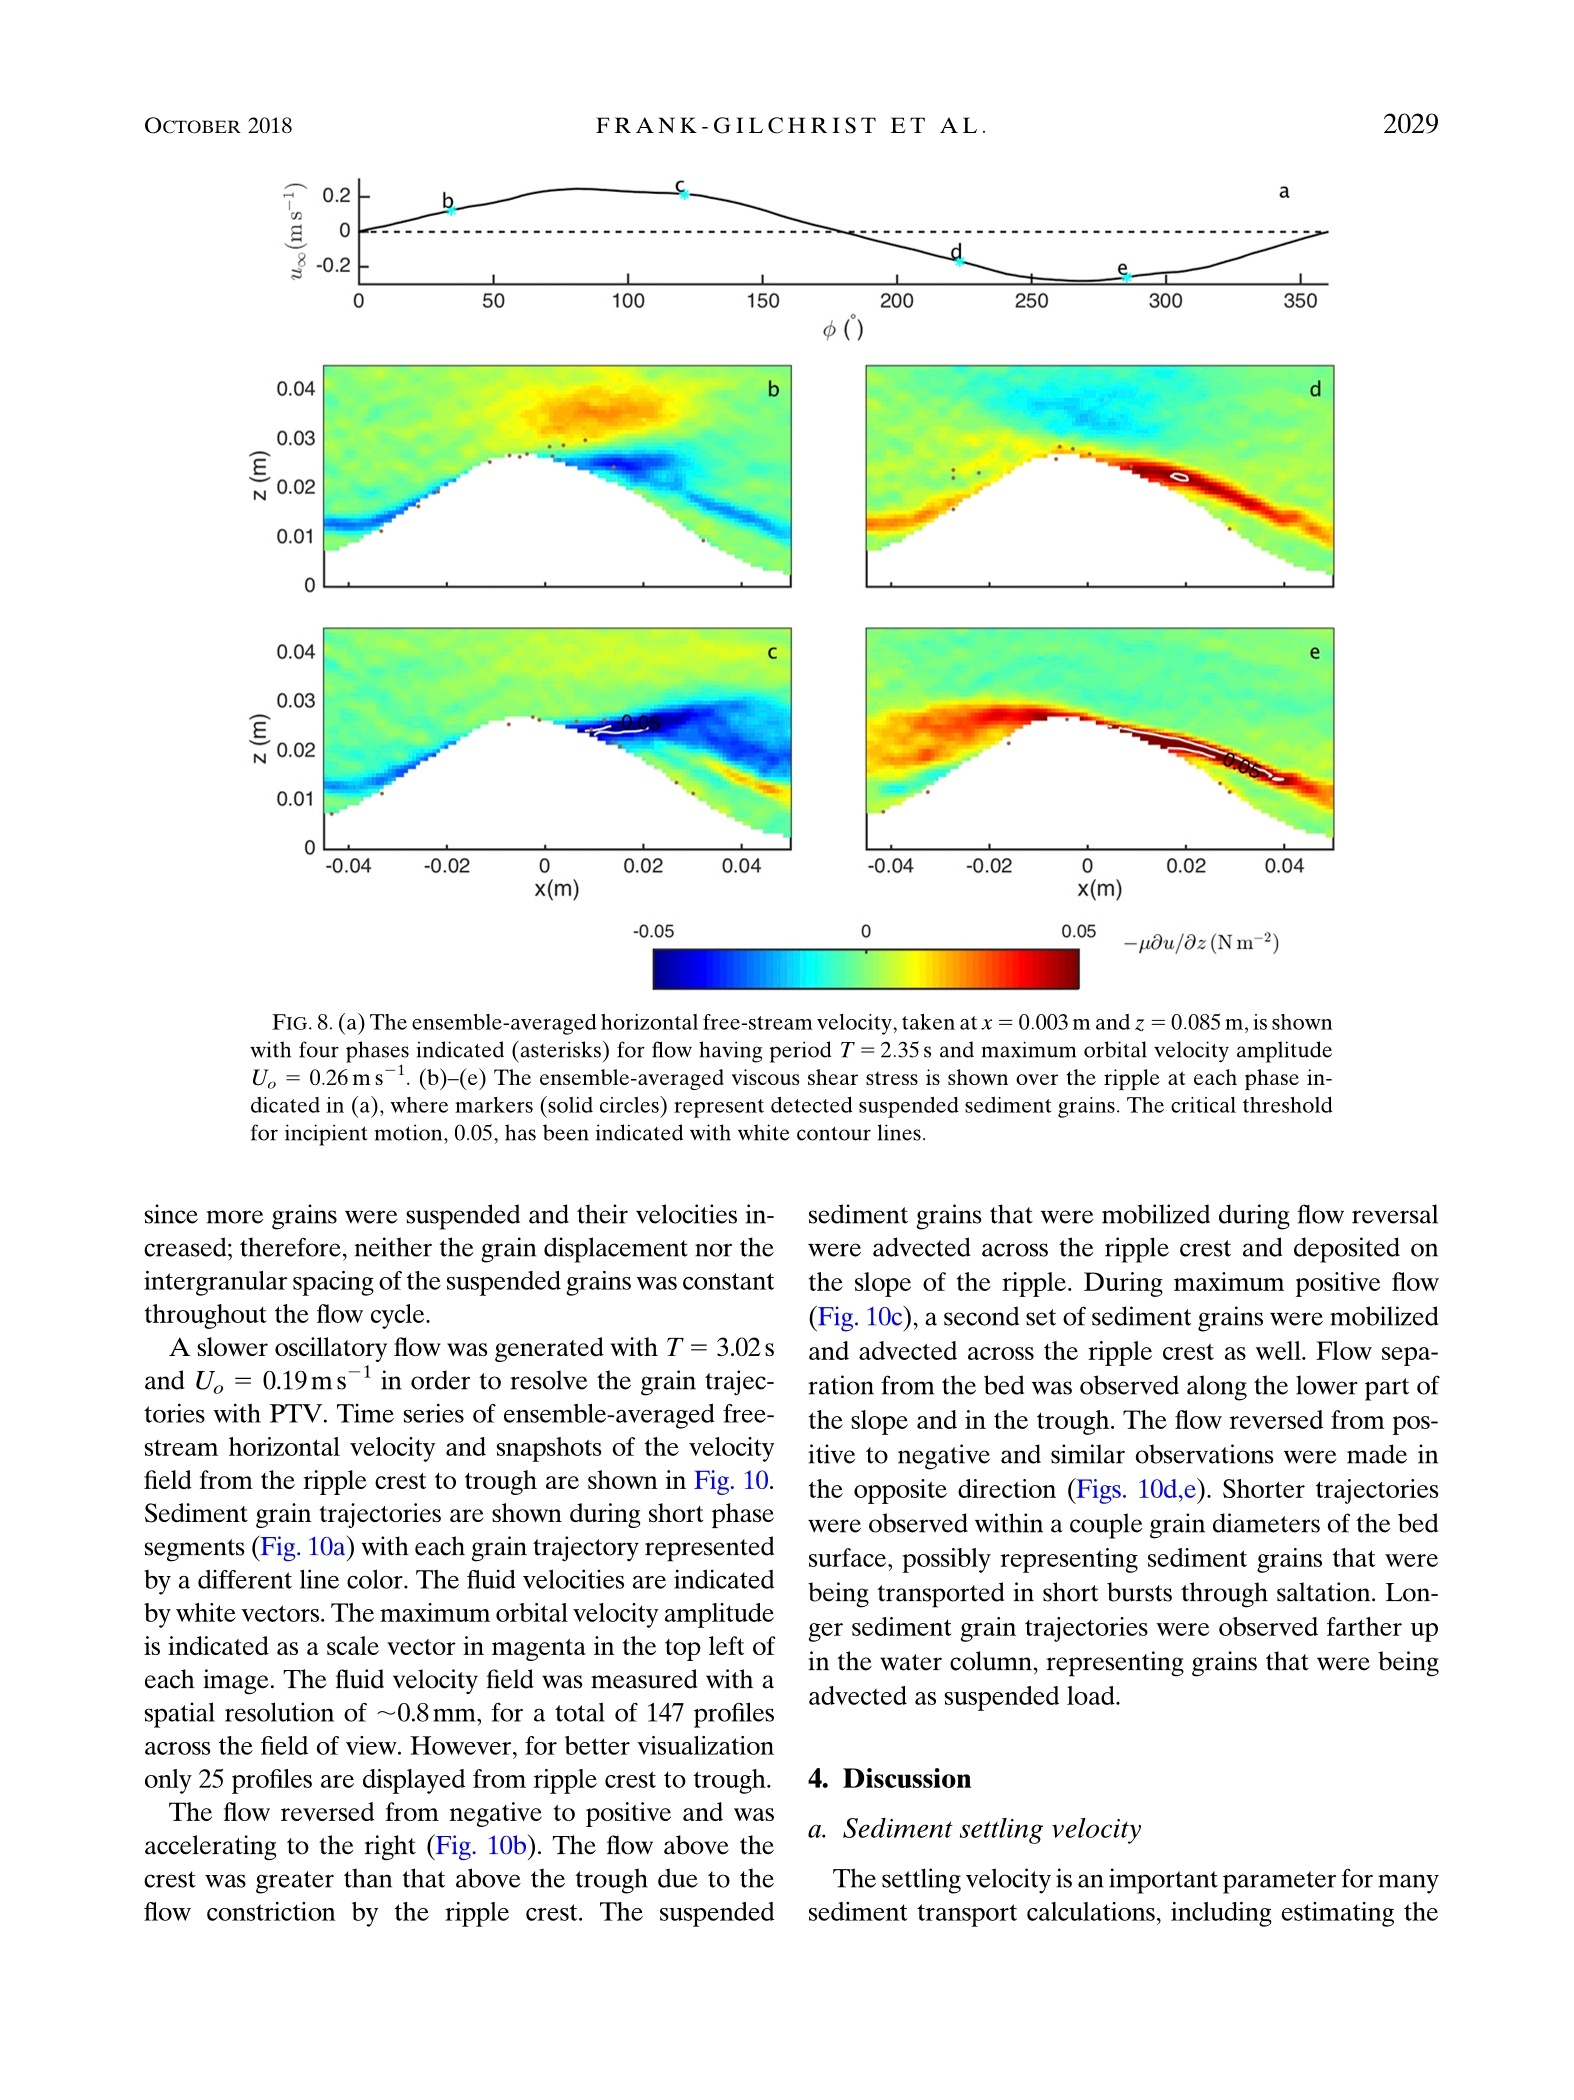
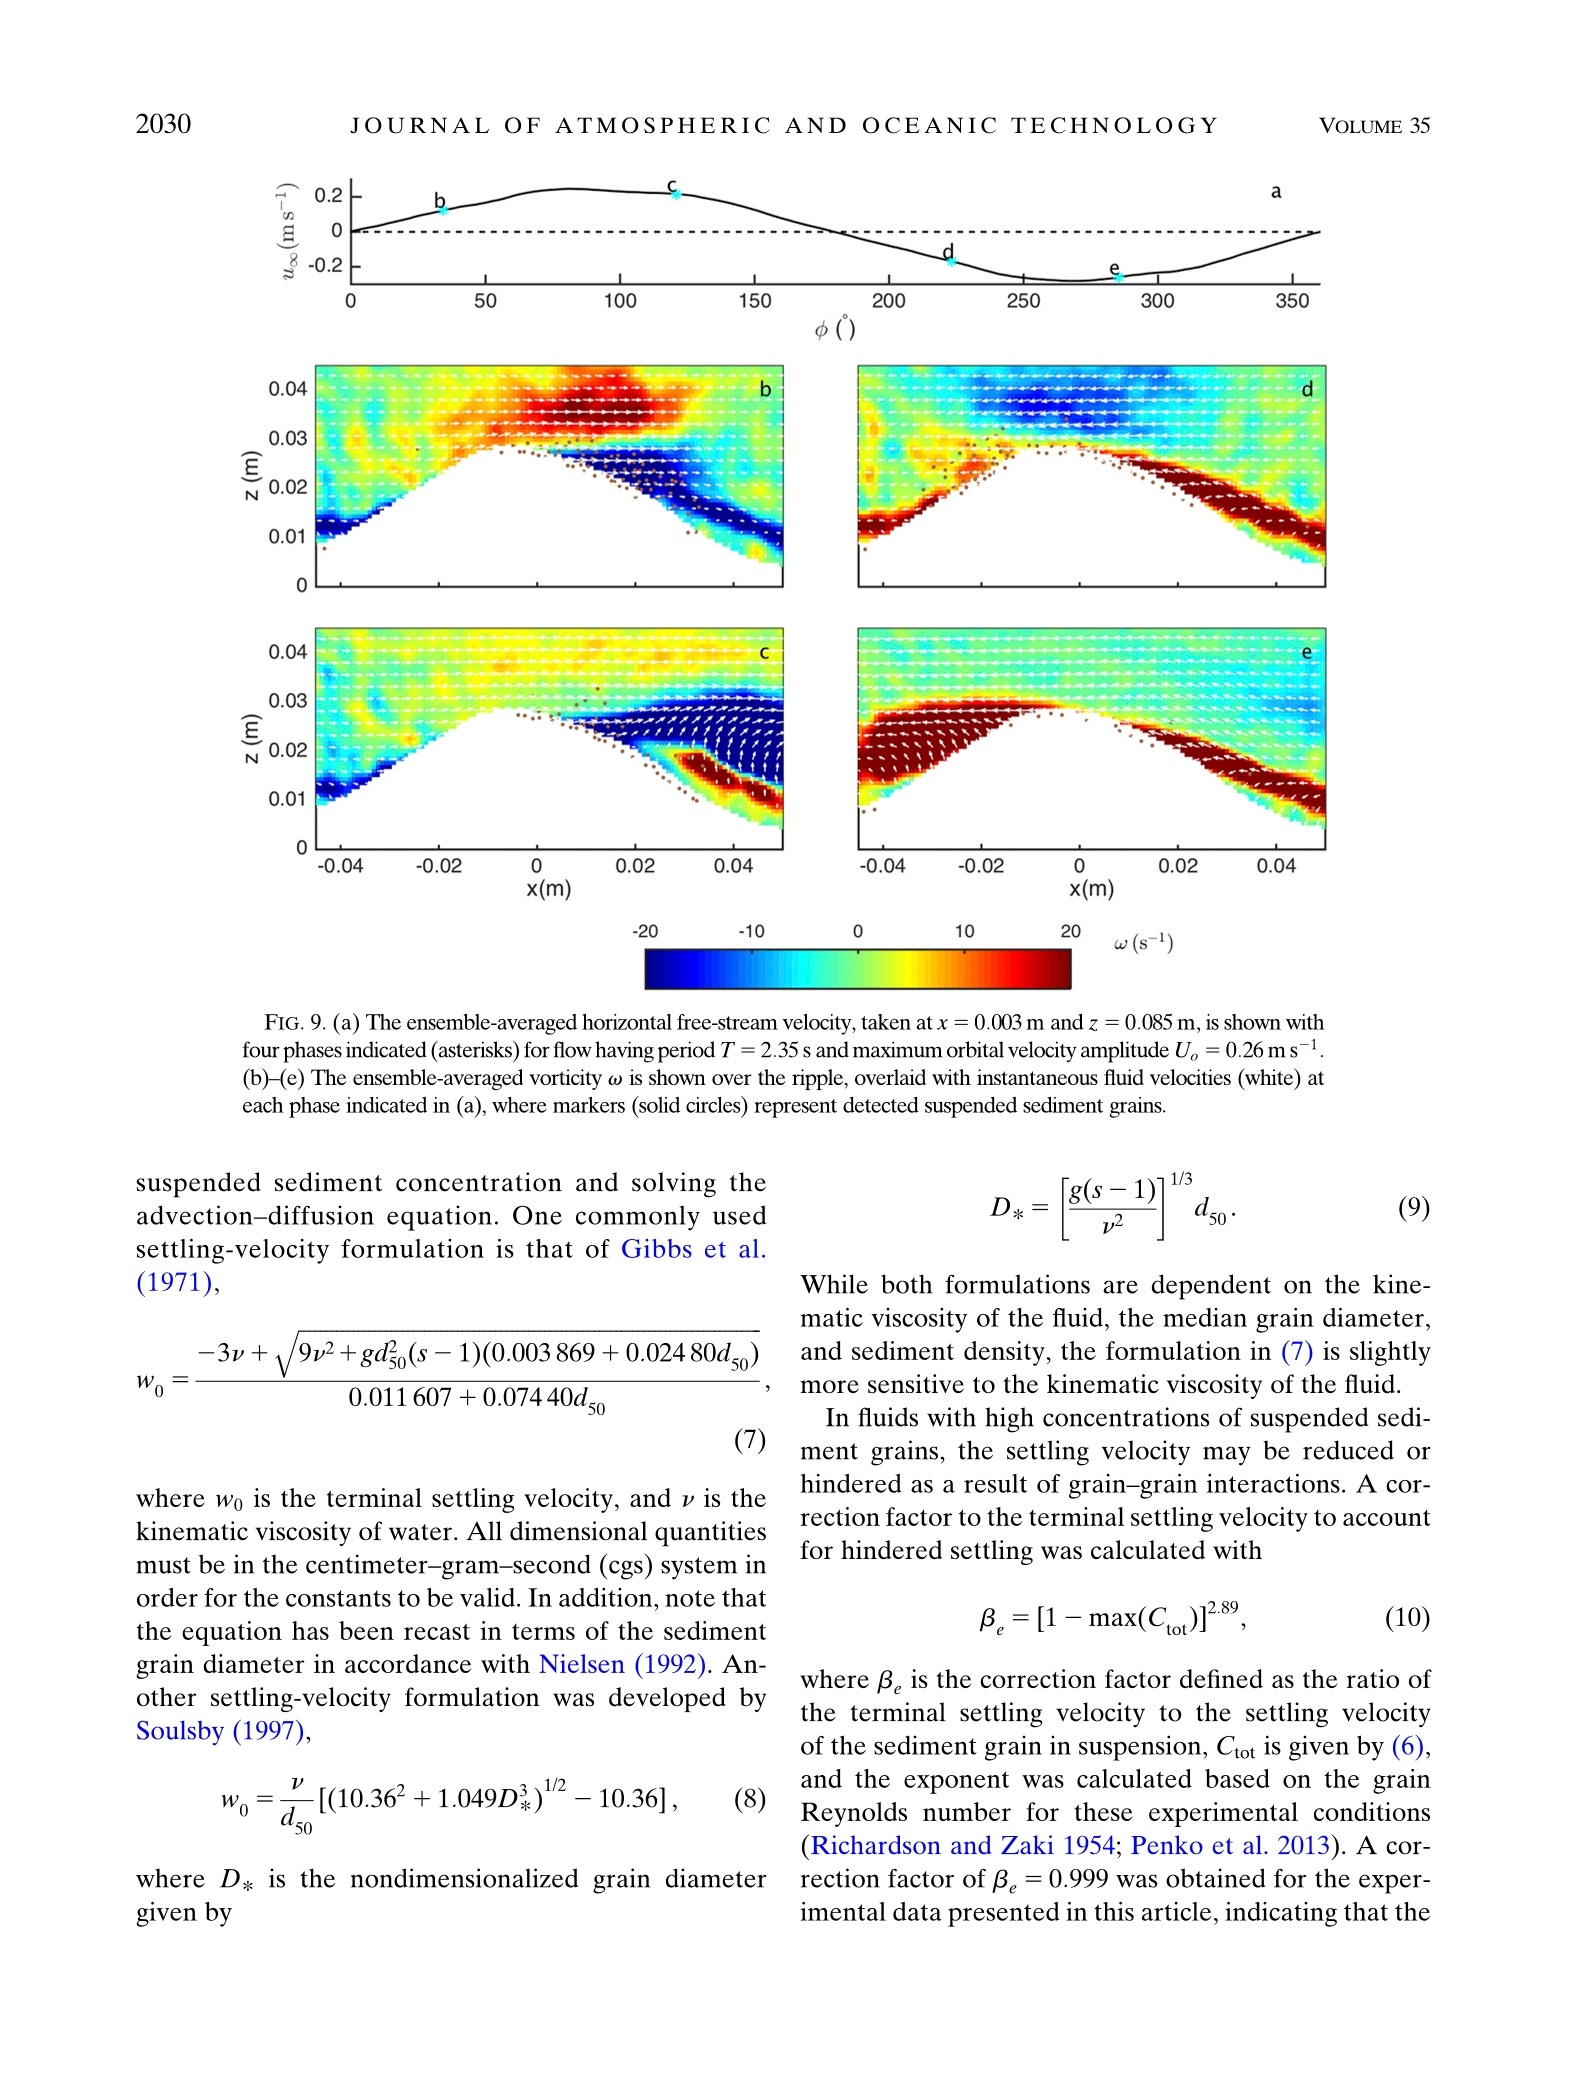
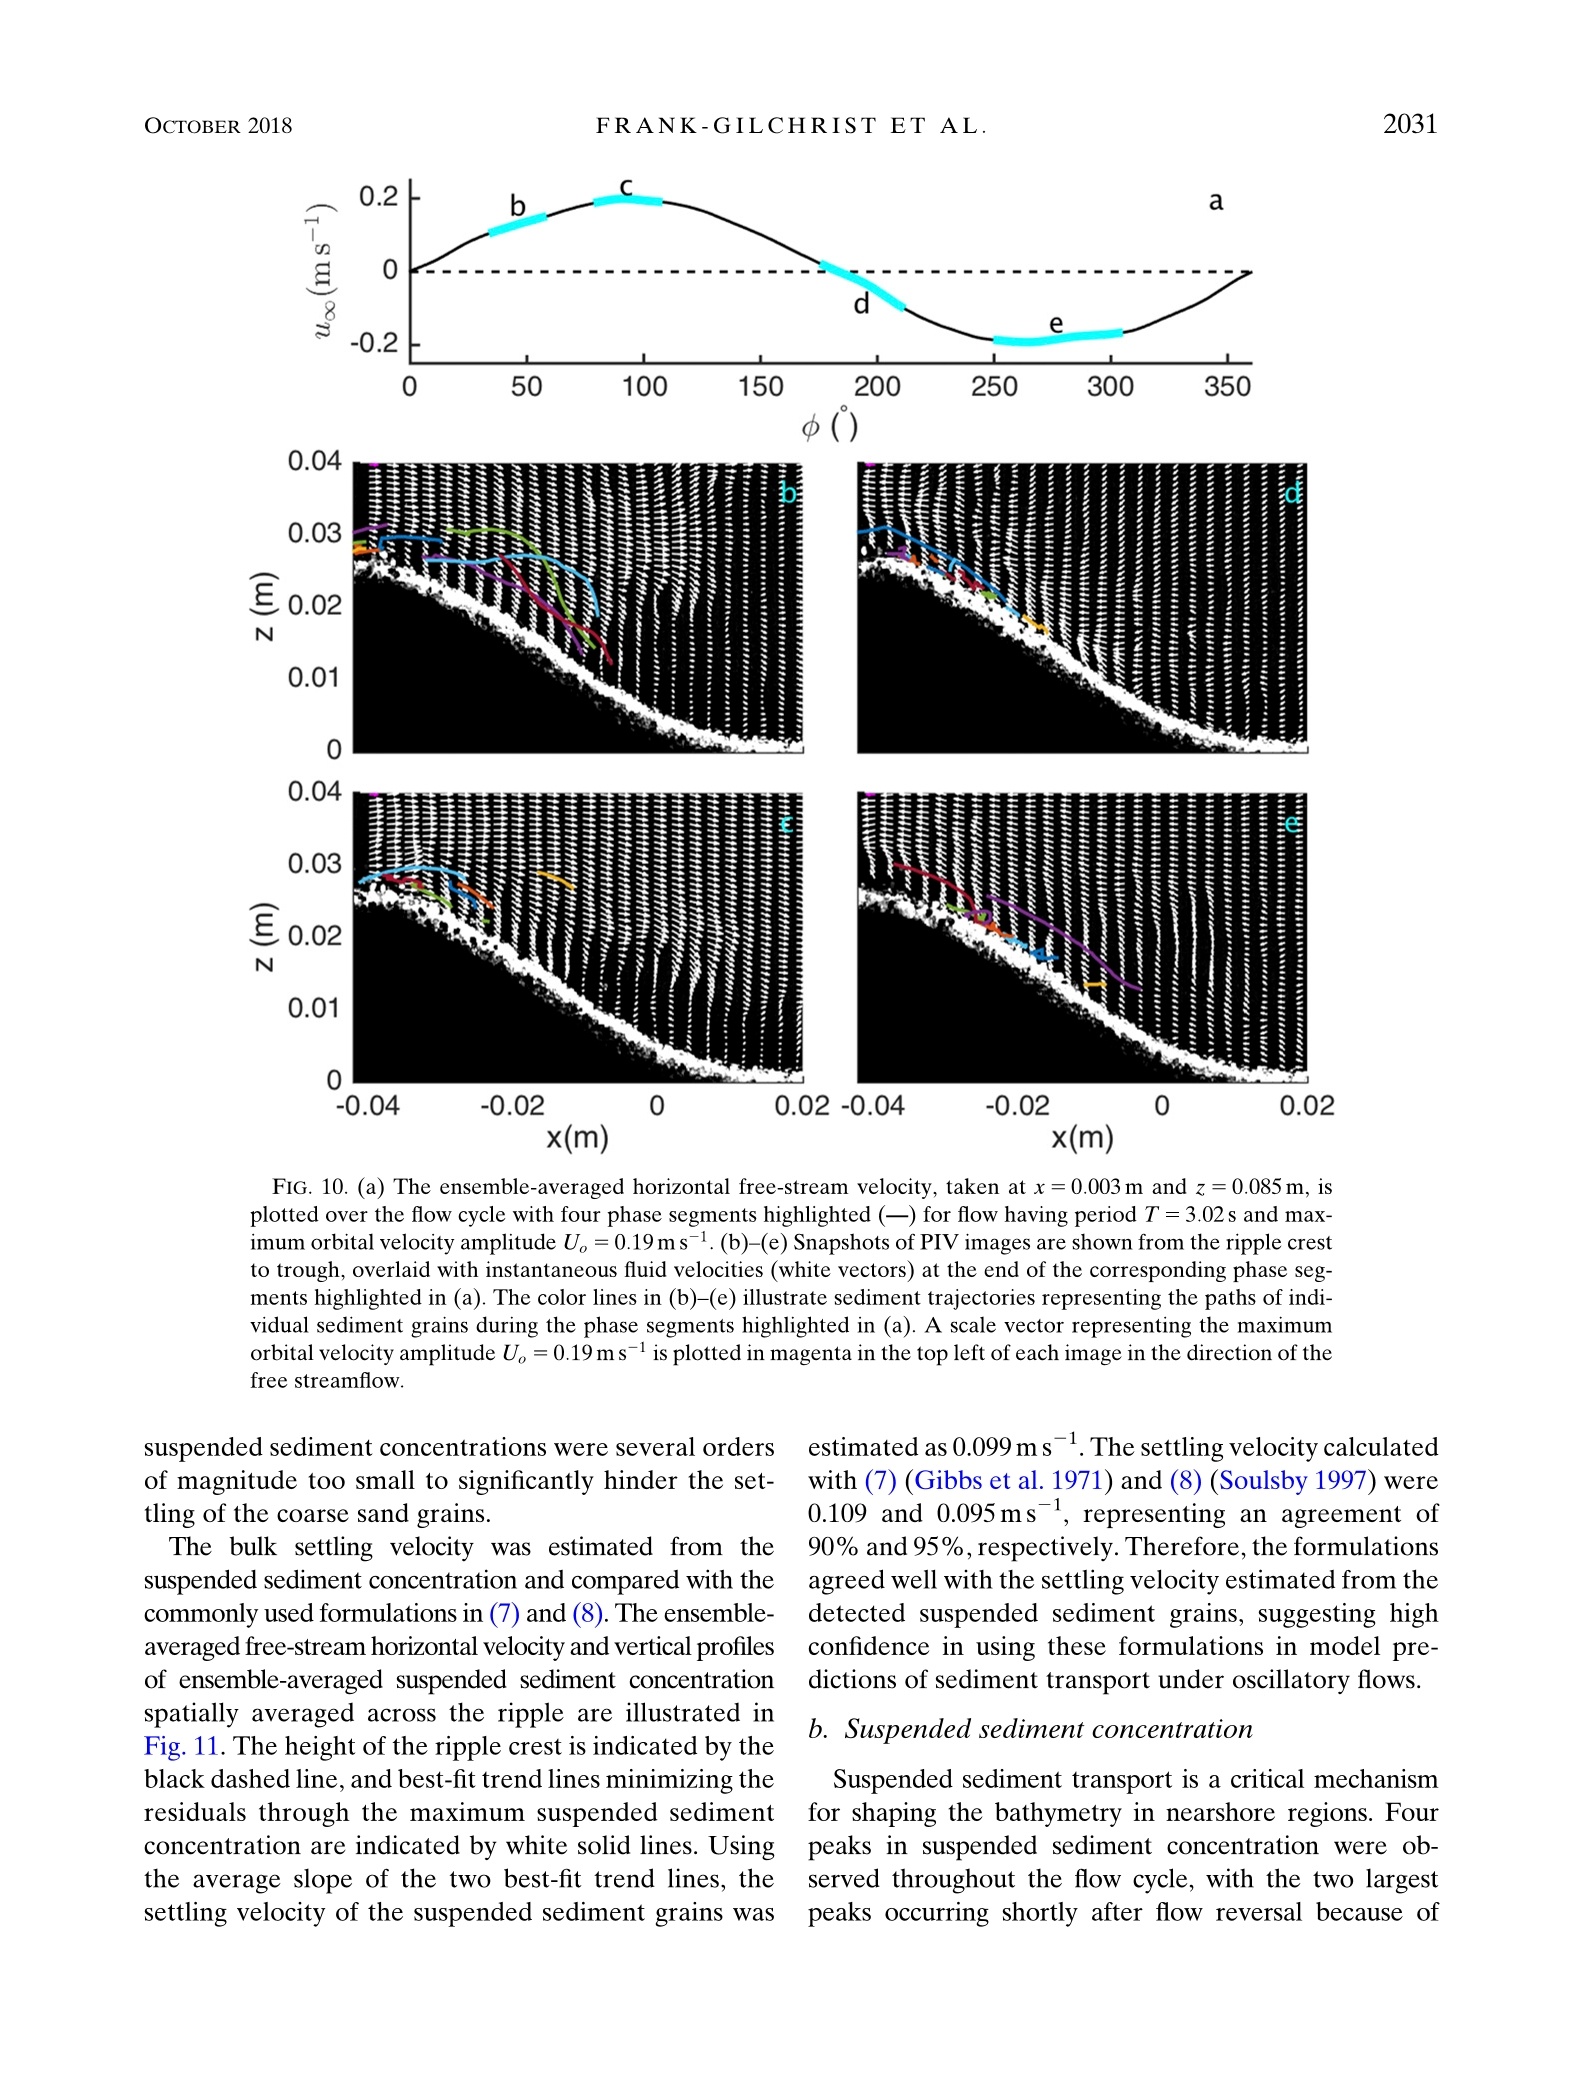
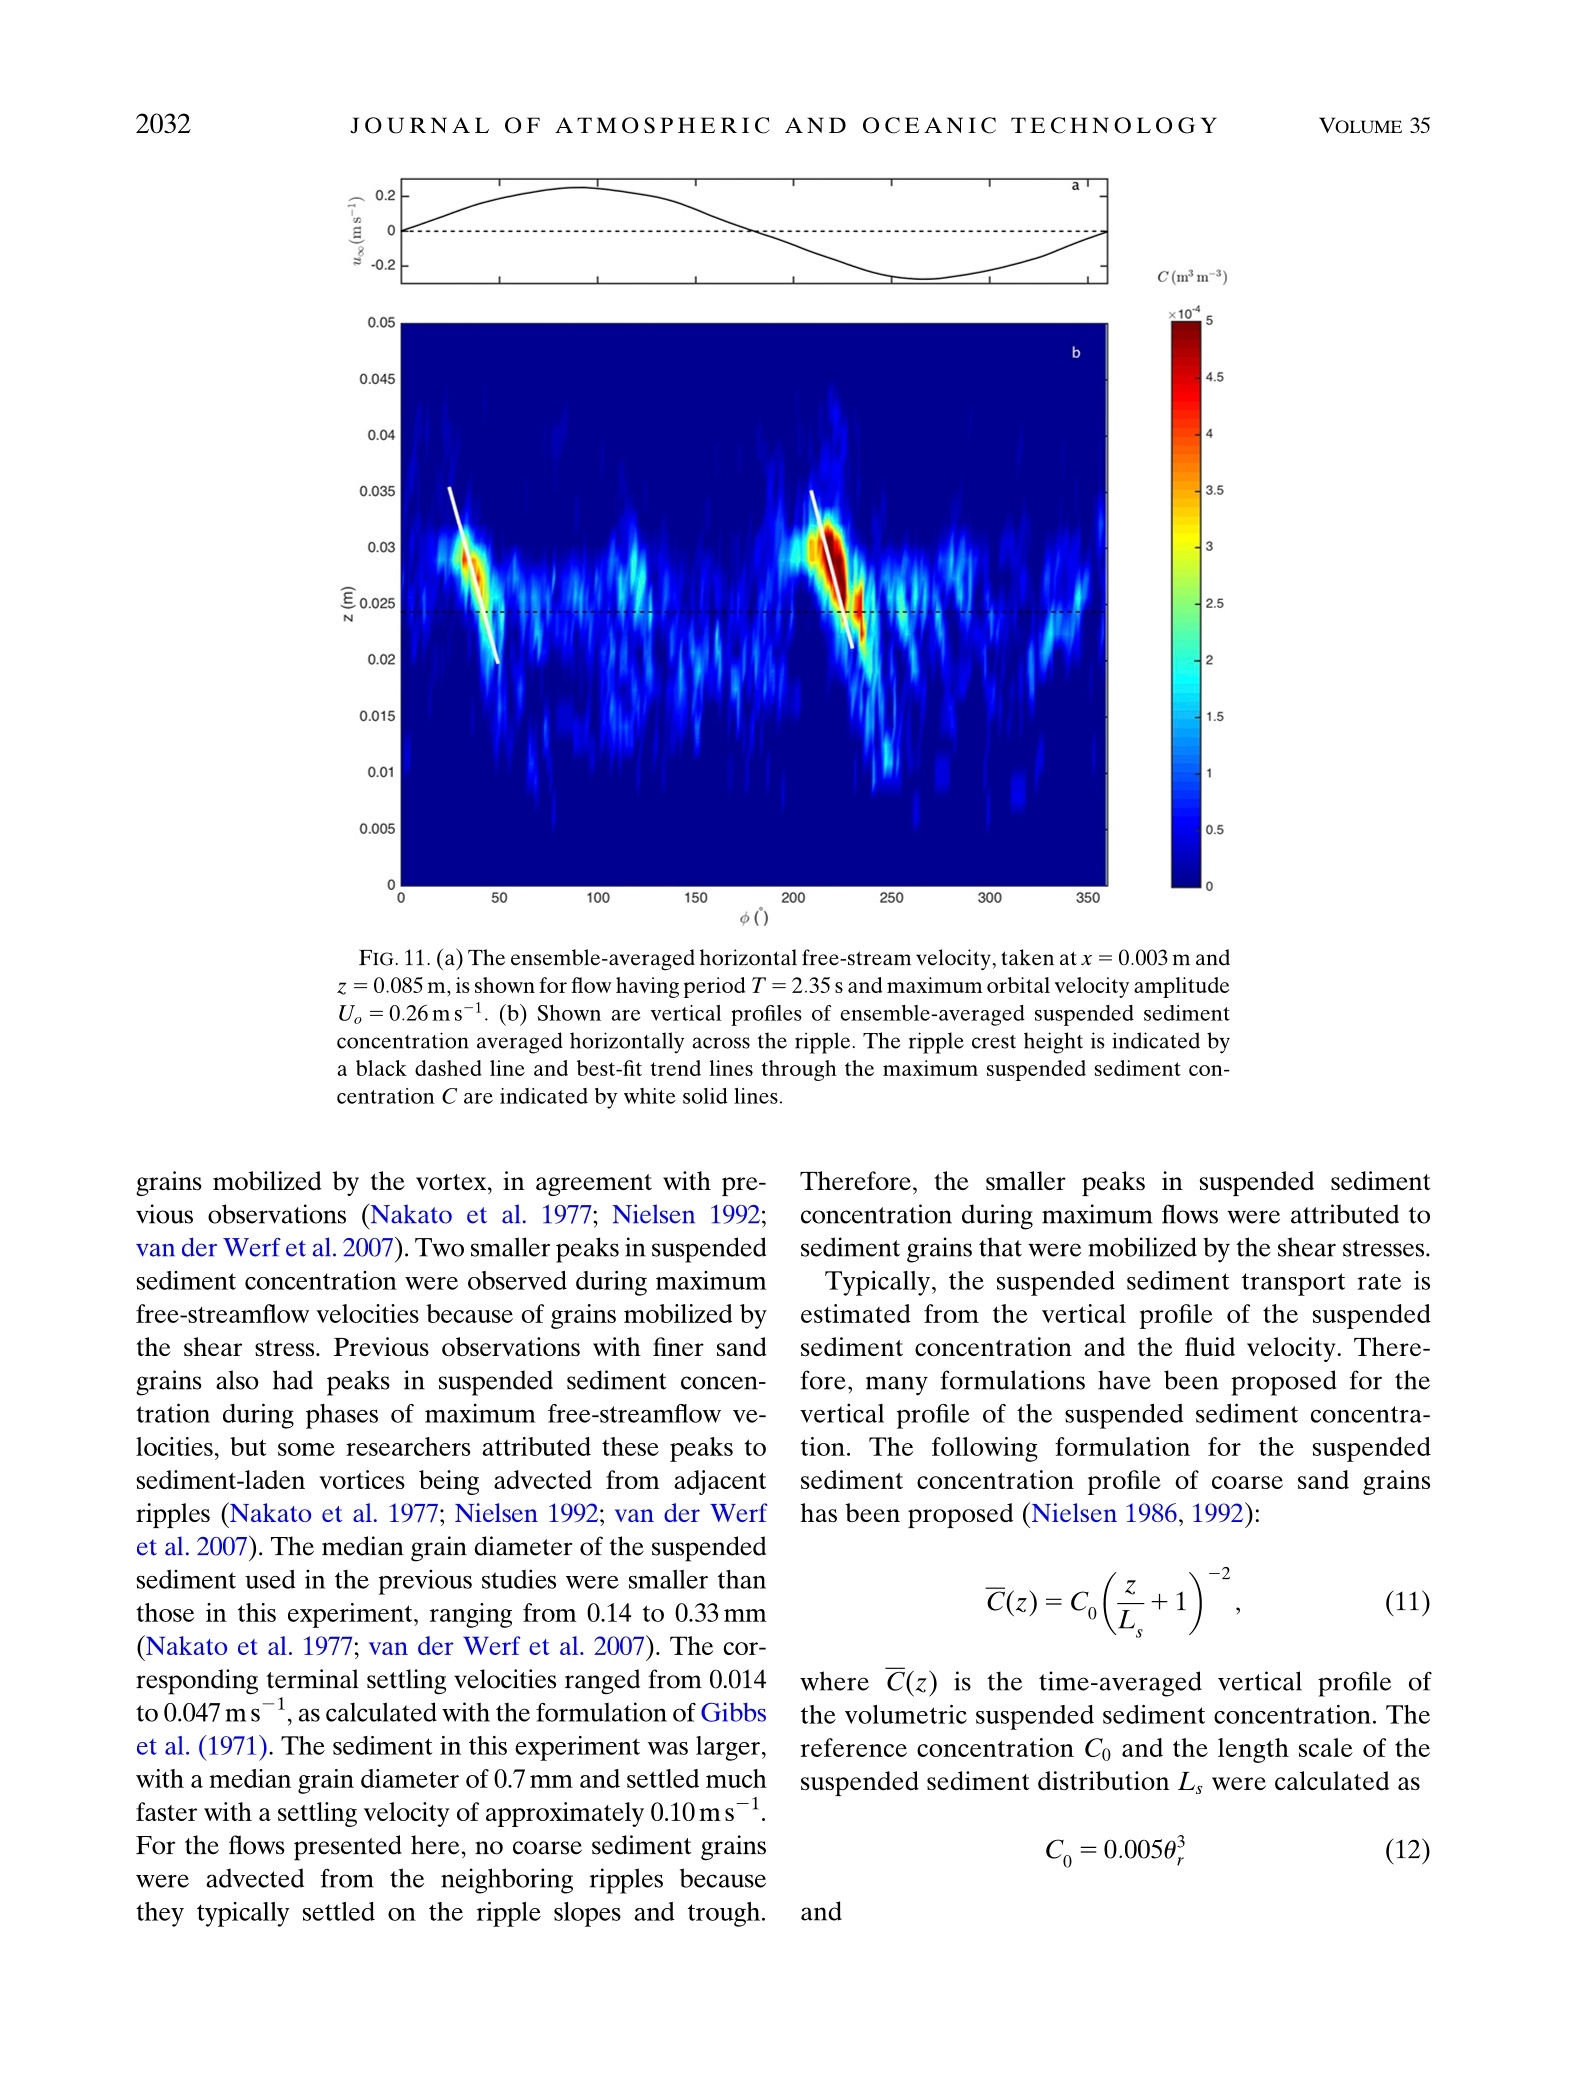
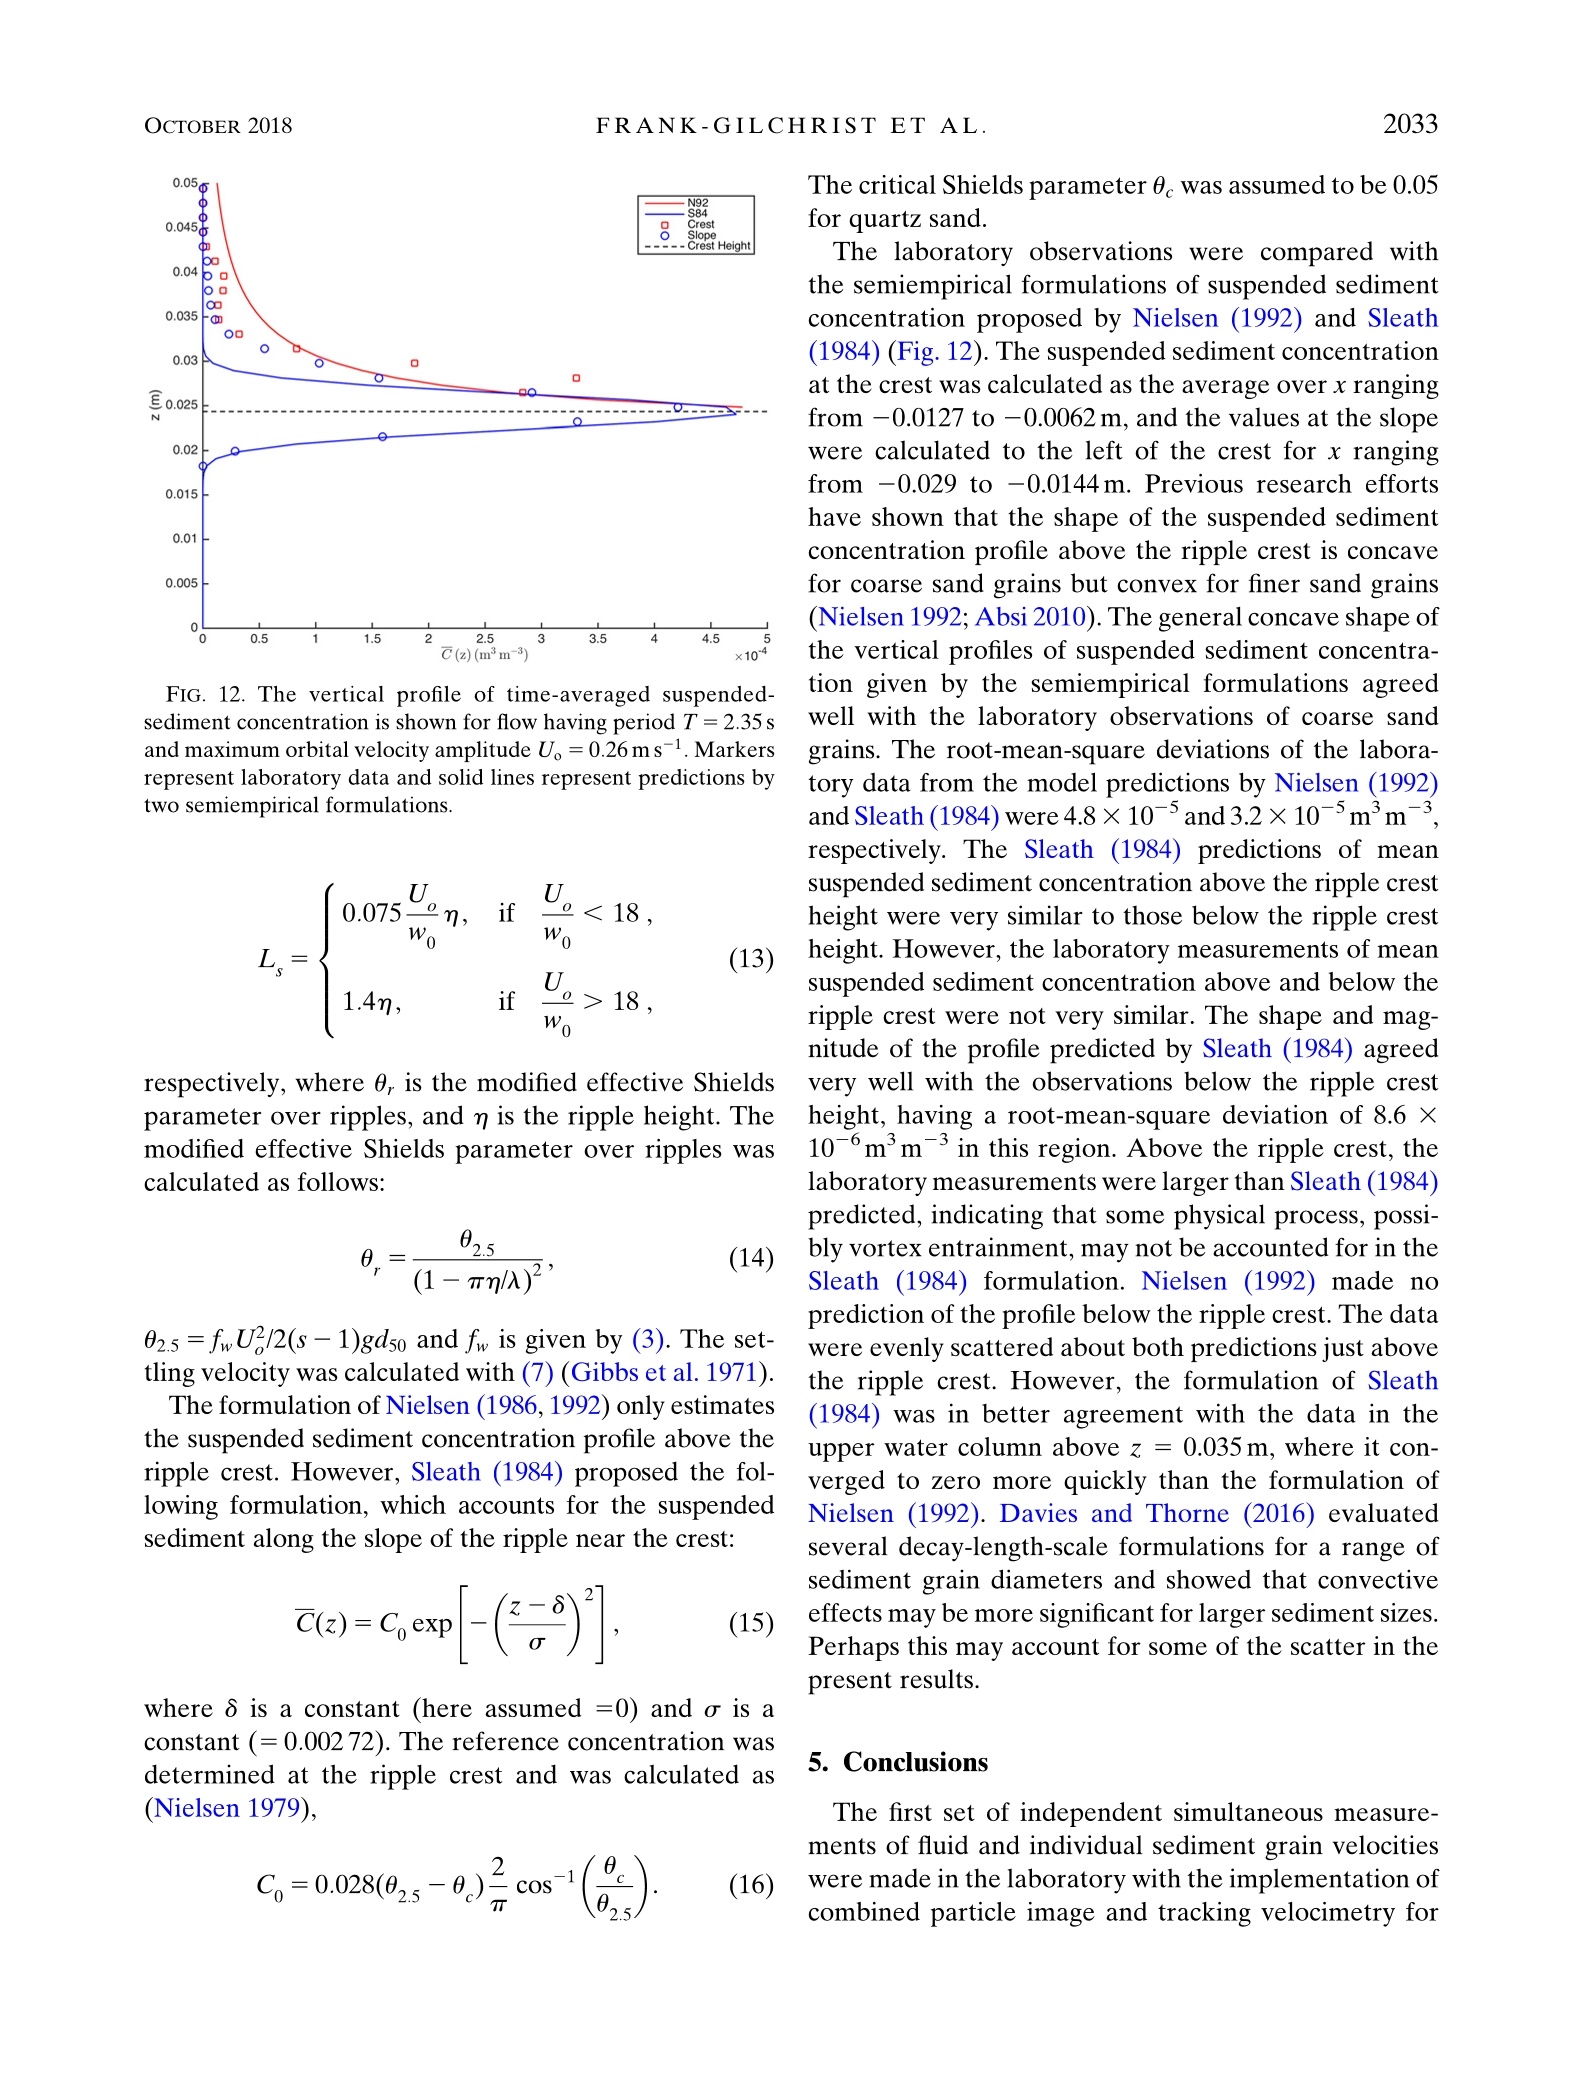
2019FRANK-GILCHRISTETA L.OCTOBER 2018 2020JOURNALOFATMOSPHERICANDOCEANIC TECHNOLOGYVOLUME 35 and oInvestigation of Sand Ripple Dynamics with Combined Particle Imageand Tracking Velocimetry DONYA P.FRANK-GILCHRIST National Research Council Postdoctoral Associate, U.S. Naval Research Laboratory, Stennis Space Center, Mississippi ALLISON PENKO AND JOSEPH CALANTONI Marine Geosciences Division, U.S. Naval Research Laboratory, Stennis Space Center, Mississippi (Manuscript received 30 March 2018, in final form 22 July 2018) ABSTRACT Accurately assessing the response of sediments to oscillatory flows requires high-resolution fluid velocityand sediment transport measurements at the fluid-sediment interface. Fluid and sediment grain velocitieswere measured simultaneously with combined particle image and tracking velocimetry under oscillatory flowsover movable sand ripples. Three high-speed cameras equipped with varying optical filters were used todistinguish between fluorescent fluid tracers and the grains, from which the fluid and grain velocities weredetermined, respectively. Individual grains were tracked during transport to determine velocities and tra-jectories. Sediment grains were first mobilized by a vortex impacting the bed during flow reversal andsuspended into the water column just prior to vortex ejection from the ripple crest, similar to previous ob-servations. During phases of maximum flow velocity, additional grains were mobilized by the shear stress andwere subsequently suspended. The flow reversed and similar observations were made in the opposite di-rection. Consequently, four peaks in suspended sediment concentration were observed throughout the flowcycle, consistent with previous observations. However, some previous researchers attributed peaks insuspended sediment concentration occurring during phases of maximum flow velocity to sediment-ladenvortices that were shed from adjacent ripples. The measured sediment grain velocities were of similar mag-nitude and phase to the near-bed fluid velocities when the grains were being advected with the flow. Mea-surements of suspended sediment concentration agreed well with semiempirical formulations having anaverage root-mean-square deviation of approximately 4×10-mm-. Predictions of settling velocity alsocompared well with the laboratory estimates, agreeing to within 90%. 1. Introduction Sand ripples enhance suspended sediment transportand wave energy dissipation in the near shore. Hence,much research effort has focused on understanding thehydrodynamics and evolution of these ripples in coastalregions through field, laboratory, and numerical stud-ies (e.g., Bagnold and Taylor 1946; Blondeaux et al.2004; Faraci and Foti 2002; Doucette and O'Donoghue2006; Charru et al.2013).Typically, small-scale rippleshave wavelengths of 10-100 cm and heights of 1-10 cm(Traykovski et al. 1999; Hurther and Thorne 2011). Denotes content that is immediately available upon publica-tion as open access. ( Corresponding author: A llison P enko, code7434@nrlssc.navy. mil ) ( DOI: 1 0.1175/JTECH-D-18-0054.1 ) Laboratory and field efforts have shown that the hy-drodynamics over small-scale ripples are dominatedby the generation and ejection of turbulent coherentstructures (i.e., vortices) (e.g., Blondeaux et al. 2004;Davies and Thorne 2005). The velocities near the ripplecrest may be up to 50% larger than the free-stream ve-locity with a phase lead of up to 108° ahead of the freestreamflow due to vortex formation (e.g., Stachurska andStaroszczyk 2016). The sediments used in these experi-ments range from fine (Nakato et al. 1977; Nichols andFoster 2007; Hurther and Thorne 2011; Stachurska andStaroszczyk 2016) to medium (van der Werfet al. 2007) tocoarse sand (Garcia et al.2002). Suspended sediment ispredominantly located very near the bed, typically within afew ripple heights of the ripple crest (van der Werf et al.2007). The average suspended sediment concentrationprofile above the ripple crest may be approximated withexponential (Sleath 1984; van der Werf 2006) or power-law ( ◎ 2018 American Meteorological So c iety. For information regarding reuse of this content and g eneral copyright information, consult the AMS Co p yright P oli cy ( www.ame ts o c . org / PUBSReuse L ice n s e s). ) formulations (Nielsen 1992). The concentration decaylength may also be calculated as a function of the rippleheight (Nielsen 1986, 1992; van der Werf 2006). Three to five peaks in suspended sediment concentra-tion have been observed throughout the flow cycle. Thestrongest peaks occur just after flow reversal associatedwith vortex ejection, with smaller peaks occurring later inthe flow cycle, which some attribute to sediment grainsbeing advected by vortices shed from neighboring ripples(Nakato et al. 1977; Nielsen 1992; van der Werf et al.2007). Although sediment transport in oscillatory flowshas previously been correlated with the Shields parame-ter (Shields 1936; Grant and Madsen 1979; van der Werf2006), laboratory experiments demonstrate that ripplesmay persist even when the critical value of the Shieldsparameter for sheet flow is exceeded (Nichols and Foster2009). In these experiments, the Sleath parameter wasfound to have a significant effect on ripple morphology.The ripple profile flattened only after the Sleath param-eter exceeded the critical value for plug flow of 0.1. Numerical models have also been used to assess thehydrodynamics and sediment transport over ripples un-der oscillatory flows. The range of models employed in-clude direct numerical simulations (Scandura et al.2000;Shimizu et al. 2001; Bhaganagar and Hsu 2009; Finn et al.2016), large-eddy simulations (Chang and Scotti 2004;Zedler and Street 2006), turbulence closure modelssolving the Reynolds-averaged Navier-Stokes equations(Andersen 1999; Fredspe et al. 1999; Eidsvik 2004), anddiscrete vortex models (Hansen et al. 1994; Malarkey andDavies 2002). A mixture theory model has also beendeveloped that treats the fluid and sediment as a contin-uum of fluid having varying density and viscosity (Penkoet al.2013).The numerical results have also shown thatwave energy dissipation is enhanced over ripples (Barret al. 2004) and that the hydrodynamics over ripples areinfluenced by vortex formation and ejection (Zedler andStreet 2006; Penko et al. 2013). While these models pro-vide high-resolution information on small-scale bottomboundary layer processes, more detailed experiments areneeded to validate these numerical models to improvepredictive capability of sediment transport over ripples. Particle image velocimetry (PIV) has provided de-tailed measurements of hydrodynamics in the labora-tory for the past several decades (Adrian 1991). PIV hasbeen used to measure fluid velocities and fluid-sedimentinteractions within the bottom boundary layer over flatbeds (Nezu and Azuma 2004; Campbell et al. 2005;Frank et al. 2015a). PIV has also been used to measurefluid velocities and bedform morphology over rippledbeds (Garcia et al. 2002;O'Donoghue et al. 2006; vander Werf 2006; Nichols and Foster 2007; Rodriguez-Abudo et al. 2013). However, there are some limitations to standard PIV techniques that may inhibit measurementsat the fluid-sediment interface. Intense laser light re-flections from the high sediment concentrations at the bedreduce the contrast of the near-bed fluid tracers from thebackground, making the tracers indistinguishable. The in-tense reflections also prohibit the calculation of fluid ve-locities near the fluid-sediment interface, specificallyduring sediment mobilization and entrainment into thewater column, which are important stages for sedimenttransport analyses (Nichols and Foster 2007). As a possiblesolution, the laser may be operated in low-power mode toreduce the strong reflections at the bed and improve ve-locity resolution (Rodriguez-Abudo et al. 2013). However,while reducing the intensity of the laser light may improvethe quality of the image at the fluid-sediment interface, ity deSTASSpotentially decreases the image quality in the water col-umn and therefore could increase flow measurement un-certainty. Additionally, when suspended sediment grainsare used as the fluid seeding agent, the observed fluid ve-locities may have an additional vertical component be-cause of the settling of the sediment grains that must beaccounted for (van der Werf 2006; van der Werf et al.2008). Low sampling frequency also may limit the abilityfor PIV to fully resolve turbulence parameters or to per-form particle tracking. Last, phase separation is challeng-ing when using standard PIV techniques. Separating thefluid from the sediment phase enables Lagrangian trackingof individual sediment grains from the onset of motion toentrainment to better relate mobility with near-bed hy-drodynamics (Radice et al. 2010; Frank et al. 2015a). Phase separation from PIV measurements of two-phaseflows has been attempted using several methods such asobserved differences in intensity and size of scattered lightby each phase (Khalitov and Longmire 2002; Zhang et al.2008), differences in the color of the scattered light fromsuspended particles and fluorescent seeding tracers (Hassanet al. 1993; Deen et al. 2000; Garcia et al. 2002;Yang et al.2011), differences in the size of particles (Gui and Merzkirch1996; Nezu and Azuma 2004; Noguchi et al. 2008), usinga two-dimensional median filter (Kiger and Pan 2000),using spatial frequency and correlation peak properties(Delnoijet al. 2000), and through filtering and subtractionbetween consecutive frames (Radice et al. 2010). Theseefforts included the measurement of bubbles through aliquid, solid particles in air, and solid particles in liquids. Within the field of sediment transport, phase separa-tion of sediment grains from fluid tracers has been per-formed in unidirectional flows based on the difference insize between the grains and tracers (Nezu and Azuma2004; Muste et al. 2005; Noguchi et al. 2008), the intensityand size of scattered light by each phase (Tapia et al.2006), and through filtering and subtraction betweenconsecutive frames (Radice et al. 2010). In oscillatory flows, mobile sediment grains near the bed have beendistinguished from fluid tracers through filtering and sub-traction between consecutive frames (Frank et al. 2015a)and by seeding the fluid with fluorescent tracers (Garciaet al. 2002; Admiraal et al. 2006). Filter techniques mayhave high uncertainty particularly for images with lowcontrast and are limited by the sampling frequency.Seeding the fluid with fluorescent tracers enables a clearerdistinction between the fluid tracers and sediment grains,significantly reducing the effects of strong reflections nearthe bed, while improving data quality throughout thewater column (Pedocchi et al.2008). Particle tracking velocimetry (PTV) determines thelocation of identified dispersed particles in subsequenttime steps in order to estimate the particle velocities andtrajectories. The velocities and trajectories of individu-al sediment grains within the bottom boundary layercould provide additional information regarding the fluidforces responsible for initiating sediment motion, aswell as how and where the sediment grains are trans-ported, leading to more accurate predictions of larger-scale sediment transport phenomena such as beacherosion. Several particle tracking algorithms have beenproposed to track dispersed particles in a variety ofmultiphase flows including the nearest-neighbor ap-proach (Papantoniou and Dracos 1989; Malik et al. 1993;Crocker and Grier 1996), two-frame match probability(Baek and Lee 1996), three-frame minimum accelera-tion (Ouellette et al. 2006), four-frame minimum changein acceleration (Malik et al. 1993;Dracos 1996),and themodified four-frame minimum acceleration predictivetracking algorithm (Ouellette et al. 2006). Additionalparticle tracking methods have been developed basedon discrete relaxation (Ohmi and Li 2000), Kalman fil-ters (Takehara et al. 2000), velocity gradient tensors(Ishikawa et al. 2000), correlations (Saga et al. 2001),hybrid adaptive schemes (Kim and Lee 2002), poly-nomial regressions (Biwole et al. 2009), probability hy-pothesis density filters (Wood et al. 2012), and morerecent shake-the-box routines (Schanz et al. 2016).Though not the most sophisticated algorithm, thenearest-neighbor technique is applicable to a large rangeof flows including oscillatory and large-scale flows and iscomputationally inexpensive (Li et al. 2013). However,connecting particle locations to long trajectories maynot be possible if the particles are identical, if particlemovements cannot be predicted with a model, or if theparticle displacement between images is large relative tothe interparticle spacing (Papantoniou and Dracos 1989;Crocker and Grier 1996). A detailed description ofseveral PTV algorithms was provided by Dracos (1996)and a brief updated overview reported by Cierpkaet al. (2013). Many of these existing particle tracking algorithmshave been successfully applied to unidirectional flows anddiffusive flows with no imposed free stream. Trackingsediment grains in oscillatory flow presents an additionalchallenge as sediment grains change direction with flowreversal.Moreover, the phase lead of near-bed velocitiesahead of the free stream causes the flow to reverse atdifferent times throughout the water column, furthercomplicating the assessment. Individual sand grains havebeen tracked over a fixed rippled bed (Chu et al. 2012)and sand grains have been distinguished from fluorescenttracers over a moveable rippled bed (Garcia et al. 2002):however, Lagrangian tracking of individual sedimentgrains over a moveable rippled bed has not been pre-viously performed. High-resolution observations of fluid-sediment in-teractions in oscillatory flows are needed to further de-velop theoretical formulations and validate numericalmodels to better predict the morphodynamics within thebottom boundary layer. Presented here are simulta-neous laboratory measurements of fluid and sedimentgrain velocities in oscillatory flows with PIV and PTV.respectively. Fluorescent seeding tracers were used todistinguish the fluid tracers from the sediment grainsIndependent measurements were made of the fluid andsediment grain velocities during grain mobilization andtransport over moveable rippled sediment beds. PTVwas used to determine the velocities and trajectories ofsediment grains. The sediment in the water column de-tected by the PTV algorithm was then used to estimatethe suspended sediment concentration and bulk settlingvelocity. The estimated suspended sediment concen-tration and settling velocities were then compared withseveral semiempirical formulations. 2. Experimental setup The experiment was conducted in the small-oscillatoryflow tunnel located at the U.S. Naval Research Labora-tory, Stennis Space Center, Mississippi. The flow tunnel isdescribed in detail by Calantoni et al. (2013). The testsection is 2 m long with a flow cross section of 0.25 m ×0.25 m above a 0.30-m-deep sediment well. Oscillatoryflow is generated with a piston and flywheel assembly.The facility is capable of generating symmetric or asym-metric oscillatory flows with periods T ranging from 2.3 to10 s and maximum orbital velocity amplitudes U,rangingfrom 0.05 to 0.6ms-.The sediment well in the test sec-. tion of the flow tunnel was filled with well-sorted, coarsequartz sand with a median grain diameter of d5o =0.7 mmand density of p=2650kg m3. The bed was initiallymanually planed. Oscillatory flow with a period of 2.35sand a maximum orbital velocity amplitude of 0.26ms-1 was then driven over the planed bed to generate ripples.The ripples reached equilibrium after approximately 4 hwhen they were observed to be two-dimensional withequal ripple wavelengths and heights in the test section.At this stage, measurements of fluid and sediment grainvelocities were made. Subsequently, the flow was reducedto a maximum orbital velocity amplitude of 0.19ms-1and period of 3.02 s. The reduced flow resulted in smallersediment grain displacements between time steps,thereby facilitating more accurate determination of thesediment grain trajectories throughout the flow cycle.The flow was reduced for approximately 1 min to collectone dataset for particle tracking analysis and was in-creased immediately afterward. Therefore, the ripplesdid not have time to adjust to the slower flow. Only thefaster flow that was in equilibrium with the ripples wasused to estimate the suspended sediment concentrationand compared with the theoretical formulations. Thewater temperature in the flow tunnel was observed to bebetween 20° and 21°C. The PIV system includes three high-speed, 1-megapixelcameras and a 100mJ dual-cavity neodymium-dopedyttrium-aluminum-garnet (Nd:YAG) laser. The flow wasseeded with neutrally buoyant hollow glass spheres coatedwith Rhodamine B having a density of 1050kg mandmedian diameter of 10 um. The fluorescent tracers ab-sorbed the 532-nm laser light and reemitted at a higherwavelength of 584 nm. Optical long-pass filters with a cut-on wavelength of 550 nm were installed on cameras A andC, set up to measure stereo PIV of the two-dimensional,three-component fluid velocities (Fig.1). The third high-speed camera (B in Fig. 1) was equipped with a neutral-density filter to reduce the intensity of the laser lightobserved at the sensor. The third camera was dominatedby the higher-intensity light scattered by the sediment, notthe fluid tracers, allowing for sediment grain tracking.Overlapping, simultaneously recorded images from thethree cameras provided independent sediment grain andfluid velocities in the same field of view at high temporal(100Hz) and spatial (~0.8mm) resolution. Image pairswere collected at 100 Hz with a laser pulse separation of2000 us between the paired images over an 11 cm ×11 cmfield of view. The laser light sheet was approximately 2 mmthick in the cross-tunnel direction. Datasets were collectedin bursts of 27.28 s limited by the internal storage capacityof the cameras. The LaVision flow processing software DaVis wasused to calibrate the images, improve image contrast,normalize the light intensity, and calculate the threecomponents of fluid velocity from the images capturedby cameras A and C (Fig. 1). The PIV images werecalibrated with a two-level 10 cm × 10cm black cali-bration plate with white dots spaced 1 cm apart. The lid FIG. 1. The PIV system is focused on the rippled sediment bedin the test section of the S-OFT at the U.S. Naval ResearchLaboratory. of the tunnel was removed,and the calibration plate washung in the water in the intended plane of the lasersheet. The three high-speed cameras captured imagesthat were reconstructed based on the preprogrammeddimensions of the calibration plate in DaVis. The imageswere preprocessed to improve image contrast betweenthe fluorescent tracer particles and the background bysubtracting a sliding minimum intensity from each im-age. The image intensity was then normalized with asliding minimum-maximum filter to homogenize theintensities of the fluorescent tracer particles. First, asliding minimum was subtracted from the image to re-move the local background intensity level. Next, thelocal maximum intensity was determined over thespecified window, as well as a global maximum intensityover 10 times the window size. The image was thenmultiplied by the ratio of the global maximum to localmaximum to normalize the intensity of the light re-emitted by the fluorescent tracers (LaVision 2014).Fluid velocities were determined by stereo cross correlation of the PIV image pairs using a round in-terrogation window with an initial diameter of 64 pixelshaving 50% overlap by diameter.Multiple passes wereperformed with a decreasing interrogation window, re-sulting in a final window diameter of 16 pixels. Spuriousvelocity vectors were removed with a median filter andreplaced with the average of the nearest neighbors. PTV was performed by first dynamically masking therippled bed. Next, the images were binarized to distin-guish between the light scattered by the sediment grainsand the surrounding background. Following binarizationof the images, a particle tracking algorithm (Crocker andGrier 1996) was implemented (Blair and Dufresne 2016)to bandpass filter the images, detect individual sedimentgrains by locating contiguous regions of high intensity,and analyze grain locations between image pairs ofsubsequent time steps to determine the new location.The time-resolved grain locations were then linked todetermine the trajectories of the identified grains.Thesediment grain velocities were calculated by dividingthe change in position by the time step between thepaired images. The PTV algorithm of Crocker andGrier (1996) was chosen because it was easily adapt-able to oscillatory flows, could handle tracking in anydirection, and did not require a constant time stepbetween images. The sediment bed elevation and ripple profiles at thecentimeter-meter scale were measured with the BedLaser Surface Tracking (BLAST) system. The BLASTsystem consists of two 520 nm, continuous wave (CW),fan beam lasers that project a ~1-m laser line on thesediment bed in the along-tunnel direction. Two digitalsingle-lens reflex (DSLR) cameras captured images andvideo of each of the laser lines projected on the bed. OneCW laser and camera with a 10-mm fish-eye lens weretranslated across the width of the small-oscillatory flowtunnel (S-OFT) with a high-precision stepping motor in0.5-mm increments, while the camera captured an imageof the laser line at every step. Each image size is 5184 ×3456 pixels, resulting in a 2-6 pixels per millimeterres-olution. The sediment bed elevation was scanned beforeand after each experiment. The second DSLR cameracaptured high-definition video (1080 pixels) at 30 framesper second of sediment bed elevation profiles in thealong-tunnel direction at the center of the test sectionover several flow cycles. The BLAST measurementswere used to determine the ripple wavelength and rippleheight because the ripple wavelength was approximately0.02 m longer than the PIV field of view. Additionally,the BLAST measurements were used to determine theripple profile and assess bedform evolution as they wereless sensitive to suspended sediment and providedmeasurements over longer time segments than the PIV. 3. Results Ripples were generated from an initially flat sedimentbed with regular oscillatory flow having period T =2.35 sand maximum orbital velocity amplitude U。=0.26msThe flow was slightly skewed and asymmetric in the neg-ative direction, having values of skewness and asymmetryof -0.07 and -0.02, respectively (Elgar et al. 1988). Theflow statistics were calculated from the free-stream ve-locity time series measured at x=0.003 and z=0.085above the bed,more than three ripple heights away fromthe ripple trough to avoid wake effects of the bedform.The measured period was calculated as the average timebetween negative and positive zero crossings, and themaximum orbital velocity amplitude was calculated as thestandard deviation of the velocity time series multipliedby √2. The resulting ripples had wavelengths of 0.13 m andheights of 0.025 m as measured by the BLAST system. a.PIV and PTV The near-bed velocity field above the ripple is veryimportant for sediment transport, as this is the re-. gion where fluid forces directly impact the sediment bedto initiate sediment motion. Time series of ensemble-averaged free-stream horizontal velocity and snapshotsof the velocity field across the ripple are shown forflow having T=2.35s and U。=0.26ms-1(Fig. 2). Thehorizontal free-stream velocity was ensemble averagedover 11 flow cycles, during which the ripple migratedapproximately 1.2 mm. The migration rate was deemedtoo small to affect the ensemble average. The PIV im-. ages of the ripple displayed (Figs. 2b-e) correspond tothe phases indicated (Fig. 2a). The sediment grain andfluid velocities are indicated by cyan and white vectors,respectively. The maximum orbital velocity amplitude isindicated as a scale vector in magenta in the top left ofeach image in the direction of the free streamflow. Thefluid velocity field was estimated with a spatial resolu-tion of ~0.8 mm, for a total of 147 profiles across thefield of view. However, for better visualization onlyevery third vector is displayed, resulting in 39 profilesdisplayed across the ripple. The vectors were also downsampled in the vertical to display only every third vector Shortly after the negative-positive flow reversal, theflow was accelerating to the right (Fig.2b). The near-bedflow velocity above the ripple crest was approximately0.10mslarger than the free-stream velocity becauseof flow constriction over the ripple crest. Sedimentgrains mobilized during flow reversal were advectedover the ripple crest, suspended into the water column,and deposited on the ripple slope (Fig. 2b). Sub-sequently, additional sediment grains were suspendedduring maximum positive flow (Fig. 2c) and advected FIG. 2. (a) The ensemble-averaged horizontal free-stream velocity, taken at x=0.003m and z=0.085 m, isplotted over the flow cycle with four phases indicated (asterisks) for flow having period T =2.35 s and maximumorbital velocity amplitude U。=0.26ms-1.(b)-(e) PIV images of the ripple are overlaid with instantaneous fluidvelocities (white vectors) and instantaneous sediment grain velocities (cyan vectors) at the corresponding phasesindicated in (a). A scale vector representing the maximum orbital velocity amplitude U,=0.26ms-is plotted inmagenta in the top left of each image in the direction of the free streamflow. across the ripple crest. Flow separation was observedalong the ripple slope and in the trough. Velocity vectorsindicated the formation of a vortex in the flow separa-tion region (Figs.2c,e). In Fig. 2d, the flow had just re-versed from positive to negative (right to left). Sedimentgrains mobilized during flow reversal were being ad-vected to the left over the ripple crest and deposited onthe opposite slope. In this trial, more sediment grainswere suspended during flow reversal than during peakvelocity (note the greater number of suspended sedi-ment grains in Figs. 2b and 2d than in Figs. 2c and 2e). The phase lead between near-bed and free-streamhorizontal velocities was determined by assessing therelative timing between flow reversals (van der Werfet al. 2007). The near-bed velocities were taken at aheight of 0.028 m. A maximum phase lead of approxi-mately 50° was observed along the ripple slope wherethe vortex was generated during flow reversal (Fig. 3). Aphase lead of 50° is significantly larger than the 10°-21°expected for fully turbulent flow over a rough flat bed(O'Donoghue and Wright 2004; Foster et al. 2006;Terrile et al. 2006; Frank et al. 2015b). Although theobserved phase lead of 50° is smaller than the phase leadof 108° (van der Werf et al. 2007) observed for moreenergetic flows with larger periods and velocities over ripples with finer sediments, the location of the maxi-mum phase lead along the ripple slope was in goodagreement with previous observations. The maximumphase lead was located on the left side of the ripple for awave phase of 0°(Fig. 3b) and the right side of the ripplefor a wave phase of 180° (Fig. 3c), suggesting that thelarge phase lead of the near-bed fluid velocities ahead ofthe free stream was predominantly due to vortex gen-eration, which develops on opposite sides of the rippledepending on the flow direction, consistent with pre-vious observations (van der Werf et al.2007). To further analyze the suspended sediment transport,the percentage of suspended sediment grains movingwith a particular grain velocity was assessed (Fig. 4). Thesediment grain velocities were calculated with the grainlocations identified by the PTV algorithm between in-dividual images of each pair having a time step of2000 us. The horizontal and vertical sediment grain ve-1lOocCities were then ensemble averaged over 11 wave cy-cles. The ensemble-averaged horizontal sediment grainvelocities had a maximum value of 0.35ms-1 and aphase lead of between 40°and50°over the free stream atflow reversals,similar to the near-bed horizontal fluidvelocities. During the accelerating phase of the positiveflow (0°-40°), more than 80% of the suspended grains FIG. 3. (a) The time-averaged ripple profile was normalized by the ripple wavelength 入 andripple height n in the horizontal and vertical dimensions, respectively. Timing of (b) negativeto positive and (c) positive to negative flow reversals for near-bed velocities relative to free-stream velocities are shown along the ripple wavelength for flow having T =2.35 s and U。=0.26 ms. The wave phase ofor each flow reversal is also indicated. The corresponding phaselead values are indicated on the right vertical axes. had positive horizontal and vertical velocities, indicatingthat they had been picked up and were being advectedwith the flow upward over the ripple to the right.Starting at a phase of 45°, negative vertical grain veloc-ities suggest that the grains were beginning to settle tothe bed. The flow then reversed and analogous obser-vations were made in the opposite direction. b. Suspended sediment concentration The spatial and temporal variability of the volumetricsuspended sediment concentration were analyzed overthe ripple throughout the flow cycle. Additionally, theShields parameter, viscous shear stress, and vorticitywere calculated to determine the fluid mechanism sus-pending the sediment grains at flow reversal and peakflow. The quantity of suspended sediment grains de-tected with PTV was used to estimate the instantaneousvolumetric suspended sediment concentration C abovethe ripple. The volumetric suspended sediment con-centration was calculated in volume bins with areas of3.3 mm ×3.3 mm over the two-dimensional PIV field ofview and a depth of 2 mm in the cross-tunnel directiony based on the laser sheet thickness. The ensemble-averaged volumetric suspended sediment concentra-tion in each bin and at each time step C(x, z, t) was defined as the volume of sediment per unit volume ofwater. where n(x, z, t) is the number of sediment grains de-tected in each bin and at each time step, V, is the volumeof one sediment grain, and Vbin is the bin volume(21.78mm). The calculations were made with bins thatoverlapped by 50% to increase spatial resolution. Thebin volume was chosen to minimize errors in the esti-mated volumetric suspended sediment concentration(Simeonov et al.2015). The ensemble-averaged free-stream horizontal veloc-ity and the ensemble-averaged volumetric suspendedsediment concentration fields corresponding to eightphases of the flow are illustrated in Fig. 5. The free-streamvelocities and suspended sediment concentrations wereensemble averaged over 11 flow cycles. All suspendedsediment was located within one ripple height of thecrest. In Fig. 5b, the volumetric suspended sedimentconcentration over the ripple was minimized when theflow reversed from negative to positive. The volumetricsuspended sediment concentration was at a maximum inFig. 5c due to grains suspended shortly after flow reversal. FIG. 4. The ensemble-averaged (a) horizontal and (b) verticalsediment velocities for suspended sediment particles are shownfor flow having T =2.35 s and U。=0.26ms. The shaded colorsrepresent the percentage of suspended grains moving with a particular velocity at each phase illustrating a phase lag between the maximum volumetricsuspended sediment concentration and free-streamflowreversal. During the maximum positive free streamflow..(Fig.5d), additional sediment grains were suspended andsubsequently deposited on the ripple slope duringthe decelerating positive flow (Fig.5e). The flow re-versed (Fig. 5f) and similar observations were made inthe opposite direction. The time-averaged volumetricsuspended sediment concentration field over all 11flow cycles was fairly symmetric about the ripple crest(Fig. 6). Additionally, the suspended sediment wasvery localized near the ripple crest with very fewgrains detected above the ripple trough. To better understand the temporal variability of thesediment dynamics, the horizontal free-stream velocity,Shields parameter, volumetric suspended sediment trans-port rate, and volumetric suspended sediment concentra-tion ensemble averaged over 11 flow cycles are plottedin Fig. 7. The Shields parameter 0(t) was calculated usingthe ensemble-averaged horizontal free-stream velocity(Ribberink 1998). gravity of quartz sand, g is the gravitational acceleration,and d5o is the median grain size diameter.The wavefriction factor was calculated as (Swart 1974), where k, is the Nikuradse roughness (=2.5d5o), and A isthe orbital excursion amplitude [=U,T/(2r)]. The suspended sediment transport rate was definedas the volume flux of sediment per unit width of bedper unit time (e.g.,Drake and Calantoni 2001). The totalhorizontal Qtotx(t) and vertical totz(t) volumetricsuspended sediment transport rate throughout the flow.cycle were calculated by and respectively, where Abed is the laser illuminated, planarprojection of the ripple (=0.0002m); i and j arecounting variables; Nx is the total number of bins in thehorizontal dimension across the field of view; Nz is thetotal number of bins in the vertical dimension abovethe bed surface; u is the ensemble-averaged horizontalfluid velocity; and w is the ensemble-averaged verticalfluid velocity. The factor of 1/2 compensates for the 50%overlap so that sediment grains were not added twice.The volumetric suspended sediment concentration wascalculated from the number of sediment grains in thesame volume bins as previously described. The verti-cal sediment transport was very small relative to thehorizontal sediment transport (note the dotted line inFig. 7c). Pick up of the sediment grains was not ac-counted for because the near-bed region (within onegrain diameter) was masked out in the determinationof the suspended sediment concentration as the par-ticle tracking algorithm had difficulty identifying andtracking individual grains in this near-bed region. Thetotal suspended sediment concentration throughoutthe flow cycle (Fig. 7d) was calculated in a similarmanner with 0.5 FIG. 5. (a) The ensemble-averaged horizontal free-stream velocity, taken at x=0.003 m andz=0.085 m, isplotted over the flow cycle with eight phases (asterisks) for flow having period T=2.35 s and maximum orbitalvelocity amplitude U。=0.26ms-1. (b)-(i) The ensemble-averaged suspended sediment concentration C across theripple is shown at the corresponding phases indicated in (a). Four peaks in the horizontal suspended sedimenttransport and volumetric suspended sediment concen-tration were observed throughout the flow cycle (Fig. 7cand Fig. 7d, respectively). The two largest peaks occurred at flow phases of approximately 34° and 220° due to grainsmobilized during flow reversal subsequently suspendedinto the water column and advected over the ripple crest.The two largest peaks in suspended sediment transport logi(C)(m'm=) FIG. 6. The time-averaged suspended sediment concentration isshown for flow having T = 2.35s and U。= 0.26ms. were not symmetric for each half of the flow cycle.The peak in the negative direction was larger, possiblybecause of the slight skewness and asymmetry of the flowin the negative direction. The two smaller peaks, ob-served at 120° and 282°, occurred during maximum free-streamflow velocities and were similar in magnitude foreach half of the flow cycle. As would be expected for the vortex ripple regime, theShields parameter exceeded the critical threshold forsediment motion during maximum flow velocities, in-dicating that the shear stress was strong enough to mobi-lize the sediment during maximum flows. The two smallerpeaks in suspended sediment concentration occurring at120° and 282°were likely mobilized by the maximumshear stresses in each direction. However, the two largestpeaks in suspended sediment transport and concentrationindicate that more sediment grains were mobilized duringflow reversals, when the Shields parameter was well belowthe critical threshold, which suggests that the shear stresswas not responsible for mobilizing the sediment at flowreversal. The near-bed viscous shear stress (=-uou/oz,where u is the dynamic viscosity of water) across theripple also confirmed that the critical threshold of 0.05was only exceeded at phases of 120° and 282° during peakflow (Figs. 8c,e) and not during the other two peak-concentration events (Figs.8b,d). The vorticity was calculated with the method ofNichols and Foster (2007). Regions of strong vortic-ity were observed along the ripple slope at phasescorresponding to the two largest peaks in suspendedsediment concentration (Figs. 9b,d). Sediment grainswere first mobilized as bedload during vortex generationalong the ripple slope just prior to flow reversal. Thesediment grains were then transported as suspendedload over the ripple crest ahead of the vortex, which wasadvected when the flow velocities increased. The volu-metric suspended sediment transport peaks at phases34°and 220° indicate that more sediment grains weresuspended by vortex shedding following flow reversalthan by the shear stress during maximum flow velocities. FIG. 7.(a) The ensemble-averaged horizontal free-stream velocity,taken at x=0.003 m and z =0.085 m, is plotted over the flow cycle forflow having period T = 2.35 s and maximum orbital velocity amplitudeU。=0.26ms.Also plotted over the flow cycle are the (b) ensemble-averaged Shields parameter 0 with the critical threshold for incipientmotion (0.05) indicated by dashed gray lines, (c) suspended sedimenttransport rate Qtot, and (d) suspended sediment concentration C. Similar observations have been made in large-scalewave flume experiments (Nichols and Foster 2009). c. Sediment grain trajectories The trajectories of individual sediment grains were de-termined through Lagrangian tracking of identified sedi-ment grains throughout the flow cycle. Tracking grainsfrom the onset of motion to entrainment into the watercolumn better relates sediment mobility to hydrodynamicswithin the bottom boundary layer such that the fluid forcesmobilizing the grains can be determined and the dominantmode of sediment transport assessed. The sampling fre-quency of 100 Hz was not fast enough to resolve longtrajectories throughout the cycle for the flow with T =2.35s and U,=0.26ms. When grain displacement be-tween time steps was more than half the intergranularspacing of the suspended grains, grain positions becameconfused between images and the algorithm could notaccurately track the grains (Crocker and Grier 1996).A higher sampling frequency may have improved thetracking efficiency at high velocities. The oscillatory flowpresented additional problems when the flow accelerated, 0.2- b FIG.8.(a) The ensemble-averaged horizontal free-stream velocity,taken at x=0.003 m and z=0.085 m, is shownwith four phases indicated (asterisks) for flow having period T =2.35s and maximum orbital velocity amplitudeU。= 0.26ms .(b)-(e) The ensemble-averaged viscous shear stress is shown over the ripple at each phase in-dicated in (a), where markers (solid circles) represent detected suspended sediment grains. The critical thresholdfor incipient motion, 0.05, has been indicated with white contour lines. since more grains were suspended and their velocities in-creased; therefore, neither the grain displacement nor theintergranular spacing of the suspended grains was constantthroughout the flow cycle. A slower oscillatory flow was generated with T = 3.02sand U。=0.19msin order to resolve the grain trajec-tories with PTV. Time series of ensemble-averaged free-stream horizontal velocity and snapshots of the velocityfield from the ripple crest to trough are shown in Fig. 10.Sediment grain trajectories are shown during short phasesegments (Fig. 10a) with each grain trajectory representedby a different line color. The fluid velocities are indicatedby white vectors. The maximum orbital velocity amplitudeis indicated as a scale vector in magenta in the top left ofeach image. The fluid velocity field was measured with aspatial resolution of ~0.8 mm, for a total of 147 profilesacross the field of view. However, for better visualizationonly 25 profiles are displayed from ripple crest to trough.The flow reversed from negative to positive and was accelerating to the right (Fig. 10b). The flow above the crest was greater than that above the trough due to the flow constriction by the ripple crest. The suspended sediment grains that were mobilized during flow reversalwere advected across the ripple crest and deposited onthe slope of the ripple. During maximum positive flow(Fig.10c), a second set of sediment grains were mobilizedand advected across the ripple crest as well. Flow sepa-ration from the bed was observed along the lower part ofthe slope and in the trough. The flow reversed from pos-itive to negative and similar observations were made inthe opposite direction (Figs. 10d,e). Shorter trajectorieswere observed within a couple grain diameters of the bedsurface, possibly representing sediment grains that werebeing transported in short bursts through saltation. Lon-ger sediment grain trajectories were observed farther upin the water column, representing grains that were beingadvected as suspended load. 4. Discussion a. Sediment settling velocity The settling velocity is an important parameter for manysediment transport calculations, including estimating the FIG. 9. (a) The ensemble-averaged horizontal free-stream velocity, taken at x=0.003 m andz=0.085 m, is shown withfour phases indicated (asterisks) for flow having period T =2.35 s and maximum orbital velocity amplitude U。=0.26 ms.(b)-(e) The ensemble-averaged vorticity w is shown over the ripple, overlaid with instantaneous fluid velocities (white) ateach phase indicated in (a), where markers (solid circles) represent detected suspended sediment grains. suspended sediment concentration and solving theadvection-diffusion equation. One commonly usedsettling-velocity formulation is that of Gibbs et al.(1971), where wo is the terminal settling velocity, and v is thekinematic viscosity of water. All dimensional quantitiesmust be in the centimeter-gram-second (cgs) system inorder for the constants to be valid. In addition,note thatthe equation has been recast in terms of the sedimen1grain diameter in accordance with Nielsen (1992). Another settling-velocity formulation was developed bySoulsby (1997), where D is the nondimensionalized grain diametergiven by While both formulations are dependent on the kine-matic viscosity of the fluid, the median grain diameter,and sediment density, the formulation in (7) is slightlymore sensitive to the kinematic viscosity of the fluid. In fluids with high concentrations of suspended sedi-ment grains, the settling velocity may be reduced orhindered as a result of grain-grain interactions. A cor-rection factor to the terminal settling velocity to accountfor hindered settling was calculated with where B, is the correction factor defined as the ratio ofthe terminal settling velocity to the settling velocityof the sediment grain in suspension, Ctot is given by (6),and the exponent was calculated based on the grainReynolds number for these experimental conditions(Richardson and Zaki 1954; Penko et al. 2013). A cor-rection factor of βe=0.999 was obtained for the exper-imental data presented in this article, indicating that the FIG. 10. (a) The ensemble-averaged horizontal free-stream velocity, taken at x=0.003m and z=0.085 m, isplotted over the flow cycle with four phase segments highlighted () for flow having period T =3.02 s and max-imum orbital velocity amplitude U。=0.19ms-l.(b)-(e) Snapshots of PIV images are shown from the ripple crestto trough, overlaid with instantaneous fluid velocities (white vectors) at the end of the corresponding phase seg-ments highlighted in (a). The color lines in (b)-(e) illustrate sediment trajectories representing the paths of indi-vidual sediment grains during the phase segments highlighted in (a). A scale vector representing the maximumorbital velocity amplitude U。=0.19 ms-l is plotted in magenta in the top left of each image in the direction of thefree streamflow. suspended sediment concentrations were several ordersof magnitude too small to significantly hinder the set-tling of the coarse sand grains. The bulk settling velocity was estimated from thesuspended sediment concentration and compared with thecommonly used formulations in (7) and (8). The ensemble-averaged free-stream horizontal velocity and vertical profilesof ensemble-averaged suspended sediment concentrationspatially averaged across the ripple are illustrated inFig. 11. The height of the ripple crest is indicated by theblack dashed line, and best-fit trend lines minimizing theresiduals through the maximum suspended sedimentconcentration are indicated by white solid lines. Usingthe average slope of the two best-fit trend lines, thesettling velocity of the suspended sediment grains was estimated as 0.099 ms. The settling velocity calculatedwith (7)(Gibbs et al. 1971) and (8) (Soulsby 1997) were0.109 and 0.095ms , representing an agreement of90% and 95%, respectively. Therefore, the formulationsagreed well with the settling velocity estimated from thedetected suspended sediment grains, suggesting highconfidence in using these formulations in model pre-dictions of sediment transport under oscillatory flows. b. Suspended sediment concentration Suspended sediment transport is a critical mechanismfor shaping the bathymetry in nearshore regions. Fourpeaks in suspended sediment concentration were ob-served throughout the flow cycle, with the two largestpeaks occurring shortly after flow reversal because of FIG. 11. (a) The ensemble-averaged horizontal free-stream velocity, taken at x=0.003 mandz =0.085 m, is shown for flow having period T=2.35 s and maximum orbital velocity amplitudeU。=0.26ms-. (b) Shown are vertical profiles of ensemble-averaged suspended sedimentconcentration averaged horizontally across the ripple. The ripple crest height is indicated bya black dashed line and best-fit trend lines through the maximum suspended sediment con-centration C are indicated by white solid lines. grains mobilized by the vortex, in agreement with pre-vious observations (Nakato et al. 1977; Nielsen 1992;van der Werfet al. 2007). Two smaller peaks in suspendedsediment concentration were observed during maximumfree-streamflow velocities because of grains mobilized bythe shear stress. Previous observations with finer sandgrains also had peaks in suspended sediment concen-tration during phases of maximum free-streamflow ve-locities, but some researchers attributed these peaks tosediment-laden vortices being advected from adjacentripples (Nakato et al. 1977; Nielsen 1992; van der Werfet al. 2007). The median grain diameter of the suspendedsediment used in the previous studies were smaller thanthose in this experiment, ranging from 0.14 to 0.33 mm(Nakato et al. 1977; van der Werf et al. 2007). The cor-responding terminal settling velocities ranged from 0.014to 0.047 ms,as calculated with the formulation of Gibbset al. (1971). The sediment in this experiment was larger,with a median grain diameter of 0.7 mm and settled muchfaster with a settling velocity of approximately 0.10ms .For the flows presented here, no coarse sediment grainswere advected from the neighboring ripples becausethey typically settled on the ripple slopes and trough. Therefore, the smaller peaks in suspended sedimentCconcentration during maximum flows were attributed tosediment grains that were mobilized by the shear stresses. Typically, the suspended sediment transport rate isestimated from the vertical profile of the suspendedsediment concentration and the fluid velocity. There-fore, many formulations have been proposed for thevertical profile of the suspended sediment concentra-tion. The following formulation for the suspendedsediment concentration profile of coarse sand grainshas been proposed (Nielsen 1986, 1992): where C(z) is the time-averaged vertical profile ofthe volumetric suspended sediment concentration. Thereference concentration Co and the length scale of thesuspended sediment distribution L were calculated as FIG. 12. The vertical profile of time-averaged suspended-sediment concentration is shown for flow having period T=2.35sand maximum orbital velocity amplitude U。=0.26ms-1. Markersrepresent laboratory data and solid lines represent predictions bytwo semiempirical formulations. respectively, where 0, is the modified effective Shieldsparameter over ripples, and nis the ripple height. Themodified effective Shields parameter over ripples wascalculated as follows: 02.5=fwU/2(s-1)gdso and fw is given by (3). The set-tling velocity was calculated with (7) (Gibbs et al. 1971). The formulation of Nielsen (1986,1992) only estimatesthe suspended sediment concentration profile above theripple crest. However, Sleath (1984) proposed the fol-lowing formulation, which accounts for the suspendedsediment along the slope of the ripple near the crest: where 8 is a constant (here assumed =0) and o is aconstant (=0.00272).The reference concentration wasdetermined at the ripple crest and was calculated as(Nielsen 1979). The critical Shields parameter 0 was assumed to be 0.05for quartz sand. The laboratory observations were compared withthe semiempirical formulations of suspended sedimentconcentration proposed by Nielsen (1992) and Sleath(1984) (Fig. 12).The suspended sediment concentrationat the crest was calculated as the average over x rangingfrom -0.0127 to -0.0062 m, and the values at the slopewere calculated to the left of the crest for x rangingfrom -0.029 to -0.0144m. Previous research effortshave shown that the shape of the suspended sedimentconcentration profile above the ripple crest is concavefor coarse sand grains but convex for finer sand grains(Nielsen 1992; Absi 2010). The general concave shape ofthe vertical profiles of suspended sediment concentra-tion given by the semiempirical formulations agreedwell with the laboratory observations of coarse sandgrains. The root-mean-square deviations of the labora-tory data from the model predictions by Nielsen (1992)and Sleath (1984) were 4.8×10⁻⁵ and3.2×10-5m’m-3respectively. The Sleath (1984) predictions of meansuspended sediment concentration above the ripple crestheight were very similar to those below the ripple crestheight. However, the laboratory measurements of meansuspended sediment concentration above and below theripple crest were not very similar. The shape and mag-nitude of the profile predicted by Sleath (1984) agreedvery well with the observations below the ripple crestheight, haviaynng a root-mean-square deviation of 8.6 ×10-m’m- in this region. Above the ripple crest, thelaboratory measurements were larger than Sleath (1984)predicted, indicating that some physical process, possi-bly vortex entrainment, may not be accounted for in theSleath (1984) formulation. Nielsen (1992) made noprediction of the profile below the ripple crest. The datawere evenly scattered about both predictions just abovethe ripple crest. However, the formulation of Sleath(1984) was in better agreement with the data in theupper water column above z = 0.035m, where it con-verged to zero more quickly than the formulation ofNielsen (1992). Davies and Thorne (2016) evaluatedseveral decay-length-scale formulations for a range ofsediment grain diameters and showed that convectiveeffects may be more significant for larger sediment sizes.Perhaps this may account for some of the scatter in thepresent results. 5. Conclusions The first set of independent simultaneous measure-ments of fluid and individual sediment grain velocitieswere made in the laboratory with the implementation ofcombined particle image and tracking velocimetry for sediment transport under oscillatory flows over movablerippled beds. Measured sediment velocities were ofsimilar magnitude and phase to the near-bed fluid ve-locities when the grains were being advected with theflow. Sediment grain trajectories were also determinedthroughout the flow cycle. For the hydrodynamic con-ditions presented over the ripples, vortex generationnear flow reversal mobilized the sediment grains in theform of bedload along the ripple slopes. Vortex ejectionfrom the ripple crest during the accelerating phase of theflow cycle produced significantly larger quantities ofsuspended sediment transport than the shear stressesduring phases of maximum velocities. Some previousstudies with finer sediment grains attributed suspendedsediment during peak flow to sediment-laden vorticesshed by adjacent ripples. Calculations of the sediment settling velocity com-pared very well with the semiempirical formulations.The comparisons of the time-averaged vertical profilesof suspended sediment concentration revealed that theformulations of Nielsen (1992) and Sleath (1984) cap-tured the general concave shape of the profile as ex-pected for coarse sand grains. However, only the Sleath(1984) model accounted for the suspended sedimentconcentration below the ripple crest where it demon-strated good agreement with the laboratory data inthis region. Acknowledgments. Donya Frank-Gilchrist was sup-ported as a postdoctoral fellow through the NationalResearch Council Research Associateship Program atthe U.S. Naval Research Laboratory. Allison Penko andJoseph Calantoni were supported under base funding tothe U.S. Naval Research Laboratory from the Office ofNaval Research. The authors would like to acknowledgeNRL staff members Edward Braithwaite and AbigailHode for their assistance with instrument set up anddata collection during the experiment. REFERENCES ( Absi,R., 2010: Concentration profiles for fine and coarse sediments suspended by waves over ripples: An analytical study with the 1 -DV gradient diffusion model. Adv. W ater Resour., 33, 411- 418, h ttps: / /doi . o rg/ 10.1016/j . advwatre s .2010.01.006. ) ( Admiraal, D., R. M usalem-Jara,M. Ga r cia, and Y. Ni n o, 2006: Vortex trajectory hysteresis above self-formed vortex rip- ples. J. Hydraul. R es., 44, 4 37-450, h t tps://doi.org/1 0. 1080/ 0 0221686.2006.9521696. ) ( Adrian, R . J., 1991: Particle-imaging techniques for experimentalfluid mechanics. Annu. R e v. Fluid Mech.,23, 261-304, http s:// doi.org/10.1146/annurev.fl.23.010191.001 4 01 . ) ( Andersen, K . H . , 1 9 99: The dynamics of ripples be n eath surface wave and topics in s h ell m o dels of turbulence. Ph.D. thesis, University of Copenhagen, 284 p p. ) Baek, S., and S. Lee, 1996: A new two-frame particle tracking al-gorithm using match probability. Exp. Fluids, 22, 23-32,https://doi.org/10.1007/BF01893303. ( Bagnold, R . A ., a nd G . T a ylor, 1 9 46: Motion of waves in sh a llow water. Interaction between waves and sand bottoms. Proc. Roy. Soc. London,187A, 1-18, ht t ps://doi. o rg/ 1 0 .1098/rspa. 1 946.0062. ) ( Barr, B. C.,D. N. Slinn, T. P ierro, and K. B. Winters, 2004: Numericalsimulation of t u rbulent, oscillatory f l ow over sand rip p les. J.Geophys. Res., 109, C09009, ht tps://doi.org/ 10 . 1029/2002 J C001709. ) ( Bhaganagar, K., and T.-J. Hsu, 2009: Direct numerical simulations of f low over two-dimensional a n d three-dimensional ripples a n d i mplication to sediment t ransport: Steady f low. Coastal Eng., 5 6,320-331, h t t ps:/ / doi.org/ 10 . 1 016/j.coasta l eng. 2 008.09.01 0 . ) ( B iwole, P. H., W. Yan, Y. Zhang, and J.-J. Roux, 2009: A complete 3D particle tracking algorithm and its applications to the indoor airflow s tudy. M eas. S c i. Technol., 20, 115 4 03, ht t ps:// d oi.org/ 1 0.1088/0957 - 0233/20/1 1 /115403. ) ( Blair, D., and E. Dufresne, 2016: The MATLAB particle trackingcode repository. Georgetown Uni v ersity, http ://s i te.ph ys i cs .geo rge town.edu/matlab/index. h tml. ) ( Blondeaux, P ., P. Scandura, and G. V ittori, 2004: Coherentstructures in an oscillatory separated flow: Numerical ex-periments. J . F luid M ech., 5 1 8,21 5 -229, htt ps://d o i.o r g/ 10.101 7 /S0022112004000953. ) ( Calantoni, J., B. J. Landry, and A . M . P e nko, 2013: Laboratoryobservations o f sand ripple evolution us i ng bimodal grain size distributions under asymmetric osc i llatory flows. J. Co a stal R es., 65, 1 497-1502,ht tps:// d oi. o rg/ 1 0. 2 112/SI65-253. 1 . ) ( Campbell, L., I . McEwan, V. Nikora, D. Po k rajac, M. Gallagher, and C . Manes,2 0 05: Bed-load effects on hydrodynamics of rough-bed open-channel flows. J. Hydraul. Eng.,131,576-585, h ttps: / /do i .org/10.1061/(ASCE)0733-9 4 29(2005)131:7(576). ) ( Chang, Y. S., and A. Scotti, 2004: Modeling unsteady turbulent flowsover r ipples: R eynolds-averaged N a vier-Stokes equations (RANS) versus large-eddy simulation (LES). J. Ge o phys. Res . , 109,C09012, h ttps:/ / doi.org/10.1029/2003JC002208 . ) ( Charru, F., B. Andreotti, and P . C laudin, 2 013: S and ripples anddunes. Annu. R ev. Fluid Mech.,45, 469-193,ht tps://doi.org/ 1 0.1 1 4 6/ a nnurev-fluid-011212-140806 . ) ( Chu, T. D., A. Jarno-Druaux,F. Marin, and A. B. Ezersky, 2012: P article trajectories and size sorting above a rippled bed understanding water waves. Phys. Re v .,85E, 021304, http s:// do i. org/ 1 0.1 1 03/PhysRevE.85.021304. ) ( Cierpka, C., B . Litke, and C. J. Kahler, 2013: Higher order multi- frame p a rticle t racking v elocimetry. Exp. F l uids, 5 4 , 1 5 33- 1 545, h t tp s: / /doi . or g/ 10.1007/ s 00348-0 1 3- 1 5 3 3-3. ) ( Crocker, J . C. , and D. G. G rier, 1 996: Methods of digital video m icroscopy for colloidal studies. J. C olloid Interface Sci., 1 79, 298-310, h ttps:/ / doi.org /10 .1006/jcis.1996.0217. ) ( Davies, A. G., and P. D. Thorne, 2005 : Modeling and measure- ment of sediment transport by waves in the vortex ripp l e re-gime. J . G eophys. R e s., 1 1 0, C05017, ht t ps:/ / doi.org/10.1029/2004JC002468. ) ( , and ——, 2016: On the suspension of graded sediment by waves above ripples: Inferences o f c o nvective and di f fusiveprocesses. Cont. ShelfRes., 1 1 2, 46-67, ht tps:/ / doi.org/1 0. 1 0 16/ i . csr.2015. 1 0.006. ) ( Deen,N. G., B . H. Hjertager, a nd T. Solberg, 2000: Comparison of PIV a nd LDA measurement methods applied to the gas-liquid flow in a bubble column. P roc. 1 0th Int. Symp. Applications of Laser T echniques to F luid M echanics, L isbon, P ortugal, C alouste Gulbenkian Foundation, 38.5, http: //ltc e s.d e m.ist. u tl . p t/lxla s er / lxlaser2000/papers/pdf/ 3 8_ 5 .pdf. ) ( Delnoij,E.,J. A. M. Kuipers, W. P. M. Van Swaaij, and J. Westerweel, 2000: Measurement of gas-liquid two-phase flow in bubble col-umns using ensemble correlation PIV. Chem. Eng.Sci.,55,3385- 3395, h ttps:/ / doi.or g/ 1 0. 10 16/S0009-2509(99)005 95 -3. ) ( Doucette, J. S., and T. O'Donoghue, 2006: R e sponse of sand rip- ples to change in oscillatory flow. Sedimentology,53, 5 81-596, https: / /doi . org / 10 . 1 1 11/j .1 365-3091.2006.0077 4 .x. ) ( Dracos, T ., 1996: P article tracking in three-dimensional space.Three-Dimensional Velocity and Vorticity Measuring and Im-age Analysis T echniques, T. D racos,Ed., S p ringer, 209-227. ) ( Drake, T. G., and J . Calantoni, 2 0 01: D i screte particle m o del fo r sheet flow sediment transport in t he nearshore.J. Geophys. Res., 1 06,19859-19868, ht tps://doi. o rg/ 10 . 1 029/2000JC000611. ) ( Eidsvik, K. J., 2004: Some contributions to the uncertainty ofsediment transport predictions. C ont. S helfRes.,24, 739-754, ht tp s://doi.o rg/ 10. 1 016/j.csr.2003. 11 . 003. ) ( Elgar, S., R. T. Guza, and M. H . Freilich, 1988: Eulerian m ea-surements of horizontal a ccelerations i n s hoaling gravitywaves. J . G eophys. Res., 9 3 , 9 2 61-9269, ht t ps:// d oi.org/ 10.1029 / JC093iC08p09261 . ) ( Faraci,C. , and E. Foti,2002: Geometry,migration and evolution ofsmall-scale bedforms g enerated by regular a n d ir r egular waves. C oastal Eng., 4 7,35-52, h ttps: / /doi.org/10 . 1016/S0378-3839(02) 0 0097-2. ) ( Finn, J. R., M. Li, and S. V. Apte, 2016: P article based m odelling and s imulation o f natural and dynamics in the wave bottom boundary la y er. J. F l uid Mech., 796, 340-385, http s ://doi.org/ 1 0. 1 017/jfm. 2 01 6 .246. ) ( Foster, D. L., A. J. Bowen, R . A . Holman, an d P. Na t oo, 2006: Field evidence of pressure e gradient i nduced i ncipient motion.J. G e ophys. Res., 111, C05004, htt ps: // d o i.org/10 .10 29/ 2004JC002863. ) ( Frank, D ., D. Foster, I. M. Sou, and J. Calantoni, 2015a: Incipient motion of surf zone s ediments. J. Geophys. Res. O ceans, 120,5710-5734,h t tp s :/ / doi.or g/ 10. 1002/201 4 JC01 0 424. ——, and P. C hou, 2015b: Lagrangian measure- ments of incipient motion in oscillatory flows. J. G e ophys. Res. . Oceans, 120, 244-256, https : //doi.o rg/ 10.1002/2014JC010183. ) ( Fredspe, J ., K. H. Andersen, and M . B. Sumer, 1 9 99: Wave pl u scurrent over a ripple-covered bed. Coastal Eng.,38, 1 77-221, https: / /doi.org/10.1016/S0378-3839(99)00047 - 2 . ) ( Garcia, M. H., R. Musalem, and D. M. Admiraal, 2002: Explor-atory s tudy o f o scillatory flow over a movable sediment bed with p article-image-velocimetry (PIV). Hydraulic Measure- ments and E xperimental Methods 2 002, Estes Park, CO,American S o ciety of Civil Engineers, 711-720. ) ( Gibbs, R. J., M. D. Matthews, and D . A . L ink, 1 971: The r ela- tionship between sphere size and settling velocity. J. Sediment. Res., 41, 7-18, http s ://doi.org/10.1306/74D721D0-2B21 - 1 1 D 7 - 8648000102C 1 865D. ) ( Grant, W.D.,and O. S. Madsen,1979:Combined wave and currentinteraction with a rough b ottom. J. Geophys. Res., 8 4, 1797- 1808, https: / /doi.org/10.1029 / JC084iC 0 4p017 9 7. ) ( Gui, L., and W. M erzkirch, 1996: Phase-separation o f PIV mea-surements in t w o-phase fl o w by applying a digital mask tech-nique. ERCOFTAC Bulletin, No. 30, E uropean R e searchCommunity on F l ow Turbulence and Combustion, 45-48. ) ( Hansen, E . A., J. Fredspe, and R. Deigaard, 19 9 4: Di s tribution of suspended sediment over wave-generated ripples. J. W aterw. Port C oastal Ocean E n g., 1 2 0, 3 7 -55, h t tps:// d oi.org/ 1 0.1061/ ( A SCE)0733-950X(19 9 4)120:1(37). ) ( Hassan, Y ., O. G . P hilip, and W. D. Schmidl,1993: Bubble collapse velocity measurements u s ing a particle i m age ve l ocimetry ) ( technique with fluorescent tracers. Proc.American So c iety of Mechanical Engineers Fluids Engineering Summer Meeting,Washington, DC, A merican Society of Mechanical Engi-neering Fluids Engineering Division,85-92. ) ( H urther,D., and P. D. Thorne, 2011: Suspension and near-bed loadsediment transport processes above a migrating, sand-rippledbed u nder shoaling waves. J. G eophys. R e s., 1 16, C 07001, https: / /doi . o r g / 10 . 1029/2010JC00677 4 . ) ( Ishikawa, M., Y. Murai, A. Wada,M. Iguchi, K. Okamoto, andF. Yamamoto, 2000: A no v el al g orithm fo r particle tracking velocimetry using the velocity gradient tensor. E x p. Fluids, 29, 5 19-531, h tt p s:/ / d o i.org / 10.1007/ s 003480000120 . ) ( Khalitov,D., and E. L ongmire, 2002: Simultaneous two-phase PIVby two-parameter phase discrimination. Exp. Fluids, 32, 252-268, h ttps: / /doi.or g /10 . 1007/s003480100356. ) ( Kiger,K. T., and C . Pan, 2000: PIV t echnique for t he simultaneousmeasurement of dilute t w o-phase flows. J. F luids E ng., 122, 811-818, h t tps: / /doi.org/10. 1 115/1. 1 31 4 8 64. ) ( Kim,H.-B.,and S.-J. Lee,2002: Performance improvement of two-frame p a rticle tracking v e locimetry using a hybrid adaptivescheme. Meas. Sc i . Te c hnol., 13, 573, htt p s://d oi .or g /10 .10 88/ 0957-0233/13/4/321. ) ( LaVision, 2014: FlowMaster Product-Manual f o r D a Vis 8.2.LaVision Rep., 188 p p. ) ( Li, D., Q. Zhong, M . Yu, a n d X. Wang, 2013: Large-scale par- ticle tracking velocimetry with multi-channel CCD cameras. Int. J. Sediment R e s., 2 8 , 10 3 -110, htt p s://d o i.org/10. 1 016/S1001- 6 279(13) 6 0022-0. ) ( Malarkey,J.,and A . G. Davies, 2002: D iscrete vortex modelling of oscillatory flow over r ipples.Appl. O c ean Res., 24, 12 7 -145, https: / /doi.o r g/10.1016/S01 4 1-1187(02)00035-4. ) ( Malik, N . A ., T . D racos, and D. A . P a pantoniou, 19 9 3: Particletracking velocimetry in three-dimensional fl o ws. Exp. Fluids, 15,279-294, h tt ps ://doi.or g/ 10 . 1007/BF00223406. ) ( Muste, M., K. Yu, I. Fujita, and R. Ettema,2005: Two-phase versus mixed-flow perspective o n suspended sediment tr a nsport in turbulent c hannel f lows. W ater R e sour. Re s ., 4 1 , W10402, https://doi.o r g /10.102 9 /2004WR003595. ) ( Nakato, T., J. F . Kennedy,J. R. Glover, and F. A. Locher,1977: Wave entrainment of sediment from rippled beds. J. Waterw. Port Coastal Ocean Div., 1 0 3, 83-99. ) ( N ezu, ., and R. A z uma, 2004: Turbulence characteristics and in-teraction b etween p a rticles a nd f l uid in p article-laden o penchannel flows. J. Hydraul.Eng.,130 , 988-1001, http s://do i. org/ 10.1061 / (ASCE)0733-9429(2004)13 0 :10(988). ) ( Nichols, C . S ., and D. L . F o ster, 2 0 07: F u ll-scale observations of wave-induced vortex generation over a rippled bed.J. Geophys Res., 112, C10015, h ttps://doi.org/10.1029/2006JC003841. ) ( , and -,20 0 9: Observations of bed fo r m evolution with field-scale oscillatory hydrodynamic forcing. J. Geophys. Res., 114, C08010, https: / /do i .org/10.1029/2008JC004733 . ) ( Nielsen, P.,1979:Some basic concepts of wave sediment transport I nstitut e of Hydrodynamics a nd H y draulic En g ineering Technical University of Denmark series paper 20, 160 pp. , 19 86: Suspended s ediment c o ncentrations u nder w a ves. C oastal Eng., 10, 2 3-31, h ttps:/ / doi.org/10.1016/0378-3839(86) 90037-2 . ) ( — ,1992: Coastal Bottom Boundary Layers and Sediment Transport. World Scientific, 340 pp. ) ( Noguchi, K., I . Nezu, and M . Sanjou, 2008: Turbulence structure and fluid-particle i nteraction i n s ediment-laden f l ows o v er developing s and d unes. E nviron. F luid Mech., 8, 5 69-578, h ttps:/ / doi . org / 10.1007/s10652 - 008-911 4 -3. ) ( O'Donoghue, T., and S. Wright, 2004: Concentrations in oscillatorysheet f low f or well sorted and graded sands. Coastal Eng.,50, 1 17-138, h t tps:/ / doi . o rg/ 10.10 1 6/ j. coastaleng . 2003.09.004. ) ( -, J. Doucette, J . Van der Werf, and J . Ribberink, 2 006: The dimensions of sand ripples in fu l l-scale o s cillatory flows. Coastal Eng., 53, 997-1012, h ttps: / /doi.org/10.1016/j . coastaleng.2006.06.008. ) ( Ohmi, K . , and H . -Y. Li, 2 0 00: P a rticle-tracking velocimetry with new a l gorithms. Meas. Sci . Technol., 11, 603, http s : / /do i. org / 1 0. 1 088/0957-0233/1 1 / 6 / 3 03. ) ( Ouellette, N. T., H. Xu, and E. Bodenschatz, 2006: A quantitative study o f t hree-dimensional L a grangian particle tr a cking al-gorithms. E xp. F lu ids, 40 , 30 1 -313, htt p s ://do i .or g /10. 1 007/ s00348-005-0068-7 . ) ( Papantoniou, D., a ndT. Dracos, 19 8 9: Analyzing 3-D turbulentmotions in open channel flow by use of stereoscopy and par-ticle tracking . Proc. Second European T u rbulence Conf.,Berlin, Germany, European Mechanics Committee,278-285, https: / /doi.org/10 . 1007/978-3-642-83822-4_43. ) ( Pedocchi, F ., J. E. Martin, and M. H. Garcia, 2008: Inexpensivefluorescent particles for large-scale experiments using particle image v e locimetry. Exp. Fl u ids, 45 , 18 3 -186,http s :// do i. org/ 10.1007/s00348-008-0516-2 . ) ( Penko, A ., J. Calantoni, S . Rodriguez-Abudo, D. Foster, andD. Slinn, 2013: Three-dimensional mixture simulations of f low over d ynamic r i ppled beds. J . Geophys. Res. Oceans, 118,1543-1555,ht tps://doi.org/10. 1 002/jgrc . 20120 . ) ( Radice, A., F. Ballio, and R. Nokes, 2 010: P reliminary r esultsfrom a n a pplication of PTV to b ed-load grains. River Flow2010: Int. Conf. Fluvial Hydraulics, Braunschweig, Germany, Bundesanstalt fur Wasserbau, 1681-1686. ) ( Ribberink, J. S ., 1998: Bed-load transport f o r steady flows and unsteady oscillatory flows. C o astal Eng., 34 , 59-82, http s://doi.org / 10. 1 016/S 0 378-3839(98)0001 3 - 1. ) ( Richardson, J. F., and W.N. Z a ki, 1 9 54: S e dimentation an d fluid-isation. Part 1 . Trans. Inst. Chem. Eng.,32 , 35-53. ) ( Rodriguez-Abudo,S., D. Foster, and M. Henriquez, 2013: Spatial variability of the wave bottom boundary layer over movable rippled beds.J. G eophys. Res. O c eans, 118,3490-3506, http s://doi.org/10. 1 002/jgrc. 2 0256. ) ( Saga,T., T. Kobayashi, S. Segawa, and H. Hu, 2001: Development and e valuation of an i mproved c orrelation based PTV method. J . V is ualization, 4, 29 - 37, htt p s: / /d o i .or g /10 .1 007/ BF03182453. ) ( Scandura, P., G. Vittori, and P. Blondeaux,2000:Three-dimensional oscillatory flow over steep ripples. J. Fluid Mech.,412,355-378, ht tp s://doi.org/10.1017/S00221 1 2 000008430. ) ( Schanz, D., S. Gesemann, and A. Schroder,2016: Shake-the-box:Lagrangian p a rticle tracking at high particle image d e nsities. Exp. Fluids,57, 7 0 , h ttps:// d oi. o rg /10 .1 0 07/s00348-016-2157- 1 . ) ( Shields, A., 1936: Anwendung der A n hlichkeitsmechanik u n dTurbulenzforschung auf die Geschiebebewegung. Ph.D. the-sis, Technical U niversity Berlin, 47 p p . ) ( Shimizu, Y.,M. W . Schmeeckle, and J. M. N elson, 2001: Direct numerical s imulations o f t urbulence o ver two-dimensional dunes u sing CIP methods. J. Hydrosci. Hy d raul. En g ., 19, 85-92. ) ( Simeonov, J. A., S. B ateman, an d J. Calantoni, 2015: Filter width and uncertainty estimation in continuum modeling of particle ) phases. Int. J. Multiphase Flow, 74, 79-83, https://doi.org/10.1016/j.ijmultiphaseflow.2015.03.025. ( Sleath, J. F. A., 1984: Sea Bed Mechanics. John Wiley,335 pp.Soulsby, R., 1997: Dynamics o f M arine Sands: A Manual forPractical Applications. 1st ed. Thomas T e lford S e rvices, 249 pp. ) ( Stachurska, B ., and R . S taroszczyk, 2 016: A n investigation of t hevelocity f ield over r ippled s and b o ttom. 6t h Int. Junior Re-searcher and Engineer W orkshop o n H y draulic Structures,Lubeck, Germany, In t ernational A s sociation for H y dro-Environment Engineering and Research, 3. ) ( Swart, D. H. , 1974: Offshore sediment t ransport and equilibrium beach profiles, part 2. Delft Hydraulics Laboratory Rep. M918,323 pp. ) ( Takehara,K.,R.J. Adrian,G.T.Etoh, and K. T. Christensen, 2000:A Kalman tracker f o r super-resolution PIV. Exp. Fluids, 29 (Suppl.), S034-S041, h tt ps : / /doi.or g/ 10.1007/s003480070005. ) ( Tapia, H. S. , J. A. G. Aragon,D. M. H ernandez, and B. B .Garcia, 2006: P article tracking velocimetry (PTV) algo-rithm f or n on-uniform and non-spherical par t icles. Pr o c.Electronics , Robotics and Automotive Mechanics Conf2006,Cuernavaca, Mexico,IEEE,325-330, http s://doi.org/10.1109/CERMA.2 0 06.1 1 8. ) ( T errile, E., A. J . H . M. Reniers, M. J. F . Stive,M. Tromp, and H.J . Verhagen,2006: Incipient motion of c oa r se par t iclesunder regular s hoaling w a ves. Coastal En g ., 53 , 81 - 92 , h t tp s: // doi.or g /10. 1 016/ j. coastaleng. 2 005.08.004. ) ( T raykovski,P . , A. E. Hay, J. D. Irish, and J. F. Lynch, 1999: Ge-ometry, m igration, a nd evolution of w ave o r bital r ipples at LEO-15. J. G e ophys. Re s ., 10 4 , 15 0 5-1524, htt p s: / /d o i.org/ 10.1029/1998JC900026 . ) ( van der W erf, J.J., 2006: Sand transport o ver rippled b eds in oscillatory flow. Ph.D. thesis, University of Twente, 206 pp. ) ( -,J. S. Doucette,T.O'Donoghue,and J. S. Ribberink,2007: Detailed measurements of v e locities and s uspended s a nd concentrations o v er fu l l-scale ripples in oscillatory flow. J. G eophys. R e s., 112, F 0 2012, ht t ps:// d oi.org/ 10 .1029/ 2006JF00061 4 . ) ( -,V. Magar,J. Malarkey, K. Guizen, and T . O. O'Donoghue, 2008: 2 DV modelling of s e diment t r ansport processes over full-scale ripples in regular asymmetric o s cillatory flow.Cont. Shelf Res., 28, 1 040-1056, h t tps:/ / doi.org /10 .1016/ i . csr . 2008.02.007. ) ( Wood, T. M., C. A. Yates, D. A. Wilkinson, a n d G. Rosser,2012: Simplified multitarget tracking using the PHDfilter fo r microscopic video data. IEEE Trans. C ircuits Syst. Video Technol.,22,702-713,htt ps:// d oi.org/1 0 .110 9 / T CSVT.2011. 2 1 7 7937 . ) ( Yang, B ., Y. W ang, and J . Liu, 2011: P IV m e asurements of two p hase v elocity f ields i n a eolian s ediment t r ansport u s ing fluorescent tracer particles.Measurement, 44, 708-716, h ttps: / / doi.or g/ 10. 1 01 6 /j.measurement.2 0 11. 0 1 .007. ) ( Zedler, E. A., and R. L. Street, 2006: Sediment transport over r ipples i n o scillatory flow. J. Hydraul. E ng., 1 32, 1 80-193, h ttps: // doi.org/10.1061/(ASCE) 0 733-9 4 29(2006)132:2(180). ) ( Zhang, W., Y. Wang, and S. J . Lee, 2008: Simultaneous P I V and P TV m e asurements of wind and sand particle velocities. Exp. Fluids, 45, 241-256,ht tps://doi.org /10 .1007/s00348-008-0474-8. ) Accurately assessing the response of sediments to oscillatory flows requires high-resolution fluid velocity and sediment transport measurements at the fluid–sediment interface. Fluid and sediment grain velocities were measured simultaneously with combined particle image and tracking velocimetry under oscillatory flows over movable sand ripples. Three high-speed cameras equipped with varying optical filters were used to distinguish between fluorescent fluid tracers and the grains, from which the fluid and grain velocities were determined, respectively. Individual grains were tracked during transport to determine velocities and trajectories. Sediment grains were first mobilized by a vortex impacting the bed during flow reversal and suspended into the water column just prior to vortex ejection from the ripple crest, similar to previous observations. During phases of maximum flow velocity, additional grains were mobilized by the shear stress and were subsequently suspended. The flow reversed and similar observations were made in the opposite direction.Consequently, four peaks in suspended sediment concentration were observed throughout the flow cycle, consistent with previous observations. However, some previous researchers attributed peaks in suspended sediment concentration occurring during phases of maximum flow velocity to sediment-laden vortices that were shed from adjacent ripples. The measured sediment grain velocities were of similar magnitude and phase to the near-bed fluid velocities when the grains were being advected with the flow. Measurements of suspended sediment concentration agreed well with semiempirical formulations having an average root-mean-square deviation of approximately 4 3 1025m3m23. Predictions of settling velocity alsocompared well with the laboratory estimates, agreeing to within 90%.
确定


还剩16页未读,是否继续阅读?

产品配置单


北京欧兰科技发展有限公司为您提供《砂砾中运动位移形变场检测方案(工作站及软件)》,该方案主要用于其他中运动位移形变场检测,参考标准--,《砂砾中运动位移形变场检测方案(工作站及软件)》用到的仪器有LaVision DaVis 智能成像软件平台、德国LaVision PIV/PLIF粒子成像测速场仪、LaVision HighSpeedStar 高帧频相机
推荐专场


相关方案
更多
该厂商其他方案
更多