


方案详情
文
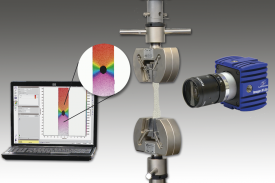
采用LaVison的DVC体视全场形变应变分析软件包,对动态X-射线断层扫描结果数据进行分析。同时辅以激光加热,观察到了页岩油样件内部,随着温度升高,裂纹断裂的产生和发展。将X-射线断层扫描,DVC和激光加热结合起来研究页岩油热解过程,可以对优化碳氢燃料提取过程提供有用信息。
方案详情

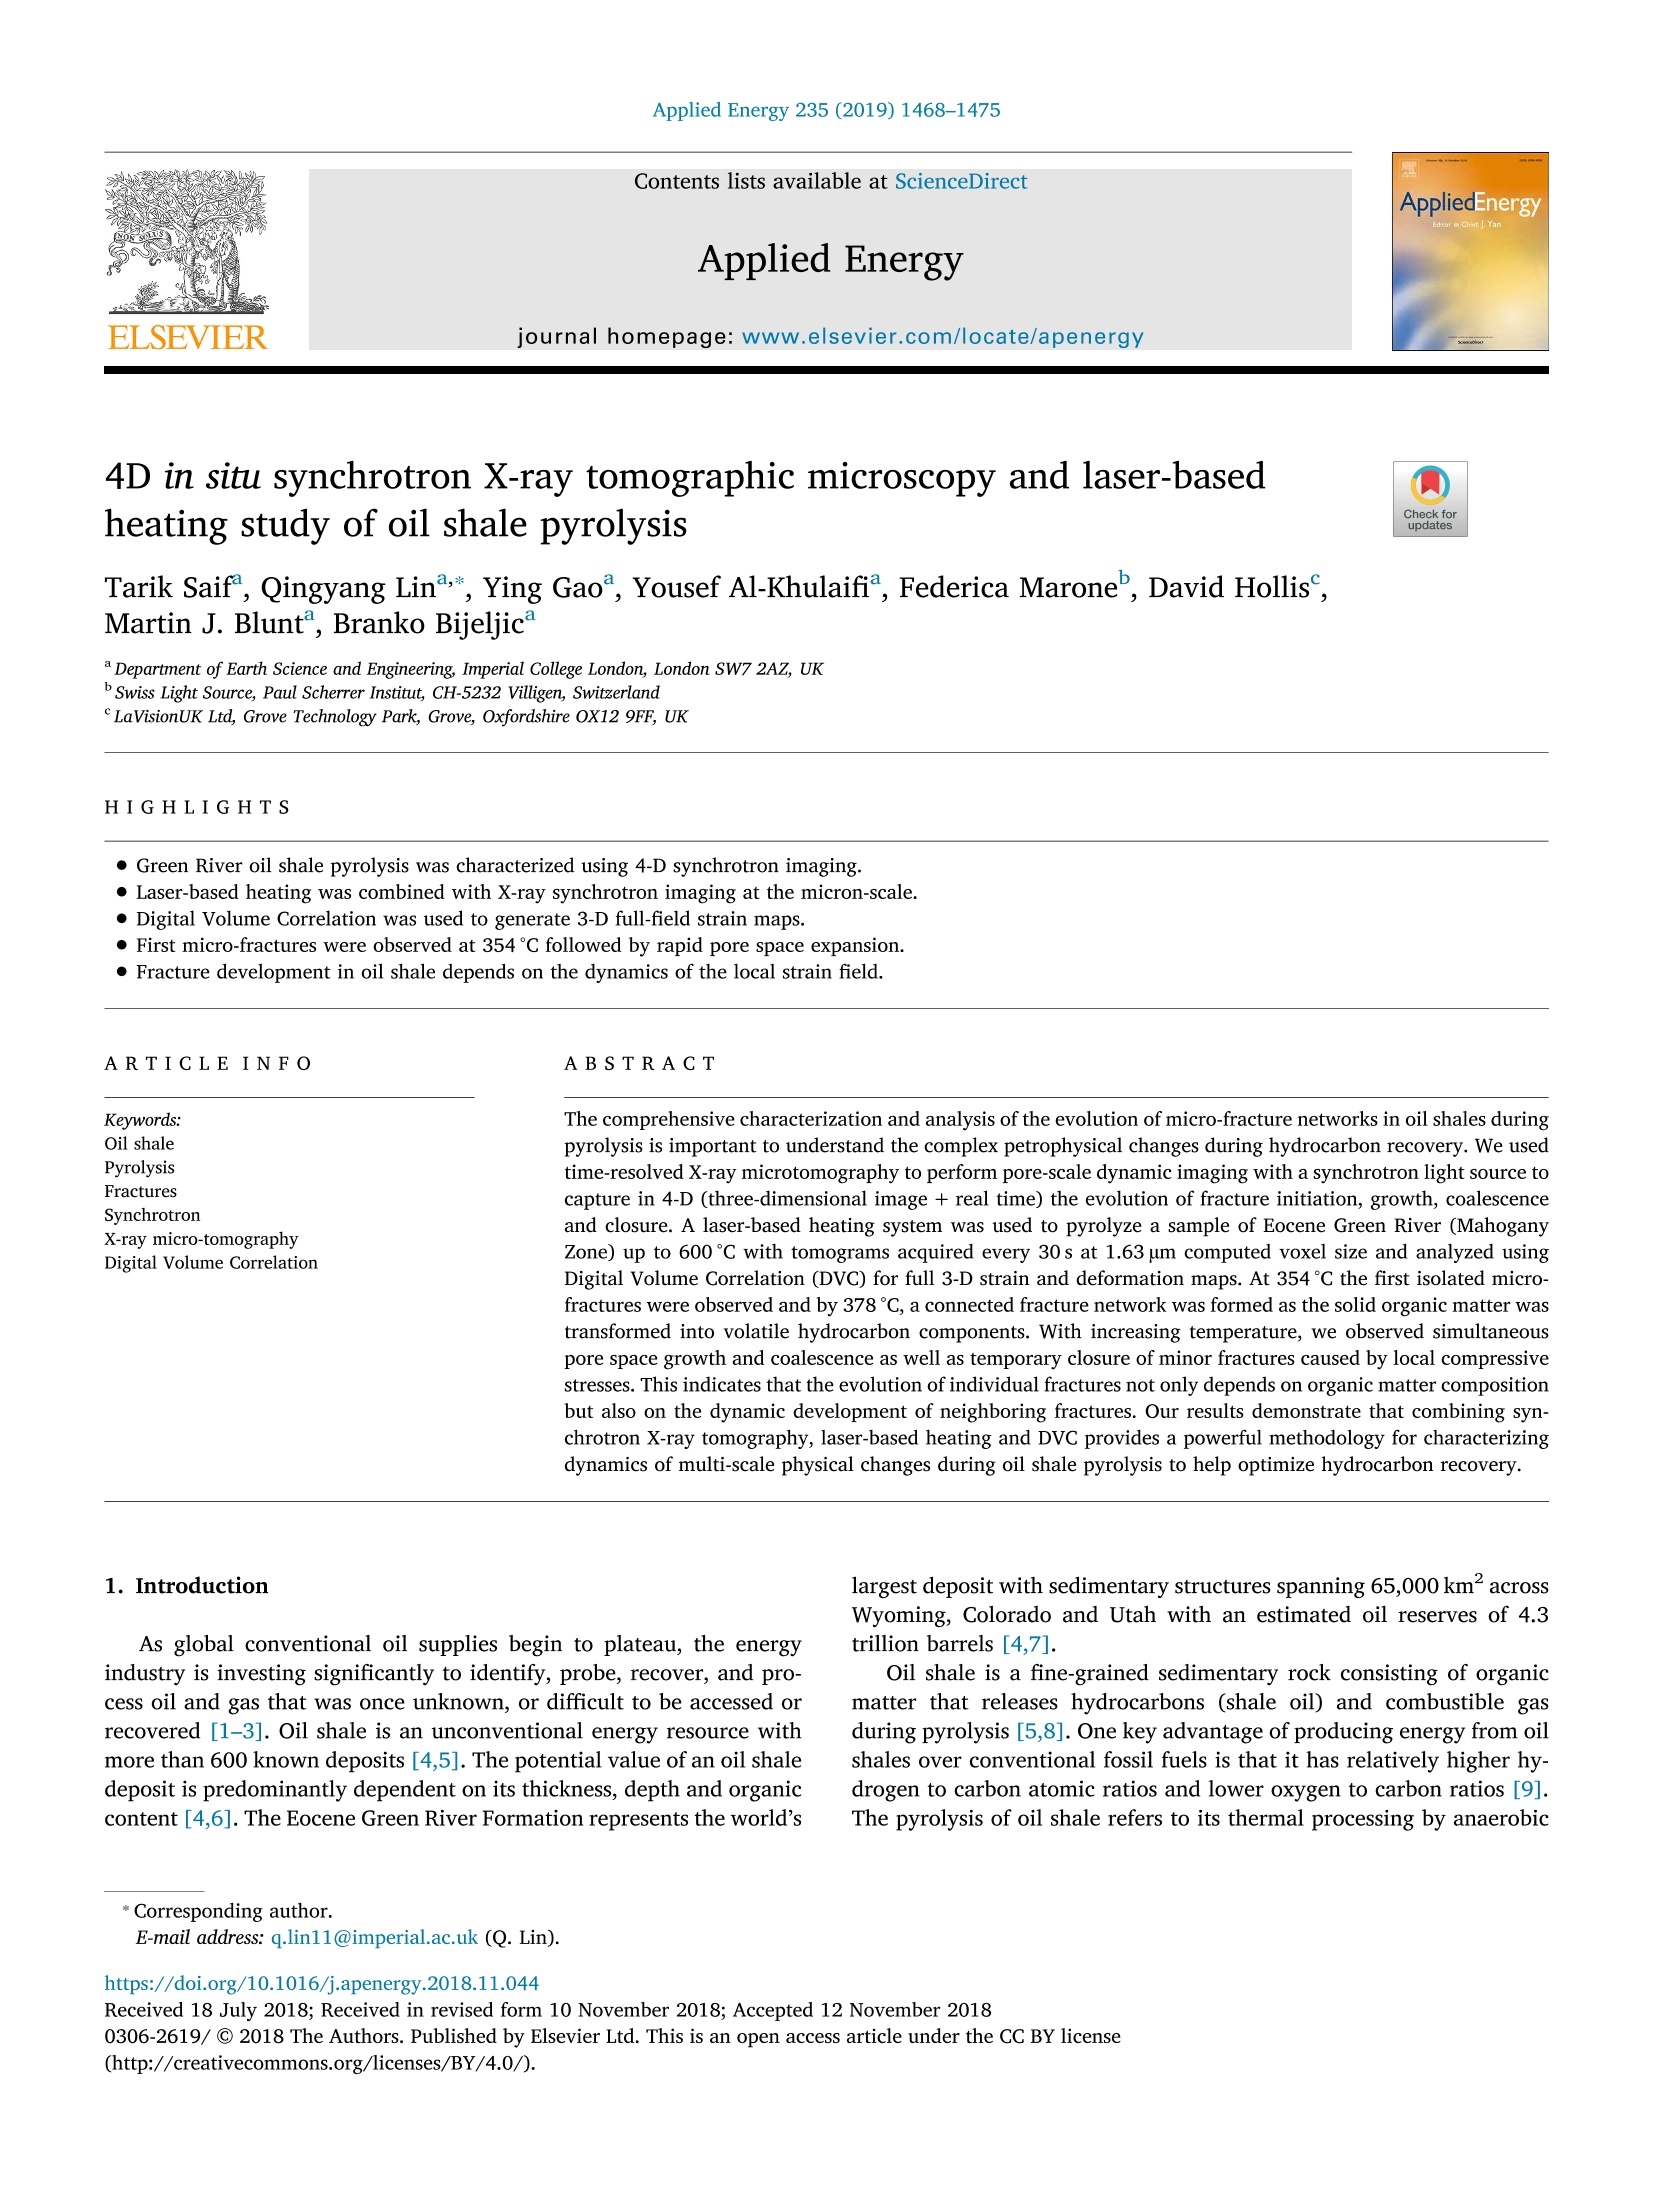
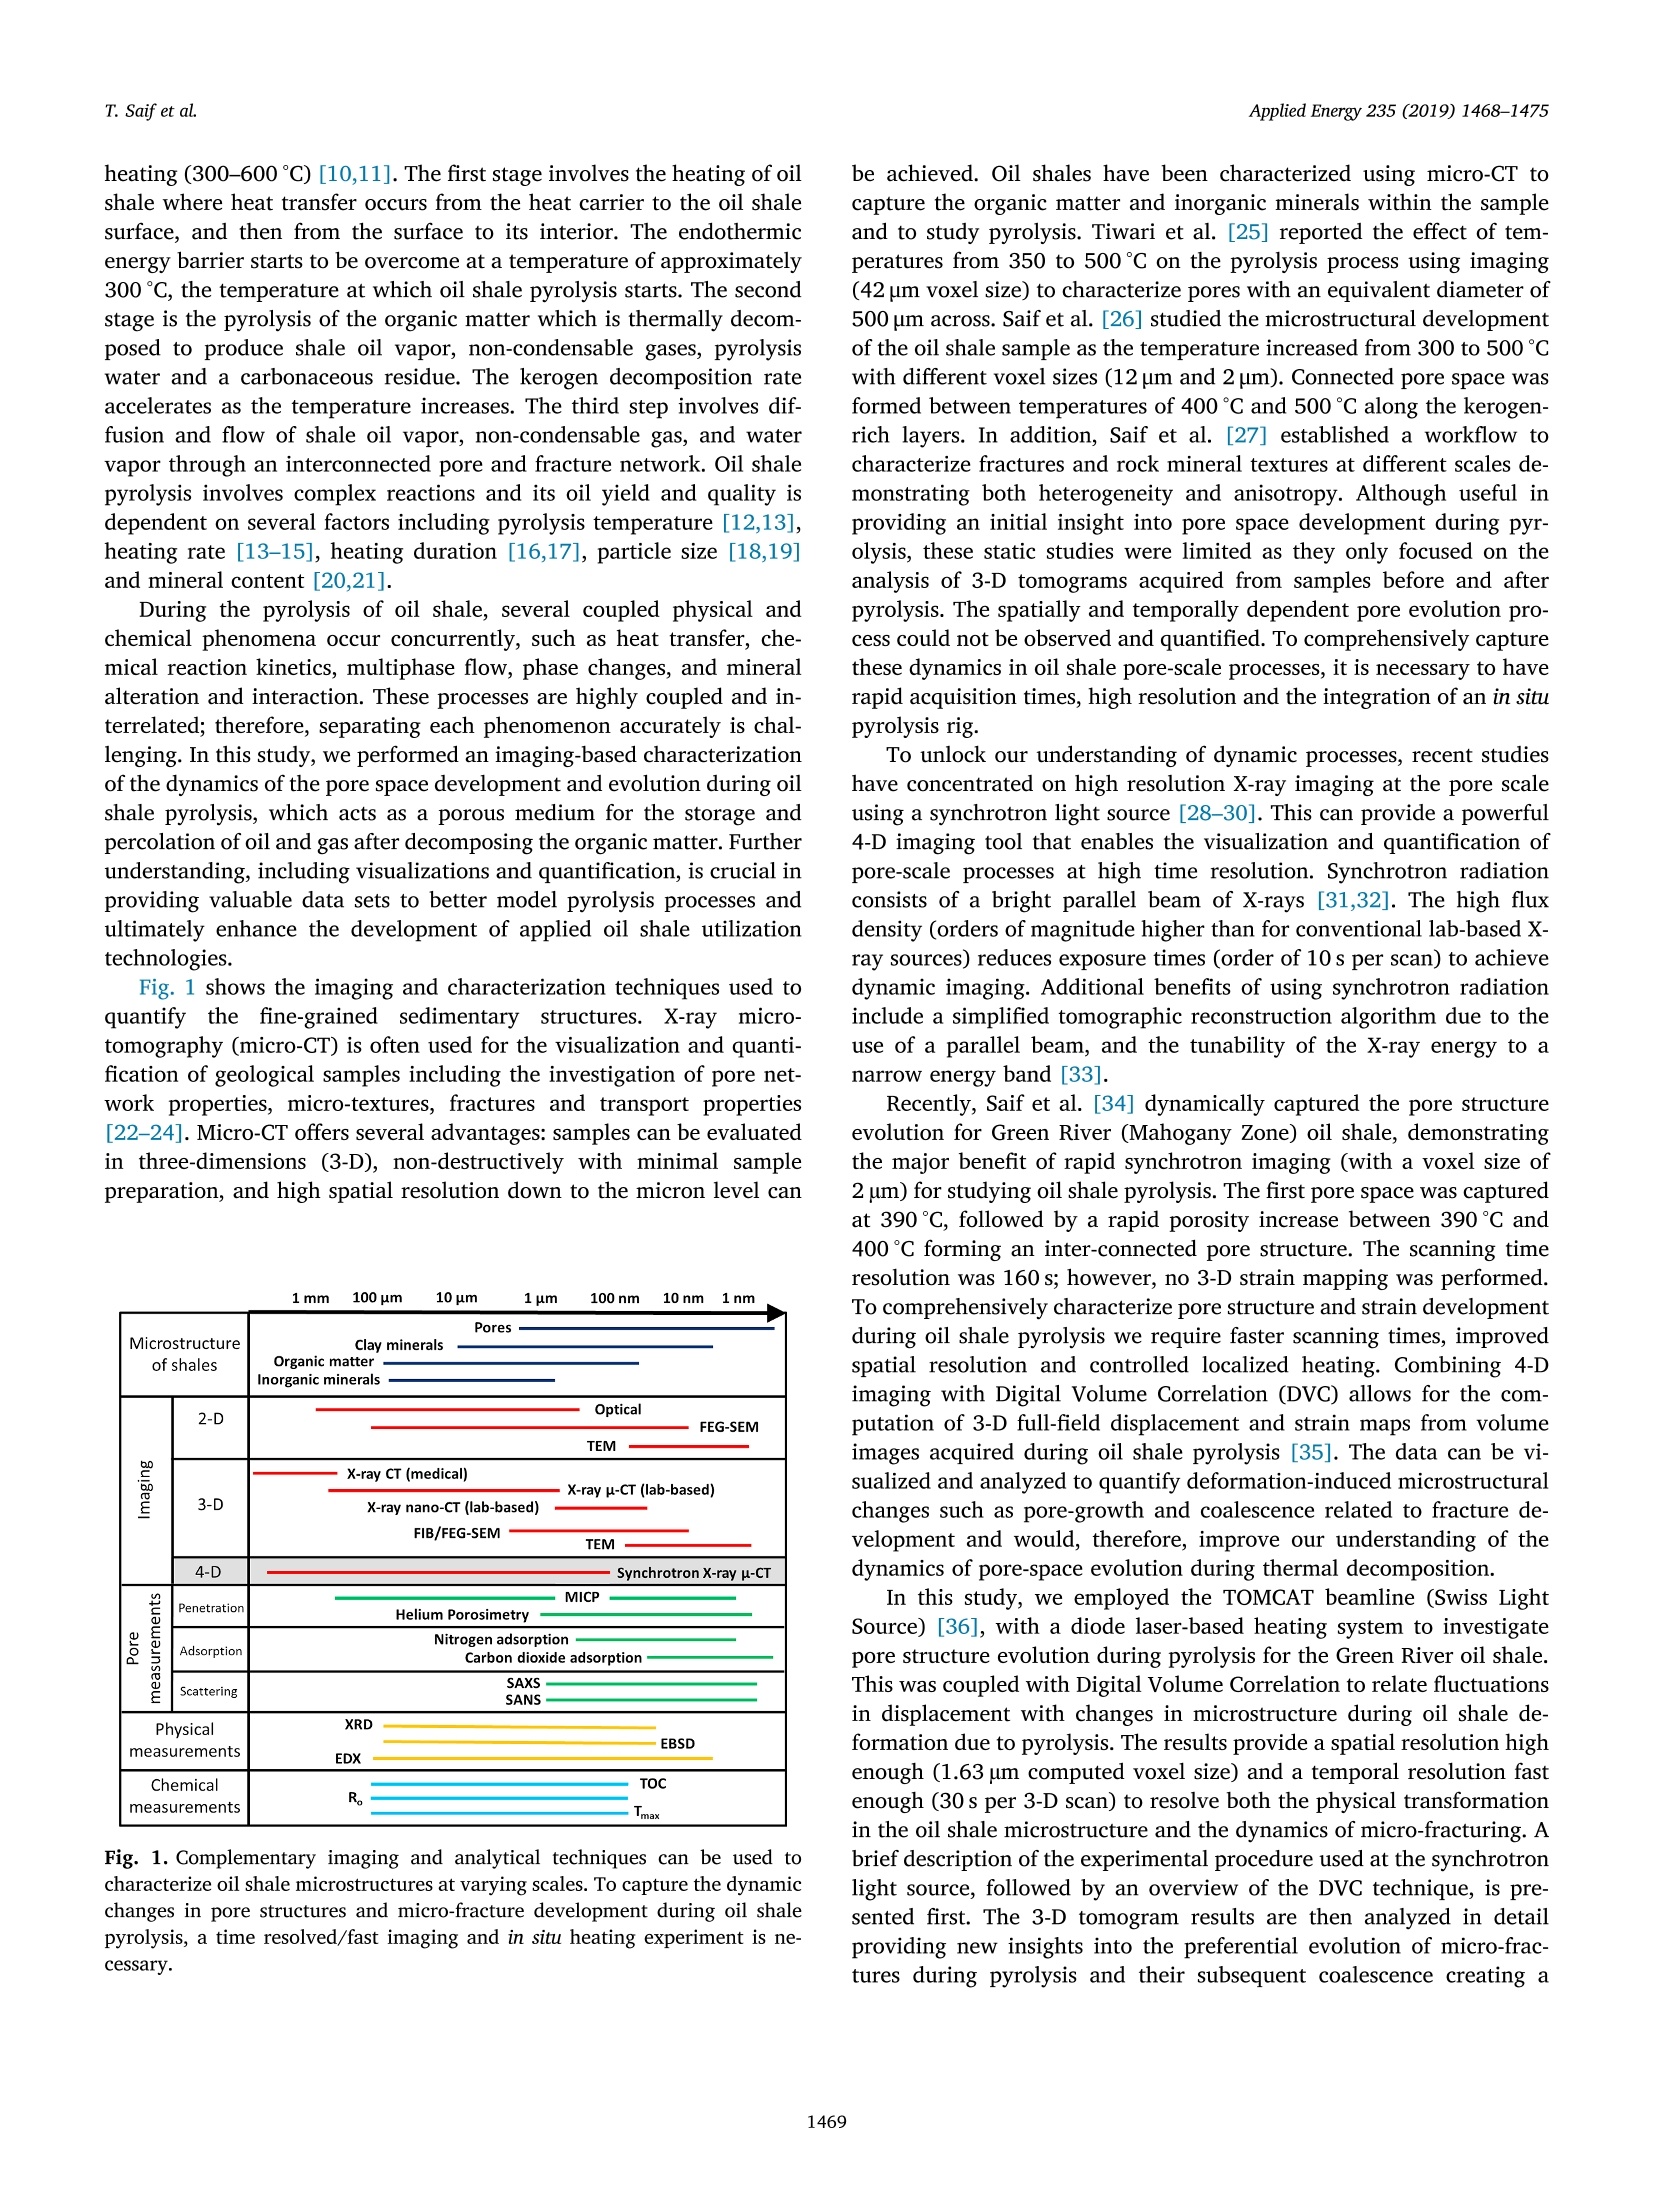
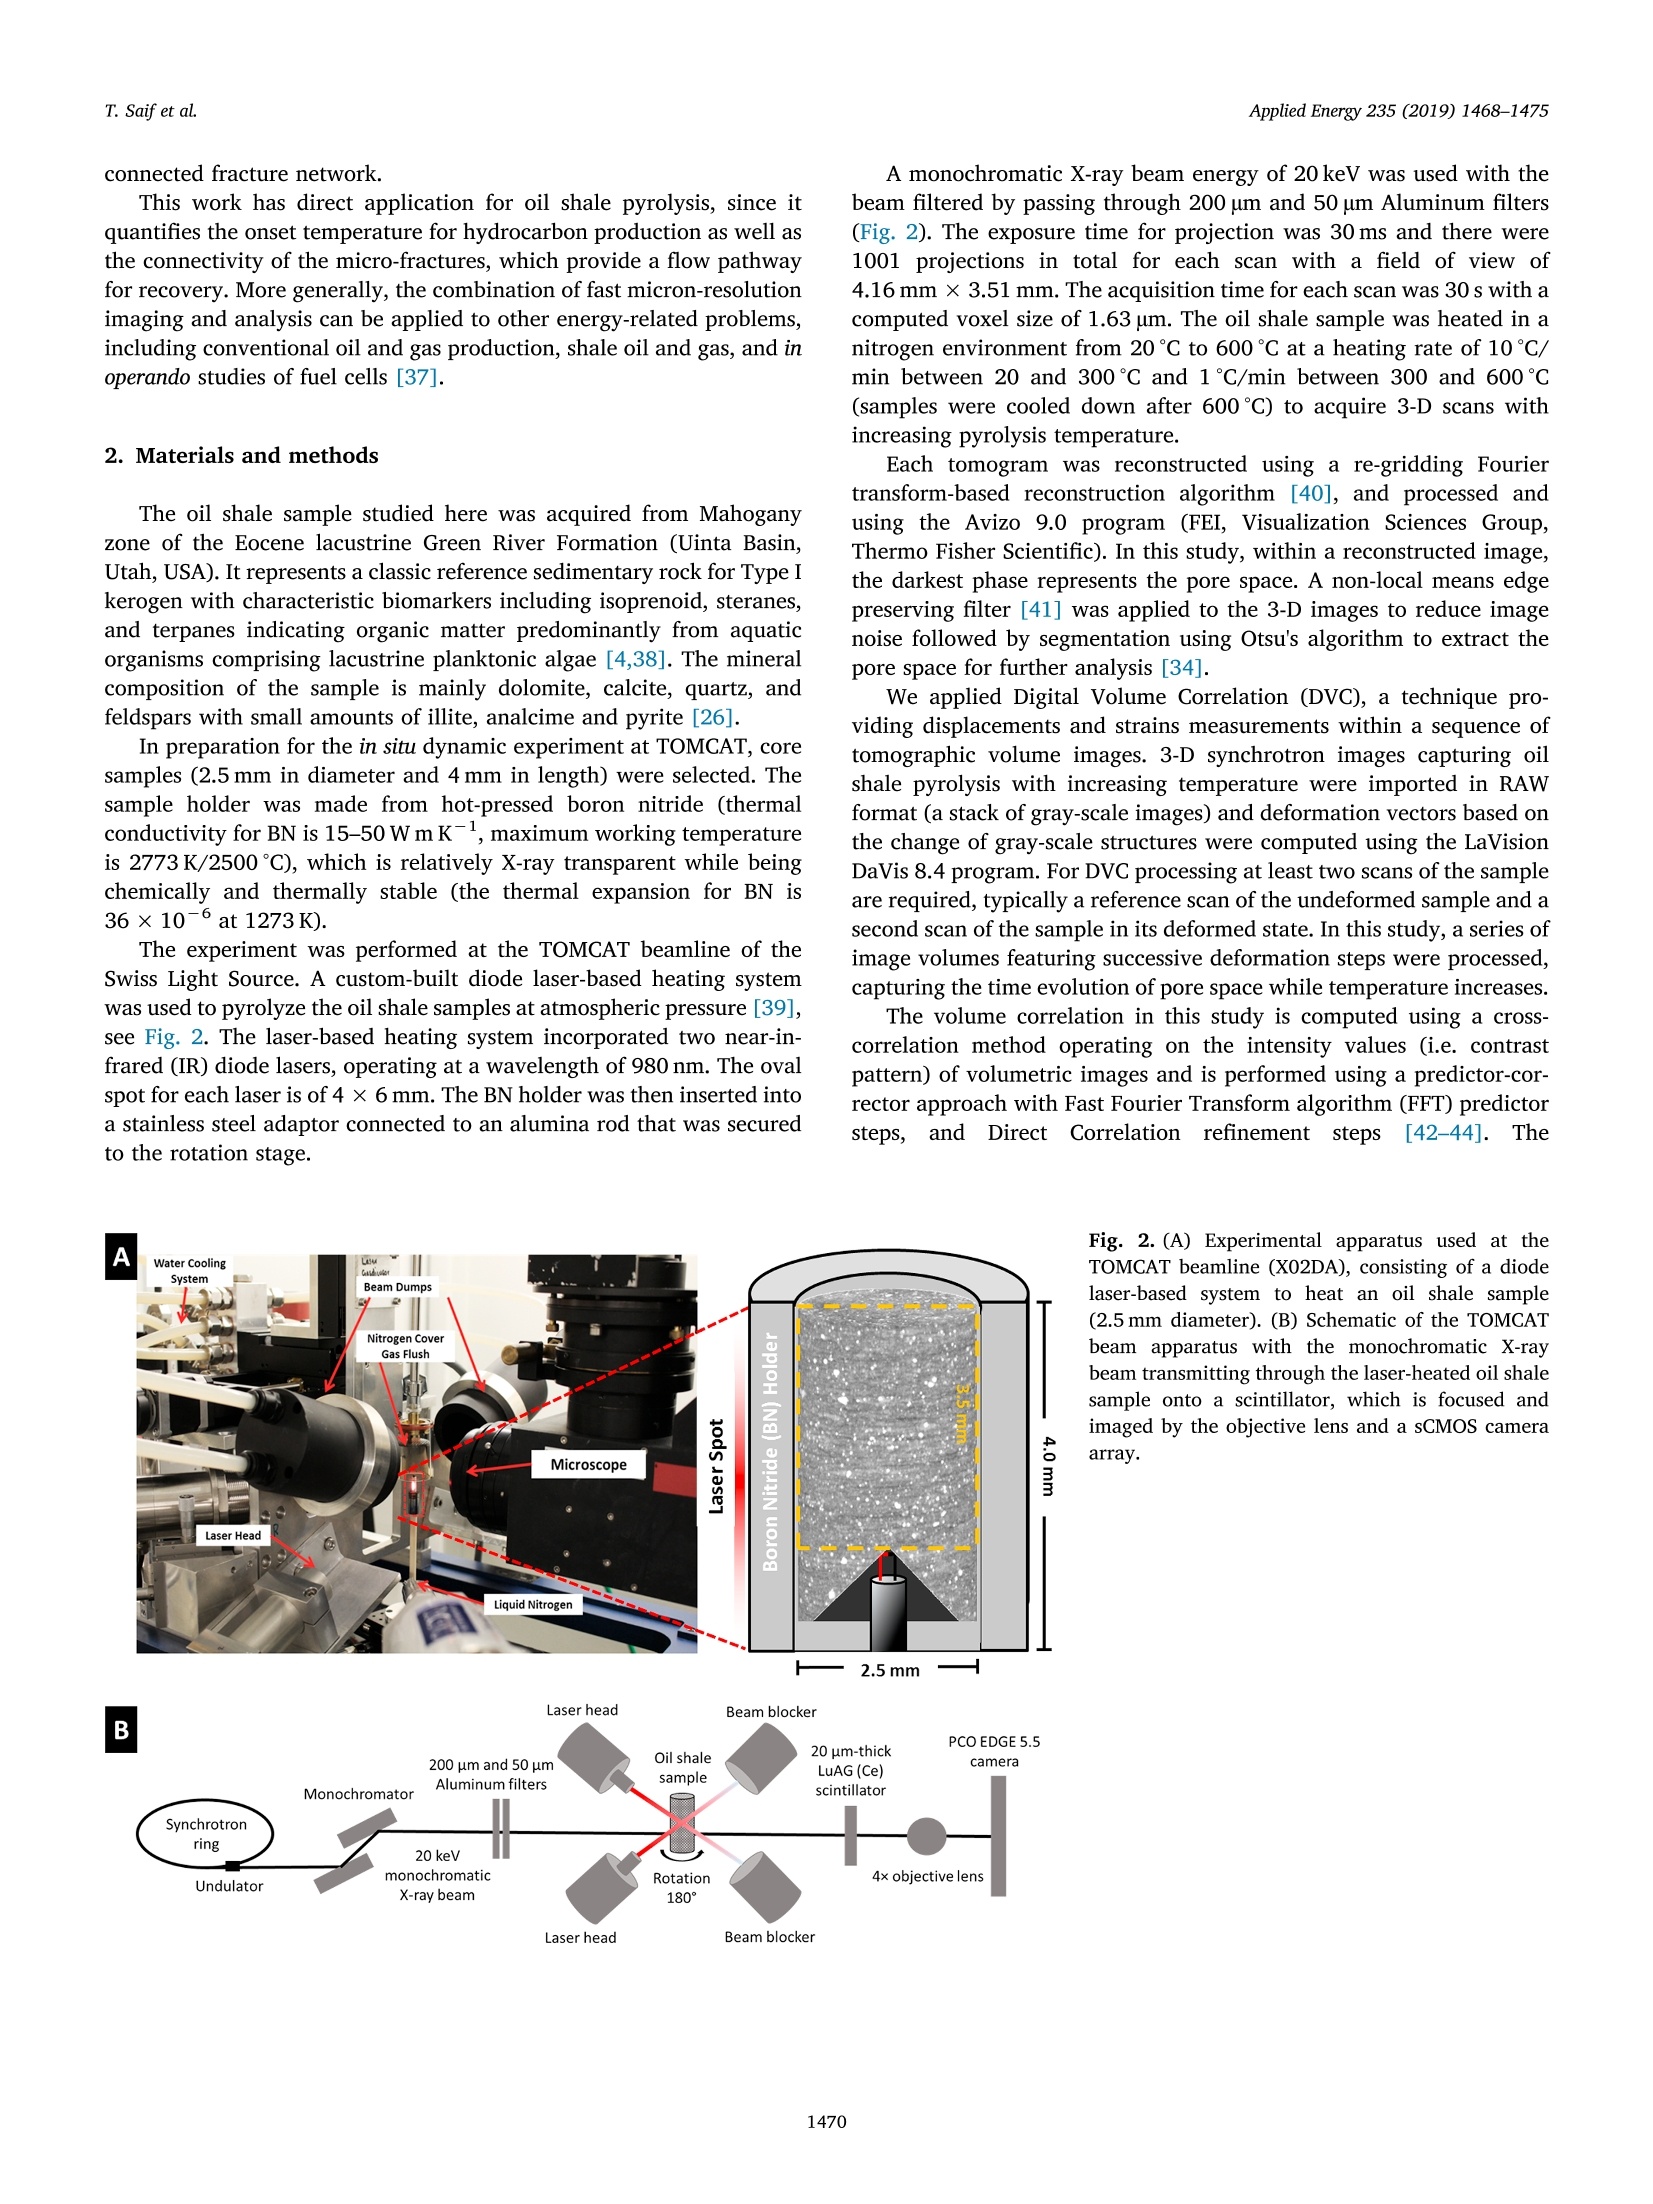
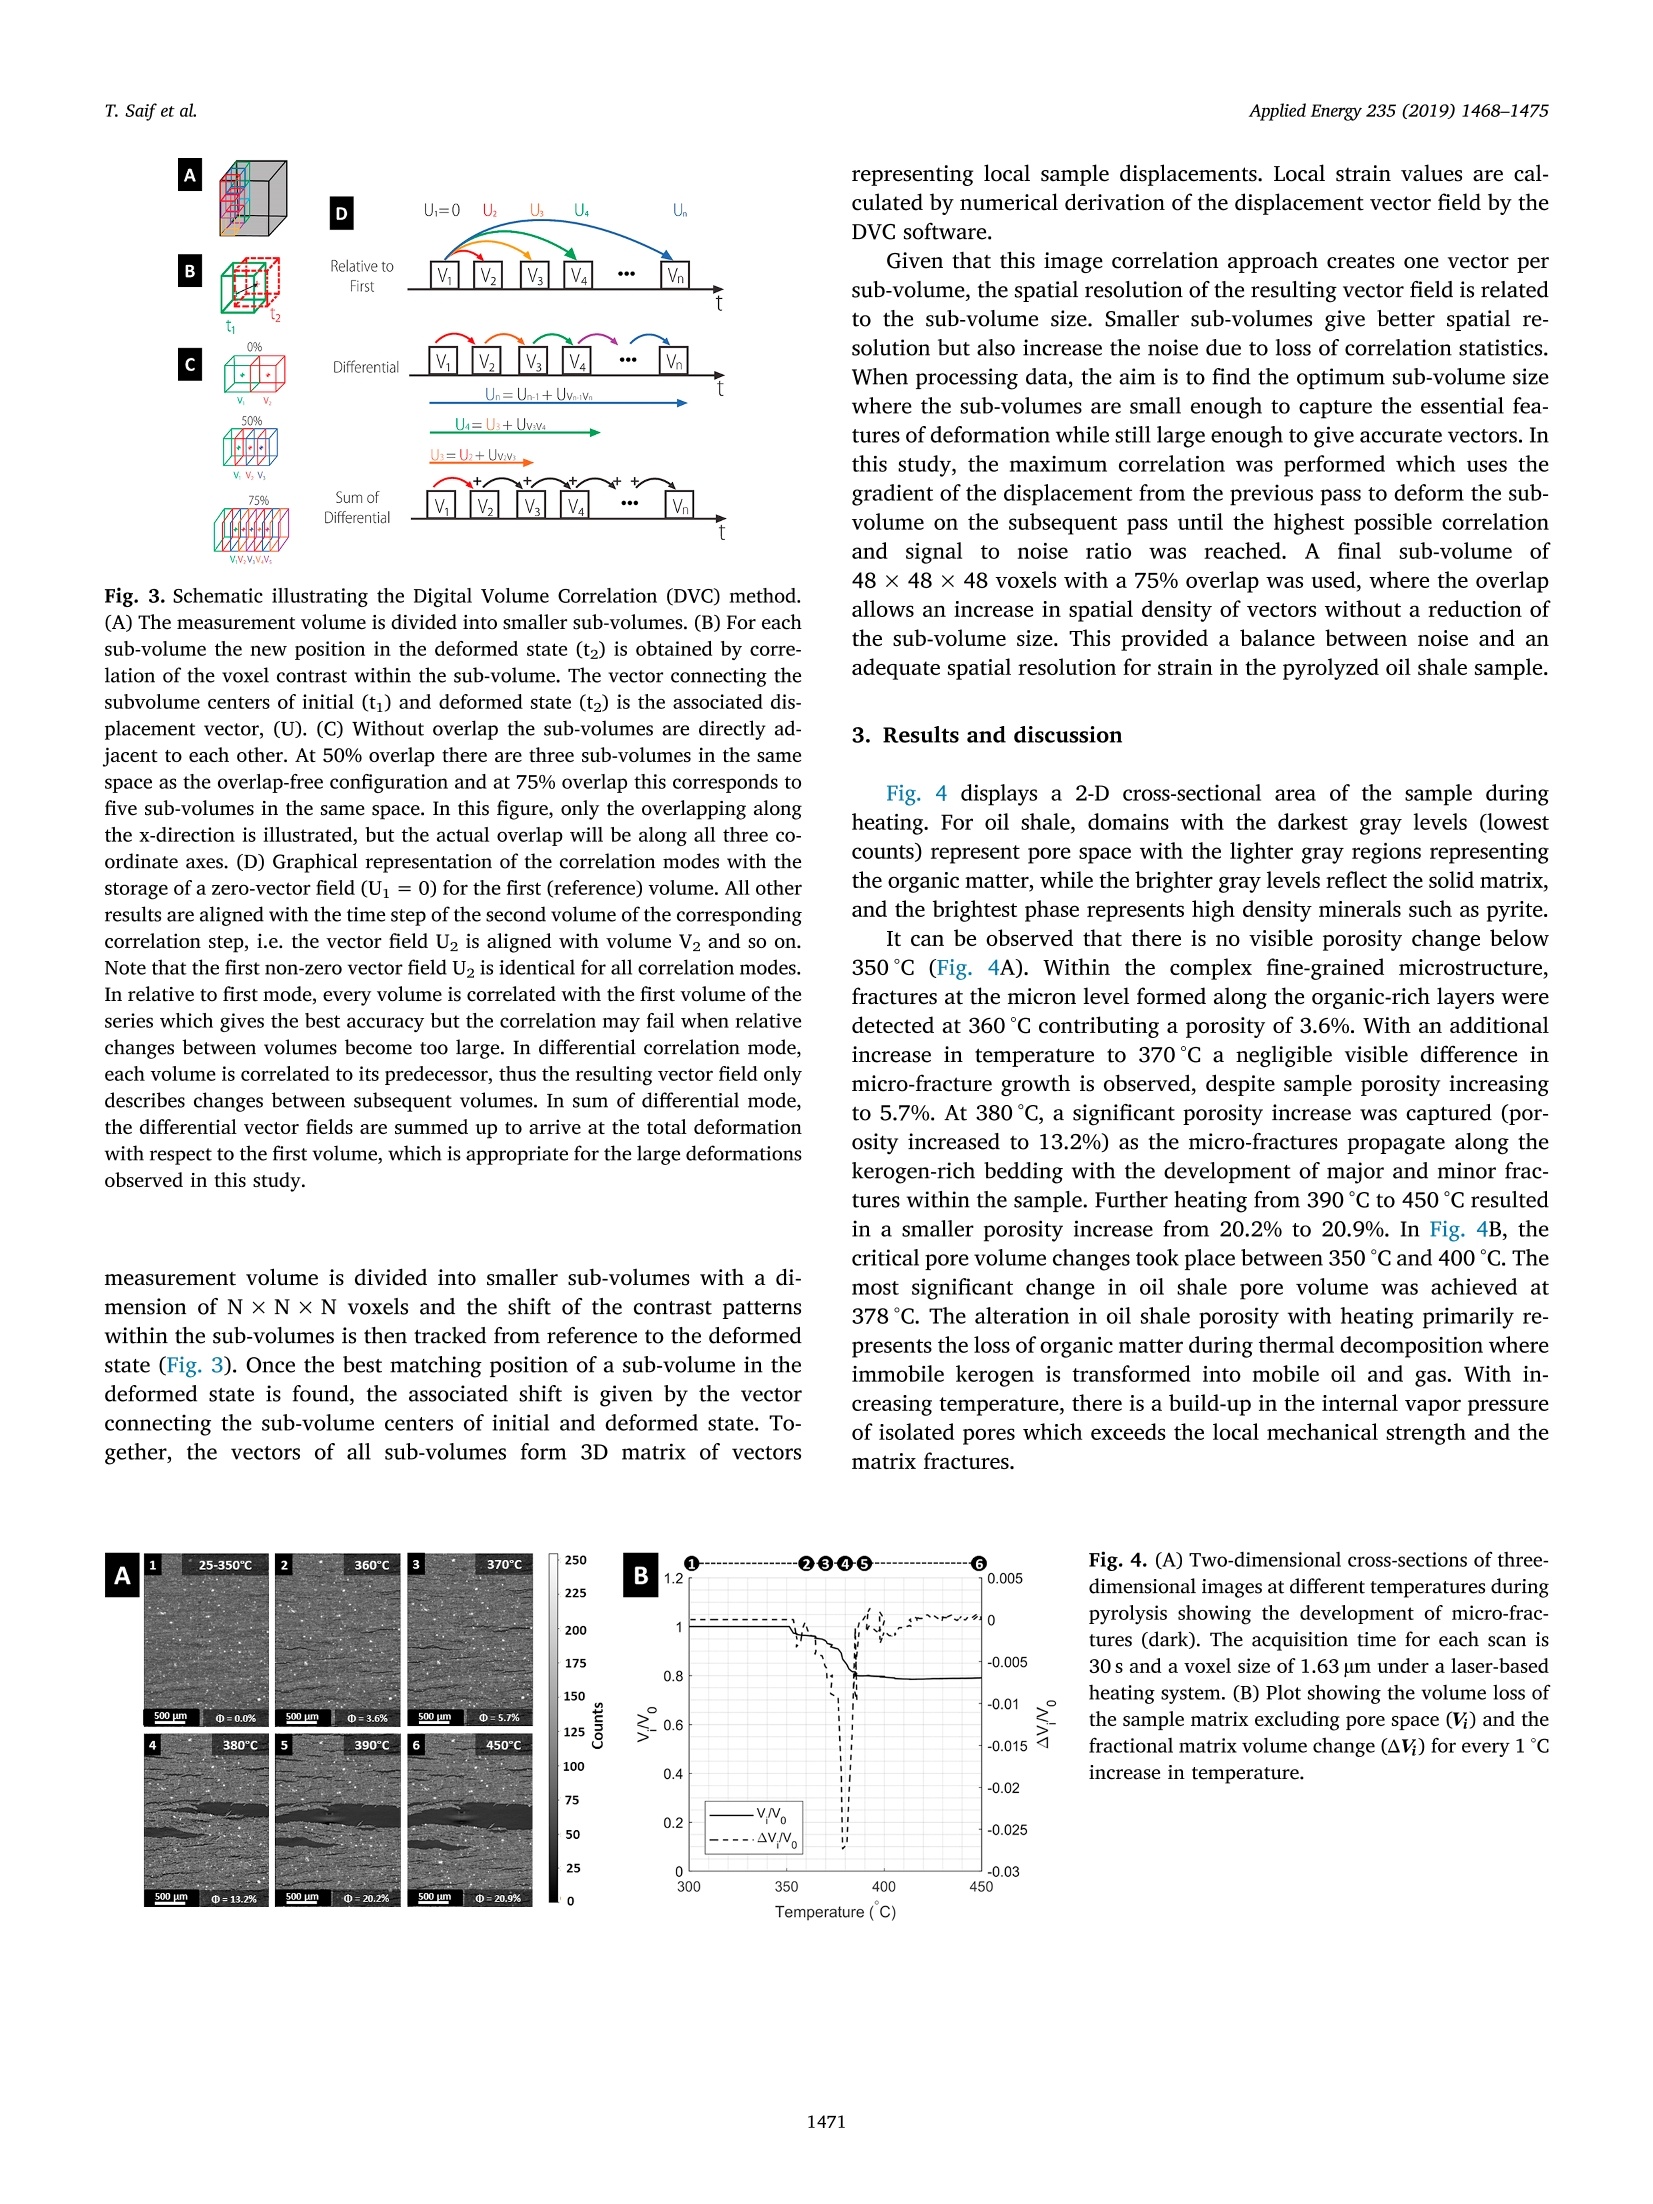
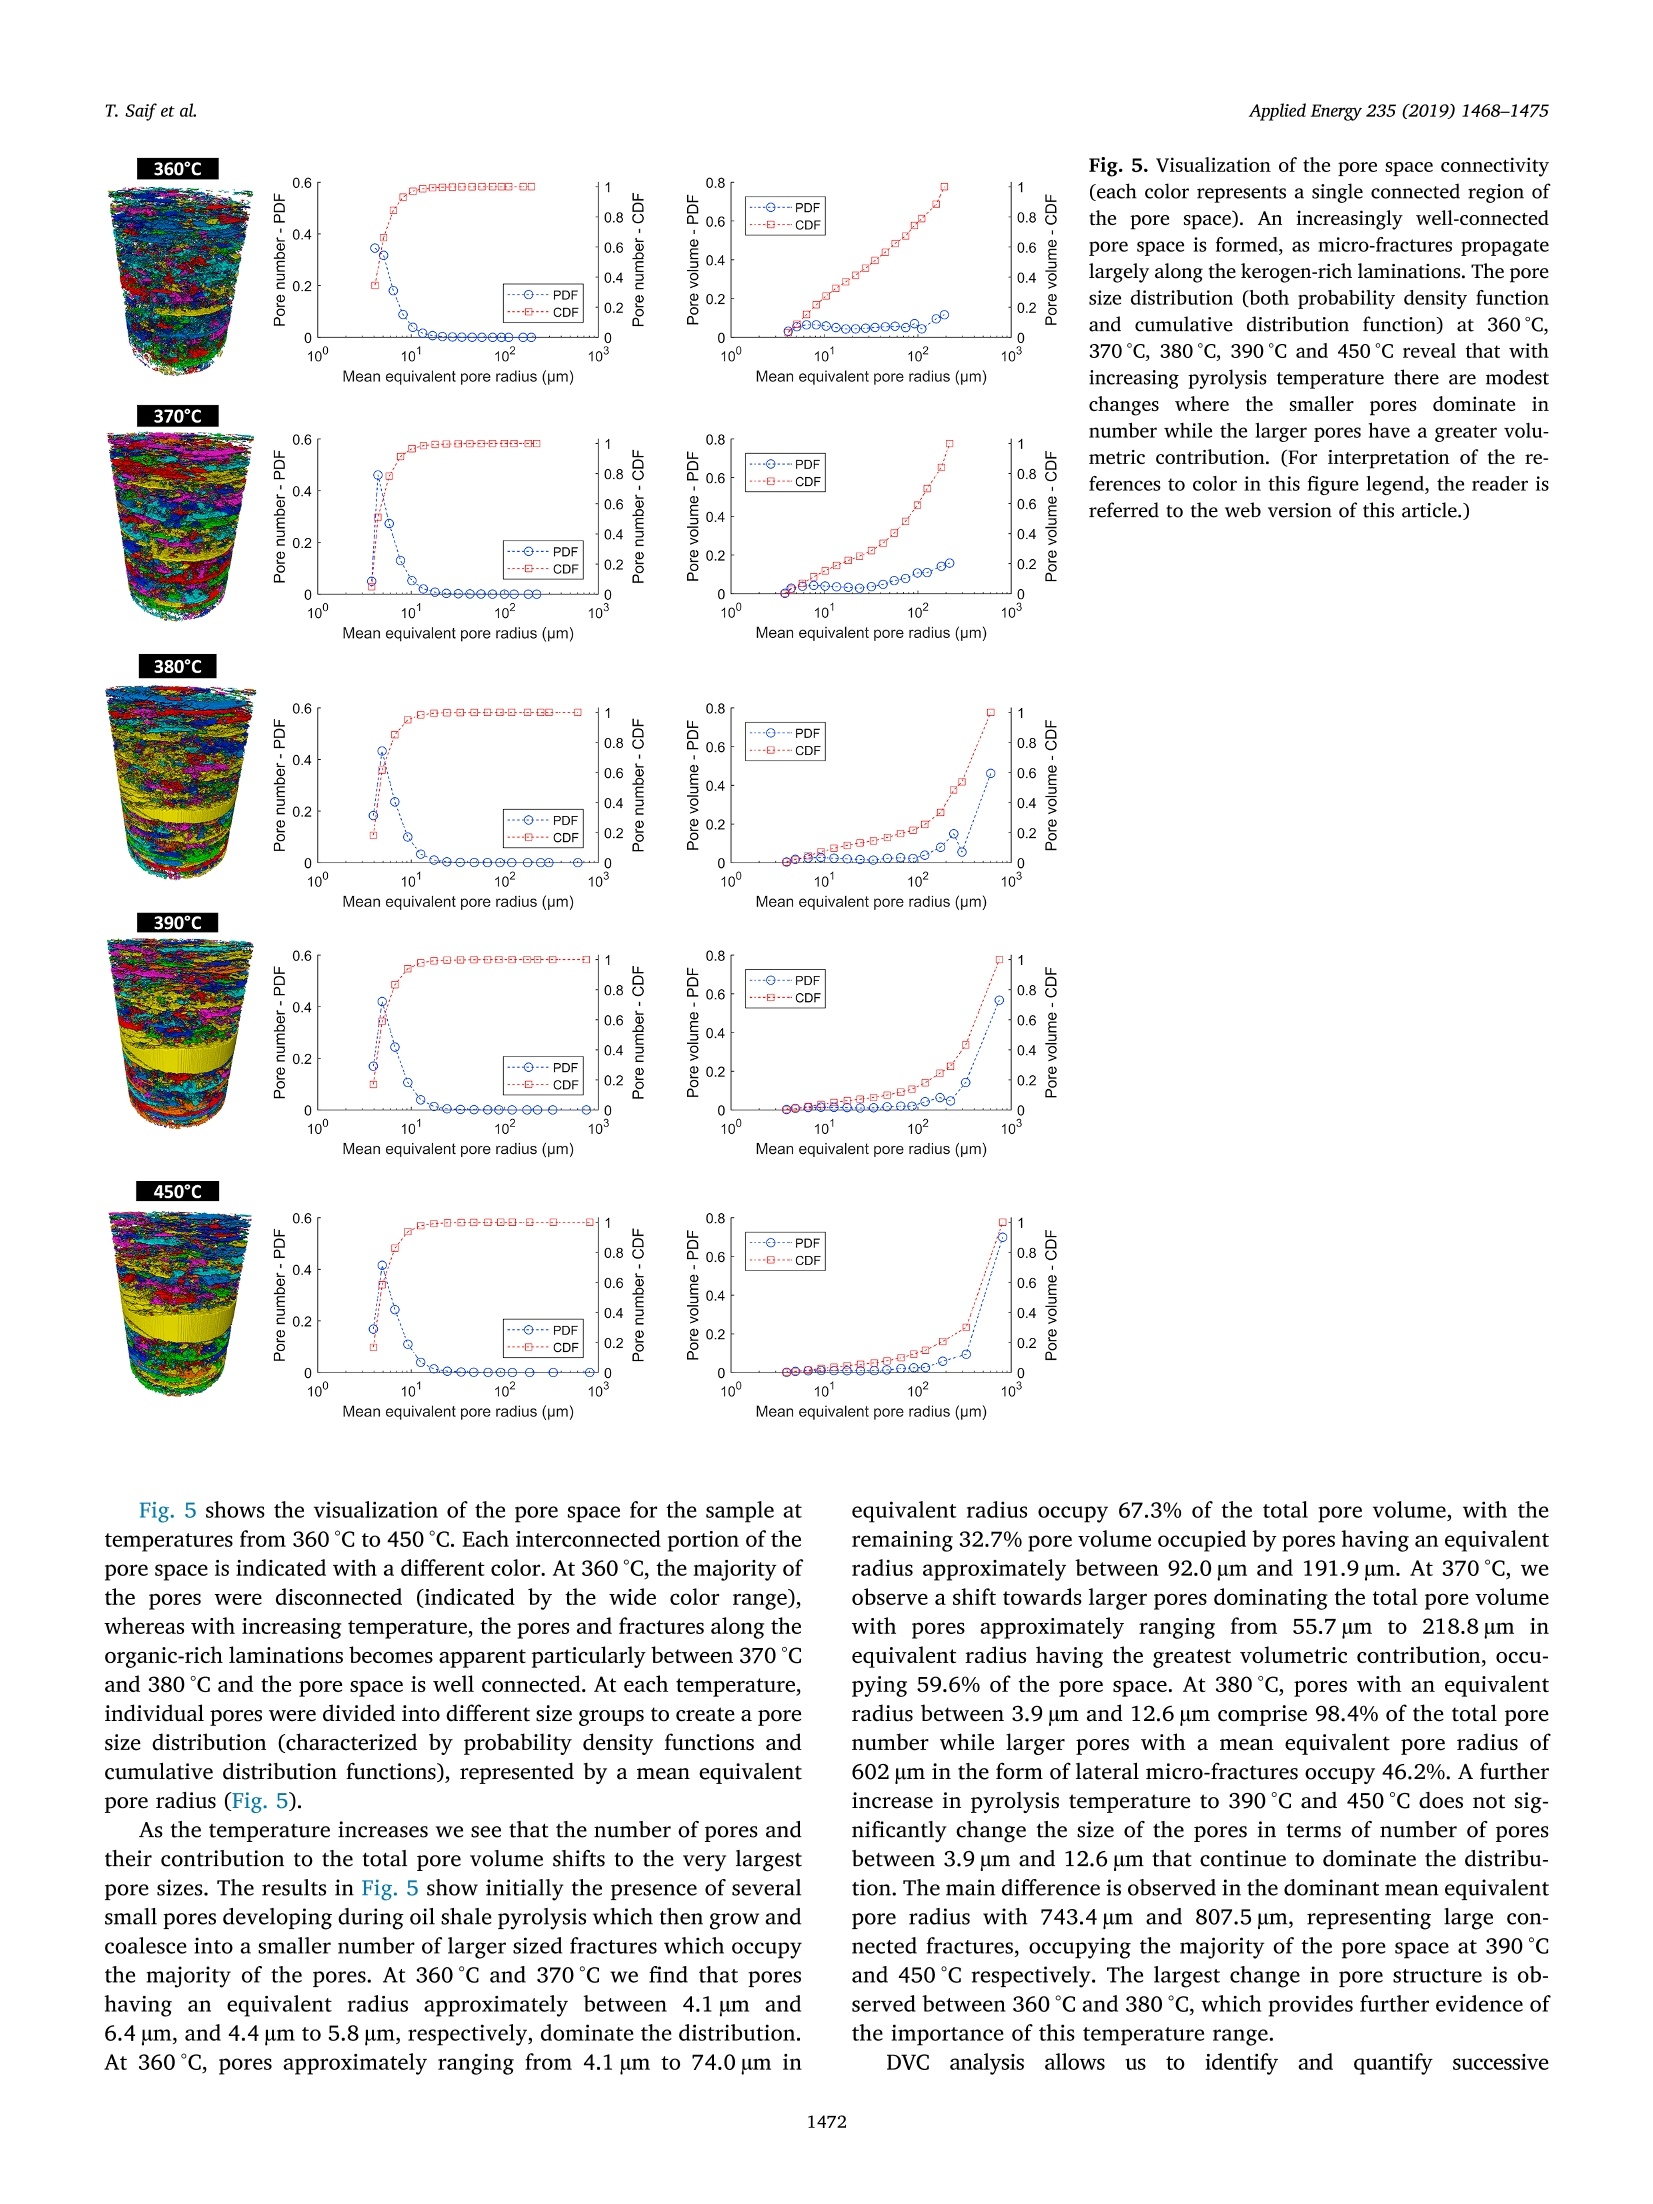
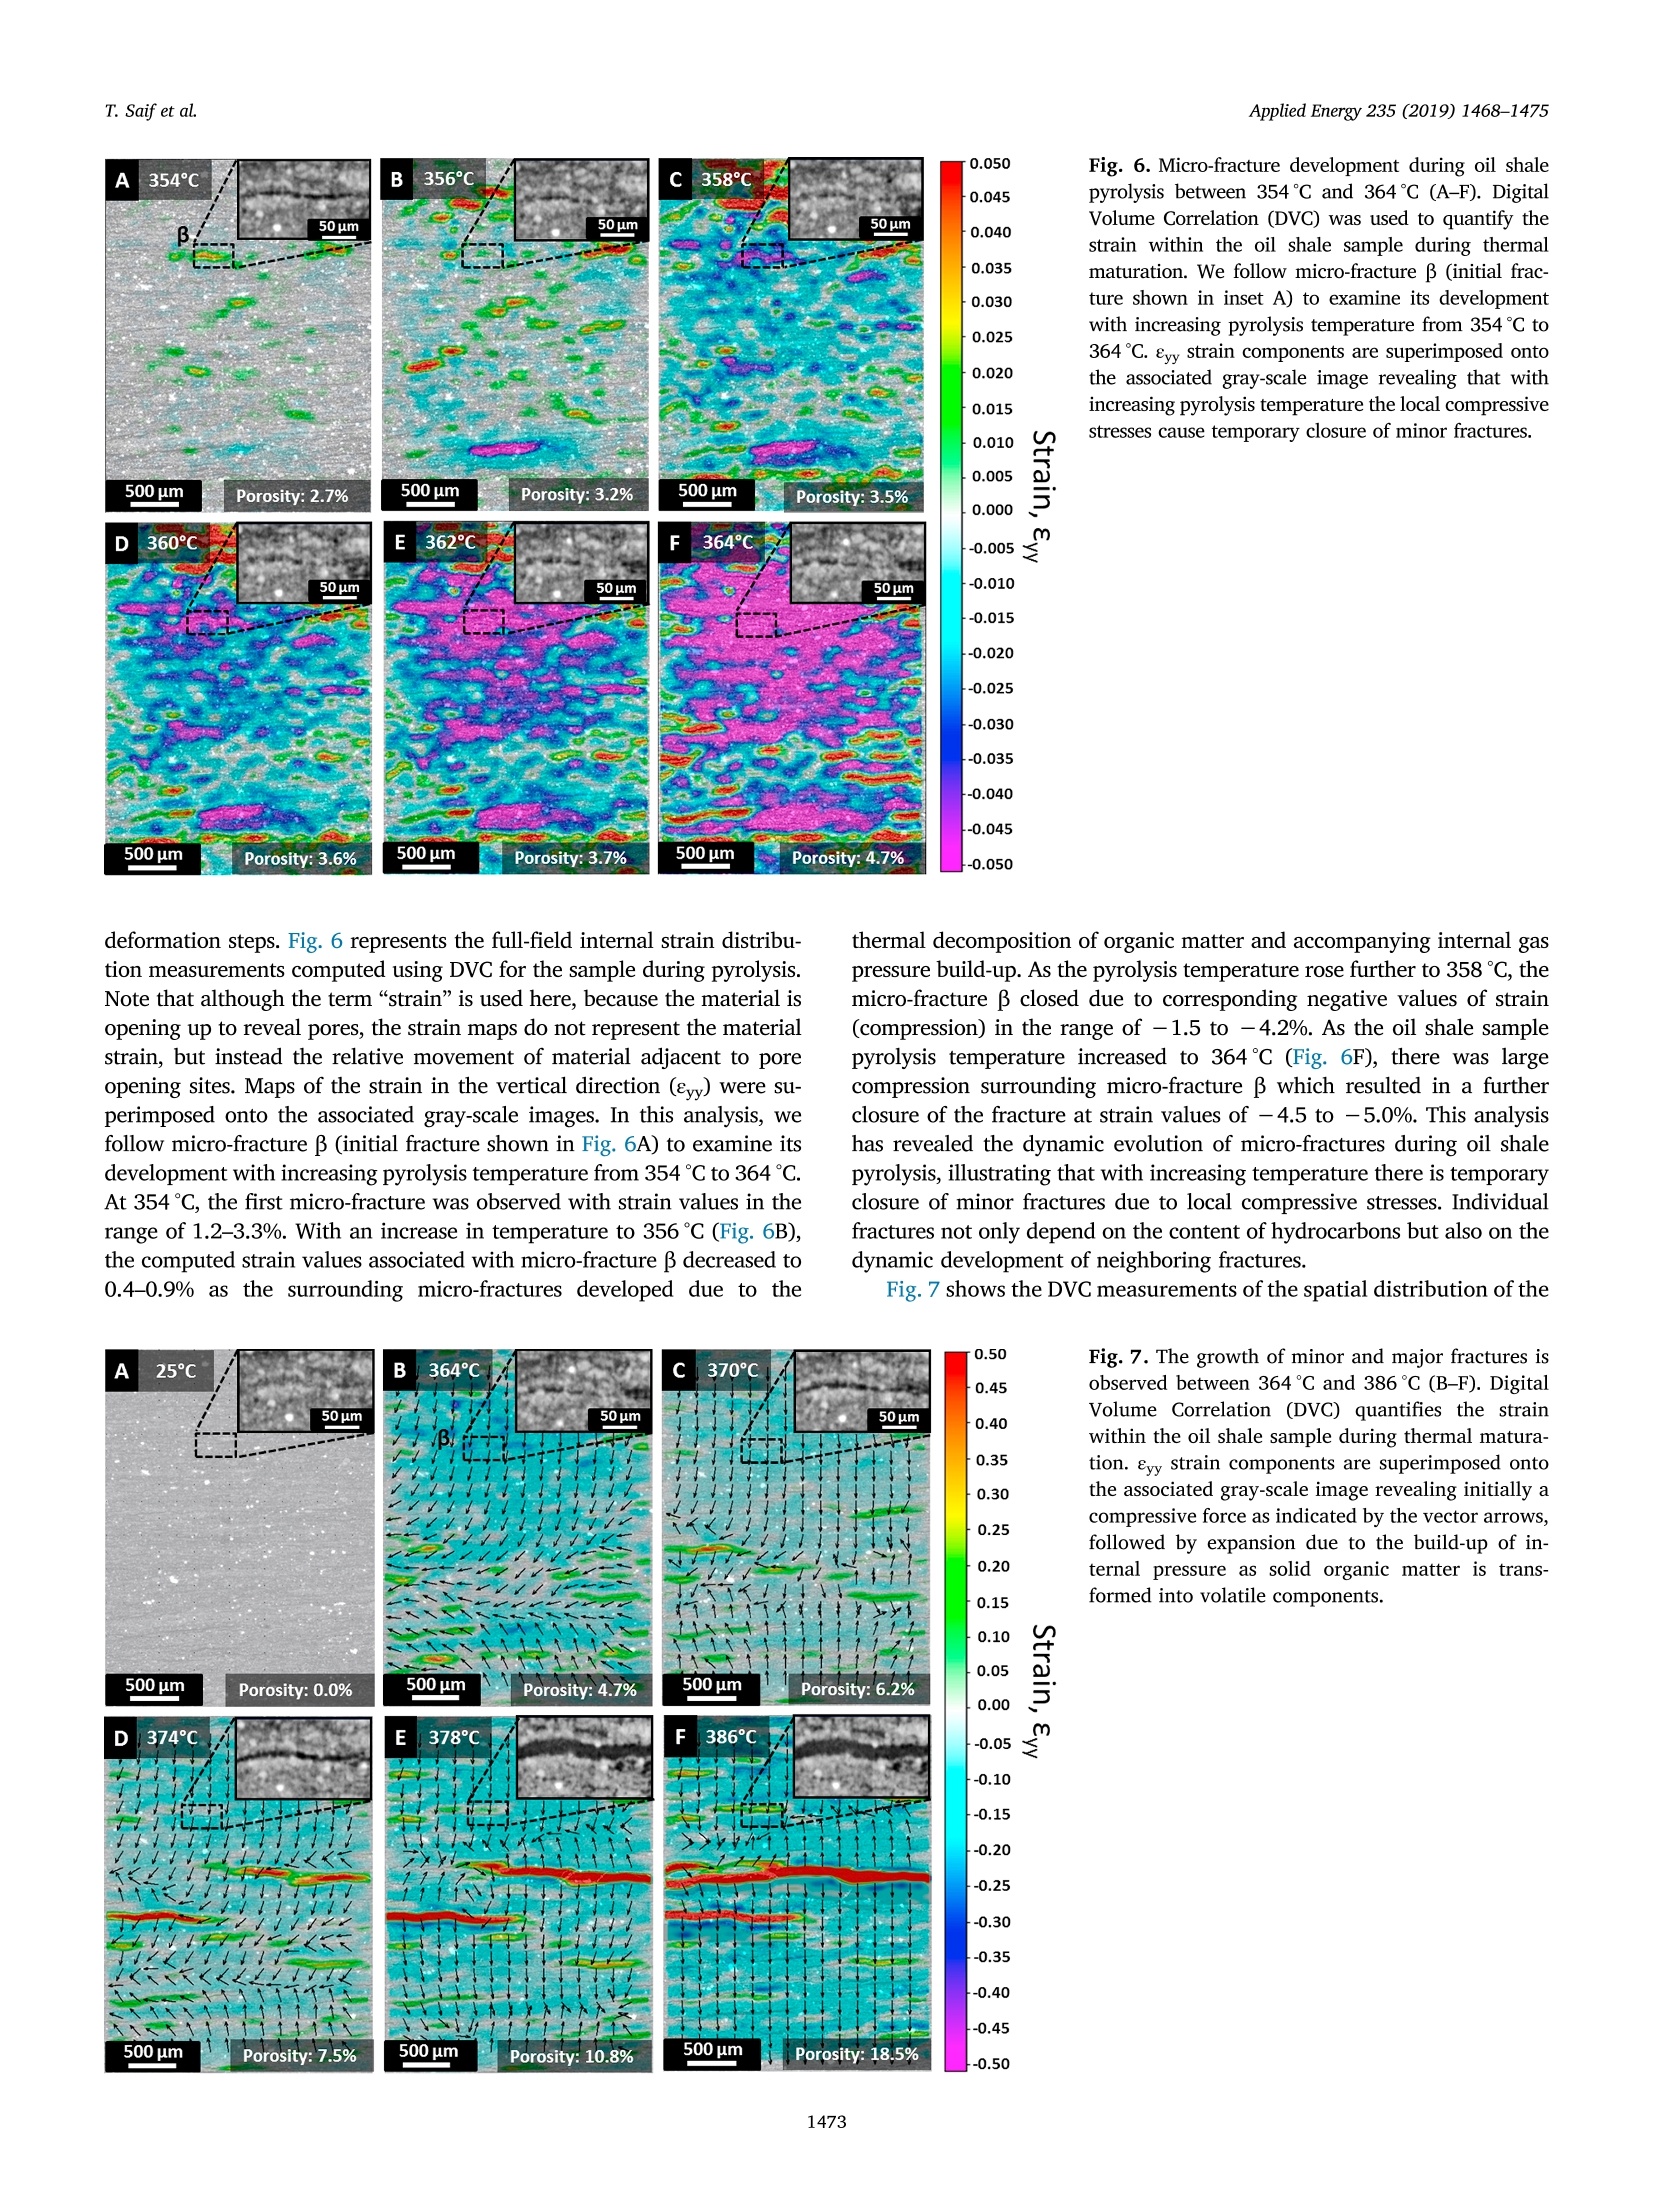
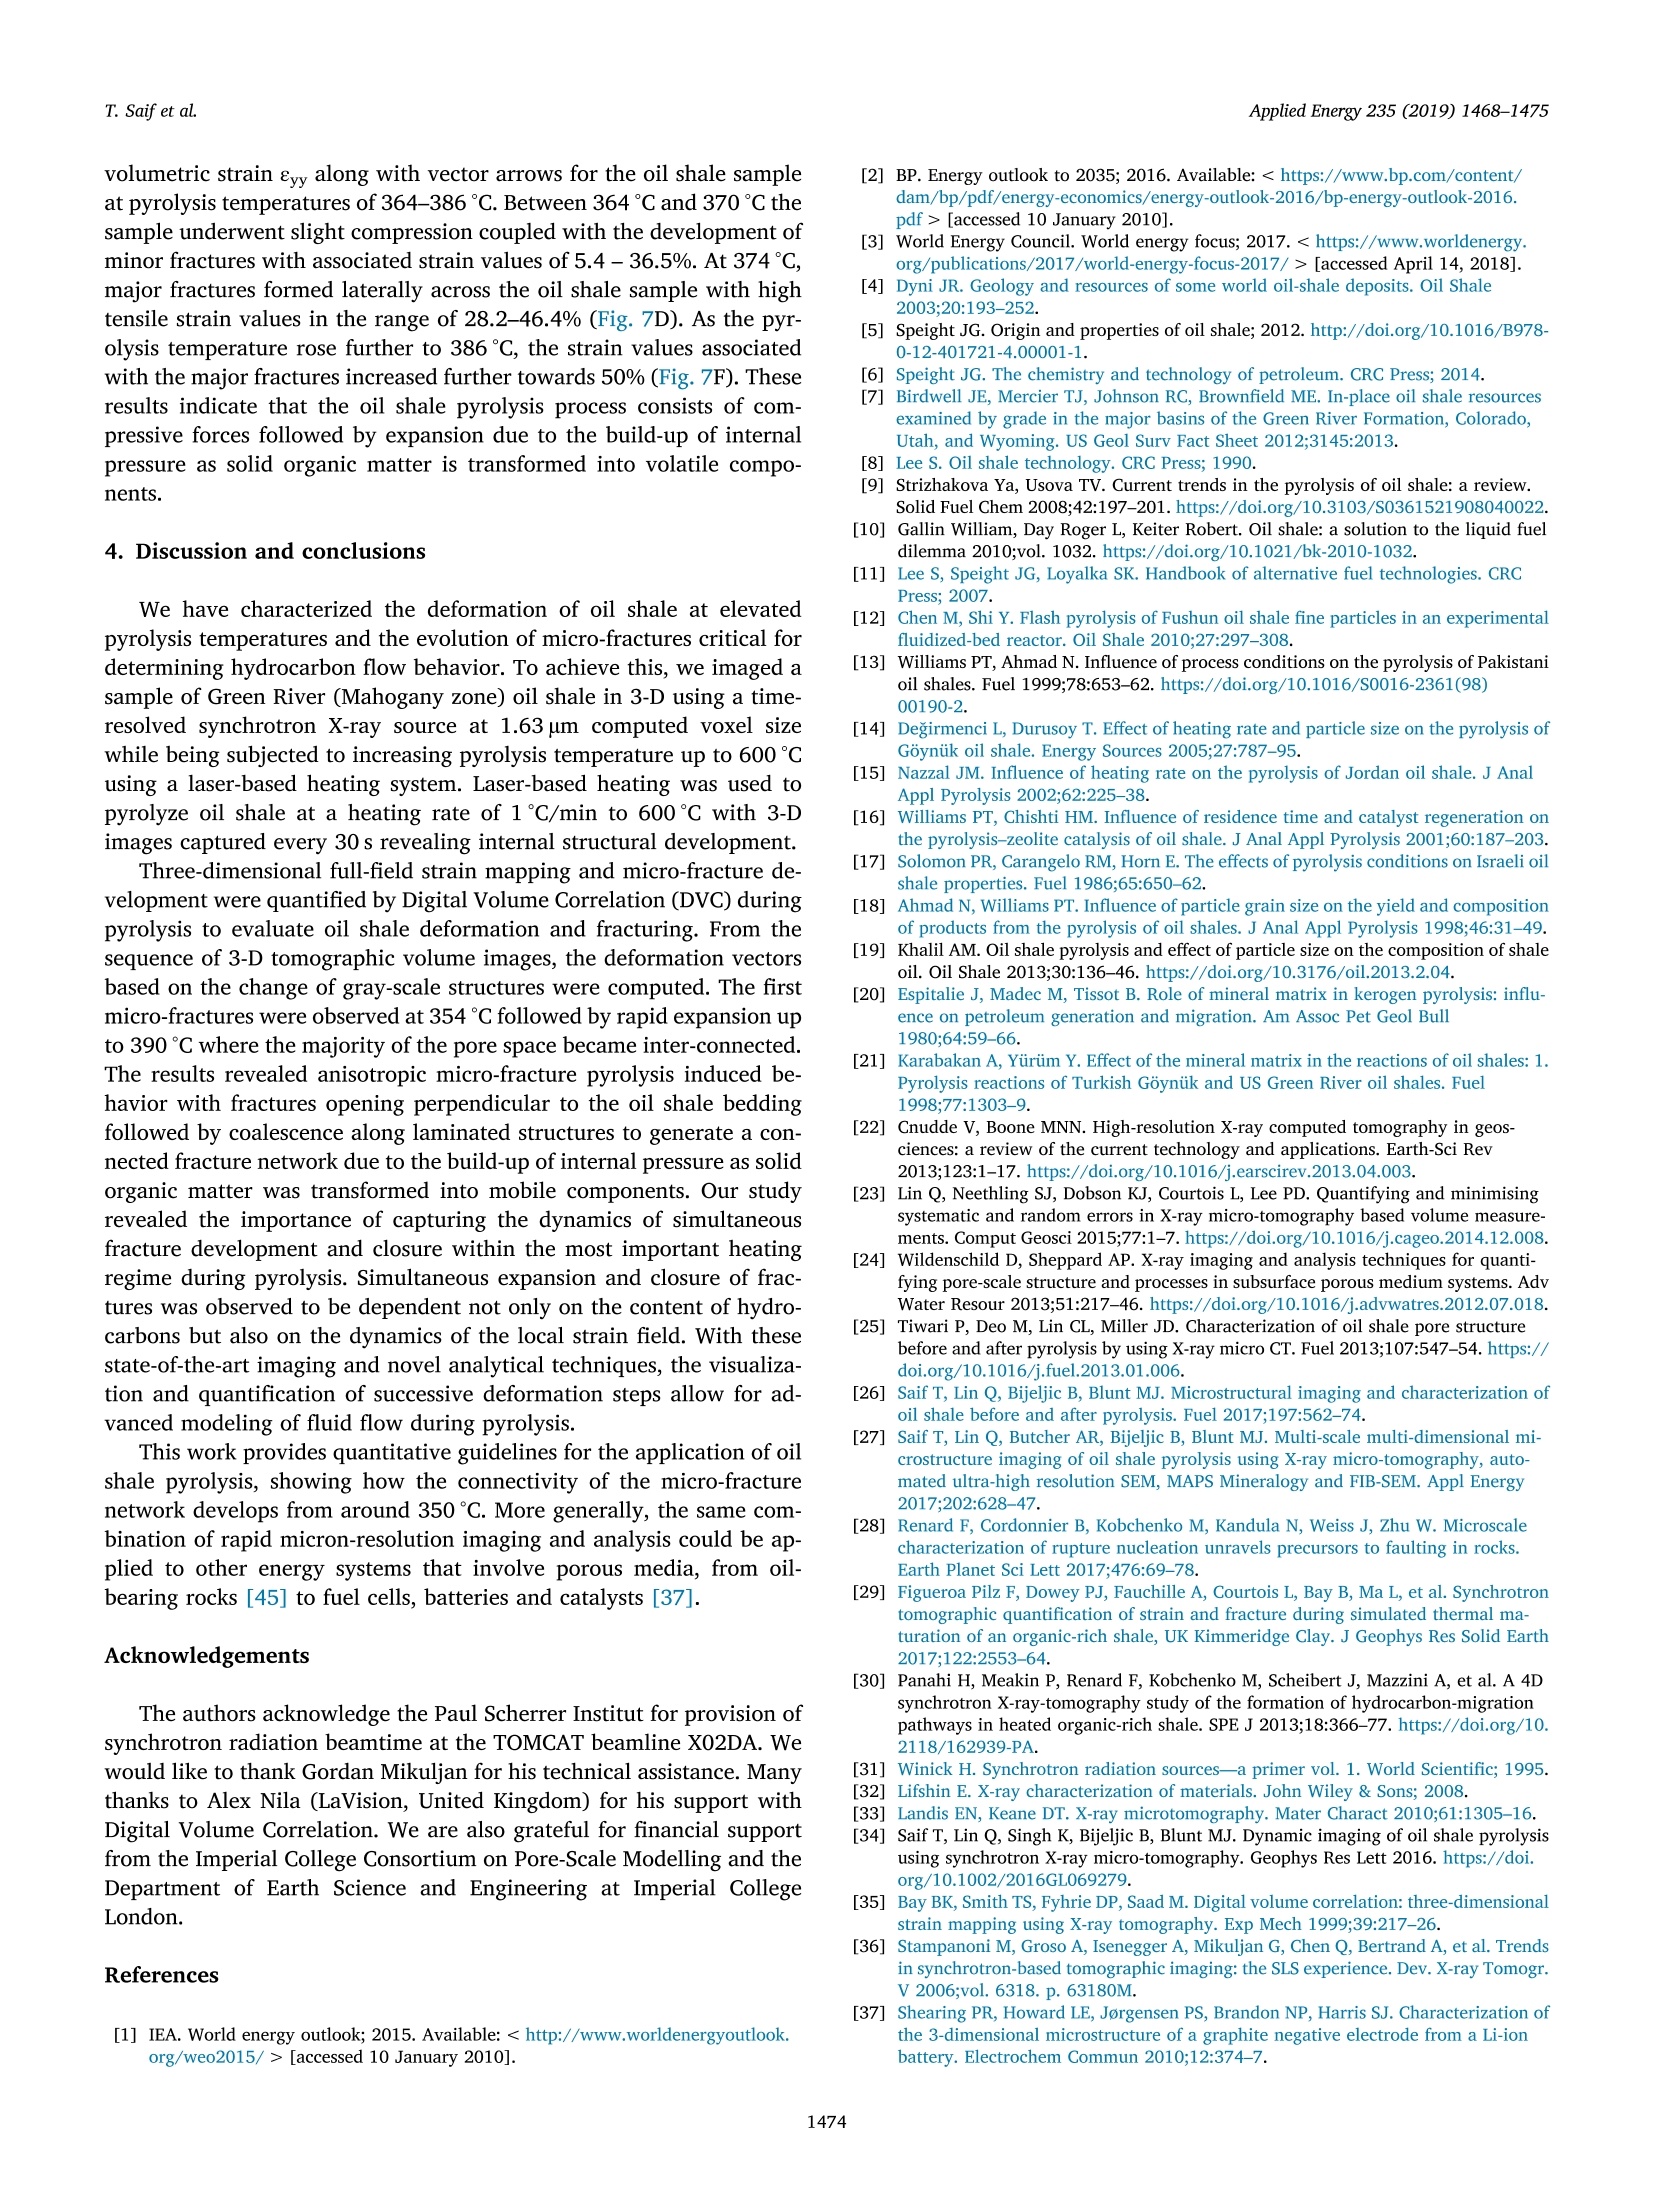
Applied Energy 235 (2019) 1468-1475Contents lists available at ScienceDirect T. Saif et al.Applied Energy 235 (2019) 1468-1475 Applied Energy journal homepage: www.elsevier.com/locate/apenergy 4D in situ synchrotron X-ray tomographic microscopy and laser-basedheating study of oil shale pyrolysis Tarik Saif, Qingyang Lin*, Ying Gao, Yousef Al-Khulaifi, Federica Marone", David Hollis ,Martin J. Blunt, Branko Bijeljic Department of Earth Science and Engineering, Imperial College London, London SW7 2AZ, UK Swiss Light Source, Paul Scherrer Institut, CH-5232 Villigen, Switzerland LaVisionUK Ltd, Grove Technology Park, Grove, Oxfordshire OX12 9FF, UK HIGHLIGHTS ·Green River oil shale pyrolysis was characterized using 4-D synchrotron imaging. ·Laser-based heating was combined with X-ray synchrotron imaging at the micron-scale. · Digital Volume Correlation was used to generate 3-D full-field strain maps. · First micro-fractures were observed at 354℃ followed by rapid pore space expansion. ·Fracture development in oil shale depends on the dynamics of the local strain field. ARTICLEINFO ABSTRACT Keywords: Oil shale Pyrolysis Fractures Synchrotron X-ray micro-tomography Digital Volume Correlation The comprehensive characterization and analysis of the evolution of micro-fracture networks in oil shales duringpyrolysis is important to understand the complex petrophysical changes during hydrocarbon recovery. We usedtime-resolved X-ray microtomography to perform pore-scale dynamic imaging with a synchrotron light source tocapture in 4-D (three-dimensional image + real time) the evolution of fracture initiation, growth, coalescenceand closure. A laser-based heating system was used to pyrolyze a sample of Eocene Green River (MahoganyZone) up to 600℃ with tomograms acquired every 30 s at 1.63 um computed voxel size and analyzed usingDigital Volume Correlation (DVC) for full 3-D strain and deformation maps. At 354℃ the first isolated micro-fractures were observed and by 378C, a connected fracture network was formed as the solid organic matter wastransformed into volatile hydrocarbon components. With increasing temperature, we observed simultaneouspore space growth and coalescence as well as temporary closure of minor fractures caused by local compressivestresses. This indicates that the evolution of individual fractures not only depends on organic matter compositionbut also on the dynamic development of neighboring fractures. Our results demonstrate that combining syn-chrotron X-ray tomography, laser-based heating and DVC provides a powerful methodology for characterizingdynamics of multi-scale physical changes during oil shale pyrolysis to help optimize hydrocarbon recovery. As global conventional oil supplies begin to plateau, the energyindustry is investing significantly to identify, probe, recover, and pro-cess oil and gas that was once unknown, or difficult to be accessed orrecovered [1-3]. Oil shale is an unconventional energy resource withmore than 600 known deposits [4,5]. The potential value of an oil shaledeposit is predominantly dependent on its thickness, depth and organiccontent [4,6]. The Eocene Green River Formation represents the world’s largest deposit with sedimentary structures spanning 65,000 kmacrossWyoming, Colorado and Utah with an estimated oil reserves of 4.3trillion barrels [4,7]. Oil shale is a fine-grained sedimentary rock consisting of organicmatter that releases hydrocarbons (shale oil) and combustible gasduring pyrolysis [5,8]. One key advantage of producing energy from oilshales over conventional fossil fuels is that it has relatively higher hy-drogen to carbon atomic ratios and lower oxygen to carbon ratios [9].The pyrolysis of oil shale refers to its thermal processing by anaerobic ( E-mail address: q.li n 1 1 @imp e rial. a c.uk ( Q. L in). ) ( h t t ps://doi.org/ 1 0.1016/j.apenergy . 2018.11 . 0 44 ) ( Received 1 8 July 2018; Received in revise d for m 10 November 2018; Accepted 12 November 2018 ) ( 0306-2619/C 201 8 The Authors. Published by Elsevier Ltd. This is an ope n access article under the CC BY l icense ) During the pyrolysis of oil shale, several coupled physical andchemical phenomena occur concurrently, such as heat transfer, che-mical reaction kinetics, multiphase flow, phase changes, and mineralalteration and interaction. These processes are highly coupled and in-terrelated; therefore, separating each phenomenon accurately is chal-lenging. In this study, we performed an imaging-based characterizationof the dynamics of the pore space development and evolution during oilshale pyrolysis, which acts as a porous medium for the storage andpercolation of oil and gas after decomposing the organic matter. Furtherunderstanding, including visualizations and quantification, is crucial inproviding valuable data sets to better model pyrolysis processes andultimately enhance the development of applied oil shale utilizationtechnologies. Fig. 1 shows the imaging and characterization techniques used toquantify the fine-grained sedimentary structures. X-ray micro-tomography (micro-CT) is often used for the visualization and quanti-fication of geological samples including the investigation of pore net-work properties, micro-textures, fractures and transport properties[22-24].Micro-CT offers several advantages: samples can be evaluatedin three-dimensions (3-D), non-destructively with minimal samplepreparation, and high spatial resolution down to the micron level can Microstructureof shales PoresClay minerals Organic matter Inorganic minerals· cE- 2-D 3-D ·X-ray CT (medical)X-ray p-CT(lab-based) X-ray nano-CT(lab-based) FIB/FEG-SEM TEM一 4-D co二 Penetration MICPHelium Porosimetry Adsorption Nitrogen adsorption -Carbon dioxide adsorption· Scattering SAXSSANS· Physicalmeasurements EBSD EDX Chemicalmeasurements TOC R。 Fig. 1. Complementary imaging and analytical techniques can be used tocharacterize oil shale microstructures at varying scales. To capture the dynamicchanges in pore structures and micro-fracture development during oil shalepyrolysis, a time resolved/fast imaging and in situ heating experiment is ne-cessary. be achieved. Oil shales have been characterized using micro-CT tocapture the organic matter and inorganic minerals within the sampleand to study pyrolysis. Tiwari et al. [25] reported the effect of tem-peratures from 350 to 500℃ on the pyrolysis process using imaging(42 um voxel size) to characterize pores with an equivalent diameter of500 um across. Saif et al. [26] studied the microstructural developmentof the oil shale sample as the temperature increased from 300 to 500℃with different voxel sizes (12 um and 2 um). Connected pore space wasformed between temperatures of 400 ℃ and 500℃ along the kerogen-rich layers. In addition, Saif et al. [27] established a workflow tocharacterize fractures and rock mineral textures at different scales de-monstrating both heterogeneity and anisotropy. Although useful inproviding an initial insight into pore space development during pyr-olysis, these static studies were limited as they only focused on theanalysis of 3-D tomograms acquired from samples before and afterpyrolysis. The spatially and temporally dependent pore evolution pro-cess could not be observed and quantified. To comprehensively capturethese dynamics in oil shale pore-scale processes, it is necessary to haverapid acquisition times, high resolution and the integration of an in situpyrolysis rig. To unlock our understanding of dynamic processes, recent studieshave concentrated on high resolution X-ray imaging at the pore scaleusinga synchrotron light source [28-30]. This can provide a powerful4-D imaging tool that enables the visualization and quantification ofpore-scale processes at high time resolution. Synchrotron radiationconsists of a bright parallel beam of X-rays [31,32]. The high fluxdensity (orders of magnitude higher than for conventional lab-based X-ray sources) reduces exposure times (order of 10 s per scan) to achievedynamic imaging. Additional benefits of using synchrotron radiationinclude a simplified tomographic reconstruction algorithm due to theuse of a parallel beam, and the tunability of the X-ray energy to anarrow energy band [33]. Recently, Saif et al. [34] dynamically captured the pore structureevolution for Green River (Mahogany Zone) oil shale, demonstratingthe major benefit of rapid synchrotron imaging (with a voxel size of2 um) for studying oil shale pyrolysis. The first pore space was capturedat 390℃, followed by a rapid porosity increase between 390℃ and400°℃ forming an inter-connected pore structure. The scanning timeresolution was 160 s; however, no 3-D strain mapping was performed.To comprehensively characterize pore structure and strain developmentduring oil shale pyrolysis we require faster scanning times, improvedspatial resolution and controlled localized heating. Combining 4-Dimaging with Digital Volume Correlation (DVC) allows for the com-putation of 3-D full-field displacement and strain maps from volumeimages acquired during oil shale pyrolysis [35]. The data can be vi-sualized and analyzed to quantify deformation-induced microstructuralchanges such as pore-growth and coalescence related to fracture de-velopment and would, therefore, improve our understanding of thedynamics of pore-space evolution during thermal decomposition. In this study, we employed the TOMCAT beamline (Swiss LightSource) [36], with a diode laser-based heating system to investigatepore structure evolution during pyrolysis for the Green River oil shale.This was coupled with Digital Volume Correlation to relate fluctuationsin displacement with changes in microstructure during oil shale de-formation due to pyrolysis. The results provide a spatial resolution highenough (1.63um computed voxel size) and a temporal resolution fastenough (30 s per 3-D scan) to resolve both the physical transformationin the oil shale microstructure and the dynamics of micro-fracturing. Abrief description of the experimental procedure used at the synchrotronlight source, followed by an overview of the DVC technique, is pre-sented first. The 3-D tomogram results are then analyzed in detailproviding new insights into the preferential evolution of micro-frac-tures during pyrolysis and their subsequent coalescence creating a connected fracture network. This work has direct application for oil shale pyrolysis, since itquantifies the onset temperature for hydrocarbon production as well asthe connectivity of the micro-fractures, which provide a flow pathwayfor recovery. More generally, the combination of fast micron-resolutionimaging and analysis can be applied to other energy-related problems,including conventional oil and gas production, shale oil and gas, and inoperando studies of fuel cells [37]. 2. Materials and methods The oil shale sample studied here was acquired from Mahoganyzone of the Eocene lacustrine Green River Formation (Uinta Basin,Utah, USA). It represents a classic reference sedimentary rock for Type Ikerogen with characteristic biomarkers including isoprenoid, steranes,and terpanes indicating organic matter predominantly from aquaticorganisms comprising lacustrine planktonic algae [4,38]. The mineralcomposition of the sample is mainly dolomite, calcite, quartz, andfeldspars with small amounts of illite, analcime and pyrite [26]. In preparation for the in situ dynamic experiment at TOMCAT, coresamples (2.5 mm in diameter and 4 mm in length) were selected. Thesample holder was made from hot-pressed boron nitride (thermalconductivity for BN is 15-50WmK-1, maximum working temperatureis 2773K/2500℃), which is relatively X-ray transparent while beingchemically and thermally stable (the thermal expansion for BN is36×10-6 at 1273 K). The experiment was performed at the TOMCAT beamline of theSwiss Light Source. A custom-built diode laser-based heating systemwas used to pyrolyze the oil shale samples at atmospheric pressure [39],see Fig.2. The laser-based heating system incorporated two near-in-frared (IR) diode lasers, operating at a wavelength of 980 nm. The ovalspot for each laser is of 4 × 6mm. The BN holder was then inserted intoa stainless steel adaptor connected to an alumina rod that was securedto the rotation stage. A monochromatic X-ray beam energy of 20 keV was used with thebeam filtered by passing through 200 um and 50 um Aluminum filters(Fig. 2). The exposure time for projection was 30 ms and there were1001 projections in total for each scan with a field of view of4.16 mm ×3.51mm. The acquisition time for each scan was 30s with acomputed voxel size of 1.63 um. The oil shale sample was heated in anitrogen environment from 20℃ to 600°℃ at a heating rate of 10℃/min between 20 and 300°C and 1C/min between 300 and 600℃(samples were cooled down after 600℃) to acquire 3-D scans withincreasing pyrolysis temperature. Each tomogram was reconstructed using a re-gridding Fouriertransform-based reconstruction algorithm [40], and processed andusing the Avizo 9.0 program (FEI, Visualization Sciences Group,Thermo Fisher Scientific). In this study, within a reconstructed image,the darkest phase represents the pore space. A non-local means edgepreserving filter [41] was applied to the 3-D images to reduce imagenoise followed by segmentation using Otsu’s algorithm to extract thepore space for further analysis [34]. We applied Digital Volume Correlation (DVC), a technique pro-viding displacements and strains measurements within a sequence oftomographic volume images. 3-D synchrotron images capturing oilshale pyrolysis with increasing temperature were imported in RAWformat (a stack of gray-scale images) and deformation vectors based onthe change of gray-scale structures were computed using the LaVisionDaVis 8.4 program. For DVC processing at least two scans of the sampleare required, typically a reference scan of the undeformed sample and asecond scan of the sample in its deformed state. In this study, a series ofimage volumes featuring successive deformation steps were processed,capturing the time evolution of pore space while temperature increases. The volume correlation in this study is computed using a cross-correlation method operating on the intensity values (i.e. contrastpattern) of volumetric images and is performed using a predictor-cor-rector approach with Fast Fourier Transform algorithm (FFT) predictorsteps, and Direct Correlation refinementtsteps [42-44]. The Fig. 2. (A) Experimental apparatus used at theTOMCAT beamline (X02DA), consisting of a diodelaser-based system to heat an oil shale sample(2.5 mm diameter). (B) Schematic of the TOMCATbeam apparatus with the monochromatic X-raybeam transmitting through the laser-heated oil shalesample onto a scintillator, which is focused andimaged by the objective lens and a sCMOS cameraarray. Laser head Beam blocker PCO EDGE 5.5 Oil shale 20 pm-thick 200 pm and 50 pm LuAG (Ce) camera Aluminum filters sample Monochromator scintillator Synchrotron ring 20 keV monochromatic Rotation 4x objective lens Undulator X-ray beam 180° Laser head Beam blocker Fig. 3. Schematic illustrating the Digital Volume Correlation (DVC) method.(A) The measurement volume is divided into smaller sub-volumes.(B) For eachsub-volume the new position in the deformed state (t2) is obtained by corre-lation of the voxel contrast within the sub-volume. The vector connecting thesubvolume centers of initial(ti) and deformed state (t2) is the associated dis-placement vector, (U). (C) Without overlap the sub-volumes are directly ad-jacent to each other. At 50% overlap there are three sub-volumes in the samespace as the overlap-free configuration and at 75% overlap this corresponds tofive sub-volumes in the same space. In this figure, only the overlapping alongthe x-direction is illustrated, but the actual overlap will be along all three co-ordinate axes.(D) Graphical representation of the correlation modes with thestorage of a zero-vector field (U1=0) for the first (reference) volume. All otherresults are aligned with the time step of the second volume of the correspondingcorrelation step, i.e. the vector field U2 is aligned with volume V2 and so on.Note that the first non-zero vector field U2 is identical for all correlation modes.In relative to first mode, every volume is correlated with the first volume of theseries which gives the best accuracy but the correlation may fail when relativechanges between volumes become too large. In differential correlation mode,each volume is correlated to its predecessor, thus the resulting vector field onlydescribes changes between subsequent volumes. In sum of differential mode,the differential vector fields are summed up to arrive at the total deformationwith respect to the first volume, which is appropriate for the large deformationsobserved in this study. measurement volume is divided into smaller sub-volumes with a di-mension of N×N×N voxels and the shift of the contrast patternswithin the sub-volumes is then tracked from reference to the deformedstate (Fig. 3). Once the best matching position of a sub-volume in thedeformed state is found, the associated shift is given by the vectorconnecting the sub-volume centers of initial and deformed state. To-gether, the vectors of all sub-volumes form 3D matrix of vectors representing local sample displacements. Local strain values are cal-culated by numerical derivation of the displacement vector field by theDVC software. Given that this image correlation approach creates one vector persub-volume, the spatial resolution of the resulting vector field is relatedto the sub-volume size. Smaller sub-volumes give better spatial re-solution but also increase the noise due to loss of correlation statistics.When processing data, the aim is to find the optimum sub-volume sizewhere the sub-volumes are small enough to capture the essential fea-tures of deformation while still large enough to give accurate vectors. Inthis study, the maximum correlation was performed which uses thegradient of the displacement from the previous pass to deform the sub-volume on the subsequent pass until the highest possible correlationand signal to noise ratio was reached. A final sub-volume of48 ×48 × 48 voxels with a 75% overlap was used, where the overlapallows an increase in spatial density of vectors without a reduction ofthe sub-volume size. This provided a balance between noise and anadequate spatial resolution for strain in the pyrolyzed oil shale sample. 3. Results and discussion Fig. 4 displays a 2-D cross-sectional area of the sample duringheating. For oil shale, domains with the darkest gray levels (lowestcounts) represent pore space with the lighter gray regions representingthe organic matter, while the brighter gray levels reflect the solid matrix,and the brightest phase represents high density minerals such as pyrite. It can be observed that there is no visible porosity change below350°℃ (Fig. 4A). Within the complex fine-grained microstructure,fractures at the micron level formed along the organic-rich layers weredetected at 360℃ contributing a porosity of 3.6%. With an additionalincrease in temperature to 370℃ a negligible visible difference inmicro-fracture growth is observed, despite sample porosity increasingto 5.7%. At 380℃, a significant porosity increase was captured (por-osity increased to 13.2%) as the micro-fractures propagate along thekerogen-rich bedding with the development of major and minor frac-tures within the sample. Further heating from 390℃ to 450C resultedin a smaller porosity increase from 20.2% to 20.9%. In Fig. 4B, thecritical pore volume changes took place between 350°℃ and 400°C. Themost significant change in oil shale pore volume was achieved at378℃. The alteration in oil shale porosity with heating primarily re-presents the loss of organic matter during thermal decomposition whereimmobile kerogen is transformed into mobile oil and gas. With in-creasing temperature, there is a build-up in the internal vapor pressureof isolated pores which exceeds the local mechanical strength and thematrix fractures. A Fig. 5. Visualization of the pore space connectivity(each color represents a single connected region ofthe pore space). An increasingly well-connectedpore space is formed, as micro-fractures propagatelargely along the kerogen-rich laminations. The poresize distribution (both probability density functionand cumulative distribution function) at 360℃,370℃, 380℃, 390℃ and 450℃ reveal that withincreasing pyrolysis temperature there are modestchanges where the smaller pores dominate innumber while the larger pores have a greater volu-metric contribution. (For interpretation of the re-ferences to color in this figure legend, the reader isreferred to the web version of this article.) Fig. 5 shows the visualization of the pore space for the sample attemperatures from 360℃ to 450°C. Each interconnected portion of thepore space is indicated with a different color. At 360C, the majority ofthe pores were disconnected (indicated by the wide color range),whereas with increasing temperature, the pores and fractures along theorganic-rich laminations becomes apparent particularly between 370℃and 380℃ and the pore space is well connected. At each temperature,individual pores were divided into different size groups to create a poresize distribution (characterized by probability density functions andcumulative distribution functions), represented by a mean equivalentpore radius (Fig.5). As the temperature increases we see that the number of pores andtheir contribution to the total pore volume shifts to the very largestpore sizes. The results in Fig. 5 show initially the presence of severalsmall pores developing during oil shale pyrolysis which then grow andcoalesce into a smaller number of larger sized fractures which occupythe majority of the pores. At 360C and 370℃ we find that poreshaving an equivalent radius approximately between 4.1 um and6.4 um, and 4.4 um to 5.8 um, respectively, dominate the distribution.At 360℃, pores approximately ranging from 4.1 um to 74.0 um in equivalent radius occupy 67.3% of the total pore volume, with theremaining 32.7% pore volume occupied by pores having an equivalentradius approximately between 92.0 um and 191.9 um. At 370°C, weobserve a shift towards larger pores dominating the total pore volumewith pores approximately ranging from 55.7 um to 218.8 um inequivalent radius having the greatest volumetric contribution, occu-pying 59.6% of the pore space. At 380℃, pores with an equivalentradius between 3.9 um and 12.6 um comprise 98.4% of the total porenumber while larger pores with a mean equivalent pore radius of602 um in the form of lateral micro-fractures occupy 46.2%. A furtherincrease in pyrolysis temperature to 390°℃ and 450℃ does not sig-nificantly change the size of the pores in terms of number of poresbetween 3.9 um and 12.6 um that continue to dominate the distribu-tion. The main difference is observed in the dominant mean equivalentpore radius with 743.4 um and 807.5 um, representing large con-nected fractures, occupying the majority of the pore space at 390℃and 450°℃ respectively. The largest change in pore structure is ob-served between 360℃ and 380°C, which provides further evidence ofthe importance of this temperature range. DVC analysis allowsS11s to identifyy anddquantifyy successive Fig. 6. Micro-fracture development during oil shalepyrolysis between 354℃ and 364℃ (A-F). DigitalVolume Correlation (DVC) was used to quantify thestrain within the oil shale sample during thermalmaturation. We follow micro-fracture β (initial frac-ture shown in inset A) to examine its developmentwith increasing pyrolysis temperature from 354℃ to364℃. evy strain components are superimposed ontothe associated gray-scale image revealing that withincreasing pyrolysis temperature the local compressivestresses cause temporary closure of minor fractures. deformation steps. Fig. 6represents the full-field internal strain distribu-tion measurements computed using DVC for the sample during pyrolysis.Note that although the term“strain”is used here, because the material isopening up to reveal pores, the strain maps do not represent the materialstrain, but instead the relative movement of material adjacent to poreopening sites. Maps of the strain in the vertical direction (eyy) were su-perimposed onto the associated gray-scale images. In this analysis, wefollow micro-fracture β (initial fracture shown in Fig. 6A) to examine itsdevelopment with increasing pyrolysis temperature from 354℃ to 364℃.At 354℃, the first micro-fracture was observed with strain values in therange of 1.2-3.3%. With an increase in temperature to 356℃ (Fig. 6B),the computed strain values associated with micro-fracture B decreased to0.4-0.9% as the surrounding micro-fractures developed due to the thermal decomposition of organic matter and accompanying internal gaspressure build-up. As the pyrolysis temperature rose further to 358℃, themicro-fracture B closed due to corresponding negative values of strain(compression) in the range of -1.5 to -4.2%. As the oil shale samplepyrolysis temperature increased to 364℃(Fig. 6F), there was largecompression surrounding micro-fracture B which resulted in a furtherclosure of the fracture at strain values of -4.5 to -5.0%. This analysishas revealed the dynamic evolution of micro-fractures during oil shalepyrolysis, illustrating that with increasing temperature there is temporaryclosure of minor fractures due to local compressive stresses. Individualfractures not only depend on the content of hydrocarbons but also on thedynamic development of neighboring fractures. Fig. 7 shows the DVC measurements of the spatial distribution of the volumetric strain eyy along with vector arrows for the oil shale sampleat pyrolysis temperatures of 364-386℃. Between 364℃ and 370℃ thesample underwent slight compression coupled with the development ofminor fractures with associated strain values of 5.4 -36.5%. At 374°C,major fractures formed laterally across the oil shale sample with hightensile strain values in the range of 28.2-46.4% (Fig. 7D). As the pyr-olysis temperature rose further to 386°℃, the strain values associatedwith the major fractures increased further towards 50% (Fig. 7F).Theseresults indicate that the oil shale pyrolysis process consists of com-pressive forces followed by expansion due to the build-up of internalpressure as solid organic matter is transformed into volatile compo-nents. 4. Discussion and conclusions We have characterized the deformation of oil shale at elevatedpyrolysis temperatures and the evolution of micro-fractures critical fordetermining hydrocarbon flow behavior. To achieve this, we imaged asample of Green River (Mahogany zone) oil shale in 3-D using a time-resolved synchrotron X-ray source at 1.63 um computed voxel sizewhile being subjected to increasing pyrolysis temperature up to 600°℃using a laser-based heating system. Laser-based heating was used topyrolyze oil shale at a heating rate of 1℃/min to 600℃ with 3-Dimages captured every 30 s revealing internal structural development. Three-dimensional full-field strain mapping and micro-fracture de-velopment were quantified by Digital Volume Correlation (DVC) duringpyrolysis to evaluate oil shale deformation and fracturing. From thesequence of 3-D tomographic volume images, the deformation vectorsbased on the change of gray-scale structures were computed. The firstmicro-fractures were observed at 354℃ followed by rapid expansion upto 390℃ where the majority of the pore space became inter-connected.The results revealed anisotropic micro-fracture pyrolysis induced be-havior with fractures opening perpendicular to the oil shale beddingfollowed by coalescence along laminated structures to generate a con-nected fracture network due to the build-up of internal pressure as solidorganic matter was transformed into mobile components. Our studyrevealed the importance of capturing the dynamics of simultaneousfracture development and closure within the most important heatingregime during pyrolysis. Simultaneous expansion and closure of frac-tures was observed to be dependent not only on the content of hydro-carbons but also on the dynamics of the local strain field. With thesestate-of-the-art imaging and novel analytical techniques, the visualiza-tion and quantification of successive deformation steps allow for ad-vanced modeling of fluid flow during pyrolysis. This work provides quantitative guidelines for the application of oilshale pyrolysis, showing how the connectivity of the micro-fracturenetwork develops from around 350℃. More generally, the same com-bination of rapid micron-resolution imaging and analysis could be ap-plied to other energy systems that involve porous media, from oil-bearing rocks [45] to fuel cells, batteries and catalysts [37]. Acknowledgements The authors acknowledge the Paul Scherrer Institut for provision ofsynchrotron radiation beamtime at the TOMCAT beamline X02DA. Wewould like to thank Gordan Mikuljan for his technical assistance. Manythanks to Alex Nila (LaVision, United Kingdom) for his support withDigital Volume Correlation. We are also grateful for financial supportfrom the Imperial College Consortium on Pore-Scale Modelling and theDepartment of Earth Science and Engineering at Imperial CollegeLondon. References ( [1] IEA. World energy outlook; 2015. A vailable:
确定

还剩6页未读,是否继续阅读?

产品配置单

北京欧兰科技发展有限公司为您提供《油页岩中体视形变应变检测方案(其它无损检测仪器/设备)》,该方案主要用于非金属矿产中体视形变应变检测,参考标准--,《油页岩中体视形变应变检测方案(其它无损检测仪器/设备)》用到的仪器有LaVision StrainMaster材料应变形变成像测量系统、LaVision DaVis 智能成像软件平台
推荐专场


相关方案
更多
该厂商其他方案
更多