


方案详情
文
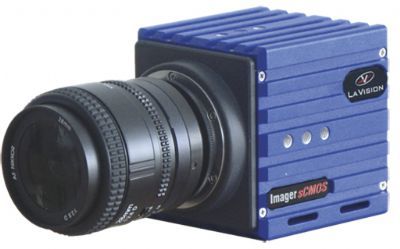
采用LaVision公司的FlowMaster粒子成像测速系统。测量了超音速气流作用下,机翼表面的流场。研究了火花放电产生局部快速加热对分离点位置的影响。
方案详情

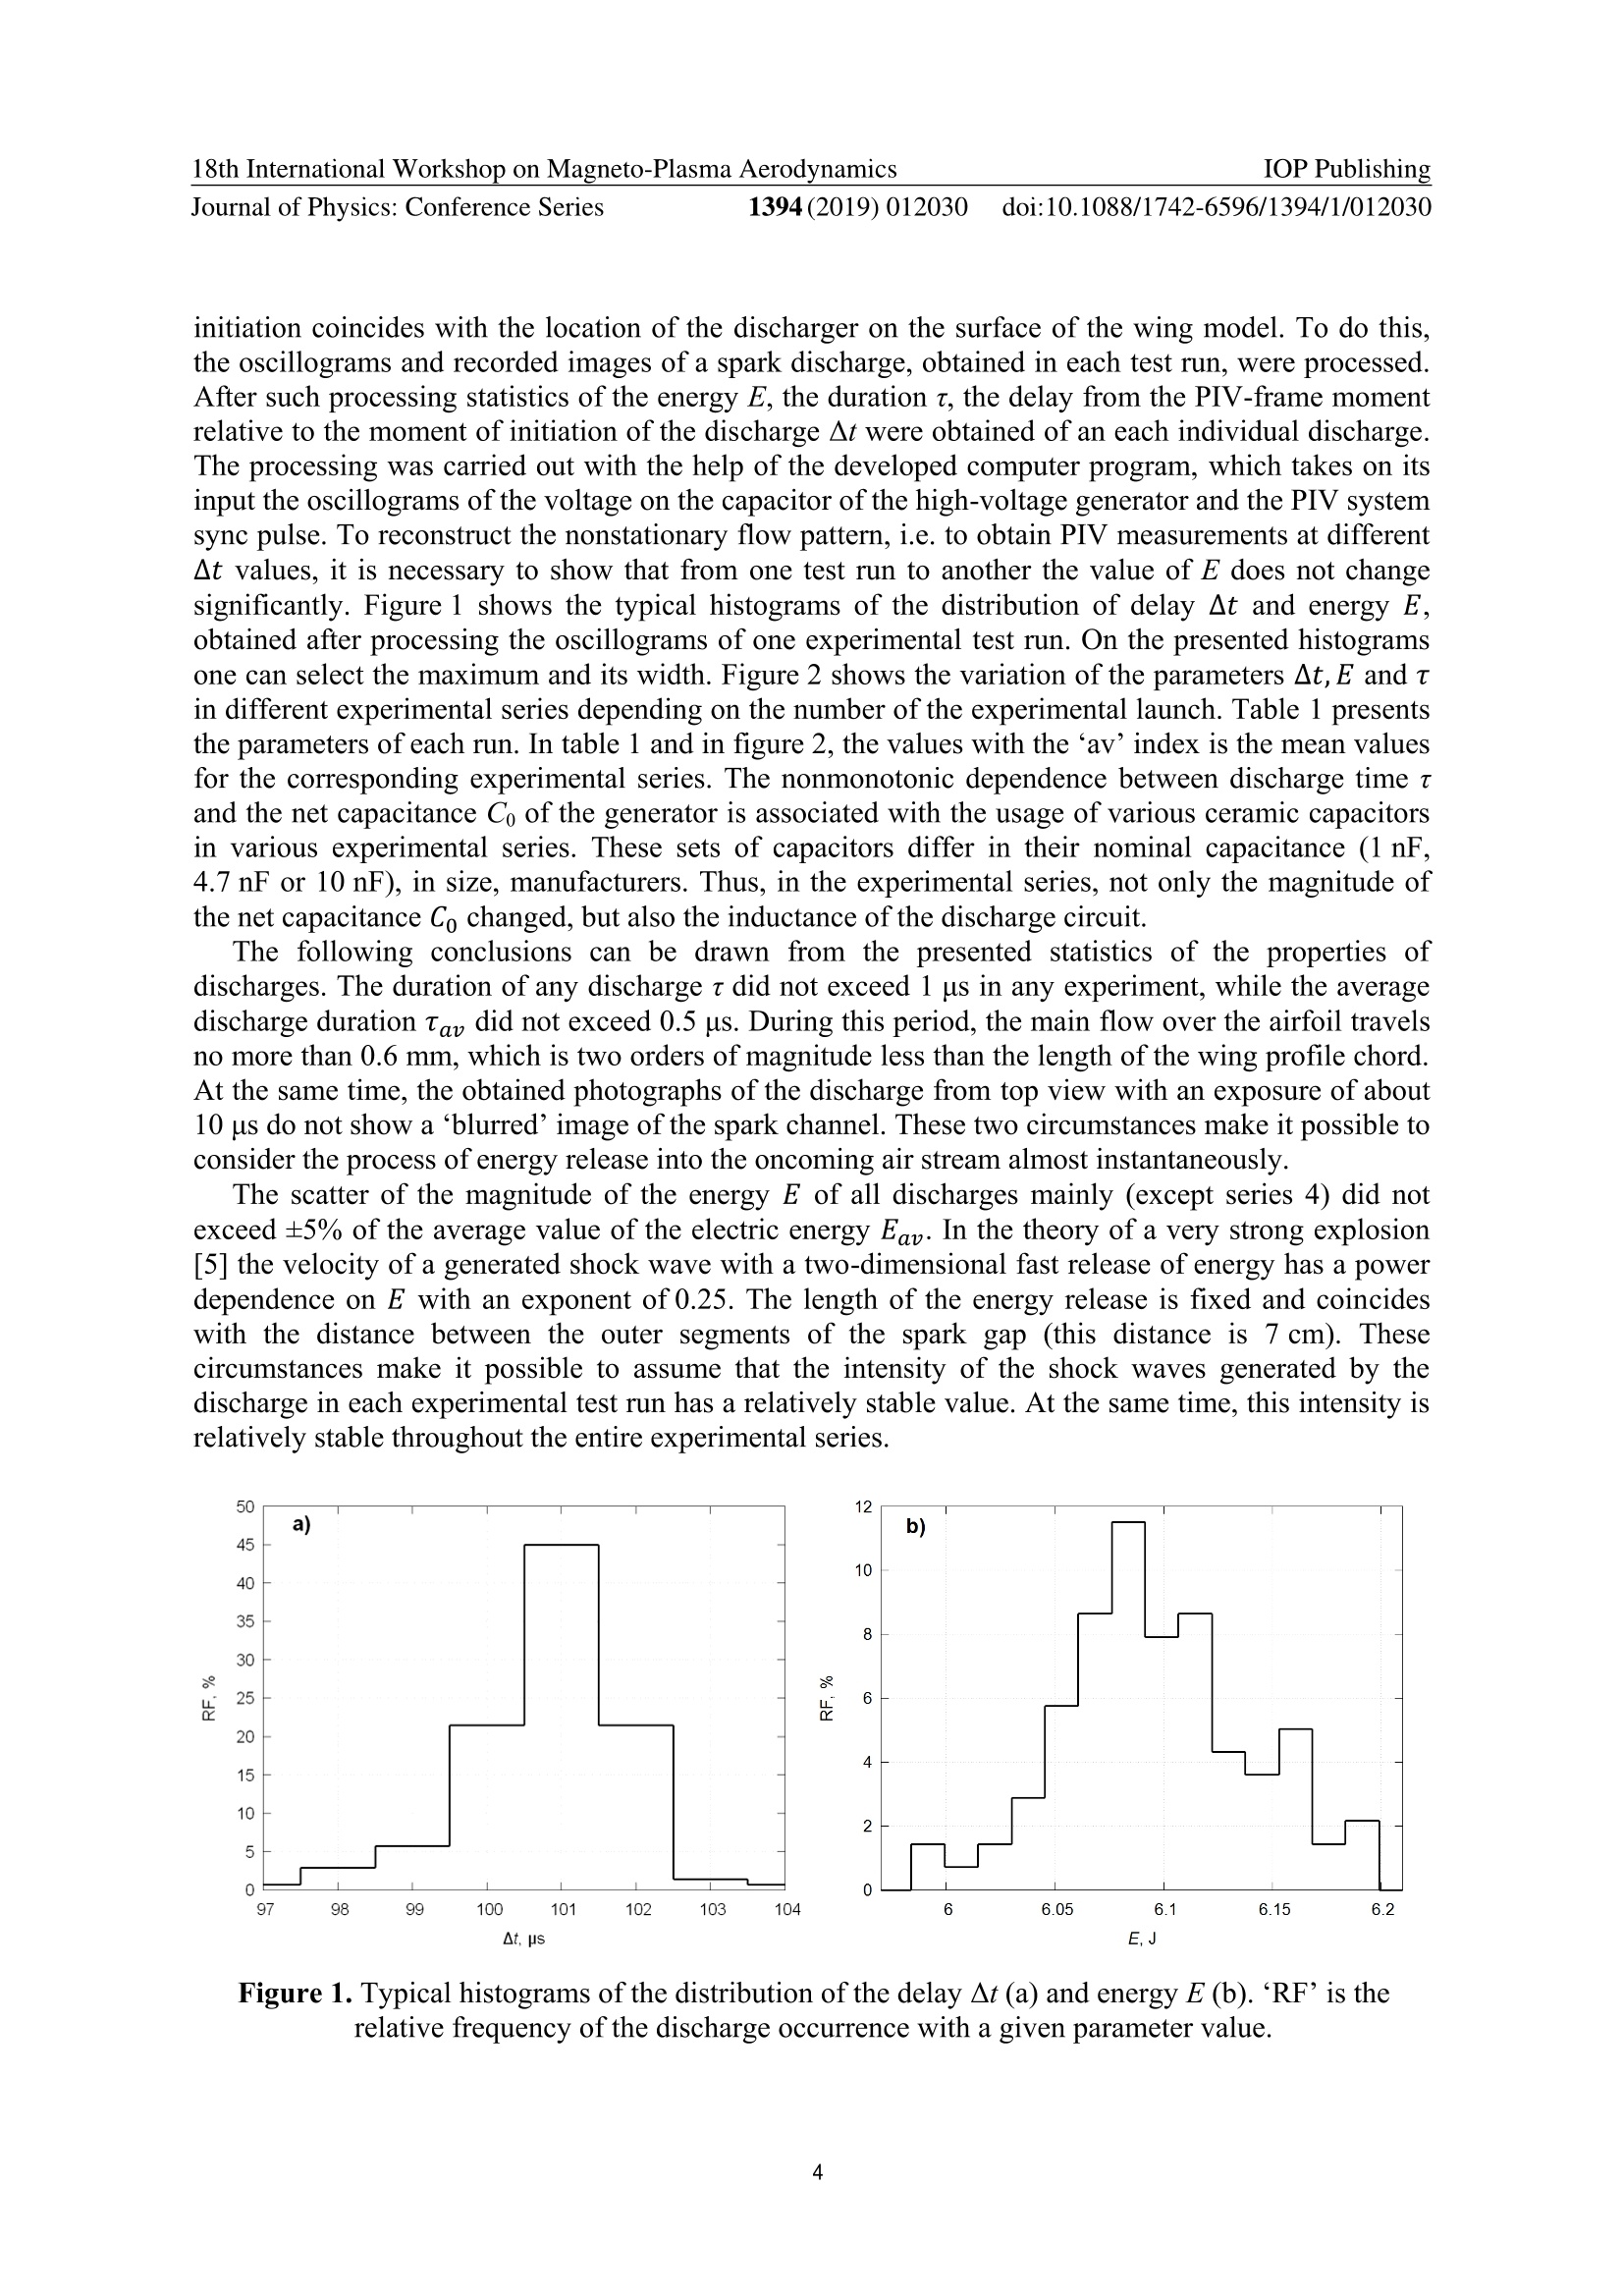
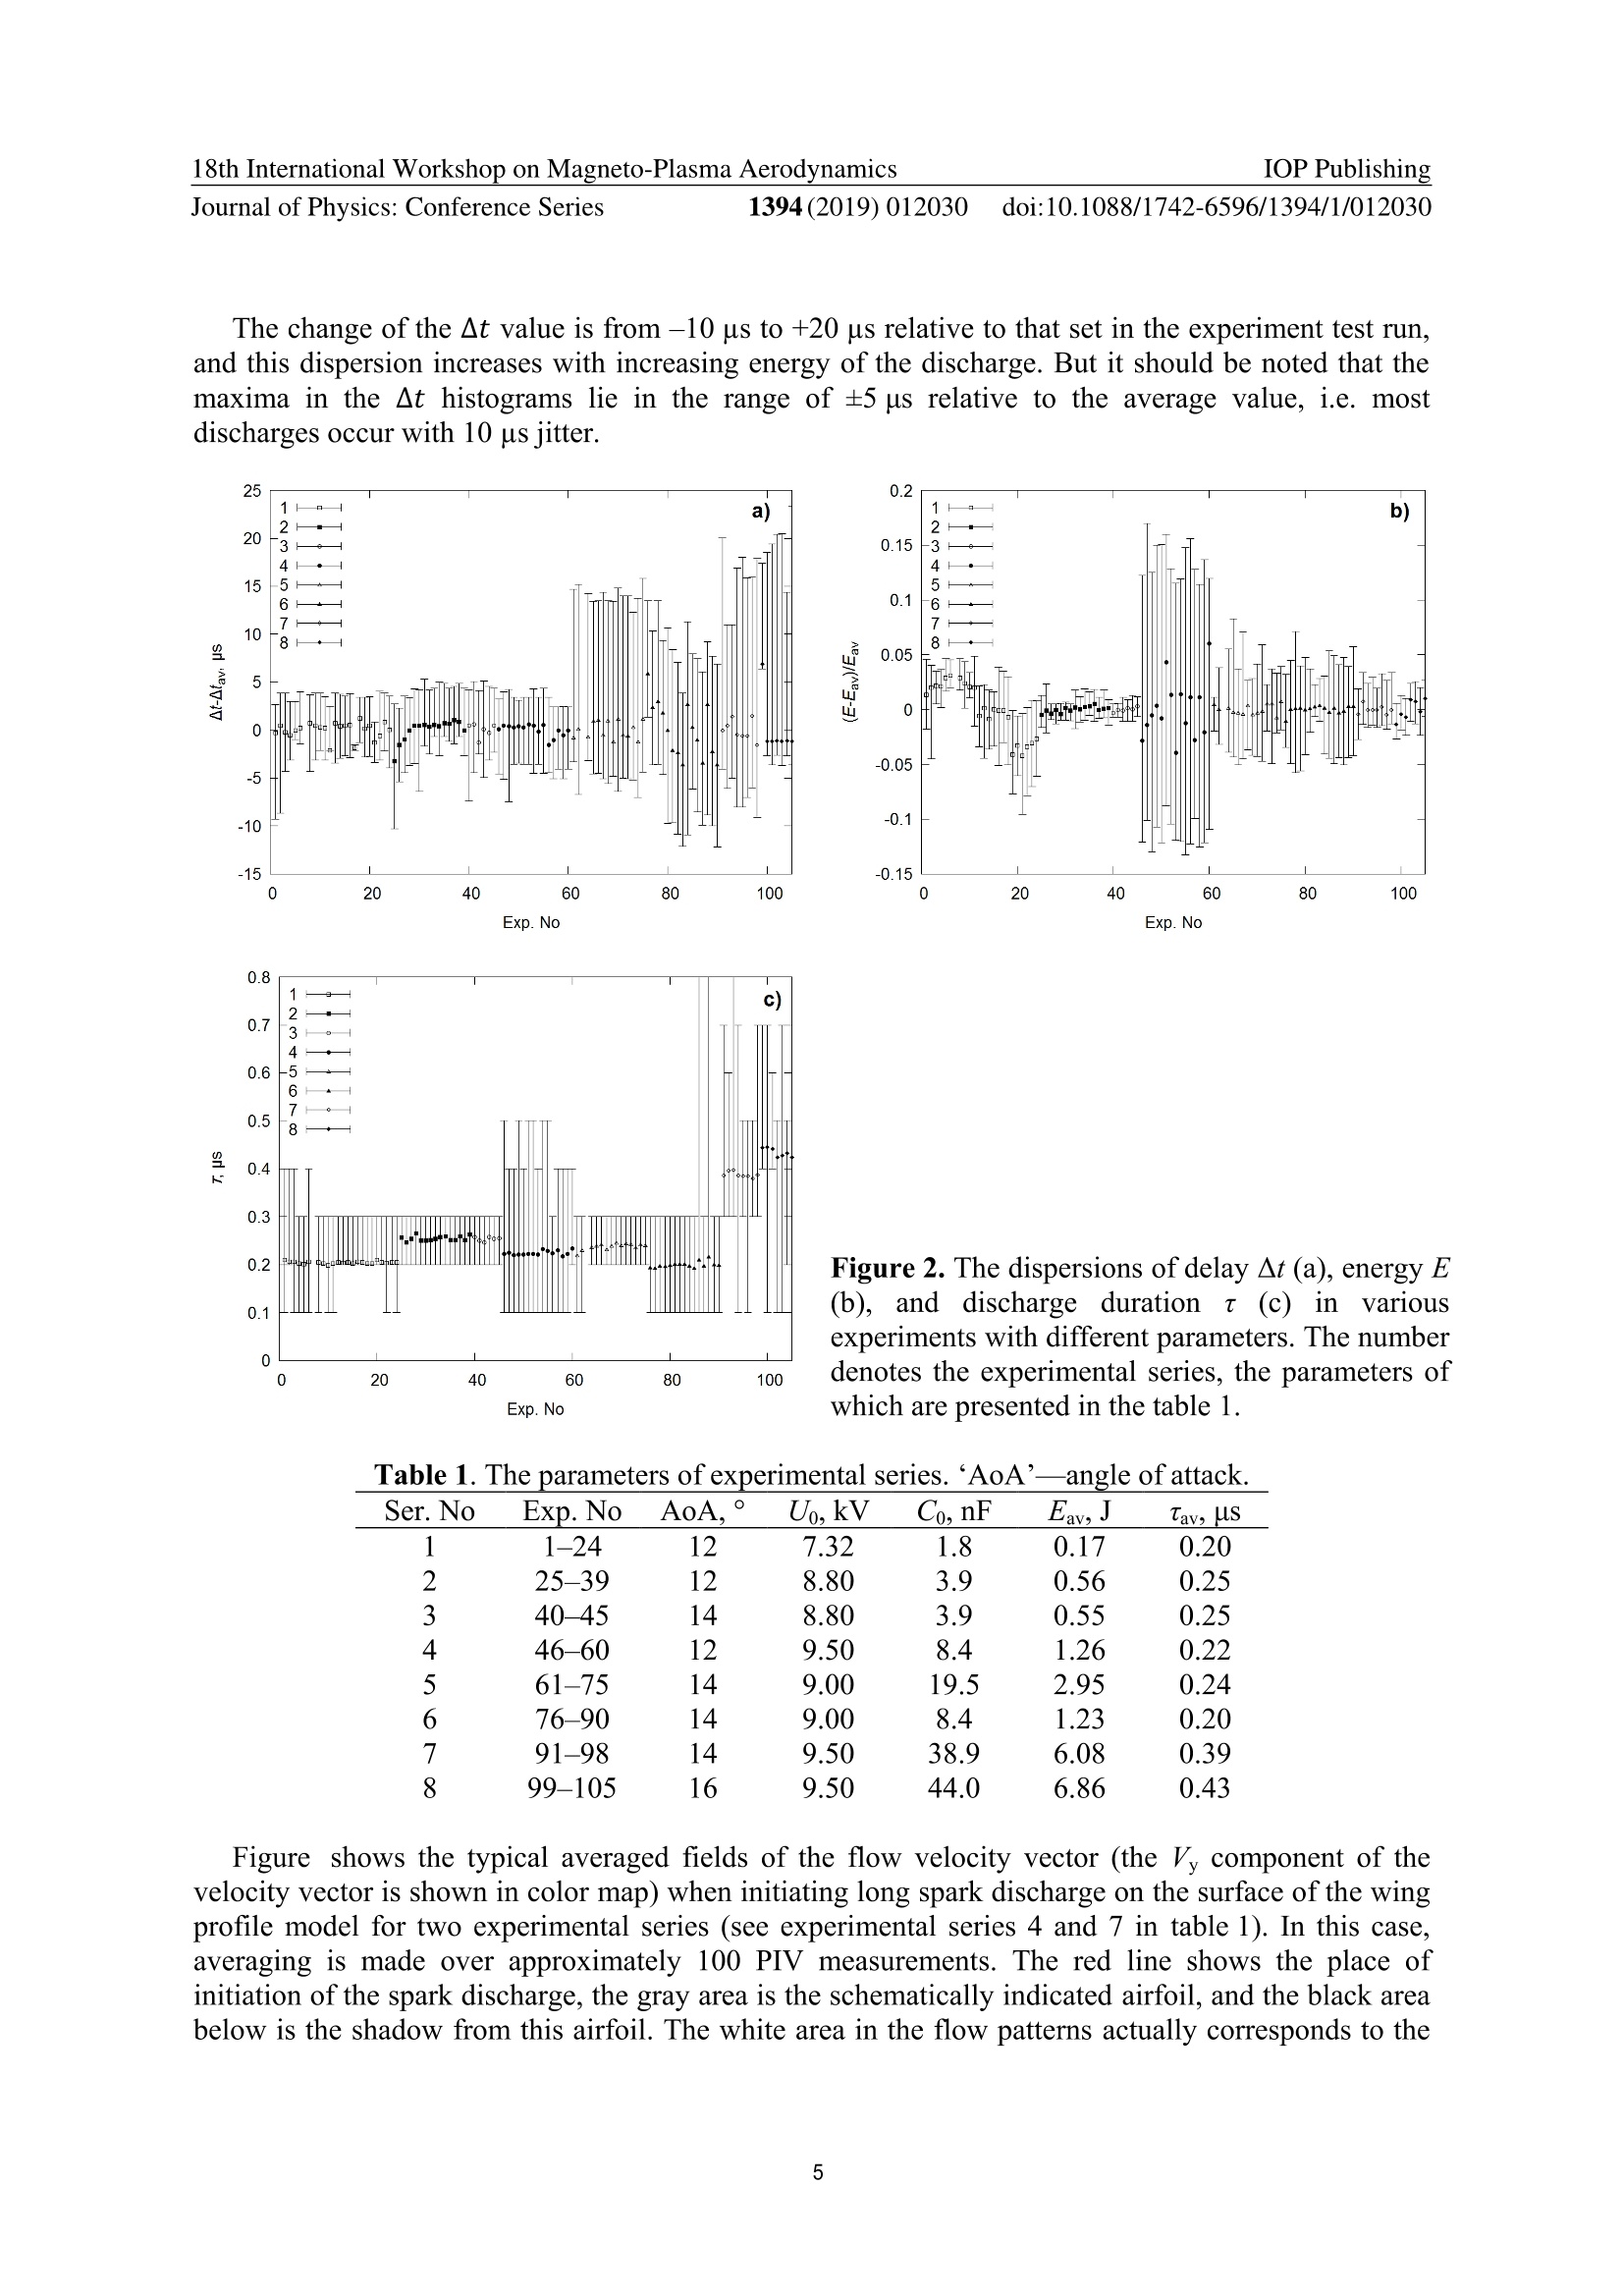
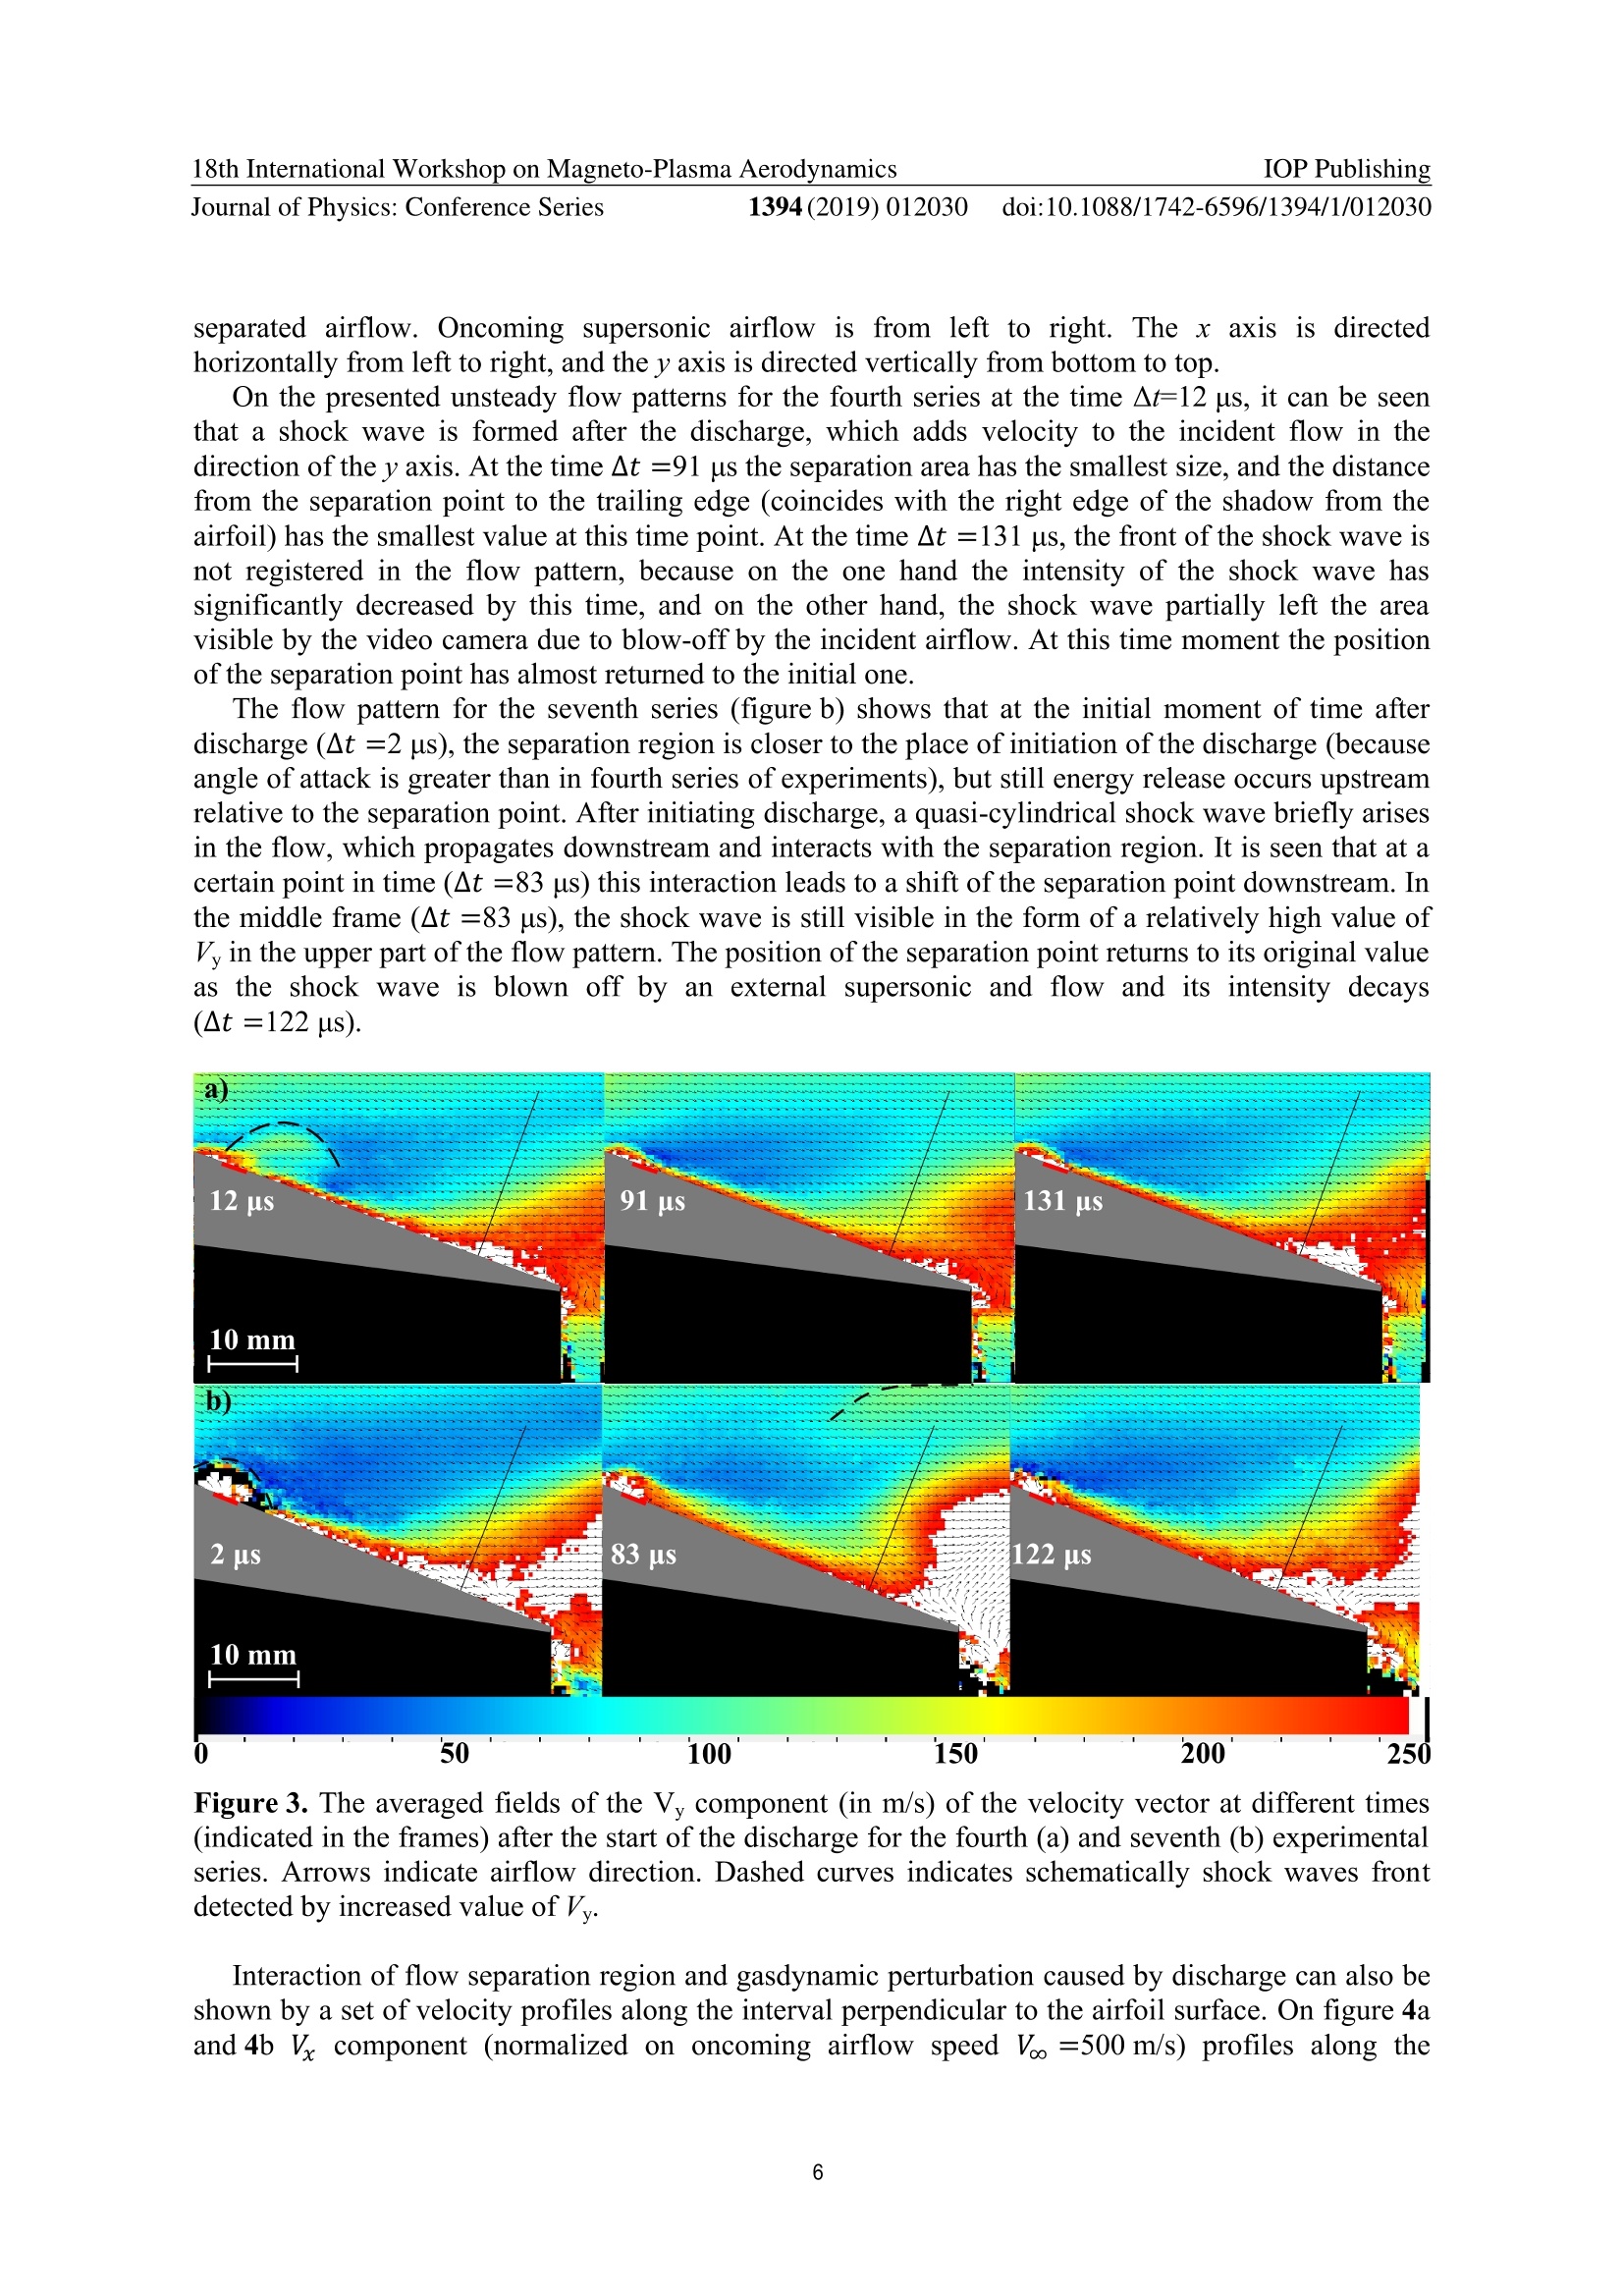
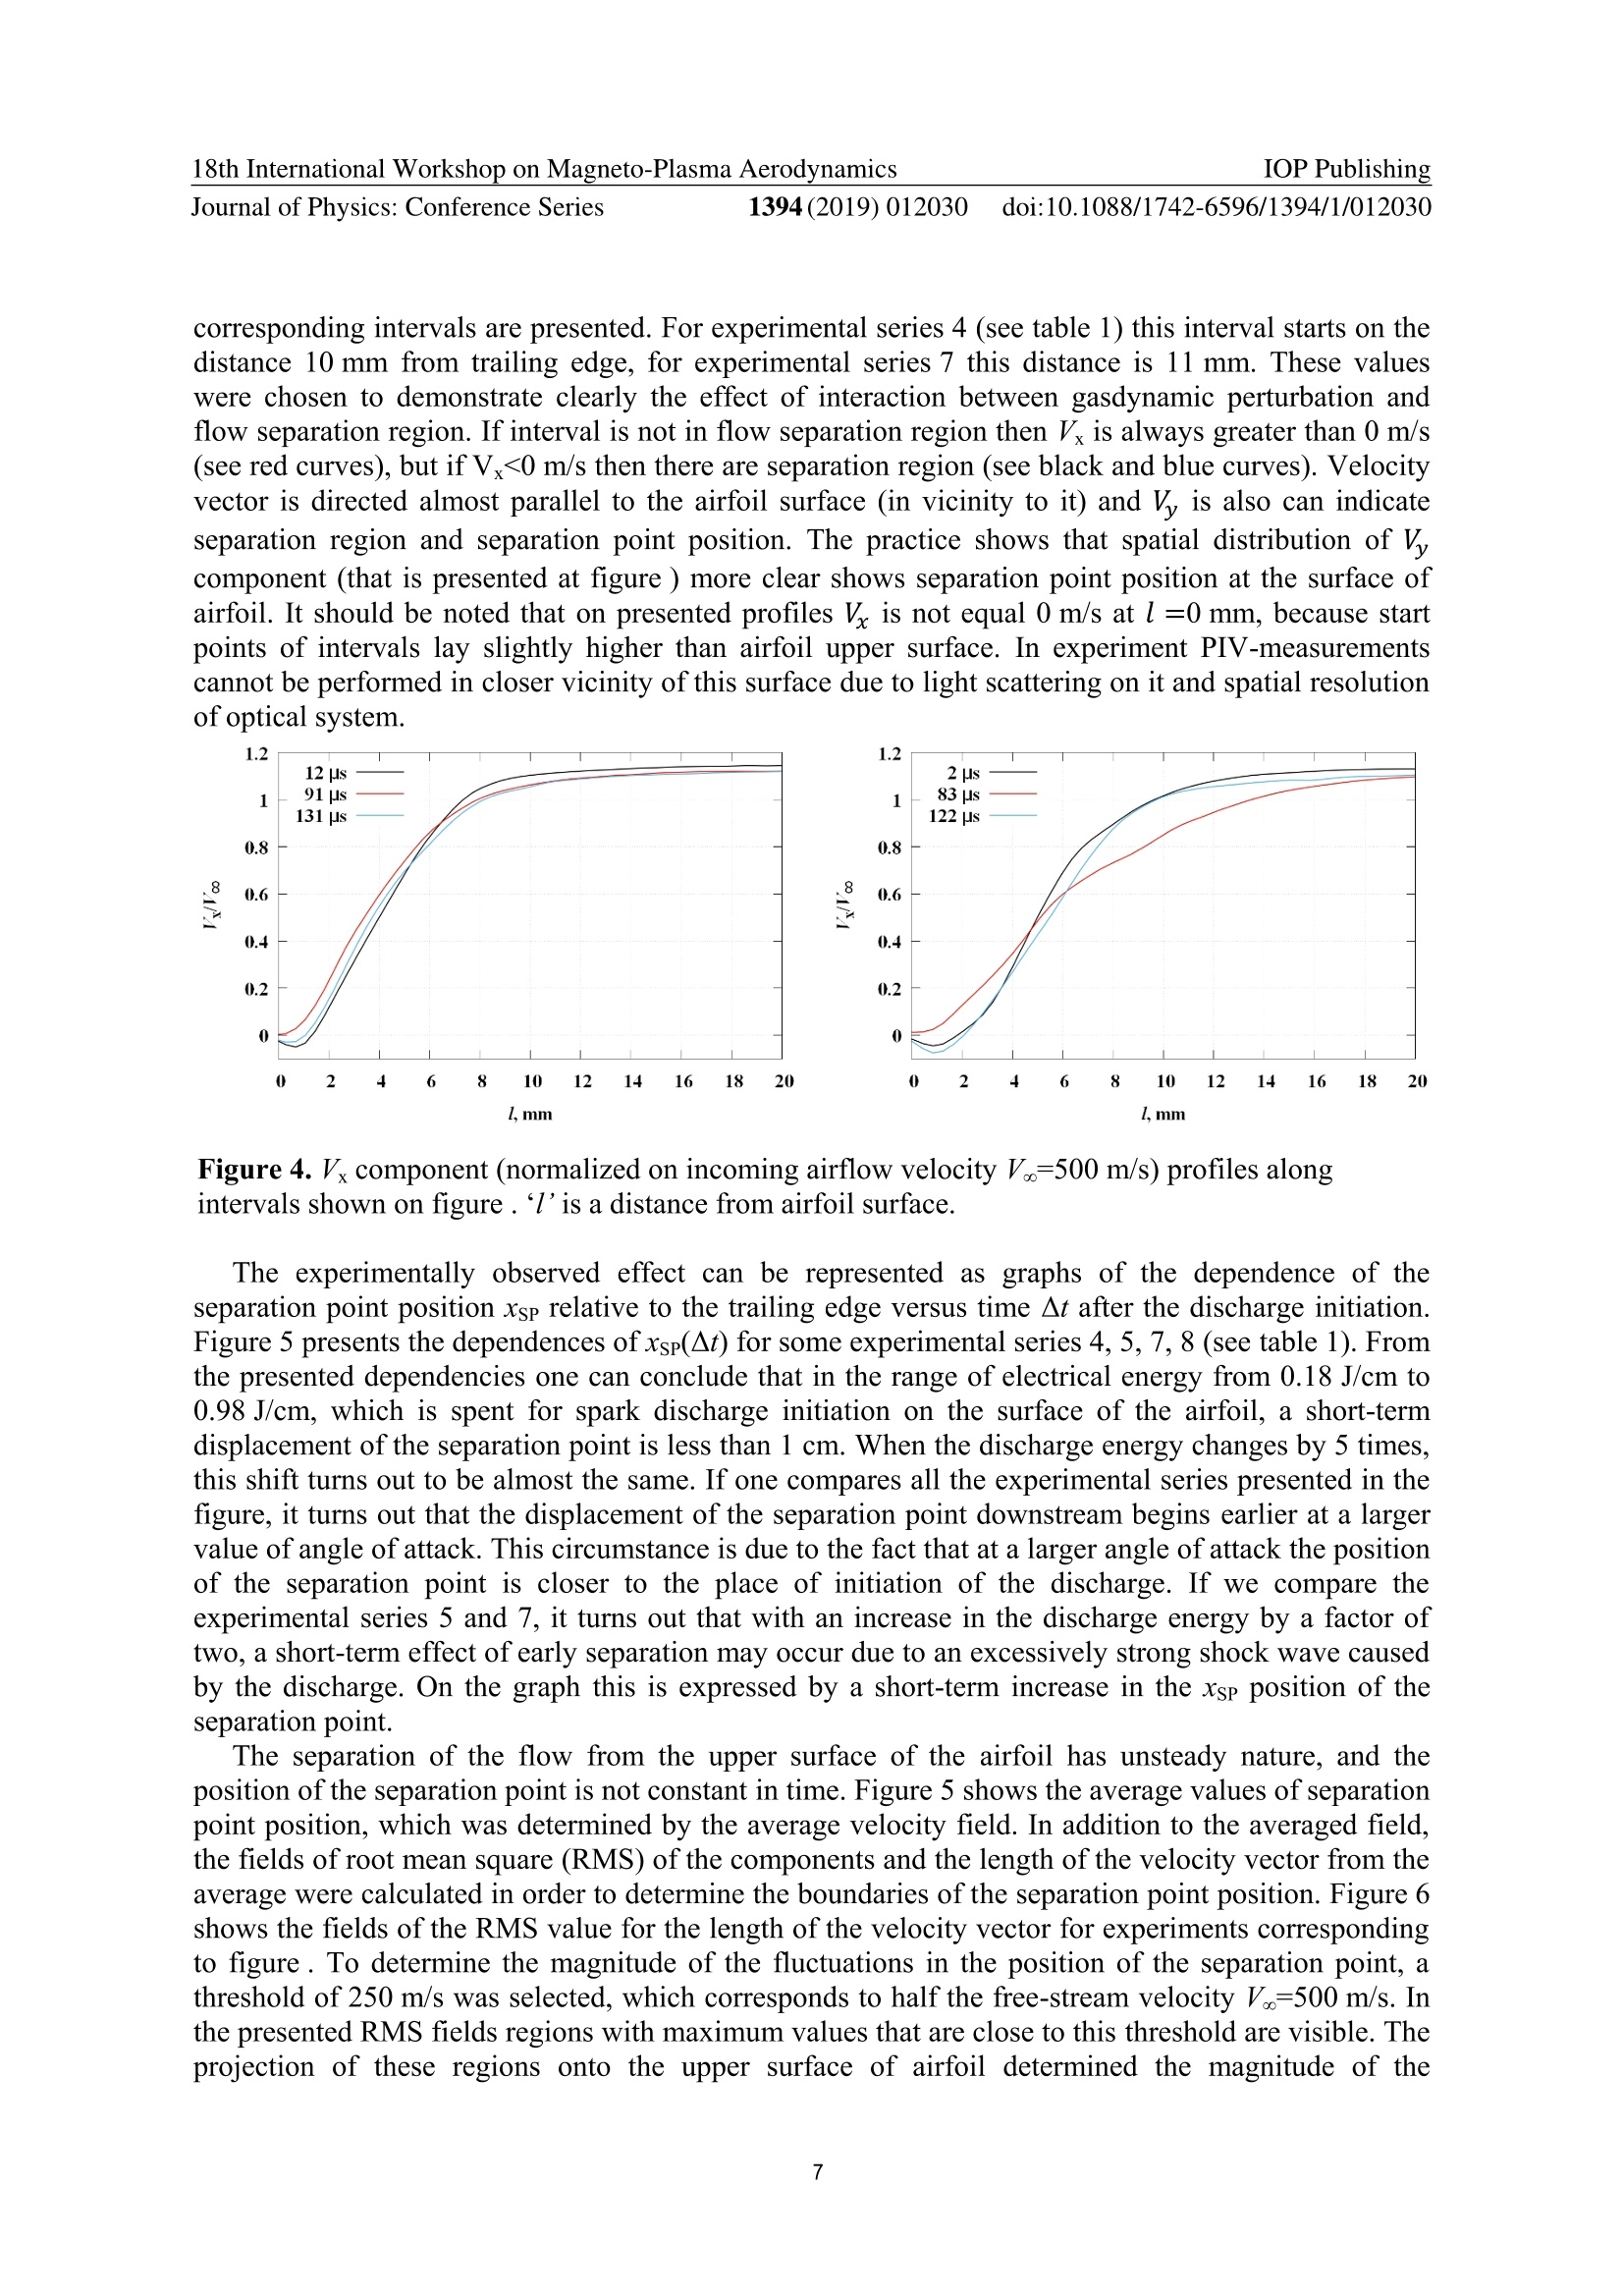
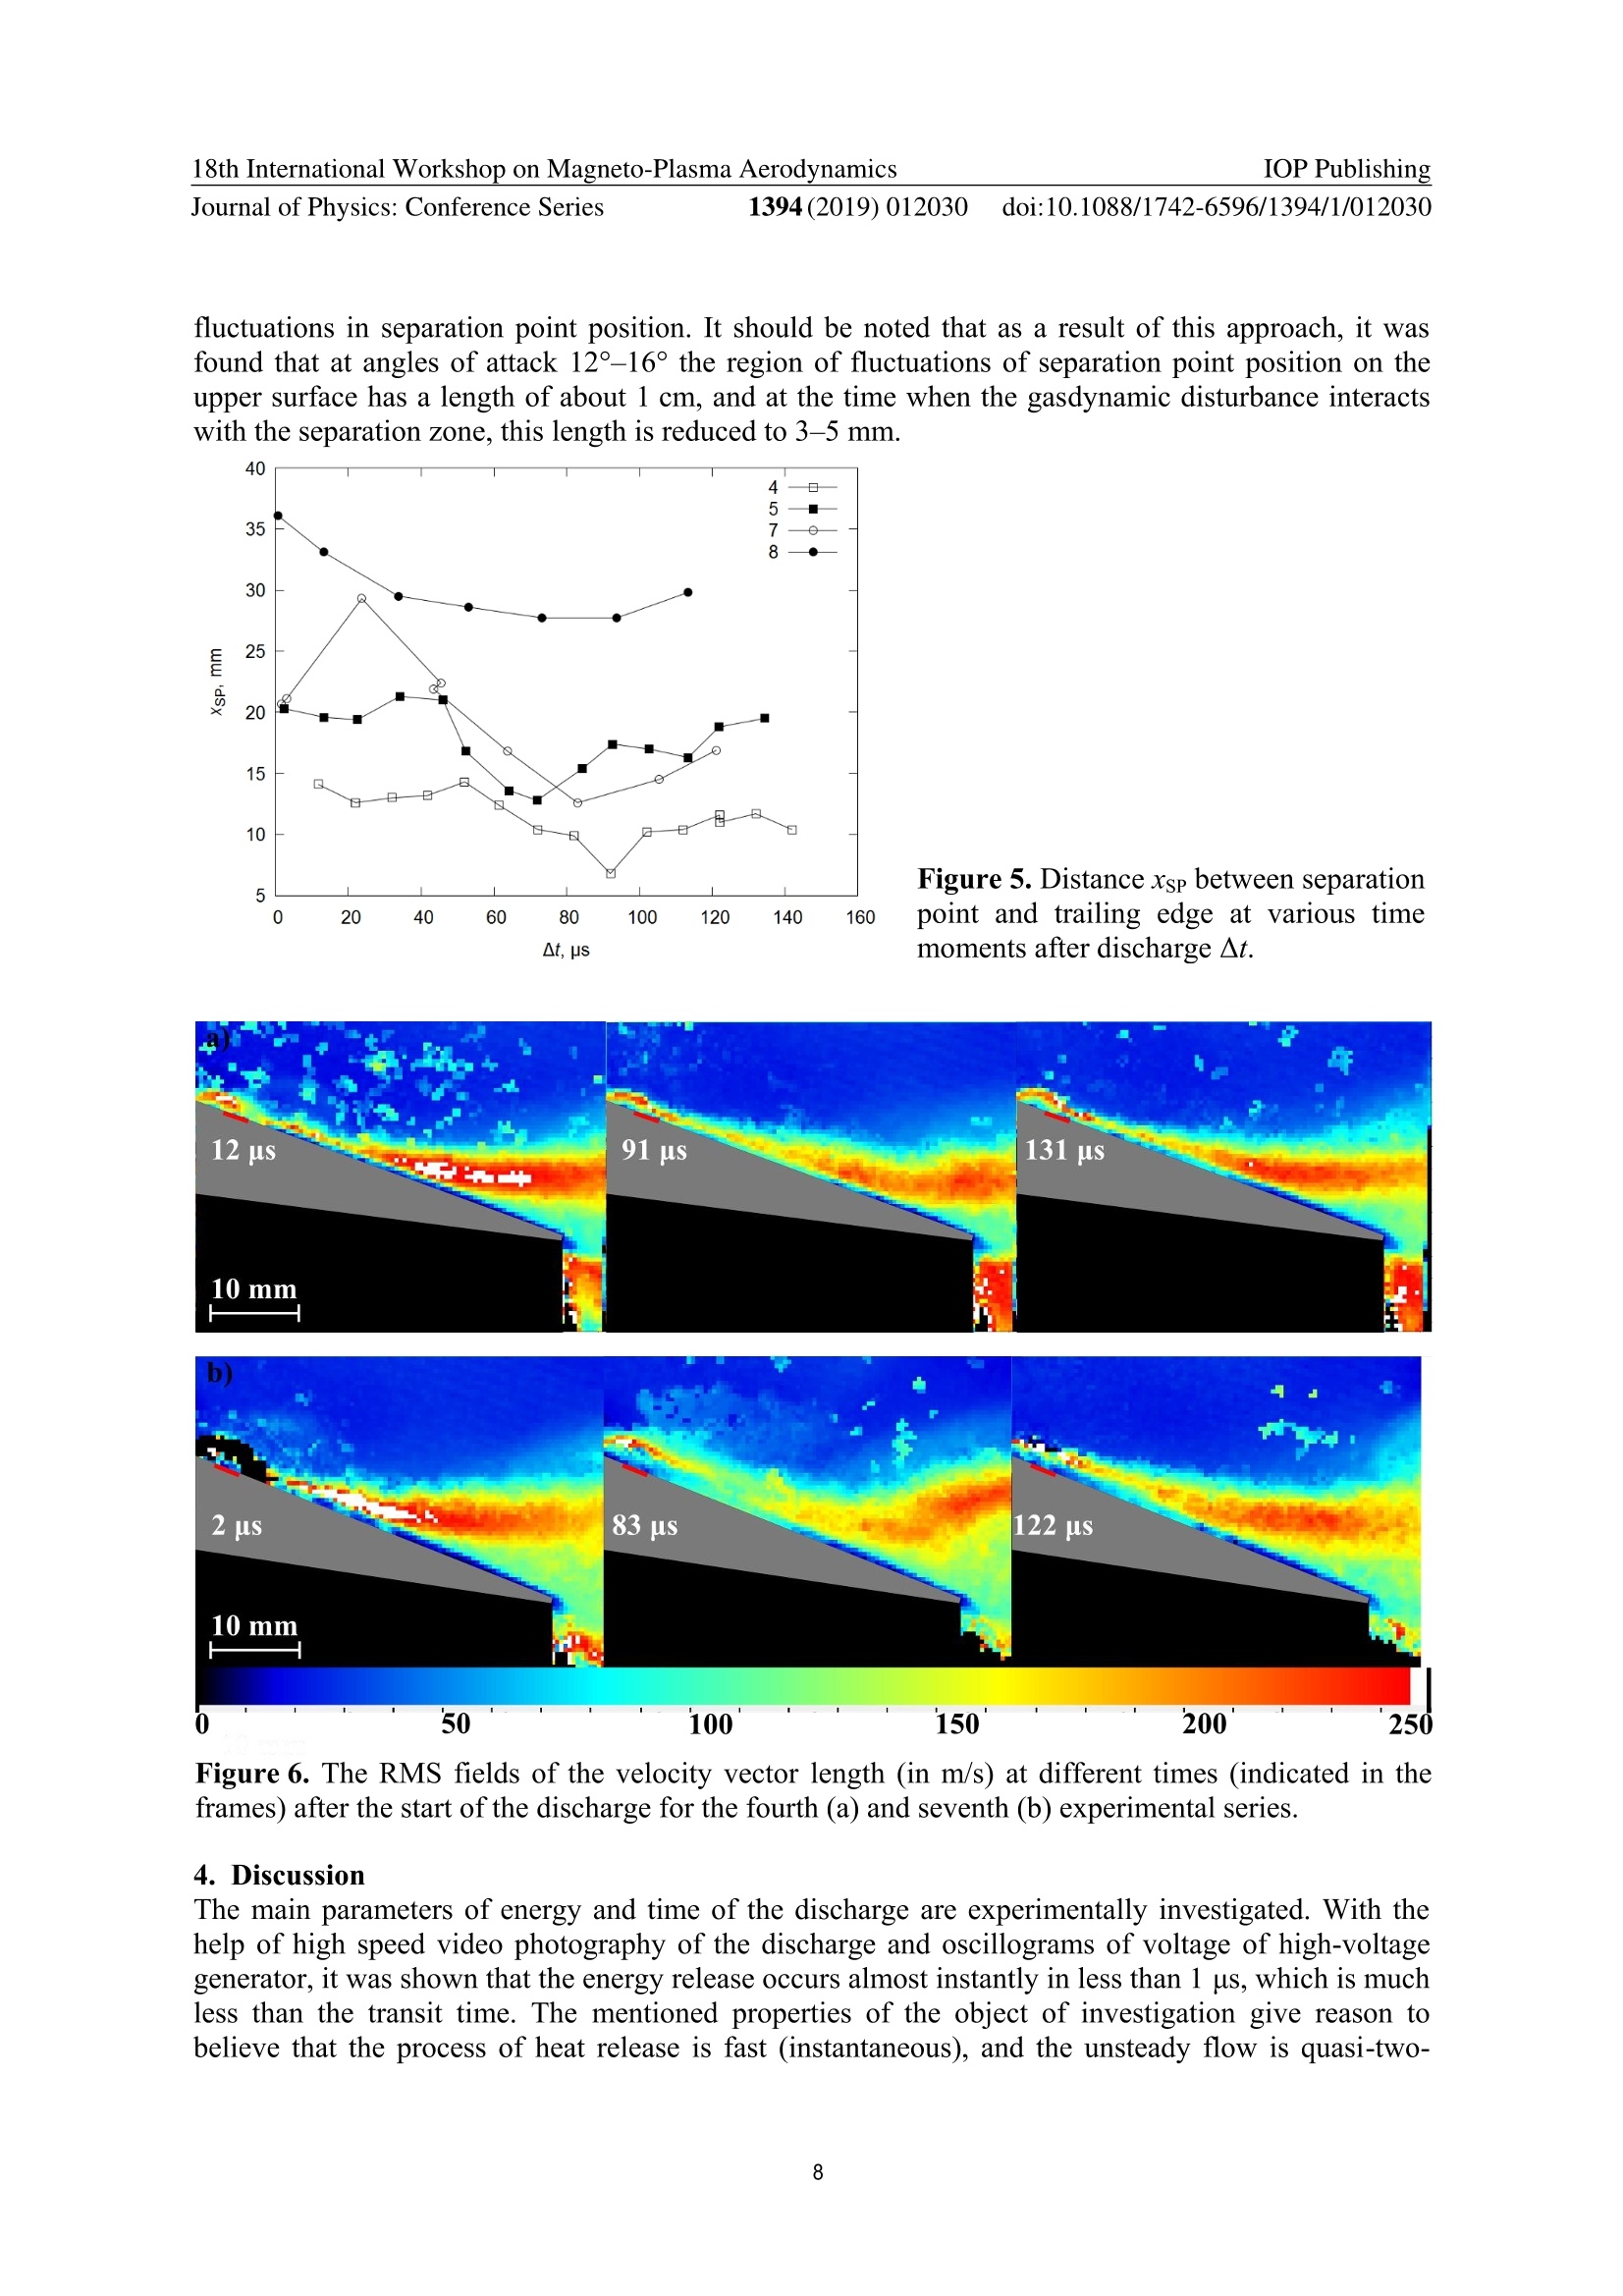
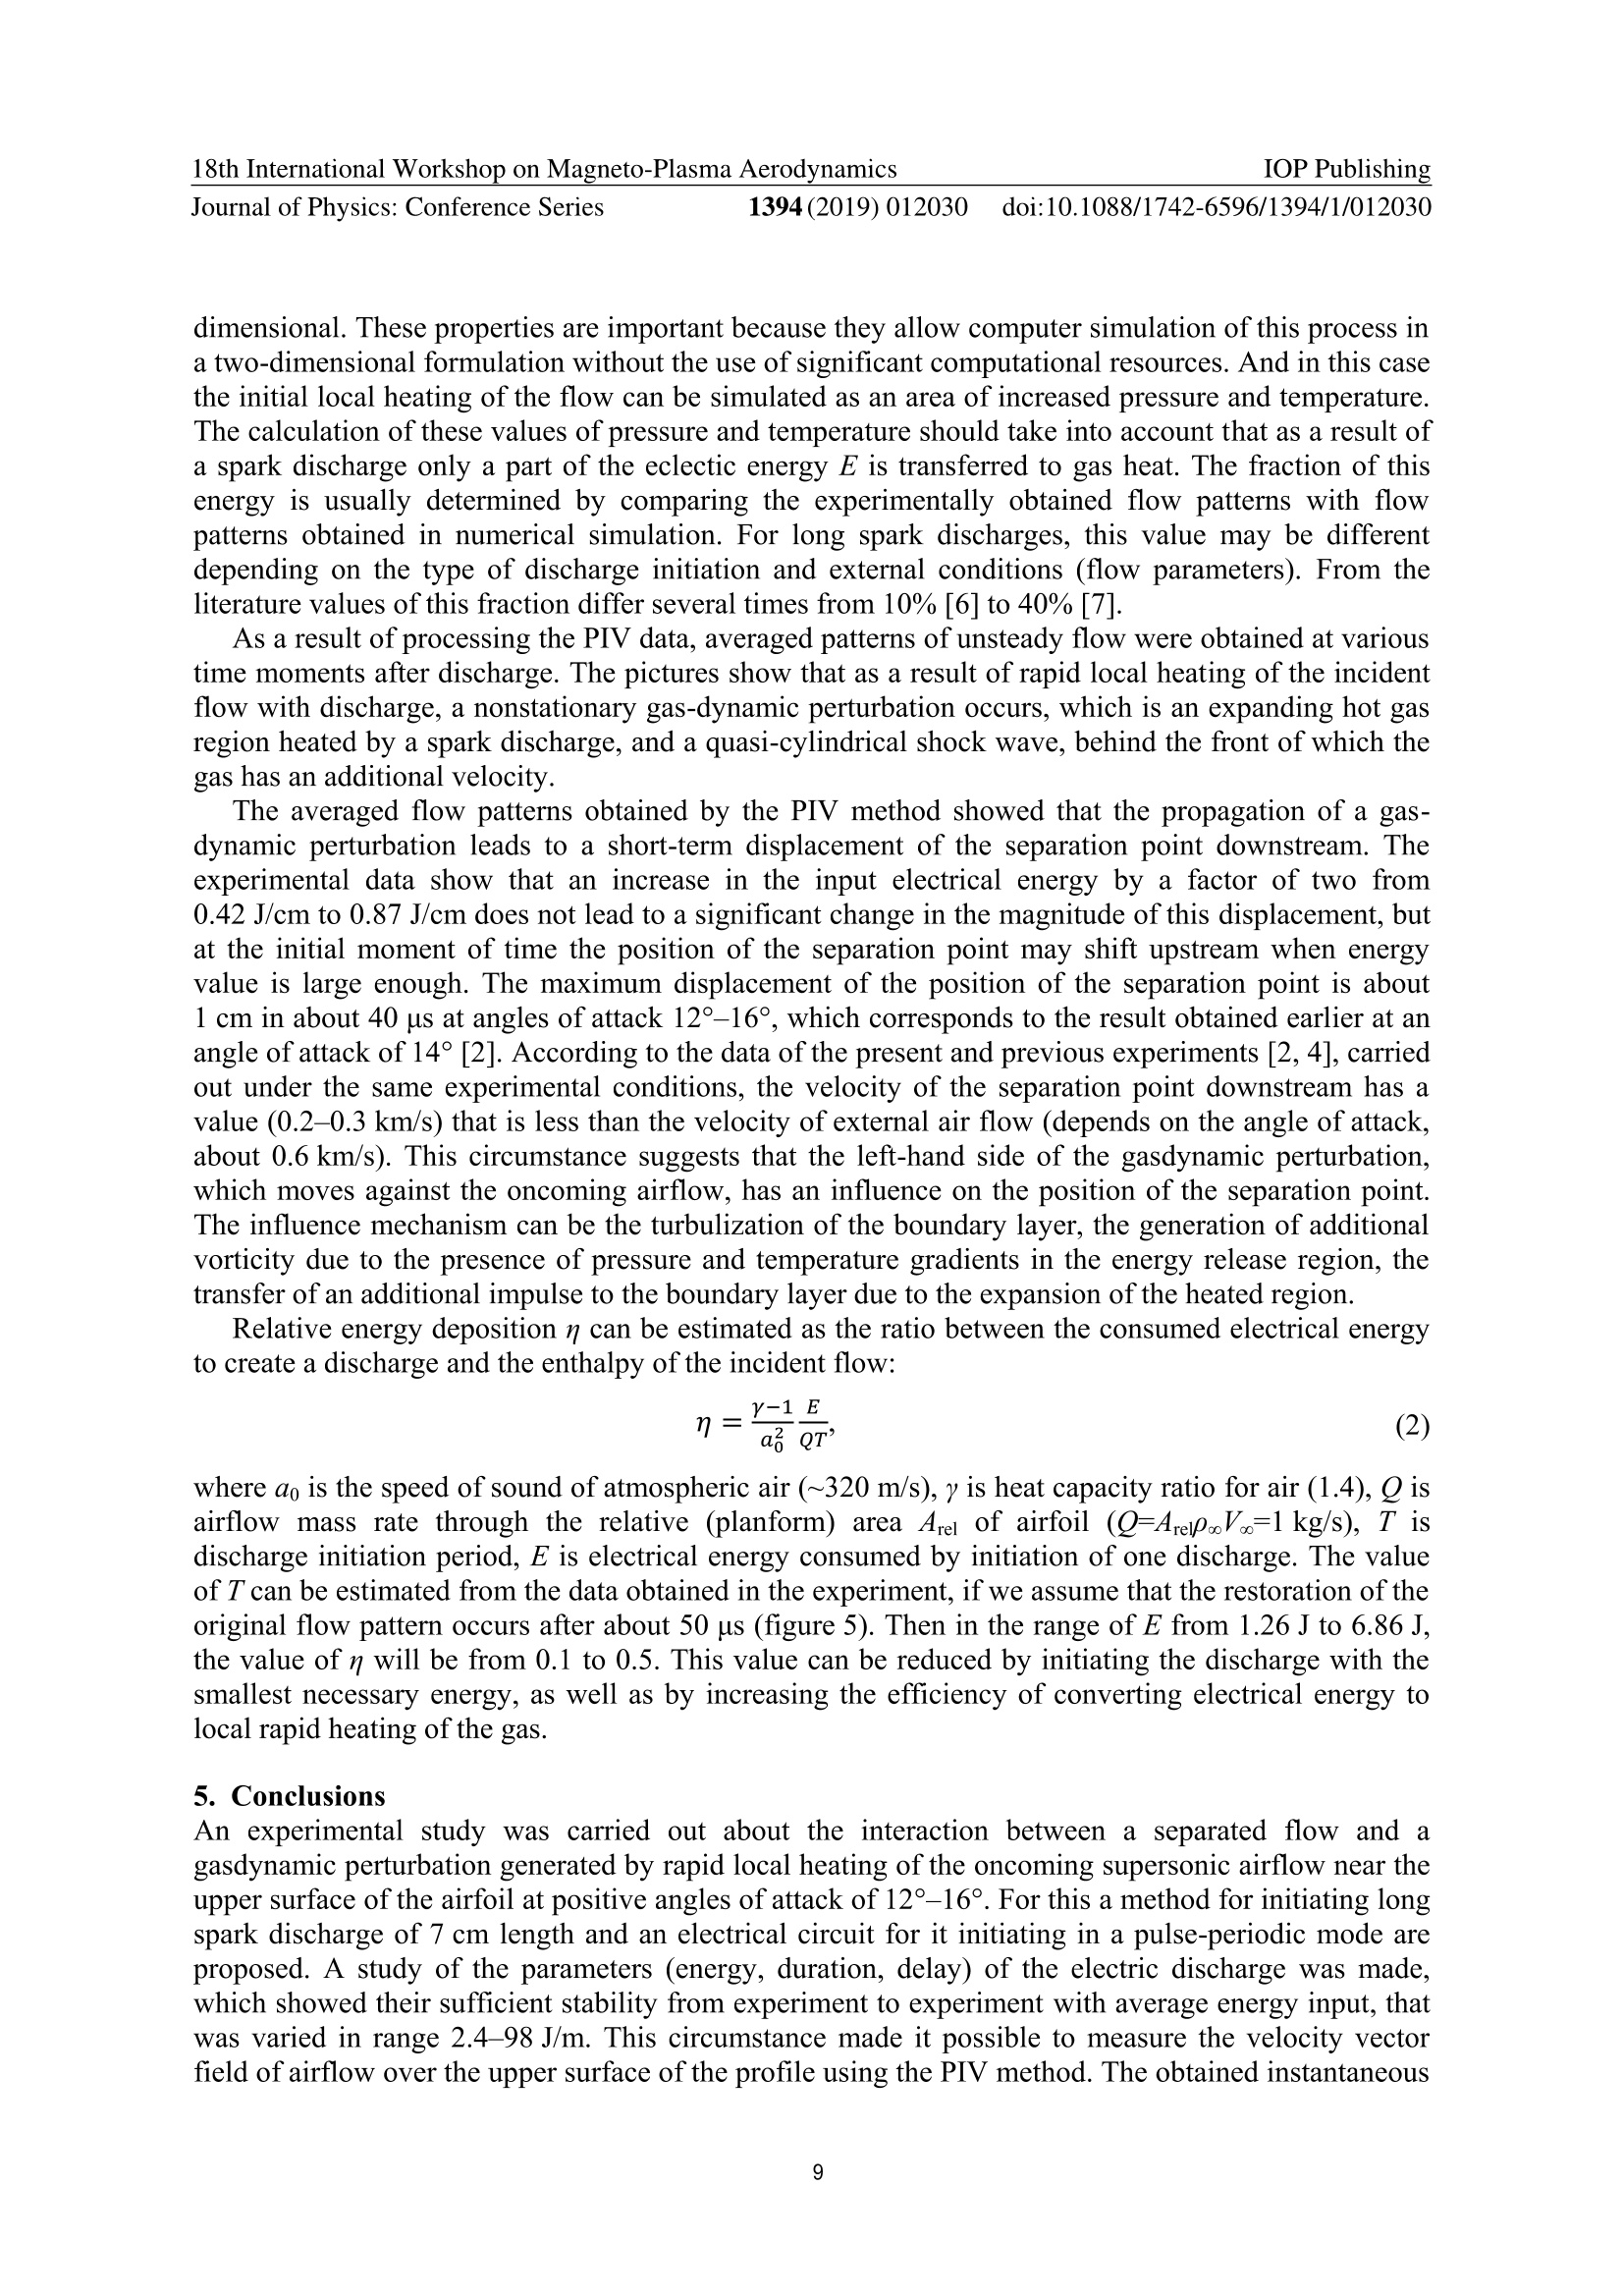
Journal of Physics: Conference Series IOP Publishing18th International Workshop on Magneto-Plasma Aerodynamics PAPER·OPEN ACCESS Influence on separation point position by rapid local gas heating withspark discharge on the surface of airfoil streamlined by supersonicairflow To cite this article: A S Saveliev 2019 J. Phys.: Conf. Ser. 1394 012030 TMlOpebooks Bringing you innovative digital publishing with leading voicesto create your essential collection of books in STEM research. Start exploring the collection - download the first chapter ofevery title for free. Journal of Physics: Conference Series 1394 (2019) 012030 doi:10.1088/1742-6596/1394/1/012030 Influence on separation point position by rapid local gasheating with spark discharge on the surface of airfoilstreamlined by supersonic airflow A S Saveliev2 Joint Institute for High Temperatures of the Russian Academy of Sciences,Izhorskaya 13 Bldg 2, Moscow, 125412 Russia,rMoscow Institute of Physics and Technology, Institutskii lane 9,Dolgoprudny,Moscow Region, 141700 Russia E-mail: fisteh@mail.ru Abstract. Experimental investigation of interaction between gas-dynamic perturbations causedby long spark discharge and separation region on the surface of an aerodynamic model.streamlined by supersonic airflow with Mach number M=2, is presented in this paper. ANACA-airfoil with a relative thickness of 12% of the chord length was used as aerodynamicmodel. With the help of the Particle Image Velocimetry method airflow was visualized avarious angles of attack, delays 0-100 us relative to the moment of discharge initiation and atvarious values of stored electric energy 0.1-10 J, that was spent for discharge creation. It wasfound that the flow disturbance caused by the discharge leads to a short-term displacement ofseparation point downstream. 1. Introduction The question of improving the aerodynamic characteristics and the pattern of flow around the surfaceof the vehicles is relevant today. When aircrafts move in the atmosphere, such regimes can be realizedin which the possibility of flight or its control is threatened, for example, when an airplane is flying atsupercritical angles of attack. One of the negative phenomena in the flow pattern is the emergence ofseparation region on the surface of the aircraft, which is characterized by nonstationarity and alteredparameters, for example, an increased pressure value, temperature inside the flow separation region, aswell as an increased drag. Currently there are passive or mechanical methods of controlling separationon the surface of aircraft and they are being used, and methods of active influence on the flow byinitiating electrical discharges of various types near the streamlined surface are being investigated anddeveloped. The main advantages of using electrical discharge are low response time, high peak power,the ability to use it only when it is necessary, and not during the entire flight at all altitudes. The rapiddevelopment of the high-voltage semiconductor industry past years makes it possible to speak of alower specific weight of high-voltage equipment (per unit of power) compared with mechanical andpneumatic devices acting on the flow. However, there are also disadvantages of using an electricaldischarge, primarily due to the need to use dielectric materials, because a discharge is initiated at ahigh electric field strength, as well as with the complexity of computer simulation of physical processes in plasma and gasdynamic processes occurring simultaneously near the surface of theaircraft, due to significantly different values of time parameters of these processes. Therefore,discharge plasma occurrence process is often considered simplistic, for example, as heating of the flowat the volume of discharge initiation. In this paper the investigation of initiation of long sparkdischarge of submicrosecond duration on the surface of a two-dimensional model of a wing across asupersonic airflow around this model at a positive angle of attack is presented. With such duration of discharge it turns out that the transit time is much longer, and the dischargeeffect can be simulated as almost instantaneous local heating of the incoming airflow. After the rapidrelease of energy for local gas heating, a quasi-cylindrical shock wave is formed in the oncomingairflow, which propagates relative to this flow. Behind the shock wave front there is airflow,whichhas a certain speed relative to the main flow. This speed can be both subsonic at a relatively lowintensity of the shock wave, and supersonic at high intensity. In this work using a spark discharge, ashock wave is generated, the recorded propagation velocity of which corresponds to a Mach numberless than 2, and the air velocity behind its front has a velocity of the order of several tens of meters persecond. The purpose of this study is to visualize with Particle Image Velocimetry method (PIV) thepropagation of a gasdynamic perturbation caused by long spark discharge across a supersonic flow.and its interaction with the separation region at various angles of attack of airfoil and dischargeenergy. 2. Experimental setup The experiments were carried out on the ST-4 supersonic wind tunnel of atmospheric-vacuum type, adetailed description of which can be found in [1]. At this facility aerodynamic models are tested insupersonic airflow. In this work the free-stream Mach number was M=2, the static pressure of the flowwas pst=0.15 bar, the mass flow rate through the nozzle was about 1 kg/s, and the time for maintaininga supersonic flow was one minute. The unit Reynolds number in the experiment is Rej~10'm. Anaerodynamic model was placed in a supersonic airflow, which was the NACA64a212 profile with achord length of 98 mm and a span of 150 mm, made of fused silica material and with a dischargedevice mounted at 38 mm from the trailing edge. A more detailed description of used aerodynamicmodel can be found in [2]. It is important to note that, due to its design, the discharger made it possibleto obtain long spark discharge of 7 cm in length in a supersonic air flow with a Mach number M=2,while the heat release using a discharge occurred across the flow. The design of the working chamberST-4 provides a mechanism by which it was possible to set the desired angle of attack of the wingmodel. During test run the flow around a wing model was diagnosed using a Particle Image Velocimetrylaser system. The working chamber of the supersonic wind tunnel is equipped with several transparentwindows, which made it possible to introduce a laser sheet for visualizing the flow above the airfoil.as well as to photograph from above long spark discharge in the airflow. For measurements, theLaVision FlowMaster 2D PIV system was used, as well as an oil aerosol generator based on Laskinnozzle [3], which provides a productive airflow seeding by droplets of oil with a diameter close to1 um. The area visible by the PIV-videocamera was 48x35 mm’ and it was located near the trailingedge of the profile, so that particles moving in the flow above the upper surface of the profile and theplace of initiation of the discharge (discharger) were in PIV-photos. The spatial resolution of the PIVsystem was 0.5 mm. High free-stream velocity, the presence of shock waves and the separation region require the usageof tracer particles with a relatively small diameter and, accordingly, high-energy lasers in a singlepulse. Since the PIV system used an Nd:YAG laser pumped by a gas-discharge lamp with a pumpingtime of about 100 us, which is close to the time of flight in experiments, and operational frequencyless than 14 Hz, a high-voltage pulse generator was used to control the initiation of the sparkdischarge. A generator is an electrical circuit based on a Marx two-stage circuit. Switching in thegenerator took place with the help of two air spark dischargers, one of which is controlled. In [2, 4]another discharge initiation scheme was used, where the initiation of a spark discharge occurred in an uncontrolled manner, and the non-stationary flow caused by the discharge was recorded independentlyof this process. Simply the high-voltage generator circuit can be characterized by a net capacitance Co, which at thetime of discharge is charged up to doubled value of the charge voltage U. The capacitance Co was setby the generator circuit (Co was varied from 4 nF to 50 nF) with the help of several high-voltagecapacitors, and Uo was varied in accordance with the breakdown voltage for a controlled dischargerand was set with the help of a high-voltage power supply. The amplitude of the high-voltage pulsewhen applied to the discharger mounted in the wing model corresponded to a voltage that exceeds abreakdown value of 1 kV/cm, which was previously determined under the same experimentalconditions [2]. In experiments LeCroy WaveRunner 66Zi digital storage oscilloscope was used, the first inputchannel of which was supplied with voltage from a high-voltage 1:1000 LeCroy PPE20KV probeconnected to a high-voltage generator, and to the second input channel a sync pulse from a PIV systemwas applied, which was a positive TTL-pulse, the rise edge of which corresponds to the moment ofPIV-measurement. Oscillograms were recorded during the entire experimental run (10 s) with adiscretization time 100 ns. The oscillogram of the voltage on the capacitors of a high-voltage generatorcan be characterized by a periodic process of slow charging to a voltage Uo (~10 ms) and fas1discharging to a voltage U due to the occurrence of a spark discharge and the release of energy intothe airflow (~0.1 us). Due to this form of oscillograms of the voltage across the capacitor of thegenerator and the sync pulse of the PIV system, they can be processed with computer algorithm. Thus,by recording the oscillograms and their subsequent processing using a computer program, one candetermine the voltage Uo, the residual voltage U after the discharge, the moments of the occurrence ofthe discharge and the PIV measurements. With simultaneous processing of the oscillograms and PIVphotographs of single test run, the average spatial distribution flow velocity vector at the time At afterthe discharge, the average value of the electric energy E that was consumed per discharge, the averageduration of the discharge t were obtained. The amount of electrical energy was determined by theformula: In addition, the static pressure of the flow pst and pressure pa of air which surrounds the supersonicjet in the working chamber were recorded synchronously with the PIV measurements, so that eachframe could be assigned a flow regime beyond the nozzle exit section. As stated above, oneexperiment lasted 10 seconds, 5 seconds before the onset of the ideally expanded flow regime on theST-4 facility and 5 seconds after. At the same time, the pressure ratio papst varied in the range from0.85 to 1.15. The number of PIV frames registered with a frequency of 14 Hz was 140. Thus, in each experimental test run the following parameters were set: electrical energy E, whichwas spent on long spark discharge creation, the delay At between the start of the discharge and thetime of the PIV measurement, the angle of attack of the airfoil. The place of initiation of the discharge(i.e. the place of energy release) was fixed on the surface of the airfoil and was specified by theposition of the discharger. By varying the value of At in the range from 0 us to 100 us (thecharacteristic value of the transit time) with a step of 10 us or 20 ps, it was possible to reconstruct thedynamics of the propagation of gasdynamic perturbations that occur after the initiation of thedischarge. To do this, the PIV frames obtained in single test run were tested (by oscillogramprocessing) for compliance with the delay relative to the set value and for the occurrence of adischarge (by the frames taken from the top view of the airfoil). The frames that passed tests wereaveraged, and the flow pattern was obtained in the form of fields of velocity vectors for a givendelay At. 3. Obtained results In order to average the passed PIV frames, obtained with fixed E,At, it is necessary to check howwide the dispersions of these parameters from discharge to discharge in single test run are. It is alsonecessary to check that the discharge duration t has a constant value, and the place of discharge initiation coincides with the location of the discharger on the surface of the wing model. To do this,the oscillograms and recorded images of a spark discharge, obtained in each test run,were processed.After such processing statistics of the energy E, the duration t, the delay from the PIV-frame momentrelative to the moment of initiation of the discharge ▲t were obtained of an each individual discharge.The processing was carried out with the help of the developed computer program, which takes on itsinput the oscillograms of the voltage on the capacitor of the high-voltage generator and the PIV systemsync pulse. To reconstruct the nonstationary flow pattern, i.e. to obtain PIV measurements at differentAt values, it is necessary to show that from one test run to another the value of E does not changesignificantly. Figure 1 shows the typical histograms of the distribution of delay At and energy E.obtained after processing the oscillograms of one experimental test run. On the presented histogramsone can select the maximum and its width. Figure 2 shows the variation of the parameters At, E and tin different experimental series depending on the number of the experimental launch. Table 1 presentsthe parameters of each run. In table 1 and in figure 2, the values with the‘av’index is the mean valuesfor the corresponding experimental series. The nonmonotonic dependence between discharge time rand the net capacitance Co of the generator is associated with the usage of various ceramic capacitorsin various experimental series. These sets of capacitors differ in their nominal capacitance (1 nF,4.7 nF or 10 nF), in size, manufacturers. Thus, in the experimental series, not only the magnitude ofthe net capacitance Co changed, but also the inductance of the discharge circuit. The following conclusions can be drawn from the presented statistics of the properties ofdischarges. The duration of any discharge t did not exceed 1 us in any experiment, while the averagedischarge duration Tay did not exceed 0.5 ps. During this period, the main flow over the airfoil travelsno more than 0.6 mm, which is two orders of magnitude less than the length of the wing profile chord.At the same time, the obtained photographs of the discharge from top view with an exposure of about10 us do not show a ‘blurred'image of the spark channel. These two circumstances make it possible tcconsider the process of energy release into the oncoming air stream almost instantaneously. The scatter of the magnitude of the energy E of all discharges mainly (except series 4) did notexceed ±5%of the average value of the electric energy Eau. In the theory of a very strong explosion[5] the velocity of a generated shock wave with a two-dimensional fast release of energy has a powerdependence on E with an exponent of 0.25. The length of the energy release is fixed and coincideswith the distance between the outer segments of the spark gap (this distance is 7 cm). Thesecircumstances make it possible to assume that the intensity of the shock waves generated by thedischarge in each experimental test run has a relatively stable value. At the same time, this intensity isrelatively stable throughout the entire experimental series. Figure 1. Typical histograms of the distribution of the delay At (a) and energy E (b). ‘RF’is therelative frequency of the discharge occurrence with a given parameter value. The change of the At value is from -10 us to +20 us relative to that set in the experiment test run,and this dispersion increases with increasing energy of the discharge. But it should be noted that themaxima in the At histograms lie in the range of +5 us relative to the average value, i.e. mostdischarges occur with 10 us jitter. Exp. No Exp. No Figure 2. The dispersions of delay At (a), energy E(b), and discharge duration t (c) nvariousexperiments with different parameters. The numberdenotes the experimental series, the parameters ofwhich are presented in the table 1. Table 1. The parameters of experimental series. ‘AoA’angle of attack. Ser. No Exp.No AoA,° U,kV Co, nF Eav,J Tav, us 1 1-24 12 7.32 1.8 0.17 0.20 2 25-39 12 8.80 3.9 0.56 0.25 3 40-45 14 8.80 3.9 0.55 0.25 4 46-60 12 9.50 8.4 1.26 0.22 5 61-75 14 9.00 19.5 2.95 0.24 6 76-90 14 9.00 8.4 1.23 0.20 7 91-98 14 9.50 38.9 6.08 0.39 8 99-105 16 9.50 44.0 6.86 0.43 Figure shows the typical averaged fields of the flow velocity vector (the Vy component of thevelocity vector is shown in color map) when initiating long spark discharge on the surface of the wingprofile model for two experimental series (see experimental series 4 and 7 in table 1). In this case,averaging is made over approximately 100 PIV measurements. The red line shows the place ofinitiation of the spark discharge, the gray area is the schematically indicated airfoil, and the black areabelow is the shadow from this airfoil. The white area in the flow patterns actually corresponds to the separated airflow. Oncoming supersonic airflow is from left to right. The x axisis directedhorizontally from left to right, and the y axis is directed vertically from bottom to top. On the presented unsteady flow patterns for the fourth series at the time t=12 us, it can be seenthat a shock wave is formed after the discharge, which adds velocity to the incident flow in thedirection of the y axis. At the time At =91 us the separation area has the smallest size, and the distancefrom the separation point to the trailing edge (coincides with the right edge of the shadow from theairfoil) has the smallest value at this time point. At the time At =131 us, the front of the shock wave isnot registered in the flow pattern, because on the one hand the intensity of the shock wave hassignificantly decreased by this time, and on the other hand, the shock wave partially left the areavisible by the video camera due to blow-off by the incident airflow. At this time moment the positionof the separation point has almost returned to the initial one. The flow pattern for the seventh series (figure b) shows that at the initial moment of time afterdischarge (At =2 us), the separation region is closer to the place of initiation of the discharge (becauseangle of attack is greater than in fourth series of experiments), but still energy release occurs upstreamrelative to the separation point. After initiating discharge, a quasi-cylindrical shock wave briefly arisesin the flow, which propagates downstream and interacts with the separation region. It is seen that at acertain point in time (At =83 pus) this interaction leads to a shift of the separation point downstream. Inthe middle frame (At=83 us), the shock wave is still visible in the form of a relatively high value ofV, in the upper part of the flow pattern. The position of the separation point returns to its original valueas the shock wave is blown off by an external supersonic and flow and its intensity decays(At =122 ps). Figure 3. The averaged fields of the Vy component (in m/s) of the velocity vector at different times(indicated in the frames) after the start of the discharge for the fourth (a) and seventh (b) experimentalseries. Arrows indicate airflow direction. Dashed curves indicates schematically shock waves fron1detected by increased value of Vy. Interaction of flow separation region and gasdynamic perturbation caused by discharge can also beshown by a set of velocity profiles along the interval perpendicular to the airfoil surface. On figure 4aand 4b V component (normalized on oncoming airflow speed Vo =500 m/s) profiles along the corresponding intervals are presented. For experimental series 4 (see table 1) this interval starts on thedistance 10 mm from trailing edge, for experimental series 7 this distance is 11 mm. These valueswere chosen to demonstrate clearly the effect of interaction between gasdynamic perturbation andflow separation region. If interval is not in flow separation region then V is always greater than 0 m/s(see red curves), but if Vx<0 m/s then there are separation region (see black and blue curves). Velocityvector is directed almost parallel to the airfoil surface (in vicinity to it) and V, is also can indicateseparation region and separation point position. The practice shows that spatial distribution ofV,component (that is presented at figure) more clear shows separation point position at the surface ofairfoil. It should be noted that on presented profiles V. is not equal 0 m/s atl =0 mm, because startpoints of intervals lay slightly higher than airfoil upper surface. In experiment PIV-measurementscannot be performed in closer vicinity of this surface due to light scattering on it and spatial resolutionof optical system. Figure 4. Vx component (normalized on incoming airflow velocity V.=500 m/s) profiles alongintervals shown on figure.T’is a distance from airfoil surface. The experimentally observed effect can be represented as graphs of the dependence of theseparation point position xsp relative to the trailing edge versus time At after the discharge initiation.Figure 5 presents the dependences of xsp(At) for some experimental series 4, 5, 7,8 (see table 1). Fromthe presented dependencies one can conclude that in the range of electrical energy from 0.18 J/cm to0.98 J/cm, which is spent for spark discharge initiation on the surface of the airfoil, a short-termdisplacement of the separation point is less than 1 cm. When the discharge energy changes by 5 times,this shift turns out to be almost the same. If one compares all the experimental series presented in thefigure, it turns out that the displacement of the separation point downstream begins earlier at a largervalue of angle of attack. This circumstance is due to the fact that at a larger angle of attack the positionof the separation point is closer to the place of initiation of the discharge. If we compare theexperimental series 5 and 7, it turns out that with an increase in the discharge energy by a factor oftwo, a short-term effect of early separation may occur due to an excessively strong shock wave causedby the discharge. On the graph this is expressed by a short-term increase in the xsp position of theseparation point. The separation of the flow from the upper surface of the airfoil has unsteady nature, and theposition of the separation point is not constant in time. Figure 5 shows the average values of separationpoint position, which was determined by the average velocity field. In addition to the averaged field,the fields of root mean square (RMS) of the components and the length of the velocity vector from theaverage were calculated in order to determine the boundaries of the separation point position. Figure 6shows the fields of the RMS value for the length ofthe velocity vector for experiments correspondingto figure. To determine the magnitude of the fluctuations in the position of the separation point, athreshold of 250 m/s was selected, which corresponds to half the free-stream velocity V.=500 m/s. Inthe presented RMS fields regions with maximum values that are close to this threshold are visible. Theprojection of these regions onto the upper surface of airfoil determined the magnitude of the fluctuations in separation point position. It should be noted that as a result of this approach, it wasfound that at angles of attack 12°-16° the region of fluctuations of separation point position on theupper surface has a length of about 1 cm, and at the time when the gasdynamic disturbance interactswith the separation zone, this length is reduced to 3-5 mm. Figure 5. Distance xsp between separationpoint and trailing edge at various timemoments after discharge At. Figure 6. The RMS fields of the velocity vector length (in m/s) at different times (indicated in theframes) after the start of the discharge for the fourth (a) and seventh (b) experimental series. 4. Discussion The main parameters of energy and time of the discharge are experimentally investigated. With thehelp of high speed video photography of the discharge and oscillograms of voltage of high-voltagegenerator, it was shown that the energy release occurs almost instantly in less than 1 us, which is muchless than the transit time. The mentioned properties of the object of investigation give reason tobelieve that the process of heat release is fast (instantaneous), and the unsteady flow is quasi-two- dimensional. These properties are important because they allow computer simulation of this process ina two-dimensional formulation without the use of significant computational resources. And in this casethe initial local heating of the flow can be simulated as an area of increased pressure and temperature.The calculation of these values of pressure and temperature should take into account that as a result ofa spark discharge only a part of the eclectic energy E is transferred to gas heat. The fraction of thisenergy is usually determined by comparing the experimentally obtained flow patterns with flowpatterns obtained in numerical simulation. For long spark discharges, this value may be differentdepending on the type of discharge initiation and external conditions (flow parameters). From theliterature values of this fraction differ several times from 10% [6] to 40% [7]. As a result of processing the PIV data, averaged patterns of unsteady flow were obtained at varioustime moments after discharge. The pictures show that as a result of rapid local heating of the incidentflow with discharge, a nonstationary gas-dynamic perturbation occurs, which is an expanding hot gasregion heated by a spark discharge, and a quasi-cylindrical shock wave, behind the front of which thegas has an additional velocity. The averaged flow patterns obtained by the PIV method showed that the propagation of a gas-dynamic perturbation leads to a short-term displacement of the separation point downstream. Theexperimental data show that an increase in the input electrical energy by a factor of two from0.42 J/cm to 0.87 J/cm does not lead to a significant change in the magnitude of this displacement, butat the initial moment of time the position of the separation point may shift upstream when energyvalue is large enough. The maximum displacement of the position of the separation point is abouf1 cm in about 40 us at angles of attack 12°-16°, which corresponds to the result obtained earlier at anangle of attack of 14° [2]. According to the data of the present and previous experiments [2, 4], carriedout under the same experimental conditions, the velocity of the separation point downstream has avalue (0.2-0.3 km/s) that is less than the velocity of external air flow (depends on the angle of attack,about 0.6 km/s). This circumstance suggests that the l。。eft-hand side of the gasdynamic perturbation,which moves against the oncoming airflow, has an influence on the position of the separation point.The influence mechanism can be the turbulization of the boundary layer, the generation of additionalvorticity due to the presence of pressure and temperature gradients in the energy release region, thetransfer of an additional impulse to the boundary layer due to the expansion of the heated region. Relative energy deposition n can be estimated as the ratio between the consumed electrical energyto create a discharge and the enthalpy of the incident flow: where ao is the speed of sound of atmospheric air (~320 m/s),y is heat capacity ratio for air (1.4), g isairflow mass rate through the relative (planform) area Arel of airfoil (Q=Arep.oV.=1kg/s), T isdischarge initiation period, E is electrical energy consumed by initiation of one discharge. The valueof T can be estimated from the data obtained in the experiment, if we assume that the restoration of theoriginal flow pattern occurs after about 50 us (figure5). Then in the range of E from 1.26 J to 6.86 J,the value of n will be from 0.1 to 0.5. This value can be reduced by initiating the discharge with thesmallest necessary energy, as well as by increasing the efficiency of converting electrical energy tolocal rapid heating of the gas. 5. Conclusions An experimental study was carried out about the interaction between a separated flow and agasdynamic perturbation generated by rapid local heating of the oncoming supersonic airflow near theupper surface of the airfoil at positive angles of attack of 12°-16°. For this a method for initiating longspark discharge of 7 cm length and an electrical circuit for it initiating in a pulse-periodic mode arezofproposed. A study of the parameters (energy, duration, delay) of the electric discharge was made.which showed their sufficient stability from experiment to experiment with average energy input, thatwas varied in range 2.4-98 J/m. This circumstance made it possible to measure the velocity vectorfield of airflow over the upper surface of the profile using the PIV method. The obtained instantaneous (averaged) fields of the flow velocity vector at various time moments after the initiation of thedischarge show that the gasdynamic perturbation, which is a quasi-cylindrical shock wave and aregion of increased pressure that moves downstream, affects the separation region. This effect leads toa shift in the position of the separation point (up to about 1 cm) downstream to the trailing edge. Fieldsof root mean square for the velocity vector are also obtained, from which the boundaries of theposition of the separation point on the upper surface of the profile are determined. At the specifiedangles of attack, the oscillations of separation point position were ±5 mm from average value. Theexperiment showed that the fluctuations in the position of the separation point decrease by 2-3 timesduring interaction of the gasdynamic perturbation with separation region. Thus, the region of increasedpressure that caused by the discharge and propagating downstream limits the oscillation range of theseparation point position, and this on average leads to its displacement to the trailing edge. Acknowledgments The reported study was funded by RFBR according to the research project Ne 18-38-00803. References ( Son E E 2 016 Physical Mechanics: Laboratory Workshops (Begell House Publishers) ) Saveliev A S 2018 J. Phys.: Conf. Ser. 1112 012014 ( Raffel M, Willert C E, Scarano F, Kahler C , Wereley S T and Kompenhans J 2 018 ParticleImage V e locimetry: A Practical Guide (Springer International Publishing) ) ( [4] Golub VV, Saveliev A S, Sechenov VA, Son E E and Tereshonok D V 2010 High Temp.48(6) 903-9 ) ( Sedov L I 1 993 Similarity and Dimensional Methods in Mechanics (CRC Press) ) ( Elias P Q and Castera P 2013 J. Phys. D: A ppl. Phys. 46 365204 ) ( Znamenskaya I A, Latfullin D F ,Lutsky A E , M u rsenkova I V an d Sy s oev N N 2 0 07 Tech . Phys. 52(5)546-54 ) This content was downloaded from IP address on at Published under licence by IOP Publishing Ltd Experimental investigation of interaction between gas-dynamic perturbations causedby long spark discharge and separation region on the surface of an aerodynamic model,streamlined by supersonic airflow with Mach number M=2, is presented in this paper. ANACA-airfoil with a relative thickness of 12% of the chord length was used as aerodynamicmodel. With the help of the Particle Image Velocimetry method airflow was visualized atvarious angles of attack, delays 0–100 μs relative to the moment of discharge initiation and atvarious values of stored electric energy 0.1–10 J, that was spent for discharge creation. It was found that the flow disturbance caused by the discharge leads to a short-term displacement of separation point downstream.
确定

还剩9页未读,是否继续阅读?

产品配置单


北京欧兰科技发展有限公司为您提供《机翼中速度场检测方案(CCD相机)》,该方案主要用于航空中速度场检测,参考标准--,《机翼中速度场检测方案(CCD相机)》用到的仪器有Imager sCMOS PIV相机、德国LaVision PIV/PLIF粒子成像测速场仪、LaVision DaVis 智能成像软件平台
推荐专场
CCD相机/影像CCD
更多


相关方案
更多
该厂商其他方案
更多