
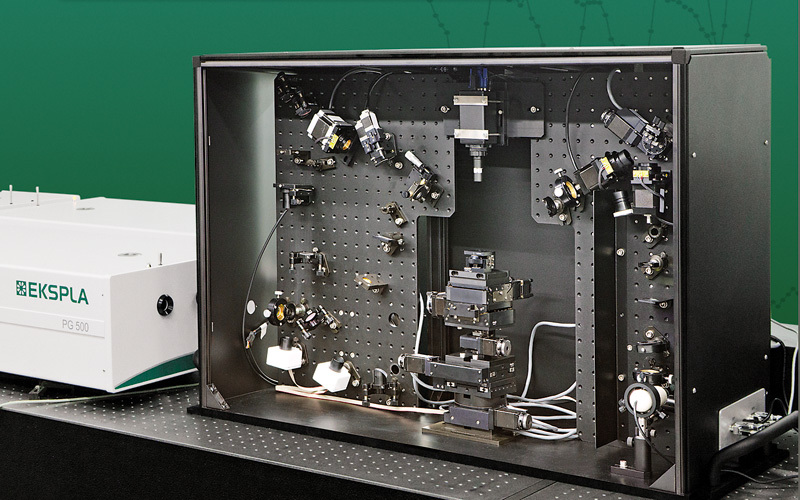


采用Ekspla公司由PL2241型脉冲皮秒激光器和PG501/DFG光学参量发生器构成的振动和频光谱测量系统对一个常压反应池内超高真空生长的模型催化剂样品的和频光谱进行了测量研究。
方案详情

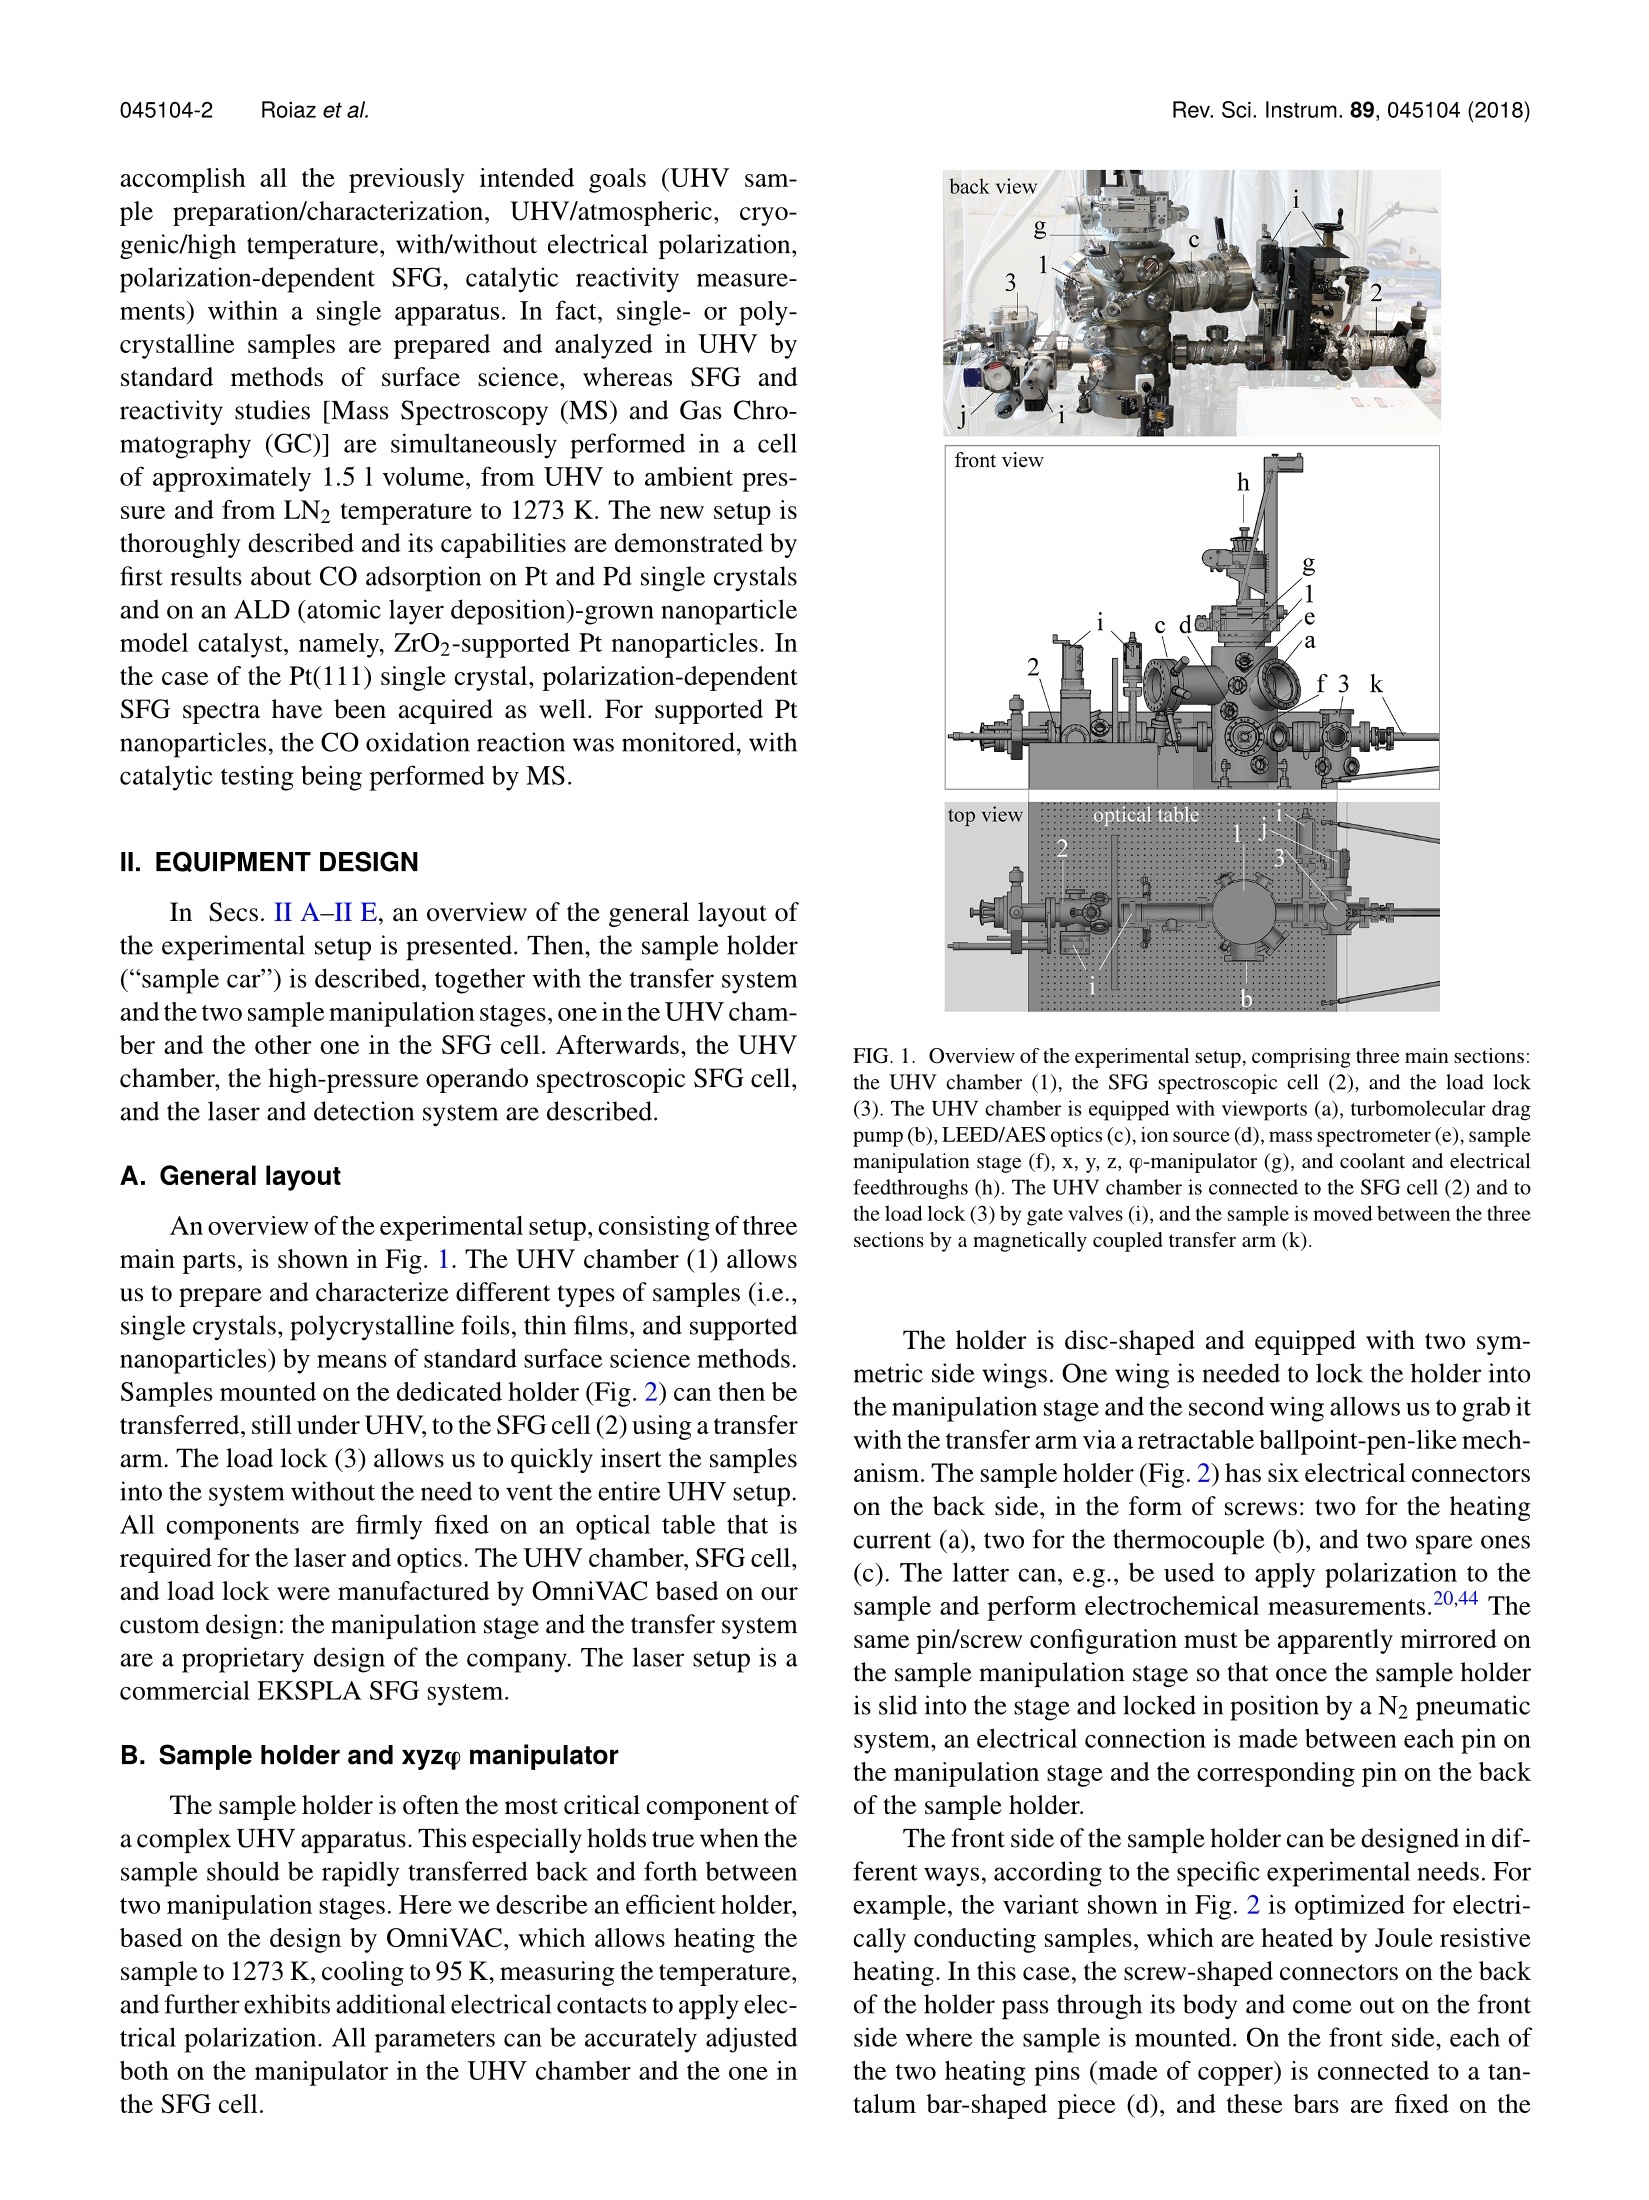
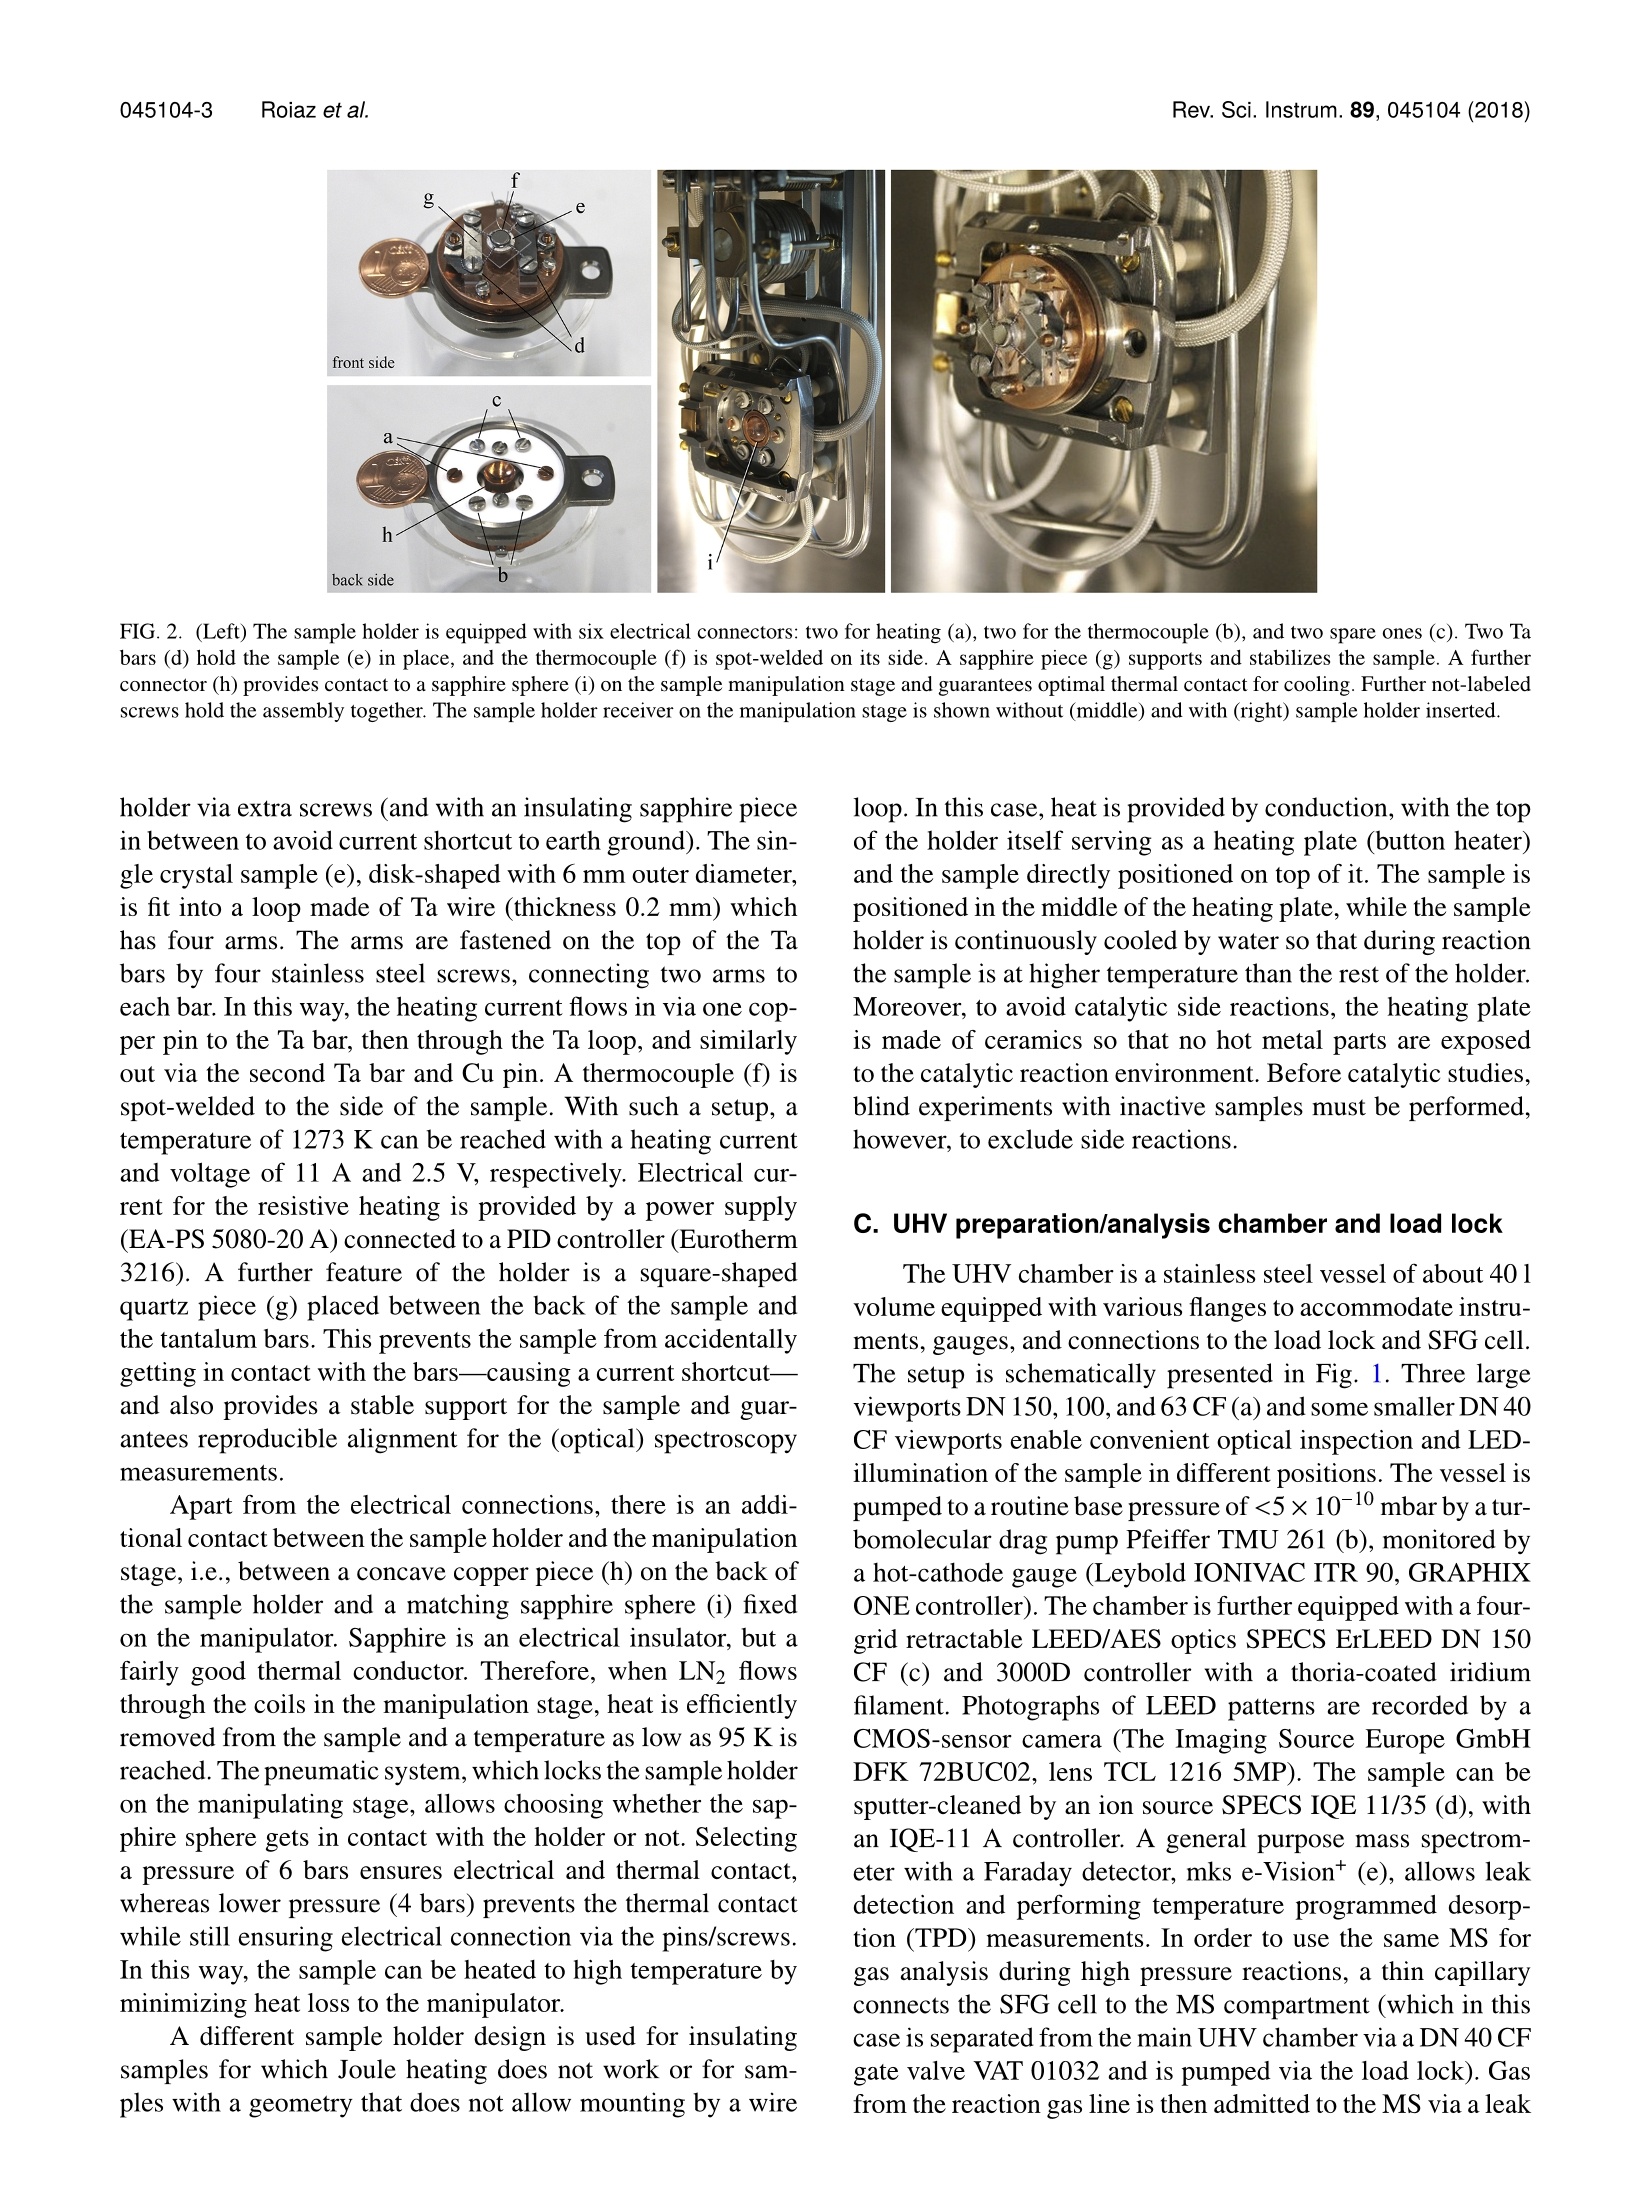
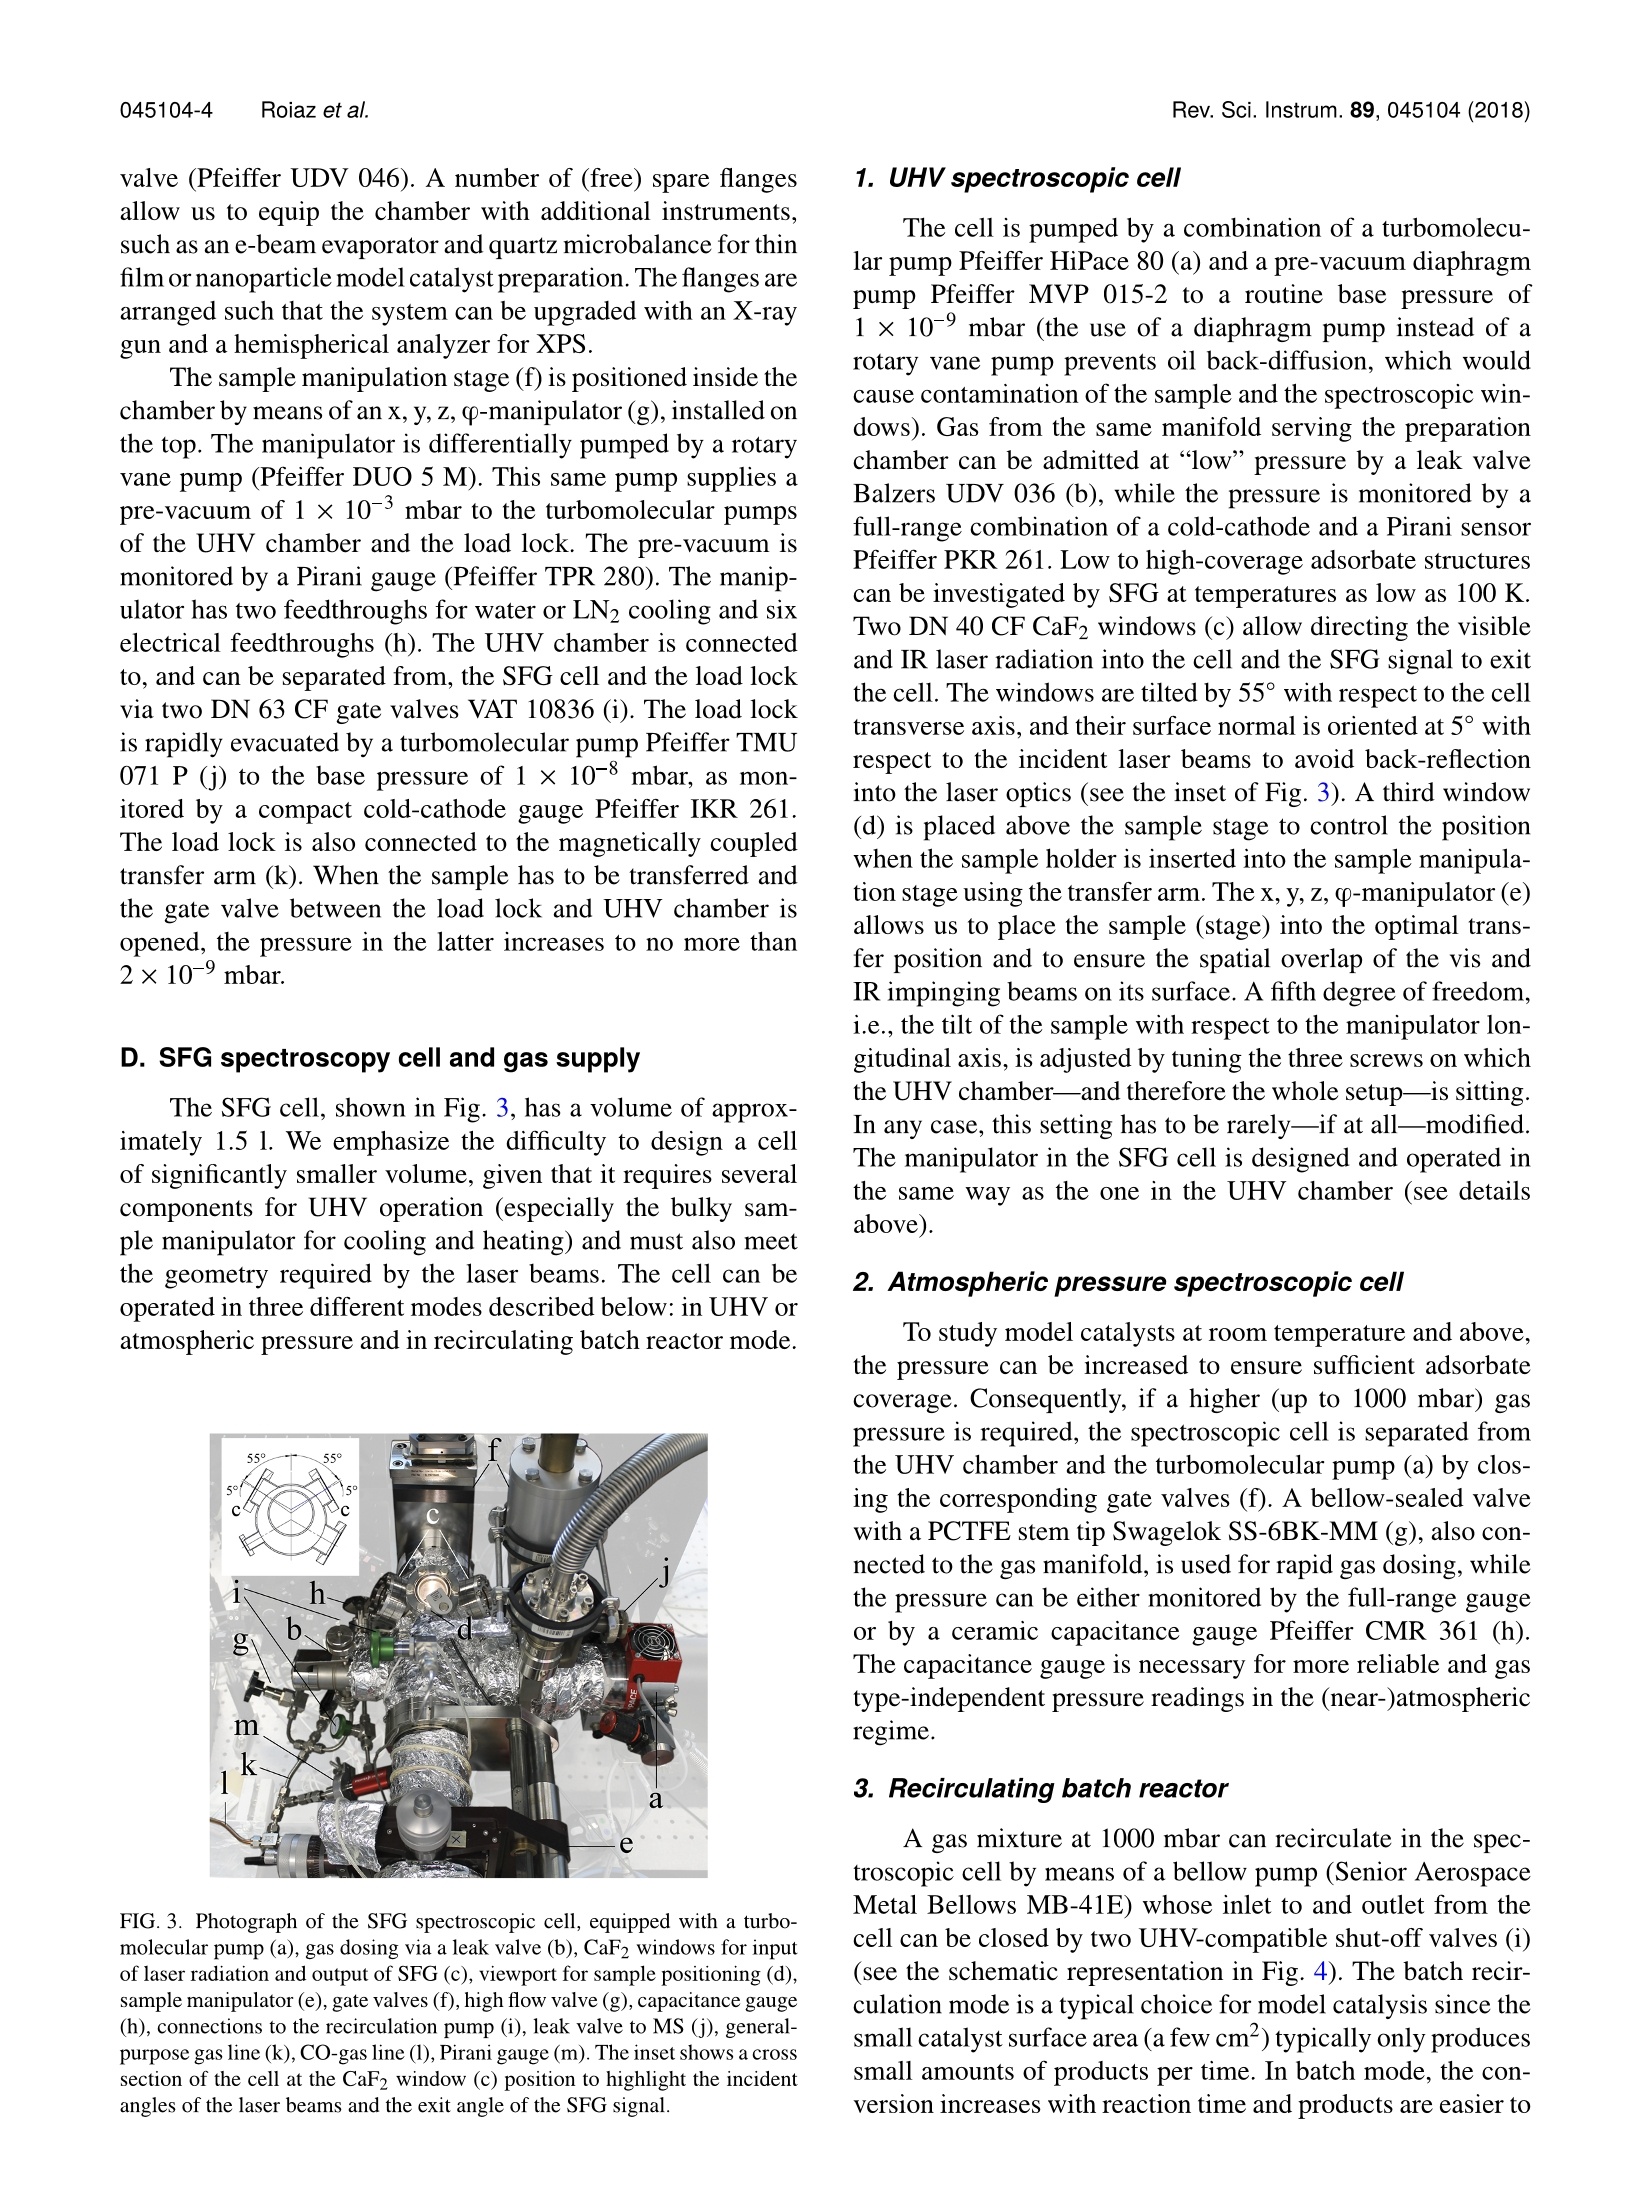
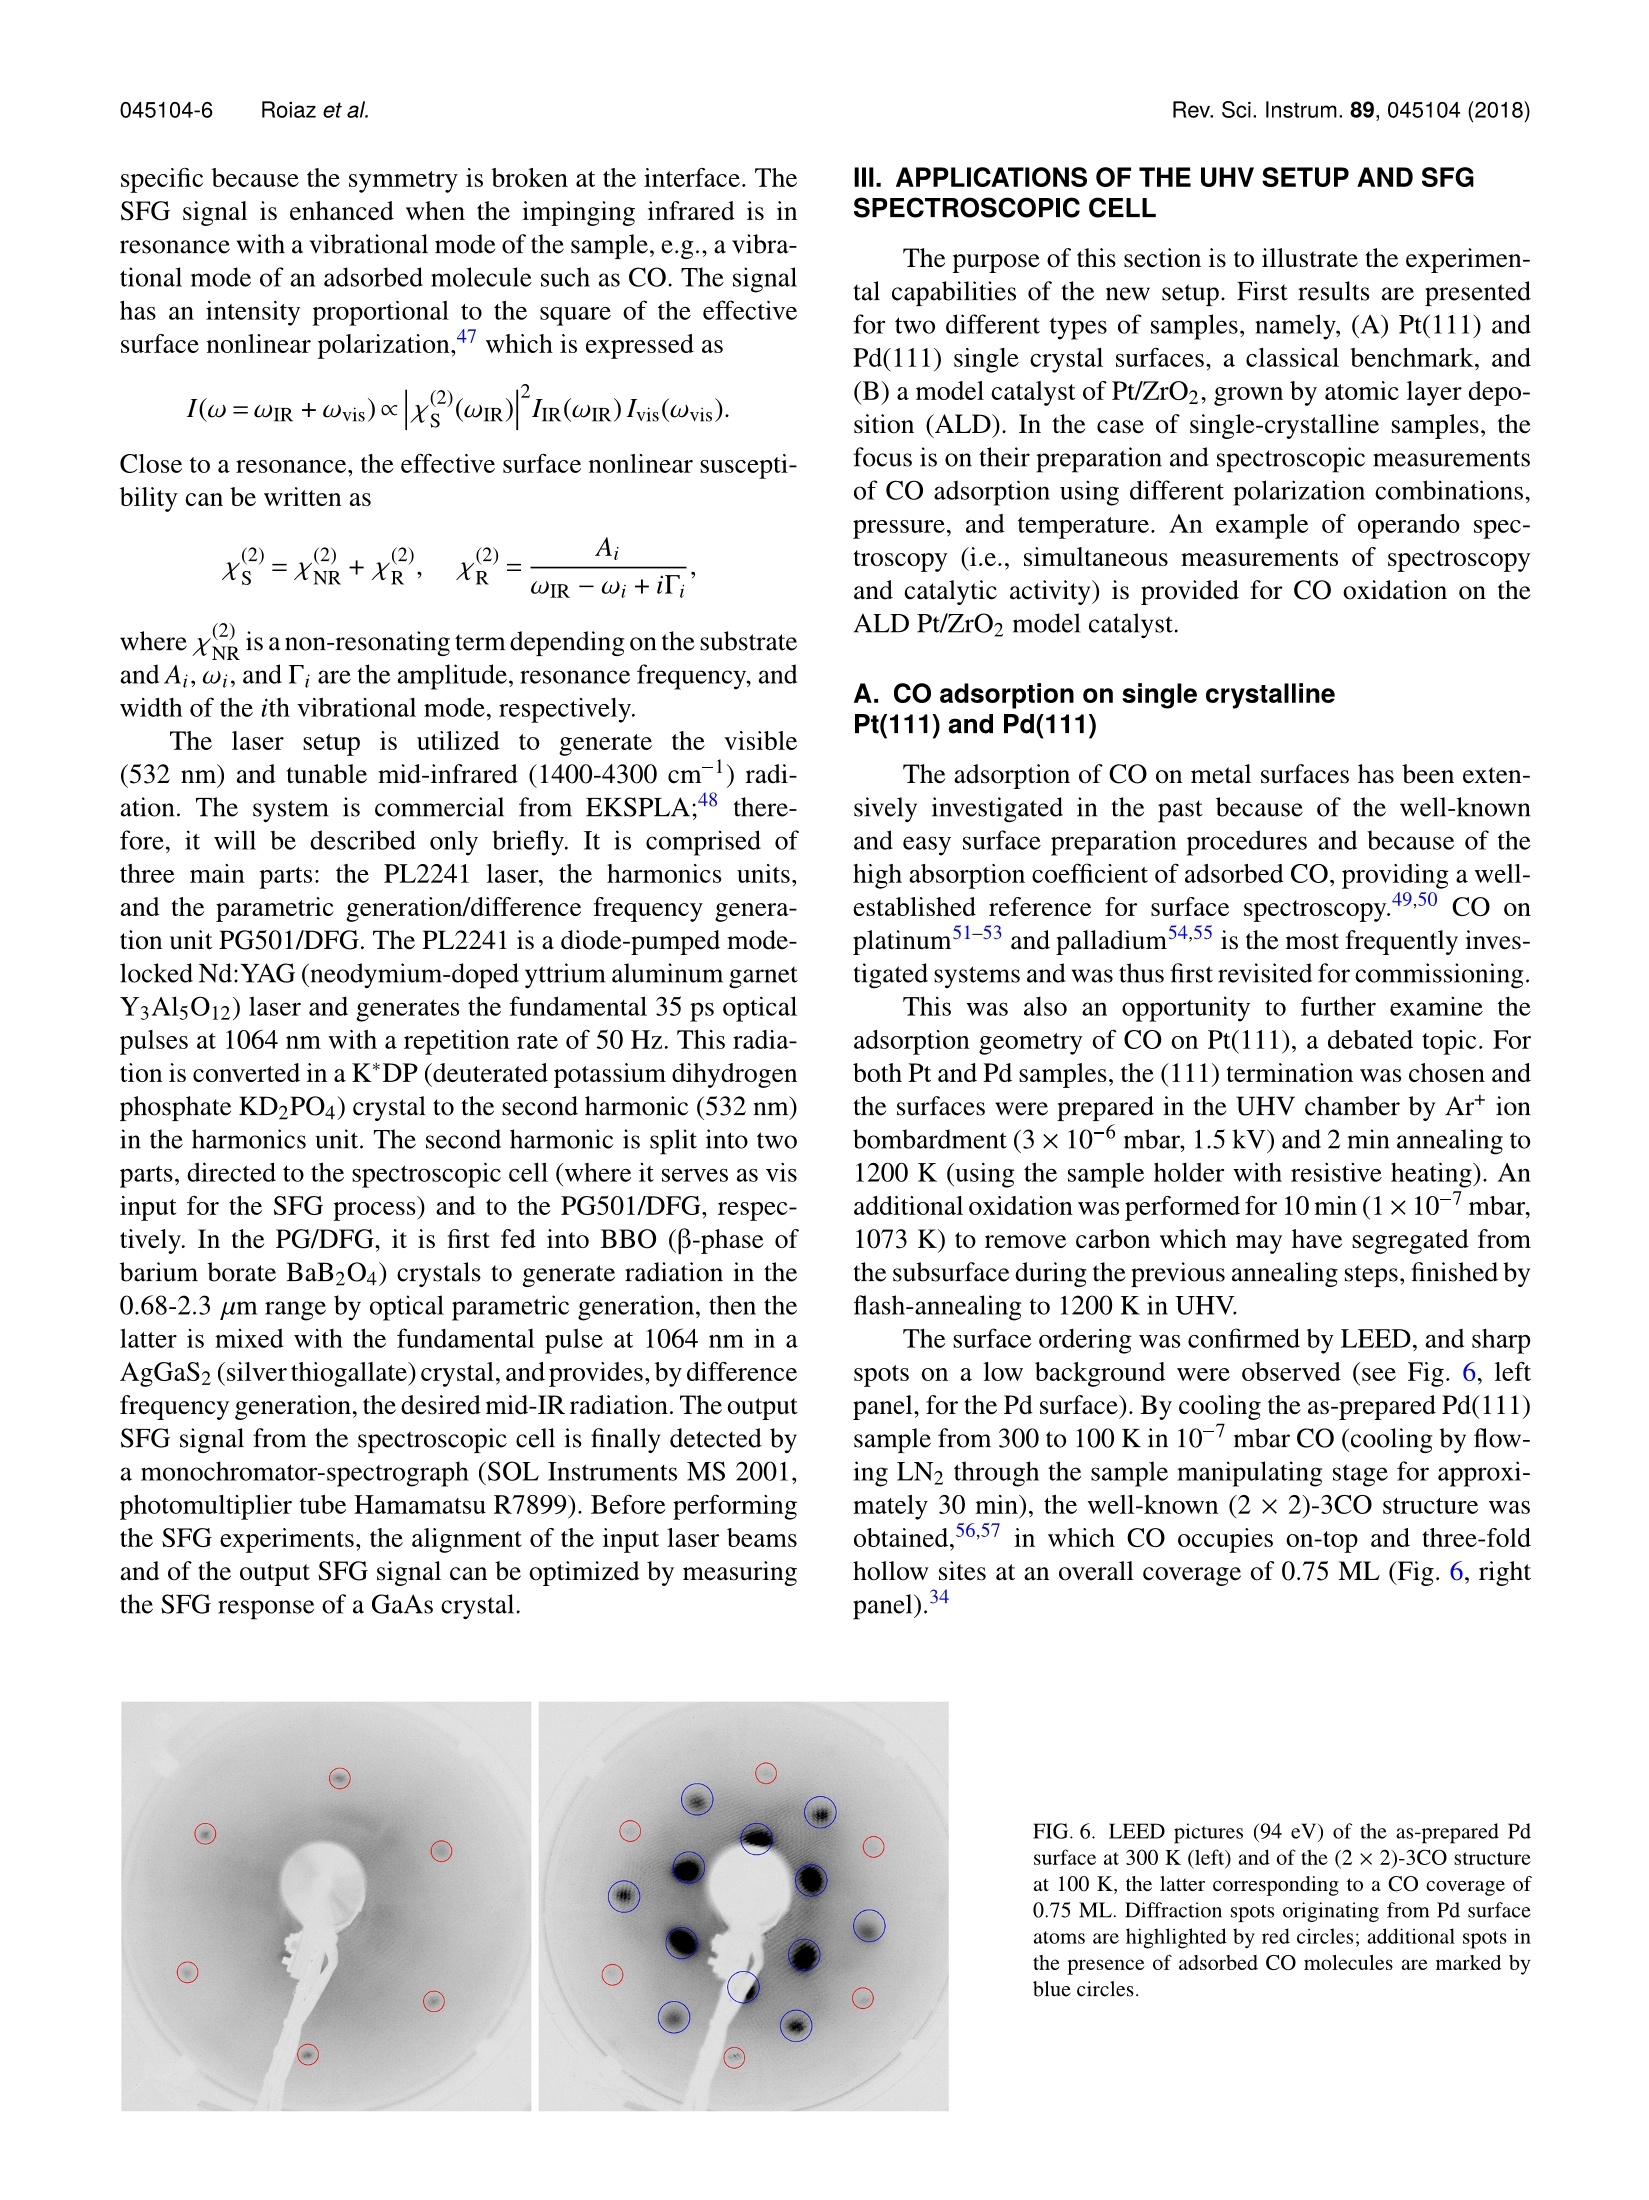
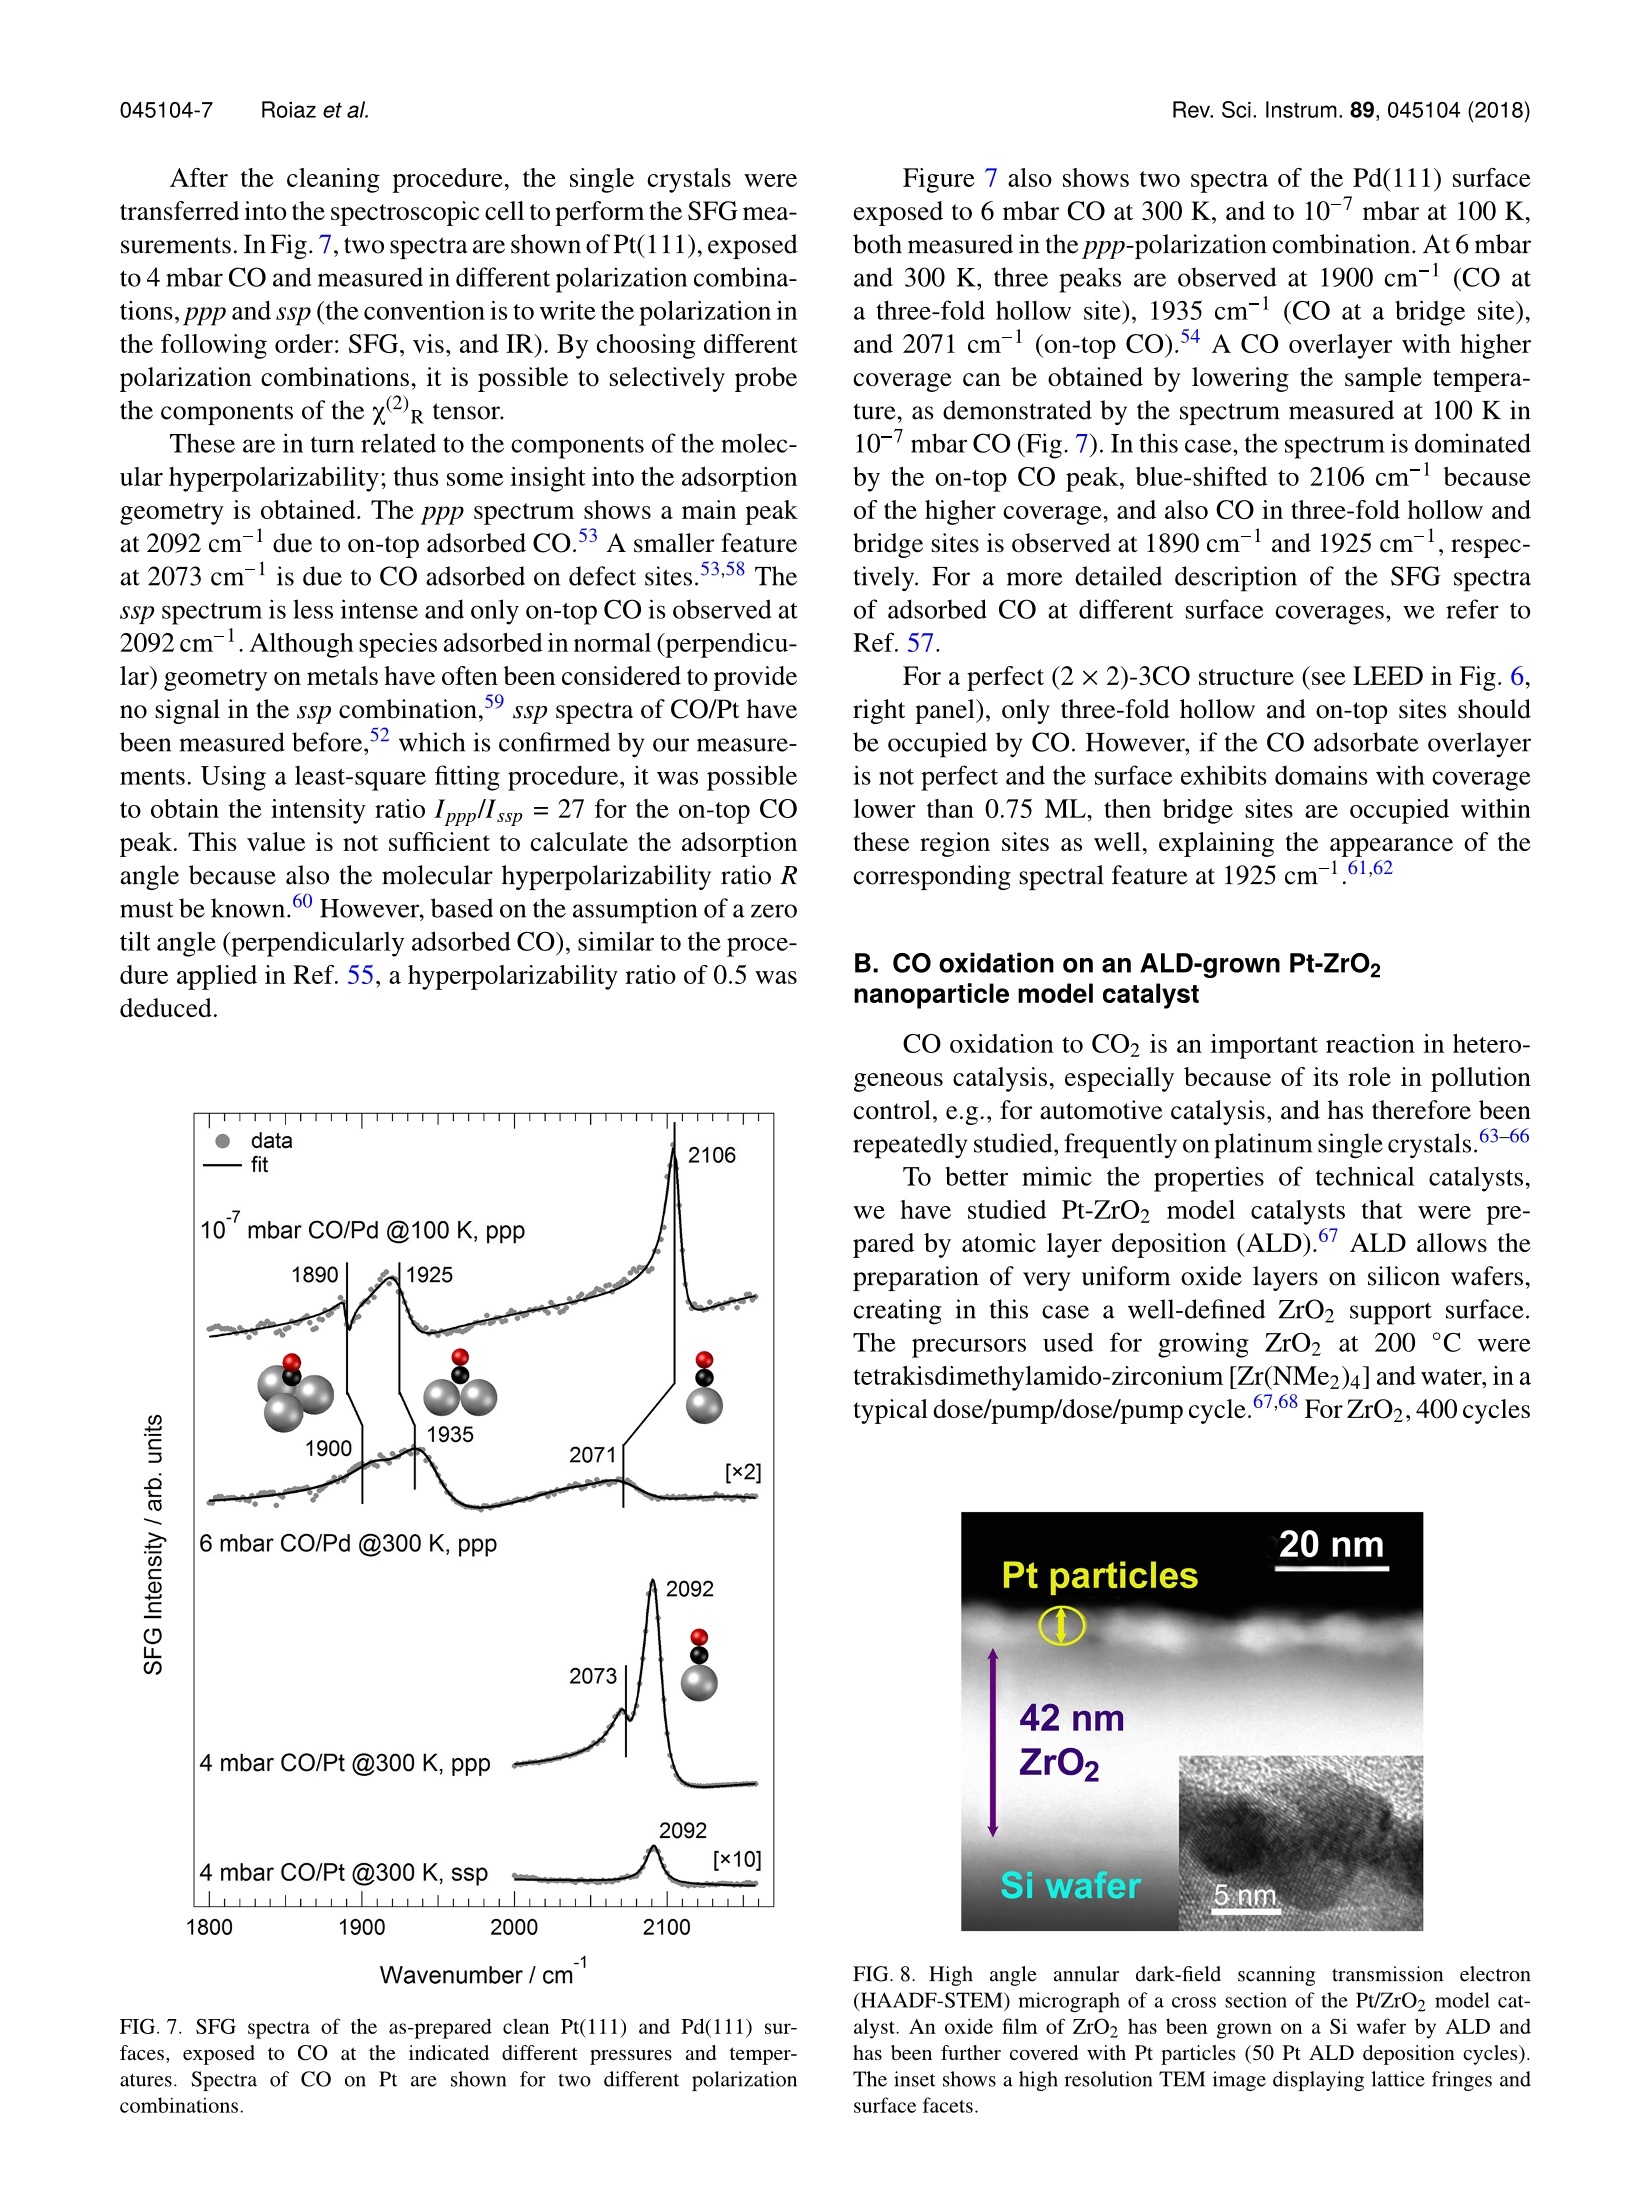
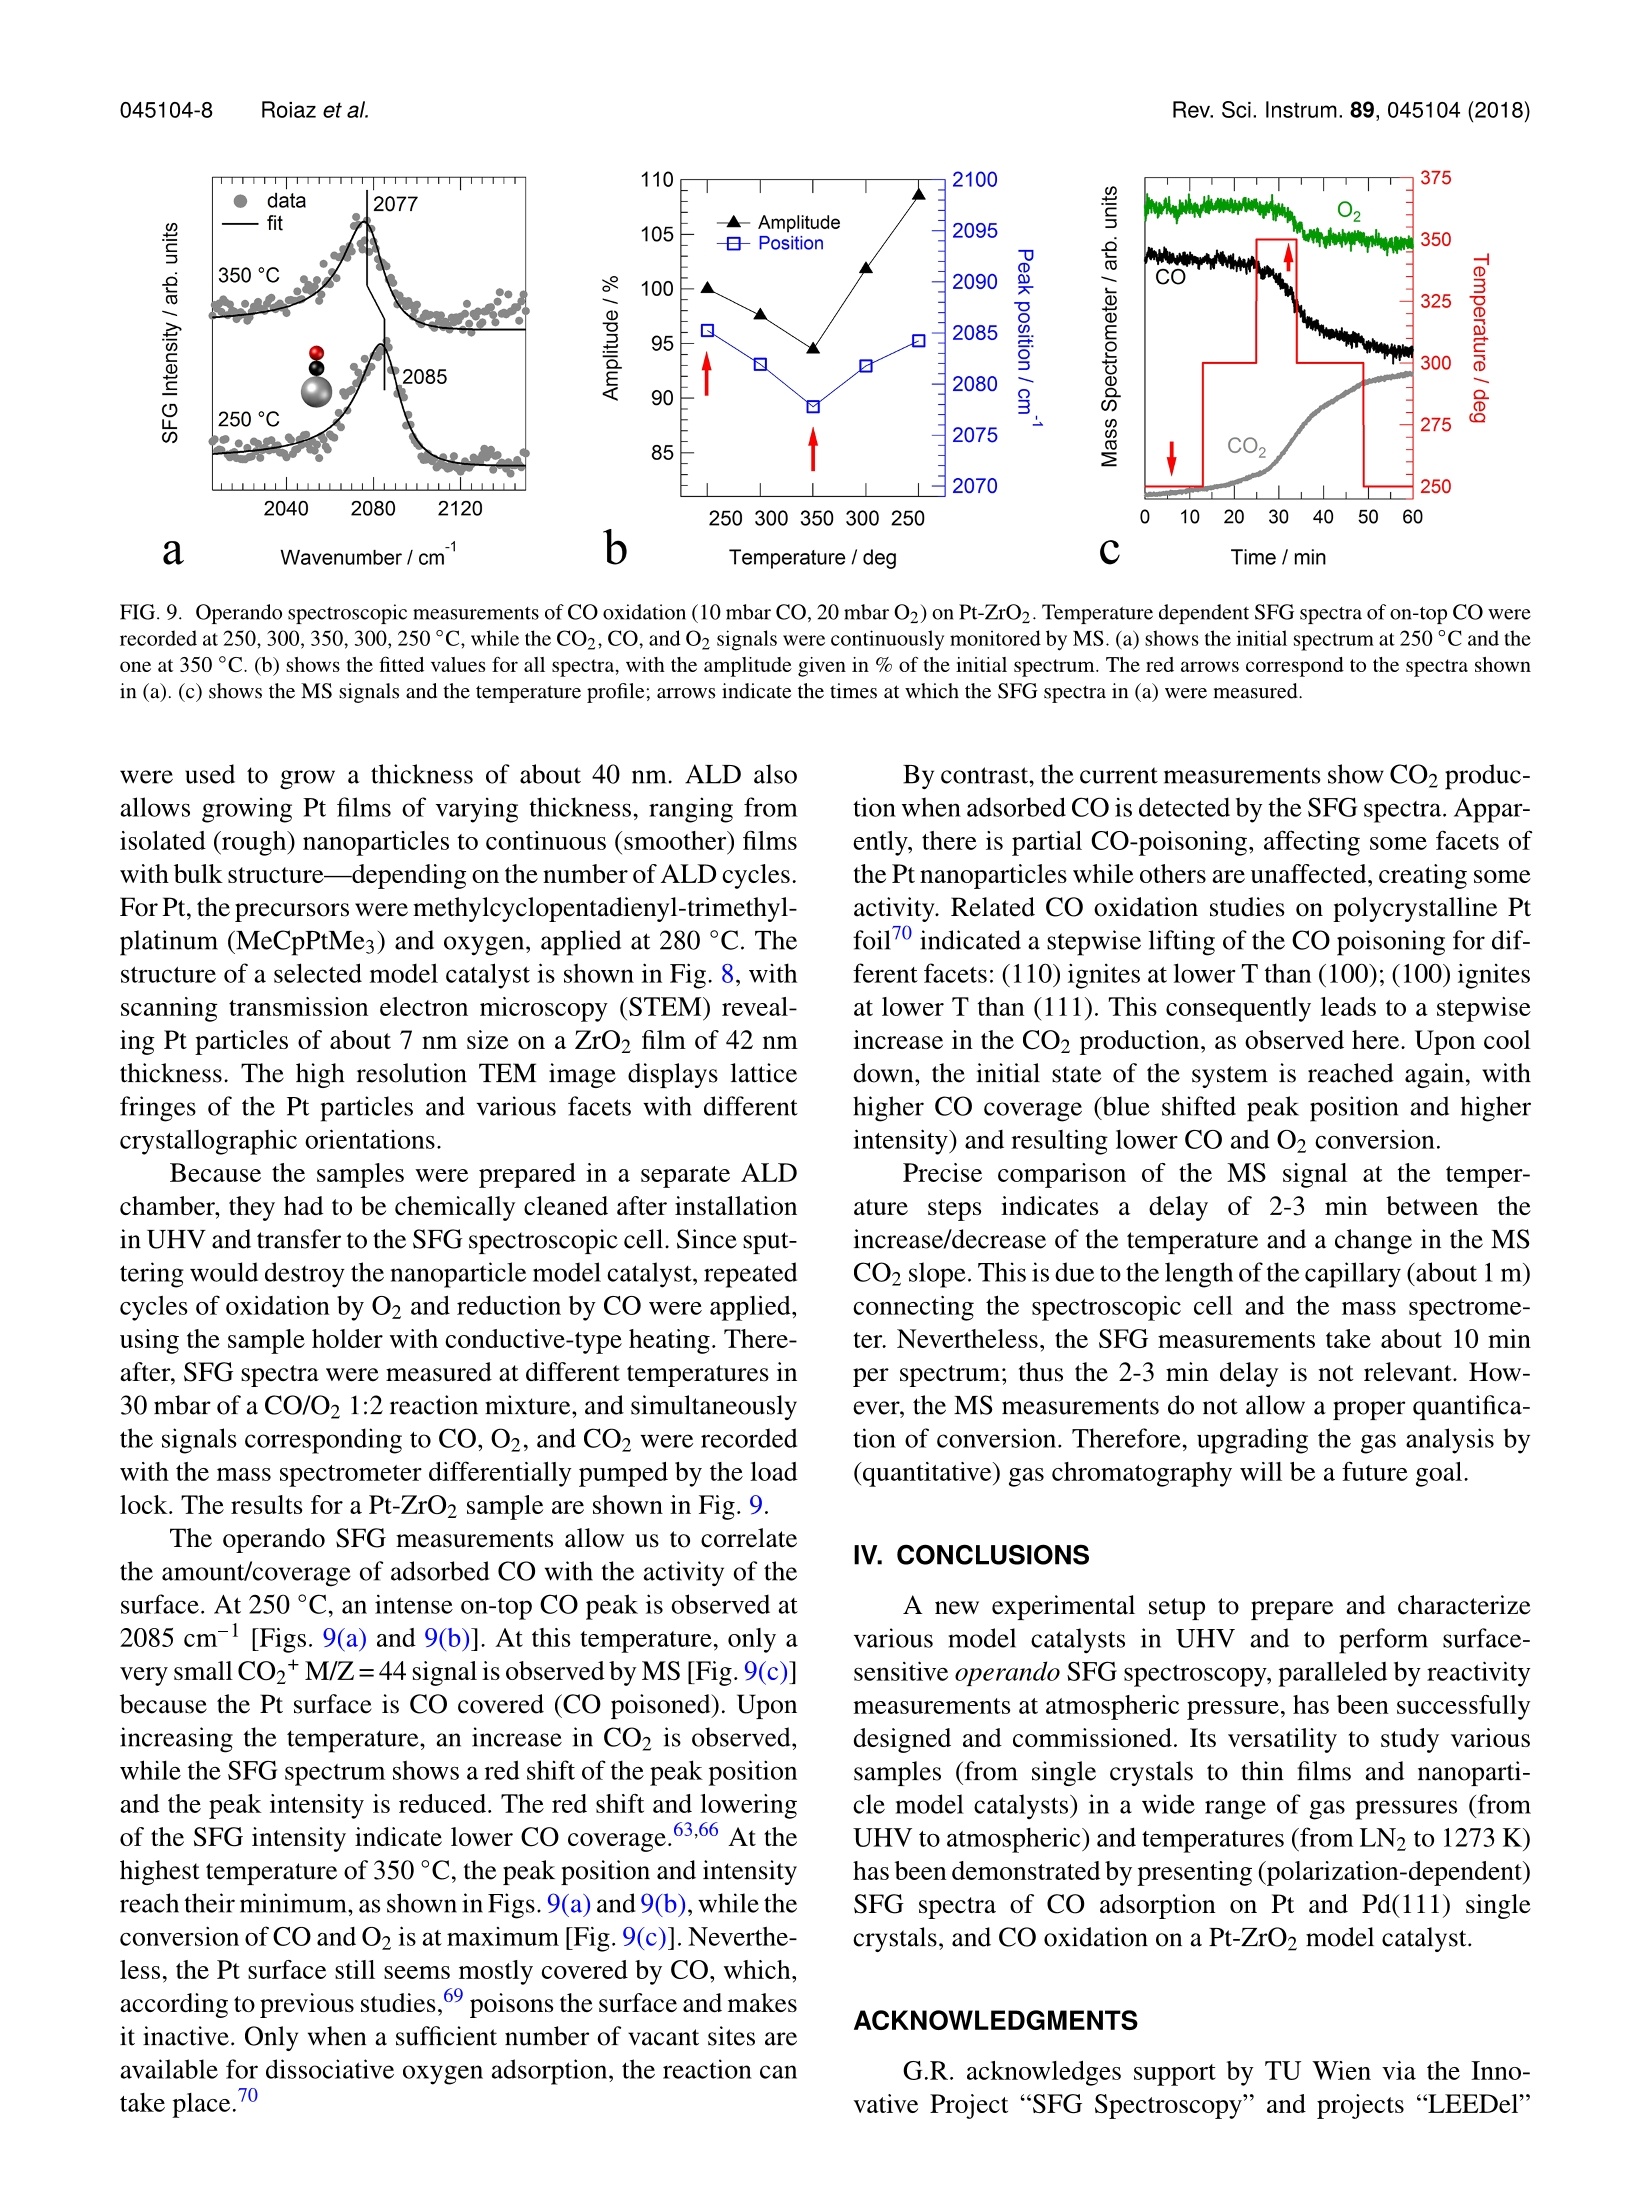
REVIEW OF SCIENTIFIC INSTRUMENTS 89,045104(2018) 045104-2 Roiaz et al.Rev. Sci. Instrum. 89, 045104(2018) Atmospheric pressure reaction cell foroperando sum frequency generationspectroscopy of ultrahigh vacuum grownmodel catalysts Cite as: Rev. Sci. Instrum. 89, 045104 (2018); https://doi.org/10.1063/1.5021641 Submitted:06 January 2018 . Accepted: 20 March 2018. Published Online: 10 April 2018 Matteo Roiaz, Verena Pramhaas, Xia Li, Christoph RameshanidDand Gunther Rupprechter oopenaccoss View Online Export Citation CrossMark ARTICLES YOU MAY BE INTERESTED IN Sum frequency generation spectroscopy of tetraalkylphosphonium ionic liquids at the air-liquid interface The Journal of Chemical Physics 148,193841(2018); https://doi.org/10.1063/1.5009674 Nonlinear optical response of a gold surface in the visible range: A study by two-colorsum-frequency generation spectroscopy.l. Experimental determination The Journal of Chemical Physics 148, 134701 (2018); https://doi.org/10.1063/1.5021553 Molecular mechanism of charge inversion revealed by polar orientation of interfacialwater molecules: A heterodyne-detected vibrational sum frequency generation study The Journal of Chemical Physics 149, 024703 (2018); https://doi.org/10.1063/1.5024310 Nanopositioning Systems Atmospheric pressure reaction cell for operando sum frequencygeneration spectroscopy of ultrahigh vacuum grown model catalysts Matteo Roiaz, Verena Pramhaas, Xia Li, Christoph Rameshan,a and Gunther Rupprechtera)Institute of Materials Chemistry, Technische Universitat Wien, Vienna 1060, Austria (Received 6 January 2018; accepted 20 March 2018; published online 10 April 2018) A new custom-designed ultrahigh vacuum (UHV) chamber coupled to a UHV and atmospheric-pressure-compatible spectroscopic and catalytic reaction cell is described, which allows us to performIR-vis sum frequency generation (SFG) vibrational spectroscopy during catalytic (kinetic) measure-ments. SFG spectroscopy is an exceptional tool to study vibrational properties of surface adsorbatesunder operando conditions, close to those of technical catalysis. This versatile setup allows per-forming surface science, SFG spectroscopy, catalysis, and electrochemical investigations on modelsystems, including single crystals, thin films, and deposited metal nanoparticles, under well-controlledconditions of gas composition, pressure, temperature, and potential. The UHV chamber enables usto prepare the model catalysts and to analyze their surface structure and composition by low energyelectron diffraction and Auger electron spectroscopy,respectively. Thereafter, a sample transfer mech-anism moves samples under UHV to the spectroscopic cell, avoiding air exposure. In the catalyticcell, SFG spectroscopy and catalytic tests (reactant/product analysis by mass spectrometry or gaschromatography) are performed simultaneously. A dedicated sample manipulation stage allows themodel catalysts to be examined from LN2 temperature to 1273 K, with gaseous reactants in a pres-sure range from UHV to atmospheric. For post-reaction analysis, the SFG cell is rapidly evacuatedand samples are transferred back to the UHV chamber. The capabilities of this new setup are demon-strated by benchmark results of CO adsorption on Pt and Pd(111) single crystal surfaces and ofCO adsorption and oxidation on a ZrO2 supported Pt nanoparticle model catalyst grown by atomiclayer deposition. @ 2018 Author(s). All article content, except where otherwise noted, is licensedunder a Creative Commons Attribution(CCBY) license (http://creativecommons.org/licenses/by/4.0/).https://doi.org/10.1063/1.5021641 I. INTRODUCTION The importance of surface science studies for under-standing elementary steps of catalytic reactions has beenwellestablished.-9 Model catalysts most frequently employedencompass single crystals and thin films, prepared under well-controlled conditions in ultrahigh vacuum (UHV), but alsometal nanoparticles grown on planar oxide supports, the latterspecifically intended to mimic the properties of industrial-grade catalysts (see Ref. 9 and the references therein). Singlecrystalline surfaces and adsorbates on them can be charac-terized by techniques such as low energy electron diffrac-tion (LEED), Auger electron spectroscopy (AES), electronenergy loss spectroscopy (EELS), or photoelectron spec-troscopy (PES). However, because of the required electronmean free path, these methods can typically only be employedin ultrahigh vacuum. Pressures around 10-10 to 10- mbar are,however, far from those of real catalysis, and a first attempt tobridge this gap dates back to the pioneering work of Somorjaiand co-workers. They constructed a high-pressure cell insidea UHV chamber, suitable for atmospheric pressure reactions,and single crystals were characterized before and after reac-tion by using surface sensitive methods.6,11-13 Afterwards,different variants were built, with high pressure cells attached ( a)guenther.rupprechter@tuwien.ac.at and christoph.rameshan@tuwien.ac.at ) outside of a UHV chamber, enabling pre- and post-reactionanalysis.11,14,15 Nevertheless, most of these early attempts were unableto spectroscopically monitor the sample during the catalyticreaction at high-pressure. This was a drawback since theactive state of a catalyst material under reaction conditionsmay be different from the state determined by post reactionanalysis 6,9,16-20 In situ (or now rather called “operando”21) spectro-scopic characterization of catalyst materials during measure-ments of catalytic performance was achieved by designinghigh pressure cells compatible with Infrared-Visible SumFrequency Generation Spectroscopy (IR-vis SFG)22-24orPolarization-Modulated Infrared Reflection Absorption Spec-troscopy(PM-IRAS).25-28Imaging reactive surfaces wasrealized by High Pressure Scanning Tunneling Microscopy(HPSTM),29-31 ;and surface composition was analyzed byNear Atmospheric Pressure X-ray Photoelectron Spectroscopy(NAP-XPS).32-37 Based on the experience in designing UHV systemscoupled to high pressure cells enabling simultaneous reac-tivity and spectroscopic measurements,15.23,24,38,39we haverecently designed and commissioned a new setup. Althoughother systems intended for high pressure SFG measure-ments on UHV-prepared surfaces have recently been con-structed40,41 aand/or upgraded,42,43 the current setup is able to accomplish all the previously intended goals (UHV sam-ple preparation/characterization, UHV/atmospheric, cryo-genic/high temperature, with/without electrical polarization,polarization-dependent SFG, catalytic reactivity measure-ments) within a single apparatus. In fact, single-or poly-crystalline samples are prepared and analyzed in UHV bystandard methods of surface science, whereas SFG andreactivity studies [Mass Spectroscopy (MS) and Gas Chro-matography (GC)] are simultaneously performed in a cell..of approximately 1.5 l volume, from UHV to ambient pres-sure and from LN2 temperature to 1273 K. The new setup isthoroughly described and its capabilities are demonstrated byfirst results about CO adsorption on Pt and Pd single crystalsand on an ALD (atomic layer deposition)-grown nanoparticlemodel catalyst, namely, ZrO2-supported Pt nanoparticles. Inthe case of the Pt(111) single crystal, polarization-dependentSFG spectra have been acquired as well. For supported Ptnanoparticles, the CO oxidation reaction was monitored, withcatalytic testing being performed by MS. II. EQUIPMENT DESIGN In Secs. II A-II E, an overview of the general layout ofthe experimental setup is presented. Then, the sample holder(“sample car) is described, together with the transfer systemand the two sample manipulation stages, one in the UHV cham-ber and the other one in the SFG cell. Afterwards, the UHVchamber, the high-pressure operando spectroscopic SFG cell,and the laser and detection system are described. A. General layout An overview of the experimental setup,consisting of threemain parts, is shown in Fig. 1. The UHV chamber (1) allowsus to prepare and characterize different types of samples (i.e.,single crystals, polycrystalline foils, thin films, and supportednanoparticles) by means of standard surface science methods.Samples mounted on the dedicated holder (Fig. 2) can then betransferred, still under UHV, to the SFG cell (2) using a transferarm. The load lock (3) allows us to quickly insert the samplesinto the system without the need to vent the entire UHV setup.All components are firmly fixed on an optical table that isrequired for the laser and optics. The UHV chamber, SFG cell,and load lock were manufactured by OmniVAC based on ourcustom design: the manipulation stage and the transfer systemare a proprietary design of the company. The laser setup is acommercial EKSPLA SFG system. B. Sample holder and xyzo manipulator The sample holder is often the most critical component ofa complex UHV apparatus. This especially holds true when thesample should be rapidly transferred back and forth betweentwo manipulation stages. Here we describe an efficient holder,based on the design by OmniVAC, which allows heating thesample to 1273 K, cooling to 95 K, measuring the temperature,and further exhibits additional electrical contacts to apply elec-trical polarization. All parameters can be accurately adjustedboth on the manipulator in the UHV chamber and the one inthe SFG cell. FIG. 1. Overview of the experimental setup, comprising three main sections:the UHV chamber (1), the SFG spectroscopic cell (2), and the load lock(3). The UHV chamber is equipped with viewports (a), turbomolecular dragpump (b),LEED/AES optics (c),ion source (d), mass spectrometer(e), samplemanipulation stage (f), x, y, z, o-manipulator (g), and coolant and electricalfeedthroughs (h). The UHV chamber is connected to the SFG cell (2) and tothe load lock (3) by gate valves (i), and the sample is moved between the threesections by a magnetically coupled transfer arm (k). The holder is disc-shaped and equipped with two sym-metric side wings. One wing is needed to lock the holder intothe manipulation stage and the second wing allows us to grab itwith the transfer arm via a retractable ballpoint-pen-like mech-anism. The sample holder (Fig. 2) has six electrical connectorson the back side, in the form of screws: two for the heatingcurrent (a), two for the thermocouple (b), and two spare ones(c). The latter can, e.g., be used to apply polarization to thesample and perform electrochemical measurements.20,44 Thesame pin/screw configuration must be apparently mirrored onthe sample manipulation stage so that once the sample holderis slid into the stage and locked in position by a N2 pneumaticsystem, an electrical connection is made between each pin onthe manipulation stage and the corresponding pin on the backof the sample holder. The front side of the sample holder can be designed in dif-ferent ways, according to the specific experimental needs. Forexample, the variant shown in Fig. 2 is optimized for electri-cally conducting samples, which are heated by Joule resistiveheating. In this case, the screw-shaped connectors on the backof the holder pass through its body and come out on the frontside where the sample is mounted. On the front side, each ofthe two heating pins (made of copper) is connected to a tan-talum bar-shaped piece (d), and these bars are fixed on the g front side back side FIG. 2. (Left) The sample holder is equipped with six electrical connectors: two for heating (a), two for the thermocouple (b), and two spare ones (c). Two Tabars (d) hold the sample (e) in place, and the thermocouple (f) is spot-welded on its side. A sapphire piece (g) supports and stabilizes the sample. A furtherconnector (h) provides contact to a sapphire sphere (i) on the sample manipulation stage and guarantees optimal thermal contact for cooling. Further not-labeledscrews hold the assembly together. The sample holder receiver on the manipulation stage is shown without (middle) and with (right) sample holder inserted. holder via extra screws (and with an insulating sapphire piecein between to avoid current shortcut to earth ground). The sin-gle crystal sample (e), disk-shaped with 6 mm outer diameter,is fit into a loop made of Ta wire (thickness 0.2 mm) whichhas four arms. The arms are fastened on the top of the Tabars by four stainless steel screws, connecting two arms toeach bar. In this way, the heating current flows in via one cop-per pin to the Ta bar, then through the Ta loop, and similarlyout via the second Ta bar and Cu pin. A thermocouple (f) isspot-welded to the side of the sample. With such a setup, atemperature of 1273 K can be reached with a heating currentand voltage of 11 A and 2.5 V, respectively. Electrical cur-rent for the resistive heating is provided by a power supply(EA-PS 5080-20 A) connected to a PID controller (Eurotherm3216). A further feature of the holder is a square-shapedquartz piece (g) placed between the back of the sample andthe tantalum bars. This prevents the sample from accidentallygetting in contact with the bars-causing a current shortcut-and also provides a stable support for the sample and guar-antees reproducible alignment for the (optical) spectroscopymeasurements. Apart from the electrical connections, there is an addi-tional contact between the sample holder and the manipulationstage, i.e., between a concave copper piece(h) on the back ofthe sample holder and a matching sapphire sphere (i) fixedon the manipulator. Sapphire is an electrical insulator, but afairly good thermal conductor. Therefore, when LN2 flowsthrough the coils in the manipulation stage, heat is efficientlyremoved from the sample and a temperature as low as 95 K isreached.The pneumatic system, which locks the sample holderon the manipulating stage, allows choosing whether the sap-phire sphere gets in contact with the holder or not. Selectinga pressure of 6 bars ensures electrical and thermal contact,whereas lower pressure (4 bars) prevents the thermal contactwhile still ensuring electrical connection via the pins/screws.In this way, the sample can be heated to high temperature byminimizing heat loss to the manipulator. A different sample holder design is used for insulatingsamples for which Joule heating does not work or for sam-ples with a geometry that does not allow mounting by a wire loop. In this case, heat is provided by conduction, with the topof the holder itself serving as a heating plate (button heater)and the sample directly positioned on top of it. The sample ispositioned in the middle of the heating plate, while the sampleholder is continuously cooled by water so that during reactionthe sample is at higher temperature than the rest of the holder.Moreover, to avoid catalytic side reactions, the heating plateis made of ceramics so that no hot metal parts are exposedto the catalytic reaction environment. Before catalytic studies,blind experiments with inactive samples must be performed,however, to exclude side reactions. C. UHV preparation/analysis chamber and load lock The UHV chamber is a stainless steel vessel of about 40 1volume equipped with various flanges to accommodate instru-ments, gauges, and connections to the load lock and SFG cell.The setup is schematically presented in Fig. 1. Three largeviewports DN 150,100, and 63 CF (a) and some smaller DN 40CF viewports enable convenient optical inspection and LED-illumination of the sample in different positions. The vessel ispumped to a routine base pressure of <5 ×10⁻¹⁰ mbar by a tur-bomolecular drag pump Pfeiffer TMU 261 (b), monitored bya hot-cathode gauge (Leybold IONIVAC ITR 90, GRAPHIXONE controller). The chamber is further equipped with a four-grid retractable LEED/AES optics SPECS ErLEED DN 150CF (c) and 3000D controller with a thoria-coated iridiumfilament. Photographs of LEED patterns are recorded by aCMOS-sensor camera (The Imaging Source Europe GmbHDFK 72BUC02, lens TCL 1216 5MP). The sample can besputter-cleaned by an ion source SPECS IQE 11/35 (d), withan IQE-11 A controller. A general purpose mass spectrom-eter with a Faraday detector, mks e-Visiont (e), allows leakdetection and performing temperature programmed desorp-tion (TPD) measurements. In order to use the same MS forgas analysis during high pressure reactions, a thin capillaryconnects the SFG cell to the MS compartment (which in thiscase is separated from the main UHV chamber via a DN 40 CFgate valve VAT 01032 and is pumped via the load lock). Gasfrom the reaction gas line is then admitted to the MS via a leak valve (Pfeiffer UDV 046). A number of (free) spare flangesallow us to equip the chamber with additional instruments,such as an e-beam evaporator and quartz microbalance for thinfilm or nanoparticle model catalyst preparation. The flanges arearranged such that the system can be upgraded with an X-raygun and a hemispherical analyzer for XPS. The sample manipulation stage (f) is positioned inside thechamber by means of an x, y, z, p-manipulator (g), installed onthe top. The manipulator is differentially pumped by a rotaryvane pump (Pfeiffer DUO 5 M). This same pump supplies apre-vacuum of 1 ×10⁻³ mbar to the turbomolecular pumpsof the UHV chamber and the load lock. The pre-vacuum ismonitored by a Pirani gauge (Pfeiffer TPR 280). The manip-ulator has two feedthroughs for water or LN2 cooling and sixelectrical feedthroughs (h). The UHV chamber is connectedto, and can be separated from, the SFG cell and the load lockvia two DN 63 CF gate valves VAT 10836 (i). The load lockis rapidly evacuated by a turbomolecular pump Pfeiffer TMU071 P (j) to the base pressure of 1 ×10⁻⁸ mbar, as mon-itored by a compact cold-cathode gauge Pfeiffer IKR 261.The load lock is also connected to the magnetically coupledtransfer arm (k). When the sample has to be transferred andthe gate valve between the load lock and UHV chamber isopened, the pressure in the latter increases to no more than2×10-9mbar. D. SFG spectroscopy cell and gas supply The SFG cell, shown in Fig. 3, has a volume of approx-imately 1.5 1. We emphasize the difficulty to design a cellof significantly smaller volume, given that it requires severalcomponents for UHV operation (especially the bulky sam-ple manipulator for cooling and heating) and must also meetthe geometry required by the laser beams. The cell can beoperated in three different modes described below: in UHV oratmospheric pressure and in recirculating batch reactor mode. FIG. 3. Photograph of the SFG spectroscopic cell, equipped with a turbo-molecular pump (a), gas dosing via a leak valve (b), CaF2 windows for inputof laser radiation and output of SFG (c), viewport for sample positioning (d),sample manipulator (e), gate valves (f), high flow valve (g), capacitance gauge(h), connections to the recirculation pump (i), leak valve to MS (j), general-purpose gas line (k), CO-gas line (l), Pirani gauge (m). The inset shows a crosssection of the cell at the CaF2 window (C) position to highlight the incidentangles of the laser beams and the exit angle of the SFG signal. 1. UHV spectroscopic cell The cell is pumped by a combination of a turbomolecu-lar pump Pfeiffer HiPace 80 (a) and a pre-vacuum diaphragmpump Pfeiffer MVP 015-2 to a routine base pressure of1× 10-9 mbar (the use of a diaphragm pump instead of arotary vane pump prevents oil back-diffusion, which wouldcause contamination of the sample and the spectroscopic win-dows). Gas from the same manifold serving the preparationchamber can be admitted at “low pressure by a leak valveBalzers UDV 036 (b), while the pressure is monitored by afull-range combination of a cold-cathode and a Pirani sensorPfeiffer PKR 261. Low to high-coverage adsorbate structurescan be investigated by SFG at temperatures as low as 100 K.Two DN 40 CF CaF2 windows (c) allow directing the visibleand IR laser radiation into the cell and the SFG signal to exitthe cell. The windows are tilted by 55°with respect to the celltransverse axis, and their surface normal is oriented at 5°withrespect to the incident laser beams to avoid back-reflectioninto the laser optics (see the inset of Fig. 3). A third window(d) is placed above the sample stage to control the positionwhen the sample holder is inserted into the sample manipula-tion stage using the transfer arm. The x,y,z, -manipulator (e)allows us to place the sample (stage) into the optimal trans-fer position and to ensure the spatial overlap of the vis andIR impinging beams on its surface. A fifth degree of freedom,i.e., the tilt of the sample with respect to the manipulator lon-gitudinal axis, is adjusted by tuning the three screws on whichthe UHV chamber—and therefore the whole setup-is sitting.In any case, this setting has to be rarely-if at all-modified.The manipulator in the SFG cell is designed and operated inthe same way as the one in the UHV chamber (see detailsabove). 2. Atmospheric pressure spectroscopic cell To study model catalysts at room temperature and above,the pressure can be increased to ensure sufficient adsorbatecoverage. Consequently, if a higher (up to 1000 mbar) gaspressure is required, the spectroscopic cell is separated fromthe UHV chamber and the turbomolecular pump (a) by clos-ing the corresponding gate valves (f). A bellow-sealed valvewith a PCTFE stem tip Swagelok SS-6BK-MM(g), also con-nected to the gas manifold, is used for rapid gas dosing, whilethe pressure can be either monitored by the full-range gaugeor by a ceramic capacitance gauge Pfeiffer CMR 361 (h).The capacitance gauge is necessary for more reliable and gastype-independent pressure readings in the (near-)atmosphericregime. 3. Recirculating batch reactor A gas mixture at 1000 mbar can recirculate in the spec-troscopic cell by means of a bellow pump (Senior AerospaceMetal Bellows MB-41E) whose inlet to and outlet from thecell can be closed by two UHV-compatible shut-off valves (i)(see the schematic representation in Fig. 4). The batch recir-culation mode is a typical choice for model catalysis since thesmall catalyst surface area (a few cm²)typically only producessmall amounts of products per time. In batch mode, the con-version increases with reaction time and products are easier to FIG. 4. Schematic overview of the experimental setup,gas supply, connections, and pumping facilities. The parthighlighted in blue represents the catalytic cell with therecirculation pump. detect.9,45,46 A sample of the reaction mixture, extracted fromthe close vicinity of the catalyst surface by a steel capillary,is leaked via another valve Balzers UDV 040 (j) to the MSattached to the UHV chamber, as described above. The flowthrough the capillary to the MS is small compared to the cellvolume; thus the overall pressure in the cell and the reactionequilibrium are not modified by performing the MS analy-sis. Alternatively, the recirculation line can also be connectedto a sample loop of a gas chromatograph (GC). After highpressure gas dosing, the cell is evacuated to the backgroundpressure in approximately 20 min (depending on the gastype) 4. Gas manifold The gas manifold (k) provides CO2, O2, H2, He, and Arand has further spare connections for additional gases andwater vapor. CO is dosed via a separate gas line (1) madeof a medical copper pipe (instead of stainless steel) to pre-vent the formation of nickel and iron carbonyls. This line is also equipped with a Cu-based carbonyl scrubber to purifythe gas from carbonyls which may have formed in the sup-ply bottle. Both gas lines are evacuated by the same rotaryvane pump(Pfeiffer DUO 5 M), reaching a base pressure of5×10-4 mbar, as monitored by a Pirani gauge, Pfeiffer TPR280 (m). Therefore, after purging the lines a couple of timeswith the desired gas, one can take full advantage of the nom-inal gas purity (4.7 in the case of CO and 5.0 for all othergases). E. Laser and optical detection system In an SFG experiment, two laser beams, one tunable inthe mid-IR from 2.3 to 10 um E(WIR) and the other onefixed in the visible at 532 nm Evis(Wvis), are superimposedon the sample and an output signal at the sum of the origi-nal frequencies E(w =WIR +Wvis) is generated according toa second-order nonlinear optical process (see Fig. 5). As asecond-order process, SFG is forbidden in a bulk with cen-trosymmetry. Therefore,SFG is highly surface or interface FIG. 5. Representation of an SFG experiment. Theinfrared radiation excites a molecule from a lower tohigher vibrational level (e.g., vibrational eigenvalues Eoand E1, respectively, for a Morse potential of depth D=88891 cm), while the visible radiation excites the sys-tem to a virtual electronic level. An anti-Stokes relaxationfollows, emitting an SFG signal. specific because the symmetry is broken at the interface. TheSFG signal is enhanced when the impinging infrared is inresonance with a vibrational mode of the sample, e.g., a vibra-tional mode of an adsorbed molecule such as CO. The signalhas an intensity proportional to the square of the effectivesurface nonlinear polarization,47 which is expressed as Close to a resonance, the effective surface nonlinear suscepti-bility can be written as where xis a non-resonating term depending on the substrateand Ai,ωi, and I; are the amplitude, resonance frequency, andwidth of the ith vibrational mode, respectively. The laser setup is utilized to generate the visible(532 nm) and tunable mid-infrared (1400-4300 cm-l) radi-ation. The system is commercial from EKSPLA;48 there-fore, it will be described only briefly. It is comprised ofthree main parts: the PL2241 laser, the harmonics units,and the parametric generation/difference frequency genera-tion unit PG501/DFG. The PL2241 is a diode-pumped mode-locked Nd:YAG (neodymium-doped yttrium aluminum garnetY3Al5O12) laser and generates the fundamental 35 ps opticalpulses at 1064 nm with a repetition rate of 50 Hz. This radia-tion is converted in a K*DP (deuterated potassium dihydrogenphosphate KD2PO4) crystal to the second harmonic (532 nm)in the harmonics unit. The second harmonic is split into twoparts, directed to the spectroscopic cell (where it serves as visinput for the SFG process) and to the PG501/DFG, respec-tively. In the PG/DFG, it is first fed into BBO (B-phase ofbarium borate BaB204) crystals to generate radiation in the0.68-2.3 um range by optical parametric generation, then thelatter is mixed with the fundamental pulse at 1064 nm in aAgGaS2 (silver thiogallate) crystal, and provides, by differencefrequency generation, the desired mid-IR radiation. The outputSFG signal from the spectroscopic cell is finally detected bya monochromator-spectrograph (SOL Instruments MS 2001,photomultiplier tube Hamamatsu R7899). Before performingthe SFG experiments, the alignment of the input laser beamsand of the output SFG signal can be optimized by measuringthe SFG response of a GaAs crystal. III. APPLICATIONS OF THE UHV SETUP AND SFGSPECTROSCOPIC CELL The purpose of this section is to illustrate the experimen-tal capabilities of the new setup. First results are presentedfor two different types of samples, namely, (A) Pt(111) andPd(111) single crystal surfaces, a classical benchmark, and(B) a model catalyst of Pt/ZrO2, grown by atomic layer depo-sition (ALD). In the case of single-crystalline samples, thefocus is on their preparation and spectroscopic measurementsof CO adsorption using different polarization combinations,pressure, and temperature. An example of operando spec-troscopy (i.e., simultaneous measurements of spectroscopyand catalytic activity) is provided for CO oxidation on theALD Pt/ZrO2 model catalyst. A. CO adsorption on single crystallinePt(111) and Pd(111) The adsorption of CO on metal surfaces has been exten-sively investigated in the past because of the well-knownand easy surface preparation procedures and because of thehigh absorption coefficient of adsorbed CO, providing a well-established reference for surface spectroscopy.49,50 Co onplatinum51-53 and palladium54,55 is the most frequently inves-tigated systems and was thus first revisited for commissioning. This was also an opportunity to further examine theadsorption geometry of CO on Pt(111), a debated topic. Forboth Pt and Pd samples, the (111) termination was chosen andthe surfaces were prepared in the UHV chamber by Ar ionbombardment (3×10⁻⁶ mbar, 1.5 kV) and 2 min annealing to1200 K (using the sample holder with resistive heating). Anadditional oxidation was performed for 10 min (1×10-mbar,1073 K) to remove carbon which may have segregated fromthe subsurface during the previous annealing steps, finished byflash-annealing to 1200 K in UHV. The surface ordering was confirmed by LEED, and sharpspots on a low background were observed (see Fig. 6, leftpanel, for the Pd surface). By cooling the as-prepared Pd(111)sample from 300 to 100 K in 10-7 mbar CO (cooling by flow-ing LN2 through the sample manipulating stage for approxi-mately 30 min), the well-known (2×2)-3CO structure wasobtained.56,577iin which CO occupies on-top and three-foldhollow sites at an overall coverage of 0.75 ML (Fig. 6,rightpanel).34 FIG. 6. LEED pictures (94 eV) of the as-prepared Pdsurface at 300 K (left) and of the (2×2)-3CO structureat 100 K, the latter corresponding to a CO coverage of0.75 ML. Diffraction spots originating from Pd surfaceatoms are highlighted by red circles; additional spots inthe presence of adsorbed CO molecules are marked byblue circles. After the cleaning procedure, the single crystals weretransferred into the spectroscopic cell to perform the SFG mea-surements. In Fig.7, two spectra are shown of Pt(111), exposedto 4 mbar CO and measured in different polarization combina-tions,ppp and ssp (the convention is to write the polarization inthe following order: SFG, vis, and IR). By choosing differentpolarization combinations, it is possible to selectively probethe components of the x2R tensor. These are in turn related to the components of the molec-ular hyperpolarizability; thus some insight into the adsorptiongeometry is obtained. The ppp spectrum shows a main peakat 2092 cm- due to on-top adsorbed CO.3 A smaller featureat 2073 cm-1 is due to CO adsorbed on defect sites.53,58 Thessp spectrum is less intense and only on-top CO is observed at2092 cm-. Although species adsorbed in normal (perpendicu-lar) geometry on metals have often been considered to provideno signal in the ssp combination,ssp spectra of CO/Pt havebeen measured before, which is confirmed by our measure-ments. Using a least-square fitting procedure, it was possibleto obtain the intensity ratio IppplIssp =27 for the on-top COpeak. This value is not sufficient to calculate the adsorptionangle because also the molecular hyperpolarizability ratio Rmust be known. However, based on the assumption of a zerotilt angle (perpendicularly adsorbed CO), similar to the proce-dure applied in Ref. 55, a hyperpolarizability ratio of 0.5 wasdeduced. cu Wavenumber/cm FIG. 7. SFG spectra of the as-prepared clean Pt(111) and Pd(111) sur-faces, exposed to CO at the indicated different pressures and temper-atures. Spectra of CO on Pt are shown for two different polarizationcombinations. Figure 7 also shows two spectra of the Pd(111) surfaceexposed to 6 mbar CO at 300 K, and to 10-7 mbar at 100 K,both measured in the ppp-polarization combination. At 6 mbarand 300 K, three peaks are observed at 1900 cm-(CO ata three-fold hollow site), 1935 cm- (CO at a bridge site),and 2071 cm- (on-top CO).54 A CO overlayer with highercoverage can be obtained by lowering the sample tempera-ture, as demonstrated by the spectrum measured at 100 K in10-7 mbar CO (Fig. 7). In this case, the spectrum is dominatedby the on-top CO peak, blue-shifted to 2106 cm- becauseof the higher coverage, and also CO in three-fold hollow andbridge sites is observed at 1890 cm- and 1925 cm-l, respec-tively. For a more detailed description of the SFG spectraof adsorbed CO at different surface coverages, we refer toRef. 57. For a perfect (2×2)-3CO structure (see LEED in Fig. 6,right panel), only three-fold hollow and on-top sites shouldbe occupied by CO. However, if the CO adsorbate overlayeris not perfect and the surface exhibits domains with coveragelower than 0.75 ML, then bridge sites are occupied withinthese region sites as well, explaining the appearance of thecorresponding spectral feature at 1925 cm-1.61,62 B. CO oxidation on an ALD-grown Pt-ZrO2nanoparticle model catalyst CO oxidation to CO2 is an important reaction in hetero-geneous catalysis, especially because of its role in pollutioncontrol, e.g., for automotive catalysis, and has therefore beenrepeatedly studied, frequently on platinum single crystals.63-66 To better mimic the properties of technical catalysts,we have studied Pt-ZrO2 model catalysts that were pre-pared by atomic layer deposition (ALD).7 ALD allows thepreparation of very uniform oxide layers on silicon wafers,creating in this case a well-defined ZrO2 support surface.The precursors used for growing ZrO2 at 200 C weretetrakisdimethylamido-zirconium [Zr(NMe2)4] and water, in atypical dose/pump/dose/pump cycle.67,68 For ZrO2, 400 cycles FIG. 8. High angle annular dark-field scanning transmission electron(HAADF-STEM) micrograph of a cross section of the Pt/ZrO2 model cat-alyst. An oxide film of ZrO2 has been grown on a Si wafer by ALD andhas been further covered with Pt particles (50 Pt ALD deposition cycles).The inset shows a high resolution TEM image displaying lattice fringes andsurface facets. Time / min FIG.9. Operando spectroscopic measurements of CO oxidation (10 mbar CO, 20 mbar O2) on Pt-ZrO2. Temperature dependent SFG spectra of on-top CO wererecorded at 250,300, 350,300,250°C, while the CO2, CO, and O2 signals were continuously monitored by MS. (a) shows the initial spectrum at 250°C and theone at 350 °C. (b) shows the fitted values for all spectra, with the amplitude given in % of the initial spectrum. The red arrows correspond to the spectra shownin (a). (c) shows the MS signals and the temperature profile; arrows indicate the times at which the SFG spectra in (a) were measured. were used to grow a thickness of about 40 nm. ALD alsoallows growing Pt films of varying thickness, ranging fromisolated (rough) nanoparticles to continuous (smoother) filmswith bulk structure—depending on the number of ALD cycles.For Pt, the precursors were methylcyclopentadienyl-trimethyl-platinum (MeCpPtMe3) and oxygen, applied at 280 C. Thestructure of a selected model catalyst is shown in Fig. 8, withscanning transmission electron microscopy (STEM) reveal-ing Pt particles of about 7 nm size on a ZrO2 film of 42 nmthickness. The high resolution TEM image displays latticefringes of the Pt particles and various facets with differentcrystallographic orientations. Because the samples were prepared in a separate ALDchamber, they had to be chemically cleaned after installationin UHV and transfer to the SFG spectroscopic cell. Since sput-tering would destroy the nanoparticle model catalyst, repeatedcycles of oxidation by O2 and reduction by CO were applied,using the sample holder with conductive-type heating. There-after, SFG spectra were measured at different temperatures in30 mbar of a CO/O2 1:2 reaction mixture, and simultaneouslythe signals corresponding to CO,O2, and CO2 were recordedwith the mass spectrometer differentially pumped by the loadlock. The results for a Pt-ZrO2 sample are shown in Fig. 9. By contrast, the current measurements show CO2 produc-tion when adsorbed CO is detected by the SFG spectra. Appar-ently, there is partial CO-poisoning, affecting some facets ofthe Pt nanoparticles while others are unaffected, creating someactivity. Related CO oxidation studies on polycrystalline Ptfoil indicated a stepwise lifting of the CO poisoning for dif-ferent facets: (110) ignites at lower T than (100); (100) ignitesat lower T than (111). This consequently leads to a stepwiseincrease in the CO2 production, as observed here. Upon cooldown, the initial state of the system is reached again, withhigher CO coverage (blue shifted peak position and higherintensity) and resulting lower CO and O2 conversion. Precise comparison of the MS signal at the temper-ature steps indicates a delay of 2-3 min between theincrease/decrease of the temperature and a change in the MSCO2 slope. This is due to the length of the capillary (about 1 m)connecting the spectroscopic cell and the mass spectrome-ter. Nevertheless, the SFG measurements take about 10 minper spectrum; thus the 2-3 min delay is not relevant. How-ever, the MS measurements do not allow a proper quantifica-tion of conversion. Therefore, upgrading the gas analysis by(quantitative) gas chromatography will be a future goal. IV. CONCLUSIONS A new experimental setup to prepare and characterizevarious model catalysts in UHV and to perform surface-sensitive operando SFG spectroscopy, paralleled by reactivitymeasurements at atmospheric pressure, has been successfullydesigned and commissioned. Its versatility to study varioussamples (from single crystals to thin films and nanoparti-cle model catalysts) in a wide range of gas pressures (fromUHV to atmospheric) and temperatures (from LN2 to 1273 K)has been demonstrated by presenting (polarization-dependent)SFG spectra of CO adsorption on Pt and Pd(111) singlecrystals, and CO oxidation on a Pt-ZrO2 model catalyst. ACKNOWLEDGMENTS G.R. acknowledges support by TU Wien via the Inno-vative Project“SFG Spectroscopy”and projects“LEEDel” and“Pump-Probe.” This work was supported by the Aus-trian Science Fund (FWF) through the Doctorate School DK+Solids4Fun (No. W1243; M.R. member; V.P. associated mem-ber), the SFB FOXSI (No. F4502-N16), and projects Com-Cat (No.I 1041-N28) and DryRef (No. I 942-N17). We areindebted to Johannes Frank for technical support. ( G. A. Somorjai,“The surface science of heterogeneous catalysis,"S urf . Sci. 299-300,849 (1994). ) ( G . Ertl,“Reactions at well-defined surfaces,”Sur f. S ci . 2 99-300, 742(1994). R . J. M adix,“Through the la b yrinth o f surface reaction m echanism: A personal account, 1964-1992,”S ur f . Sc i . 299,785-797 (1994).D. A. King,“Chemisorption on metals: A personal r e view,”Su rf.S c i. 2 99,6 941 78-689 (1994). ) ( D . W. Goodman, “Model studies in cata l ysis using surface sci e nce pro b es," Chem. Rev . 9 5, 523 (1995). ) ( G. A . Somorjai,“ M odern su r face science and surface t echnologies: An introduction,”C h e m. R e v. 9 6 , 1 2 23-1235 (1 9 9 6). ) ( H.-J. F reund,“ A dsorption of g a ses o n c o mplex: Solid surfaces,”An gew. Chem. , Int. E d . Engl. 36, 452-475(1997). ) ( G . Ertl and H.-J. Freund,“Catalysis and surface science,”P h ys. T o d a y 5 2( 1),32(1999). ) ( G. Rupprechter,“Sum fre q uency generation and polarization-modulation i nfrared r eflection absorption spectroscopy of functioning model cata l ystsfrom ultrahigh v acuum to a m bient pr e ssure," Ad v. C a t al. 5 1 , 133-263 (2007). ) ( D. P. Woodruff an d T. A. Delchar, Modern Techniques of Surface Science, 2 ed. (Cambridge University Press, Cambridge, 1 9 94). ) ( D. W. Blakely, E. I. K ozak, B. A. Sexton, and G. A. Somorjai, “New instru-mentation a nd techniques to monitor chemical surface r e actions on s i ngle crystals over a wide pressure range ( 1 0-8-105 To r r) in the same apparatus," J . Vac. Sci. Technol . 13, 1091-1096 (1976). ) ( 12A. L. Cabrera, N. D. Spencer, E. Kozak, P. W. Davies, and G. A. Somorjai, “Improved i n strumentation t o c arry o ut s urface analysis and to monitorchemical surface reactions insitu on small area catalysts over a wide pressure r ange (10-8-10(5) Torr),”R ev. S ci. I n s tr u m. 53, 1888-1893 ( 1 982). ) ( 3D. Godbey, F. Z a era, R . Y e ates, and G . A . S o morjai,“H y drogenation of chemisorbed e thylene on c lean, hydrogen, and ethylidyne covered p latinum(111) crystal surfaces,”Su rf. S c i. 1 67, 150-166 (1986). ) ( 4J. S zanyi a nd D. W . Go o dman, “Co m bined eleva t ed pressure reactorand u ltrahigh vacuum s u rface a n alysis s y stem,” R e v . S c i. I n strum. 6 4 , 2350-2352(1993). ) ( 1 5w. R eichl, G . Rosina, G. R upprechter, C . Z immermann, an d K. Hayek, “Ultrahigh v acuum c o mpatible al l -glass high p r essure r e action cell f oraccurate and reproducible measurement of small r eaction rates,” Re v . S ci. Instrum. 71, 1495-1499 (2000). ) ( 1 6“In-situ c haracterization o f c atalysts,”in To p ics in Catalysis, edited by R . S chlogl a nd A. Z ecchina (2001), Vol. 1 5(1) ( Special I ssue). ) ( “Novel In Si t u Pr o bes for Nanocatalysis,” in MRS Bulletin, edited by A. S tierle and A. M . Molenbroek (2007), Vol. 32(12) (Special Issue). ) ( C . Rameshan,C. W e ilach, W. Stadlmayr, S. Penner, H. Lor e nz, M. Havecker, R. B lume, T . R o cha, D . Te s chner, A. Knop-Gericke, R. Schlogl,D.Zemlyanov,N. Memmel,G. Rupprechter, and B. Klotzer,“Steam reform- i ng of methanol on P dZn near-surface alloys on Pd(111) a nd P d f oil studied by in-situ XPS, LEIS and PM-IRAS,”J.C atal. 2 7 6, 101-113(2010). ) ( C. Rameshan, W . St a dlmayr, S. P e nner, H . L orenz, N. M emmel, M. Haevecker, R. B lume, D. Teschner, T. Rocha, D. Zemlyanov, A. Knop-Gericke, R. Schloegl, and B. Kloetzer,“Hydrogen production by methanolsteam reforming on co p per boosted by zinc-assisted water acti v ation," Angew. C h e m., I nt . E d. 51, 3002-3006(2012). ) ( 20A,. K . O pitz, A. N enning, C. R ameshan, R . Rameshan, R. B l ume,M. Havecker, A. Knop-Gericke, G. Rupprechter, J. Flei g , and B. K l ot z er,“Enhancing electrochemical water-splitting kinetics by polarization-drivenformation of n ear-surface iron(0): An in s itu XPS study on perovskite-typeelectrodes, ” Ang e w. Chem., I n t . E d . 5 4 , 2 6 28 (2015). ) ( 21 M. A. Banares, “Operando m e thodology: Co m bination of in situ spe c -troscopy a nd s imultaneous activity measurements under catalytic reaction conditions,”C atal. Today 100, 7 1-77 (2005). ) ( 2 2X. D. Zhu, H . Suhr, and Y. R. Sh e n, “Surface vibrational spectroscopy by infrared-visible sum frequency generation,” P hys. R ev. B 3 5, 3047-3050 (1987). ) ( 23G. Rupprechter, T. Dellwig, H. Unterhalt, and H.-J . Freund , "CO a dsorp-tion on Ni(100) a nd P t (1 1 1) s t udied by i n frared-visible sum frequency ) generation spectroscopy: Design and application of an SFG-compatibleUTHV-high-pressure reaction cell," Top. Catal. 15, 19-26(2001). 24K. Y. Kung, P. Chen, F. Wei, G. Rupprechter, Y. R. Shen, and G. A.Somorjai,“Ultrahigh vacuum high-pressure reaction system for 2-infrared1-visible sum frequency generation studies," Rev. Sci. Instrum. 72,1806-1809 (2001). 25G. A. Beitel, A. Laskov, H. Oosterbeek, and E. W. Kuipers, "Polarizationmodulation infrared reflection absorption spectroscopy of CO adsorption onCo(0001) under a high-pressure regime,"J. Phys. Chem. 100, 12494-12502(1996). 26Y.Jugnet, F. Aires, C. Deranlot, L. Piccolo, and J. C. Bertolini, “Cochemisorption on Au(110) investigated under elevated pressures by polar-ized reflection absorption infrared spectroscopy and scanning tunnelingmicroscopy,” Surf. Sci. 521, L639-L644 (2002). 27M. Borasio, O. R. de la Fuente, G. Rupprechter, and H.-J. Freund,“In situ studies of methanol decomposition and oxidation on Pd(111) byPM-IRAS and XPS spectroscopy,”J. Phys. Chem. B 109, 17791-17794(2005). ( 2 8 G. Rupprechter and C. Weilach,“Spectroscopic stu d ies of surface-gas inter- actions a nd catalyst restructuring at ambient pressure: Mi n d the gap! , " J . P hy s. : Condens. Matter 20, 184019 (2008). ) 29B. J. McIntyre, M. B. Salmeron, and G. A. Somorjai, “A variable pres-sure/temperature scanning tunneling microscope for surface science andcatalysis studies,"Rev. Sci. Instrum. 64, 687 (1993). 30J. A. Jensen, K. B. Rider, M. Salmeron, and G. A. Somorjai,“High P STM,CO on Pt(111),” Phys. Rev. Lett.80,1228 (1998). E. Laegsgaard, L. Osterlund, P. Thostrup, P. B. Rasmussen, I. Stensgaard,and F. Besenbacher,“A high-pressure scanning tunneling microscope,"Rev.Sci. Instrum.72,3537-3542(2001). 32R. W. Joyner, M. W. Roberts, and K. Yates,“High pressure electronspectrometer for surface studies,” Surf. Sci. 87, 501-509(1979). 33V. I. Bukhtiyarov, V.V. Kaichev,E. A. Podgornov, and I. P. Prosvirin,“XPS,UPS, TPD and TPR studies of oxygen species active in silver-catalysedethylene epoxidation,”Catal. Lett. 57, 233-239 (1999). V. V. Kaichev, I. P. Prosvirin, V. I. Bukhtiyarov, H. Unterhalt,G. Rupprechter, and H.-J. Freund,“High-pressure studies of CO adsorp-tion on Pd(111) by x-ray photoelectron spectroscopy and sum-frequencygeneration,"J. Phys. Chem. B 107,3522-3527(2003). ( M. Mo r kel, V. V. Kaichev, G. R upprechter, H.-J . Freund, I. P . P rosvirin, and V. I . Bukhtiyarov, “ Methanol dehydrogenation an d formation of ca r -bonaceous o verlayers on Pd(111) studied by high-pressure SF G an d XPSspectroscopy,”J . Ph ys . Chem. B 1 08, 1 2955 ( 2004). ) ( 36J. Pantforder, S. Pollmann, J. F. Zhu, D. Borgmann,R. Denecke, and H.-P. S teinriick , “New setup for in situ x-ray photoelectron spectroscopy f rom ultrahigh vacuum to 1 m bar,”Re v. S c i. In strum. 7 6, 014102 (2005). ) ( 3 7S. Alayoglu a n d G. A. So m orjai, “Am b ient pres s ure x-ra y photoelectronspectroscopy f o r p r obing monometallic, bim e tallic and oxide-metal cata- lysts under reactive atmospheres a nd catalytic reaction conditions, ” Top . Catal. 59, 420-438 (2016). ) ( 38J. Silvestre-Albero, M . Borasio, G. Rupprechter, and H.-J.Freund, “Com- bined U HV an d ambient pre s sure studies of 1.3-butadiene adsorption and reaction on Pd(111) by GC, IRAS and XPS,” C a tal. Commun. 8 , 292-298(2007). ) ( 39L. Mayr, R. Rameshan,B. Klotzer, S. Penner, and C. Rameshan,"Combined UHV/high-pressure catalysis setup for depth-resolved near-surface spectro- scopic characterization and catalytic testing of model catalysts,”Re v . Sci . Instrum. 85,055104 (2014). ) 40R. R. Feng, A. A. Liu, S. Liu, J. J. Shi, Y. Liu, and Z. F. Ren,"Methanoladsorption on TiO2 film studied by sum frequency generation vibrationalspectroscopy,”Chin. J. Chem. Phys. 28, 11-16 (2015). ( 41M. Roiaz, E. M onachino, C. Dri, M. Greiner, A. Knop-Gericke, R. Schlogl, G. Comelli, and E. Vesselli,“Reverse water-gas shift or sabatier methanationon Ni(110)? Stable surface species at near-ambient pressure," J . Am. C hem.Soc. 138, 4146-4154(2016). ) ( 42M. C. Y ang, D. C. Tang, and G. A . Somorjai,“Sample mounting and trans- f er mechanism for i n situ IR-visible sum f requency generation vibrationalspectroscopy in high-pressure ultrahigh vacuum system,”R ev. Sci. Instrum. 74,4554-4557(2003). ) ( 43S. Liu, A. A. Liu, R. D. Zhang, and Z. F. Ren, “Compact ultrahigh vacuum/high-pressure system for broadband in f rared sum frequency gen-eration vibrational s pectroscopy s t udies,” R e v. S c i. I n strum. 87 , 04 4 101 (2016). ) ( A. K. Opitz, A. Nenning, C. Rameshan, M. Kubicek, T. Gotsch, R. Blume, M. Havecker, A. K n op-Gericke, G. Rupprechter, B. K lo t zer, and J. Fl e ig, ) “Surface chemistry of perovskite-type electrodes during high temperatureCO2 electrolysis investigated by operando photoelectron spectroscopy,”ACS Appl. Mater. Interfaces 9, 35847-35860 (2017). 45G. Rupprechter, H. Unterhalt, M. Morkel, P. Galletto, L. J. Hu, andH.-J.Freund, “Sum frequency generation vibrational spectroscopy at solid-gas interfaces: CO adsorption on Pd model catalysts at ambient pressure,"Surf. Sci. 502, 109-122(2002). 46U. Mann, Principles of Chemical Reactor Analysis and Design: New Toolsfor Industrial Chemical Reactor Operations, 2nd ed. (John Wiley & Sons,Inc., Hoboken, New Jersey, 2009). 4Y. R. Shen, “Optical second harmonic generation at interfaces,Annu. Rev.Phys. Chem. 40, 327-350(1989). 48Ekspla, SFG Spectrometer, in Ekspla Comp (Lithuania), SFG SpectrometerHandbooks (PL2241 and PG501/DFG). 49P. Hollins,“The influence of surface defects on the infrared spectra ofadsorbed species,”Surf. Sci. Rep. 16, 51-94 (1992). 50G. Rupprechter, “Surface Science Approach to Heterogeneous Catalysis,”in Textbook on Surface and Interface Science, edited by K. Wandelt51(Wiley-VCH, Weinheim,2016), Vol. 5, Chap. 39,pp. 459-527. 5IC. Kluinker, M. Balden, S. Lehwald, and W. Daum, “CO stretching vibra-tions on Pt(111) and Pt(110) studied by sum-frequency generation,” Surf.Sci. 360, 104-111(1996). 2S. Baldelli, N. Markovic, P. Ross, Y. R. Shen, and G. Somorjai,“Sum fre-quency generation of CO on (111) and polycrystalline platinum electrodesurfaces: Evidence for SFG invisible surface CO,”J. Phys.Chem. B 103,8920-8925(1999). ( 53G. Rupprechter, T. D e llwig, H . Un t erhalt, an d H.- J . Fre u nd, “Hi g h- pressure carbon monoxide adsorption on Pt(111) revisited: A sum fr e quencygeneration study,” J. P hy s . Che m . B 105,3797-3802(2001). ) ( 54H. Unterhalt, G. Rupprechter, a n d H.-J. Freund, “Vibrational sum frequencyspectroscopy on Pd(111) and supported Pd nanoparticles: CO adsorption from u ltrahigh vacuum t o atmospheric pressure,"J . P hys . C hem. B 10 6, 356-367 (2002). ) ( 55P. Galletto, H. Unterhalt, and G. Rupprechter,“ T he molecular orientation of CO o n Pd(111 ) : A po l arization-dependent SFG study," Chem . P hys . L e t t.367,785-790(2003). ) 56M. Gierer, A. Barbieri, M. A. VanHove, and G. A. Somorjai,“Structuralreanalysis of the Rb(111)+(√3×√3)R30°-CO and Rh(111)+(2×2)-3COphases using automated tensor LEED,”Surf. Sci.391,176-182(1997). ( 71 M. Morkel, G. R up p rechter, and H.-J. F r eund,“Ultrahigh vacuum and high-pressure coadsorption of CO and H 2 o n Pd(111): A combined SFG, TDS, and LEED study,”J. Chem. P h ys . 1 1 9, 10853-10866 (2003). ) 58v. K. Agrawal and M. Trenary,“An infrared study of NO adsorption atdefect sites on Pt(111),” Surf. Sci. 259,116-128(1991). 59T. Yuzawa, T. Shioda, J. Kubota, K. Onda, A. Wada, K. Domen, andC. Hirose, “Polarization characteristics from SFG spectra of clean and reg-ulatively oxidized Ni(100) surfaces adsorbed by propionate and formate,"Surf. Sci. 416,L1090-L1094 (1998). 60H. F. Wang, W. Gan, R. Lu, Y. Rao, and B. H. Wu, “Quantitative spectraland orientational analysis in surface sum frequency generation vibrationalspectroscopy (SFG-VS),”Int. Rev. Phys. Chem. 24,191-256(2005). 61G. Rupprechter, H. Unterhalt, M. Morkel, P. Galletto, T. Dellwig, andH.-J. Freund,“Extending UHV studies to the mbar range: Vibrational SFGspectroscopy of high-pressure CO adsorption on Pt(111) and Pd(111),”Vacuum 71, 83-87 (2003). 62M. Morkel, H. Unterhalt, M. Salmeron, G. Rupprechter, and H.-J. Freund,“SFG spectroscopy from 10(-8) to 1000 mbar: Less-ordered CO structuresand coadsorption on Pd(111),”Surf. Sci. 532, 103-107 (2003). 63H. Harle, K. Mendel, U. Metka, H. R. Volpp, L. Willms, and J. Wolfrum,“Temperature dependence (90-440 K) of the vibrational spectra of COadsorbed on platinum(111) studied by sum-frequency generation,”Chem.Phys. Lett. 279,275-281(1997). 64F. Fournier, W. Zheng, S. Carrez, H. Dubost, and B. Bourguignon, “Ultra-fast laser excitation of CO/Pt(111) probed by sum frequency generation:Coverage dependent desorption efficiency,"Phys. Rev.Lett. 92,4 (2004). 65E. H. G. Backus and M. Bonn, “A quantitative comparison betweenreflection absorption infrared and sum-frequency generation spectroscopy,”Chem. Phys. Lett. 412,152-157(2005). 66M. Tushaus, E. Schweizer, P. Hollins, and A. M. Bradshaw, “Yet anothervibrational study of the adsorption system Pt(111)-CO,”J.Electron Spec-trosc. Relat. Phenom. 44,305-316 (1987). 67s. M. George, “Atomic layer deposition: An overview,”Chem. Rev. 110,111-131(2010). 68R. L. Puurunen, “Surface chemistry of atomic layer deposition: A casestudy for the trimethylaluminum/water process,"J. Appl. Phys. 97, 121301(2005). 69A. Haghofer, P. Sonstrom, D. Fenske, K. Fottinger, S. Schwarz,J. Bernardi,K. Al-Shamery, M. Baumer, and G. Rupprechter,“Colloidally prepared Ptnanowires versus impregnated Pt nanoparticles: Comparison of adsorptionand reaction properties,” Langmuir 26,16330-16338 (2010). D. Vogel, C. Spiel, Y. Suchorski, A. Trinchero, R. Schlogl, H. Gronbeck,and G.Rupprechter, “Local catalytic ignition during CO oxidation on low-index Pt and Pd surfaces: A combined PEEM,MS, and DFT study,”Angew.Chem., Int. Ed. 51, 10041-10044 (2012). Rev. Sci. Instrum. ; https://doi.org/ Author(s). / Author(s) A new custom-designed ultrahigh vacuum (UHV) chamber coupled to a UHV and atmospheric-pressure-compatible spectroscopic and catalytic reaction cell is described, which allows us to perform IR-vis sum frequency generation (SFG) vibrational spectroscopy during catalytic (kinetic) measurements. SFG spectroscopy is an exceptional tool to study vibrational properties of surface adsorbates under operando conditions, close to those of technical catalysis. This versatile setup allows performing surface science, SFG spectroscopy, catalysis, and electrochemical investigations on model systems, including single crystals, thin films, and deposited metal nanoparticles, under well-controlled conditions of gas composition, pressure, temperature, and potential. The UHV chamber enables us to prepare the model catalysts and to analyze their surface structure and composition by low energy electron diffraction and Auger electron spectroscopy, respectively. Thereafter, a sample transfer mechanism moves samples under UHV to the spectroscopic cell, avoiding air exposure. In the catalytic cell, SFG spectroscopy and catalytic tests (reactant/product analysis by mass spectrometry or gas chromatography) are performed simultaneously. A dedicated sample manipulation stage allows the model catalysts to be examined from LN2 temperature to 1273 K, with gaseous reactants in a pressure range from UHV to atmospheric. For post-reaction analysis, the SFG cell is rapidly evacuated and samples are transferred back to the UHV chamber. The capabilities of this new setup are demonstrated by benchmark results of CO adsorption on Pt and Pd(111) single crystal surfaces and of CO adsorption and oxidation on a ZrO2 supported Pt nanoparticle model catalyst grown by atomic layer deposition.
确定


还剩9页未读,是否继续阅读?

产品配置单

北京欧兰科技发展有限公司为您提供《超高真空生长的模型催化剂样品中和频光谱检测方案(其它光谱仪)》,该方案主要用于催化剂中理化分析检测,参考标准--,《超高真空生长的模型催化剂样品中和频光谱检测方案(其它光谱仪)》用到的仪器有Ekspla SFG 表面和频光谱分析系统
推荐专场
相关方案
更多
该厂商其他方案
更多