


方案详情
文
采用Ekspla PL2230型锁模脉冲皮秒高能量激光器,搭建了一套皮秒振动和频光谱测量系统SFG,并利用该测量系统研究了固定化酶制备非均相酶杂化催化剂的课题
方案详情

a) UC BerkeleyUC Berkeley Electronic Theses and Dissertations Title Immobilization of Enzymes to Create Heterogeneous-Enzyme Hybrid Catalysts Permalink https://escholarship.org/uc/item/4cj529f6 Author Hurlburt, Tyler john Publication Date2018 Peer reviewed|Thesis/dissertation Immobilization of Enzymes to Create Heterogeneous-Enzyme Hybrid Catalysts by Tyler Hurlburt A dissertation submitted in partial satisfaction of the requirements for the degree of Doctor of Philosophy in Chemistrv in the Graduate Division of the University of California, Berkeley Committee in charge: Professor Gabor A. Somorjai, ChairProfessor Matthew B. Francis Professor Wenjun Zhang Fal 2018 Immobilization of Enzymes to Create Heterogeneous- Enzyme Hybrid Catalysts Copyright O 2018 by Tyler Hurlburt Abstract Immobilization of Enzymes to Create Heterogeneous-Enzyme Hybrid Catalysts ByTyler Hurlburt Doctor of Philosophy in Chemistry University of California, Berkeley Professor Gabor A. Somorjai, Chair Enzymes are highly selective and active biocatalysts that can catalyze reactions atmuch milder conditions than heterogeneous catalysts. However, in solution enzymes are notreusable, can not be used in a flow cell, and can be difficult to separate from the products.By immobilizing enzymes onto a solid support, it is possible to create a catalytic system thatcombines the activity and selectivity of enzymes with the reusability and ease of separationof heterogeneous catalysis. This immobilization process also allows for enzymes to be studiedwith surface-specific techniques. One method to immobilize enzymes is through DNA directed immobilization (DDI).This method uses the selective binding of complementary DNA strands to immobilizeenzymes in an ordered and selective manner. The activity of aldolase-an enzyme in theglycolysis pathway that catalyzes the C-C bond breaking step-was found to be significantafter conjugation to DNA and subsequent immobilization onto functionalized glass surfaces.These immobilized enzyme surfaces were found to be reusable for multiple reaction cyclesand regeneratable by dehybridizing the DNA strands. These DNA and enzyme modified surfaces were studied by using sum frequencygeneration (SFG) vibrational spectroscopy.This showed that quartz modified with double-stranded DNA has an ordered structure, while single-stranded DNA surfaces are moredisordered due to the lack of rigidity. Alcohol dehydrogenase, which catalyzes the conversion of a primary or secondaryalcohol into an aldehyde or ketone, can be immobilized onto the mesoporous silica materialSBA-15 through non-specific physical adsorption.These immobilized enzymes are activeupon adsorption but are prone to significant leaching. The specificity of immobilized alcoholdehydrogenase towards longer alcohols was found to be slightly diminished. This dissertation builds on existing knowledge of enzyme immobilization methodsand surface science characterization techniques. This research shows that immobilizedenzymes are a promising method for creating novel catalytic systems. The results show theimportance of limiting the leaching of enzymes off of the support for potential catalyticapplications. Table of Contents Acknowledgments....m.iv Chapter 1: Surface Science Approach to the Molecular Level Integration of the Principlesin Heterogeneous,Homogeneous, and Enzymatic Catalysis.........................................................· .1 1.1. Unification of the Three Fields of Catalysis....... .2 1.2. Characterization of Catalysts under Reaction Conditions.. .3 1.3.Introduction to Enzymes...... ..6 .1.4. Methods of Enzymelmmobilization.... 1.4. References..... Chapter 2: Site-selective Attachment of Enzymes to Glass Surfaces through DNA Directed Immobilization....... .14 .2.1. Introduction....... 2.2. Results and Discussion....... 2.2.1. Modifying Glass Slides with Single Stranded DNA and Hybridizing to .Complementary DNA.......... 2.2.2. Modifying Aldolase with A'DNA and Evaluating its Activity....... 2.2.3. Evaluating the Activity of Surface Immobilized Aldolase..... 2.2.4. Reusing the Protein Immobilized Surfaces...... .2.2.5. Surface Characterization with Atomic Force Microscopy...... 2.2.6. Hybridization Temperature Modulates Immobilization Levels..... 2.2.7. Regenerating and Recycling the Single Stranded DNA Modified Surfaces...... 2.3.Conclusions..... 2.4. Materials and Methods........ 2.4.1. General Procedures and Materials..... 2.4.2.Instrumentation and Sample Analysis..... 2.4.3. Preparation of Aniline Functionalized Glass Slides... 2.4.4. Synthesis of Aminophenol-DNA........ 2.4.5. Patterning Single Stranded DNA on Aniline Functionalized Slides Using .Potassium Ferricyanide Mediated Oxidative Coupling......... .36 2.4.6. Annealing of Complementary DNA Strands on Single Stranded DNAModified Glass Slides....... .2.4.7. Capping Free Cysteines on Aldolase with N-ethyl maleimide....... 2.4.8. Synthesis of DNA-Aldolase Bioconjugate......... ...................................... 2.4.9. Synthesis of Fluorescent DNA-Aldolase Conjugate..... 2.4.10. Characterization of DNA-Aldolase Conjugate........ 3 33 3 2.4.11. Activity Assay of Aldolase in Solution........3 2.4.12. Immobilization of DNA-Aldolase onto Glass Surfaces and Analysis ofActivity.......... 2.4.13. Reusing Surfaces with Immobilized Aldolase..... 2.4.14. Regenerating Surfaces with Immobilized Aldolase..................................... 3 .2.4.15. Atomic Force Microscopy Studies......4 2.4.16. Capping of Free Cysteines with 5,5'-dithio-bis-(2-nitrobenzoic Acid)......40 2.4.17. Modification of Aldolase with a Small Molecule o-aminophenol Reagent.at the N-terminus for Mass Spectrometry Analysis...... .40 2.4.18. Trypsin Digestion of a Small Molecule Modified Aldolase for MS/MS 2.5.References......................................................................................................................................... .Analysis....... 44 Chapter 3:Characterization of DNA Surfaces via Sum Frequency Generation Spectroscopy.......... .45 3.1. Introduction....... 3.2. Results and Discussion......... .........0 ............................................. .3.2.1.Evaluating DNA Attachment Using Fluorescence..... 3.2.2. SFG Spectroscopy of Aniline Functionalized Quartz Surface... .3.2.3. SFG Spectroscopy of DNA Surfaces in Air..... 3.2.4. SFG Spectroscopy in Air of Immobilized Enzymes... 3.3. Conclusions........ 3.4.Materials and Methods...... 3.4.1.General Procedures and Materials. ................................................................. 3.4.2.Instrumentation.......... 3.4.3. Preparation of Aniline Functionalized Quartz Discs... 5 升.3.4.4. Synthesis of Aminophenol-DNA...... 3.4.5. Patterning Single Stranded DNA on Aniline Functionalized Slides UsingPotassium Ferricyanide Mediated Oxidative Coupling......... ......56 3.4.6. Annealing of Complementary DNA Strands on Single Stranded DNA .Modified Glass Slides...... .3.4.7.Synthesis of DNA-Aldolase Bioconjugate...... 3.4.8. Immobilization of DNA-Aldolase onto Quartz Discs.. 3.5. References........ 555 Chapter 4:Immobilization of Enzymes onto Mesoporous Silica........ .60 4.1. Introduction....... 4.2. Results and Discussion....... 4.2.1. Evaluating Incorporation of Phenylazide Silane into SBA-15.. ... 4.2.2. Measuring Activity of Non-specifically Adsorbed Alcohol .Dehydrogenase...... ·....65 4.2.3. Effect of Incubation Temperature, Concentration, and Time on Activity...67 4.2.4. Alcohol Specificity........... ....68 4.2.5.Leaching Tests......... 4.3.Conclusions........ 4.4.Materials and Methods............m..m ...m................................................................· .4.4.1.General Procedures and Materials. 4.4.2.Instrumentation....... 4.4.3.Preparation of SBA-15.... .4.4.4. Expression of Alcohol Dehydrogenase... 4.4.5. Activity Assay of Alcohol Dehydrogenase in Solution...... 4.4.6. Immobilization of Alcohol Dehydrogenase onto SBA-15.. .4.4.7. Activity Assay of Alcohol Dehydrogenase on SBA-15................................ 4.4.8. Screen of Activity for Various Alcohols...... 4.4.9. Determination of Leaching of Enzyme from SBA-15. 4.5. References....... 的卫乃乃乃乃乃乃 Acknowledgments The research contained within this dissertation was supported by the Director, Officeof Science, Office of Basic Energy Sciences, Chemical Sciences, Geosciences and BiosciencesDivision of the U.S. Department of Energy, under Contract no.DE-AC02-05CH11231 First, I must express my gratitude to my Ph.D. advisor, Professor Gabor A. Somorjai, forgiving me the opportunity to study in his lab. It is a great honor to be the last Ph.D. student ofsuch a distinguished scientist. The amount of science that Gabor has done and the numberof truly great scientists that he has molded is certainly awe-inspiring. Beyond his scientificmentorship,I have greatly appreciated listening to him tell stories of his journey to becominga professor or of great scientific breakthroughs coming from unlikely beginnings. I will alwaysbe grateful to his support and advice. l also must thank Professor Matt Francis. This project started out as a collaboration withhis lab and Matt quickly came to treat me as one of his own students. Giving me a desk in hislab, inviting me on group trips, and advising me just like any other Francis lab member. Thiswork would not have been accomplished without his support The Somorjai group as a whole has been an essential guiding light in my graduatestudies. I have to thank Walter Ralston, Griffin Kennedy, Gerome Melaet, Yonatan Horowitz,Wenchi Liu, Alex Buyanin, Christophe Deraedt,Nate Musselwhite, Lindsay Carl Keller, Rong"Rocky"Ye, Selim Alayoglu, Kwangjin An, Fudong Liu, Lynda Han, and Shanshan Yang. It wasalways a great time with them, even when we fail to win the softball championship. I consider the Francis Lab to be my "adopted lab."You have all taught me all of thebiology and biochemistry that I came to learn over these last five years. Without you l wouldhave been lost in a discipline I knew nothing about. I must specifically thank Ariel Furst, SarahKlass, Matt Smith, and all the members of 733 that I have overlapped with: loana Aanei, JoelFinbloom, Kristin Wucherer, and Daniel Brauer. Your jokes, discussion, and good moods havekept me sane during rough stretches, plus you were always willing to help me execute a good(or typically bad) prank. Most importantly I must thank my collaborator and partner in crime,Kanwal Palla. You were perhaps the most important person during my time in grad school.Working so closely with another student could have been difficult but working with you wasalways so easy and so much fun. Finally, I have to thank my family. My parents have always supported me and pushedme to be my best self. They made me everything that l am, and I can never thank themenough. To my brother, Nick,you have always been a wonderful role model for me. We couldbe competitive at times, but you have always been one of my best friends and l am so fortu-nate that you were only an hour away for most of my graduate career to make it easy to havefamily when needed.Lastly, I wish to thank my girlfriend, Sara. You have made my life so muchbetter for the last year and a half. Your humor, intellect, caring, and love have kept me goingmore than you can know. I am so excited for our future and all the adventures we have instore. Chapter 1 Surface Science Approach to the Molecular Level Integration of the Principles inHeterogeneous, Homogeneous, and Enzymatic Catalysis Abstract Heterogeneous,homogeneous, and enzymatic catalysis have generally beentreated and studied as three separate fields. However, all three fields have many aspectsthat unify them, therefore it is useful to study catalysts from each field in similar manners.Heterogeneous catalysts have been studied extensively under reaction conditions to monitordynamic changes that occur during catalytic reactions, their atomic and molecular structure,and composition and oxidation state with high spatial and time resolution. The techniquesused to monitor these catalysts include sum frequency generation vibrational spectroscopy,high pressure scanning tunneling microscopy,and ambient pressure X-ray photoelectronspectroscopy. In order to use these techniques to study enzymes under reaction conditions,we have heterogenized homogeneous catalysts by encapsulating small metal clustersin dendrimers and immobilized enzymes through the use of DNA tethers. By studyingall three fields under reaction conditions with the same techniques we aim to show thatheterogeneous, homogeneous, and enzymatic catalysts all behave similarly at the molecularlevel. In order to achieve this goal, it is possible to immobilize enzymes in order to study themwith techniques that have typically been reserved for heterogeneous catalysis. Adapted by permission from Springer Nature, Topics in Catalysis, Surface Science Approachto the Molecular Level Integration of the Principles in Heterogeneous, Homogeneous, andEnzymatic Catalysis, Hurlburt, T. H.; Liu, W.-C.; Ye, R.; Somorjai, G. A., Copyright 2018. 1.1. Introduction Catalysis has long been separated into three distinct fields—heterogeneous,homogeneous, and enzymatic—all studied independently. Heterogeneous catalysis operateswith the catalyst in a different phase than the reactants and products (e.g. solid-liquid, solid-gas); homogeneous catalysis has both catalyst and reactants/products in the same phase(almost exclusively liquid); enzymatic catalysis uses the active site of proteins to carry out thecatalysis needed for biological systems. Instead of treating each field as its own distinct discipline, it is novel and scientificallyworthwhile to unify all three types of catalysis and show that they all behave similarly onthe molecular scale. All three fields have the capability to carry out the same broad class ofreactions. Such as the oxidation of primary alcohols where bimetallic Au-Pd nanoparticlessupported on TiO2 (heterogeneous), a Cu-azo complex (homogeneous), and horse liveralcohol dehydrogenase (enzyme) all have an affinity for the oxidation of benzyl alcohol.1-3Other examples of catalysts from each field catalyzing the same reaction can be seen in Table1.1. Alcohol Oxidation Isomerization Esterification Heterogeneous Au-Pd bimetallicnanoparticles on TiO, Zn based coordinationnetwork Sulfated ZrO. Homogeneous Cu-azo complex Bulky palladiumhydride complex Bulky diarlyammoniumarenesulfonate Enzyme Alcohol dehydrogenase Peptidyl prolyl cis-trans isomerase Lipase Table 1.1. Catalysts from each of the three fields of catalysis that catalyze the same reactions.1 Heterogeneous Enzyme Pt/Rh bimetallicnanoparticles:~8nm Trypsin: ~4nm ~1.6 nm Figure 1.1. An example catalyst from each field of catalysis. Each catalyst is smaller than 10nm in each dimension. These catalysts catalyze CO oxidation, olefin polymerization, andprotein hydrolyzation respectively. In most cases, the active catalyst, whether heterogeneous, homogeneous, or enzyme,is under 10 nm in scale (Figure 1.1). As such, all of these catalysts could be considerednanoparticles. Besides the connection in their sizes, it has also been shown that the oxidationstates of noble metal nanoparticles, including Pt and Rh, increase with decreasing sizes.10,11When the nanoparticles are sufficiently small, their oxidation states eventually approach thatof the metal complexes, which are extensively used as catalysts in homogeneous catalysis.The heterogenization of homogeneous and enzyme catalysts are also actively sought after,as that provides the means to study all three fields of catalysis with the same techniquestypically only used for heterogeneous catalysts. 1.2.Characterization of Nanoparticle Catalysts Under Reaction Conditions To truly understand these nanoparticle catalysts, it is not enough to study the catalystbefore and after the reaction, but to actually follow the catalyst while the reaction is ongoing.For example, it has been demonstrated repeatedly that the catalysts undergo structurereconstruction and changes in oxidation states upon contact with the reaction atmosphere, b) Frequency (cm) Figure 1.2. a) Scheme of an SFG system showing the overlap of the incoming fixed visiblebeam (green) and a variable IR beam (red) and the outgoing SF beam (blue). b) Energy leveldiagram of SFG showing the frequency of the outgoing signal is equal to the sum ofthefrequencies of the two incoming beams. c) SFG spectra of ethylene hydrogenation on Pt(111)showing the orientation of various molecular species on the surface of the catalyst.18 and that the active sites are often formed in-situ under reaction conditions.12-15 In addition,since the catalytic reactions often take place on the surface of the nanoparticle catalysts,characterization techniques equipped with superior surface sensitivities would be extremelypowerful. Much of the work that has been done in studying catalysis under reactionconditions has focused on heterogeneous catalysis due to limitations of the spectroscopicand microscopic techniques used. These techniques include: sum frequency generation(SFG) vibrational spectroscopy, high pressure scanning tunneling microscopy (STM), ambientpressure X-ray photoelectron spectroscopy (AP-XPS), and nanodiode hot electron detection. SFG is an inherently surface sensitive spectroscopic technique, making it a particularlygood tool for studying adsorbed species under catalytic reaction conditions.16-19 SFG requiresthe spatial and temporal overlap of a fixed wavelength visible beam and a variable IR beam(Figure 1.2a). When the IR frequency matches a vibrational mode of the surface there is aresulting outgoing beam that has a frequency equal to the sum of the frequencies of the two Time (h) Figure 1.3. a) 200 Ax200 A high pressure STM image of Pt(111) in the presence of 20 mTorrcyclohexene and 20 mTorr hydrogen at 350 K. Blurry, streaky image suggests adsorbedspecies move faster than the STM tip. b) Pressures of cyclohexene (black squares),cyclohexane (red triangles), and benzene (green diamonds) during cyclohexenehydrogenation. c) 90 A x90 A high pressure STM image of Pt(111) in the presence of 20 mTorrcyclohexene, 200 mTorr hydrogen, and 5 mTorr CO at 300 K (CO poisons the catalyst). Yellowrhombus represents the unit cell d) Pressures of cyclohexene,cyclohexane, and benzeneduring cyclohexene hydrogenation on poisoned catalyst.21 incoming beams (Figure 1.2b). During ethylene hydrogenation reactions on Pt(111) we haveobserved several molecular species on the surface of the catalysts.18 These include ethylidynebound perpendicularly to the surface and ethylene bound parallel to the surface via eitherT-bonded or di-o-bonded (Figure 1.2c). Knowing the orientation and bonding of thesemolecules makes it possible to determine, under reaction conditions, the molecular details ofthe mechanisms of these reactions. Using high pressure STM it is seen that the species adsorbed on a solid catalyst aremobile, not just stuck in one active site.20-22 Studies of cyclohexene hydrogenation on Pt(111)show streaky, diffuse STM images while the reaction is ongoing (Figure 1.3a,b). However,upon the addition of carbon monoxide (which poisons any catalytic turnover) clear, orderedstructures are seen (Figure 1.3c, d). This suggests that when the catalyst is active and thereaction is ongoing the adsorbed species move faster than the tip of the STM (100 A/ms)."? Ambient pressure XPS can be used to determine the surface composition andoxidation states of bimetallic nanoparticles under reaction relevant conditions rather thanthe ultra-high vacuum conditions typically needed for XPS (Figure 1.4a). In the presence of anoxidizing gas (nitric oxide) 15 nm rhodium-palladium nanoparticles preferentially segregaterhodium to the surface, with ~94% of the Rh being in the oxide form. Upon the addition of areducing gas (carbon monoxide) to mimic the reaction conditions, the surface compositionbecomes much more equal and about 76% of the remaining surface Rh are reduced to itsmetallic state. This trend continues through cycles of oxidizing and reducing conditions(Figure1.4b).23 Figure 1.4. a) Scheme of ambient pressure XPS setup.b) Surface atomic fraction of Rh and Pdin bimetallic nanoparticles under oxidizing (NO) and reducing/catalytic (NO+CO) conditions."3 1.3. Introduction to Enzymes Enzymes are biological catalysts, typically proteins, but occasionally RNA. Becauseenzymes function under biological conditions, they can catalyze reactions under significantlymore mild conditions than conventional heterogeneous and homogeneous catalysts.Enzymes generally function in aqueous solution, at temperatures ranging from 25-100℃,and at nearly neutral pH's.Elevated temperatures and extreme pH conditions can lead tounfolding (or denaturing) of the enzyme structure, causing inactivation of the catalytic activesite.24Industrial uses of enzymes necessitates increased stability, particularly in the longtermthermal stability. Enzymes can catalyze a particular reaction both in whole cells and isolated in vitro.One common method for synthesizing an enzyme of interest is through expression in cells.To express the protein a plasmid-a circular strand of DNA that encodes for the desiredprotein—is transformed (ortransferred) into the host cell. This host cell can be a bacterial,yeast, plant, or mammalian cell, but most often Escherichia coli (E. coli) are used. These E. coliare then grown on an agar plate containing an antibiotic that the host cells are resistant to; Figure 1.5. Expression and purification of proteins. a) A plasmid, a circular strand of DNA,encodes for the desired protein. b) The plasmid is transformed into an expression vector, oftenE. coli.c) Cells are incubated on an agar plate. d) Cells from a single colony from the plate areadded to a flask containing growth medium. Cells are allowed to grow. Once enough cells arepresent, expression of the protein is induced. e) Cell material is collected via centrifugation.Cell walls are ruptured through sonication, osmotic shock, or by physical means. f) Thedesired protein is purified from other proteins through size, charge, or affinity this allows for the selected growth of the cells containing the desired plasmid.Cells fromone isolated colony on the agar plate are selected and added to a flask containing a growthmedium. The cells are allowed to exponentially grow in these incubation flasks. Once adesired concentration of cells has been reached, a reagent—commonly Isopropyl B-D-1-thiogalactopyranoside (IPTG)- is added to induce the cells into producing large amountsof the chosen protein. The solution containing the cells is then centrifuged, and the solidcell material (pellet) is isolated. The cells are then lysed, or broken apart, by sonication,osmotic shock, or physical means enabling the release of the expressed protein. This solutioncontaining the freed protein and cell debris is centrifuged again, causing the ruptured cellmaterial to precipitate, and the supernatant containing the desired (and other ancillary)proteins is collected. This liquid is then added to a column that will separate the desiredprotein from others based on size, charge, or affinity. The purity of the collected proteinfractions can be determined by gel electrophoresis. The complete process is diagrammed inFigure 1.5. The kinetics of enzymes can be simplified in to two steps: 1) the binding of thereactant (or substrate) to the enzyme; and 2) the reaction to create the products. At relativelylow substrate concentrations, the reaction rate is linearly correlated to the substrateconcentration. There are sufficient enzymes relative to substrates such that the enzymes arelargely free, allowing them to catalyze the reaction. An increase in the substrate concentrationleads to a increase in the reaction rate. As the substrate concentration continues to increase,more enzymes are bound to a substrate. At a sufficiently high concentration, the enzymes aresaturated with substrate such that all of the active sites are occupied. In this case, the reactionrate is limited by the turnover rate of the enzyme; at this concentration increasing the amountofsubstrate does not result in an increase in the reaction rate. Two important kinetic factors ofenzymes are this turnover rate, called k , and the substrate concentration where the reactionrate is at half of its maximum, K. A higher k is the result of an enzyme that can catalyze areaction faster and a lower K is the result of a higher affinity of an enzyme for its substrate.The overall catalytic efficiency of an enzyme can be measured by kaK. For select enzymes,this value can reach the theoretical maximum of 108-1010M-1s1which is the limit of diffusion ofsubstrate into the active site. a) b) Cross-linking Matrix entrapment c) d) Non-specific adsorption Covalent bonding Figure 1.6. General diagram of the four types of enzyme immobilization techniques. a)Cross-linking of enzymes to each other to create larger aggregated particles that can beisolated and resused. b) Matrix entrapment where the enzyme is encased in a material thatallows for the diffusion of reactants and products, but not theenzyme. c) Enzymes can benon-specifically adsorped on to supports through hydrogen bonding, van der Waalsinteractions, or charge-charge interactions. d) The covalent bonding of enzymes to a surfacethrough a linker molecule. This typically requires the functionalization of the surface and/orthe enzyme. 1.4.Methods of Enzyme Immobilization Immobilizing enzymes onto a solid support offers many benefits including thepotential to use the techniques described above to study the reaction mechanism, theability to reuse the enzyme for multiple cycles, the capability to place the enzyme into aflow cell, and the ease of separating products from the catalyst.25-28 Through immobilizationof enzymes, it is possible to create a catalytic system that retains these benefits typicallyreserved to heterogeneous catalysts but also with the very high selectivity and ability tofunction at mild conditions seen in enzymes. a) B-galactosidaseCa-AlgGelatinCalcium phosphate Figure 1.7. a) Schematic representation of β-galactosidase entrapped in an alginate-gelatin-calcium phosphate capsule.b) Optical micrograph of capsules. c) SEM image of capsules at50x magnification.(Reprinted from Process Biochem. 46, Shen,Q.;Yang, R.; Hua, X.; Ye, F.;Zhang,W.; Zhao, W., Gelatin-Templated Biomimetic Calcification for B-GalactosidaseImmobilization, 1565-1571, Copyright 2011, with permission from Elsevier.) Techniques for immobilizing enzymes can be broken down into four broad groups:cross-linking, matrix entrapment, non-specific adsorption,and covalent bonding (Figure1.6). It has been shown that through the creation of cross-linked enzyme crystals (CLCs) ofthermolysin, an enzyme used in the manufacturing of aspartame, it is possible to make anenzyme catalyst that is much more stable in organic solvents and for longer times.29 B-Galactosidase, an enzyme used to hydrolyze lactose, has been entrapped in analginate-gelatin-calcium phosphate hybrid capsule (Figure 1.7). This material creates a hardershell around the particles containing the immobilized enzyme. This decreases the amountof leaching, increases mechanical stability, broadens the optimal temperature and pH range,and increases the storage stability as compared to when the enzyme is entrapped in alginatewithout the hard exterior shell.30 Lipase enzymes have been immobilized on both unfunctionalized and functionalizedzeolites. Functionalization methods include creating amine- and thiol-terminated surfaces.It was found that while enzyme uptake was greater in the unfunctionalized zeolites due toa decrease in the mesoporous surface area, the functionalized surfaces retained activity athigher levels. This is believed to be a result of stronger enzyme-support interactions and thusdecreased leaching.1 One method for the covalent bonding of enzymes to a surface is through the use ofrecombinant poly-histidine tags at either the C-or N-terminus of an enzyme. This tag canselectively bind to a Cu²+-PEG modified Si(111) surface through metal chelation.3Since thismethod is selective for a single location on the enzyme, all of the immobilized enzymes areoriented in the same direction. This results in a system that is more active than those that Figure 1.8. a) Three different modifications of a Si(111) surface.(A) and (B) randomly tetherproteins to the surface by reacting with the NH, groups in lysines. (C) Selectively binds to apoly-histidine tag at the C-terminus of the enzyme. b) The relative activity of enzymesimmobilized through these three methods and free enzyme in solution(D). (Reprinted fromProteomics 5, Cha, T. W.;Quo, A.; Zhu, X. Y., Enzymatic Activity on a Chip: The Critical Role ofProtein Orientation, 416-419, Copyright 2005, with permission from John Wlley and Sons.) are randomly oriented through covalent binding to the many lysines available for bindingand roughly as equal as free enzyme in solution (Figure 1.8). This is due to certain randomorientations having an active site that is inaccessible to the bulk solution decreasing the totalactivity. An ideal immobilization method would be one that is generalizable to many enzymes,site-selective, resistant to leaching,selectively reversible, use readily accessible functionalgroups on the enzyme, allow for the controlled attachment of multiple enzymes, maximizethe density of enzymes, and increase the stability of the enzyme. Finding one method thatmeets all of these criteria may be akin to searching for the Holy Grail, but it should be the goalto maximize as many of these conditions as possible. 1.4.References 1..Enache,D. I.;Edwards, J.K.; Landon, P; Solsona-Espriu, B.; Carley, A. F.;Herzing, A. A.;Watanabe, M.; Kiely, C. J.; Knight, D. W.; Hutchings, G. J.,Solvent-Free Oxidation ofPrimary Alcohols to Aldehydes Using Au-Pd/TiO2 Catalysts. Science 2006, 311, 362-365 2.Marko,I.E.;Giles, P. R.;Tsukazaki, M.; Brown, S. M.; Urch,C. J.,Copper-CatalyzedOxidation of Alcohols to Aldehydes and Ketones: An Efficient, Aerobic Alternative.Science 1996, 274,2044-2046 3.. Shearer, G. L.; Kim, K.; Lee, K. M.; Wang, C. K.; Plapp,B. V., Alternative Pathwaysand Reactions of Benzyl Alcohol and Benzaldehyde with Horse Liver AlcoholDehydrogenase. Biochemistry 1993,32,11186-11194 4.Ohara, K.;Kawano, M.;Inokuma, Y.; Fujita, M. A, Porous Coordination Network Catalyzesan Olefin Isomerization Reaction in the Pore. J. Am. Chem. Soc. 2010,132, 30-31 5.Gauthier, D.; Lindhardt, A. T.;Olsen, E. P. K.;Overgaard, J.;Skrydstrup,T., In SituGenerated Bulky Palladium Hydride Complexes as Catalysts for the EfficientIsomerization of Olefins. Selective Transformation of Terminal Alkenes to 2-Alkenes.J.Am. Chem. Soc. 2010, 132,7998-8009 6.Kofron, J. L.; Kuzmic, P.;Kishore,V.;Colon-Bonilla, E.;Rich, D. H.,Determination of KineticConstants for Peptidyl Prolyl Cis Trans Isomerases by an Improved SpectrophotometricAssay. Biochemistry 1991, 30, 6127-6134 7. Sejidov, F.T.; Mansoori, Y.; Goodarzi, N., Esterification Reaction Using SolidHeterogeneous Acid Catalysts under Solvent-Less Condition.J. Mol. Catal. A Chem.2005,240,186-190 8..Ishihara,K.; Nakagawa, S.; Sakakura, A., Bulky Diarylammonium Arenesulfonates asSelective Esterification Catalysts.J. Am. Chem. Soc. 2005, 127,4168-4169 9..Bjorkling, F.;Godtfredsen, S. E.; Kirk, O.A., Highly Selective Enzyme-CatalysedEsterification of Simple Glucosides. J. Chem. Soc. Chem.Commun. 1989,14,934-935 10. Li,Y.; Liu, J. H.-C.;Witham, C. A.; Huang, W.; Marcus, M. A.; Fakra, S. C.; Alayoglu, P.;Zhu, Z.;Thompson, C. M.; Arjun, A.; Lee, K.; Gross, E.;Toste, F. D.; Somorjai, G. A., A Pt-Cluster-Based Heterogeneous Catalyst for Homogeneous Catalytic Reactions: X-RayAbsorption Spectroscopy and Reaction Kinetic Studies of Their Activity and Stabilityagainst Leaching. J.Am. Chem. Soc.2011,133,13527-13533 11. Grass,M.E.;Zhang, Y.; Butcher,D. R.; Park, J.Y.; Li, Y.; Bluhm, H.; Bratlie, K. M.; Zhang,T.; Somorjai, G. A., A Reactive Oxide Overlayer on Rhodium Nanoparticles duringCO Oxidation and Its Size Dependence Studied by in Situ Ambient-Pressure X-RayPhotoelectron Spectroscopy.Angew. Chemie-Int. Ed. 2008, 47,8893-8896 12. Tao, F.; Grass,M. E.;Zhang,Y.;Butcher, D. R.;Aksoy, F; Aloni, S.; Altoe, V.; Alayoglu,S.;Renzas,J. R.;Tsung, C. K.; Zhu, Z.; Liu, Z.; Salmeron, M.; Somorjai, G. A.,Evolutionof Structure and Chemistry of Bimetallic Nanoparticle Catalysts under ReactionConditions.J Am Chem Soc 2010, 132, 8697-8703 13. Schott,V.;Oberhofer, H.; Birkner, A.; Xu, M.; Wang, Y.; Muhler, M.; Reuter, K.; Woll, C.,Corrigendum to: Chemical Activity of Thin Oxide Layers: Strong Interactions with theSupport Yield a New Thin-Film Phase of ZnO Angew. Chemie-Int.Ed. 2017,52,11925-11929 14. Gross,E.; Shu, X. Z.;Alayoglu, S.; Bechtel, H. A.;Martin, M. C.;Toste, F. D.; Somorjai,G.A., In Situ IR and X-Ray High Spatial-Resolution Microspectroscopy Measurements ofMultistep Organic Transformation in Flow Microreactor Catalyzed by Au Nanoclusters.J.Am. Chem. Soc. 2014, 136,3624-3629 15. Tsakoumis,N. E.;Walmsley, J. C.; Ronning, M.; Van Beek, W.;Rytter, E.; Holmen,A.,Evaluation of Reoxidation Thresholds for y-Al,O Supported Cobalt Catalysts underFischer-Tropsch Synthesis Conditions. J. Am. Chem. Soc. 2017,139,3706-3715 16. Shen,Y. R., Surface Properties Probed by Second-Harmonic and Sum-FrequencyGeneration. Nature. 1989,337,519-525 17. Somorjai, G. A.; Frei, H.; Park,J.Y., Advancing the Frontiers in Nanocatalysis,Biointerfaces, and Renewable Energy Conversion by Innovations of SurfaceTechniques. J. Am. Chem. Soc. 2009, 131,16589-16605 18. McCrea, K. R.; Somorjai, G. A.,SFG-Surface Vibrational Spectroscopy Studiesof Structure sensitivity and Insensitivity in Catalytic Reactions: Cyclohexenedehydrogenation and Ethylene Hydrogenation on Pt(111) and Pt(100) Crystal Surfaces.J.Mol. Catal. Chem. 2000,163,43-53 19. Holinga, G. J.;York, R. L.; Onorato, R. M.;Thompson,C. M.;Webb, N. E.; Yoon, A. P;Somorjai, G. A., An SFG Study of Interfacial Amino Acids at the Hydrophilic SiO2 andHydrophobic Deuterated Polystyrene Surfaces. J. Am. Chem. Soc. 2011, 133, 6243-6253 20. Tao,F.;Dag, S.;Wang, L. W.; Liu,Z.; Butcher, D. R.; Bluhm, H.; Salmeron, M.; Somorjai,G.A., Break-up of Stepped Platinum Catalyst Surfaces by High Co Coverage. Science 2010,327,850-853 21. Zhu,Z.; Melaet, G.;Axnanda,S.; Alayoglu, S.; Liu,Z.;Salmeron, M.; Somorjai, G. A.,Structure and Chemical State of the Pt(557) Surface during Hydrogen OxidationReaction Studied by in Situ Scanning Tunneling Microscopy and X-Ray PhotoelectronSpectroscopy.J. Am. Chem. Soc. 2013,135,12560-12563 ( 22. Montano,M.; Salmeron, M . ; Somorjai, G. A., STM Studies of CyclohexeneHydrogenation/Dehydrogenation and Its Poisoning by Carbon Monoxide on Pt(111). Surf. Sci. 2006,60 0 ,1809-1816 ) 23. Tao, F.; Grass, M. E.; Zhang,Y.; Butcher, D. R.;Renzas, J. R.; Liu, Z.;Chung,J.Y.; Mun, B. S.;Salmeron, M.; Somorjai,G. A.,Reaction-Driven Restructuring of Rh-Pd and Pt-Pd Core-Shell Nanoparticles. Science 2008,322,932-934 24. lyer, P. V.; Ananthanarayan, L., Enzyme Stability and Stabilization—Aqueous and Non-aqueous Environment. Proc. Biochem.2008, 43, 1019-1032 25. D'Souza, S. F., Immobilized Enzymes in Bioprocess. Current Science 1999, 77, 69-79 26. Polizzi, K. M.; Bommarius, A. S.; Broering, J. M.; Chaparro-Riggers,J. F., Stability ofBiocatalysts. Curr. Opin. Chem. Bio. 2007,11,220-225 27. Xie, H.;Wang, Z.;Kong, W.;Wang,L.; Fu, Z., A Novel Enzyme-Immobilized Flow CellUsed as End-Column Chemiluminescent Detection Interface in Open-Tubular CapillaryElectrochromatography.Analyst, 2013,138,1107-1113 28. Katchalski-Katzir, E.; Kraemer, D. M.,Eupergit C, a Carrier for Immobilization of Enzymesof Industrial Potential. J. Mol.Catal B:Enzym.2000, 10, 157-176 ( 29. Cao, L.; van Rantwijk, F.; Sheldon, R. A., Cross-Linked Enzyme Aggregates: A Simple and Effective Method for the Immobilization of Penicillin Acylase.Org. Lett. 2000,2,1361- 1364 ) 30. Shen, Q.; Yang, R.; Hua, X.; Ye, F.; Zhang, W.;Zhao, W., Gelatin-Templated BiomimeticCalcification for B-Galactosidase Immobilization. Process Biochem.2011, 46,1565-1571 31.Mitchell,S.; Perez-Ramfrez, J., Mesoporous Zeolites as Enzyme Carriers: Synthesis,Characterization, and Application in Biocatalysis. Catal. Today 2011, 168, 28-37 32. Cha, T. W.; Quo, A.; Zhu, X.Y., Enzymatic Activity on a Chip: The Critical Role of ProteinOrientation.Proteomics 2005,5,416-419 Chapter 2 Site-Selective Oxidative Coupling Reactions for the Attachment of Enzymes toGlass Surfaces through DNA Directed Immobilization Abstract Enzymes are able to maintain remarkably high selectivity towards their substrateswhile still retaining high catalytic rates. By immobilizing enzymes onto surfaces we canheterogenize these biological catalysts, making it practical to study, use, and combine themin an easily controlled system. In this work, we develop a platform that allows for the simpleand oriented immobilization of proteins through DNA directed immobilization (DDI). First,we modified a glass surface with single stranded DNA. We then site-selectively attachedthe complementary DNA strand to the N-terminus of a protein. Both DNA modificationswere carried out using an oxidative coupling strategy, and the DNA strands served as easilytunable and reversible chemical handles to hybridize the protein-DNA conjugates onto thesurface. We have used the aldolase enzyme as a model protein to conduct our studies. Wecharacterized each step of the protein immobilization process using fluorescent reportersas well as atomic force microscopy. We also conducted activity assays on the surfaces withDNA linked aldolase to validate that, despite being modified with DNA and undergoingsubsequent immobilization, the enzyme was still able to retain its catalytic activity and thesurfaces were reusable in subsequent cycles. Adapted with permission from Palla, K. S.; Hurlburt, T. H.; Buyanin, A. M.; Somorjai, G. A.;Francis, M. B., J. Am. Chem. Soc. 2017, 139,1967-1974. Copyright 2017 American ChemicalSociety 2.1.Introduction Traditionally, catalysis research has been undertaken as the three separate disciplinesinvolving homogeneous complexes, heterogeneous structures, and enzymes. As such, thetools to determine mechanistic information have largely evolved separately. In previouswork, we have successfully converted homogeneous catalysts into heterogeneous systems,merging high reaction selectivity with the advantages of catalyst recovery, ability tobe employed in continuous flow processes, and compatibility with surface-sensitivecharacterization techniques.To integrate enzymes into heterogeneous systems, there is aneed for new immobilization strategies that are site-selective, general, and inherently capableof combining multiple species into complex arrays. With the overall goal of studying thedynamics of enzyme behavior using sum frequency generation vibrational spectroscopy andother techniques suited for heterogeneous systems,we have developed an efficient surfaceattachment strategy based on DNA hybridization. An interesting feature of this approach isthe use of two different reaction modes of a family of oxidative coupling methods, allowinga unified strategy for modifying both the surface and the protein components with pendantnucleic acid groups. The utility of immobilizing proteins onto a surface spans a variety of applications,including the study of protein-protein interactions, enzyme kinetic studies, biosensors,bioanalytics, and even industrial biocatalytic processes.5-7These studies create a constant needfor effective and facile ways to assemble protein microarrays. Many protein immobilizationchemistries involve the direct attachment of proteins to surfaces through short linkers andreactive handles. Common approaches include nonspecific covalent modification of nativeamino acid side chains on the surface of a protein, such as lysine acylation with NHS esters.However, it has been found that randomly oriented proteins can exhibit reduced accessibilityof active sites and display lower activities than their ordered counterparts.7- Because an ordered display of proteins is often more favored, both covalent andnon-covalent strategies to orient proteins uniformly on surfaces have been developed.Covalent approaches have taken advantage of maleimide reactivity with thiols, nativechemical ligation,10 photochemical thiol-ene chemistry, carbohydrate moieties,12 Si-tags,13and enzymatic tags,14.15 to name a few. Representative non-covalent systems are exemplifiedby polyhistidine tag incorporation via genetic engineering to bind to Ni-NTA functionalizedsurfaces, as well as biotin-streptavidin complexation.16-18 Another non-covalent proteinimmobilization approach is through the use of DNA, taking advantage of complementarystrand hybridization. This type of DNA directed immobilization (DDI) requires that thesurface be functionalized with a short oligonucleotide and that its complementary strandbe conjugated to the target protein such that the hybridization of the two strands will leadto the controlled immobilization of the proteins under chemically mild and biocompatibleconditions. DDI has shown reliability and has been used in tandem with a variety of otherassembly processes. It has also been reported that the DDI strategy is an efficient methodto immobilize proteins because of the easily adjustable linker it provides, thereby helping toprevent protein denaturation.19-21 Previously, protein surfaces have been created with this strategy via the complexationof biotinylated antibodies and biotinylated DNA, brought together with streptavidin, thatwere then immobilized on streptavidin-biotin-DNA modified surfaces via DNA hybrdization.22Additionally, clickable functional groups that can bind to native tyrosine residues have beenused to create DNA-protein conjugates which were then immobilized on similar streptavidinbased surfaces.23 Because DNA molecules are highly stable, they can easily undergo chemicalmodification in preparation for DDI. In another example, a DNA-heme was generatedand used to reconstitute two separate heme binding proteins: apo myoglobin and apohorseradish peroxidase. These were tethered onto microplates that were coated with thecomplementary DNA strands, and it was shown that enzymatic activity of both proteinswas retained.24Even more recently, unnatural amino acid incorporation was used to insert ap-acetylphenylalanine residue into a monoclonal antibody, which was then used as a handlefor ligation with an aminoxy-functionalized single stranded DNA.25These approaches illustrateboth the benefits and the complexities involved in generating protein-DNA bioconjugates. a OH OH .NH [O] NH2 path a R R OH NH2 [O] NH path b R R Figure 2.1. DNA directed immobilization. a) Reaction pathways for oxidative coupling of ano-aminophenol to an aniline moiety and to an N-terminal proline residue. b) Schematic ofDNA directed immobilization of a site-selectively modified DNA-protein conjugate onto aglass surface displaying complementary single stranded DNA. We have previously developed several site-selective protein modification reactions,and we have shown the applicability of some of them in the synthesis of DNA surfacesand DNA-protein bioconjugates.26-34 More recently, we reported on an oxidative strategythat is able to couple an o-aminophenol (AP) to either an aniline moiety or the N-terminalamino group of peptides and proteins using potassium ferricyanide as the oxidant.35,36 Thisreaction involves the intermediacy of an iminoquinone intermediate, to which the anilineor N-terminal amine adds. Following reoxidation of the resulting aminophenol species, hydrolysis of the iminoquinone imine yields the final ketone group. Aniline addition productsprefer the tautomer shown in Figure 2.1a, path a, while additions with N-terminal prolines sitas the o-quinone species shown in Figure 2.1a,path b.Both type of products are highly stableand resist hydrolysis. Herein, we take advantage of this positional selectivity and functional group toleranceand apply it toward the development of a DDI based platform as shown in Figure 2.1b. Wefirst coupled an o-aminophenol modified DNA strand to an aniline modified glass surface.Separately, we modified our protein of interest at the N-terminus with a complementaryo-aminophenol substituted DNA strand in a single step with low concentrations of reagents.The subsequent hybridization of the surface oligo with the complementary oligo-proteinconjugate allowed for the controlled attachment of the protein to surfaces in an orientedand versatile manner. We then apply DNA hybridization based protein immobilization usingaldolase and evaluate its catalytic activity after attachment to glass slides. We also study thereusability and regenerability of these surfaces. 2.2.Results and Discussion 2.2.1. Modifying Glass Slides with Single Stranded DNA and Hybridizing toComplementary DNA Figure 2.2. MALDI-TOF analysis of DNA before (black) and after (red) aminophenolattachment. Most previous studies of DDI-based protein immobilization have used gold or coatedplastic substrates.19 For these studies we selected glass slides because of their advantages forspectroscopic and microscopic analysis.We used silanization with 3-(4-azidophenyl)-N-(3- trimethoxysilylpropyl) propanamide followed by TCEP reduction in order to derivatize glasswith aniline functional groups.2 We then synthesized the aminophenol modified strand A(AP-A), a 20 base oligomer (Figure 2.2.), and coupled it to the aniline surface in the presenceof potassium ferricyanide as an oxidizing agent (Figure 2.3a). Once the glass slides weremodified with AP-A, each surface was incubated with complementary strand, A, which hada fluorophore conjugated to its 5'end (A’*). Non-complementary AP-B was also synthesizedto be used as a negative control for the surface modification. Following hybridization andrinsing, fluorescent images were collected to confirm that the DNA mediated hybridizationbetween A and A’* was specific (Figure 2.3b). Fluorescence intensity on these slides was50-fold greater than that of the mismatched control between B and A'* (Figure 2.3c),indicating that there was only nominal non-specific binding of A'* onto the glass surface. Theprocedure used for surface DNA attachment was optimized (concentration, buffer conditions,time) to give the greatest difference in fluorescence between complementary and non-complementary strands. DNA sequences used in these studies are highlighted in Table 2.1. Figure 2.3. Modification of aniline coated glass slides with single stranded DNA. a) Schematicof an oxidative coupling reaction for single stranded DNA attachment to aniline modifiedsurfaces. b) Fluorescence studies to verify DNA strand hybridization. After attachment ofstrand A or strand B, glass slides were incubated with a fluorescently tagged DNA (A’*).Fluorescence signal was evaluated when there was sequence complementarity (left column,strands A and A’*) and when there was not (right column, strands B and A’*). c) Plot offluorescence intensities, conducted in triplicate. The fluorescence intensity on thecomplementary slides was 50-fold greater than on the non-complementary slides. Table 2.1. DNA sequences used. 2.2.2. Modifying Aldolase with A'DNA and Evaluating its Activity A fructose-bisphosphate aldolase (ALD) from rabbit muscle was chosen as a proteinof particular interest for these studies. Aldolase is a protein involved in a series of enzymeswithin the glycolytic pathway, as it catalyzes the reversible breakdown of fructose-1,6-bisphosphate (FBP) to glyceraldehyde-3-phosphate (G3P) and dihydroxyacetone phosphate(DHAP) as seen in Figure 2.4a. Because it is involved in a C-C bond breaking and (in themicroscopic reverse) bond forming reaction, it is of particular importance in industrialprocesses that can engineer the enzyme to be promiscuous and catalyze other C-C bondprocesses.It is a homotetramer with D, symmetry (PDB:6ALD). All four of the N-termini are Time (min) Figure 2.4. Aldolase modification with DNA. a) Conversion of fructose-1,6,bisphosphate intoglyceraldehyde-3-phosphate and dihydroxyacetone-phosphate by aldolase. b) Schematic ofprotein modification at the N-termini (yellow) with aminophenol modified DNA. c) Anionexchange HPLC traces of NEM caped aldolase (black) and NEM capped aldolase modified withsingle stranded DNA(pink) showing multiple modifications. d) Quantification of solutionactivity of unmodified aldolase (orange), aldolase with reactive cysteines capped with NEM(purple), and NEM capped aldolase after modification with A'DNA (green) and 5 kDa PEG(blue). Samples were analyzed in triplicate and data points were collected every two minutes.Initial rates were 1.473±0.009 uM/min for unmodified aldolase, 1.030 ±0.006 uM/min forNEM capped aldolase, 0.499±0.003 uM/min for NEM capped aldolase modified with DNA,and 0.391 ±0.002 uM/min for NEM capped aldolase modified with PEG. All assays were run at37℃ and conducted in triplicate. solvent exposed, with two N-termini in proximity to one another and the other two N-terminion the opposite face. As a result of this configuration, there are two possible ways for theprotein to be immobilized via its N-terminal positions.Fortunately, these would be expectedto display the protein with highly similar orientations. Additionally, it retains a proline residueat its N-terminus, which has a favorable propensity towards the oxidative coupling reaction.36 As the cysteine residues of aldolase are not required for catalytic activity, theywere first capped with N-ethyl-maleimide (NEM) to prevent participation in the oxidativecoupling reaction (Figure 2.5). For future studies involving enzymes that rely on free cysteinegroups, we have recently shown that 5,5'-dithio-bis-(2-nitrobenzoic acid) (DTNB) can alsobe used.38 AP-A' was synthesized and coupled to the aldolase N-terminus using potassiumferricyanide mediated oxidative coupling (Figure 2.4b). Free DNA was removed through spinconcentration, and a BCA assay was used to quantify the total protein remaining. Additionally,HPLC with an anion exchange column and tryptophan fluorescence detection was used to a) b) Figure 2.5. Modifying aldolase with N-ethyl maleimide (NEM) to cap free cyteine side chainsbefore modifying at the N-terminus with DNA. a) Chemical reaction between thiol groups oncysteine side chains and N-ethyl maleimide.b) Deconvoluted ESI-TOF mass spectra of aldolasewith and without N-ethyl maleimide capping. Unmodified aldolase has a mass of 39212 Da.MS analysis of pure aldolase presented two peaks; the parent peak at 39212 Da and ashoulderpeak at 39244 Da.This shoulder peak was also observed to get modified by NEM, asindicated by the*labels. determine the level of modification of the DNA-aldolase bioconjugate. Less than 5% of thetotal protein was unmodified with DNA, and a range of modifications from one to four DNAstrands per tetramer were seen (Figure 2.4c). Solution activity assays were carried out on aldolase, aldolase capped with NEM,and NEM capped aldolase that was modified separately with AP-A'DNA and aminophenol 5kDA polyethylene glycol (PEG) to determine how the modification itself as well as reactionconditions impacted the enzymatic activity. The 5 kDa PEG modification was chosen becauseof its comparability to the 20 base A'DNA in molecular weight while having a neutral charge.Glyceraldehyde-3-phosphate dehydrogenase (GAPDH) was paired with aldolase in the activityassays. GAPDH catalyzes the conversion of G3P to 1,3-bisphosphoglycerate in the presenceof NAD* as a cofactor. The conversion of NAD* to NADH can be monitored by the increase inabsorbance at 340 nm and can be used to quantify aldolase activity. As illustrated in Figure2.4d, NEM capped aldolase after modification with DNA retained about 48% of its enzymaticactivity (PEG modified aldolase retained 38% of its activity). This difference could be attributedto the DNA (or PEG) sterically hindering accessibility of the active site. Aldolase capped with DTNB was modified at the N-terminus with a small moleculeaminophenol (2-amino-p-cresol) (Figure 2.6a). After removal of the cysteine cap, thebioconjugate was analyzed by ESI-TOF mass spectrometry and showed high yields of a singlep-aminocresol addition (Figure 2.6b). A trypsin digestion of this sample confirmed that themodification was occurring at the N-terminal peptide fragment (Figures 2.7 and 2.8) andsubsequent MS/MS analysis confirmed that the oxidative coupling mediated modification wasoccurring site-selectively at the N-terminal proline residue of aldolase (Figure 2.9). Figure 2.6. Modifying DTNB-aldolase at the N-terminus a) Oxidative couping reaction withthe N terminal proline residue of aldoase and p-aminocresol in the presence of potassiumferricyanide.b) Deconvoluted LC-MS spectra of aldolase,DTNB-aldolase, DTNB-aldolase afteroxidative couping, and DTNB-aldolase after oxidative coupling and subsequent TCEPtreatment to remove DTNB. Only a single modification with p-aminocresol is observed.Unmodified aldolase has a mass of 39212 Da. a) PHSHPALTPEQKKELSDIAHRIVAPGKGILAADESTGSIAKRLQSIGTENTEENRRFYRQLLTADDRVNPCIGGVILFHETLYQKADDGRPFPQVIKSKGGVVGIKVDKGVVPLAGTNGETTTQGLDGLSERCAQYKKDGADFAKWRCVLKIGEHTPSALAIMENANVLARYASICQQNGIVPIVEPEILPDGDHDLKRCQYVTEKVLAAVYKALSDHHILEGTLLKPNMVTPGHACTQKYSHEEIAMATVTALRRTVPPAVTGVTFLSGGQSEEEASINLNAINKCPLLKPWALTFSYGRALQASALKAWGGKKENLKAAQEEYVKRALANSLACQGKYTPSCQAGAAASESLFISNHAY b) 462.275 Modificationsobserved Observed[M+H]+ 1341.6911068.581 Expected [M+H] 1341.691 PHSHPALTPEQKKELSDIAHRIVAPGK GILAADESTGSIAK RLQSIGTENTEENRR FYR QLLLTADDRVNPCIGGVILFHETLYQKADDGRPFPQVIKSKGGVGIK VDKGVPLAGTNGETTTQGLDGLSERCAQYKK DGADFAK WR CVLK IGEHTPSALAIMENANVLAR YASICQQNGIVPIVEPEILPDGDHDLKRCQYVTEK VLAAVYK ALSDHHIYLEGTLLKPNMVTPGHACTQKYSHEEIAMATVTALRR TVPPAVTGVTFLSGGQSEEEASINLNAINKCPLLKPWALTFSYGR ALQASALK AWGGK KENLK AAQEEYVK RALANSLACQGK YTPSGQAGAAASESLFISNHAY C13(Carbamidomethyl) C1(Carbamidomethyl) C5(Carbamidomethyl)C1(Carbamidomethyl) C25(Carbamidomethyl) C1(Carbamidomethyl) C9(Carbamidomethyl) Figure 2.7. Tryptic digest results of unmodified aldolase. a) Amino acid sequence of aldolasefrom rabbit muscle b) Peptide fragments accounting for the full aldolase sequencearetabulated. In italics are the fragments that were not observed in the analysis. Only the longest,unique fragments observed are shown. A 93.1% sequence coverage was observed. During thedigestion protocol, cysteines were capped with iodoacetamide, as observed by thecarbamidomethyl modifications. 1288.679 C4(Carbamidomethyl) C1(Carbamidomethyl) 2107.096 1345.69914 Observed [M+H]+ 1461.7131341.6911068.5811898.0591802.912一 Expected [M+H]+ 1808.952801.482 -- Figure 2.8. Tryptic digest results of aldolase modified with 2-amino-p-aminocresol (+120).Peptide fragments accounting for the full aldolase sequence are tabulated. N-terminallymodified aldolase used in the tryptic digest was first evaluated by intact MS, as seen in Figure2.7b. In red is the N-terminal tryptic peptide, showing an expected mass addition of 120 Da. Initalics are the fragments that were not observed in the analysis. Only the longest, uniquefragments observed are shown. A 94.8% sequence coverage was observed. During thedigestion protocol, cysteines were capped with iodoacetamide, as observed by thecarbamidomethyl modifications. m/z Figure 2.9. MS/MS analysis of the N-terminal tryptic peptide of aldolase. They ions areshown in blue, the bions are shown in green (with neutral losses of water). The analysis isconsistent with the expected modification of +120 Da at the N-terminal proline residue, asrepresented by the * in the peptidesequence. 2.2.3. Evaluating the Activity of Surface Immobilized Aldolase Figure 2.10. Testing the activity of DNA-aldolase conjugates immobilized after hybridizationto the glass surface. Activity assay of A'-aldolase exposed to a glass surface displaying thecomplementary DNA strand (A, pink), the non-complementary DNA strand (B, blue), and freein solution at a concentration of 20 nM (green). All assays were run at 37C and conducted intriplicate. The A'-aldolase bioconjugate was incubated on A-modified (complementary) surfacesto allow for DNA directed immobilization. Enzymatic activity was subsequently evaluatedand the results of these assays are shown in Figure 2.10. Because hybridization to the surfaceis an internal purification tool, unmodified aldolase did not need to be purified away fromDNA modified aldolase. In order to evaluate any non-specific binding that was occurring,a control was included where the DNA-protein conjugate was incubated on B-modified(non-complementary) surfaces. As compared to the control, we observed that when A'-aldolase was incubated on the surface displaying its complementary strand, aldolase activitywas significant, and background activity was minimal. This confirmed that aldolase wassuccessfully immobilized with very low levels of non-specific adsorption and that the surfaceimmobilization itself did not destroy its quaternary structure. An additional control wasincluded with 20 nM free A'-aldolase in solution to ensure that the assay was functioning as a) b) # Surface DNA Incubation 1:Protein Incubation 2: Fluorescently tagged DNA 1 5'-TCA TAC GAC TCA CTC TAG GG-3'5'-AlexaFluor488 TCA TAC GAC TCA CTC TAG GG-3' 5'-AGT GAC AGC TGG ATC GTT AC-3' 5'-AlexaFluor488 ACT GAT GGT AAT CTG CAC CT-3' A 53.5 A'-ALD A* 2 A - A** 3 A ALD A'* 4 A A'-ALD C* 5 A 一 C* 6 A ALD C** 7 B A'-ALD A'* Figure 2.11. Using fluorescent DNA to visualize protein immobilization. To verify theattachment of aldolase through DNA directed immobilization, glass slides were modified witheither strand A or B. Then, surfaces were incubated with either A'-aldolase (A'-ALD) or justaldolase (ALD). Following the first incubation, a second incubation was carried out with eithercomplementary (A'*) or non-complementary DNA that was fluorescently labelled withAlexaFluor488 (C’*). Two replicates are shown for each set of experimental conditions.Incubation 2 allowed for backfilling of sites not occupied by A'-ALD, as seen in sample 1.Samples 2 and 3 were positive controls and 4-7 were negative controls. Because the fluores-cence in sample 1 is lower than sample 2, it indicates that hybridization of A'-ALD occupiedsites on the A surface and thus led to fewer sites being accessible for hybridization duringincubation step 2. Additionally, sample 3 confirms that there is little, if any,non-specificbinding to the surface, or at the very least it does not prevent DNA hybridization fromoccurring. b) # Surface DNA Incubationsample 1 A A'-ALD* 2 A A'* 3 B A'-ALD* c) Figure 2.12. Using a fluorescent aldolase DNA conjugate to visualize protein immobilization.Slides modified with single stranded DNA were modified with fluorophore (Oregon Green488) labeled aldolase (A'-ALD*). Slides modified with A showed a fluorescence increase due tocomplementary strand hybridization (1) and slides modified with B did not show a significantincrease due to non-complementarity between the seqences (2). As a positive control,complementary DNA with AlexaFluor 488 conjugated onto it (A’*) was hybridized to slideswith strand A. The fluorescence increase observed in slide 1 over slide 3 indicated DNAdirected attachment of aldolase onto the glass surface. Fluorescence data were quantifiedusing ImageJ software, and the data plotted are the average of two replicates. expected. This amount of protein represents the theoretical maximum amount that can beon the surface, as determined by dividing the total area of the experimental region by the"footprint"each protein would occupy. Fluorescence studies were also conducted to visualizeeach step qualitatively, and are depicted in Figures 2.11 and 2.12. 2.2.4 Reusing the Protein Immobilized Surfaces Given the successful immobilization of aldolase onto the glass slides, we wereinterested in investigating the reusability of the surfaces. We ran each cycle for 15 h, rinsedreagents from the wells and repeated the assay using the same surface. These data are shownin Figure 2.13a. It can be seen that, while we do see a drop in activity in each subsequentcycle, about half of the activity is maintained from one run to the next. We hypothesizedthat because the assay was conducted at 37℃, the temperature could be attributing toinactivation of the protein over time. To test this, we incubated unmodified aldolase insolution at 37 ℃ for lengths of time equivalent to each iterative cycle, and we observedthat the drop in activity was in fact a result of the protein being exposed to the elevatedtemperatures for extended periods of time (Figure 2.13b). The immobilized aldolase was shown to have a smaller decrease in activity over three cycles than the free DNA-aldolase insolution (Figure 2.13c). Figure 2.13. Testing for reusability of aldolase modifed surfaces. a) Activity assay of A'-aldo-lase immobilized on a glass surface with the complementary DNA strand, A (pink), with thenon-complementary DNA strand, B(blue), and free in solution at a concentration of 20 nM(green) over three cycles. Between each cycle, glass slides were rinsed and fresh reactantswere added.b) Testing effect of elevated temperature for extended time on aldolase activity.A 96-well plate was loaded with three sets of an aldolase activity assay solution. The first setwas initiated by the addition of FBP and the activity was measured over 15 h at 37℃(black).The 96-well plate was stored at room temperature for 9 h and then the second setof aldolaseassays were initiated by the addition of FBP. The activity was measured over 15 h at 37℃(red).This was repeated for the third set (blue). c) Relative rates of A'-aldolase immobilized on aglass surface with the complementary DNA strand (pink) and free in solution (green) over thecourse of three cycles. All samples were run in triplicate, and data shown are the averagesobserved. All trials were run at 37 C. 2.2.5. Surface Characterization with Atomic Force Microscopy Atomic Force Microscopy (AFM) studies were carried out at the various stages of thesurface modification process on mica surfaces. Mica was chosen due to its atomically flatnature.35 This allowed for verification that any changes to the surface morphology were duesolely to the chemistries we applied and not the underlying morphology of the substrate.Additionally, free surface silanol groups on mica allowed for identical surface chemistryto that used on the glass slides. AFM images were taken of surfaces functionalized with a)aniline, b) single stranded DNA (sequence A), c) double stranded DNA (sequence A'hybridizedto sequence A), and d) immobilized aldolase via DNA hybridization (A'-aldolase hybridized toA) (Figure 2.14). It was seen that the aniline functionalized surface was uniformly flat, showingminimal variation in height over the observed region. Upon the attachment of single strandedDNA, the surface became rougher, showing a high density of small features of increasedheight. These features became larger in area upon addition of the complementary strand ofDNA. The addition of the A'-aldolase conjugate to a surface displaying single stranded A DNAcontinued the trend of increasing morphological heterogeneity. These images verified thatthe surface was becoming more complex at each stage of the modification process, and thusthe morphologies are changing in a manner consistent with what we expected to see basedon the fluorescence imaging studies. Figure 2.14. Height AFM images taken in non-contact mode of a)aniline modified mica; b)mica functionalized with single-stranded DNA; c) complementary DNA hybridized to micafunctionalized with single-stranded DNA; and d) complementary DNA-aldolase conjugatehybridized to mica functionalized with single-stranded DNA. Scale bars are 50 nm. 2.2.6. Hybridization Temperature Modulates Immobilization Levels Previous reports have suggested that levels of modification on the surface play asignificant role in activity levels, and that higher surface coverage does not always correlateto higher activity due to the effects of over-crowding and blockage of enzyme active sites.40Given this information, having a method to tune the level of modification in either directioncould prove useful for tailoring these surfaces for different proteins. For all of the experimentsdescribed thus far, hybridization between DNA-aldolase and DNA modified glass surfaces wascarried out at room temperature.Interestingly, when hybridization temperatures were varied(4, 23 and 37℃), it was observed that the increasing temperatures resulted in increasinglevels of protein immobilization. This was first determined through backfilling of open ssDNAsites (at 23℃) after aldolase had been immobilized, where an expected trend of decreasingfluorescence with increasing annealing temperature was observed when the averagefluorescence was quantified for the total surface area of the glass slides (Figure 2.15a,b).We hypothesize that the closer the hybridization temperature is to the melting temperatureof the DNA strands (52.6℃), the more efficient the thermal annealing becomes because a) Figure 2.15. Impact of annealing temperature on surface hybridization levels. a) Fluorescenceimages of glass slides modified with A, then incubated with A'-aldolase at varyingtemperatures. Subsequent room temperature incubation with fluorescently tagged DNA, A*,allowed for backfilling of open surface DNA sites.b) Quantification of fluorescent slides. Lowerfluorescence corresponds to greater hybridization of the A'-aldolase conjugate.c) Initial ratesof A'-aldolase activity when immobilized on surfaces with strand A (complementary) or strandB (non-complementary) at varying incubation temperatures, conducted in triplicate. the strands can melt and rehybridize to reach optimal coverage. At a lower temperaturethe strands are more restricted to the first location of hybridization, leading to lower levelsof surface coverage. We also observed an increase in aldolase activity at the higher levelsof modification, and could use this approach to refine our surfaces further(Figure 2.15c).Additionally, in the future, we envision using temperature variations to determine the levels atwhich we can saturate surfaces with enzymes without impeding their catalytic activity, in aneffort to obtain surfaces with maximum efficiency.41 2.2.7. Regenerating and Recycling the Single Stranded DNA Modified Surfaces Figure 2.16. Testing the activity of regenerated DNA-aldolase conjugates immobilized onglass surfaces.a) Schematic of DNA strand displacement mediated surface regeneration.b)Initial rates of the activity of Ax'-aldolase exposed to a glass surface displaying thenon-complementary DNA strand (strand B), and the complementary DNA strand (strand A)were obtained. Then, DNA strand displacement was carried out to remove the Ax'-aldolaseconjugate from the glass surface. The regenerated surfaces were then incubated with a newbatch of Ax'-aldolase. Initial rates of activity for both of these surfaces were obtained. Allassays were run at 37 ℃ and conducted in triplicate. A particularly noteworthy advantage of using DDI to orient proteins onto solidsurfaces is that the DNA strands can be separated in order to remove the DNA-aldolaseconjugate and regenerate the surface bearing single stranded DNA. This allows for storageof the slides for an extended period of time due to the stability of DNA, and ultimately theability to reuse them in future assays. We used DNA strand displacement to remove theDNA-aldolase conjugate and then rehybridized a fresh batch of DNA-aldolase. In this assay,we conjugated aldolase onto 25 base strand Ax, where 20 bases were complementary toA, but the remaining 5 served as an overhang. Ax'-aldolase was immobilized to glass slidesdisplaying A. Then, Ax, a 25 base strand with complete complementarity to Ax, was used todisplace Ax'-aldolase from the surface. This surface was then reused, and a fresh batch ofAx'-aldolase was immobilized (Figure 2.16a). Activity assays of the surfaces at each stage were a) 54.4 Figure 2.17. Using fluorescent DNA to visualize protein immobilization and regeneration. a)Fluorescence images of various modified glass slides backfilled with DNA labelled withAlexaFluor488 (Ax'*). Slides were modified with: the non-complementary DNA strand (B, 1);the complementary DNA strand (A, 2); the complementary DNA strand (A) and thenincubated with Ax'-aldolase (Ax'-ALD, 3); strand A, then incubated with Ax'-ALD, and thenincubated with the complement to Ax'(Ax) to dehybridize the DNA-enzyme conjugate off thesurface (4); strand A, then incubated with Ax'-ALD, then incubated with Ax, and reincubatedwith Ax'-ALD to test for the regenerability of the ssDNA modified glass slides (5).b) Quantification of the fluorescence using ImageJ software. A greater level of fluorescencecorresponds to more open DNA sites for the fluorescently labelled DNA to hybridize to. Each experimental condition was run in triplicate. c) DNA sequences used in this experiment. carried out, and as seen in Figure 2.16b, the activity of aldolase immobilized on fresh glassslides remained consistent with the activity observed on aldolase that was immobilized on aregenerated glass slide. Fluorescence studies also corroborated these trends (Figure 2.17). The ability to recycle the DNA modified glass slides will be of particular use for slideswith more complex DNA patterns. It should be possible to pattern the glass with multipledifferent DNA strands with spatial control, creating an ordered array that would selectivelybind multiple enzymes, allowing for the catalysis of a complex series of reactions. 2.3. Conclusions In this work, we have prepared a single class of aminophenol substituted DNA strandsand used them to modify both glass surfaces and protein N-termini. By piecing together eachcomponent, we have developed a step-by-step platform for producing oriented displays ofproteins on glass surfaces. We have qualitatively verified our chemistry at each stage throughfluorescence studies and AFM, and have also demonstrated its utility by testing the enzymaticactivity of surface immobilized aldolase. This allows for the oriented immobilization ofproteins with an adjustable spacer, where the enzyme can be reused in multiple cycles.Additionally,through DNA strand displacement, we have successfully regenerated the singlestranded DNA bearing glass surfaces, and we have shown them to be reusable in subsequenthybridization assays.The chemistry involved in attaching the first strand of DNA to thesurface is convenient, quick, stable, and works on inexpensive glass slides. The conjugation ofthe complementary DNA strands to proteins is biocompatible, quick, and only requires lowconcentrations of the coupling partners. In addition, because the native N-terminal amineis being targeted as the attachment site, it can be applied to a large scope of proteins withminimal genetic engineering being required,this could include thermostable enzymes whichwould give longer lifetimes. Because we have used DNA hybridization as our mode of protein attachment, theeasily accessible diversity of DNA strands offer a wide range of attachment handles, both interms of linker length and rigidity. Additionally, the generalizable nature of this DDI methodshould facilitate the immobilization of a variety of proteins. Given all of these advantagesprovided by this approach, we seek to enhance this platform further in the future. Taking advantage of the transparent nature of the glass surfaces used in thesestudies, we are also seeking to characterize these surfaces using alternative spectroscopictechniques, such as Sum Frequency Generation and X-Ray Photoelectron Spectroscopy, togain information about the orientation and coverage of the protein.4,4243 2.4. Materials and Methods 2.4.1. General Procedures and Materials Unless otherwise noted, the chemicals and solvents used were of analytical grade andwere used as received from commercial sources. Water (dd-H,O) used as a reaction solvent and in biological procedures was deionized using a Barnstead NANOpure purification system(ThermoFisher, Waltham,MA). Aldolase from rabbit muscle, glyceraldehyde-3-phosphatedehydrogenase from rabbit muscle,NAD+, NADH and Fructose-1,6-bisphosphate wasobtained from Aldrich (St. Louis, MO). Single stranded 5'aminated or fluorophore labeled DNAmolecules were purchased from Integrated DNA Technologies. Absorbance measurementsof samples in 24 and 96-well plates were obtained on a Tecan Infinite 200 Pro plate reader.Fluorescence images of glass slides were taken on a Typhoon 9410 variable mode imager(Amersham Biosciences). 2.4.2. Instrumentation and Sample Analysis NMR1H spectra were measured with a Bruker AVQ-400 (400 MHz, 100 MHz) spectrometer. Mass Spectrometry of DNA strands Matrix assisted laser desorption-ionization time-of-flight mass spectrometry (MALDI-TOF MS) was performed on a Voyager-DE system (PerSeptive Biosystems, USA) and data wereanalyzed using Data Explorer software. Oligonucleotide samples were co-crystallized using3-hydroxypicolinic acid: ammonium citrate solution (9:1) in 1:1 acetonitrile (MeCN) to H,O. Atomic Force Microscopy The Agilent 5500 system (Keysight Technologies Inc., Santa Rose, CA, USA) was used forAFM high resolution imaging of the surface modification on mica.Non-contact AFM imageswere obtained under dry nitrogen conditions (<1%RH) using Tap150AI-G probes (InnovativeSolutions Bulgaria Ltd.,Sofia, Bulgaria) with a nominal resonant frequency value of 150 kHz.Freshly cleaved muscovite mica,V1 quality (Electron Microscopy Sciences, Hatfield, PA, USA)was used as AFM substrates for surface modification. The AFM images were analyzed usingGwyddion SPM data analysis software. Full Length Protein Mass Spectrometry Proteins and protein conjugates were analyzed on an Agilent 6224 Time-of-Flight(TOF) mass spectrometer with a dual electrospray source connected in-line with an Agilent1200 series HPLC (Agilent Technologies,USA). Chromatography was performed usinga Proswift RP-4H (Thermo Scientific, USA) column with a H,O/MeCN gradient mobilephase containing 0.1% formic acid. Mass spectra of proteins and protein conjugates weredeconvoluted with the MassHunter Qualitative Analysis Suite B.05 (Agilent Technologies,USA). Liquid Chromatography/Tandem Mass Spectrometry. High-resolution electrospray ionization (ESI) and liquid chromatography with tandemmass spectrometry detection (LC-MS/MS) mass spectra were obtained at the UC BerkeleyQB3/Chemistry Mass Spectrometry Facility. Trypsin-digested protein samples were analyzed using a Thermo Dionex UltiMate3000RSLCnano liquid chromatograph that was connected in-line with an LTQ-Orbitrap-XL massspectrometer equipped with a nanoelectrospray ionization (nanoESl) source (Thermo FisherScientific, Waltham, MA). The LC was equipped with a C18 analytical column (Acclaim°PepMap RSLC, 150 mm lengthx0.075 mm inner diameter, 2 um particles, 100 A pores,Thermo) and a 1 uL sample loop. Acetonitrile, formic acid (Fisher Optima grade, 99.9%), andwater purified to a resistivity of 18.2 MQ.cm (at 25℃) using a Milli-Q Gradient ultrapure waterpurification system (Millipore, Billerica, MA) were used to prepare mobile phase solvents.Solvent A was 99.9% water/0.1% formic acid and solvent B was 99.9% acetonitrile/0.1% formicacid (v/v). The elution program consisted of isocratic flow at 2% B for 4 min, a linear gradientto 30% B over 38 min, isocratic flow at 95% B for 6 min, and isocratic flow at 2% B for 12 min,at a flow rate of 300 nL/min. Full-scan mass spectra were acquired in the positive ion modeover the range m/z =350 to 1600 using the Orbitrap mass analyzer, in profile format, witha mass resolution setting of 60,000 (at m/z =400, measured at full width at half-maximumpeak height, FWHM). In the data-dependent mode, the eight most intense ions exceedingan intensity threshold of 20,000 counts were selected from each full-scan mass spectrumfor tandem mass spectrometry (MS/MS) analysis using collision-induced dissociation (CID).Data acquisition and analysis were performed using Xcalibur (version 2.0.7) and ProteomeDiscoverer software (version 1.3, Thermo), respectively. Peptide identifications were validatedby manual inspection of MS/MS spectra, i.e., to check for the presence of y-type and b-typefragment ions that identify the peptide sequences.4 2.4.3. Preparation of Aniline Functionalized Glass Slides Synthesis of 3-(4-azidophenyl)-N-(3-trimethoxysilylpropyl) Propanamide (PhenylazideSilane) Phenylazide silane was synthesized following a previously pubished protocol.32 Briefly,to a solution of 3-(4-azidophenyl) propionic acid (574 mg, 3.0 mmol) in 90 mL of anhydrousTHF under positive nitrogen pressure were added DIPEA (0.7 mL, 7.5 mmol, excess) andpentafluorphenyl trifluoroacetate (0.64 mL, 3.75 mmol), which was added slowly over 20 min,resulting in the formation of dense, white fumes. The reaction was stirred for 2 h at RT. To thissolution was added 3-aminopropyl trimethoxysilane (0.57 mL, 3.3 mmol), and the resultingsolution was stirred under nitrogen at RT for 18 h. The solvent was then removed using arotary evaporator. After purification by flash chromatography (100% EtOAc), a light yellow oilwas obtained, and confirmed by NMR. Modification of Glass Slides with 3-(4-azidophenyl)-N-(3-trimethoxysilylpropyl)Propanamide Circular glass slides (Fisher Scientific, 15 mm diameter, 0.17-0.25 mm thick) weresonicated (Cole-Parmer Ultrasonic Cleaner 8890-R-MTH) for 2 min in acetone and isopropanolconsecutively, then immersed in Nanopure water. The slides were dried with N, and thencleaned with oxygen plasma (Plasma Equipment Technical Services, Inc, PETS reactive ionetcher, RIE-1) at 100 W (~0.2 Torr) for 5 min. Following plasma cleaning, the slides wereimmersed in a solution of 25 mM 3-(4-azidophenyl)-N-(3-trimethoxysilylpropyl) propanamide in methanol containing 1% v/v water and 148 mM acetic acid. The slides were incubated inthis solution at RT for 2 h with stirring, after which they were rinsed in a solution of 148 mMacetic acid in methanol for 2 minutes. The slides were then rinsed with pure methanol, andfinally dried with a stream of N,. After drying, the slides were cured in an oven at 110℃ for aminimum of 12 h to promote covalent modification of the glass surface. These phenylazidecoated glass slides were stored in the dark at RT in a dessicator until the azide groups werereduced to the anilines, as described below. The silanization solution could be reused aminimum of six times with no change in performance if stored at-20℃ between uses. Reduction of Phenylazide Functionalized Glass Slides to Aniline Functionalized GlassSlides Phenylazide modified slides were submerged in a solution of 50 mM TCEP in 200mM sodium phosphate buffer at pH 7.5 and incubated at RT with stirring for 30 min. Afterreduction, the slides were rinsed in Nanopure water and dried with a stream of N,. The anilinedisplaying glass slides were stored at RT in a desiccator until use. 2.4.4. Synthesis of Aminophenol-DNA Amine-modified DNA was dissolved to 2.5 mM.The reaction conditions describe thegeneralized procedure for the modification of amine functionalized DNA. [RepresentativeDNA strand A:5'/5AmMC6/ CCC TAG AGT GAG TCG TAT GA-3'(5AmMC6=6-aminohexylphosphate)]. To a solution of 125 uL of 100 mM pH8 phosphate buffer was added 125 uL ofa 2.5 mM amine DNA solution (0.31 umol). To this were added 150 pL of DMF and 100 uL ofa ~500 mM solution of nitrophenol-NHS (~50 umol) in DMSO. 3(4-hydroxy-3-nitrophenyl)propionic acid NHS ester (nitrophenol-NHS) was prepared following a previously publishedprotocol.36 The solution was shaken for at least 4 h. This solution was added to a NAP-5column (GE Healthcare), equilibrated and eluted with nanopure water. To the resultingsolution was added 53 uL of 200 mM Na,S,O to reduce the nitrophenol to the desiredaminophenol. The Na,S,O was stored in a dessicator at RT, and a 200 mM stock solution wasprepared fresh in 0.2 M phosphate buffer, pH 6.5 before addition. The solution was shakenfor at least 20 minutes before being directly loaded onto a NAP-10 column, and the elutionprocess was repeated. The eluent was lyophilized, yielding~1.0 mg of a white solid (50%). TheDNA was prepared via C-18 ziptip for MADLI-TOF analysis and modification was confirmed.Aminophenol-DNA stock solutions were prepared at 1 mM in water and stored at-20℃ forfuture use. 2.4.5. Patterning Single Stranded DNA on Aniline Functionalized Slides Using PotassiumFerricyanide Mediated Oxidative Coupling Aniline functionalized 15 mm circular glass slides were modified with ssDNA. A 4.5 uLdrop of 50 uM aminophenol-modified DNA, 1 mMK Fe(CN),and 250 mM NaCl in 10 mM pH6.5 phosphate buffer was placed on the center of the aniline glass slide. Another unmodifiedglass slide was placed on top of the drop causing the DNA solution to spread over the slide in a sandwich. Slides were incubated in the dark at RT for 1 h. Then, slides were dipped in waterand the unmodified glass slides were removed from the DNA-modified glass. DNA-modifiedglass slides were rinsed in 0.4% SDS and then 10 mM pH 6.5 phosphate buffered saline (PBS)each at RT for 5 min with stirring. Slides were rinsed in Nanopure water and dried with astream of N,. The single stranded DNA displaying glass slides were stored at RT in a desiccatoruntil use. 2.4.6. Annealing of Complementary DNA Strands on Single Stranded DNA ModifiedGlass Slides Glass slides (15 mm in diameter) coated with ssDNA were incubated with thecomplementary strand for hybridization. PDMS wells were used to form a well on top of theglass slides, and 200 uL of 0.05 uM DNA in 5x SSC+0.1% Tween 20 was added to the well,justenoughto cover the top of the slide. Slides were incubated for 1h in humidifying conditionson an orbital shaker at RT. Following incubation, the PDMS wells were removed and the glassslides were rinsed in 5x SSC+0.1% Tween 20 three times for 1 min and then in 1x SSC + 0.1%Tween 20 two times for 10 min. Following the rinses, glass slides were rinsed in water, driedwith nitrogen and stored for subsequent use and analysis. Slides with fluorescent DNA strandswere analyzed using a Typhoon 9410 variable mode imager. Controls involved DNA strandmismatches chosen such that hybridization should not occur. (20X SSC buffer: 0.3 M sodiumcitrate dihydrate, 3 M NaCl, pH7.0) 2.4.7. Capping Free Cysteines on Aldolase with N-ethylMaleimide Free cysteines were capped from potential modification during subsequent oxidativecoupling steps by reaction with N-ethyl maleimide (NEM). To a solution of aldolase from rabbitmuscle (100 uL of a 118 uM solution in 100 mM pH 7.0 phosphate buffer) was added NEM (5uL of a 100 mM solution in DMSO) and 95 uL of 100 mM pH7.0 phosphate buffer. The reactionmixture was incubated at RT for 3 h and then the excess NEM was removed by repeated (6times) centrifugal filtration against a 30 kDa MWCO membrane. 2.4.8. Synthesis of DNA-Aldolase Bioconjugate To the aldolase (20 uM) in 10 mM phosphate buffer, pH 7.5 was added 5 equiv. of theo-aminophenol modified DNA (100 uM). The solution was briefly vortexed and then 10 equiv.(relative to the o-aminophenol) of K,Fe(CN) (as a 10 mM stock solution in water) was added.After 30 min, the reaction was purified by repeated (>12 times) centrifugal filtration against a30 kDa MWCO membrane (Millipore), allowing for purification of aldolase and aldolase-DNAconjugate from free DNA. Modification was monitored by a combination of SDS-PAGE and aBCA assay (kit purchased from Thermo Scientific). 2.4.9. Synthesis of Fluorescent DNA-Aldolase Conjugate To aldolase-DNA conjugate (15 uM based on DNA concentration) in 100 mM carbonatebuffer, pH 10.0 was added 25 equiv. of commercially purchased Oregon Green NHS ester. Thissolution was vortexed for 1 h. The reaction was purified by repeated (>6 times) centrifugalfiltration against a 30 kDa MWCO membrane (Millipore) into 25 mM phosphate buffer, pH 8.5,allowing for purification of fluorescent aldolase-DNA conjugate from free dye. 2.4.10. Characterization of DNA-Aldolase Conjugate For protein analysis, high performance liquid chromatography (HPLC) was carried outon an Agilent Technologies 1260 Infinity LC system with an anion exchange column (AgilentBio WAX, NP 1.7, 4.6x50 mm). Solvents used were: Solvent A: 20 mM bis-trispropane, pH 6.9;Solvent B:20 mM bis-trispropane, 2M NaCl, pH 6.9. Samples were injected and then solventmixture was increased from 0% B to 65% B over 30 min,then back to 0% B over 0.1 min, andheld at 0% B for 12 min to re-equilibrate.Column held at 37℃. Fluorescence detection wasused with 290 nm excitation and 340 nm emission. Modification levels were calculated bydividing the peak area of unmodified aldolase by the sum of the modified and unmodifiedaldolase peak area. Additionally, sodium dodecyl sulfate-polyacrylamide gel electrophoresis (SDS-PAGE) was carried out on a Mini Gel Tank apparatus from Life Technologies following themanufacturer’s protocols.MOPS buffer purchased from Life Technologies was used as theelectrode buffer. All protein electrophoresis samples were heated for at least 15 minutesat 100℃ in the presence of 1,4-dithiothreitol (DTT) to ensure reduction of any disulfidebonds.NuPAGE Bis-Tris Mini Gels (12%) were run for 50 min at 200 V to allow good resolutionof bands.Commercially available markers (Bio Rad) were applied to at least one lane ofeach gel for assignment of apparent molecular masses.Visualization of protein bands wasaccomplished by staining with Coomassie Brilliant Blue R-250. Gel imaging was performedon a Gel Doc EZTM Imager (Bio Rad). Image Lab software was used to determine the level ofmodification by optical densitometry. Once the level of modification was determined, a BCA assay was run following themanufacturer's protocols to determine the total protein concentration of the stock solution. 2.4.11. Activity Assay of Aldolase in Solution Activities of aldolase, unmodified and modified, were meaured in solution in a 96-well plate. Each well had aldolase, NAD+, GAPDH,and FBP added to it such that the finalconcentrations were 20 nM aldolase, 1 mM NAD+, 1.35 uM GAPDH, and 100 uM FBP in 250uL total reaction volume of the activity assay buffer (20 mM potassium phosphate, 10 mMpotassium pyrophosphate,3 uM dithiothreitol (DTT) pH 8.5). Prior to adding the FBP, the platewas equilibrated to 37℃. After the addition of FBP, the absorbance at 340 nm was measuredevery 2 min for 5 h while holding the temperature at 37℃ (Tecan Infinite 200 Pro platereader). Samples were run in triplicate. 2.4.12.Immobilization of DNA-Aldolase onto Glass Surfaces and Analysis of Activity Glass slides (15mm in diameter) coated with ssDNA (strands A and B) were loadedin a 24 well plate. These slides were incubated with DNA-aldolase conjugate (strand A') forhybridization. PDMS wells were used to form a well on top of the glass slides while in the24-well plate, and 200 uL of 0.025 uM conjugate (based on DNA concentration) in 5x SSC +0.1% Tween 20 was added to the well, just enough to cover the top of the slide. Slides wereincubated for 1 h in humidifying conditions on an orbital shaker at RT (unless otherwisenoted).Following incubation, 2 mL of 5x SSC+0.1% Tween 20 were added to the wells andthe PDMS wells were removed. The glass slides were rinsed in 5x SSC+0.1% Tween 20 viarepeated pipetting and then the plate was shaken twice for ten minutes with the wells filledwith 2 mL of 1x SSC +0.1% Tween 20. At this point, the PDMS wells were removed from theglass slides, but the slides remained immersed in solution within the 24-well plate. After rinsing with SSC, the buffer was exchanged into the activity assay buffer (20 mMpotassium phosphate, 10 mM potassium pyrophosphate, 3 uM dithiothreitol (DTT) pH 8.5).Each well had NAD+,GAPDH,and FBP added to it such that the final concentrations were 1mM NAD+, 1.35 uM GAPDH, and 100 uM FBP in 500 uL total volume. Prior to adding the FBP,the plate was equilibrated to 37 ℃. A positive control was also run with the addition of 20 nMDNA-aldolase conjugate (strand A’) in solution with wells containing a glass slide that hadthe non-complementary DNA strand attached to it. Immediately after the addition of FBP, theabsorbance at 340 nm was measured every 5 min for 16 h while holding the temperature at37℃ (Tecan Infinite 200 Pro plate reader). A standard curve with NADH was also prepared onthe same plate, in concentrations ranging from 0-100 uM. All samples were run in triplicate. 2.4.13. Reusing Surfaces with Immobilized Aldolase After running the activity assay, the 24-well plate was removed from the plate readerand stored at 4C until further use (~6 h). The used wells had 2 mL of fresh activity assaybuffer added to them and then 2 mL were drawn out, using a pipet. This was repeated at leasttwo more times, so that the wells were rinsed without allowing the slides to dry out. Afterrinsing, each well had NAD+, GAPDH,and FBP added to it such that the final concentrationswere 1 mM NAD+, 1.35 uM GAPDH,and 100 uM FBP in 500 uL total volume. Prior to addingthe FBP, the plate was heated to 37℃. After the addition of FBP, the absorbance at 340 nmwas measured every 5 min for 16 h while holding the plate at 37 C (Tecan Infinite 200 Proplate reader). All samples were run in triplicate. 2.4.14. Regenerating Surfaces with Immobilized Aldolase Glass slides displaying strand A were modified with DNA-aldolase (strand Ax') andwere tested for activity in a 24-well plate assay, as described above. Each well had 1 mL of 25uM complementary DNA (strand Ax) in 5x SSC +0.1% Tween 20 added to it to dehybridize theDNA-aldolase from the surface. Slides were incubated for 1 h in humidifying conditions on anorbital shaker at 37℃. Following incubation, 2 mL of 5x SSC +0.1% Tween 20 were added tothe wells. The glass slides were rinsed in 5x SSC + 0.1% Tween 20 via repeated pipetting and then the plate was shaken twice for ten minutes with the wells filled with 2 mL of 1xSSC +0.1% Tween 20. All liquid was drawn out of each well. PDMS wells were used to form a well ontop of the glass slides while in the 24-well plate, and 200 pL of 0.025 uM conjugate (based onDNA concentration) in 5x SSC +0.1% Tween 20 was added to the well, just enough to coverthe top of the slide. Slides were incubated and rinsed as before. After rinsing with SSC, the buffer was exchanged into the activity assay buffer (20 mMpotassium phosphate, 10 mM potassium pyrophosphate, 3 uM dithiothreitol (DTT) pH8.5).Each well had NAD+,GAPDH,and FBP added to it such that the final concentrations were 1mM NAD+, 1.35 uM GAPDH, and 100 uM FBP in 500 uL total volume. Prior to adding the FBP,the plate was equilibrated to 37 ℃. A positive control was also run with the addition of 20 nMDNA-aldolase conjugate (strand Ax') in solution. After the addition of FBP, the absorbance at340 nm was measured every 5 min for 16 h while holding the temperature at 37℃ (TecanInfinite 200 Pro plate reader). A standard curve with NADH was also prepared on the sameplate, in concentrations ranging from 0-100 uM. 2.4.15. Atomic Force Microscopy Studies Mica surfaces were used in the AFM studies.Surface modification protocols on micawere identical to those outlined above for glass slides. In lieu of sonication, a fresh mica layerwas exposed just before immersing it into the 3-(4-azidophenyl)-N-(3-trimethoxysilylpropyl)propanamide solution. All subsequent steps remained unchanged when preparing surfacesfunctionalized with a) aniline, b) single stranded DNA (sequence A), c) double stranded DNA(sequence A'hybridized to sequence A),and d) immobilized aldolase via DNA hybridization(A'-aldolase hybridized to A). 2.4.16. Capping of Free Cysteines with 5,5'-dithio-bis-(2-nitrobenzoic acid) (DTNB) Free cysteines were protected from potential modification by disulfide formationwith 5,5'-dithiobis-(2-nitrobenzoicacid),(DTNB). To a solution of aldolase (780 uL of a 100uM solution) was added DTNB (20 pL of a 20 mM solution in 100 mM phosphate buffer, pH7.2 with 1 mM EDTA). The reaction mixture was incubated at RT for 15-30 min and then theexcess DTNB was removed by repeated (6 times) centrifugal filtration against a 10 kDa MWCOmembrane. To reduce the disulfide, approximately 25 equiv. of TCEP (as a 0.5 M solution, pH7.0) was added to the protein sample. The reaction mixture was incubated at RT for 15 minand then purified using a 0.5 mL centrifugal filter with a 10 kDa MWCO. 2.4.17. Modification of Aldolase with a Small Molecule o-aminophenol Reagent at theN-terminus for Mass Spectrometry Analysis To a solution of aldolase (20 uM) in 10 mM phosphate buffer, pH 7.5 was added 5equiv. of 2-amino-p-cresol(100 uM). The solution was briefly vortexed and then 10 equiv. ofK,Fe(CN) (1 mM as a solution in 10 mM phosphate buffer, pH 7.5) was added. After 30 min,the reaction was purified using a 0.5 mL centrifugal filter with a 10 kDa MWCO. 2.4.18. Trypsin Digestion of a Small Molecule Modified Aldolase for MS/MS Analysis. For the tryptic digest, a procedure from UC Berkeley QB3 Mass Spectrometry Facilitywas followed.45-47 To 5 pL of a 765 uM protein stock was added 20 uL of8M urea and 0.5uL of 500 mM DTT, all in 50 Tris buffer, pH 7.0. After incubation at 55℃ for 20 minues, 6 pLof a freshly made 100 mM iodoacetamide solution was added. The resulting solution wasincubated at RT for 30 minutes in the dark. After incubation, 2 uL of 500 mM DTT were added.After incubation at RT for 20 minutes, 6 uL of the alkylyated protein from this sample was usedfor digestion. To 6 uL was added 2.5 uL of 1 M Tris, pH 7.0, 0.5 pL of 100 mM CaCl2 0.5 uL of 1ug/ul trypsin (Promega), and 41.5 uL water. This solution was allowed to incubate overnight atRT for protein digestion to occur prior to sample analysis. 2.5.References 1. Witham, C. A.;Huang, W.Y.;Tsung,C. K.;Kuhn, J.N.; Somorjai, G. A.; Toste, F. D., Convertinghomogeneous to heterogeneous in electrophilic catalysis using monodisperse metalnanoparticles. Nat. Chem. 2010,2,36-41. 2. Huang, W.Y.;Liu,J. H.-C.;Alayoglu, P.;Li, Y. M.; Witham, C. A.; Tsung,C. K.; Toste, F. D.;Somorjai, G. A., Highly Active Heterogeneous Palladium Nanoparticle Catalysts forHomogeneous Electrophilic Reactions in Solution and the Utilization of a ContinuousFlow Reactor.J.Am. Chem. Soc. 2010, 132,16771-16773. 3..LLi,Y.; Liu, J. H.-C.; Witham, C. A.; Huang, W.; Marcus, M. A.; Fakra, S.C.; Alayoglu, P;Zhu,Z.;Thompson, C. M.; Arjun, A.; Lee, K.; Gross, E.; Toste, F. D.;Somorjai, G. A., A Pt-Cluster-Based Heterogeneous Catalyst for Homogeneous Catalytic Reactions: X-ray AbsorptionSpectroscopy and Reaction Kinetic Studies of Their Activity and Stability againstLeaching.J.Am. Chem. Soc. 2011, 133,13527-13533. 4.Baio,J. E.; Weidner, T.; Baugh, L.; Gamble,L. J.; Stayton, P.S.; Castner, D. G., Probing theorientation of electrostatically immobilized protein G B1 by time of flight aecondary ionspectrometry, sum frequency generation and near-edge x-ray adsorption fine structurespectroscopy.Langmuir2012,28,2107-2112. 5. Phizicky, E.; Bastiaens, P. I. H.; Zhu, H.; Snyder, M.; Fields, S., Protein analysis on aproteomic scale.Nature 2003,422,208-215. 6. BBrady, D.; Jordaan,J., Advances in enzyme immobilization. Biotechnol. Lett. 2009, 31,1639-1650. 7. Jonkheijm,P; Weinrich, D.; SchrOder, H.;Niemeyer, C. M.; Waldmann, H., Chemicalstrategies for generating protein biochips. Angew. Chem. Int. Ed. 2008, 47,9618-9647. 8.CQha,T.;Guo, A.; Zhu,X., Enzymatic activity on a chip: The critical role of proteinorientation.Proteomics 2005, 5,416-419. 9..BVallieres, K.; Chevallier, P.; Sarra-Bournet, C.;Turgeon, S.; Laroche, G., AFM imaging ofimmobilized fibronectin: Does the surface conjugation scheme affect the proteinorientation/conformation? Langmuir 2007,23,9745-9751. 10.Camarero,J. A.; Kwon,Y.;Coleman, M. A., Chemoselective attachment of biologicallyactive proteins to surfaces by expressed protein ligation and its application for"proteinchip"fabrication.JAm Chem Soc. 2004, 126,14730-14731. 11.Buhl, M.;VonhOren, B.; Ravoo, B. J., Immobilization of enzymes via microcontact printingand thio-ene chemistry. Bioconjugate Chem. 2015, 26,1017-1020. 12. Yeritsyan, H.E.; Gasparyan, V.K., Homogeneous immunoassay for human lgG usingoriented hen egg lgY immobilized on gold sol nanoparticles. Microchim. Acta 2012, 176,117-122. ( 13.Taniguchi, K.; Nomura, K.; Hata, Y.; Nishimura,T.; Ksami, Y.; Kuroda, A., The Si-tag forimmobilizing proteins on a silica surface. Biotechnol Bioeng 2007, 9 6 ,1023-1029. ) 14.Kindermann,M.;George, N.;Johnsson,N.;Johnsson, K., Covalent and site-specificimmobilization of fusion proteins.J. Am. Chem. Soc. 2003, 125,7810-7811. ( 15.Wong, L.S.; Thirlway, J.;Micklefield,J., Direct site-selective covalent immobilizationcatalyzed by a phosphopantetheinyl transferase. . Am.Chem. Soc. 2008, 130,12456- 12464. ) ( 16.Abad, J. M.; Mertens, S. F.L.;Pita, M.; Fernandez, V. M.; Schiffrin, D. J., Functionalization ofthioctic acid-capped gold nanoparticles for specific immobilization of histidine tagged proteins.J.Am. Chem. Soc. 2005, 127,5689-5694. ) ( 17.Reynolds,N. P.;Tucker, J. D.;Davison, P.A.; Timney, J. A.; Hunter, C. N.; Leggett, G. J.,Site-specific immobilization and micrometer and n anometer scale photopatterning of yellowfluorescent protein on glass surfaces. J. Am. Chem. Soc. 2009, 131,896-897. ) 18.Hutsell, S. Q.; Kimple,R. J.; Siderovski,D. P; Willard, F.S.; Kimple, A. J., High affinityimmobilization of proteins using biotin and GST-based coupling strategies. Methods Mol.Biol.2010,627,75-90. 19.Nimse, S. B.; Song, K.; Sonawane, M. D.;Sayyed, D.R.; Kim,T., Immobilization techniquesfor microarray: challenges and applications. Sensors 2014, 14,22208-22229. ( 20.Niemeyer, C. M.,Semisynthetic DNA-protein conjugates for biosensing andnanofabrication. Angew. Chem. Int. Ed.2010,49,1200-1216. ) 21. Beaucage, S. L., Strategies in the preparation of DNA oligonucleotide arrays for siagnosticapplications. Curr.Med. Chem. 2001,8,1213-1244. 22. Niemeyer, C. M.;Boldt,L; Ceyhan, B; Blohm, D.,DNA-directed immobilization: Efficient,reversible,and site-selective surface binding of proteins by means of covalent DNA-streptavidin conjugates.Anal. Biochem. 1999,268,54-63. 23. Bauer, D.M.; Ahmed, I.; Vigovskaya, A.; Fruk, L., Clickable Tyrosine Binding BifunctionalLinkers for Preparation of DNA-Protein Conjugates Bioconjug Chem 2013,24,1094-1101. 24. Fruk, L.; MUller, J.; Niemeyer, C. M., Kinetic analysis of semisynthetic peroxidase enzymescontaining a covalent DNA-heme adduct as the cofactor.Chem. Eur.J. 2006, 12,7448-7457. ( 25. Wold, E. D.;McBride, R.; Axup,J. Y.; Kazane, S. A.; Smider, V.V., Antibody microarrays utilizing site-specific antibody-oligonucleotide conjugates.Bioconjugate Chem. 2015, 26, 807-811. ) ( 26. Behrens, C. R.; Hooker, J. M.,Obermeyer, A. C.; Romanini, D. W.; Katz, E.M.; Francis, M. B.,Rapid chemoselective b i oconjugation through the oxidative coupling of anilines andaminophenols.J.Am. Chem. Soc. 2011, 133,16398-16401. ) ( 27.Witus, L.S.; Netirojjanakul, C.; Palla,K.S.; Muehl, E.M,;Weng, C.H.;lavarone, A.T.; Francis,M.B., Site-specific protein transamination using N-methylpyridinium-4-carboxaldehyde. J.Am. Chem. Soc.2013,135,17223-17229. ) ( 28.Scheck,R. A.;Dedeo,M. T.; lavarone, A. T.; Francis, M. B., Optimization of a Biomimetic T ransamination Reaction.J.Am. Chem. Soc. 2008,130,11762-11770. ) ( 29. Palla, K. S.; Witus, L. S.;Mackenzie, K. J.; Netirojjanakul, C.; Francis, M. B.,Optimizationand expansion of a site selective N-methylpyridinium-4-carboxaldehyde mediatedtransamination for bacterially expressed proteins. J. Am. Chem. Soc. 2015, 137,1123- 1129. ) ( 30.Tong, G.J.; Hsiao, S. C.; Carrico,Z. M.; Francis,M. B., Viral cap s id DNA aptamer conjugatesas multivalent cell-targeting vehicles.J. Am. Chem. Soc. 2009,131 , 11174-11178. ) ( 31.Netirojjanakul, C.; Witus, L. S.; Behrens, C. R.; Weng, C.;lavarone, A. T.; Francis, M. B.,Synthetically modified Fc domains as building blocks for immunotherapy applications. Chem. Sci. 2013,4,266-272. ) ( 32. El Muslemany, L. M.; Twite, A. A.; ElSohly,A. M.; Obermeyer, A. C.; Mathies, R. A.; Francis,M. B., Photoactivated bioconjugation between ortho-azidophenols and anilines: A facileapproach to biomolecularphotopatterning.J.Am. Chem. Soc. 2014,136,12600-12606. ) ( 33.Capehart, S. L.; Coyle, M. P.; Glasgow, J. E.; Francis, M.B., Controlled integration of goldnanoparticles and organic fluorophores using synthetically modified MS2 viral capsids. J. Am. Chem. Soc. 2013, 135,3011-3016. ) ( 34. Capehart, S. L.; ElSohly, A. M.;Obermeyer, A. C.; Francis,M. B. , Bioconjugation of Goldnanoparticles through the oxidative coupling of ortho-aminophenols and anilines.Bioconjugate Chem.2014,25,1888-1892. ) ( 35.Obermeyer, A. C.; Jarman, J. B.; Netirojjanakul, C.;Francis, M. B., Mild Bioconjugation Through the Oxidative coupling of ortho-aminophenols and anilines with ferricyanide.Angew. Chem., Int. Ed. 2014,53,1057-1061. ) 36.Obermeyer, A.C.; Jarman, J.B.; Francis, M.B., N-Terminal modification of proteins witho-aminophenols.J.Am. Chem. Soc. 2014, 136,9572-9579. 37.Windle, C. L.;MUller, M.;Nelson, A.; Berry, A., Engineering aldolases as biocatalysts. Curr.Opin.Chem.Biol. 2014,19,25-33. 38.Rosen, C.B.; Kwant, R.L.;MacDonald, J.I.;Rao,M.; Francis, M. B., Capture and Recyclingof Sortase A through Site-Specific Labeling with Lithocholic Acid.Angew. Chem. Int. Ed.2016,55,8585-858. 39.Sasou,M.; Sugiyama, S.; Yoshino, T.; Ohtani, T., Molecular flat mica surface silanized withmethyltrimethoxysilane for fixing and straightening DNA. Langmuir 2003, 19,9845-9849. 40. Saha, B.;Saikia, J.; Das, G., Correlating enzyme density,conformation and activity onnanoparticle surfaces in highly functional bio-nanocomposites. Analyst 2015, 140,532-542. 41.Seeman, N. C., Nanomaterials based on DNA Annu. Rev. Biochem.2010,79,65-87. 42. Phillips, D. C.; York, R. L.; Mermut, O.;McCrea, K. R.; Ward, R. S.; Somorjai, G. A., Side chain,chain Length, and sequence effects on amphiphilic peptide adsorption at hydrophobicand hydrophilic surfaces studied by sum-frequency generation vibrational spectroscopyand quartz crystal microbalance.J. Phys. Chem. C. 2007,111,255-261. ( 43. York, R. L.; Browne, W. K.; Geissler, P. L.; Somorjai, G. A., Peptides adsorbed on hydrophobicsurfaces - A sum frequency generation vibrational s p ectroscopy and modeling study. Isr. J. Chem. 2007,47,51-58. ) 44. Roepstorff, P; Fohlman,J., Proposal for a common nomenclature for sequence ions inmass spectra of peptides. Biol. Mass Spectrum. 1984,11,601. ( 45. Rebecchi, K. R.; Go,E. P.;Xu, L.; Woodin, C. L.;Mure, M.; Desaire, H.,A general p r otease digestion procedure for optimal protein sequence coverage and post-translationalmodifications analysis of recombinant glycoproteins: application to the characterization of human lysyl oxidase-like 2 glycosylation. Anal. Chem.2011,83,8484-8491. ) 46. Hervey, W. J.,lV; Strader, M. B.; Hurst, G. B., Comparison of digestion protocols formicrogram quantities of enriched protein samples. J. Proteome Res. 2007, 6, 3054-3061. 47. Strader, M. B.; Tabb, D. L.; Hervey, W. J.; Pan, C.; Hurst, G. B., Efficient and specific trypsindigestion of microgram to nanogram quantities of proteins in organic-aqueous solventsystems.Anal. Chem. 2006,78,125-134. Chapter 3 Characterization of DNA Surfaces via Sum Frequency Generation VibrationalSpectroscopy Abstract Sum frequency generation (SFG) vibrational spectroscopy is an inherentlysurface specific spectroscopic technique that can give information about the orientation andbonding of molecules on surfaces. SFG was used to study surfaces of DNA and enzymes thatwere tethered through DNA directed immobilization. It was seen that single-stranded DNAsurfaces are disordered, while the double-stranded surfaces have a more rigid and orderedarray of DNA.The immobilized enzyme does not have a spectra that is significantly differentfrom the double-stranded DNA surface. 3.1.Introduction Figure 3.1. a) Basic scheme of sum frequency generation. The incident visible and IR beamsoverlap in time and space, generating an outgoing signal beam that is amplified when the IRbeam matches a vibrational mode of the surface. b) Energy level diagram of sum frequencygeneration demonstrating that the frequency of the outgoing beam is equal to the sum ofthe frequencies of the two incoming beams. It has been shown that the orientation of immobilized enzymes has a strong effect onthe activity of the catalytic system.1-3 One method to analyze the orientation of surfaces andmolecules adsorbed or attached to a surface is sum frequency generation (SFG) vibrationalspectroscopy.4.5 SFG is a surface-specific technique allowing for the analysis of the vibrationalmodes of interfacial molecules without the interference of modes from the bulk substrate.6 SFG is a non-linear spectroscopy achieved through the temporal and spatial overlapof a fixed wavelength visible beam and a tunable wavelength IR beam (Figure 3.1a).Theresulting SFG beam has a frequency that is the sum of the two incoming frequencies (Figure3.1b):47 sFG=@p+@vs When the frequency of the IR beam matches with a vibrational mode of the sample, theintensity of the emitted SFG light is enhanced. The intensity of this light is measured as afunction of the IR frequency, generating a vibrational spectrum. As SFG is a non-linear spectroscopy,the selection rules governing differ from thoseof linear techniques such as IR and Raman spectroscopies. For a particular vibrationalmode to be SF active, it must be in an asymmetric environment on both the microscopic and macroscopic scale. A bulk material is centrosymmetric and thus lacks asymmetry butintroducing an interface into this bulk material inherently breaks the centrosymmetry,allowing the interfacial molecules to be SF active. Additionally, the interfacial molecules musthave a net polar orientation. That is, a completely disordered arrangement of molecules ormolecules equally arranged in opposing directions will result in no signal. The bulk polarization, P, which is the sum of the molecular electric dipoles which canbe induced by an oscillating electric field, E, is described as: wherexis the first-order susceptibility and e is the vacuum permittivity. The induced dipoleoscillates and emits light with the same frequency of the incident field. This produces theproperties seen in linear spectroscopies. As the E field increases, the non-linear terms become more significant such that thebulk polarization becomes: The second- and third-order non-linear susceptibilities are considerably smaller than x".These non-linear susceptibilities only become significant with electromagnetic fields of themagnitude achievable with pulsed lasers. In SFG, the E field is the sum of the two oscillating incident fields with frequenciesw andw: If we only consider the second-order term of the bulk polarization, it gives: It is conventional to exclude the time dependence of the field,which results in the simplestform of the expression for the SFG component of the second-order non-linear polarization: x2) is the second-order non-linear susceptibility which describes the relationship betweenthe electric field vectors, E, and E,,and the second-order non-linear polarization. It is also themacroscopic average of the hyperpolarizability of the molecules on the surface (B). When theIR beam's frequency matches a molecular resonance, B,and thusx2, increases. This results in asignificant increase in the intensity of the SFG signal.4 Examining the nonlinear susceptibility,X, also demonstrates the surface specificityof SFG. In a centrosymmetric environment,X(2), must be identical for any two opposingdirections: For this to be satisfied x2must be zero. Since an interface is non-centrosymmetric, x(2)0 andthe interface is therefore SFG active. There are two components that go into x2), a resonant (R)and a nonresonant (NR) susceptibility: x can be significant for metallic surfaces due to plasmon resonance,but is generallyindependent of frequency,while x2) for dielectric materials is generally very small.4 Since the non-linear susceptibility is a third rank tensor, it has a maximum of 27components, but due to symmetry constraints, there are fewer non-zero components. Planarsurfaces can be considered isotropic around the surface normal, creating a C axis. This meansthat x=-xand y=-y, but z-z. Combining this with the requirement that2=), meansthat only four independent non-zerox2)components can generate a SF signal: Each of the electric fields can be resolved into components that are polarized parallel,s, and perpendicular, p, to the surface. Table 3.1 shows the polarization combinations andthe correspondingX2elejmeknts that can produce an SFG signal. Polarizations are listed inorder of decreasing energy: SFG, visible, and infrared. In this work, we use SFG with a ppppolarization to study DNA surfaces. Polarization nijkelements ppp x,x)xm, x) pss x(2)zyy sps (2)yzy ssp x(2)yyz Table 3.1. SFG polarizations and the corresponding x(2) elements that can generate an SFGsignal. Polarizations are listed as SFG, visible, and infrared. 3.2. Results and Discussion 3.2.1. Evaluating DNA Attachment Using Fluorescence b) Flgure 3.2. a) Fluorescent images of quartz discs modified with DNA and then presented withfluorescently labelled non-complementary and complementary DNA strands. b)Quantification of fluorescence levels of these slides. In this work, high quality z-cut quartz discs were used as a support. To verify that thesesurfaces were able to be modified with DNA prior to SFG studies, fluorescent DNA probeswere used. First, the 1/16 inch thick quartz discs were cleaned in a Nochromix° solution andthen functionalized with a phenylazide silane. This was then reduced in a solution of TCEP tocreate aniline functionalized surfaces. Discs were then modified with a previously synthesizedaminophenol modified DNA strand (AP-A) through oxidative coupling. These DNA modifiedquartz surfaces were then treated with a complementary strand of DNA (A’) or with thecomplementary strand with a AlexaFluor488 dye attached (A*). A negative control with anon-complementary first strand (AP-B) was also used. These surfaces were then fluourescentlyimaged. As shown in Figure 3.2, there is a high level of fluorescence when the fluorescentlytagged DNA strand is presented to a quartz surface modified with its complement and thereare much lower levels of fluorescence from the non-complementary DNA suggesting thatthere is some, but little non-specific binding. Therefore these quartz surfaces were able to beaniline functionalized and then modified with DNA. DNA sequences used in this chapter canbe found in Table 3.1. Name sequence T(℃) AA'A"*PolyTPolyA 5'-CCCTAG AGT GAG TCG TATGA-3' 5'-TCA TACGAC TCA CTC TAG GG-3' 5'-AlexaFluor488 TCA TAC GAC TCA CTC TAG GG-3'5'-TTT TTT TTT TTT TTT TTT TTT TTTT-3' 5'-AAA AAA AAA AAAAAA AAA AAA AAA A-3' 52.652.652.642.842.8 Table 3.2. DNA sequences used. 3.2.2. SFG Spectroscopy of Aniline Functionalized Quartz Surface Z-cut quartz discs were cleaned and then functionalized to present an aniline moiety.These quartz and aniline surfaces were analyzed with SFG in air in the ppp polarization (Figure3.3a). The cleaned quartz surface shows no distinct peaks in the CH region which suggeststhat the cleaning procedure removed any impurities on the surface. The spectrum of theaniline functionalized quartz shows four peaks in the CH stretching region. As seen in Figure3.3b, the aniline tether has several methylene groups but no methyl groups. It is unclear whatcaused the peaks corresponding to the symmetric and asymmetric stretches at 2875 and 2960cmrespectively. It is possible that the methyl stretches are a result of methanol adsorbed onthe surface as methanol was the solvent used during the functionalization. Figure 3.3. a) SFG spectra of cleaned z-cut quartz and aniline functionalized quartz in air withppp polarization.Noted peaks are a symmetric methylene stretch at 2850 cm", a symmetricmethyl stretch at 2875 cm, an asymmetric methylene stretch at 2915 cm",and anasymmetric methyl stretch at 2960 cm lb) Structure of aniline tether on the functionalizedquartz. 3.2.3. SFG Spectroscopy of DNA Surfaces in Air O O Figure 3.4. The structure of DNA and the four nucleobases. The free methyl group on thymineis highlighted by the red circle. For this SFG work, different DNA strands were used. Of the four DNA nucleobasesonly thymine has a free methyl group (Figure 3.4). This methyl group will have a differentvibrational mode than the methylene groups in the DNA backbone. As such, if the first standattached to the surface contains only thymine as a base (PolyT), it is possible to follow theasymmetric methyl stretch at 2960 cm'upon DNA hybridization to determine changes in theorientation of the strands.8,9 Figure 3.5 shows a representative spectra of single-stranded PolyT on the surface andthen hybridized with a solution of 0.01 or 1 uM PolyA complement DNA. As can be seen, theasymmetric methyl stretch at 2960 cmlbecomes much more defined upon hybridization.Since the PolyA strand does not contain any free methyl groups to contribute to this peak, it must be the case that the methyl groups are becoming more ordered upon hybridization.It is also seen that the symmetric methylene stretch at 2850 cmbecomes very sharp anddefined after addition of the second strand. This also suggests that the methylene rich DNAbackbone becomes much moreordered after hybridization. This is consistent with previouslydone studies.10,11 The symmetric methylene stretch for the double-stranded sample hybridizedfrom 1 pM PolyA is significantly sharper and higher than that of the sample hybridized from a0.01 uM PolyA which suggests that more DNA may be hybridized on the surface at the higherconcentration. Figure 3.5. SFG spectra of single- and double-stranded DNA in air with ppp polarization. Thefirst strand on the surface is a PolyT strand and the second is a PolyA at either 0.01 or 1 uM insolution. Peaks of interest are a symmetric methylene stretch at 2850 cm, a symmetricmethyl stretch at 2875 cml, an asymmetric methylene stretch at 2915 cm1, and anasymmetric methyl stretch at 2960 cm". Figure 3.6. Cartoon representation of a floppy, randomly oriented array of single-strandedDNA becoming rigid and ordered upon hybridization. Prior to DNA hybridization, the single-stranded PolyT is flexible and disordered onthe surface,causing many of the various stretching modes to cancel each other out. Oncethe much more rigid DNA double helix is formed, all of the methyl groups become ordered,creating this prominent feature in the spectra. A diagram of the single-and double-strandedDNA surfaces can be seen in Figure 3.6. 3.2.4. SFG Spectroscopy in Air of Immobilized Enzymes Aldolase from rabbit muscle was conjugated to the PolyA DNA strand and thentethered to the quartz surface through DNA hybridization. These immobilized aldolasesurfaces were then analyzed by SFG in air. As shown in Figure 3.7, the SFG spectra ofimmobilized aldolase matches that of the double-stranded DNA. This is likely a result of thevibrational modes in the CH region of the enzyme all canceling each other out since thereare hundreds to thousands of CH stretching modes in each enzyme with no overall ordering.Because these modes all cancel out,the ordered modes of the double-stranded DNA wouldstill be visible to SFG. IR Wavenumber (cm-1) Figure 3.7. SFG spectra of double-stranded DNA and aldolase immobilized through DNAdirected immobilization in air with ppp polarization. Both spectra appear to have the samefeatures. 3.3. Conclusions DNA functionalized quartz discs wereanalyzed using SFG vibrational spectroscopy.The double-stranded DNA surfaces were found to have a far greater amount of orderingthan the single-stranded DNA because of the sharpness and height of peaks resulting fromvibrational modes in the backbone of the DNA and from the free methyl group on thymine. Itis suggested that a greater in solution concentration of the second strand of DNA (1 uM over0.01 uM) results in a more ordered system. Spectra of aldolase immobilized through DNA tethering were found to effectivelymatch those of just double-stranded DNA. This is likely due to the inherent disorder in the CHvibrational modes of the enzyme. Previous studies have shown that SFG peaks are detectablein the amide region of proteins due to their secondary structures.12-14 Further studies should be carried out of these DNA and enzyme surfaces in solutionand in the amide region. 3.4. Materials and Methods 3.4.1. General Procedures and Materials Unless otherwise noted, the chemicals and solvents used were of analytical grade and wereused as received from commercial sources.Water(dd-H2O) used as a reaction solvent andin biological procedures was deionized using a Barnstead NANOpure purification system(ThermoFisher, Waltham, MA). Single stranded 5'aminated DNA molecules were purchasedfrom Integrated DNA Technologies. Aldolase from rabbit muscle was obtained from Aldrich(St. Louis,MO) 3.4.2. Instrumentation Sum Frequency Generation Vibrational Spectroscopy An Ekspla PL2230 picosecond laser was used for all SFG experiments. This laserproduces a 1064 nm beam with a 28 ps pulse duration and a 50 Hz repetition rate. ALaserVision OPG/OPA is then used to split the beam into a fixed visible beam (532 nm) and atunable infrared beam (2700-3500 cm-1). These beams had energies of 80-120 uJ and 200-300pJ respectively. Both beams are polarized to the ppp polarization and directed to the sampleholder. The IR beam is incident to the sample at a 40° angle and the visible beam at a 57°angle relative to the surface normal. The SFG signal was detected by a photomultiplier tubeand the signal-to-noise ratio was improved by a gated integrator system with a 100 ns gatetime. This setup can be seen in Scheme 3.1. Sample Scheme 3.1. General setup of the SFG laser system. 3.4.3. Preparation of Aniline Functionalized Quartz Discs Synthesis of 3-(4-azidophenyl)-N-(3-trimethoxysilylpropyl) Propanamide (PhenylazideSilane). Phenylazide silane was synthesized following a previously published protocol.32Briefly, to a solution of 3-(4-azidophenyl) propionic acid (574 mg, 3.0 mmol) in 90 mL ofanhydrous THF under positive nitrogen pressure were added DIPEA (0.7 mL, 7.5 mmol, excess)and pentafluorphenyl trifluoroacetate (0.64 mL, 3.75 mmol), which was added slowly over20 min, resulting in the formation of dense, white fumes. The reaction was stirred for 2 h atRT. To this solution was added 3-aminopropyl trimethoxysilane (0.57 mL, 3.3 mmol), and theresulting solution was stirred under nitrogen at RT for 18 h. The solvent was then removedusing a rotary evaporator. After purification by flash chromatography (100% EtOAc), a lightyellow oil was obtained, and confirmed by NMR. Modification of Quartz Discs with 3-(4-azidophenyl)-N-(3-trimethoxysilylpropyl)Propanamide. Circular quartz discs (Chemglass, 1 inch diameter, 1/16 inch thick) were cleaned byimmersing the discs in a solution of Nochromix@ in sulfuric acid (40 mg/mL) for 2 h withstirring. Discs were removed from the Nochromix°solution and rinsed in Nanopure water.Following cleaning, the slides were immersed in a solution of 25 mM 3-(4-azidophenyl)-N-(3-trimethoxysilylpropyl) propanamide in methanol containing 1%v/v water and 148 mM aceticacid. The slides were incubated in this solution at RT for 2 h with stirring, after which theywere rinsed in a solution of 148 mM acetic acid in methanol for 2 minutes.The slides werethen rinsed with pure methanol, and finally dried with a stream of N2. After drying, the slides were cured in an oven at 110 ℃ for a minimum of 12 h to promote covalent modificationof the glass surface. These phenylazide coated glass slides were stored in the dark at RT ina desiccator until the azide groups were reduced to the anilines, as described below. Thesilanization solution could be reused a minimum of six times with no change in performanceif stored at -20℃ between uses. Reduction of Phenylazide Functionalized Glass Slides to Aniline Functionalized GlassSlides. Phenylazide modified slides were submerged in a solution of 50 mM TCEP in 200mM sodium phosphate buffer at pH 7.5 and incubated at RT with stirring for 30 min. Afterreduction, the slides were rinsed in Nanopure water and dried with a stream of N2. The anilinedisplaying glass slides were stored at RT in a desiccator until use. 3.4.4. Synthesis of Aminophenol-DNA Amine-modified DNA was dissolved to 2.5 mM. The reaction conditions describe thegeneralized procedure for the modification of amine functionalized DNA. [RepresentativeDNA strand T:5'/5AmMC6/TTT TTT TTT TTT TTT TTT TTT TTTT-3'(5AmMC6=6-aminohexylphosphate)]. To a solution of 125 uL of 100 mM pH 8 phosphate buffer was added 125 uL ofa 2.5 mM amine DNA solution (0.31 umol).To this were added 150 uL of DMF and 100 uL ofa ~500 mM solution of nitrophenol-NHS (~50 umol) in DMSO. 3(4-hydroxy-3-nitrophenyl)propionic acid NHS ester (nitrophenol-NHS) was prepared following a previously publishedprotocol.36 The solution was shaken for at least 4 h.This solution was added to a NAP-5column (GE Healthcare),equilibrated and eluted with nanopure water. To the resultingsolution was added 53 uL of 200 mM Na2S204 to reduce the nitrophenol to the desiredaminophenol. The Na2S2O4 was stored in a desicator at RT, and a 200 mM stock solution wasprepared fresh in 0.2 M phosphate buffer, pH 6.5 before addition. The solution was shakenfor at least 20 minutes before being directly loaded onto a NAP-10 column, and the elutionprocess was repeated. The eluent was lyophilized,yielding~1.0 mg of a white solid (50%). TheDNA was prepared via C-18 ziptip for MADLI-TOF analysis and modification was confirmed.Aminophenol-DNA stock solutions were prepared at 1 mM in water and stored at-20℃ forfuture use. 3.4.5. Patterning Single Stranded DNA on Aniline Functionalized Discs Using PotassiumFerricyanide Mediated Oxidative Coupling Aniline functionalized 1 inch circular quartz discs were modified with ssDNA. A 10 uLdrop of 50 uM aminophenol-modified DNA, 1 mM K,Fe(CN),and 250 mM NaCl in 10 mM pH6.5 phosphate buffer was placed on the center of the aniline quartz discs. An unmodifiedglass slide was placed on top of the drop causing the DNA solution to spread over the quartzdisc in a sandwich. Slides were incubated in the dark at RT for 1 h. Then discs were dipped inwater and the unmodified glass slides were removed from the DNA-modified quartz. DNA-modified quartz discs were rinsed in 0.4% SDS and then 10 mM pH 6.5 phosphate buffered saline (PBS) each at RT for 5 min with stirring. Discs were rinsed in Nanopure water and driedwith a stream of N.. 3.4.6. Annealing of Complementary DNA Strands on Single Stranded DNA ModifiedQuartz Discs Quartz discs (1/16 inch thick, 1 inch in diameter) coated with ssDNA were incubatedwith the complementary strand for hybridization. PDMS wells were used to form a well on topof the quartz discs, and 200 uL of 0.01 or 1 uM DNA in 5x SSC + 0.1% Tween 20 was added tothe well, just enough to cover the top of the disc.Discs were incubated for 1h in humidifyingconditions on an orbital shaker at RT. Following incubation, the PDMS wells were removedand the quartz discs were rinsed in 5x SSC +0.1%Tween 20 three times for 1 min and then in1x SSC + 0.1% Tween 20 two times for 10 min. Following the rinses, quartz discs were rinsed inwater, dried with nitrogen and stored for subsequent use and analysis. Discs with fluorescentDNA strands were analyzed using a Typhoon 9410 variable mode imager.Controls involvedDNA strand mismatches chosen such that hybridization should not occur. (20X SSC buffer: 0.3M sodium citrate dihydrate, 3 M NaCl, pH 7.0). 3.4.7. Synthesis of DNA-Aldolase Bioconjugate Free cysteine residues were capped from potential modification during subsequentoxidative coupling steps by reaction with N-ethyl maleimide (NEM). To a solution of aldolasefrom rabbit muscle (100 uL of a 118 pM solution in 100 mM pH 7.0 phosphate buffer) wasadded NEM (5 uL of a 100 mM solution in DMSO) and 95 uL of 100 mM pH 7.0 phosphatebuffer. The reaction mixture was incubated at RT for 3 h and then the excess NEM wasremoved by repeated (6 times) centrifugal filtration against a 30 kDa MWCO membrane. To the aldolase (20 uM) in 10 mM phosphate buffer, pH 7.5 was added 5 equiv. of theo-aminophenol modified DNA (100 uM). The solution was briefly vortexed and then 10 equiv.(relative to the o-aminophenol) of K Fe(CN) (as a 10 mM stock solution in water) was added.After 30 min, the reaction was purified by repeated (>12 times) centrifugal filtration against a30 kDa MWCO membrane (Millipore), allowing for purification of aldolase and aldolase-DNAconjugate from free DNA. Modification was monitored by a combination of SDS-PAGE and aBCA assay (kit purchased from Thermo Scientific). 3.4.8.Immobilization of DNA-Aldolase onto Quartz Discs Quartz discs (1/16 inch thick, 1 inch in diameter)coated with ssDNA were incubatedwith DNA-aldolase conjugate for hybridization. PDMS wells were used to form a well on topof the quartz discs, and 200 uL of 0.1 uM conjugate (based on DNA concentration) in 5x SSC+0.1% Tween 20 was added to the well, just enough to cover the top of the disc. Discs wereincubated for 1 h in humidifying conditions on an orbital shaker at RT. Following incubation,the discs were rinsed in 5x SSC + 0.1% Tween 20 twice for 1 min each, then in 1x SSC +0.1%Tween 20 twice for 15 min each,and then in water. 3.5. References 1..Cha,T. W.; Quo, A.; Zhu,X.Y., Enzymatic Activity on a Chip: The Critical Role of ProteinOrientation. Proteomics 2005,5,416-419 2.Turkova, J.;Fusek, M.; Stovidkova, J.; Kralová, Z., Biospecific Complex Formation as aTool for Oriented Immobilization. Makromol. Chem., Macromol. Symp. 1988, 17,241-256 3.. Huang,W.;Wang,J.; Bhattacharyya, D.; Bachas, L. G., Improving the Activity ofImmobilized Subtilisin by Site-Specific Attachment to Surfaces. Anal. Chem. 1997,69,4601-4607 4Lambert, A. G.; Davies, P. B.; Neivandt, D. J., Implementing the Theory of Sum FrequencyGeneration Vibrational Spectroscopy: A Tutorial Review. Appl. Spectrosc.Rev. 2005, 40,103-145 5.. Cremer,P. S.; Su,X.; Shen,Y. R.; Somorjai, G. A., Ethylene Hydrogenation on Pt(111)Monitored in Situ at High Pressures Using Sum Frequency Generation.J.Am. Chem.Soc.1996,118,2942-2949 6..Miranda, P. B.; Shen, Y. R., Liquid Interfaces: A Study by Sum-Frequency VibrationalSpectroscopy.J. Phys. Chem.B 1999, 103, 3292-3307 ( 7. Shen,Y.R. , The Principles of Nonlinear Optics; Wiley, 1984. ) ( 8 . . Howell, C.;Schmidt, R.; Kurz, V.; Koelsch, P.,Sum-Frequency-Generation Spectroscopy of DNA Films in Air and Aqueous Environments. Biointerphases 2008, 3,47-51 ) 9. Stokes, G.Y.;Gibbs-Davis, J. M.; Boman, F. C.; Stepp, B. R.; Condie, A. G.;Nguyen, S.T.;Geiger, F. M.,Making "Sense"of DNA. J. Am.Chem. Soc. 2007, 129,7492-7493 10. Walter, S.; Geiger, F.M., DNA on Stage: Showcasing Oligonucleotides at Surfaces andInterfaces with Second Harmonic and Vibrational Sum Frequency Generation.J.Phys.Chem. Lett. 2010, 1,9-15 11. Asanuma, H.; Noguchi, H.; Uosaki, K.; Yu, H.-Z.,Metal Cation-Induced Deformation ofDNA Self-Assembled Monolayers on Silicon: Vibrational Sum Frequency GenerationSpectroscopy.J.Am. Chem. Soc. 2008, 130,8016-8022 12. Baio, J. E.;Weidner, T.; Baugh, L.;Gamble, L. J.; Stayton, P. S.; Castner, D. G., Probing theOrientation of Electrostatically Immobilized Protein G B1 by Time-of-Flight SecondaryIon Spectrometry, Sum Frequency Generation, and Near-Edge X-ray Adsorption FineStructure Spectroscopy.Langmuir 2012,28,2107-2112 13. Wang,J.; Chen,X.; Clarke, M. L.;Chen,Z., Detection of Chiral Sum FrequencyGeneration Vibrational Spectra of Proteins and Peptides at Interfaces in Situ. Proc.Natl.Acad. Sci. 2005, 102,4978-4983 14. Fu, L.;Liu, J.; Yan, E. C. Y., Chiral Sum Frequency Generation Spectroscopy forCharacterizing Protein Secondary Structures at Interfaces. J. Am. Chem. Soc. 2011, 133,8094-8097 Chapter 4Immobilization of Enzymes onto Mesoporous Silica Abstract Mesoporous silicas are materials with very high surface areas and tunable pore sizes.SBA-15 is one type of mesoporous silica with pores large enough to fit enzymes. Herein, weuse SBA-15 as a support for immobilizing alcohol dehydrogenase. Alcohol dehydrogenasewas found to non-specifically adsorb onto SBA-15 and retain activity upon adsorption. Thisactivity of immobilized enzyme appears to be largely independent of enzyme incubationtemperature and time, but is dependent on incubation concentration. The specificity ofalcohol dehydrogenase was altered upon immobilization for the largest alcohols studied inthis work. Significant leaching of the enzyme from SBA-15 was detected, leaving the utility ofthis immobilization technique to be limited. 4.1.Introduction Mesoporous silicas are a range of porous materials with exceedingly high surfaceareas and pore sizes ranging from 2 to 30 nm. These materials have a wide range of possibleapplications such as gas separation, environmental cleanup of hazardous materials, drugdelivery, and catalysis.4-6The use of mesoporous silicas in catalysis includes acting as asupport for metallic nanoparticle catalysts, dendrimer encapsulated metal clusters, andimmobilized enzymes. These materials are promising supports for enzyme immobilizationbecause enzymes typically have a diameter under 10 nm and the tunable nature of the poresize in the mesoporous silicas can be matched to the size of the enzyme.7-10 The high surfacearea of mesoporous silicas allows for the immobilization of a great amount of enzyme intoa relatively small volume allowing for the synthesis of a highly selective and active catalyticsystem. SBA-15 is one type of mesoporous silica that has hexagonal pores, a high thermalstability, and pores ranging from 5 to 30 nm making it one of the most tunable mesoporoussilicas.11-13The surface area of SBA-15 is typically 400-1000 m²/g. These properties, along withthe thickness of the walls of SBA-15 ranging from 3 to 7 nm, which gives SBA-15 a greaterthermal and mechanical stability than similar materials, make SBA-15 particularly promisingfor enzyme immobilization. 4 Alcohol dehydrogenase (ADH) is an industrially relevant enzyme (and personallyimportant to the author) as it catalyzes the reversible oxidation of primary and secondaryalcohols to aldehydes and ketones respectively. ADH is particularly valuable for itsapplications in biofuel cell production.15-17 However, free ADH, like all enzymes, is not stablefor more than a few days which effectively destroys its industrial relevancy. It has been shownthat upon immobilization, enzymes become more stable, in some cases retaining activity forup to months at a time.18-21 In this work, we use SBA-15 as a support for the immobilization of ADH. We attemptedto functionalize SBA-15 in order to covalently bond ADH to SBA-15. It was found thatADH itself non-specifically adsorbed onto SBA-15 allowing for immobilization withoutfunctionalization. 4.2. Results and Discussion 4.2.1. Evaluating Incorporation of Phenylazide Silane into SBA-15 Scheme 4.1. Proposed scheme for the functionalization of SBA-15 to include a phenylazidesilane which can then be reduced to create an aniline moiety. Figure is not to scale. Previous studies have shown the ability to functionalize SBA-15 both during andafter synthesis.22-24 In this work, we attempted to functionalize SBA-15 with aphenylazidesilane similarly to work done in Chapter 2 (Scheme 4.1). This method would incorporateaniline moieties into the SBA-15 allowing for the potential attachment of additives rangingfrom small molecules to proteins or nanoparticles. To determine the effectiveness of theincorporation of phenylazide silane, modified and unmodified SBA-15 were both added to asolution of aminophenol Oregon Green 488 with K Fe(CN) to allow for the oxidative couplingof the Oregon Green dye to the SBA-15. A slurry of these SBA-15 samples where dropcast ontoglass slides and the fluorescence was measured. As shown in Figure 4.1, the silanized SBA-15 treated with Oregon Green did not show significantly more fluorescence than the unmodifiedSBA-15 treated with Oregon Green. This suggests that the phenylazide silane was notincorporated into the SBA-15 or it was at very low amounts. Due to this, further work wasdone using the unmodified SBA-15. a) SBA-15 Silanized SBA-15 Silanized SBA-15 Figure 4.1. a) Fluorescence image of various SBA-15 solutions dropped onto glass micro-scope slides and dried in air. b). Plot of fluorescence intensities. The fluorescence levels of theSBA-15 that was modified to include an aniline moiety to react with the aminophenol OregonGreen (magenta) was not significantly different of the fluorescence of the unmodified SBA-15incubated with the aminophenol Oregon Green (green). There is also a high level of signalfrom the modified SBA-15 with no presence of fluorophore (blue). ■Fluorescence ▲Derivative Figure 4.2. Characterization of alcohol dehydrogenase.a) SDS-PAGE gel of expressed alcoholdehydrogenase. The desired enzyme shows up as a double band because not all of theenzyme was denatured due to its high thermostability. Elution fractions 2 and 3 werecollected and lyophilized. b) Deconvoluted ESI-TOF mass spectra of alcohol dehydrogenase.Alcohol dehydrogenase has a mass of 33,280 Da. c) Melting temperature curve of alcoholdehydrogenase. The high increase in the fluorescence (blue squares) and decrease in thederivative of the fluorescence curve (orange triangles) as the temperature approaches 100℃demonstrates that the melting point of this protein is at or above 100℃. 4.2.2. Measuring Activity of Non-specifically Adsorbed Alcohol Dehydrogenase Scheme 4.2. Alcohol dehydrogenase catalyzes the reversible oxidation of a primary orsecondary alcohol to an aldehyde or ketone in the presence of the cofactor NAD+. A thermostable alcohol dehydrogenase (ADH) from Pyrococcus furiosus was expressedin E. coli and used in these studies (Figure 4.2). ADH is an enzyme that catalyzes the conversionof an alcohol to a ketone or aldehyde with NAD+ as a cofactor (Scheme 4.2). In these studies,the activity of ADH is determined by measuring the absorbance at 340 nm which is due Figure 4.3. Kinetic assay for Mlchaelis-Menten analysis of ADH in solution. Assay was run with1uM ADH, 100 mM 2-pentanol, and 50-1000 uM NAD+ at 42 ℃. Insert shows the linear regionof each run during the first 10-30 min. to NAD+ being reduced to NADH. The activity of 1 uM of ADH was measured with varyingconcentrations of NAD+(50-1000 uM) and 100 mM 2-pentanol.A Michaelis-Menten analysiswas carried out on these data to determine the catalytic parameters of the enzyme (Figure4.3). The turnover rate, k,was found to be 0.0831 sl and the Michaelis constant, K, wasfound to be 1.43x10⁻⁴ M. ADH was then incubated with SBA-15 and the activity of this ADH non-specificallyadsorbed onto SBA-15 was measured (Figure 4.4). The immobilized ADH still retains a highlevel of activity upon adsorption onto SBA-15. A MIchaelis-Menten analysis of this system wasnot carried out, as the total enzyme concentration adsorbed onto SBA-15 is not preciselyknown. The creation of products appears to plateau around 250 uM because that correlates tothe maximum absorbance of the detector. This is a result of the SBA-15 drastically increasingthe absorbance of the reaction mixture. Figure 4.4. Kinetic assay of ADH immobilized on SBA-15 in solution. Assay was run with 100mM 2-pentanol, and 250-1000 uM NAD+ at 42C. 4.2.3. Effect of Incubation Temperature, Concentration, and Time on Activity We investigated the conditions to achieve the highest activity of alcoholdehydrogenase adsorbed onto SBA-15. Alcohol dehydrogenase (0 uM, 0.1 uM,1 uM, 10uM) was incubated onto SBA-15 for 15 min, 1, 5, or 20 h at 4, 23, or 37℃. As shown inFigure 4.5, the incubation concentration has a major effect on the activity of the catalyticsystem. When incubated at 0.1 uM the activity was essentially the same as when no alcoholdehydrogenase was incubated on the SBA-15. It should be noted that incubating with 10 uMalcohol dehydrogenase is four to six times as active as when incubating with 1 uM alcoholdehydrogenase. There are no clear overall trends seen regarding the temperature and timevariations in the incubation,although at 4℃, the activity decreases slightly as the incubationtime increases. Figure 4.5. A screen of the effect of incubation concentration (0 uM (gray), 0.1 uM (purple), 1uM (green),and 10 uM (blue)), temperature (4℃,23℃, and 37℃), and time (15 min, 1 h, 5 h,and 20 h) on the activity of alcohol dehydrogenase immobilized on SBA-15. 4.2.4. Alcohol Specificity We were curious if upon incorporation into the SBA-15, the alcohol dehydrogenasehad a change in specificity for length of alcohol.The activity of alcohol dehydrogenase insolution and immobilized on SBA-15 was measured in the presence of methanol, ethanol,2-propanol,1-butanol, and 2-pentanol (Figure 4.6). In solution, the activity follows a cleartrend of increasing with an increase in length of reactant alcohol.This trend holds for thealcohol dehydrogenase on SBA-15, except that the activity is the same for 1-butanol and2-pentanol. This could be caused by the activity towards 2-pentanol being limited by itsability to diffuse through the pores in the SBA-15. Figure 4.6. Alcohol specificity of alcohol dehydrogenase in solution (a) and immobilized onSBA-15 (b). The activity increases with size of alcohol from methanol to 2-pentanol for both insolution and immobilized except for the activity of immobilized ADH for 2-pentanol and1-butanol are equal. The absorbance for the solution containing SBA-15 (with no enzyme)and no alcohol decreases over time as the SBA-15 crashes out of solution. 4.2.5. Leaching Tests As the alcohol dehydrogenase was non-specifically adsorbed onto the SBA-15support it is important to determine the amount of leaching during the activity assays. Thiswas measured by measuring the activity of the alcohol dehydrogenase on SBA-15 and thenseparating the SBA-15 from the solution via centrifugation. The activity was then measured ofthe reused SBA-15 and of the supernatant (Figure 4.7). It can be seen that the reused SBA-15support and the reused supernatant have nearly equal activities relative to that of the initialSBA-15. This suggests that roughly half of the alcohol dehydrogenase that was adsorbed ontothe SBA-15 leaches into the solution during the activity assay. Figure 4.7. Relative activities of alcohol dehydrogenase immobilized on SBA-15 (green),reused SBA-15 after one use (magenta), and the supernatant collected after centrifuging theSBA-15 solution after one use (blue). 4.3. Conclusions Immobilization of alcohol dehydrogenase onto SBA-15 is achievable through non-specific adsorption. While the immobilized enzyme is still active, because it is only physicallyadsorbed on the support, there is a high level of leaching. We have found that there is littledependence on the temperature and time of incubation for the immobilization of the enzymeonto SBA-15, but the concentration of enzyme during incubation is very important with0.1 uM ADH not being sufficient to show activity, but 1 and 10 uM ADH during incubationresulting in significant activity. The trend of activity increasing with an increase in alcohollength is consistent between ADH in solution and immobilized on SBA-15 except for theactivity of ADH on SBA-15 towards 1-butanol and 2-pentanol being equal suggesting that2-pentanol is limited by diffusion. This method for immobilization is effective for one cycle of the reaction. But due tothe significant amount of leaching, it would not be a particularly suitable method for multiplereuses of the catalyst. It may be possible to find a procedure that prevents this leaching inwhich case this ADH would be a fitting enzyme to use due to its high thermostability. 4.4. Materials and Methods 4.4.1. General Procedures and Materials Unless otherwise noted, the chemicals and solvents used were of analytical grade andwere used as received from commercial sources. Water (dd-H2O) used as a reaction solventand in biological procedures was deionized using a Barnstead NANOpure purification system(ThermoFisher, Waltham, MA). Absorbance measurements of samples in 24 and 96-well plateswere obtained on a Tecan Infinite 200 Pro plate reader. Fluorescence images of glass slideswere taken on a Typhoon 9410 variable mode imager (Amersham Biosciences). 4.4.2.Instrumentation Full Length Protein Mass Spectrometry Proteins were analyzed on an Agilent 6224 Time-of-Flight (TOF) mass spectrometerwith a dual electrospray source connected in-line with an Agilent 1200 series HPLC (AgilentTechnologies, USA). Chromatography was performed using a Proswift RP-4H (ThermoScientific, USA) column with a H2O/MeCN gradient mobile phase containing 0.1% formic acid.Mass spectra of proteins and protein conjugates were deconvoluted with the MassHunterQualitative Analysis Suite B.05 (Agilent Technologies,USA). 4.4.3. Preparation of SBA-15 Synthesis of SBA-15 Pluronic 123 (5 g) was dissolved in 180 mL of water and 20 ml of 36% HCl with stirringat 40 ℃ for 30 min in a 500 mL polypropylene bottle. 10 g ofTEOS was added to the solutionwith stirring at 40 ℃ for 20 h. The mixture was heated at 100 ℃ for 24 h in a polypropylenebottle. The white powder was recovered through filtration, washed with water, and dried at 60℃ for 12 h. The product was then refluxed with ethanol three times (50 mL of ethanol per 1 gof product) for 12 h each. Synthesis of 3-(4-azidophenyl)-N-(3-trimethoxysilylpropyl) Propanamide (PhenylazideSilane) Phenylazide silane was synthesized following a previously published protocol.32Briefly, to a solution of 3-(4-azidophenyl) propionic acid (574 mg, 3.0 mmol) in 90 mL ofanhydrous THF under positive nitrogen pressure were added DIPEA (0.7 mL, 7.5 mmol, excess)and pentafluorphenyl trifluoroacetate (0.64 mL, 3.75 mmol), which was added slowly over 20 min, resulting in the formation of dense, white fumes. The reaction was stirred for 2 h atRT. To this solution was added 3-aminopropyl trimethoxysilane (0.57 mL, 3.3 mmol), and theresulting solution was stirred under nitrogen at RT for 18 h. The solvent was then removedusing a rotary evaporator. After purification by flash chromatography (100%EtOAc),a light-yellow oil was obtained, and confirmed by NMR. One-pot Synthesis of Silanized SBA-15 The same procedure was followed as in the synthesis of unmodified SBA-15,except that phenylazide silane was included with the addition of TEOS (1:19 molar ratio ofphenylazide silane to TEOS). The resulting powder was light-brown instead of white. Afterrefluxing with ethanol, the product was added to a solution of 50 mM TCEP in 200 mMsodium phosphate buffer at pH 7.5 and incubated at RT with shaking for 30 min to reduce thephenylazide to aniline. Product was then filtered and dried in air overnight. Post-synthesis Silanization of SBA-15 Unmodified SBA-15 (10 mg) was loaded into 1.6 mL Eppendorf tubes.500 uL of asolution of 25 mM 3-(4-azidophenyl)-N-(3-trimethoxysilylpropyl) propanamide in methanolcontaining 1% v/v water and 148 mM acetic acid was added. Tubes were wrapped in foil andshaken for 2 h at room temperature. The SBA-15 was centrifuged (10K rpm, 4℃,3 min) andthe supernatant was removed by pipetting. The SBA-15 was then rinsed by adding 1 mL of148 mM acetic acid in methanol and shaking for 10 min. The SBA-15 was centrifuged,andthe supernatant was removed. This rinsing was repeated two more times and then dried inan oven overnight. The SBA-15 was added to a solution of 50 mM TCEP in 200 mM sodiumphosphate buffer at pH 7.5 and incubated at RT with shaking for 30 min to reduce thephenylazide to aniline. The product was rinsed by centrifuging, removing the supernatant,adding 1 mL of DI water, shaking for 10 min, and repeating the centrifugation process. Characterization of fluorescently labeled SBA-15 10 mg of SBA-15 (unmodified, silanized during synthesis, and silanized post-synthesis)were loaded into 1.6 mL Eppendorf tubes and 240 uL of a solution of 10 uM aminophenolOregon Green 488,1 mM K3Fe(CN)6, and 250 mM NaCl in 10 mM phosphate buffer, pH 6.5was added to each tube. The tubes were shaken for 1 h while covered in foil. The SBA-15 wascentrifuged (10K rpm,4℃,3 min) and the supernatant was removed by pipetting. The SBA-15was then rinsed by adding 1 mL of 0.04% SDS and shaking at 23 ℃ for 10 min. The solutionwas centrifuged again, the supernatant was removed, and 1 mL of 10 mM phosphate,250 mMNaCl, pH7.5 buffer was added before shaking again.The solution was centrifuged once more,the supernatant was removed, and 200 uL of 10 mM phosphate buffer, pH 6.5 was added. 10uL of each solution was dropped on a glass slide (15mm in diameter) and allowed to dry inair at room temperature while covered. Slides were analyzed using a Typhoon 9410 variablemode imager. 4.4.4. Expression of Alcohol Dehydrogenase A plasmid for the expression of an alcohol dehydrogenase (ADH) with a C-terminalHis6 tag was purchased from DNA2.0. The full plasmid sequence is shown below, with theinsert for ADH in red: CCCGTAGAAAAGATCAAAGG ATCTTCTTGA GATCCTTTTTTTCTGCGCGT 1801TGACCTTTATTTGTTGCACTGGCCCGTTGATGACTTCAAGAAGATAGAGG 1851 AGACACTTCA CGCTTTGGAA GACCTCGTAG ATGAGGGAGT GATAAGGTAC 1901ATTGGAGTTA(GCAACTTCAATCTGGAACTTCTCCAGCGCT CCCCAGGAGGT 3901GTCGCAAATTGTCGCGGCGA.TTAAATCTCG CGCCGATCAA CTGGGTGCCA 3951GCGTGGTGGTGTCGATGGTA GAACGAAGCGGCGTCGAAGC CTGTAAAGCG GCGGTGCACA ATCTTCTCGC GCAACGCGTC AGTGGGCTGA 4051 TCCGCTGGAT GACCAGGATG CCATTGCTGT GGAAGCTGCC TGCACTAATG 4101 TTCCGGCGTT ATTTCTTGAT( GTCTCTGACC AGACACCCAT CAACAGTATT 4151 ATTTTCTCCC ATGAGGACGG. TACGCGACTG GGCGTGGAGC ATCTGGTCGC 4201 ATTGGGTCAC( CAGCAAATCG CGCTGTTAGC GGGCCCATTA AGTTCTGTCT 4251L CGGCGCGTCT(( GCGTCTGGCT GGCTGGCATA AATATCTCAC TCGCAATCAA 4301 ATTCAGCCGA TAGCGGAACG GGAAGGCGAC TGGAGTGCCA TGTCCGGTTT 4351 TCAACAAACC ATGCAAATGC TGAATGAGGG CATCGTTCCC ACTGCGATGC 4401 TGGTTGCCAA CGATCAGATG GCGCTGGGCG CCAATGCGCGC CATTACCGAG 4451 TCCGGGCTGC GCGTTGGTGC GGATATCTCG GTAGTGGGAT ACGACGATAC 4501 CGAAGATAGC TCATGTTATA TCCCGCCGTT AACCACCATC AAACAGGATT 4551 TTCGCCTGCT GGGGCAAACC I AGCGTGGACC GCTTGCTGCA ACTCTCTCAG 4601 GGCCAGGCGG TGAAGGGCAA .. TCAGCTGTTGCCCAGTCTCAC TGGTGAAAAG 4651 AAAAACCACC CTGGCGCCCA ATACGCAAAC CCGCCTCTCCC CGCGCGTTGG 4701 CCGATTCATT AATGCAGCTG GCACGACAGG TTTCCCGACT GGAAAGCGGG 4751 CAGTGACTCA TGACCAAAAT CCCTTAACGT GAGTTACGCG CGCGTCGTTC 4801CACTGAGCGTCAGAC Plasmid for ADH was transformed into One Shot BL21 (DE3) competent E. colicells (Invitrogen). Transformed cells were added to Luria broth (LB) agar plates containingkanamycin (50 ug/mL) and incubated overnight at 37 ℃. Isolated colonies were grownovernight in 4 mL of LB containing kanamycin (50 ug/mL) at 37℃. Cultures grown overnightwere added to 1 L of LB containing kanamycin (50 ug/mL) at 37℃ until an optical density(OD) of 0.6 was observed at 600 nm. Expression of ADH-His6 was induced by the additionof 2 mL of 0.1 mM isopropyl B-D-1-thiogalactopyranoside (IPTG). Cultures were grown for18 h at 37℃ and then centrifuged (8000 rpm, 4℃, 15 min) to pellet the cells. The cells wereresuspended in 12 mL of lysis buffer (50 mM NaH2PO4, 300 mM NaCl, 10 mM imidazole, pH8.0), lysed by sonication (FisherbrandTM Model 120 Sonic Dismembrator, 2 s on, 4 s off, 50%amplitude) for 30 min, and cell debris was removed by centrifugation(11,000 rcf, 4℃,1h).The cleared cell lysate was incubated with 5 mL of rinsed nickel-nitrilotriacetic acid resin (Ni-NTA) in a 20 mL cartridge for 1 h at 4℃. The resin-bound protein was washed with three 10mL portions of wash buffer (50 mM NaH2PO4, 300 mM NaCl, 20 mM imidazole, pH 8.0), theneluted with six 1.25 mL portions of elution buffer(50 mM NaH2PO4, 300 mM NaCl, 250 mMimidazole,pH8.0). Protein fractions from Ni-NTA column were run on sodium dodecyl sulfate-polyacrylamide gel electrophoresis (SDS-PAGE) carried out on a Mini Gel Tank apparatusfrom Life Technologies following the manufacturer's protocols. MOPS buffer purchased fromLife Technologies was used as the electrode buffer. All protein electrophoresis samples wereheated for at least 15 minutes at 100 ℃ in the presence of 1,4-dithiothreitol (DTT) to ensurereduction of any disulfide bonds. NuPAGE Bis-Tris Mini Gels (12%) were run for 50 min at 200V to allow good resolution of bands. Commercially available markers (Bio Rad) were appliedto at least one lane of each gel for assignment of apparent molecular masses. Visualization of protein bands was accomplished by staining with Coomassie Brilliant Blue R-250. Gel imagingwas performed on a Gel Doc EZTM Imager (Bio Rad). The fractions containing purified proteinwere combined and lyophilized yielding 250 mg of protein. 4.4.5. Activity Assay of Alcohol Dehydrogenase in Solution Activity of alcohol dehydrogenase was measured in a 96-well plate. Each well hadalcohol dehydrogenase,NAD+, and 2-pentanol added to it such that the final concentrationswere 1 uM alcohol dehydrogenase, 1 mM NAD+, and 100 mM 2-pentanol in 250 uL totalreaction volume of the activity assay buffer (250 mM glycine, pH 8.5). Prior to addingthe 2-pentanol, the plate was equilibrated to 42℃. After the addition of 2-pentanol, theabsorbance at 340 nm was measured every 2 min for 5 h while holding the temperature at 42℃ (Tecan Infinite 200 Pro plate reader). Samples were run in triplicate. 4.4.6.Immobilization of Alcohol Dehydrogenase onto SBA-15 Eppendorf tubes (1.6mL) were loaded with SBA-15 (10 mg). To each tube was added300 uL alcohol dehydrogenase (0.1-10 uM) in 50 mM phosphate buffer, pH 8.5. The tubes wereshaken for a varying amount of time (0.25-20 h) at either 4, 23, or 37 ℃. The SBA-15 was centrifuged (10K rpm, 4℃, 3min) and the supernatant was removedby pipetting. The SBA-15 was then rinsed by adding 1 mL of 0.04% SDS and shaking at 23℃for 10 min. The solution was centrifuged again, the supernatant was removed, and 1 mL of 10mM phosphate, 250 mM NaCl, pH 7.5 buffer was added before shaking again. This process wasrepeated two more times with the activity assay buffer (250 mM glycine, pH 8.5). 4.4.7. Activity Assay of Alcohol Dehydrogenase on SBA-15 Activity of the immobilized alcohol dehydrogenase was measured in a 96-well plate. Each wellhad a slurry of SBA-15 incubated with alcohol dehydrogenase in 200 uL of the activity assaybuffer.NAD+, and 2-pentanol were added to each well such that the final concentrations were1 uM alcohol dehydrogenase,1 mM NAD+, and 100 mM 2-pentanol in 250 uL total reactionvolume of the activity assay buffer (250 mM glycine, pH 8.5). Prior to adding the 2-pentanol,the plate was equilibrated to 42℃. After the addition of 2-pentanol, the absorbance at 340nm was measured every 2 min for 5 h while holding the temperature at 42 ℃(Tecan Infinite200 Pro plate reader) with shaking for 5 sec every minute. Samples were run in triplicate. 4.4.8. Screen of Activity for Various Alcohols Activity of alcohol dehydrogenase free in solution and immobilized on SBA-15 weremeasured as described above with 100 mM of methanol, ethanol, 2-propanol,1-butanol, or2-pentanol. 4.4.9. Determination of Leaching of Enzyme from SBA-15 To measure the extent of leaching of alcohol dehydrogenase from SBA-15, the activityof immobilized alcohol dehydrogenase was measured as described above. The solutions fromeach well were then pipetted out of the well plate and loaded into 1.6 mL Eppendorf tubes.These solutions were centrifuged (10K rpm, 4℃,3 min) and the supernatants were pipettedinto separate Eppendorf tubes. 200 pL of activity assay buffer was added to each of theEppendorf tubes still loaded with SBA-15. All of the solutions were transferred to a new 96-well plate. NAD+ and 2-pentanol wereadded to each well such that the final concentrations1 mM NAD+, and 100 mM 2-pentanol in250 uL total reaction volume of the activity assay buffer. Prior to adding the 2-pentanol, theplate was equilibrated to 42℃. After the addition of 2-pentanol, the absorbance at 340 nmwas measured every 2 min for 5 h while holding the temperature at 42 ℃ (Tecan Infinite 200Pro plate reader) with shaking for 5 seconds every minute. Samples were run in triplicate. 4.5.References 1. Harlick, P. J. E.; Sayari, A., Applications of Pore-Expanded Mesoporous Silicas. 3. TriamineSilane Grafting for Enhanced CO2 Adsorption. Ind. Eng. Chem. Res. 2006,45,3248-3255 2. Feng, X.;Fryxell,G. E.; Wang, L. Q.;Kim, A. Y.; Liu, J.;Kemner, K. M., FunctionalizedMonolayers on Ordered Mesoporous Supports. Science 1997, 276, 923-926 3. Song,S.W.; Hidajat, K.; Kawi, S., Functionalized SBA-15 Materials as Carriers for ControlledDrug Delivery: Influence of Surface Properties on Matrix-Drug Interactions. Langmuir2005,21,9568-9575. 4.Ye, R.; Zhukhovitskiy, A. V.; Kazantsev, R.V.; Fakra, S. C.; Wickemeyer, B. B.;Toste, F. D.;Somorjai, G.A., Supported Au Nanoparticles with N -Heterocyclic Carbene Ligands asActive and Stable Heterogeneous Catalysts for Lactonization.J. Am. Chem. Soc.2018,140,4144-4149 ( 5. W V ang, Y.;Caruso, F., Mesoporous Silica Spheres as Supports for Enzyme I mmobilizationand Encapsulation. Chem. Mater. 2005, 17,953-961 ) ( 6. V V eisi, H.; Sedrpoushan, A.; Faraji, A. R.; Heydari, M.; Hemmati, S.; Fatahi, B. A., MesoporousSBA-15 Silica Catalyst Functionalized with Phenylsulfonic Acid Groups (SBA-15-Ph-SO H) a s a Novel Hydrophobic Nanoreactor Solid Acid Catalyst for a One-Pot Three-Component Synthesis of 2H-Indazolo[2,1-b]Phthalazine-Triones and Triazolo[1,2-a] indazole-triones. RSC Adv. 2015,5,68523-68530 ) 7. TTakahashi, H.;Li, B.; Sasaki, T.; Miyazaki, C.; Kajino,T.; Inagaki, S., Catalytic ActivityinOrganic Solvents and Stability of Immobilized Enzymes Depend on the Pore Size andSurface Characteristics of Mesoporous Silica.Chem.Mater. 2000, 12,3301-3305 8. Dai,Z.;Liu, S.;Ju, H.; Chen, H., Direct Electron Transfer and Enzymatic Activity ofHemoglobin in a Hexagonal Mesoporous Silica Matrix. Biosens. Bioelectron. 2004, 19,861-867 9.).LLi, Y.; Wang, W.; Han, P., Immobilization of Candida Sp.99-125 Lipase onto Silanized SBA-15 Mesoporous Materials by Physical Adsorption. Korean J.Chem. Eng. 2014, 31, 98-103 10.Popat, A.; Hartono,S. B.; Stahr, F.; Liu, J.; Qiao, S. Z.; Lu, G. Q., Mesoporous SilicaNanoparticles for Bioadsorption, Enzyme Immobilisation, and Delivery Carriers.Nanoscale 2011,3,2801-2818 ( 11.Zhao, D.; Feng, J.;Huo, Q.; Melosh, N.;Fredrickson,G. H.; Chmelka, B. F.; Stucky, G. D.,Triblock Copolymer Syntheses of Mesoporous Silica with Periodic 50 to 300 Angstrom Pores. Science 1998,279,548-552 ) ( 12. Zhao,D.;Huo, Q.;Feng,J.;Chmelka, B. F.; Stucky, G. D., N onionic Triblock and Star Diblock Copolymer and O l igomeric Sufactant Syntheses of Highly Ordered, Hydrothermally Stable, Mesoporous Silica Structures.J. Am. Chem. Soc. 1998, 120,6024-6036 ) ( 13.Zhao,D.;Sun, J.; L i, Q.; Stucky, G. D., Morphological Control of Highly Ordered Mesoporous Silica SBA-15. Chem.Mater. 2000,12,275-279 ) ( 14. Cassiers, K.; Linssen, T.; Mathieu, M.; Benjelloun, M.; Schrijnemakers, K.; Van Der Voort,P; Cool, P.; Vansant, E. F. A.,Detailed Study of Thermal, Hydrothermal, and MechanicalStabilities of a Wide Range of Surfactant Assembled Mesoporous Silicas. Chem. Mater. 2002,14,2317-2324 ) ( 15.Akers,N. L.;Moore, C. M.; Minteer, S. D., Development of Alcohol/O2 Biofuel CellsUsing Salt-Extracted Tetrabutylammonium Bromide/Nafion Membranes to Immobilize Dehydrogenase Enzymes. Electrochim. Acta 2005,50,2521-2525 ) ( 16. Atsumi, S.; Wu, T. Y.; Eckl, E. M.; Hawkins, S. D.;Buelter, T.; Liao,J. C., Engineering theIsobutanol B iosynthetic Pathway in Escherichia Coli by Comparison of Three AldehydeReductase/Alcohol Dehydrogenase Genes. Appl. Microbiol. Biotechnol.2010,85,651-657 ) ( 17. Palmore, G. T. R.; Bertschy, H.; Bergens, S. H.; Whitesides, G. M., A Methanol/DioxygenBiofuel Cell That Uses NAD+-Dependent Dehydrogenases as Catalysts: Application of anElectro-Enzymatic Method to Regenerate Nicotinamide Adenine Dinucleotide at Low Overpotentials.J.Electroanal. Chem. 1998, 443, 155-161 ) ( 18.Bes, M. T.;Gomez-Moreno, C.; Guisan,J.M.; Fernandez-Lafuente,R.,Selective Oxidation: Stabilisation by Multipoint Attachment of Ferredoxin NADP+reductase, an Interesting Cofactor Recycling E nzyme.J. Mol. Catal.A. Chem. 1995,3,161-169 ) 19.Klibanov,A. M., Stabilization of Enzymes against Thermal Inactivation.Adv. Appl.Microbiol. 1983,29,1-28 20. Martinek, K.; Klibanov, A. M.;Goldmacher, V. S.; Berezin, I. V., The Principles of EnzymeStabilization I. Increase in Thermostability of Enzymes Covalently Bound to aComplementary Surface of a Polymer Support in a Multipoint Fashion. BBA-Enzymol.1977,485,1-12 21.Dekker, R. F. H., Immobilization of a Lactase onto a Magnetic Support by CovalentAttachment to Polyethyleneimine-Glutaraldehyde-Activated Magnetite. Appl. Biochem.Biotechnol.1989,22,289-310 22. Burkett, S. L.; Sims, S. D.; Mann, S., Synthesis of Hybrid Inorganic-Organic MesoporousSilica by Co-Condensation of Siloxane and Organosiloxane Precursors. Chem. Commun.1996,1367-1368 23.Chong, A. S. M.; Zhao, X. S., Functionalization of SBA-15 with APTES and Characterizationof Functionalized Materials. J. Phys.Chem. B2003,107,12650-12657 24.Margolese, D.;Melero, J. A.; Christiansen,S. C.; Chmelka, B. F.; Stucky, G. D., DirectSyntheses of Ordered SBA-15 Mesoporous Silica Containing Sulfonic Acid Groups.Chem.Mater. 2000, 12, 2448-2459 Powered by the California Digital LibraryUniversity of CaliforniaeScholarship.org Enzymes are highly selective and active biocatalysts that can catalyze reactions at much milder conditions than heterogeneous catalysts. However, in solution enzymes are not reusable, can not be used in a flow cell, and can be difficult to separate from the products. By immobilizing enzymes onto a solid support, it is possible to create a catalytic system that combines the activity and selectivity of enzymes with the reusability and ease of separation of heterogeneous catalysis. This immobilization process also allows for enzymes to be studied with surface-specific techniques.One method to immobilize enzymes is through DNA directed immobilization (DDI). This method uses the selective binding of complementary DNA strands to immobilize enzymes in an ordered and selective manner. The activity of aldolase—an enzyme in the glycolysis pathway that catalyzes the C-C bond breaking step—was found to be significant after conjugation to DNA and subsequent immobilization onto functionalized glass surfaces. These immobilized enzyme surfaces were found to be reusable for multiple reaction cycles and regeneratable by dehybridizing the DNA strands.These DNA and enzyme modified surfaces were studied by using sum frequency generation (SFG) vibrational spectroscopy. This showed that quartz modified with double-stranded DNA has an ordered structure, while single-stranded DNA surfaces are more disordered due to the lack of rigidity.Alcohol dehydrogenase, which catalyzes the conversion of a primary or secondary alcohol into an aldehyde or ketone, can be immobilized onto the mesoporous silica material SBA-15 through non-specific physical adsorption. These immobilized enzymes are active upon adsorption but are prone to significant leaching. The specificity of immobilized alcohol dehydrogenase towards longer alcohols was found to be slightly diminished.This dissertation builds on existing knowledge of enzyme immobilization methods and surface science characterization techniques. This research shows that immobilized enzymes are a promising method for creating novel catalytic systems. The results show the importance of limiting the leaching of enzymes off of the support for potential catalytic applications.
确定
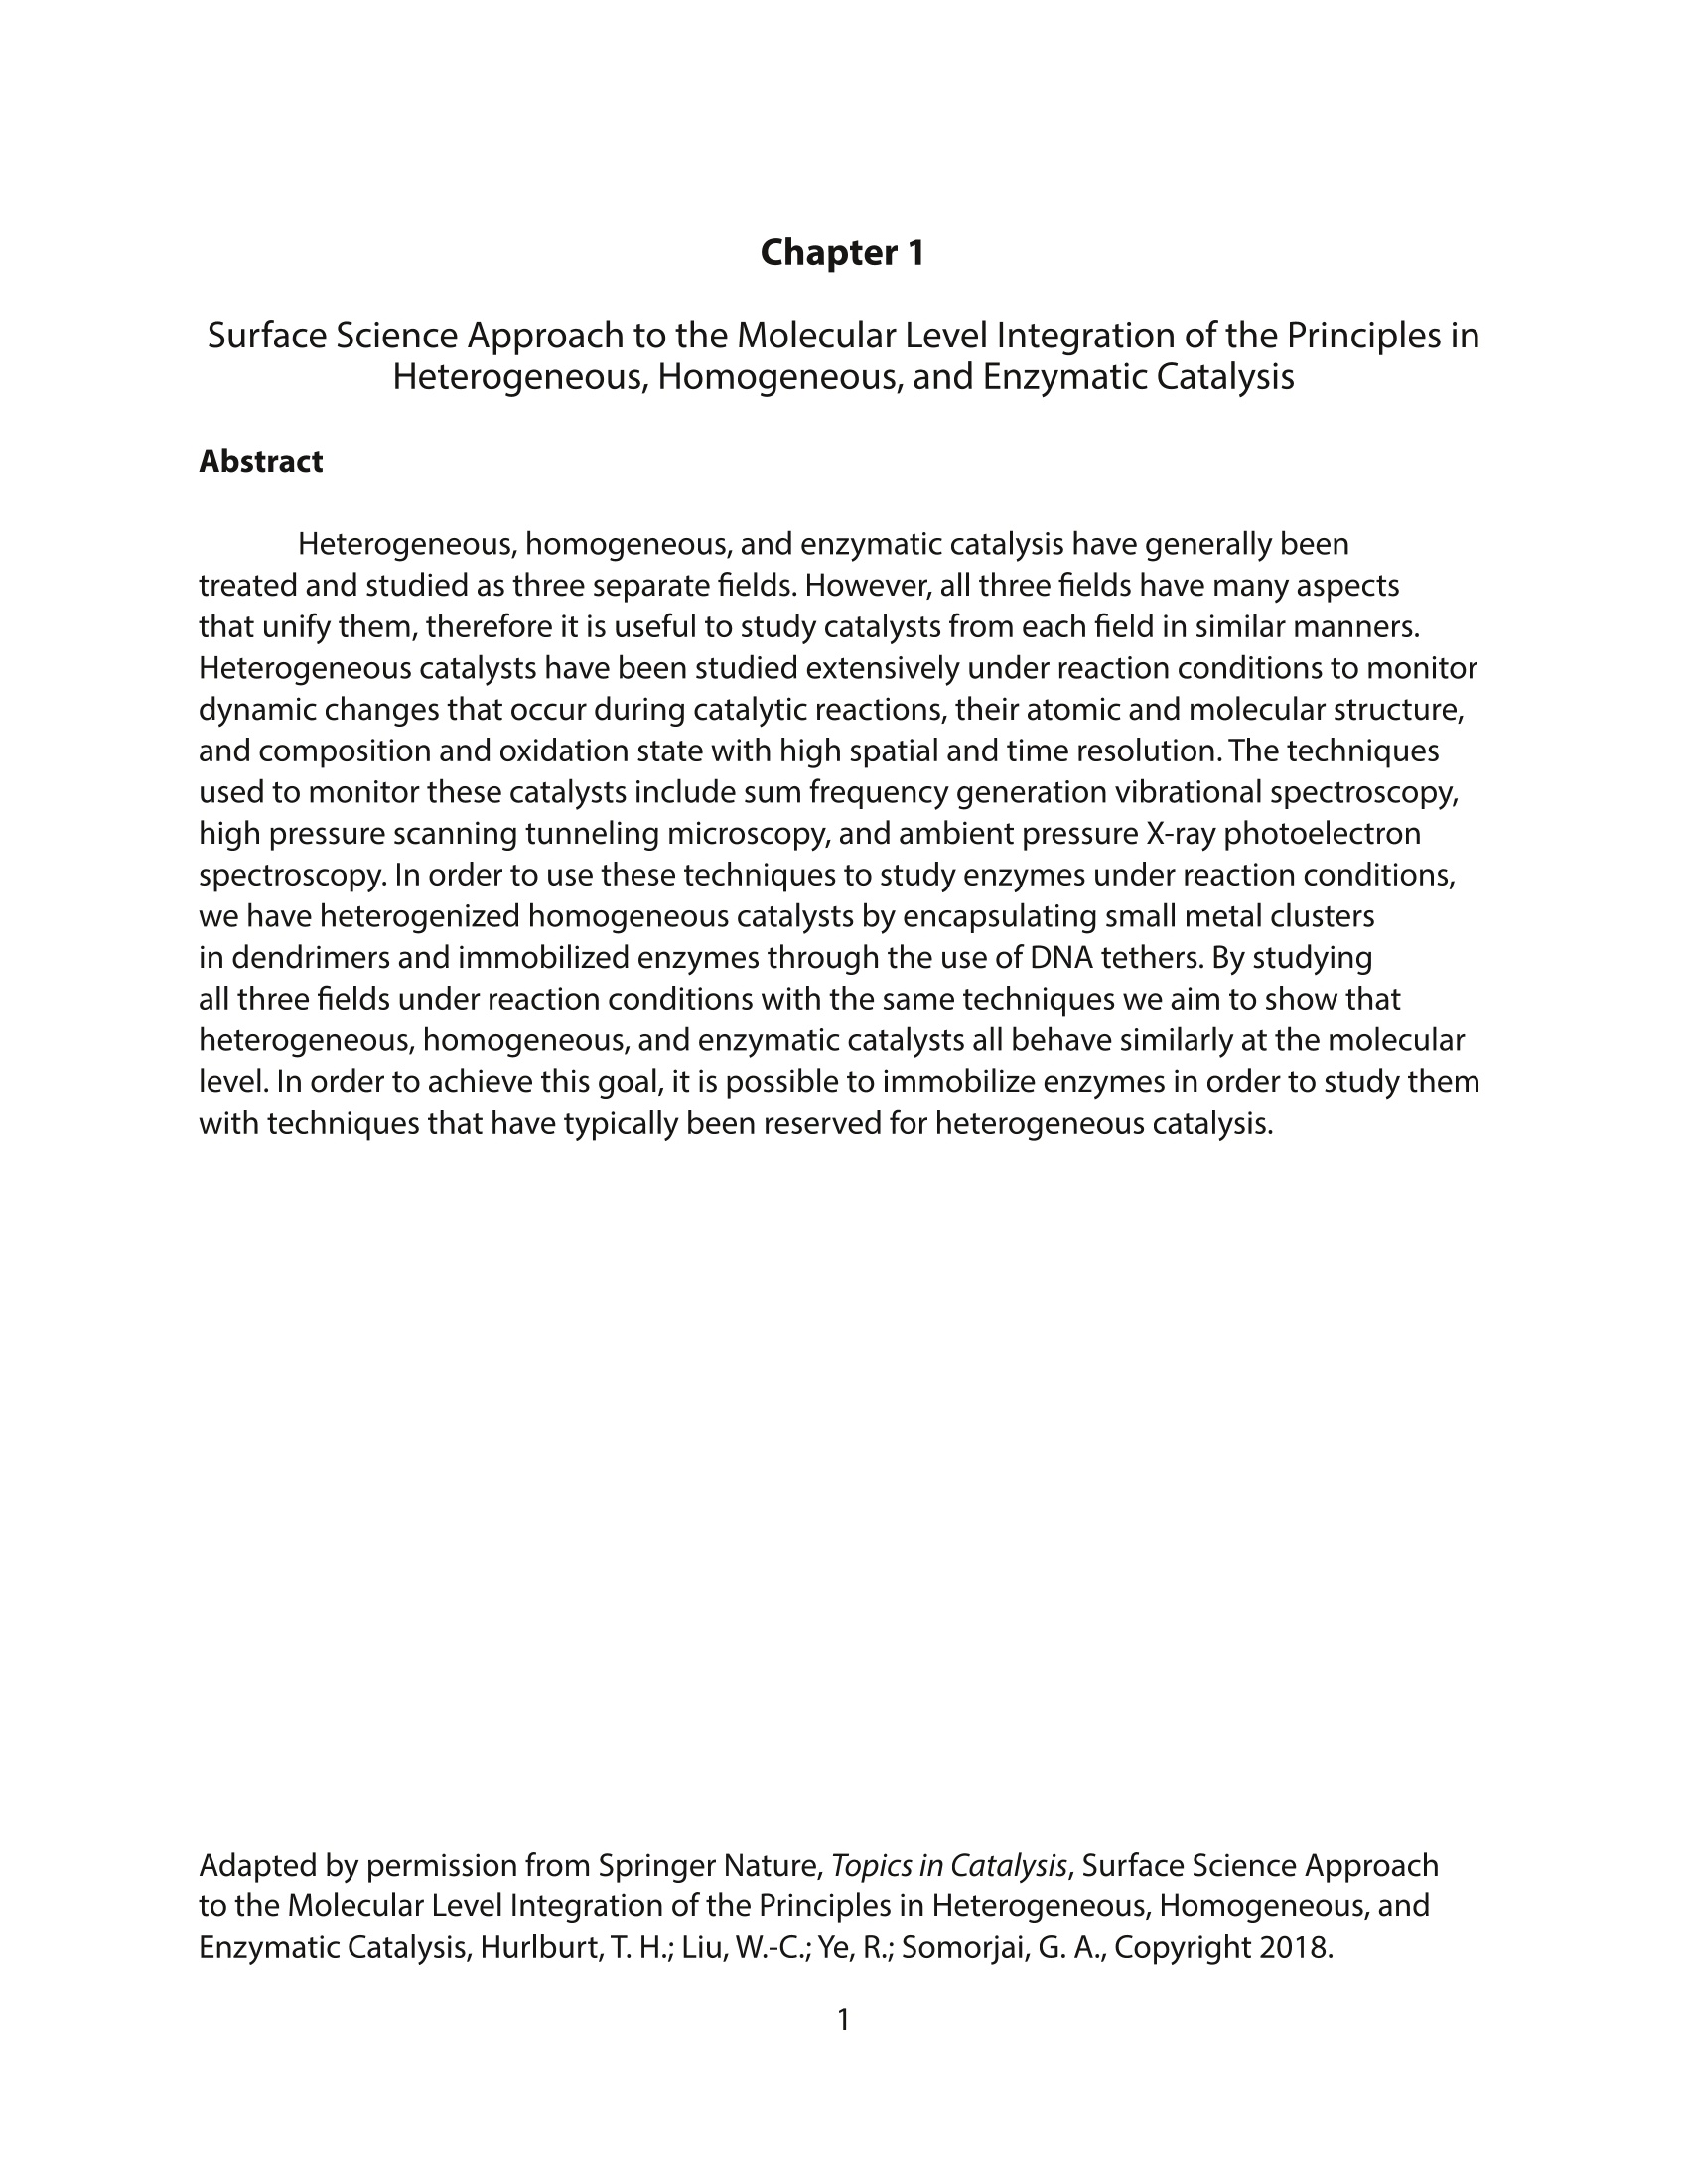
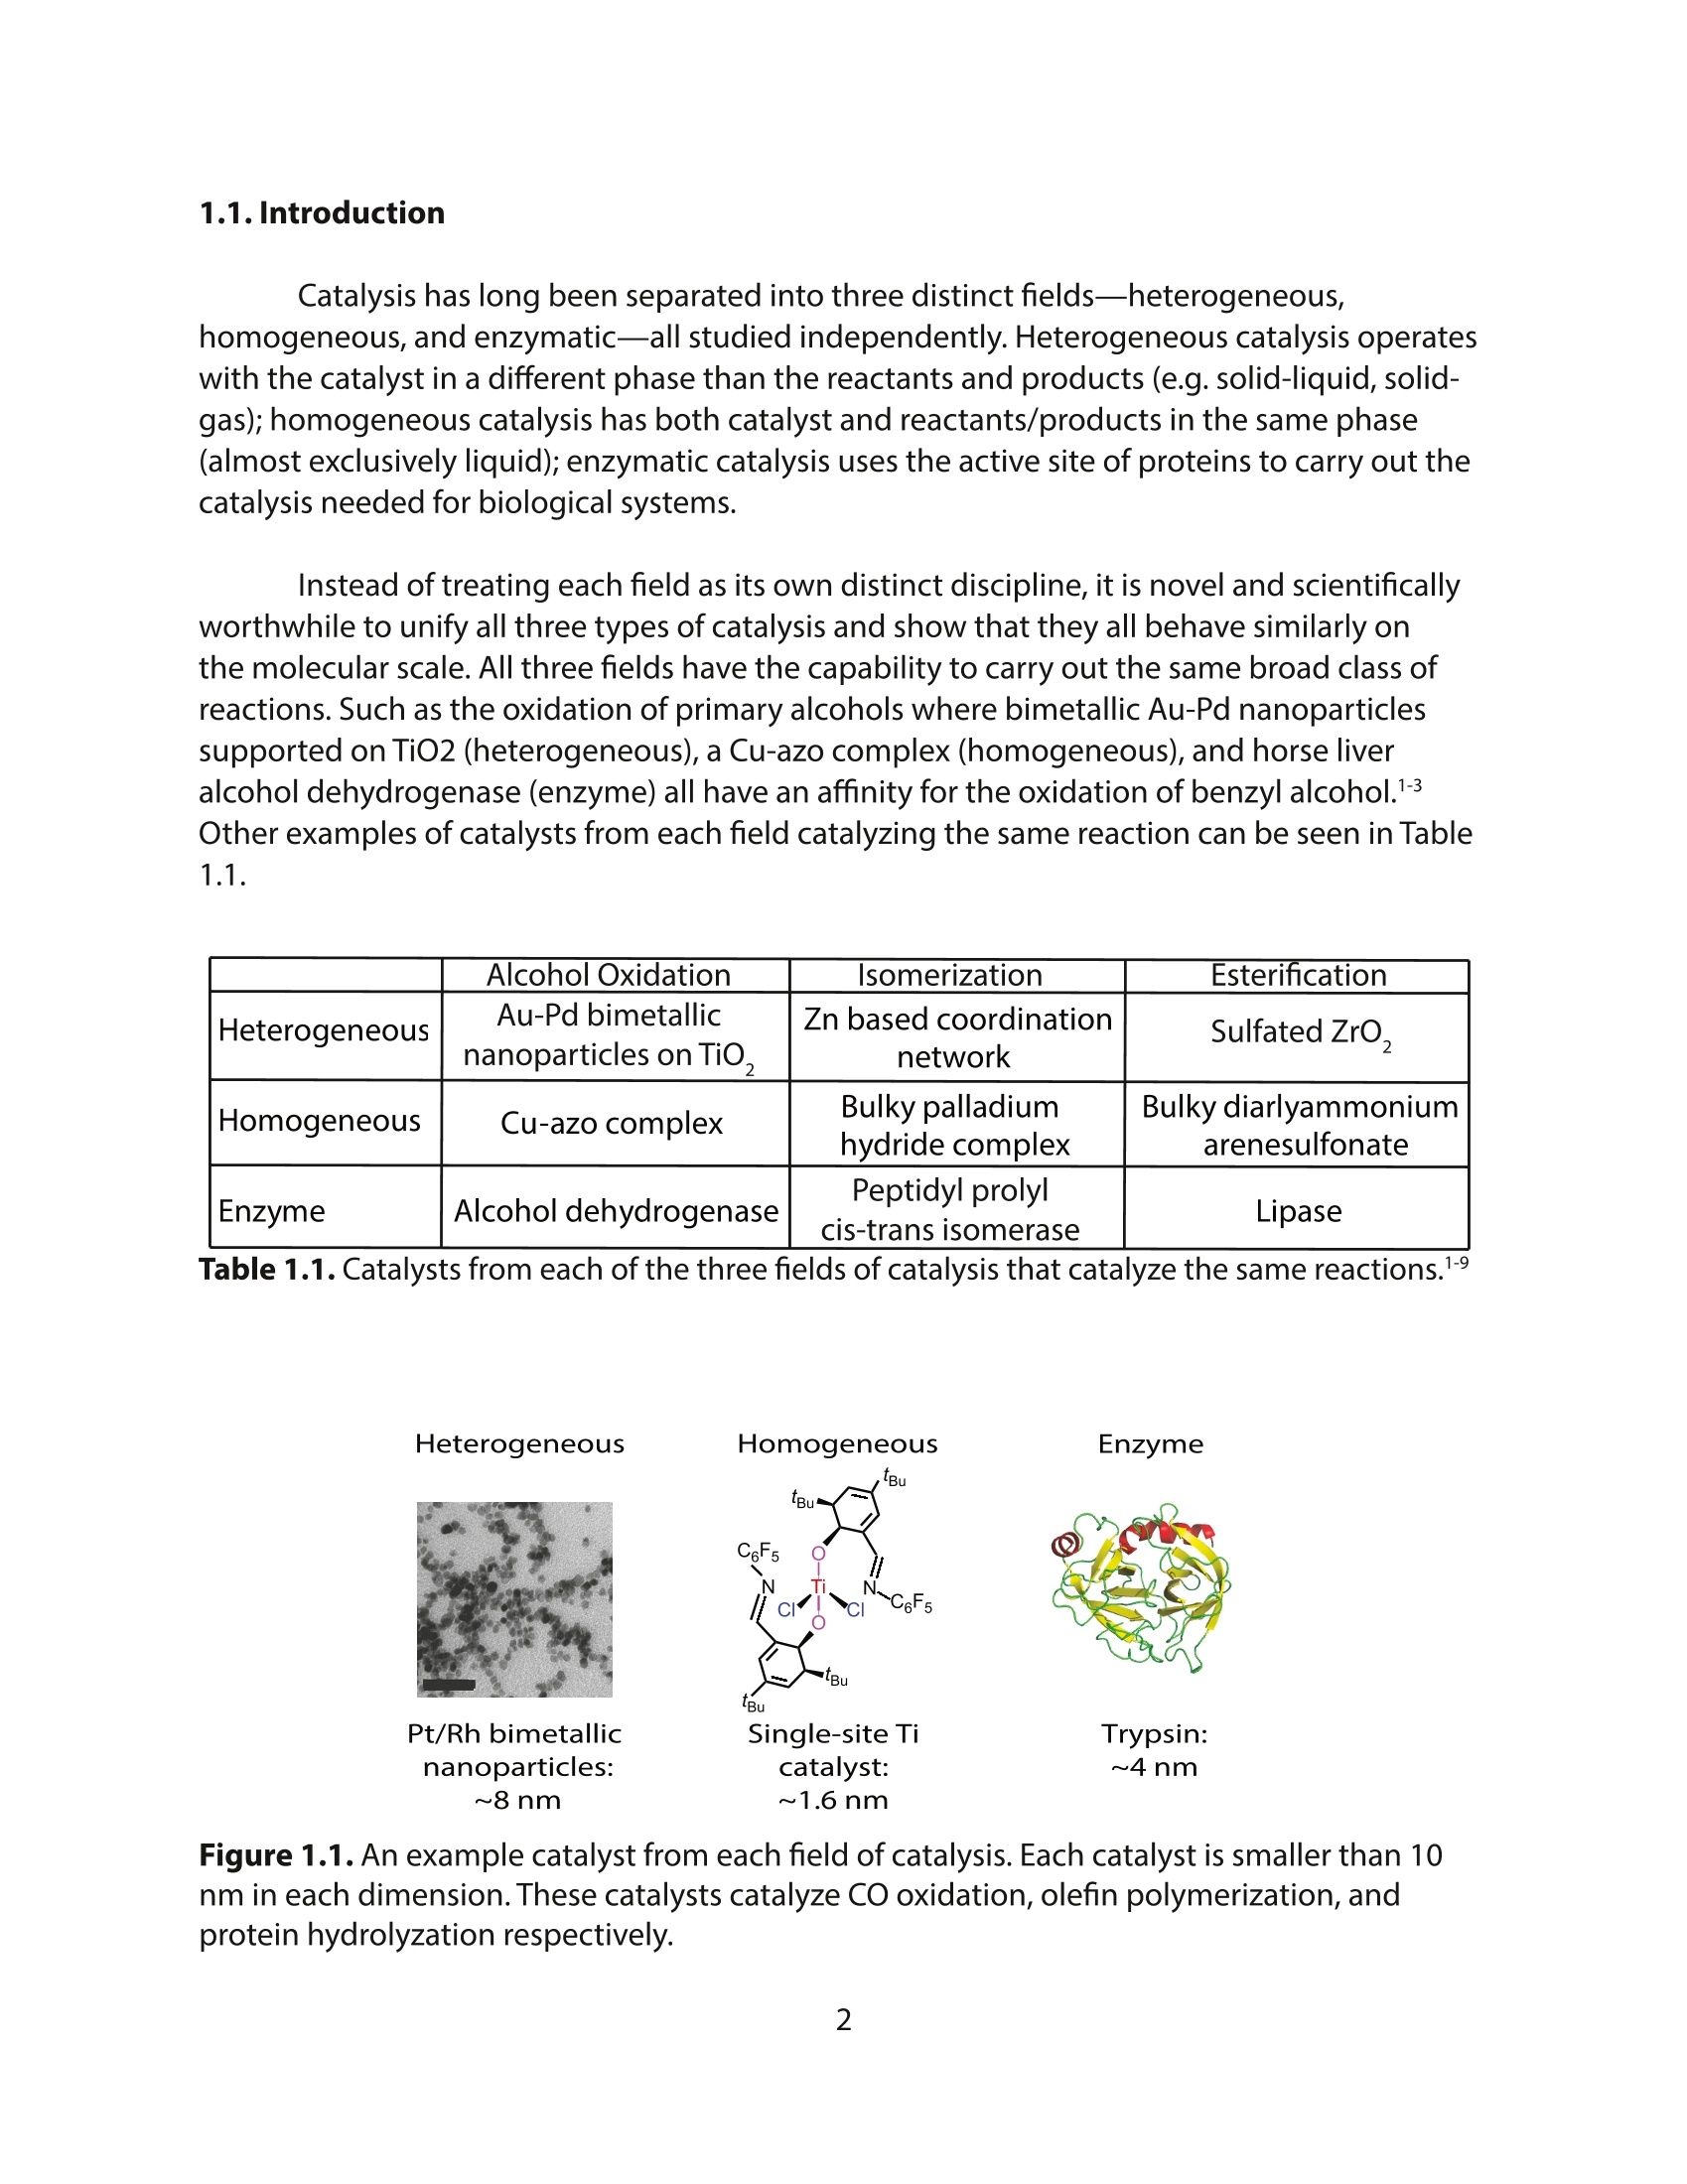
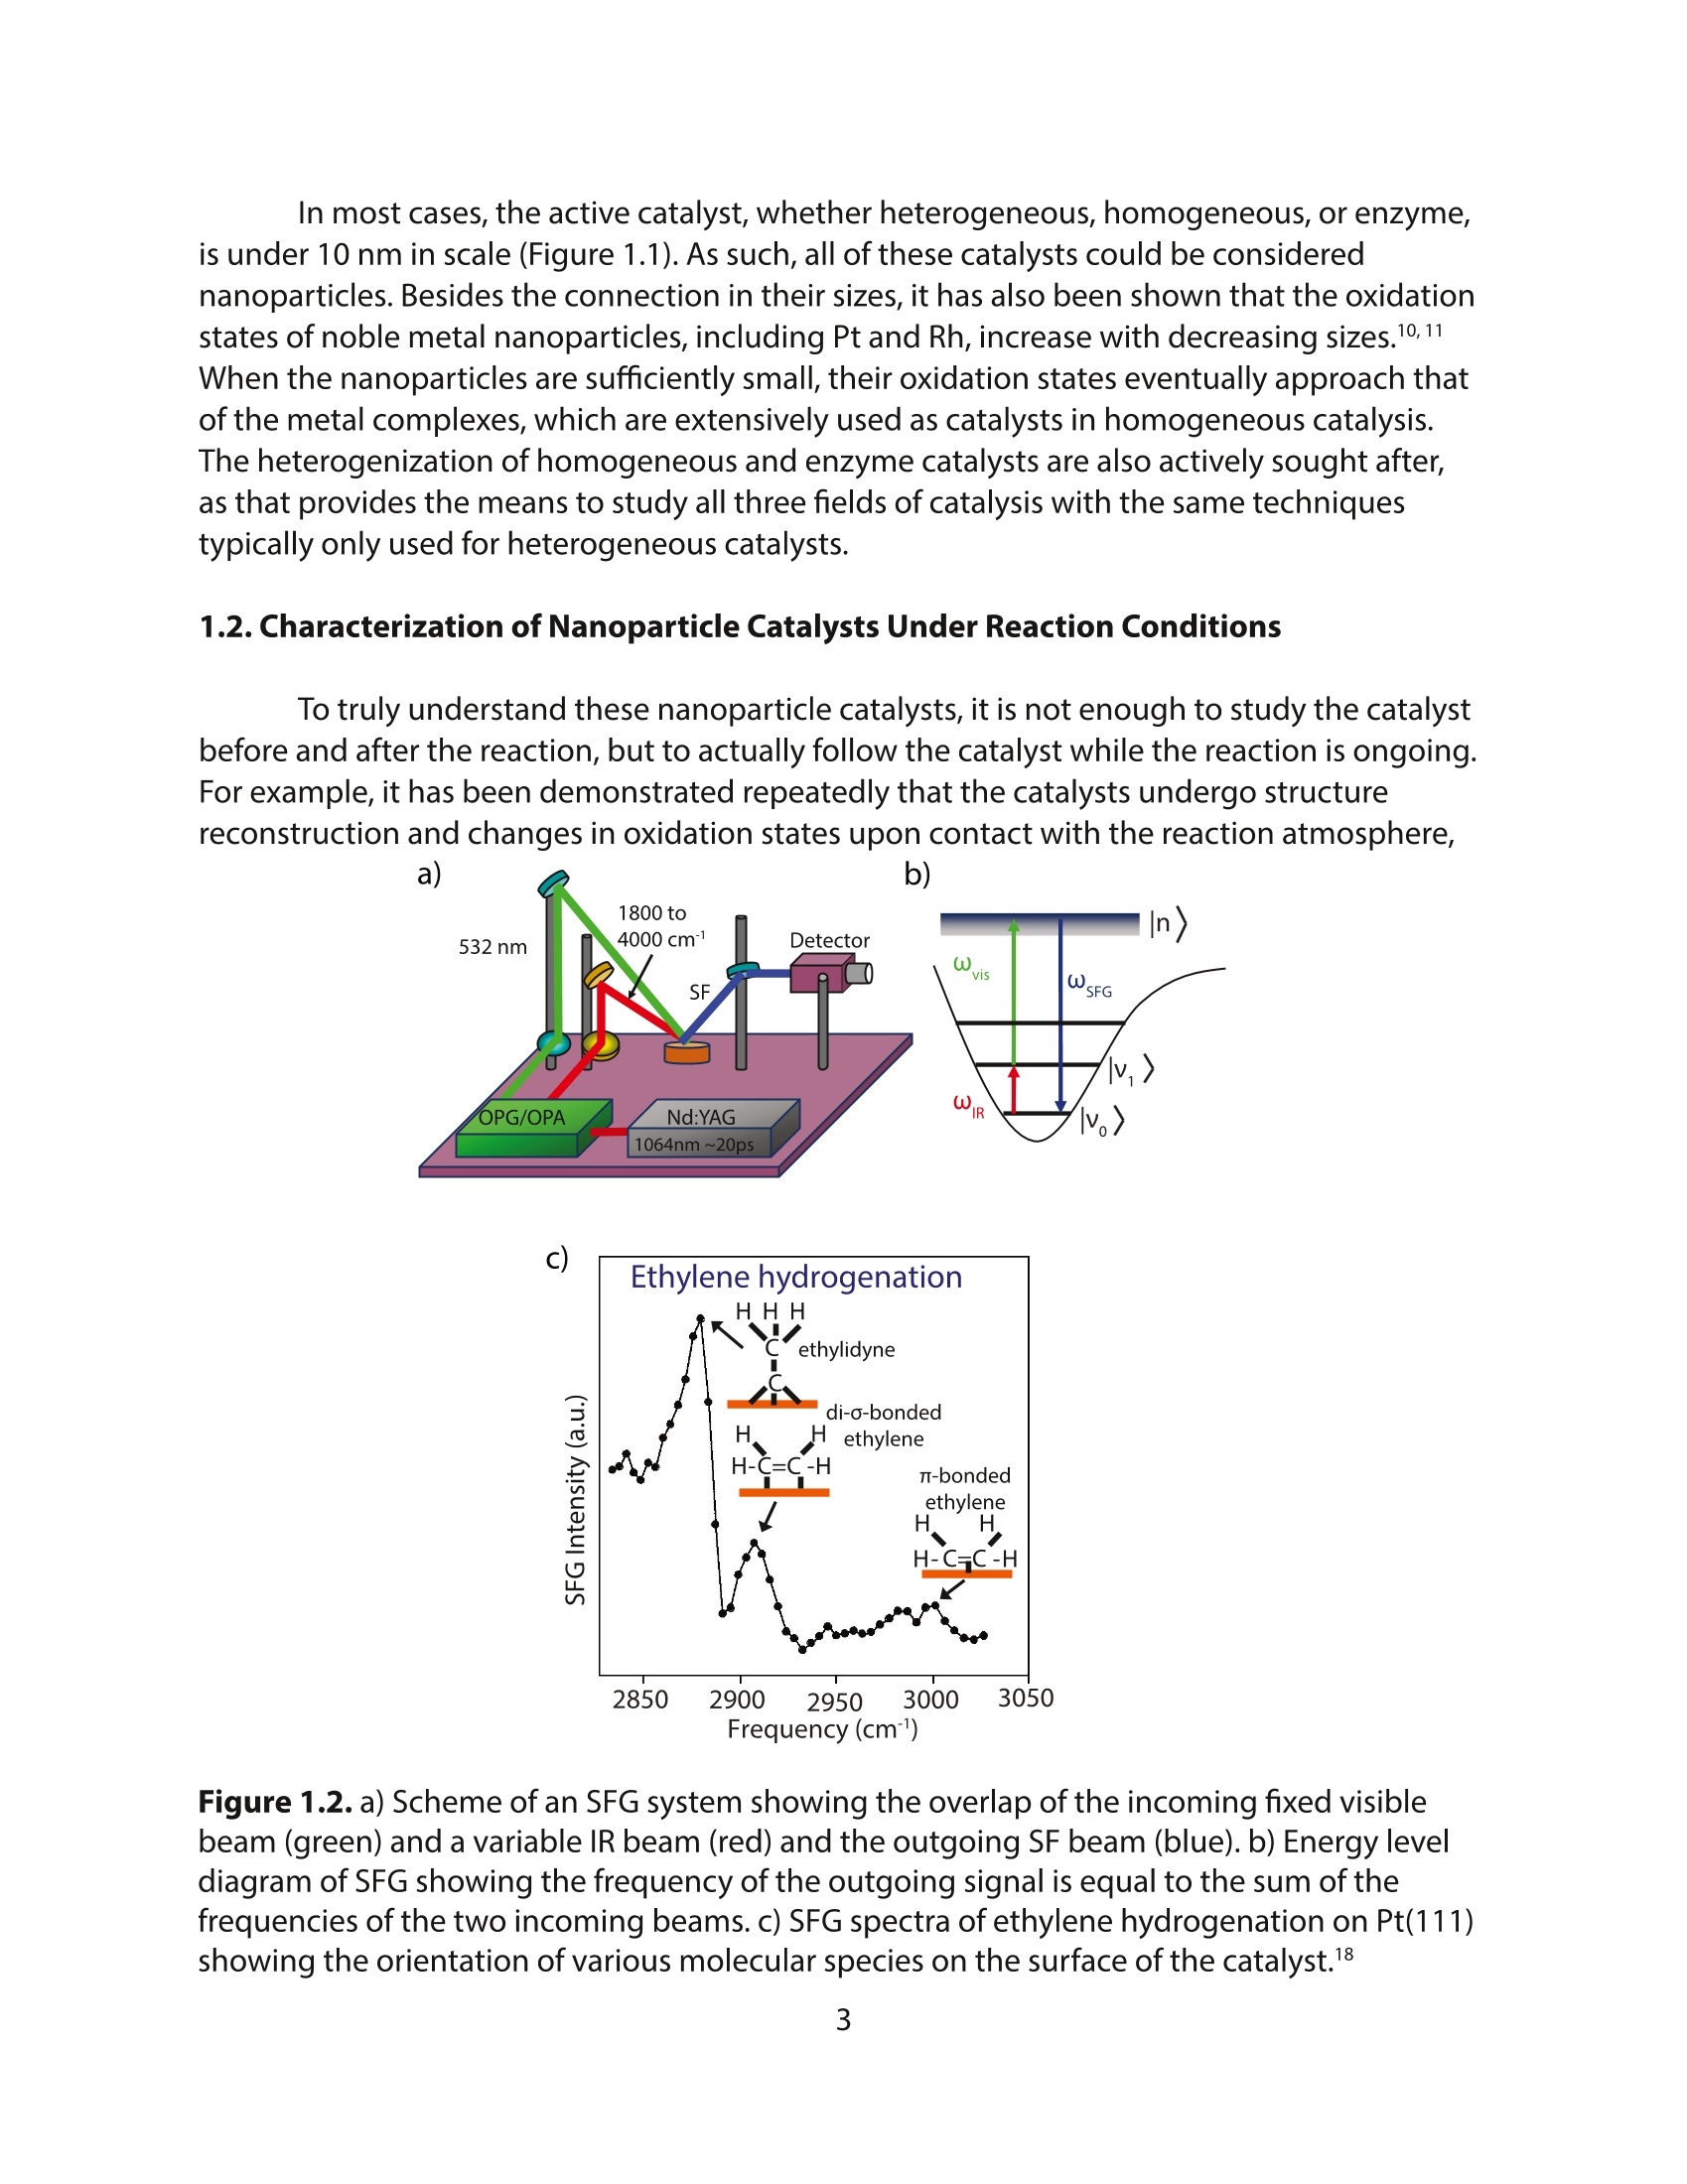
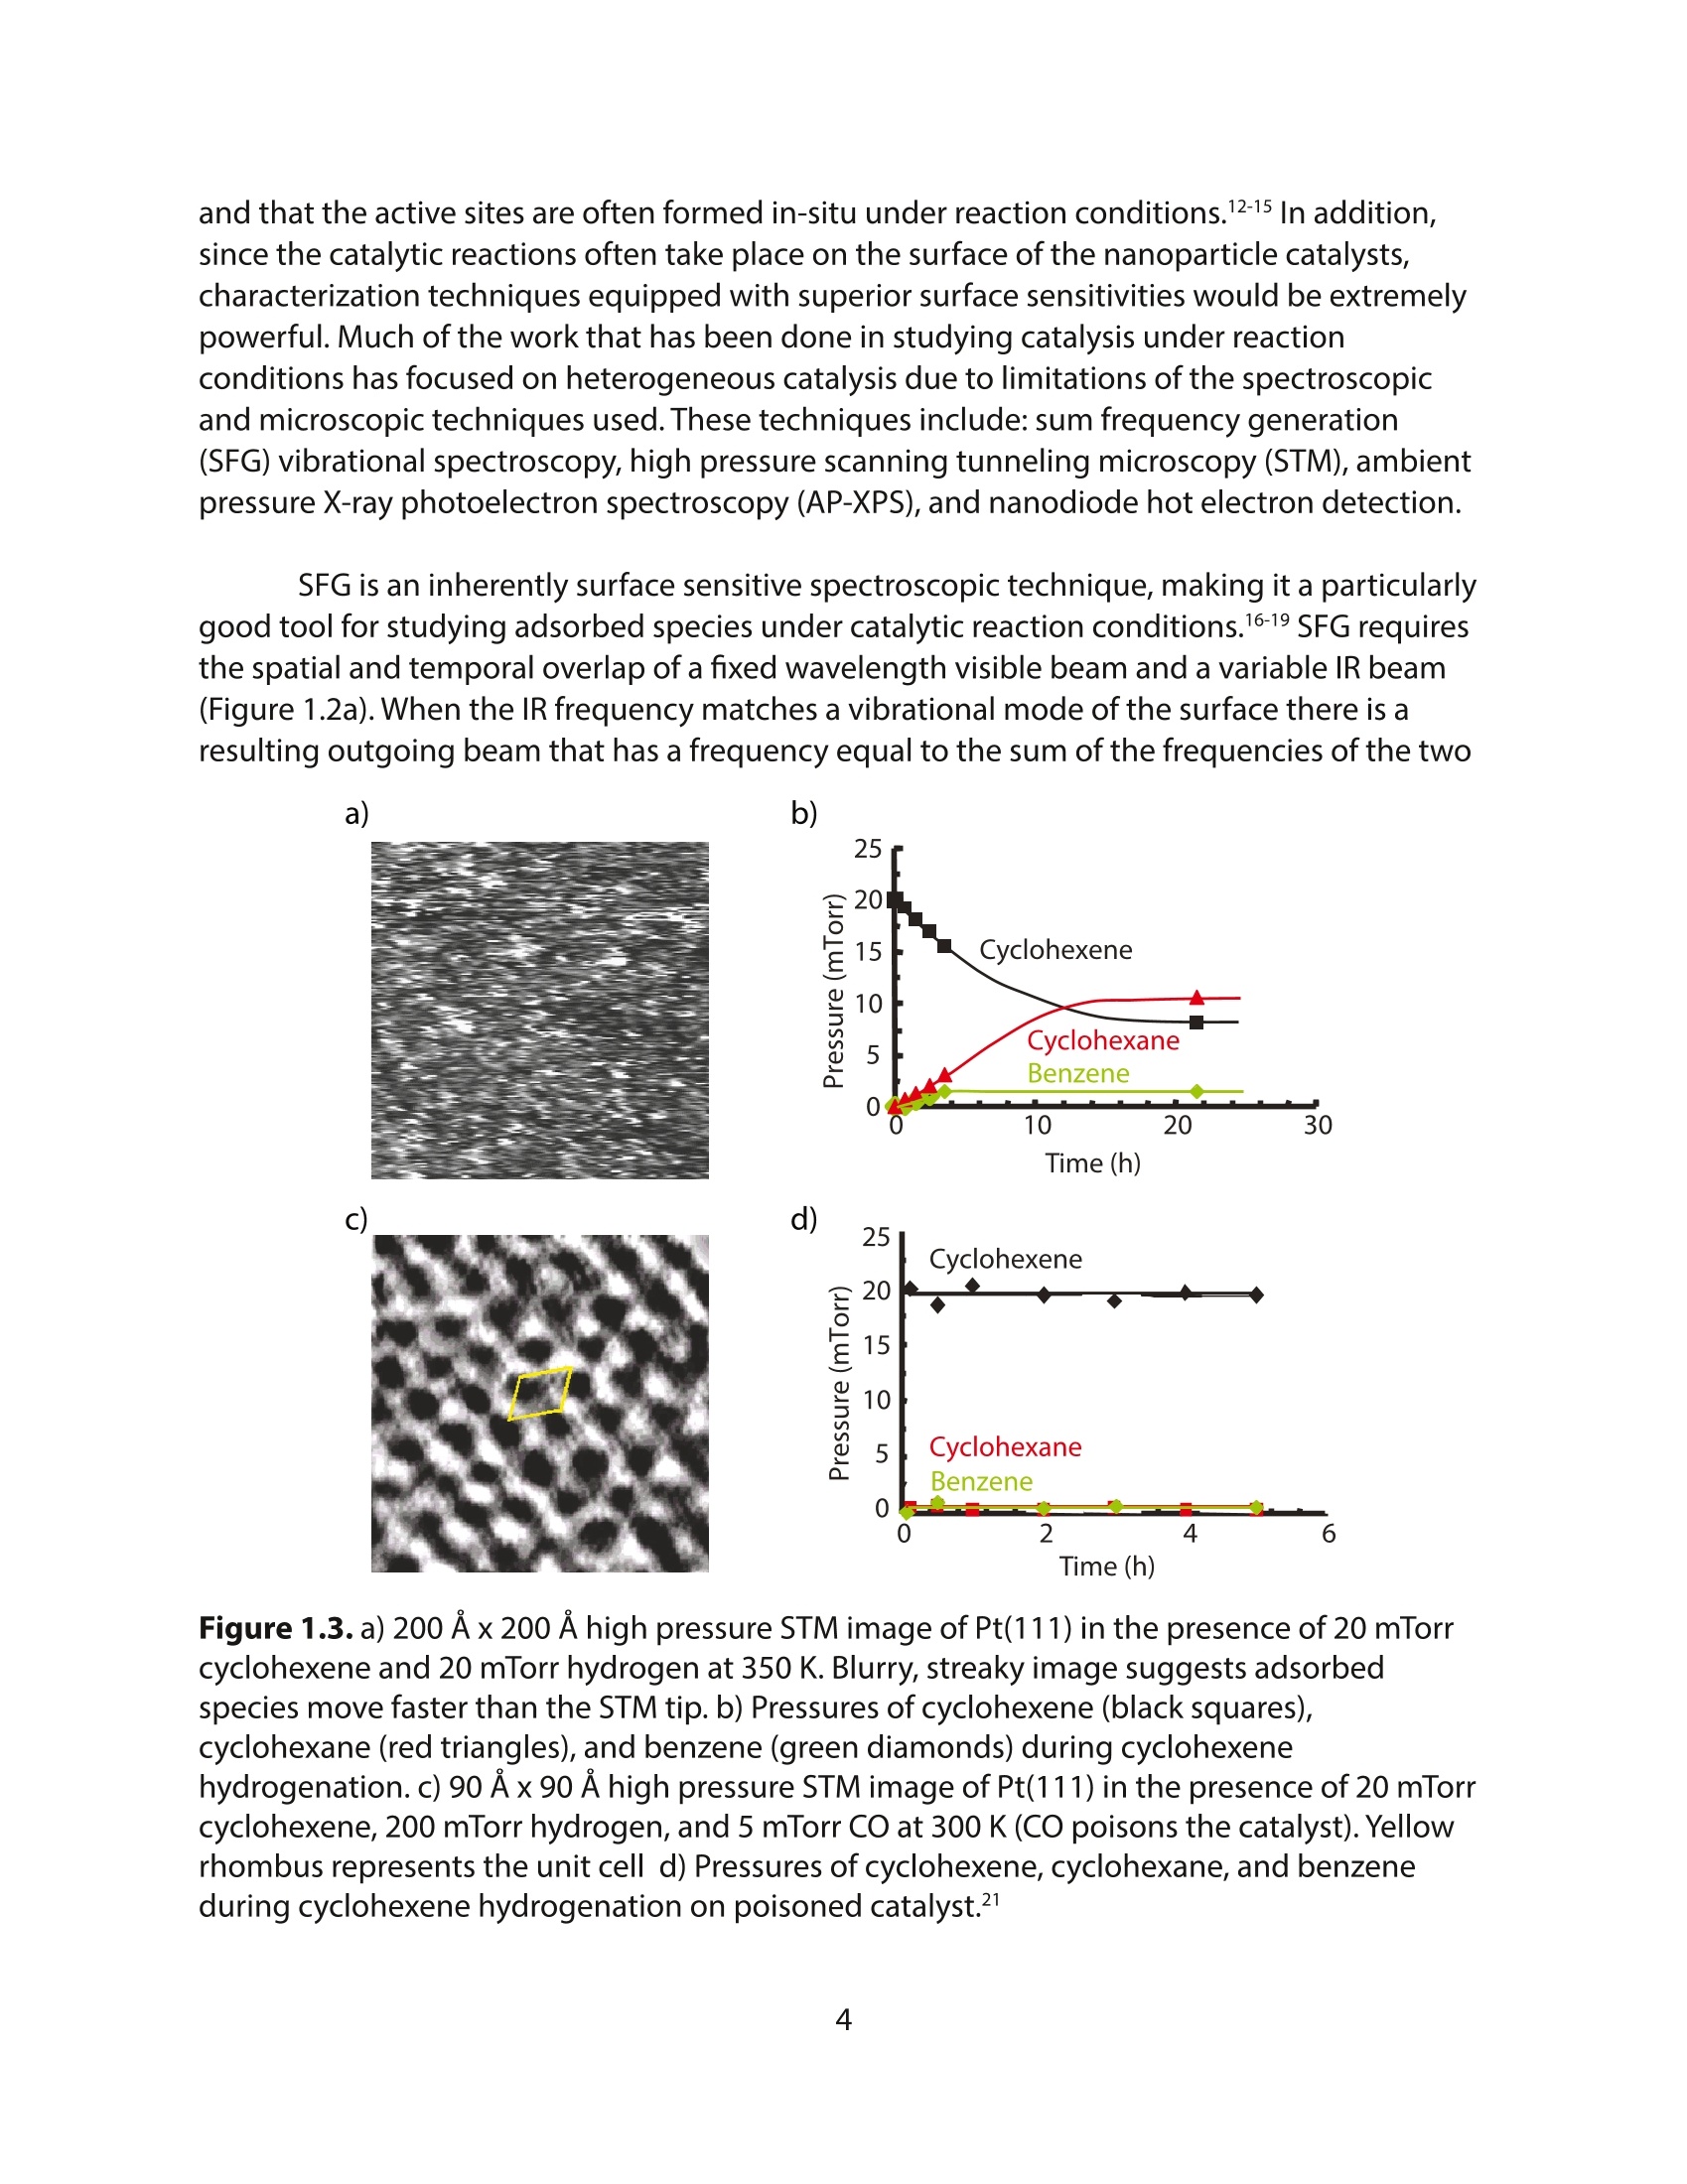
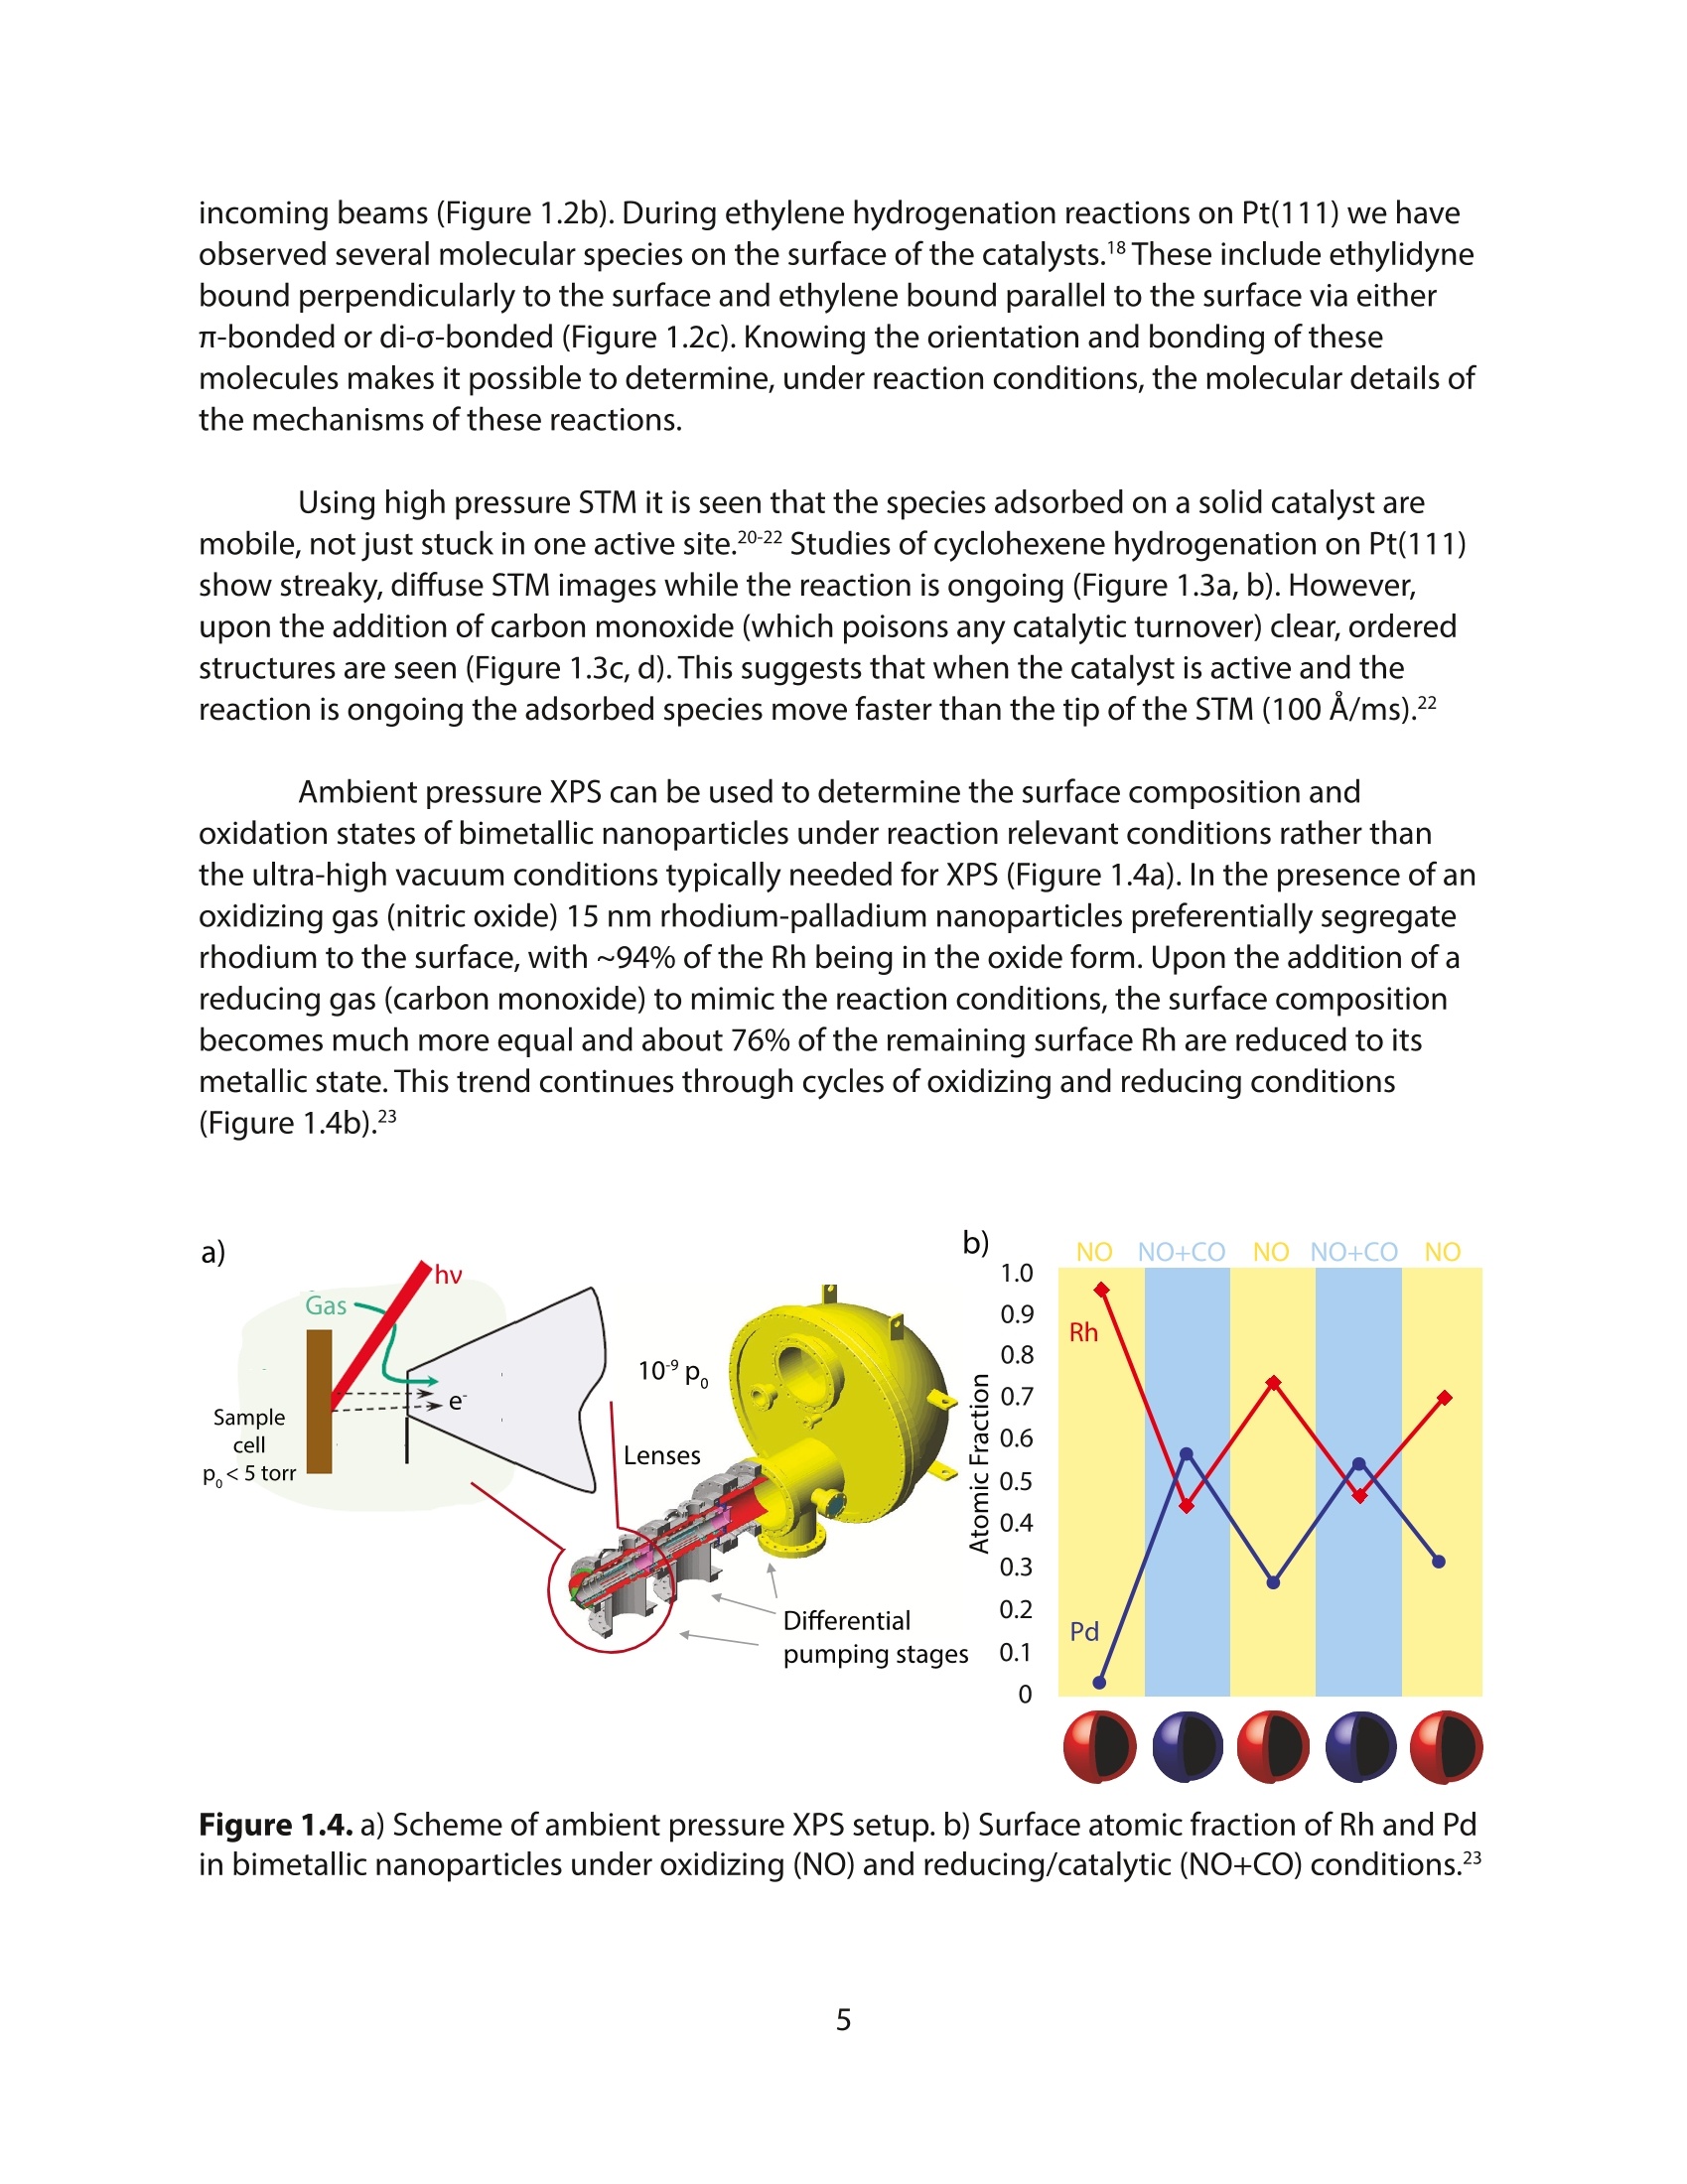
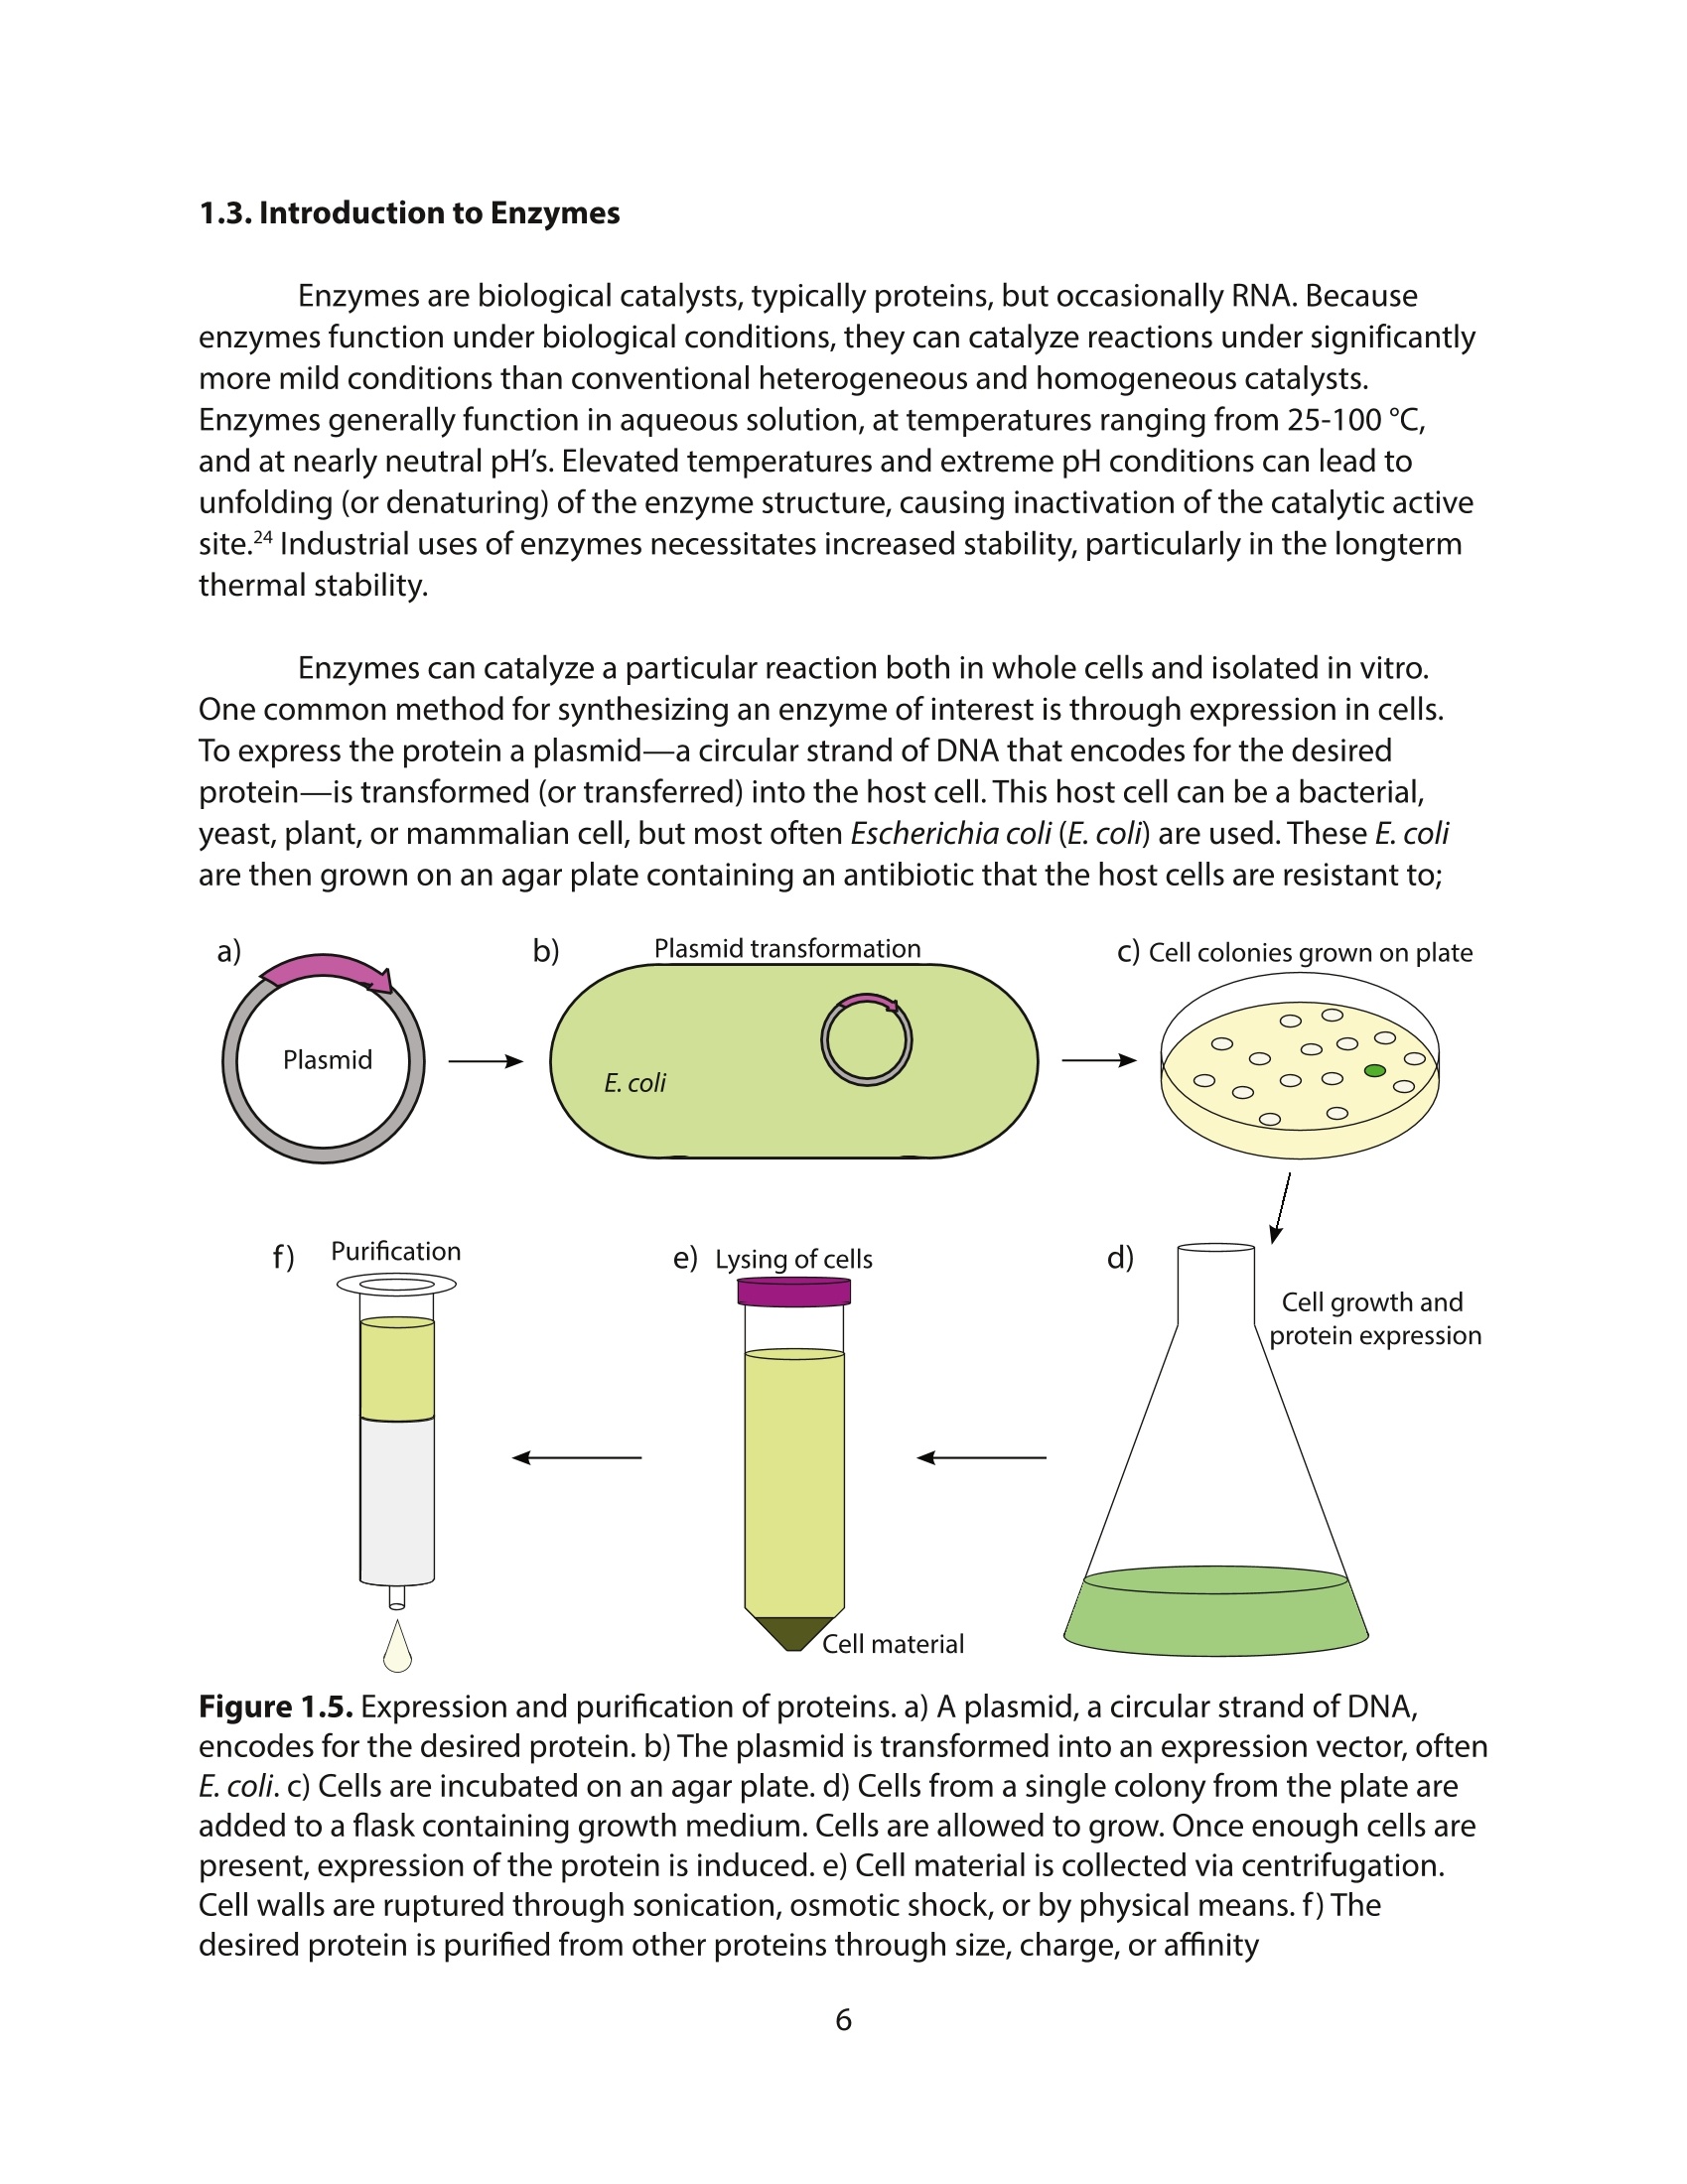
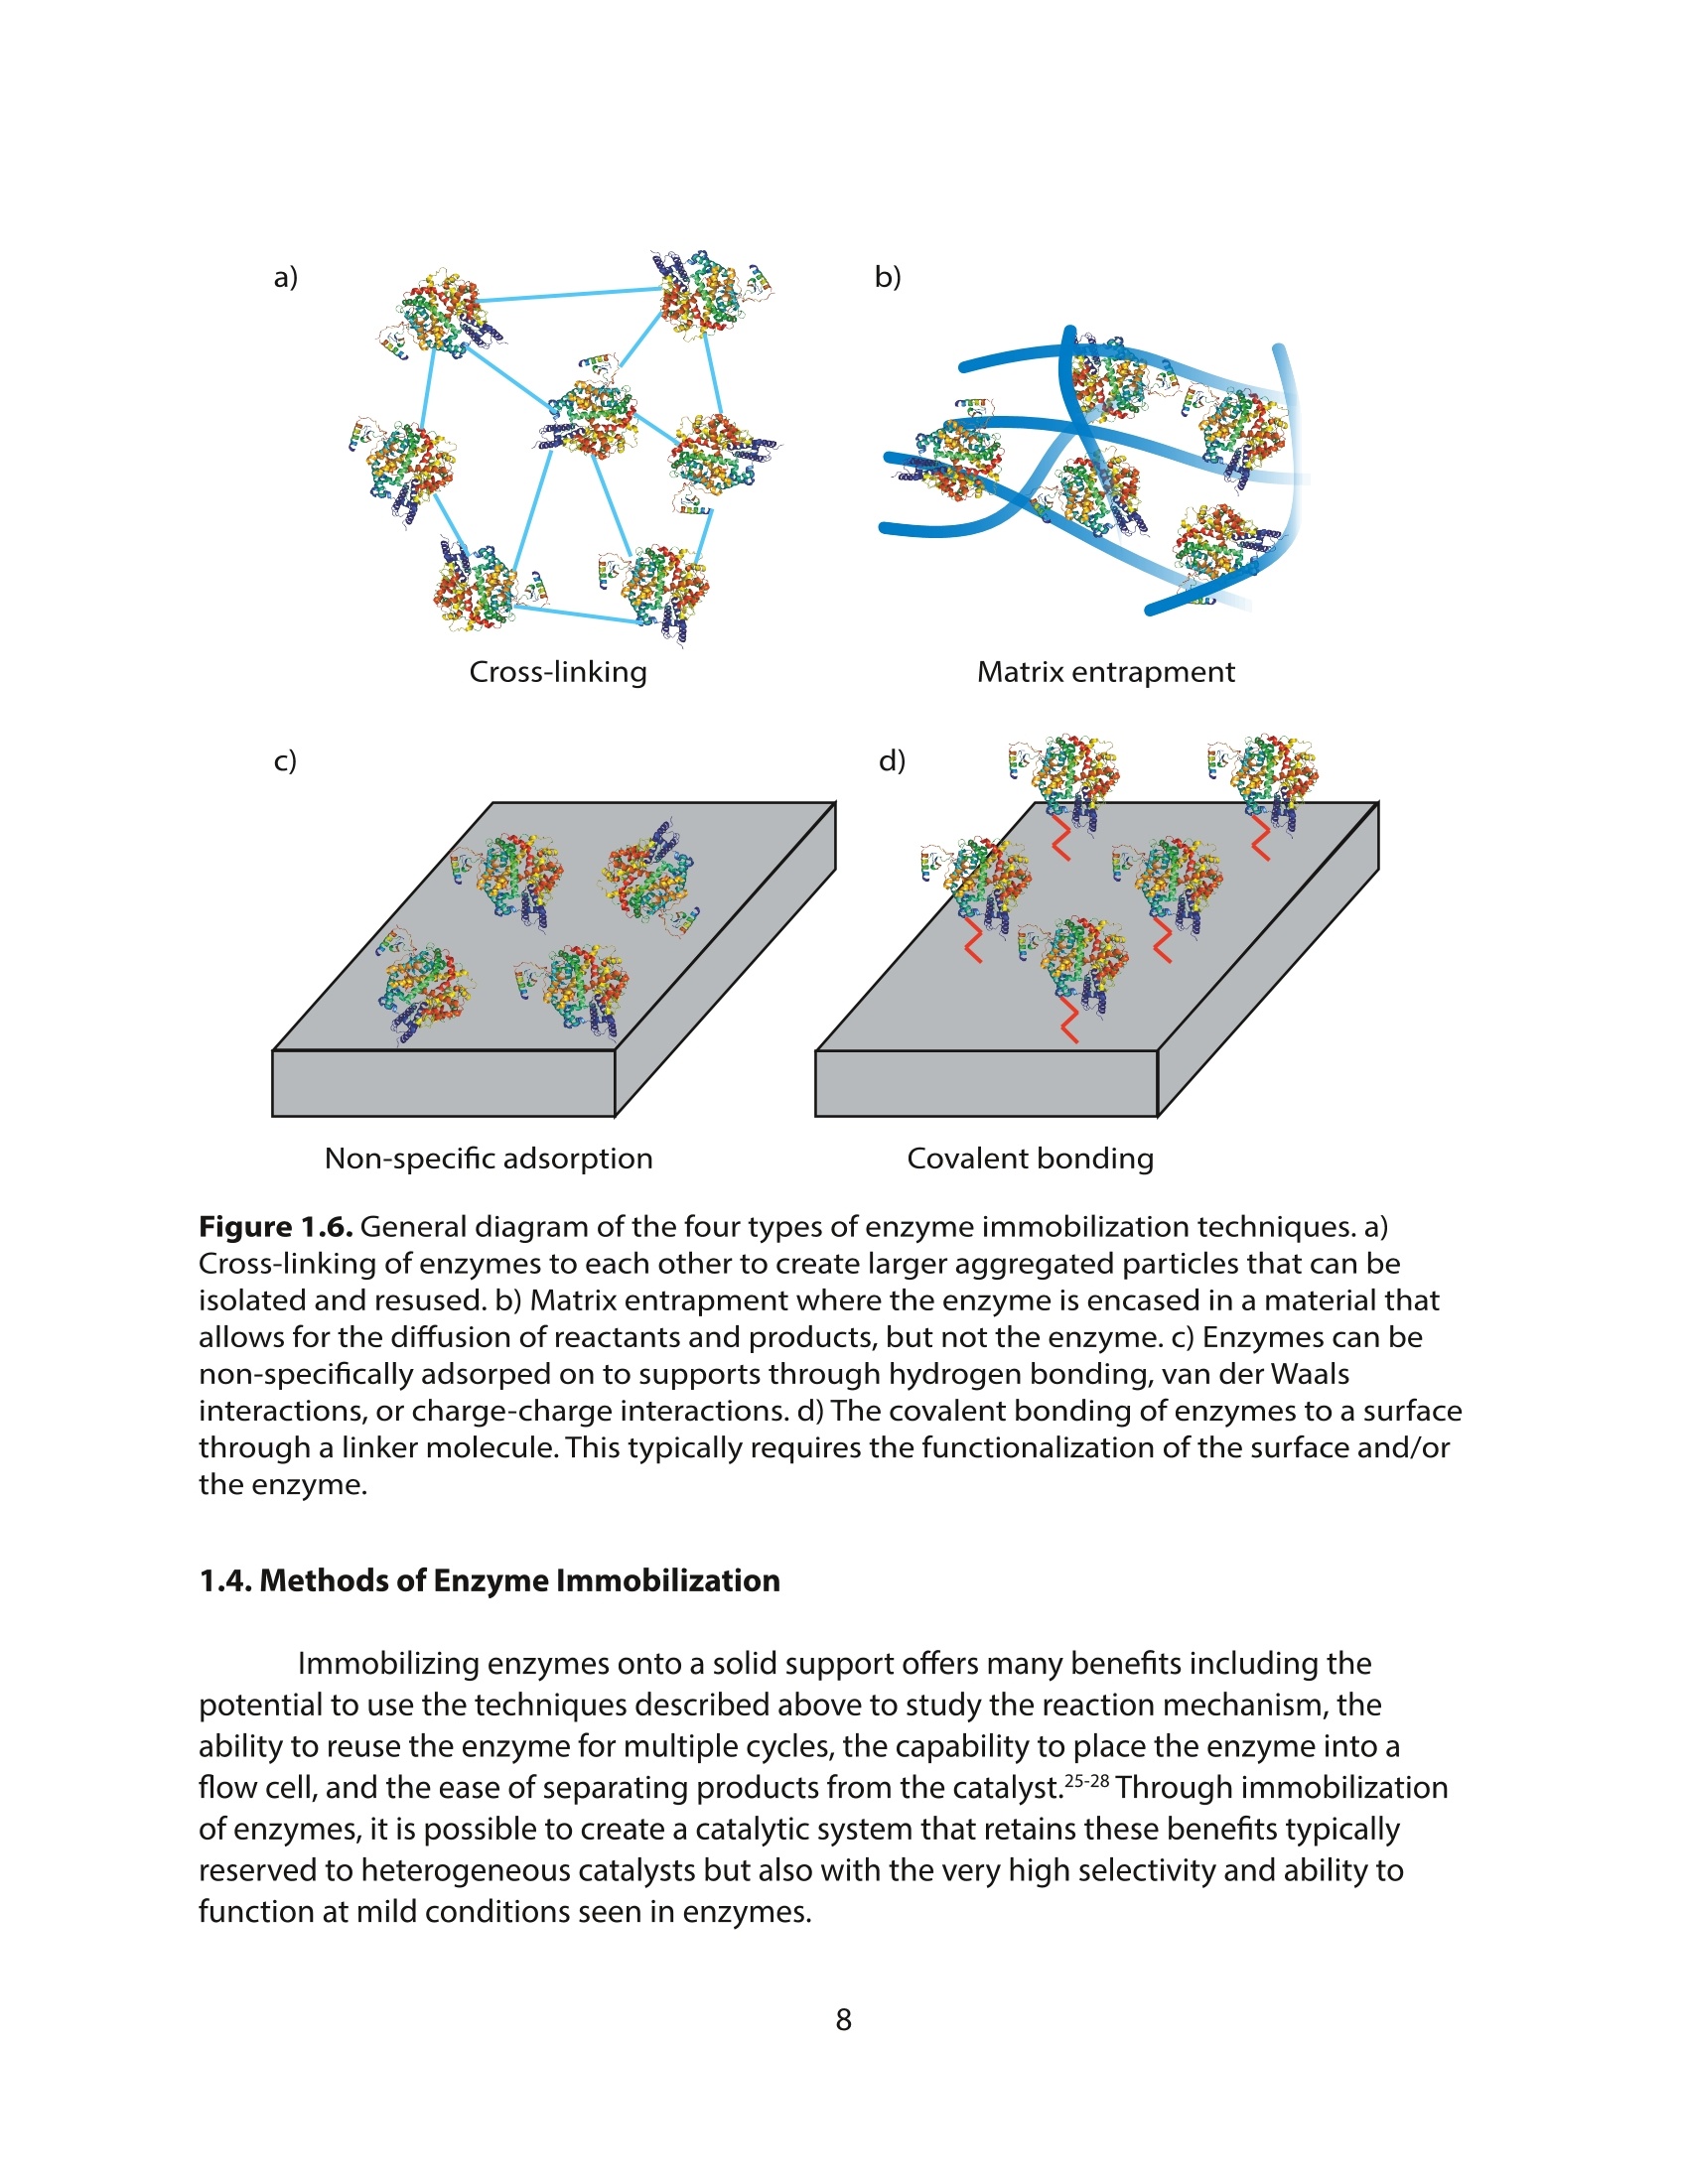
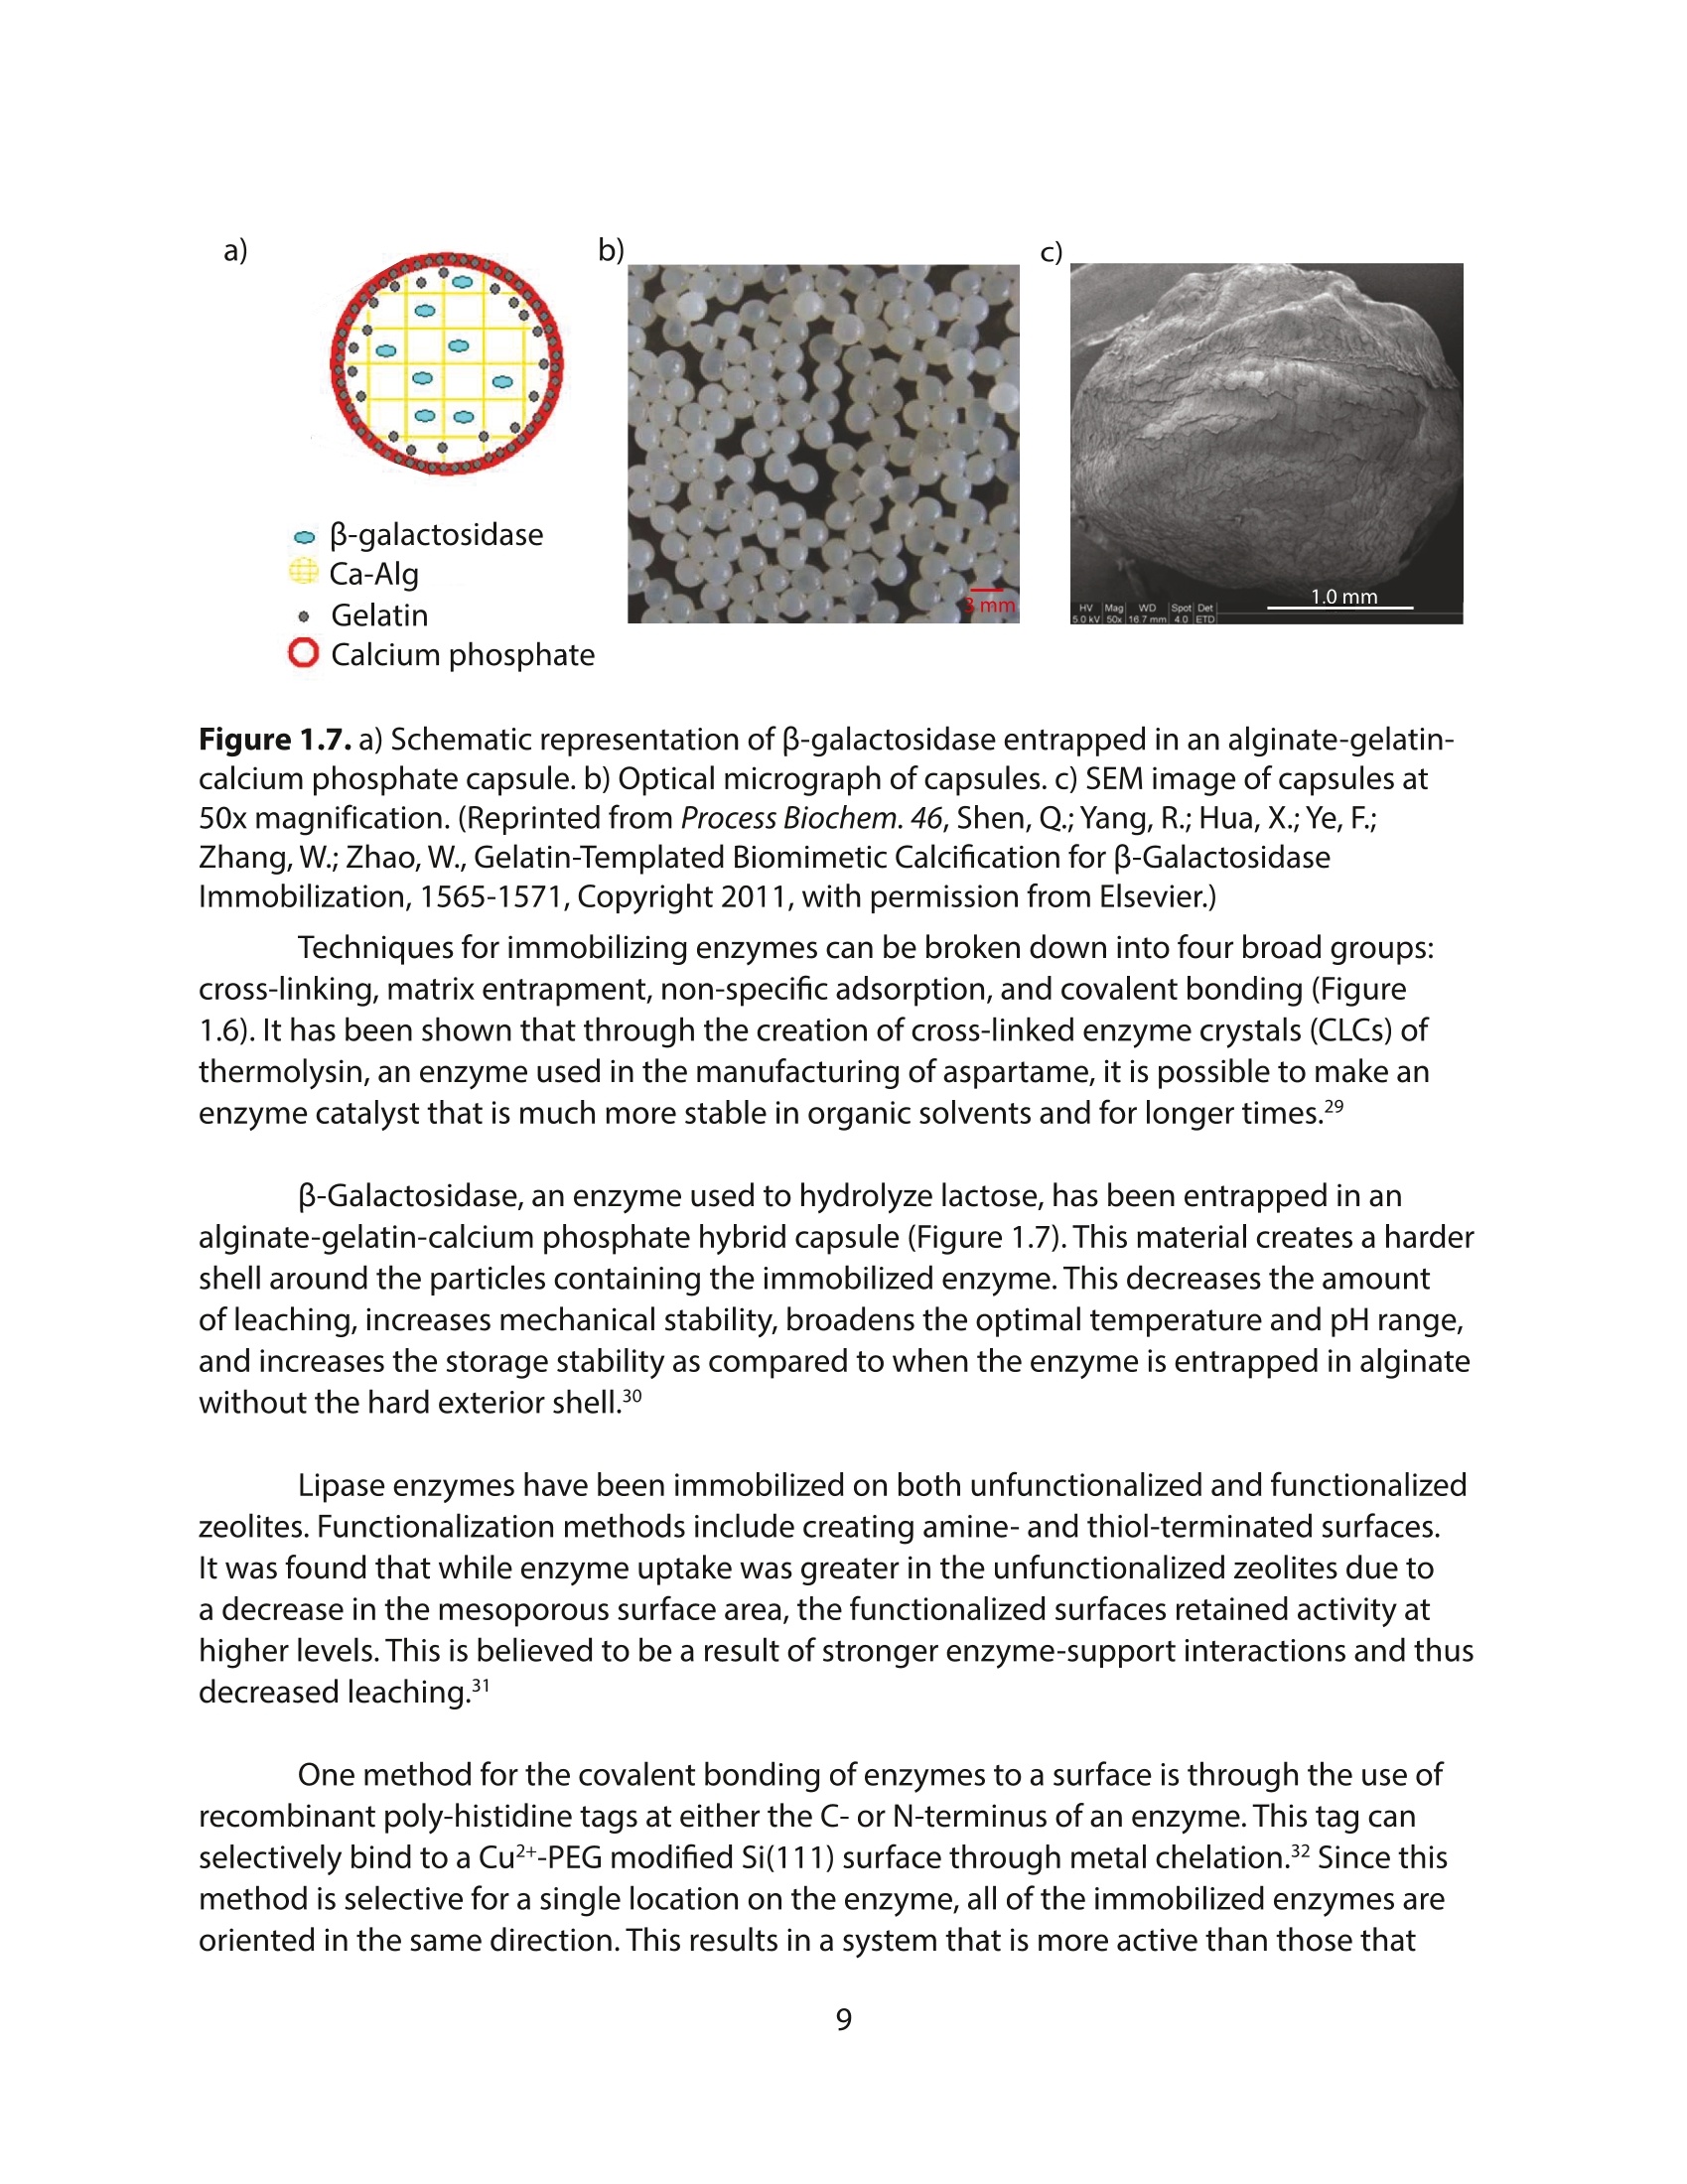
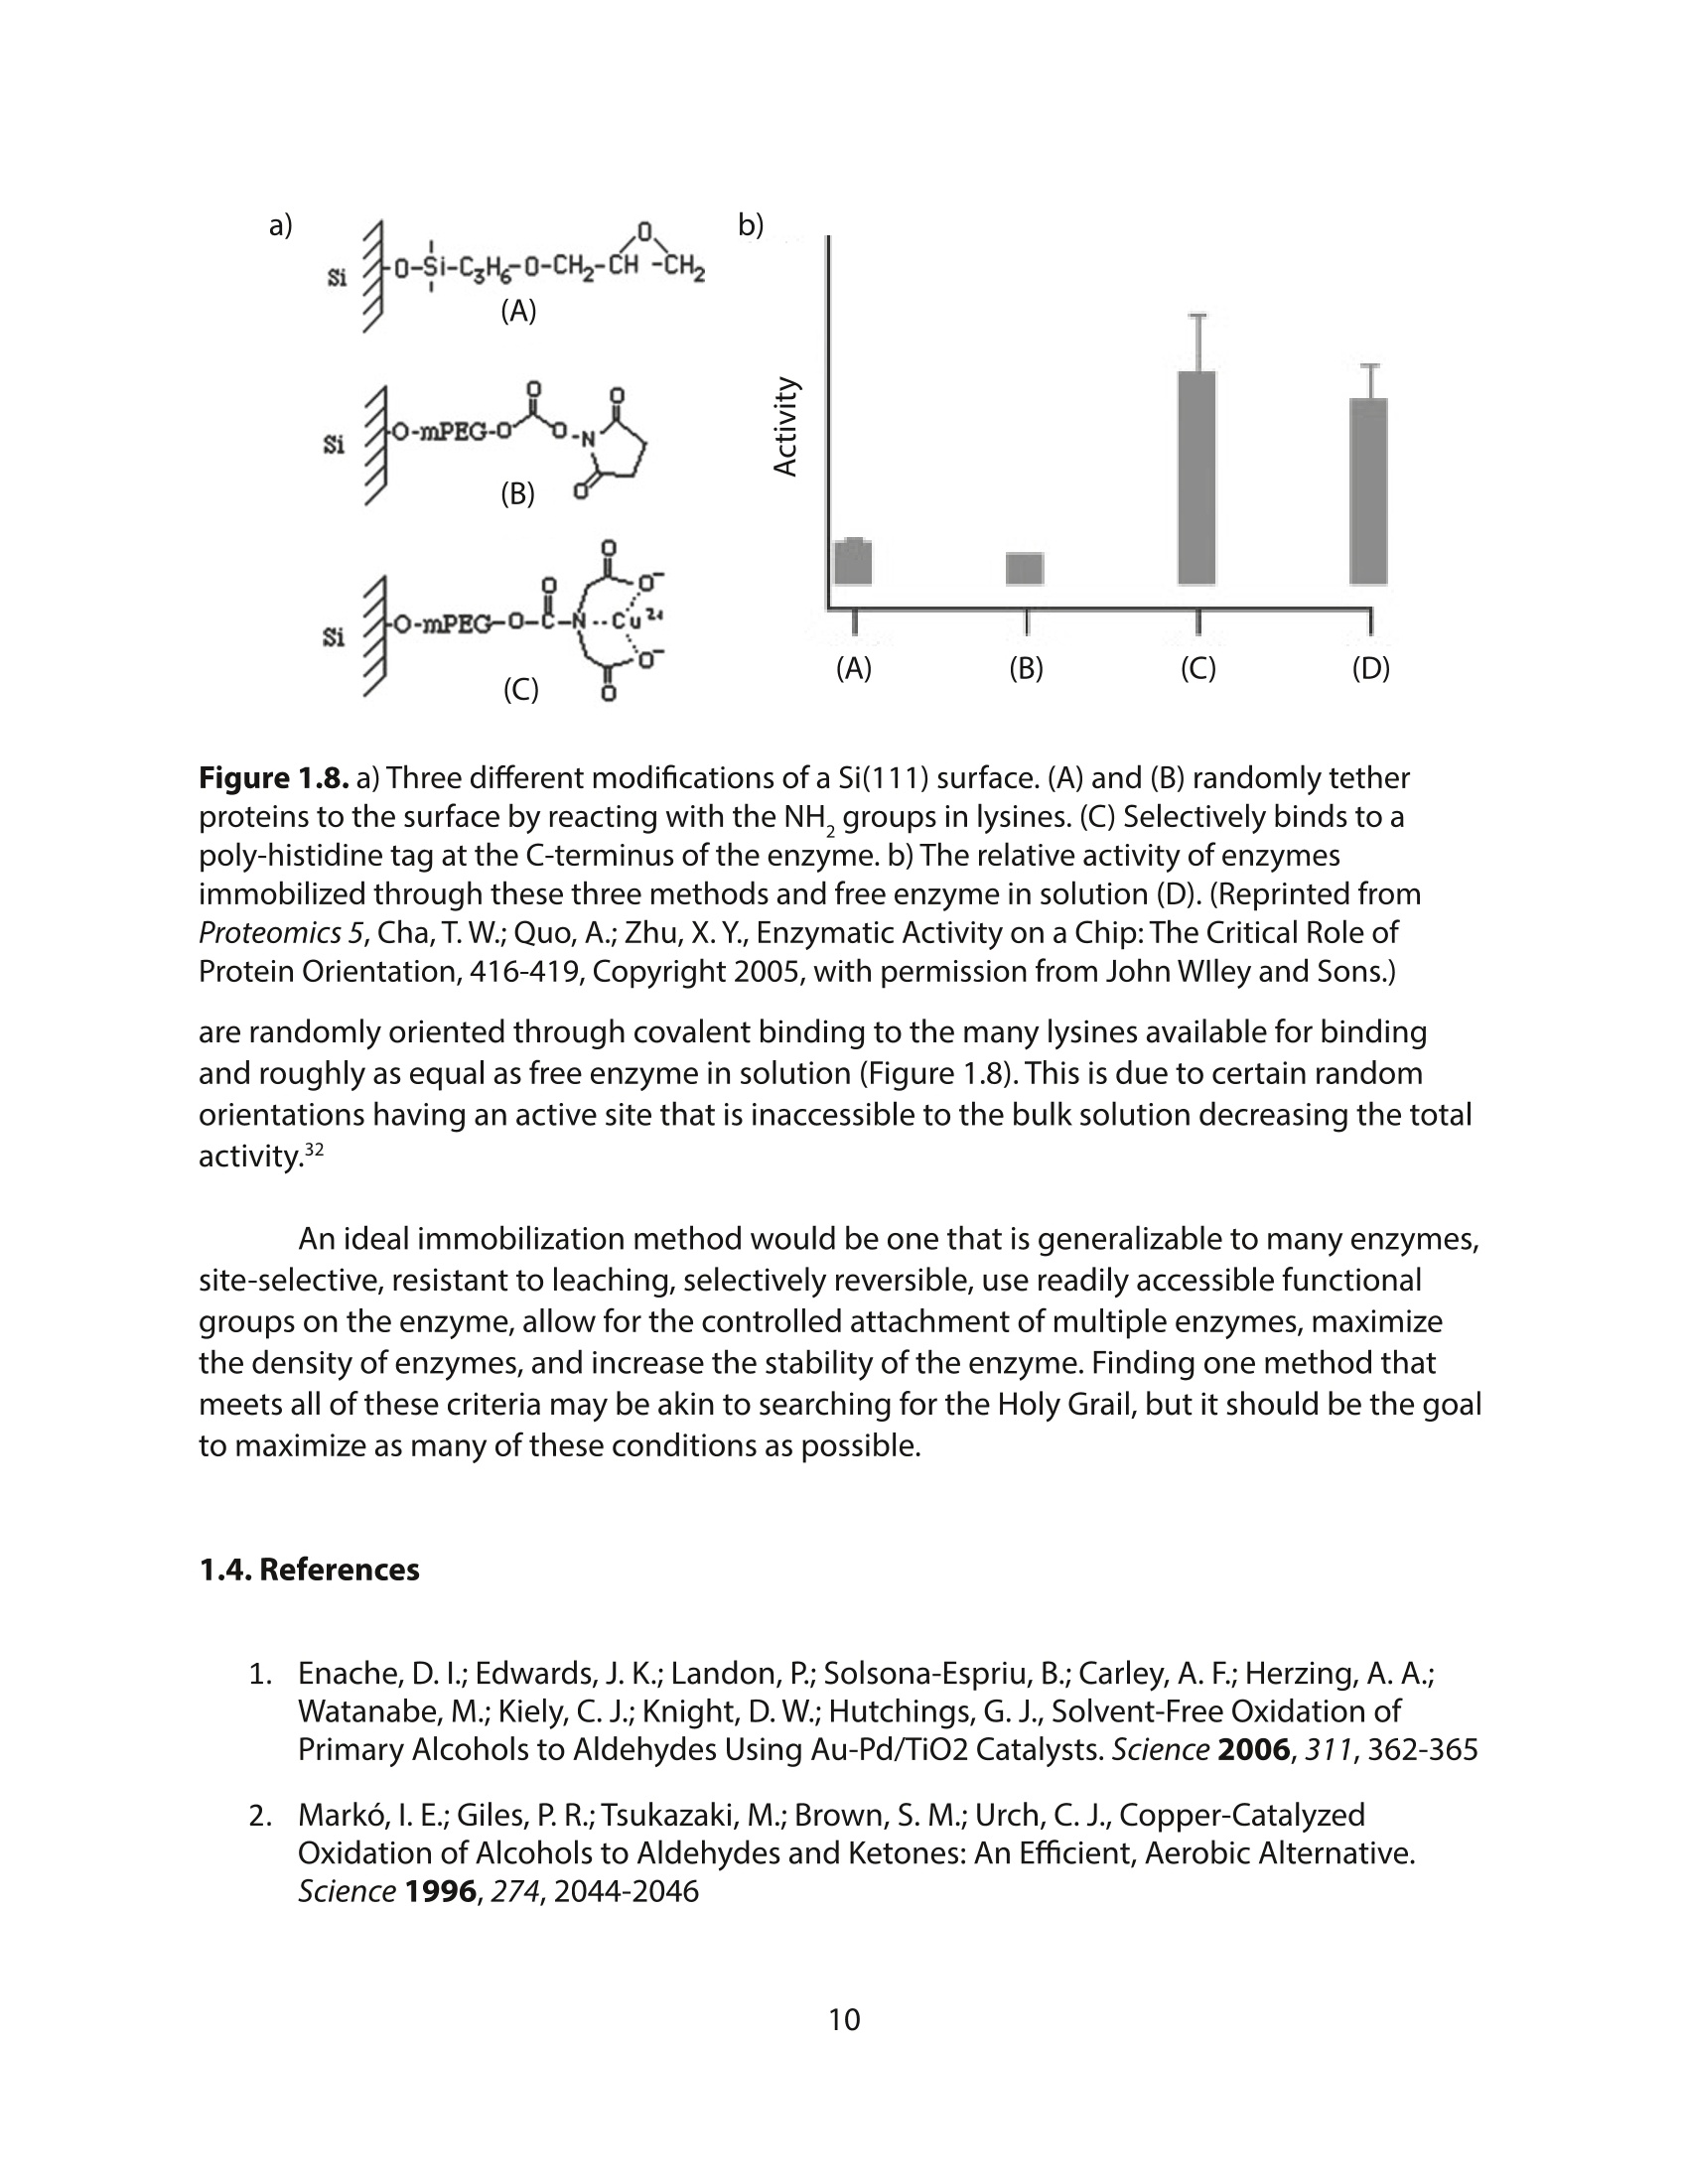
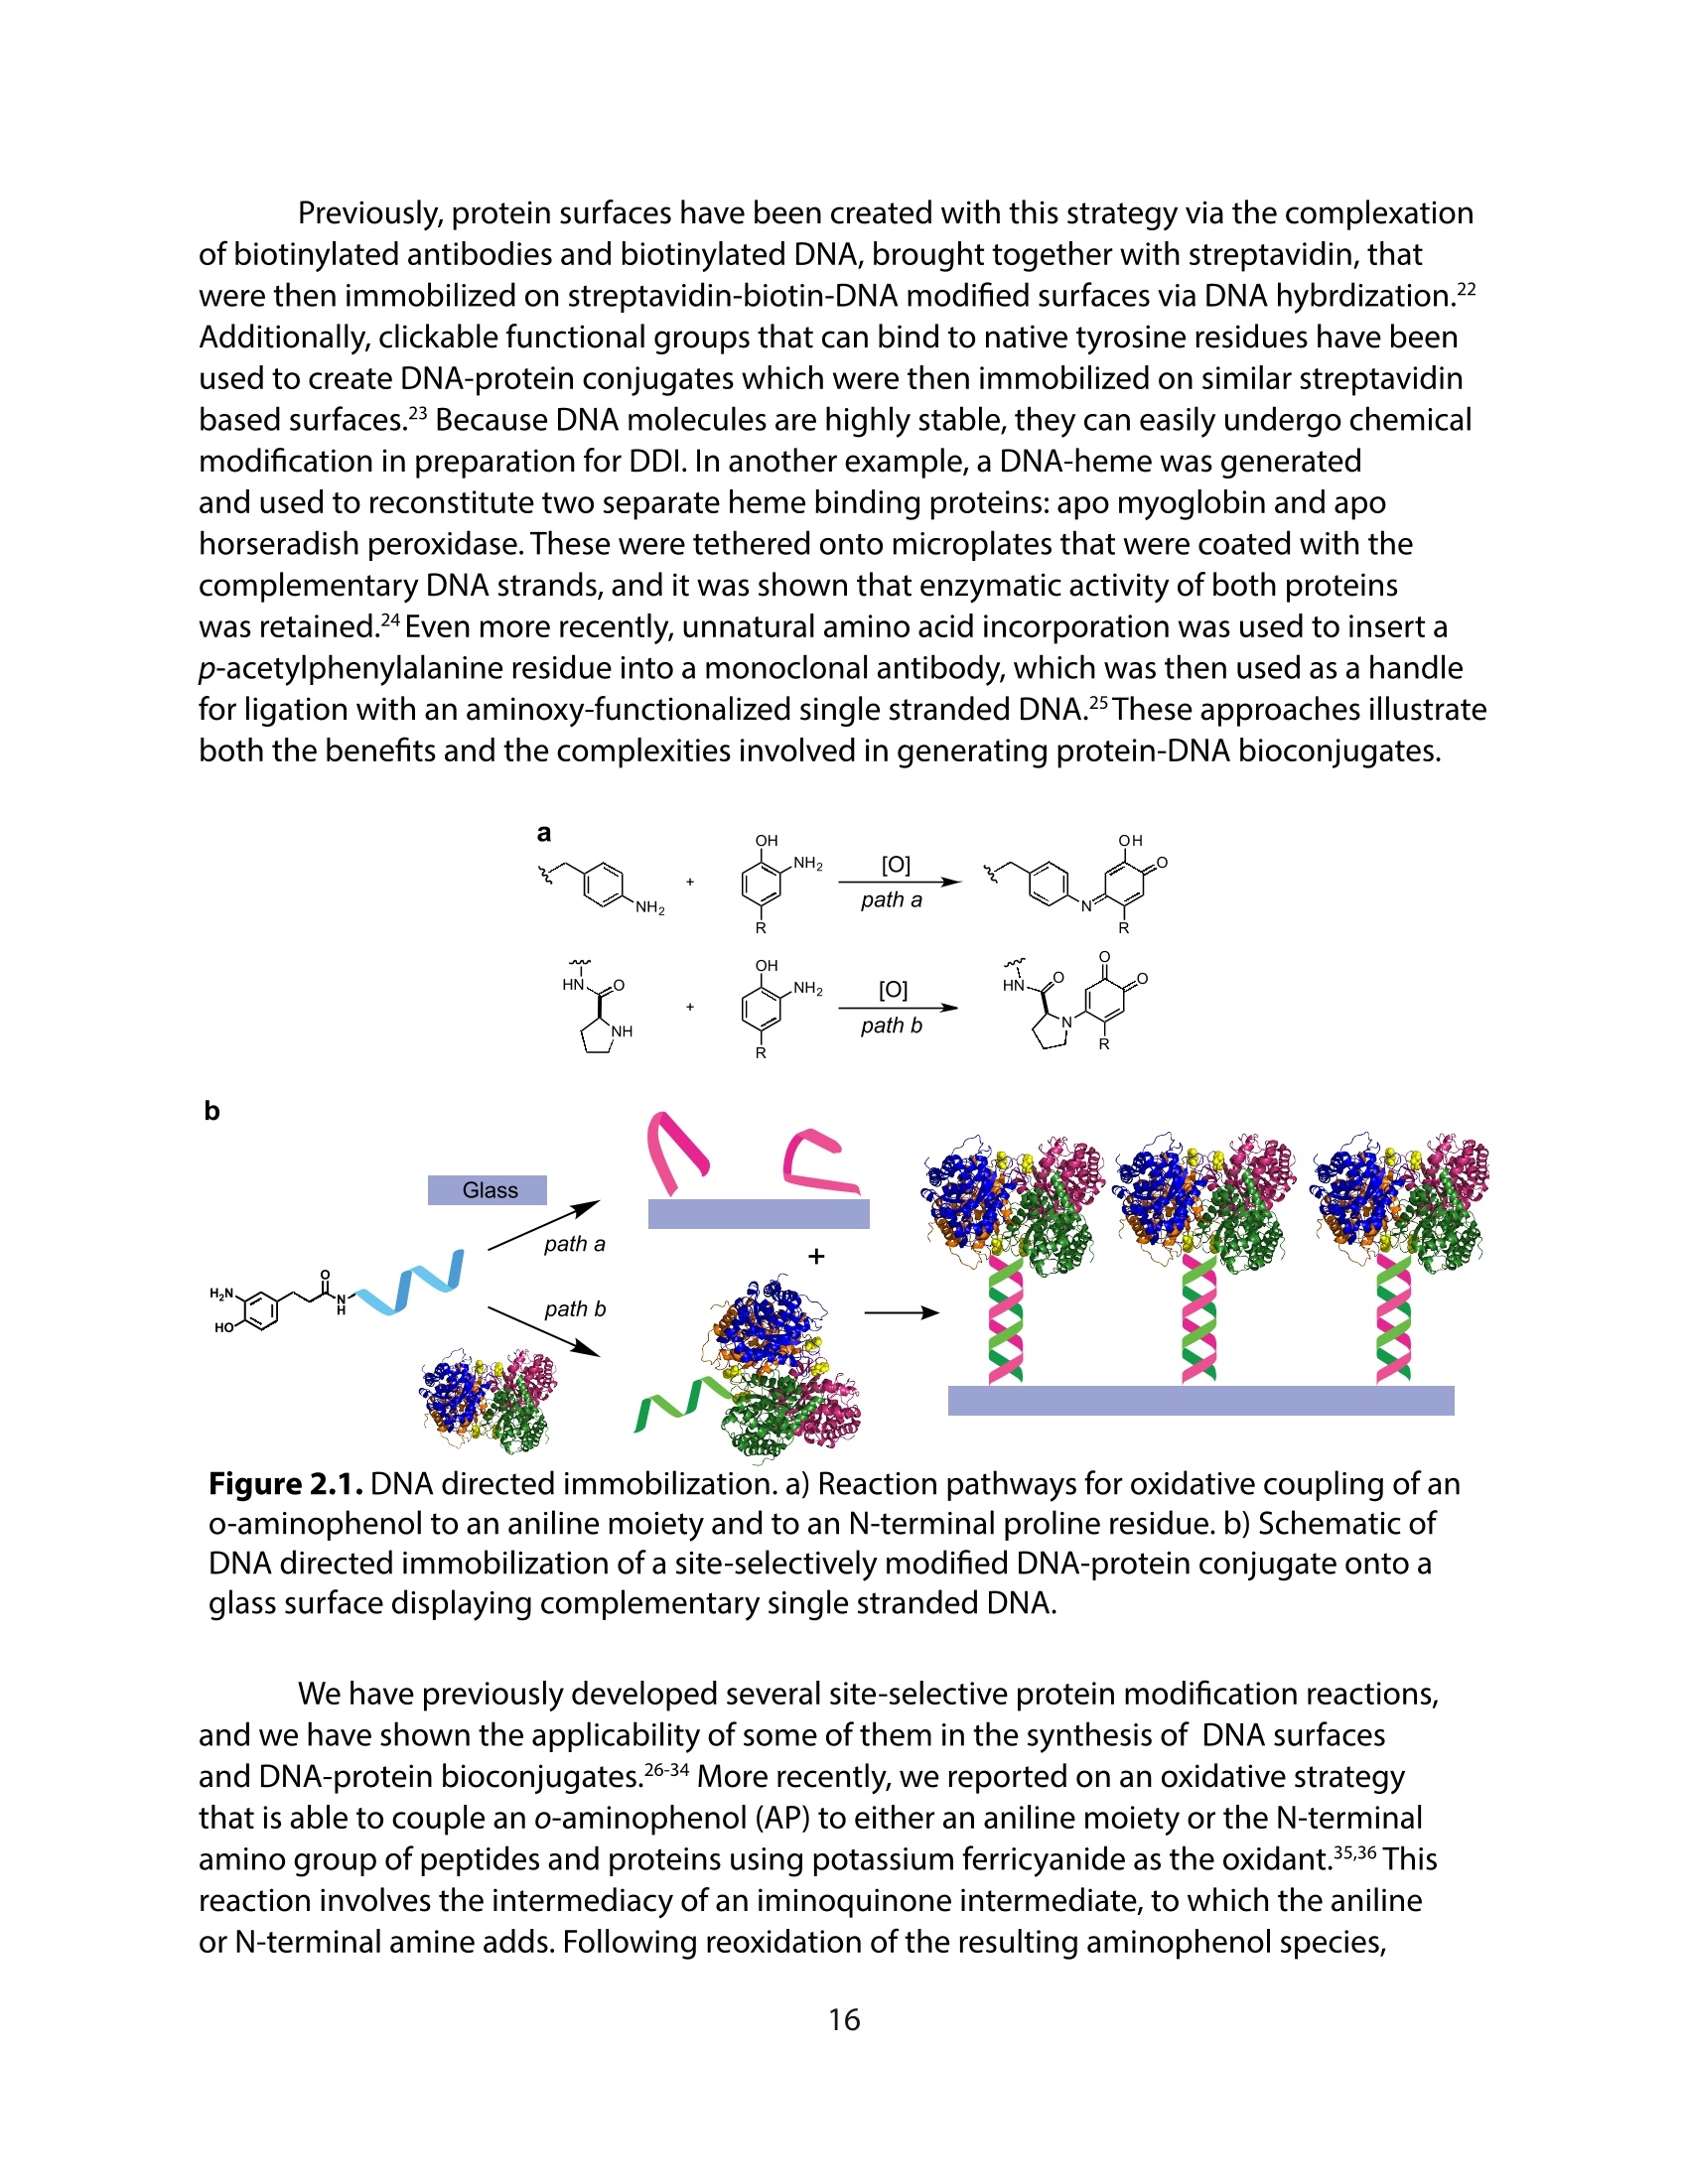
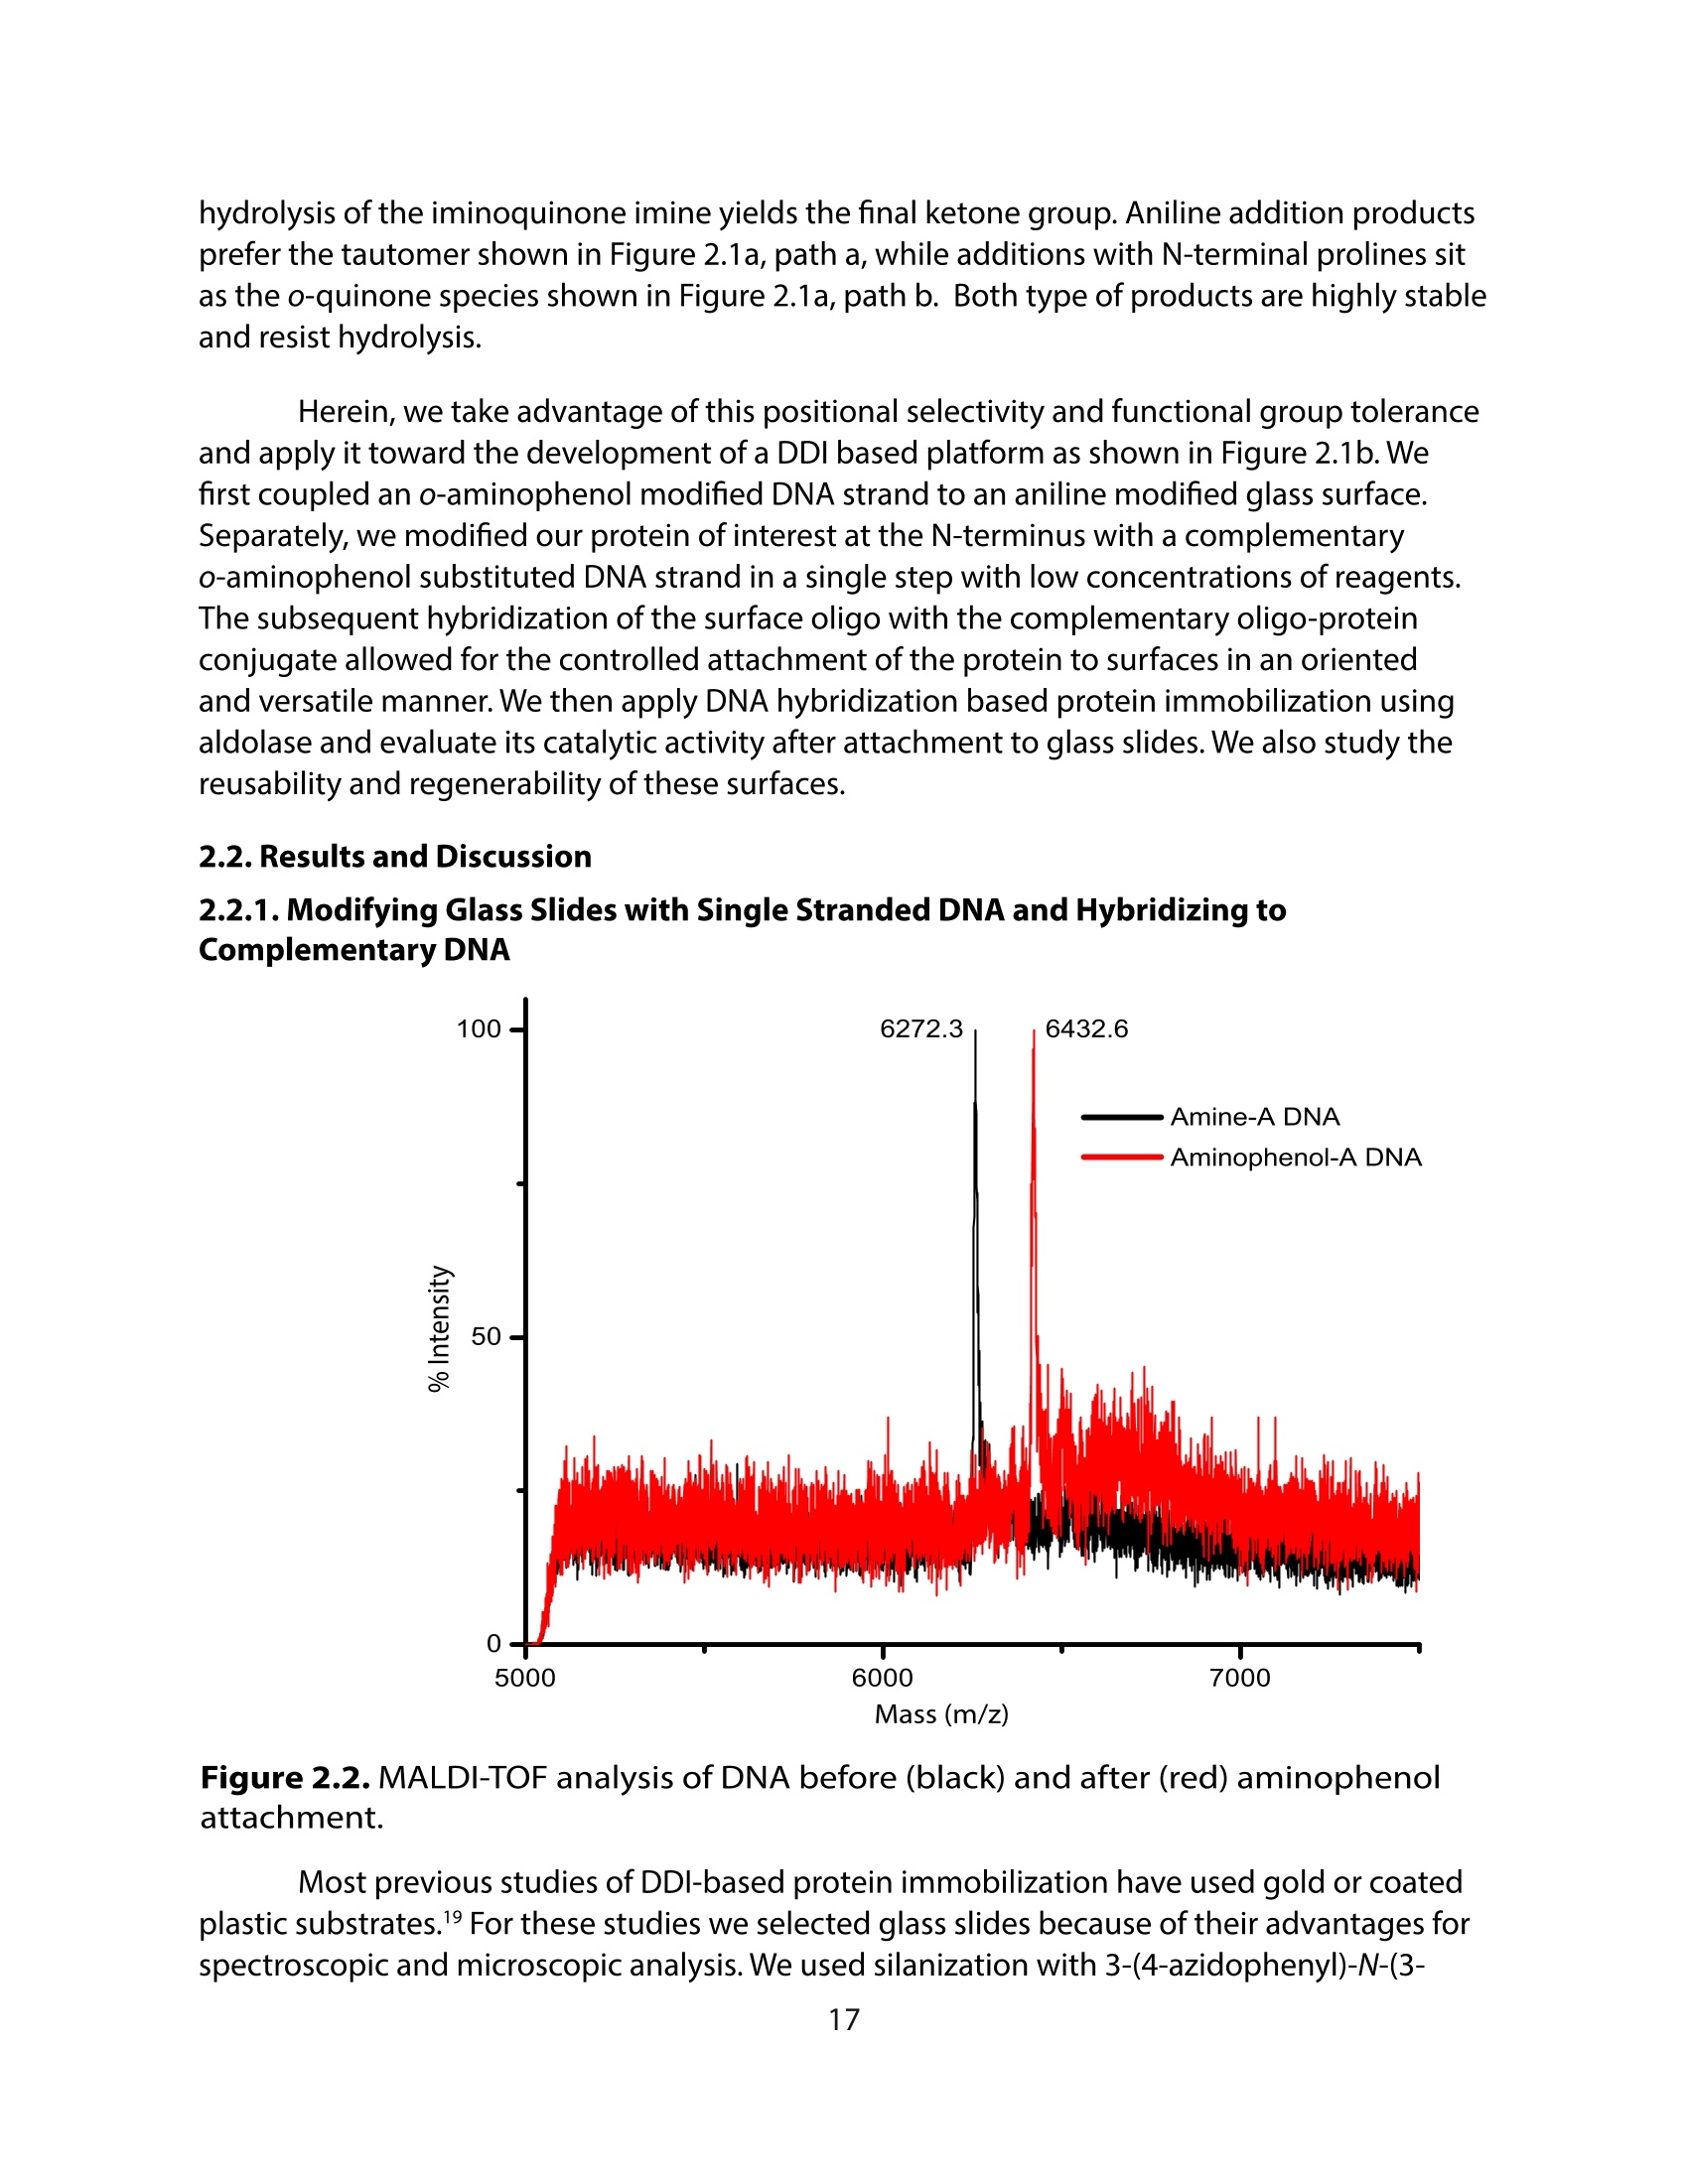
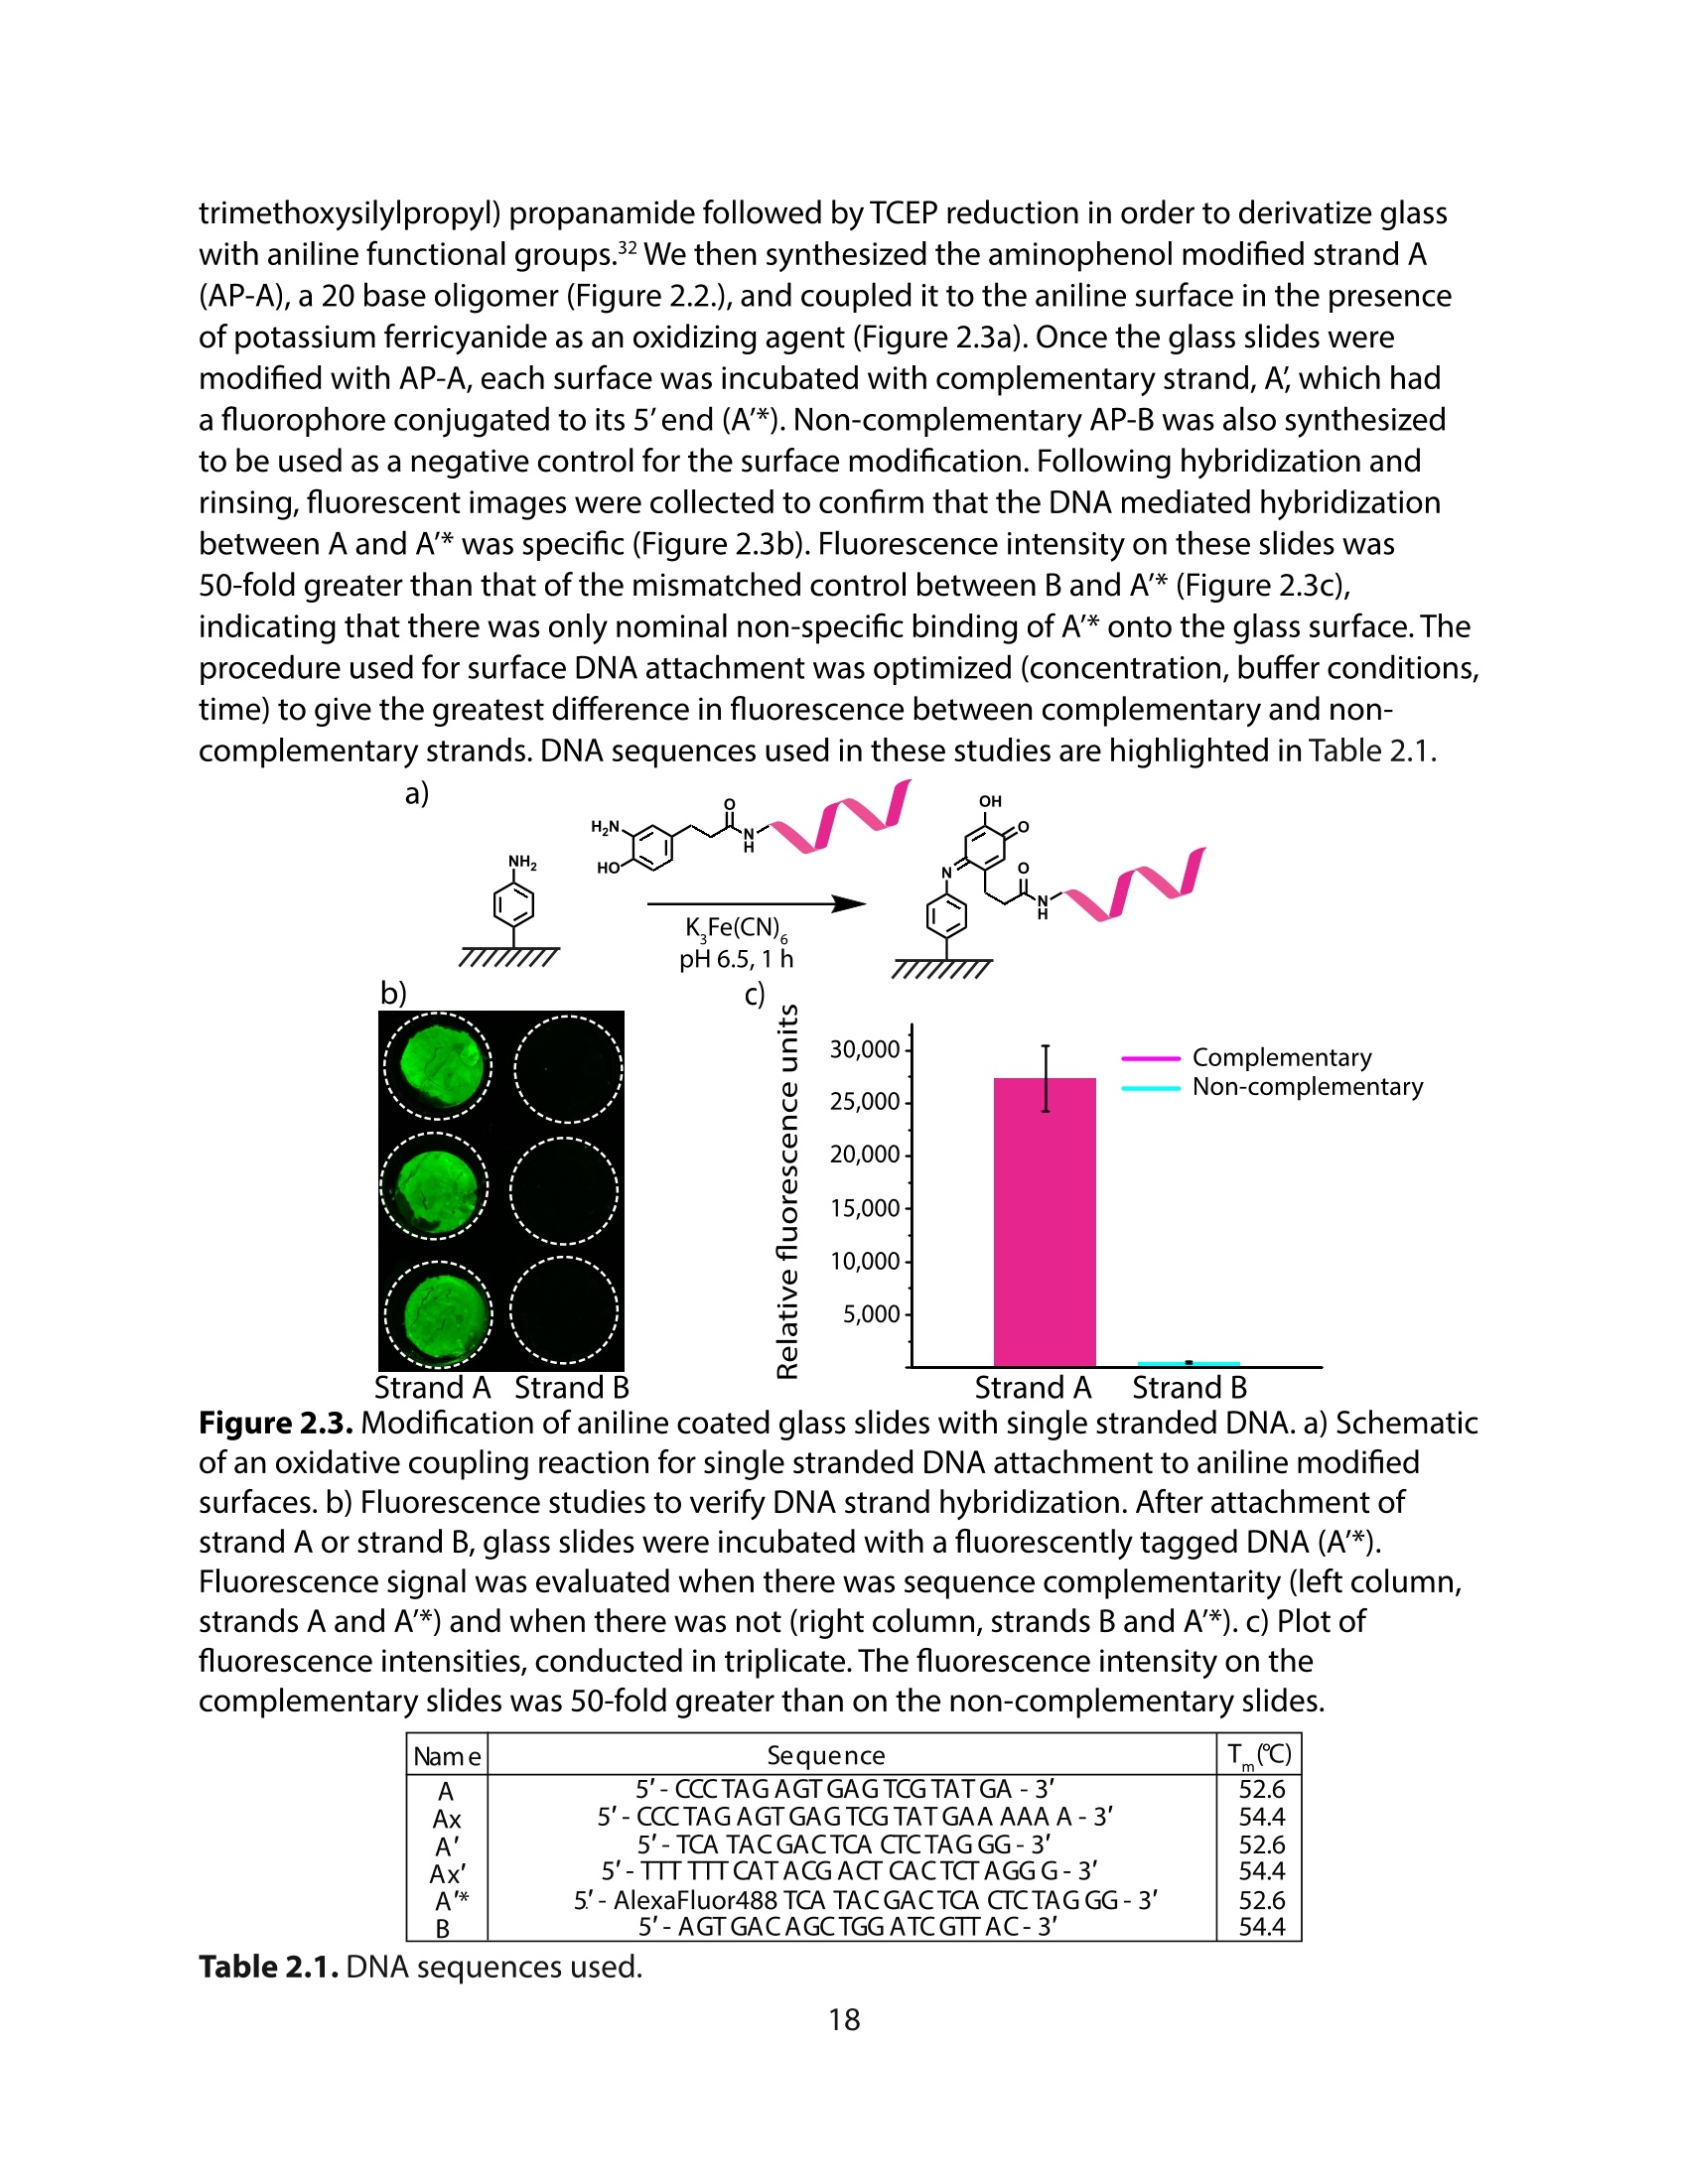
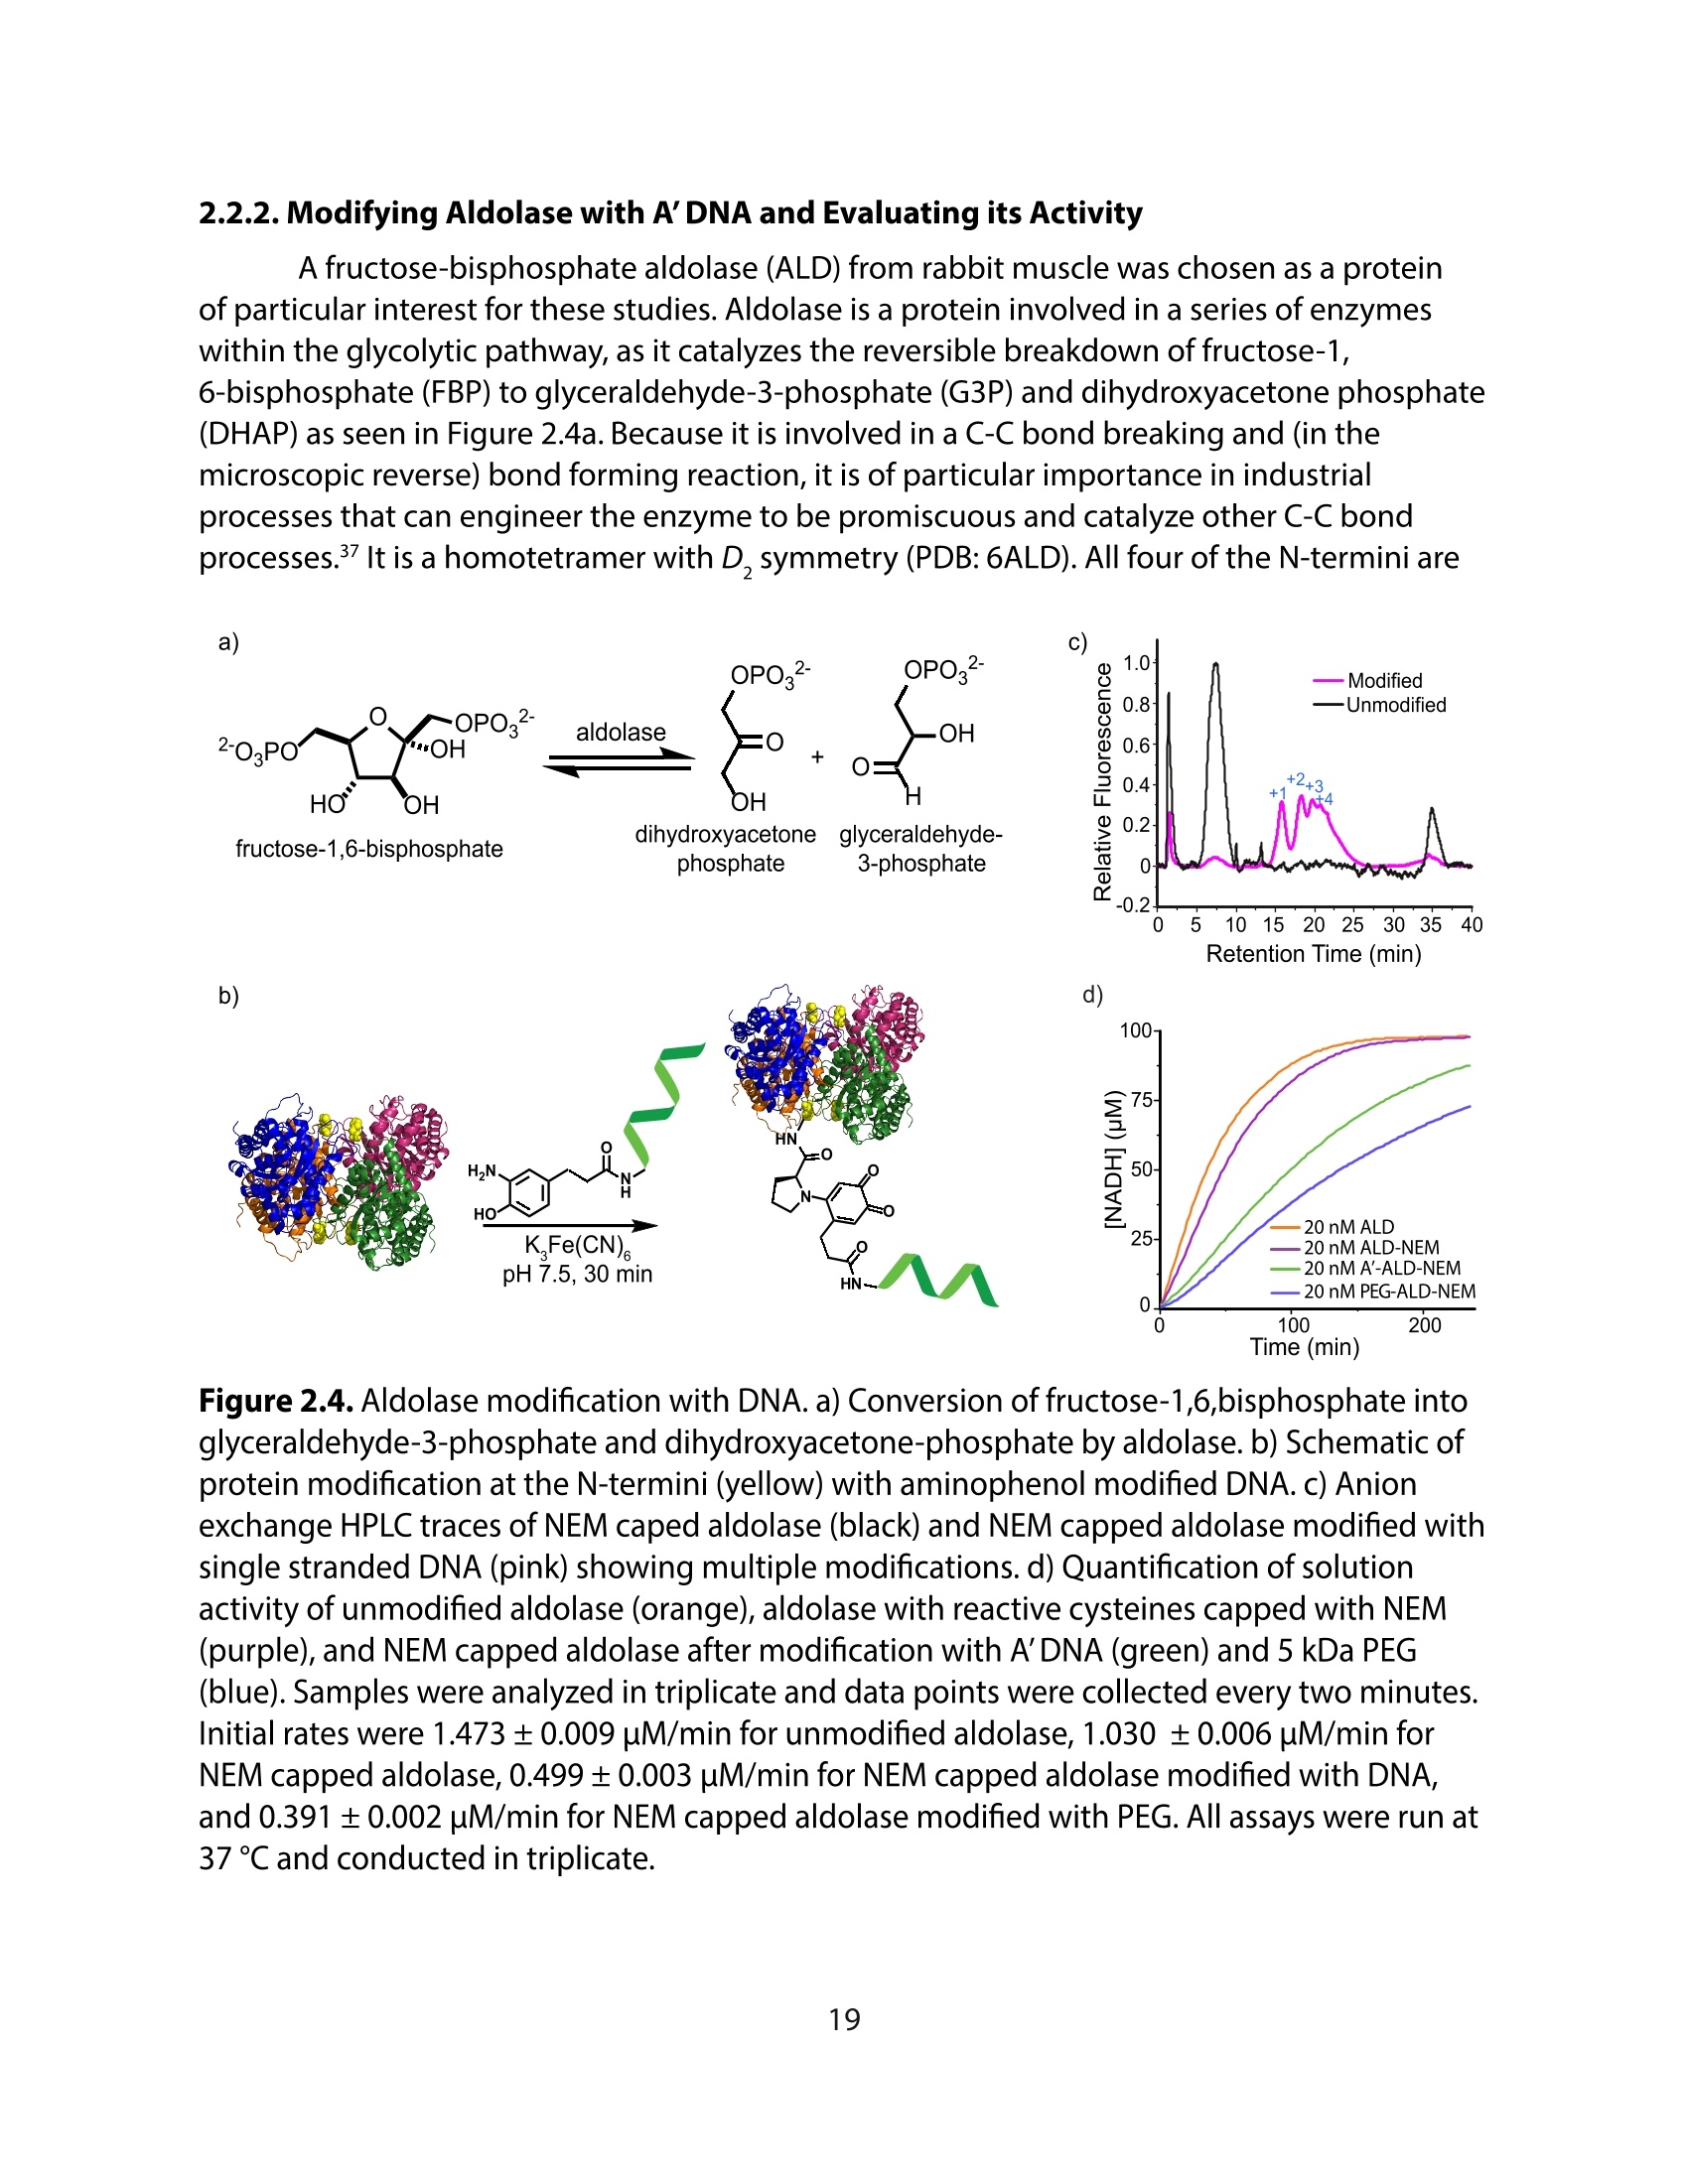
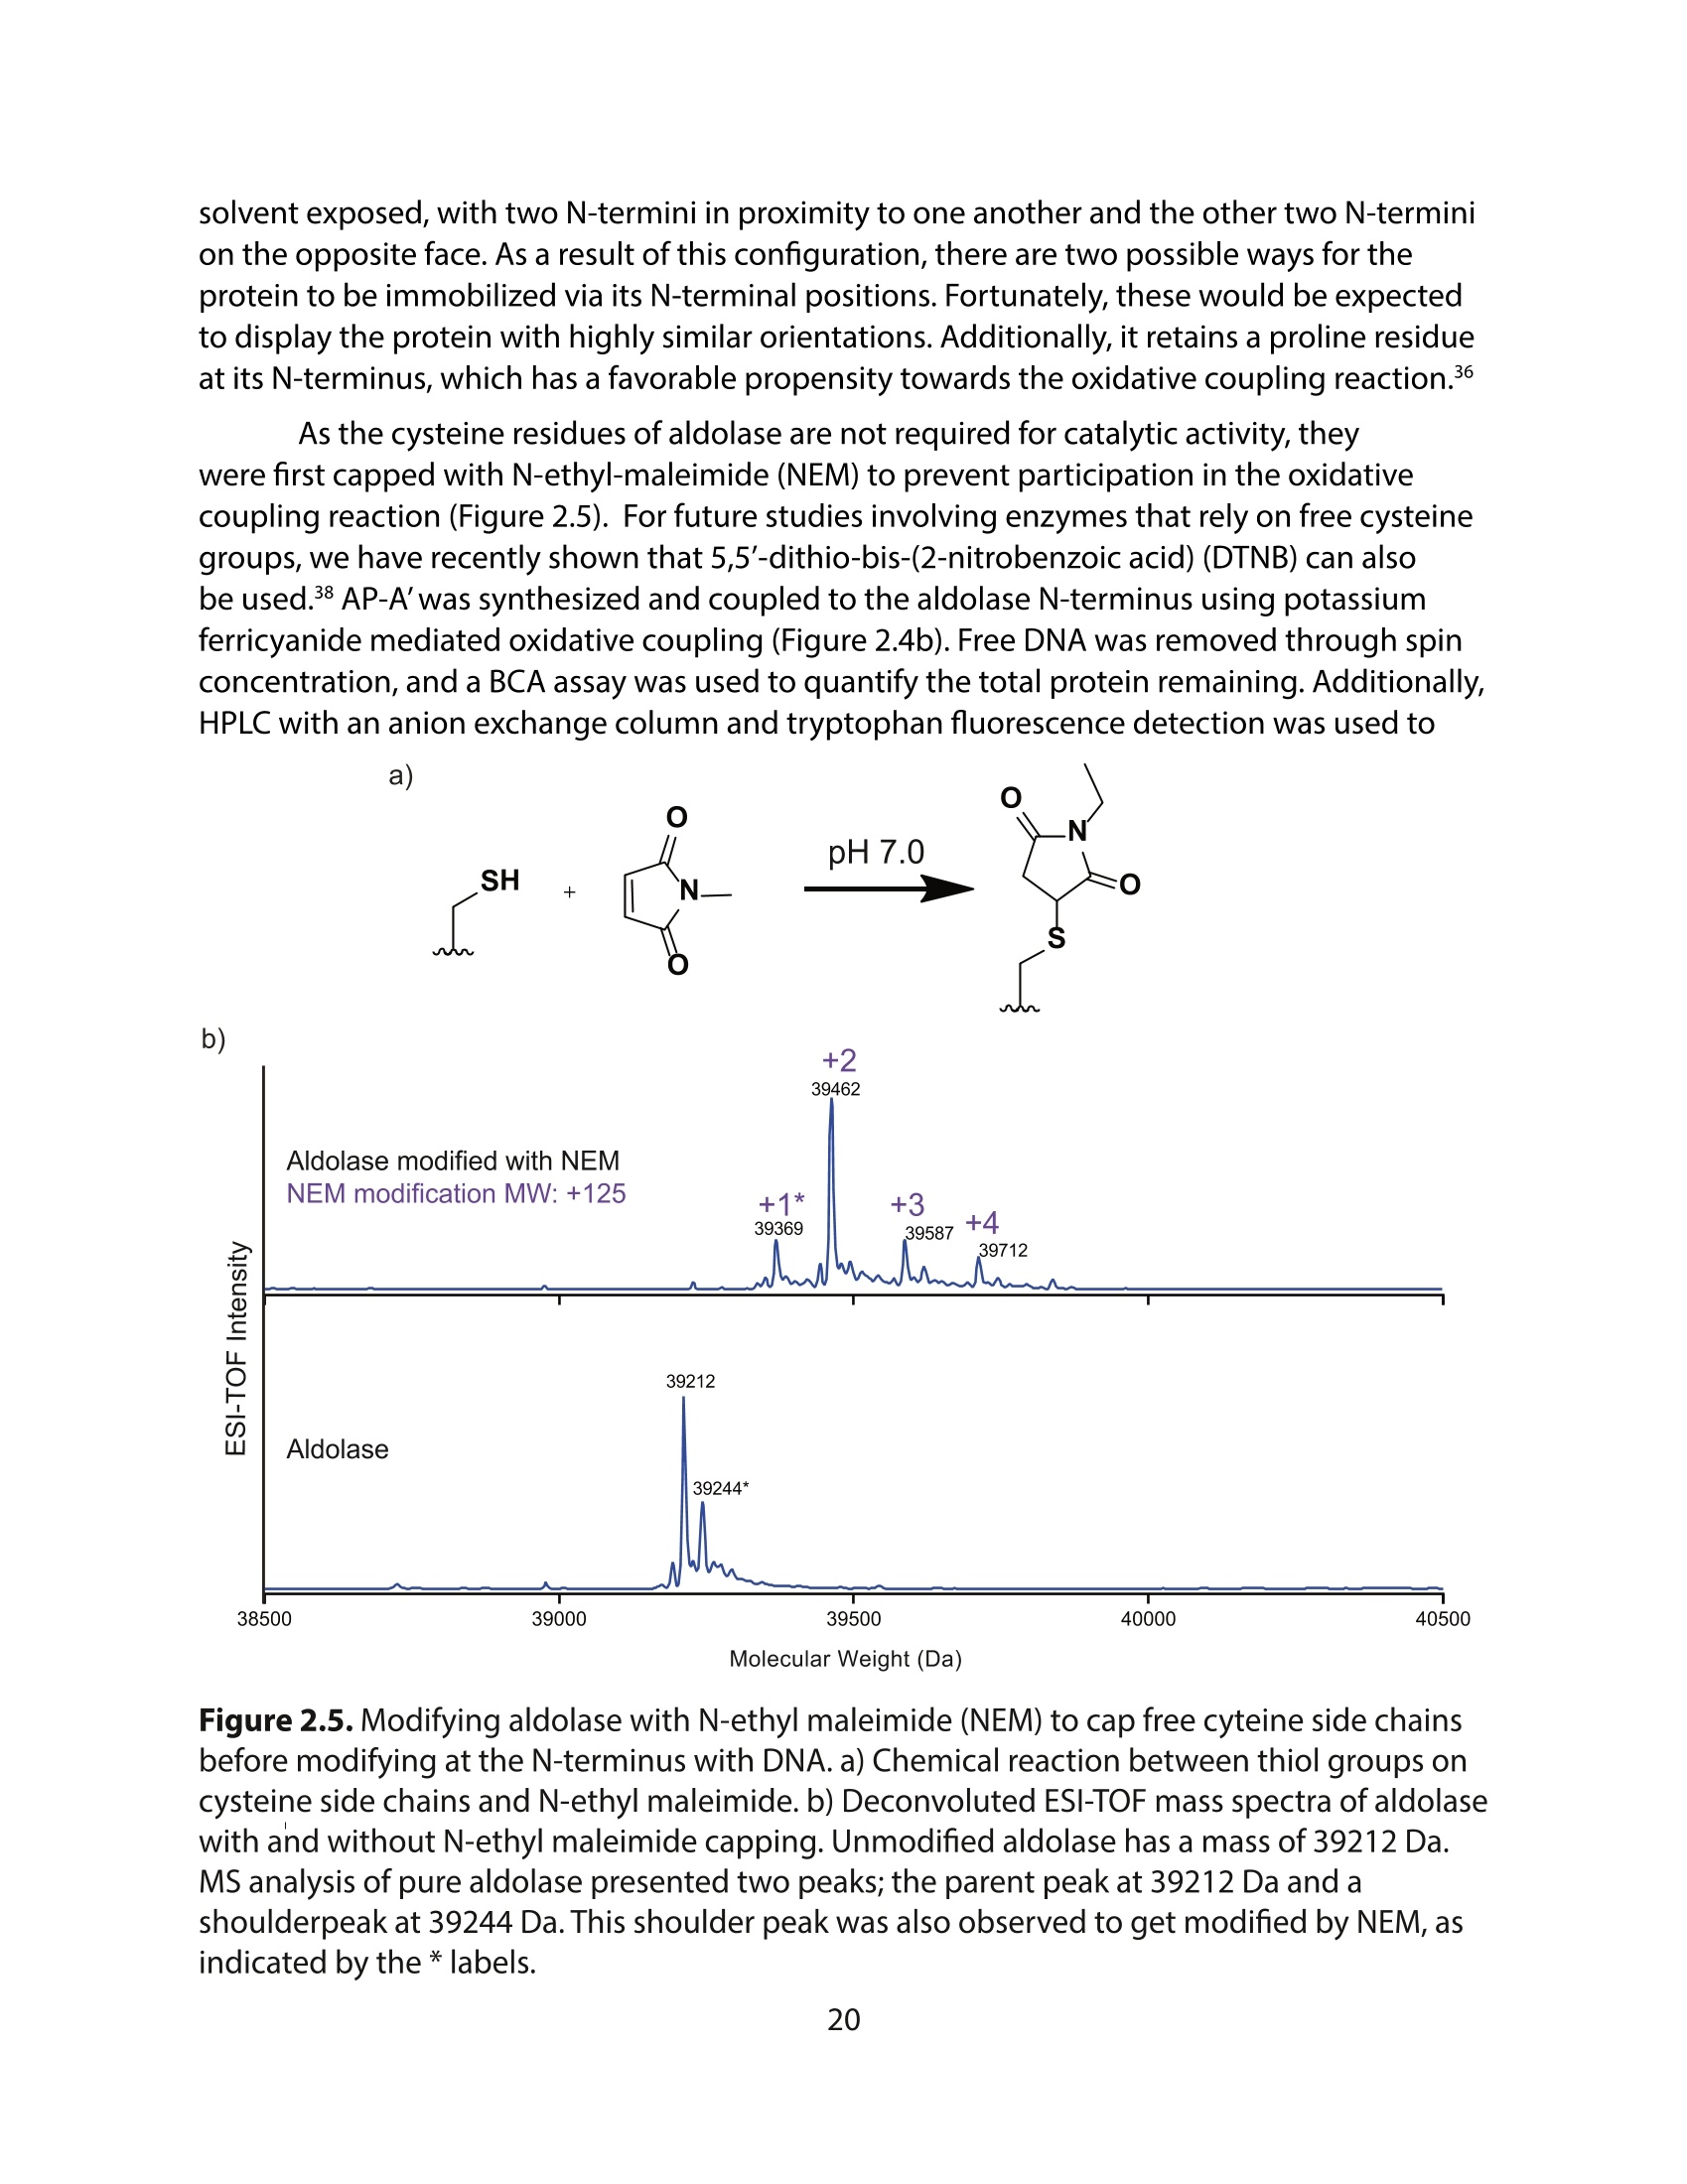
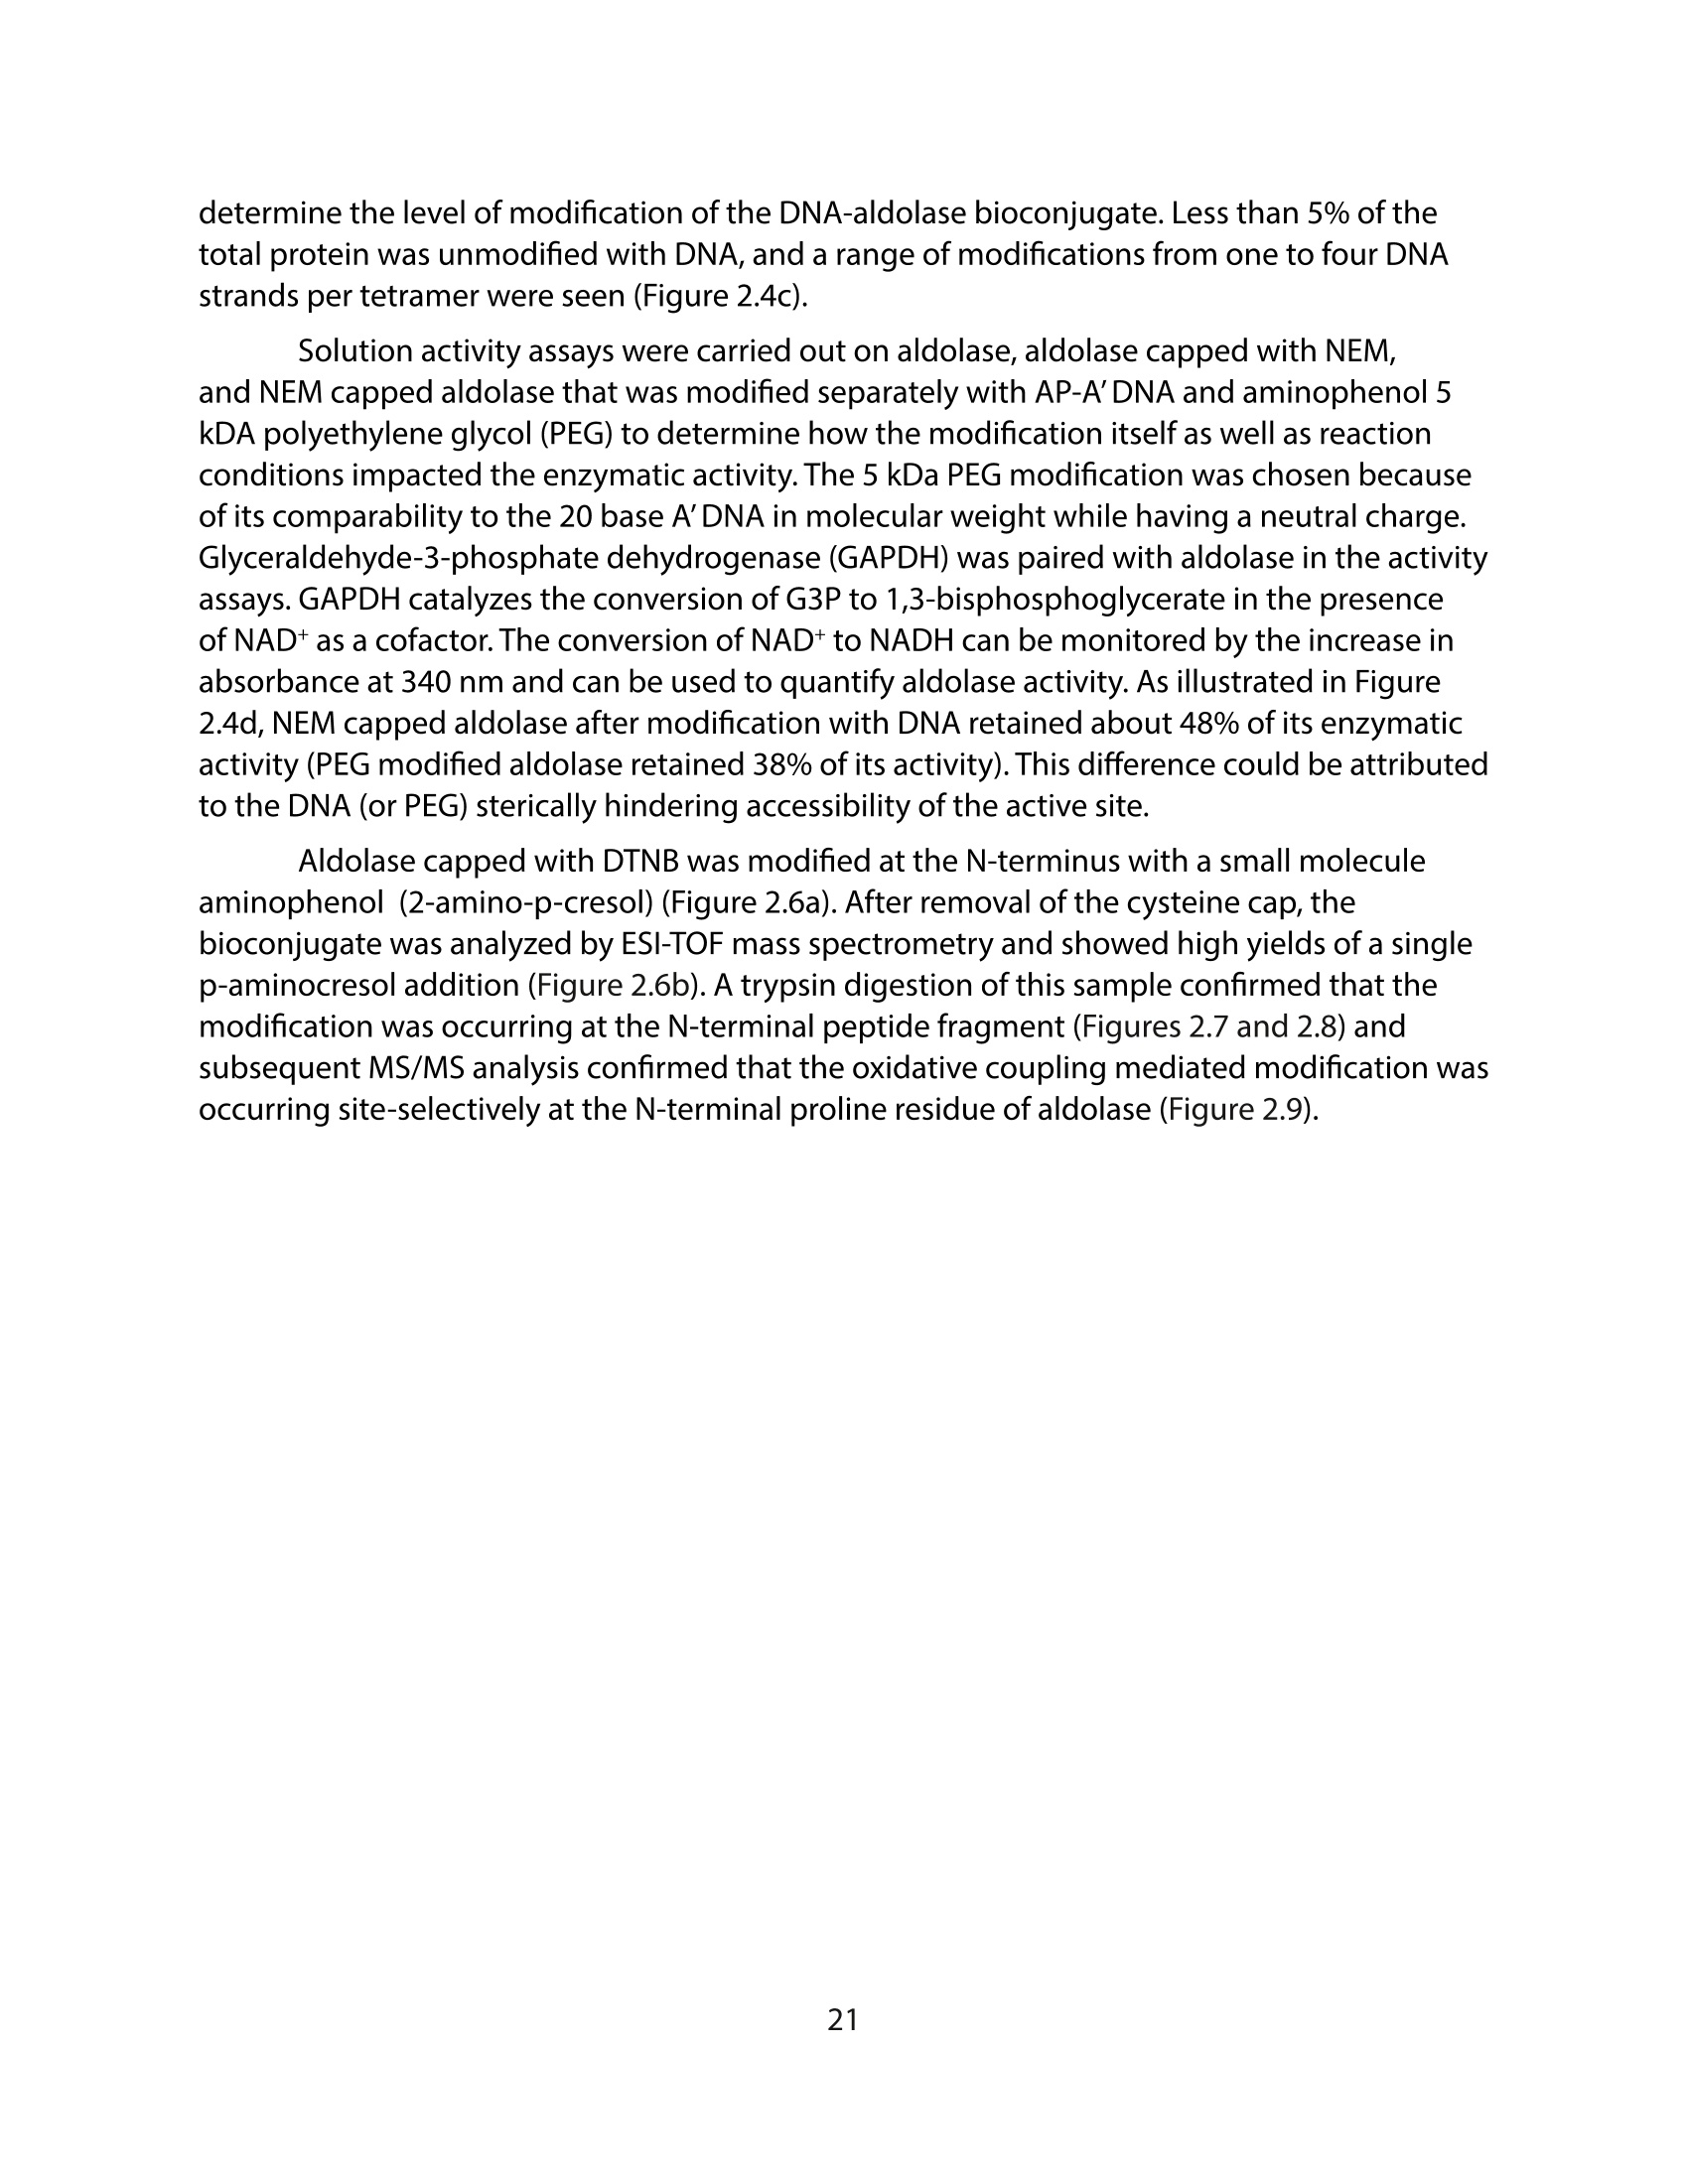
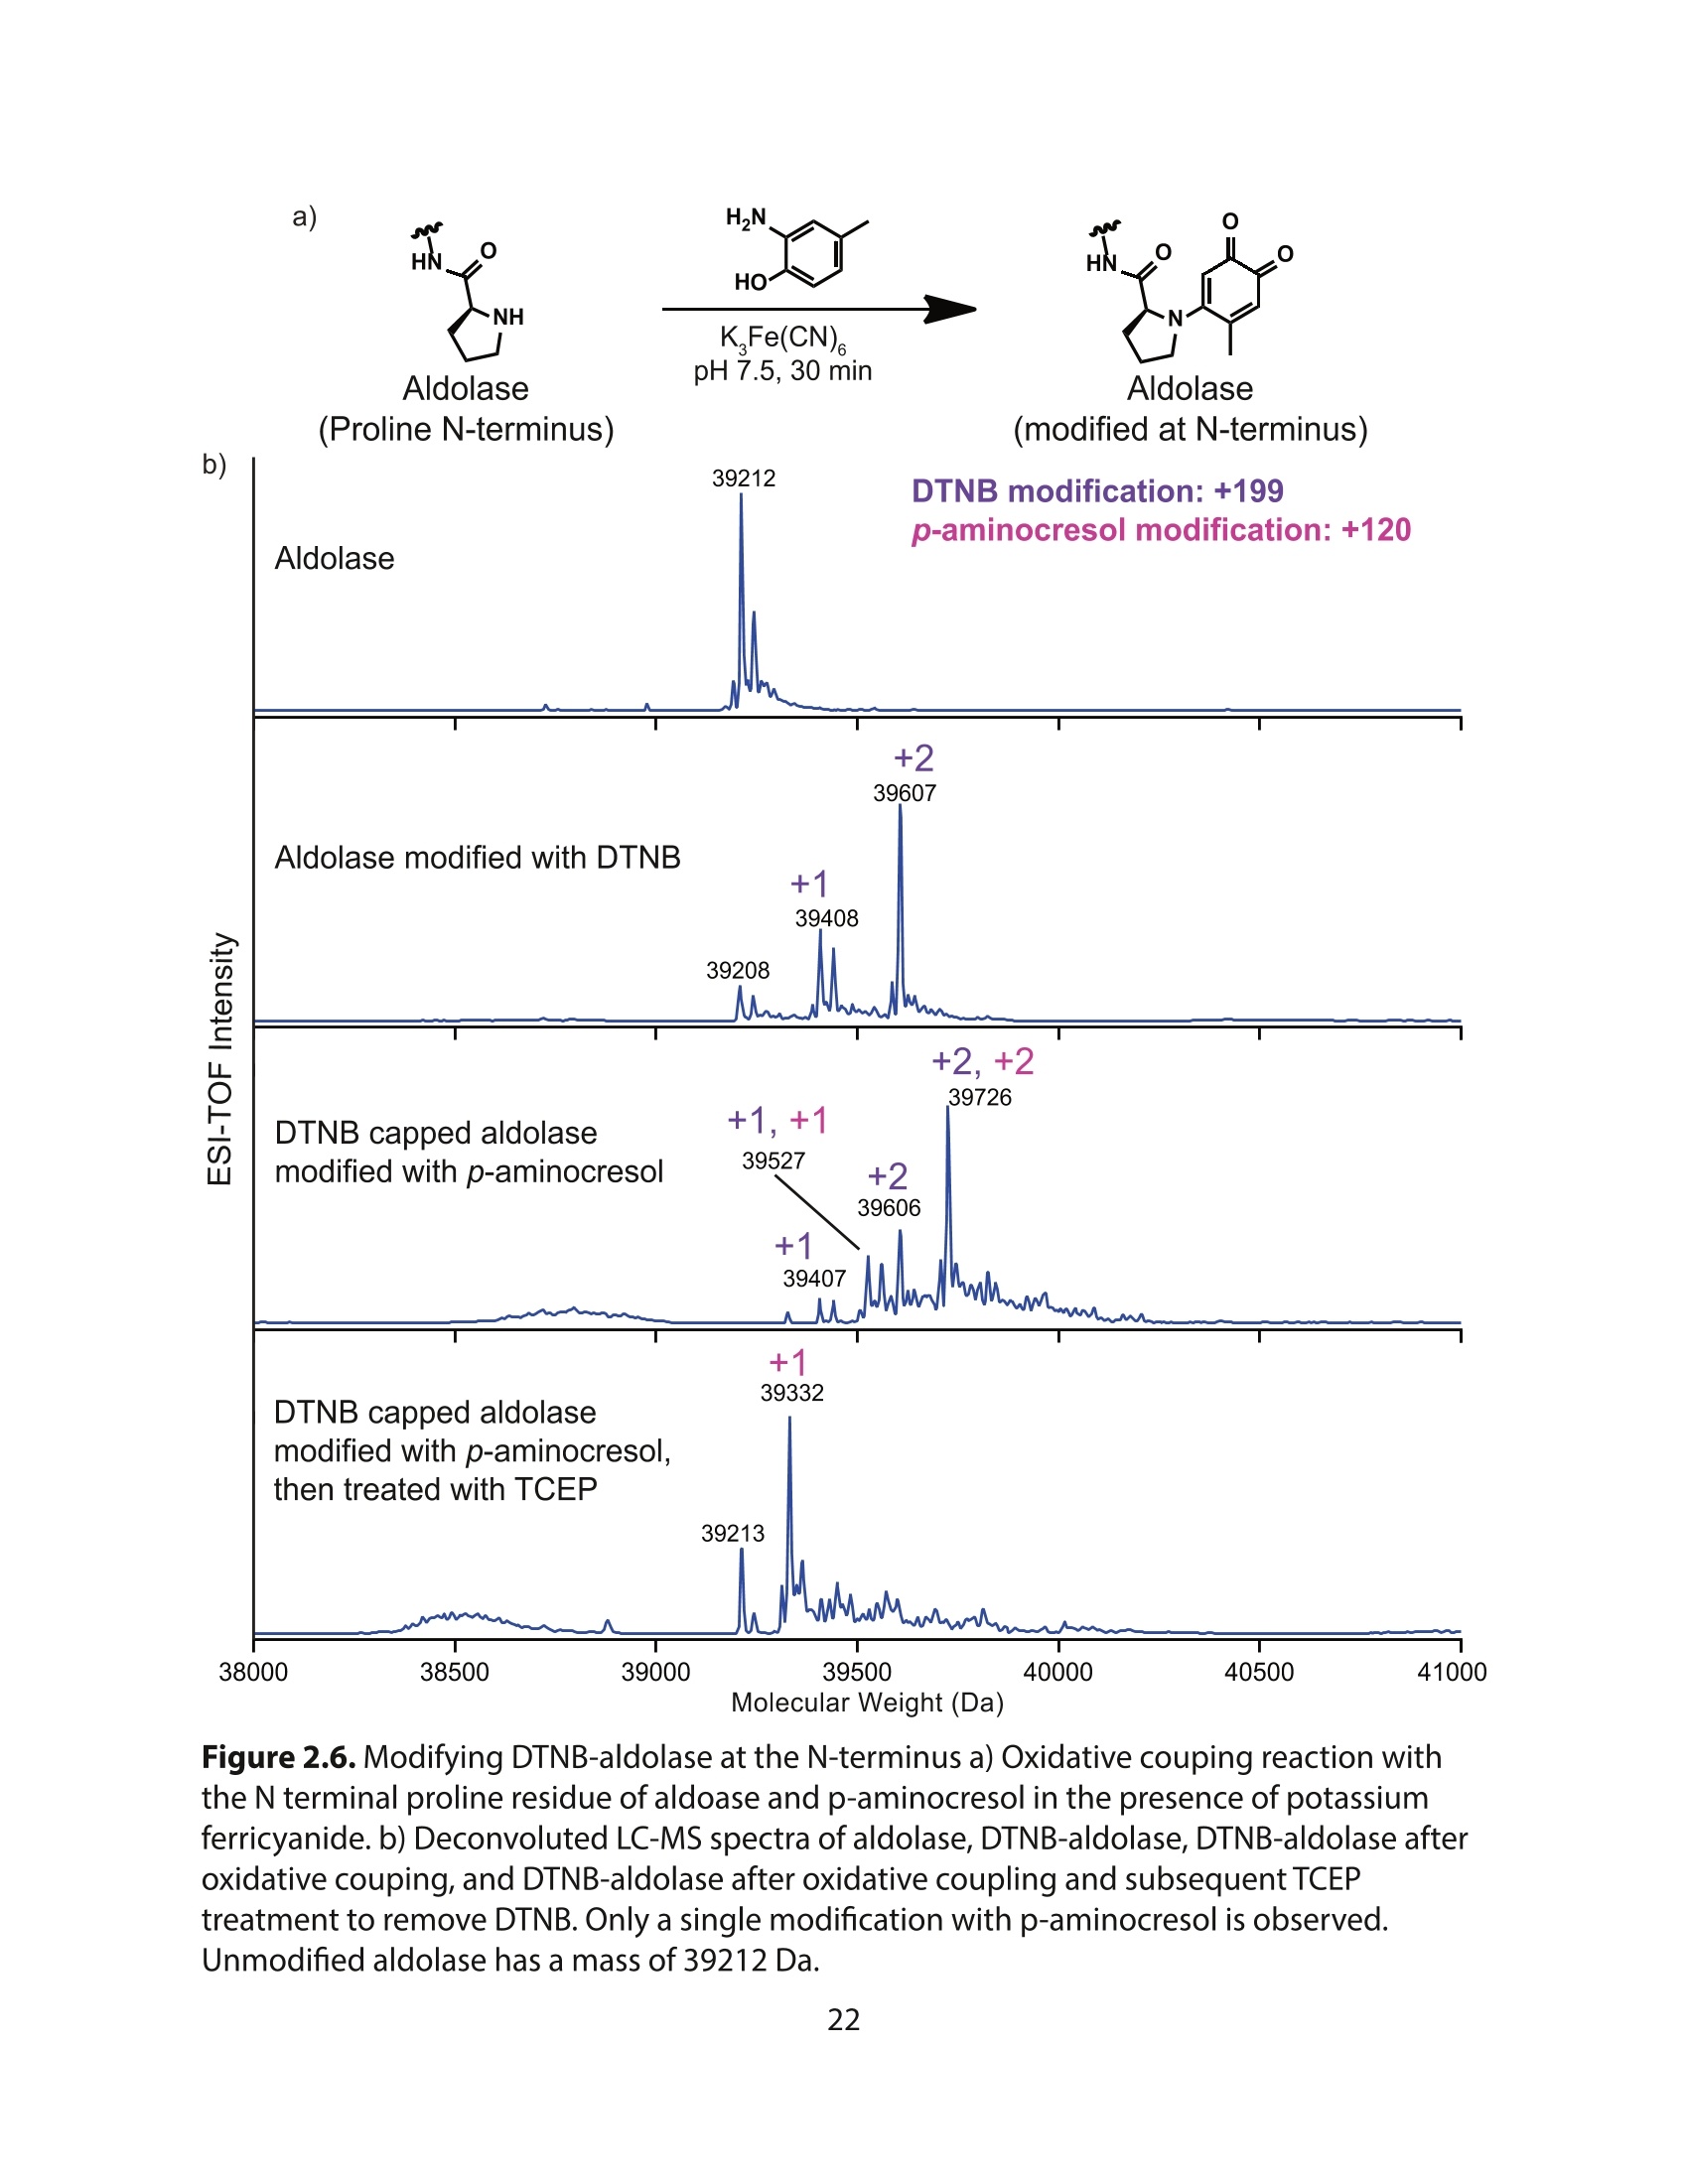
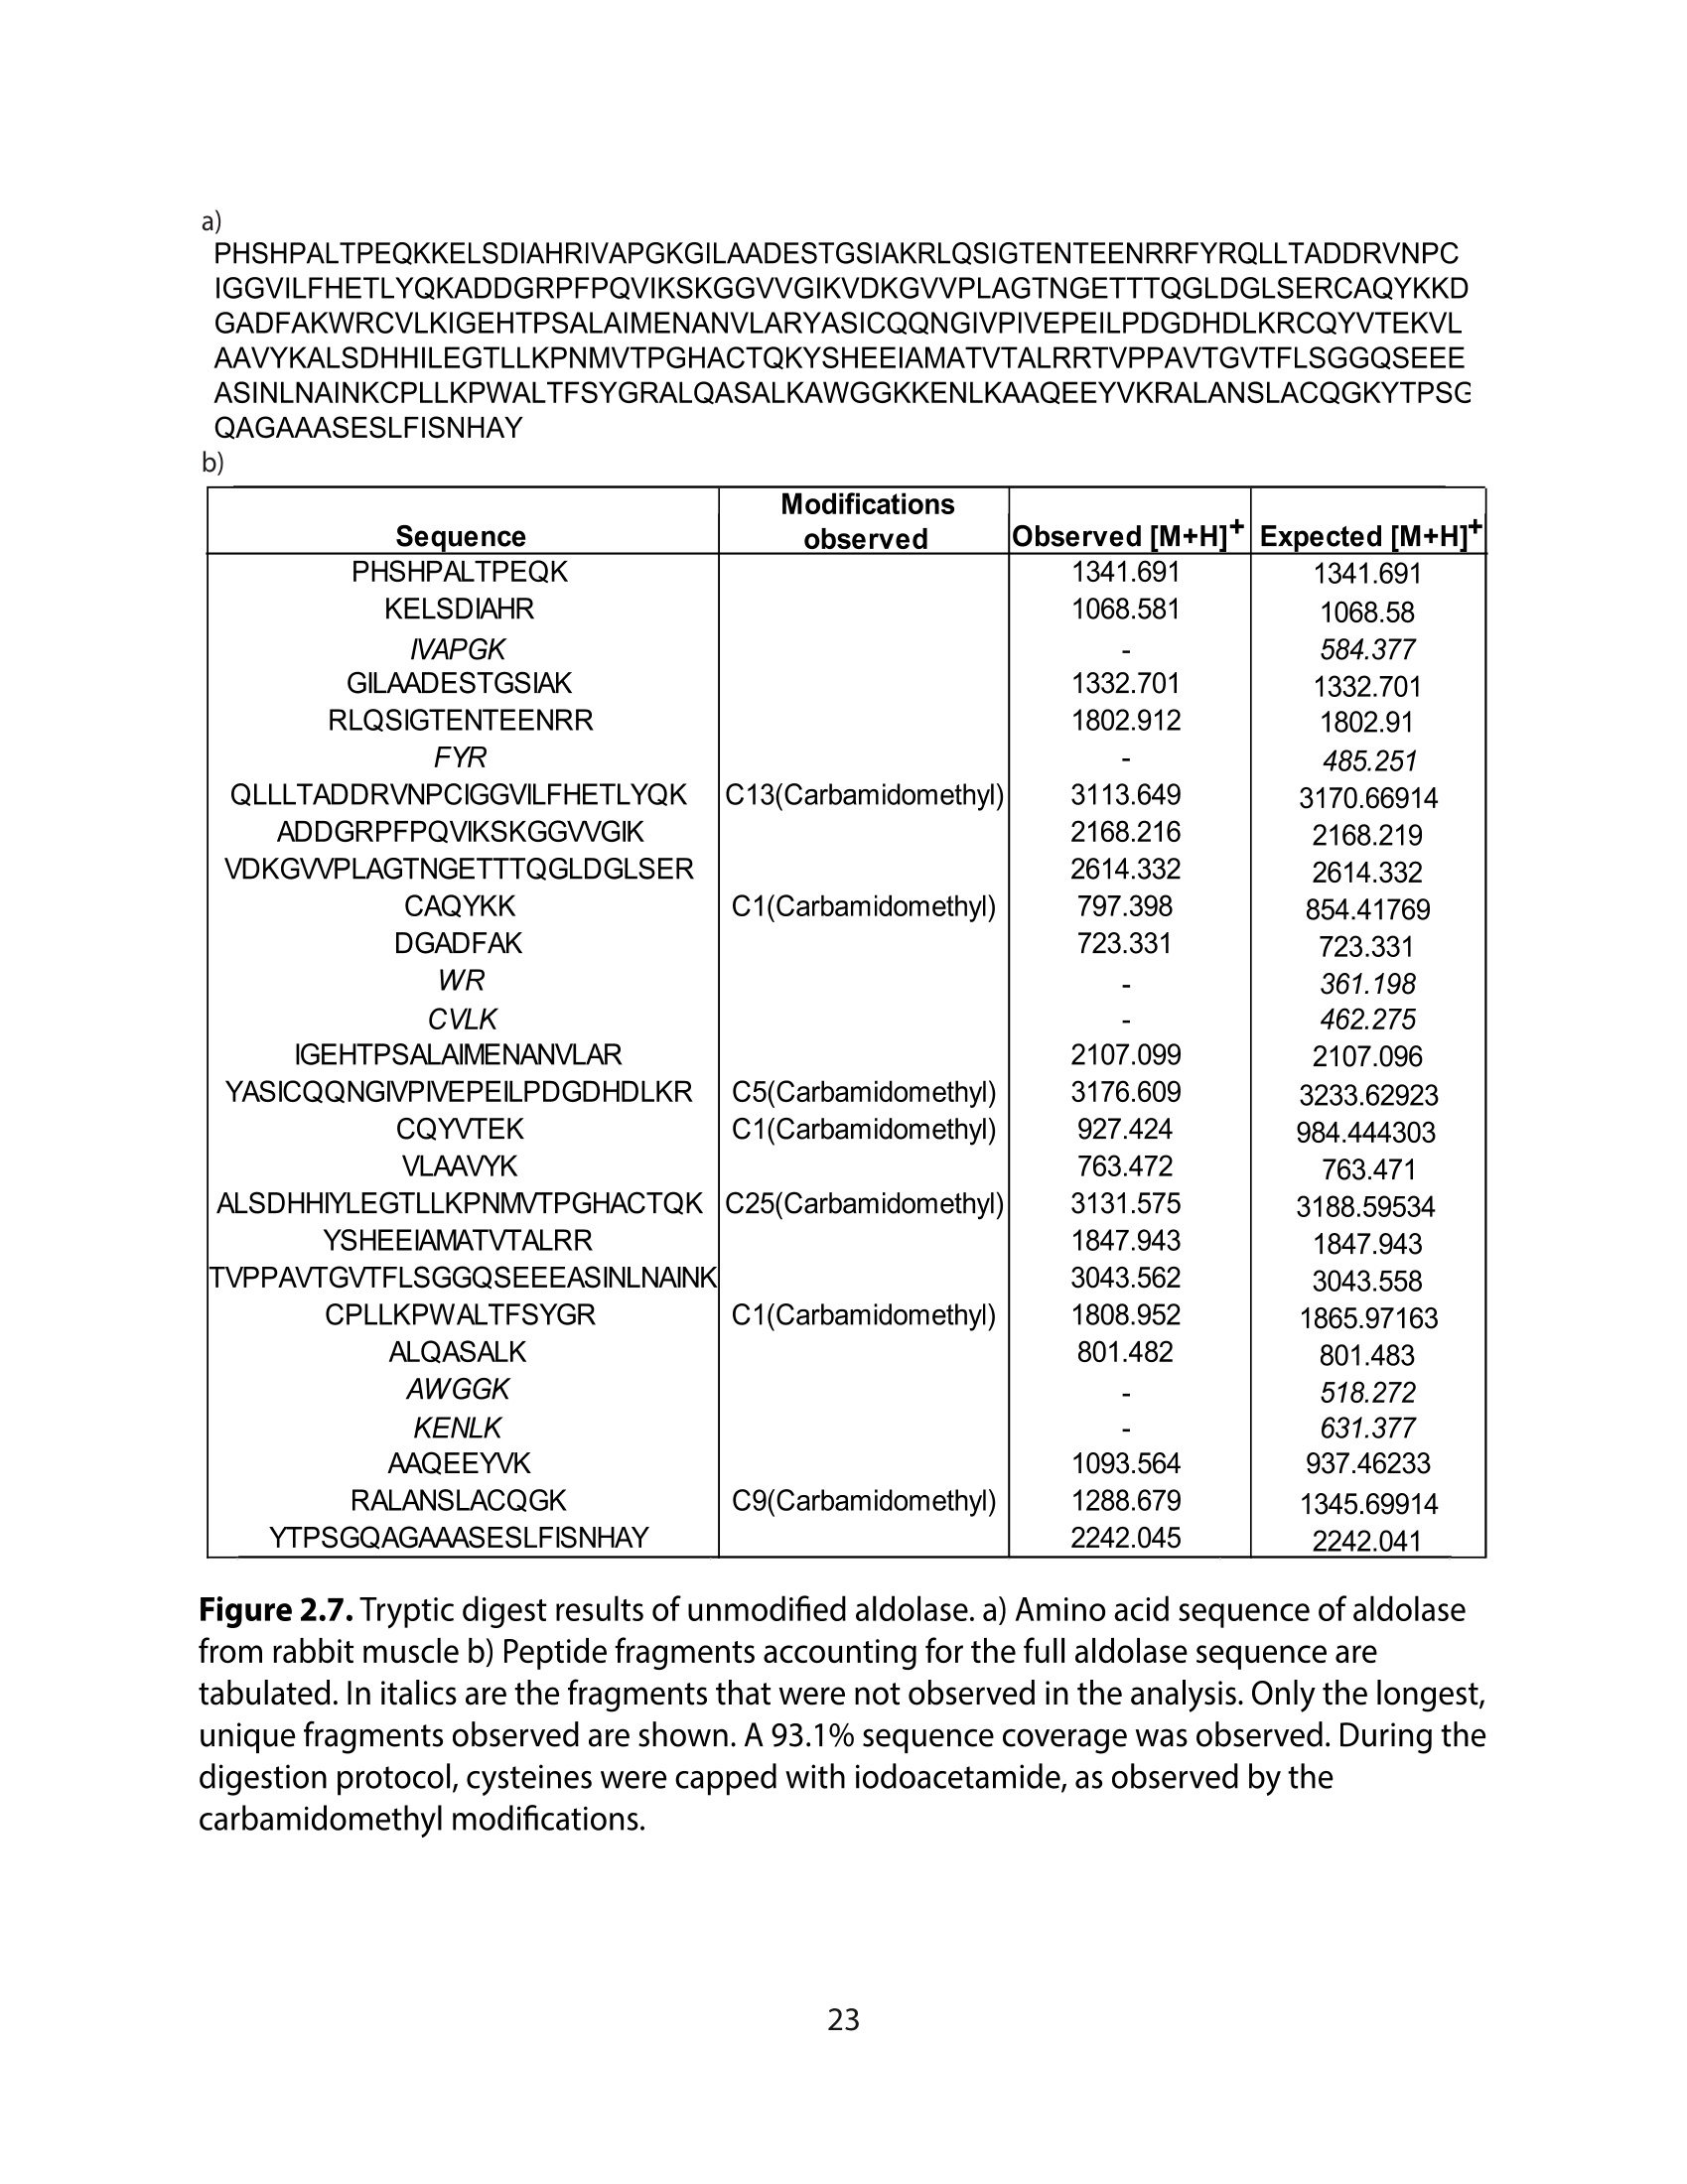
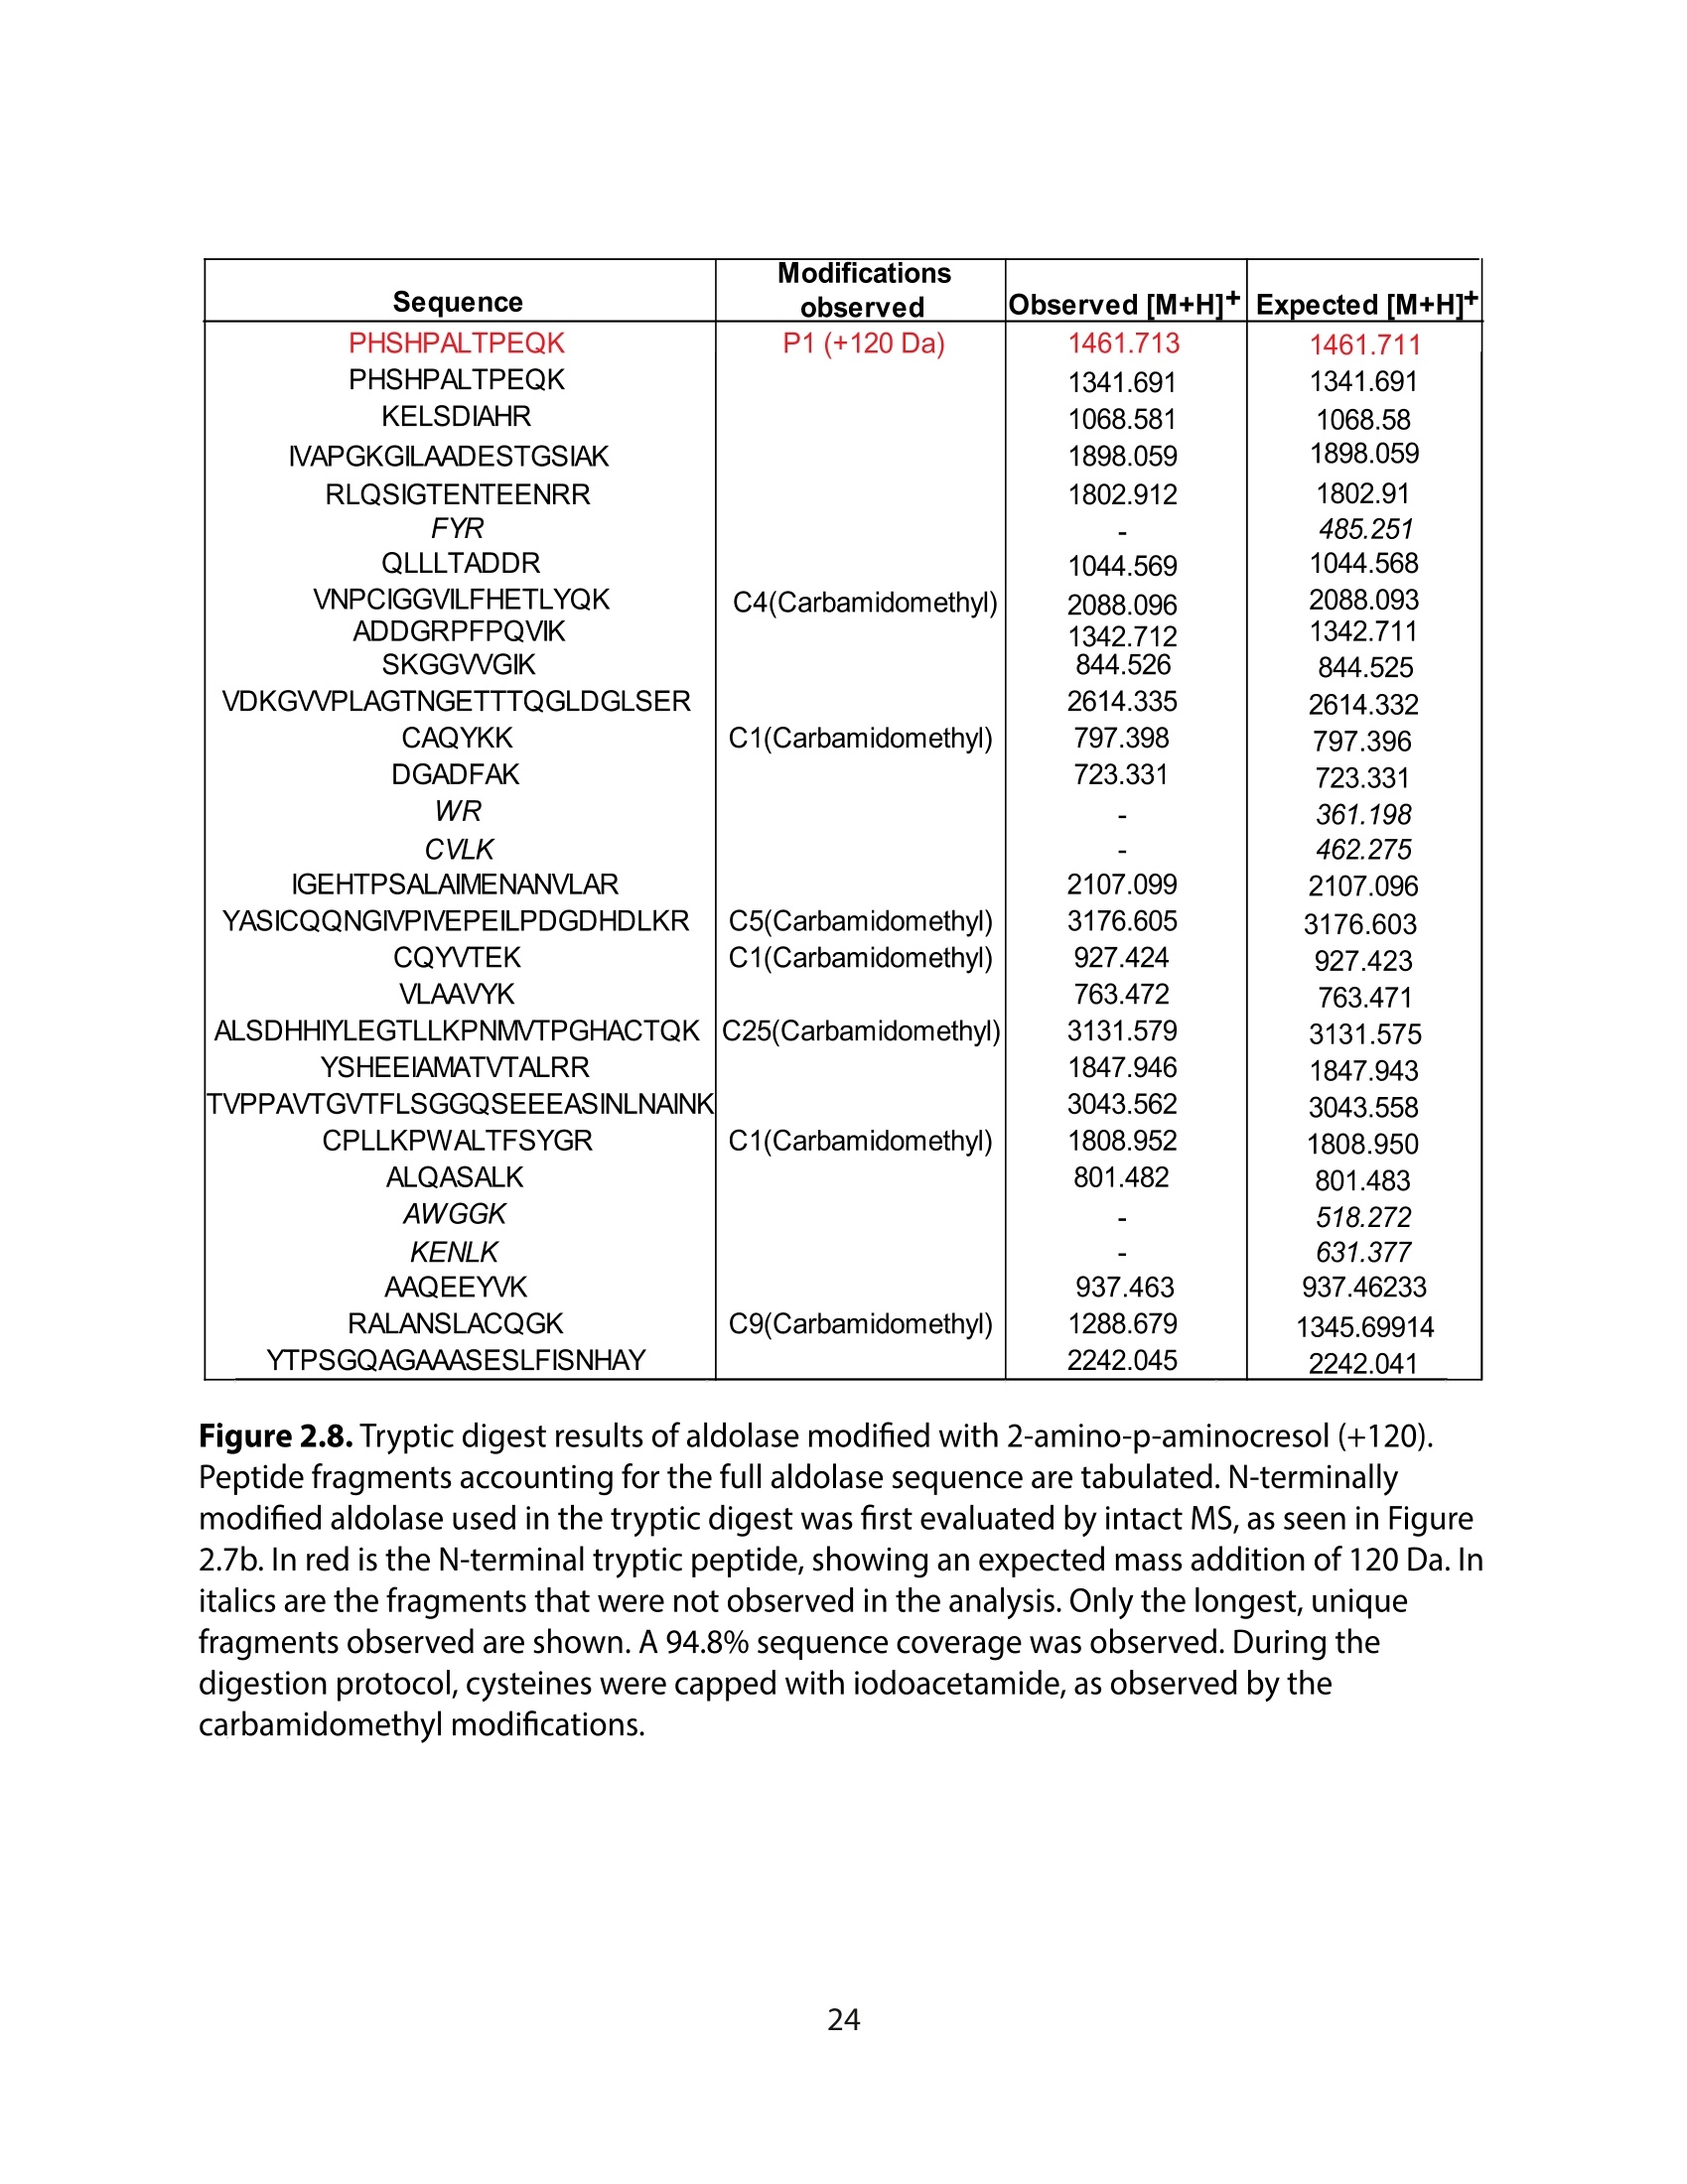
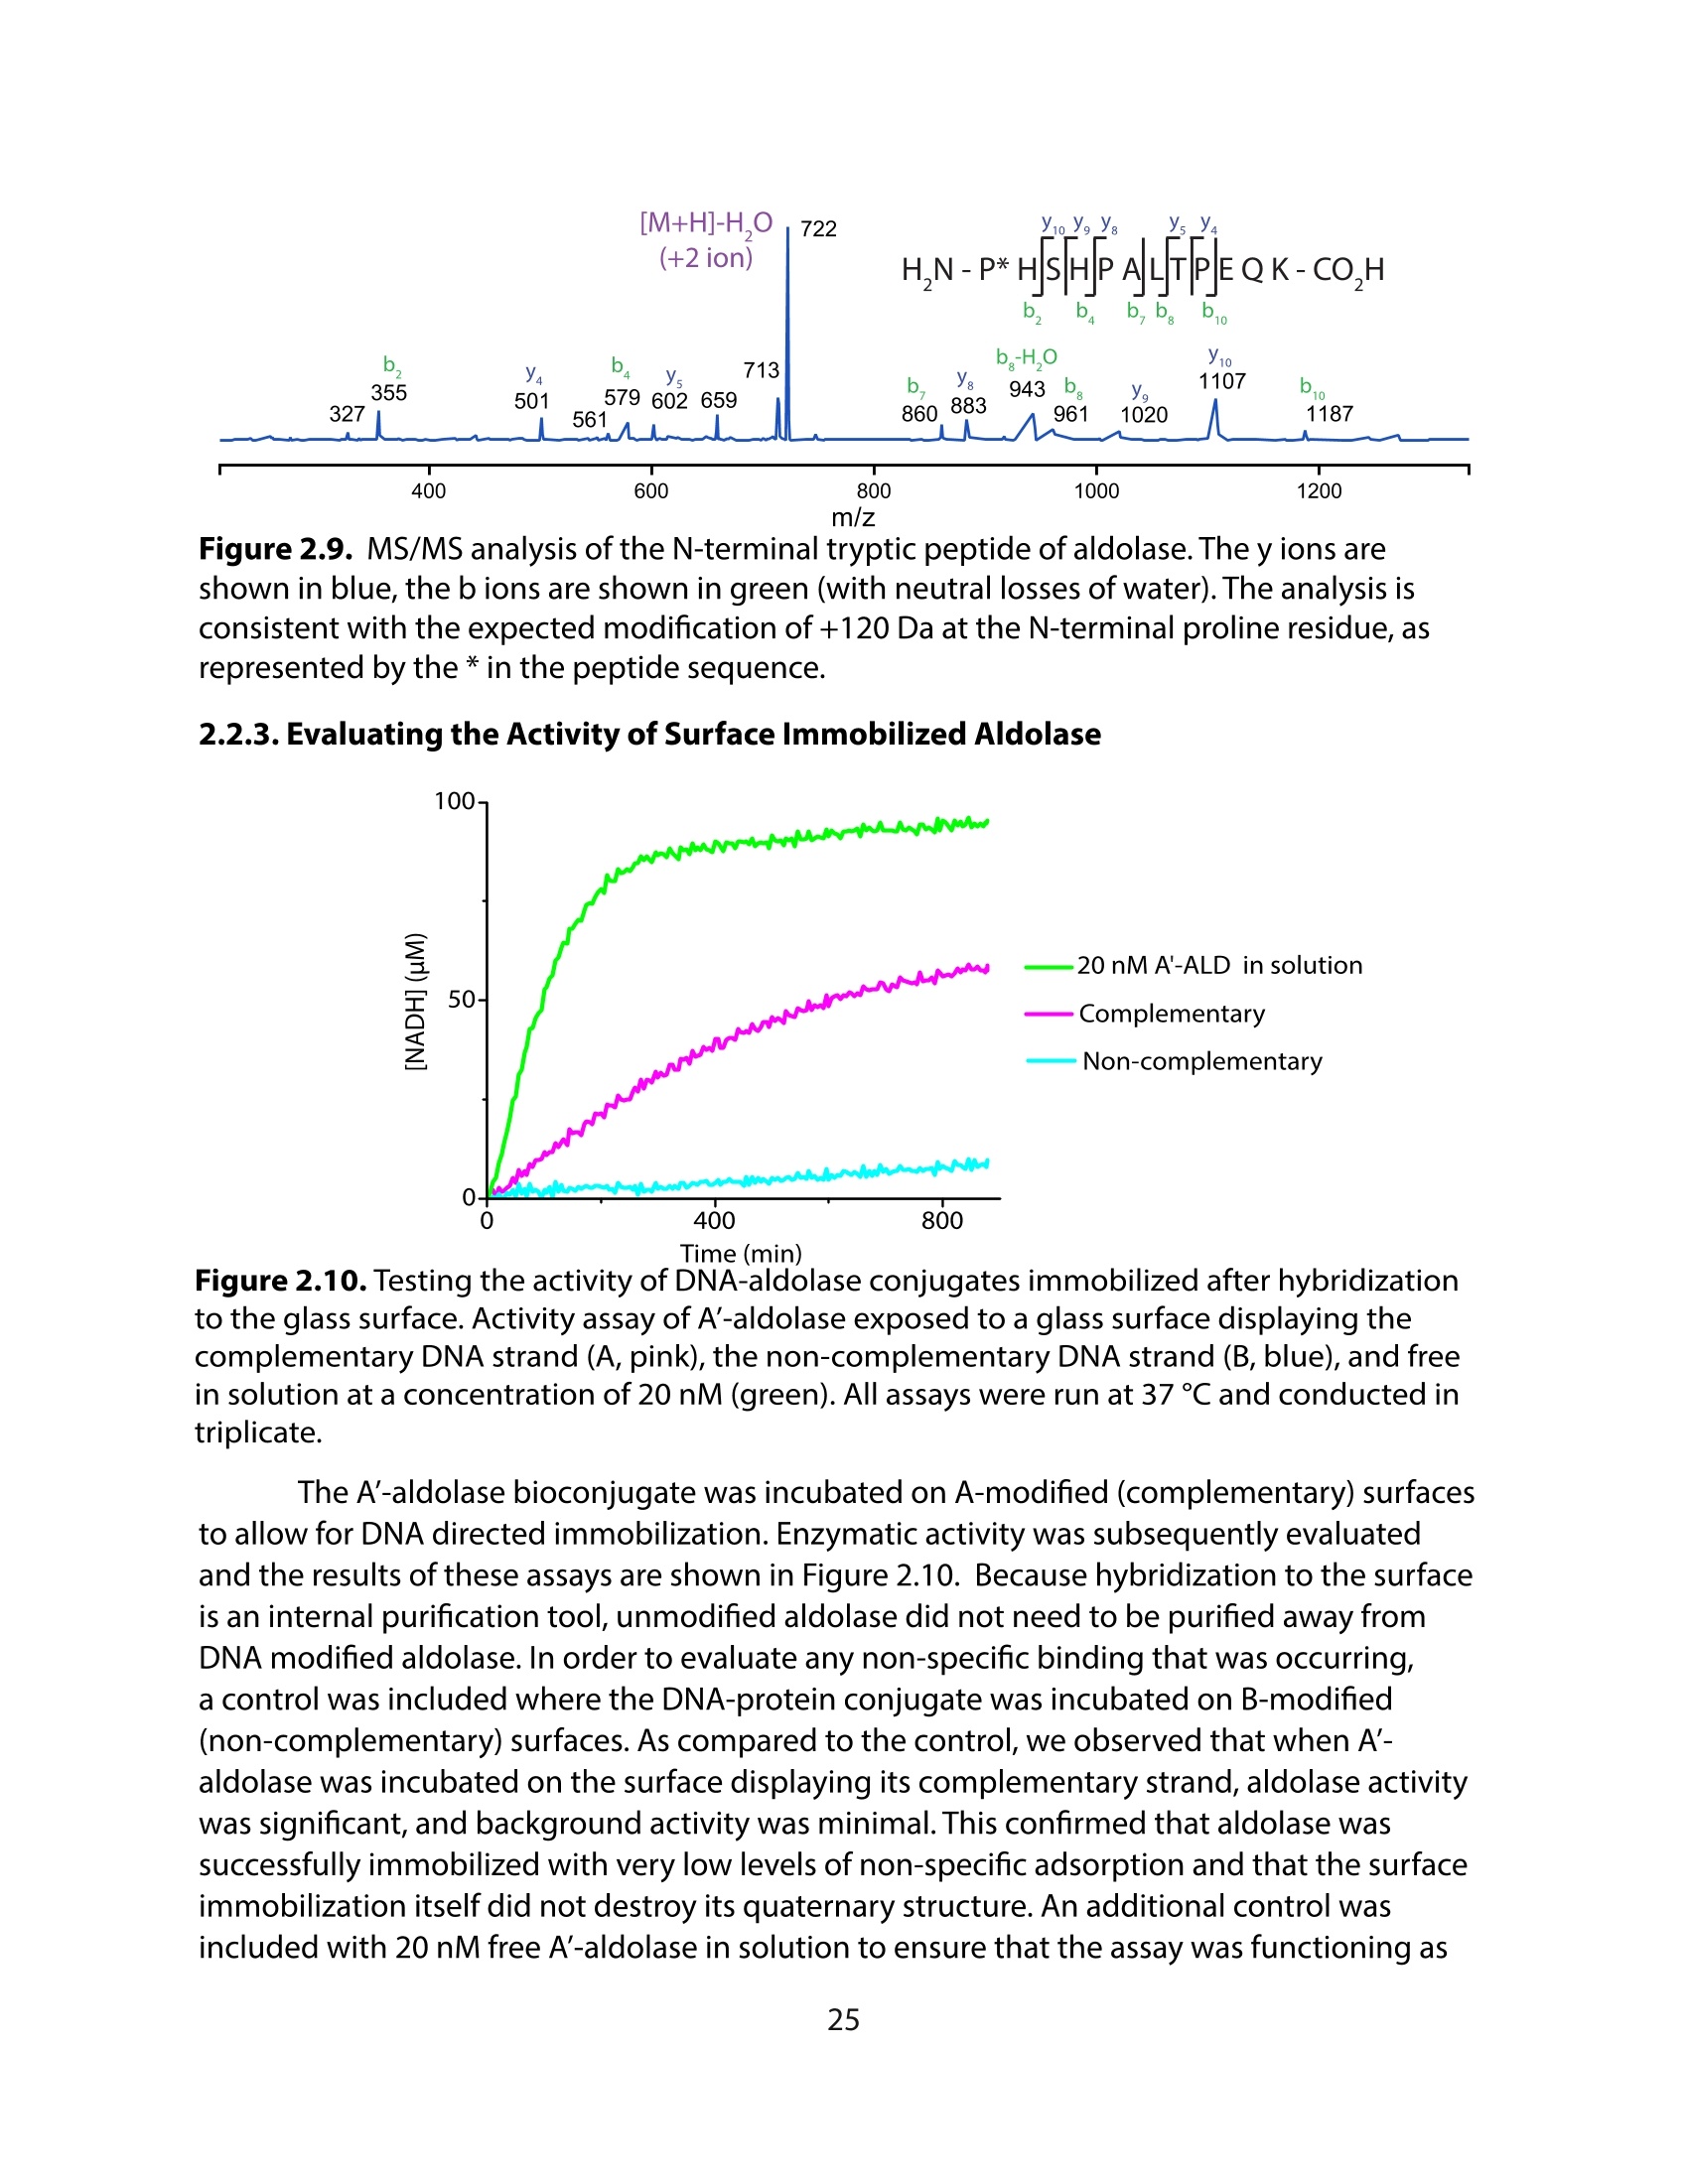
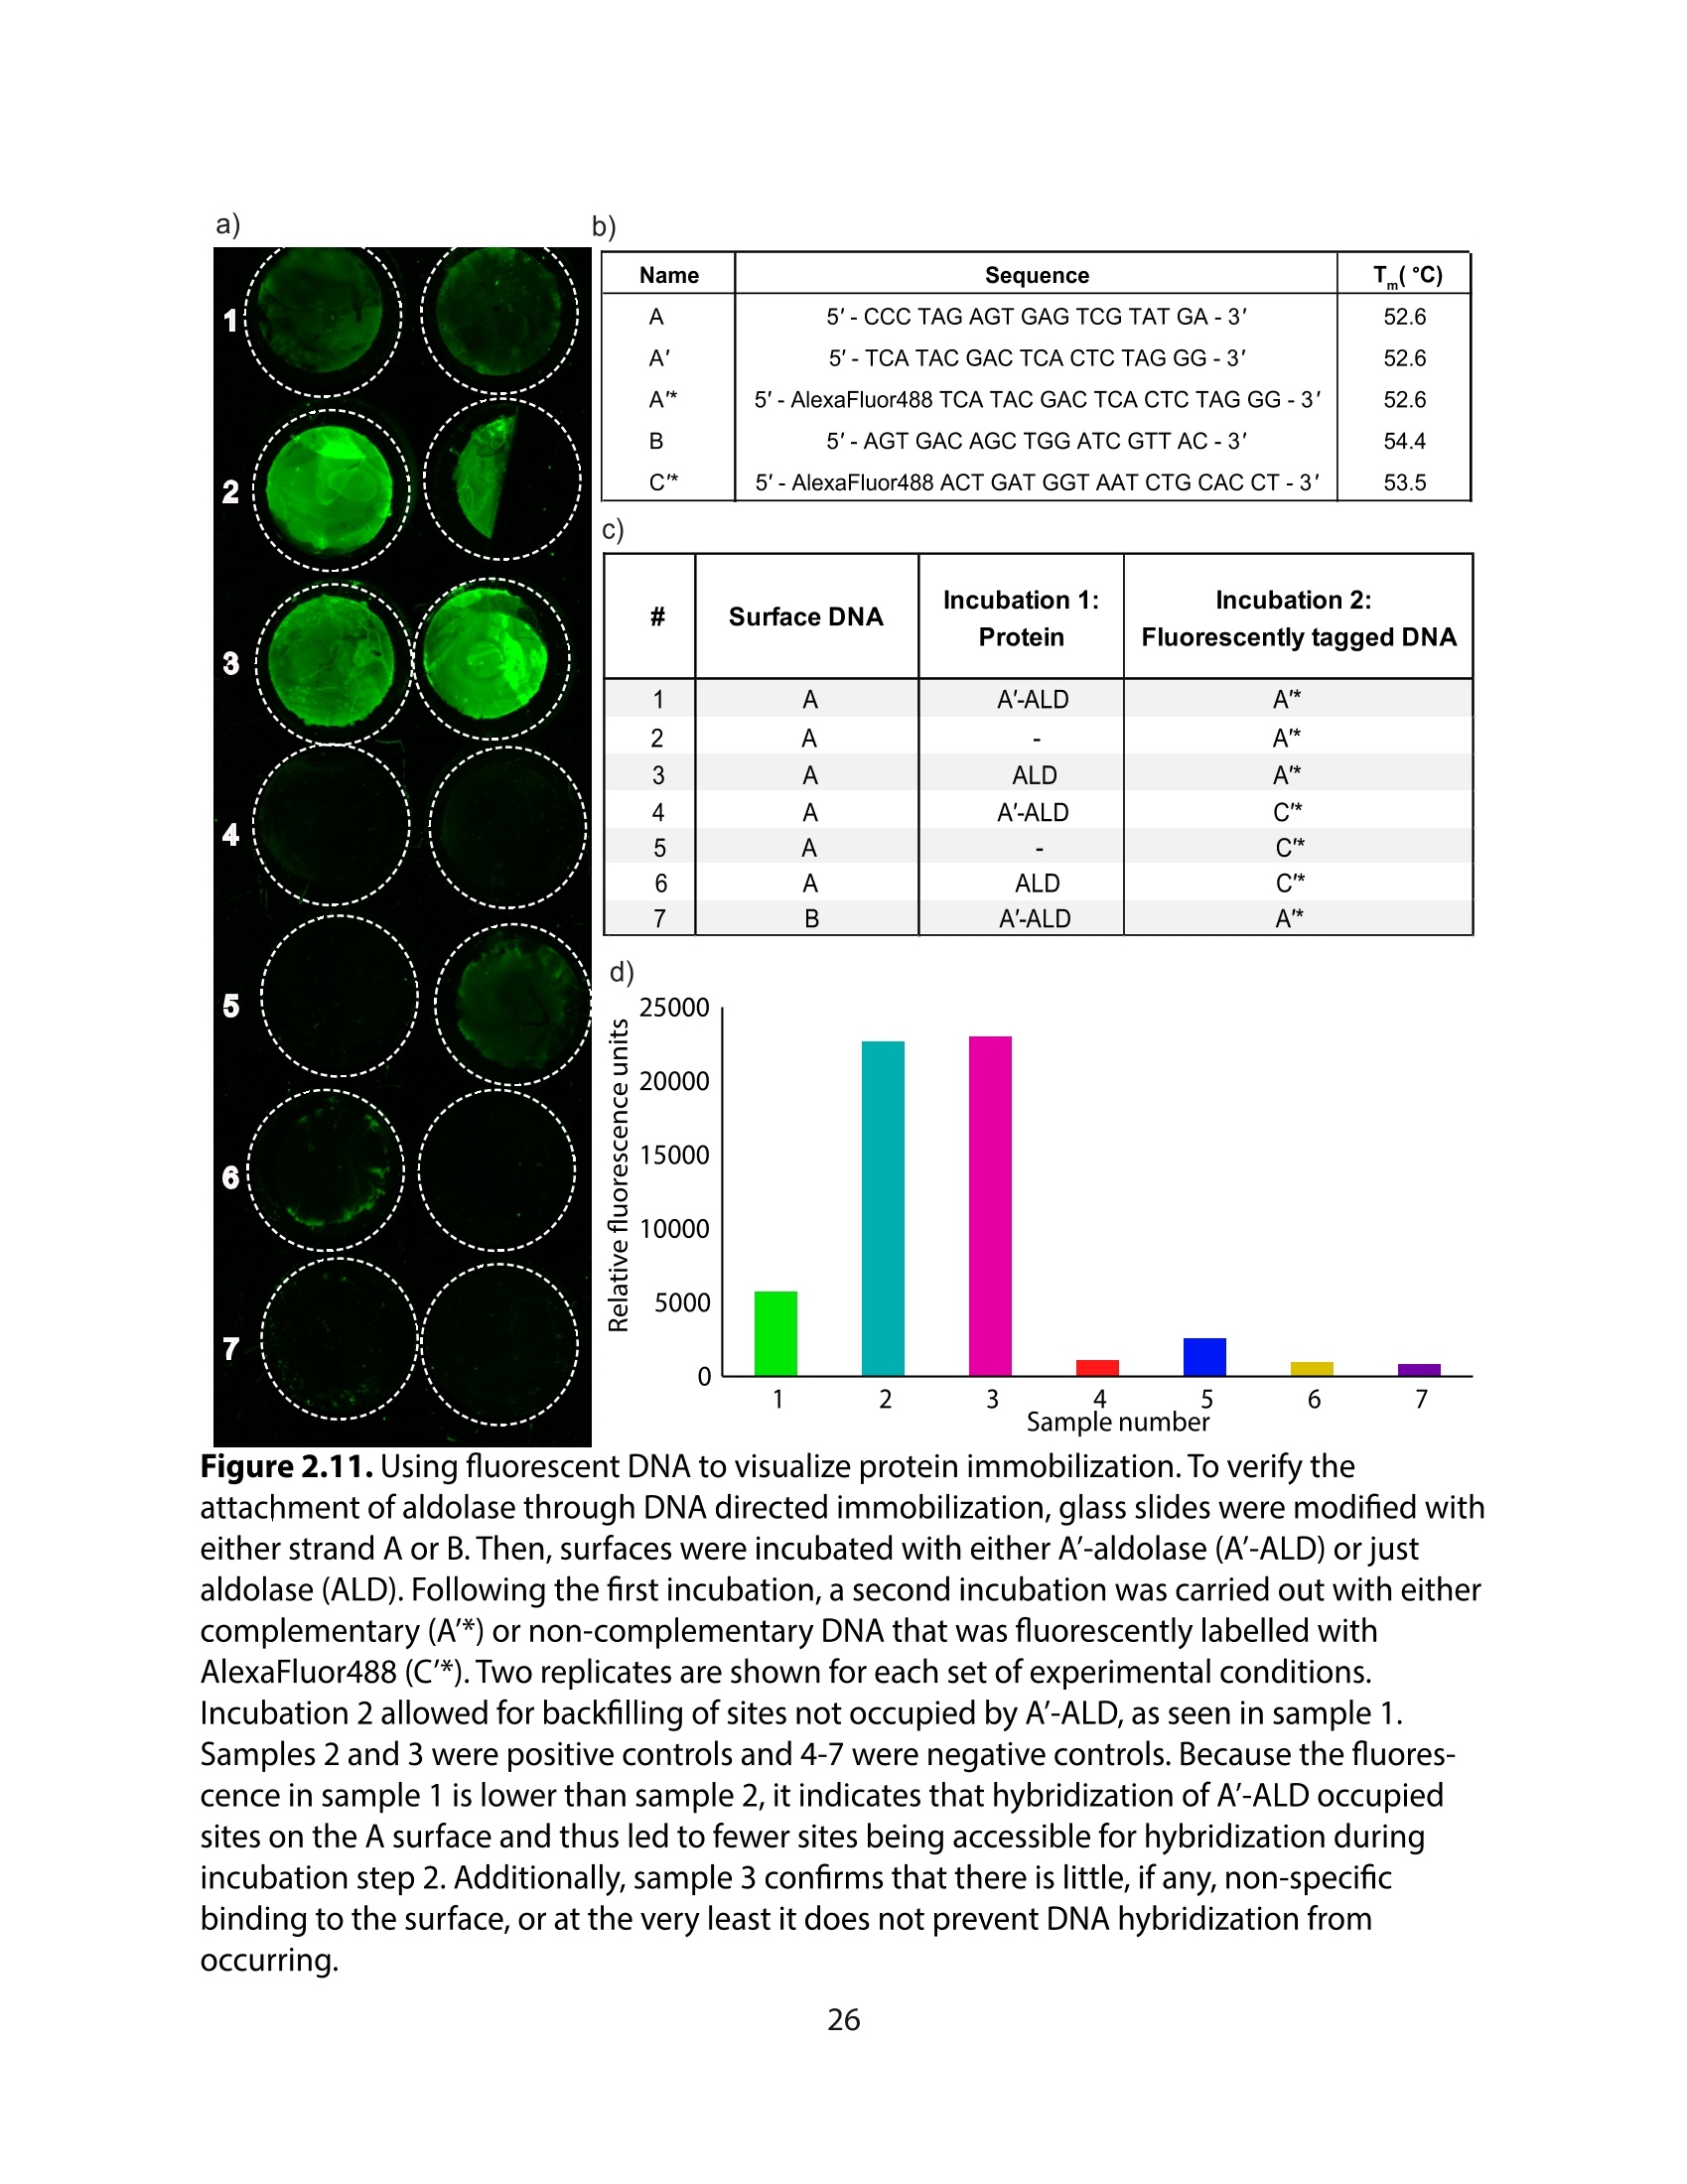
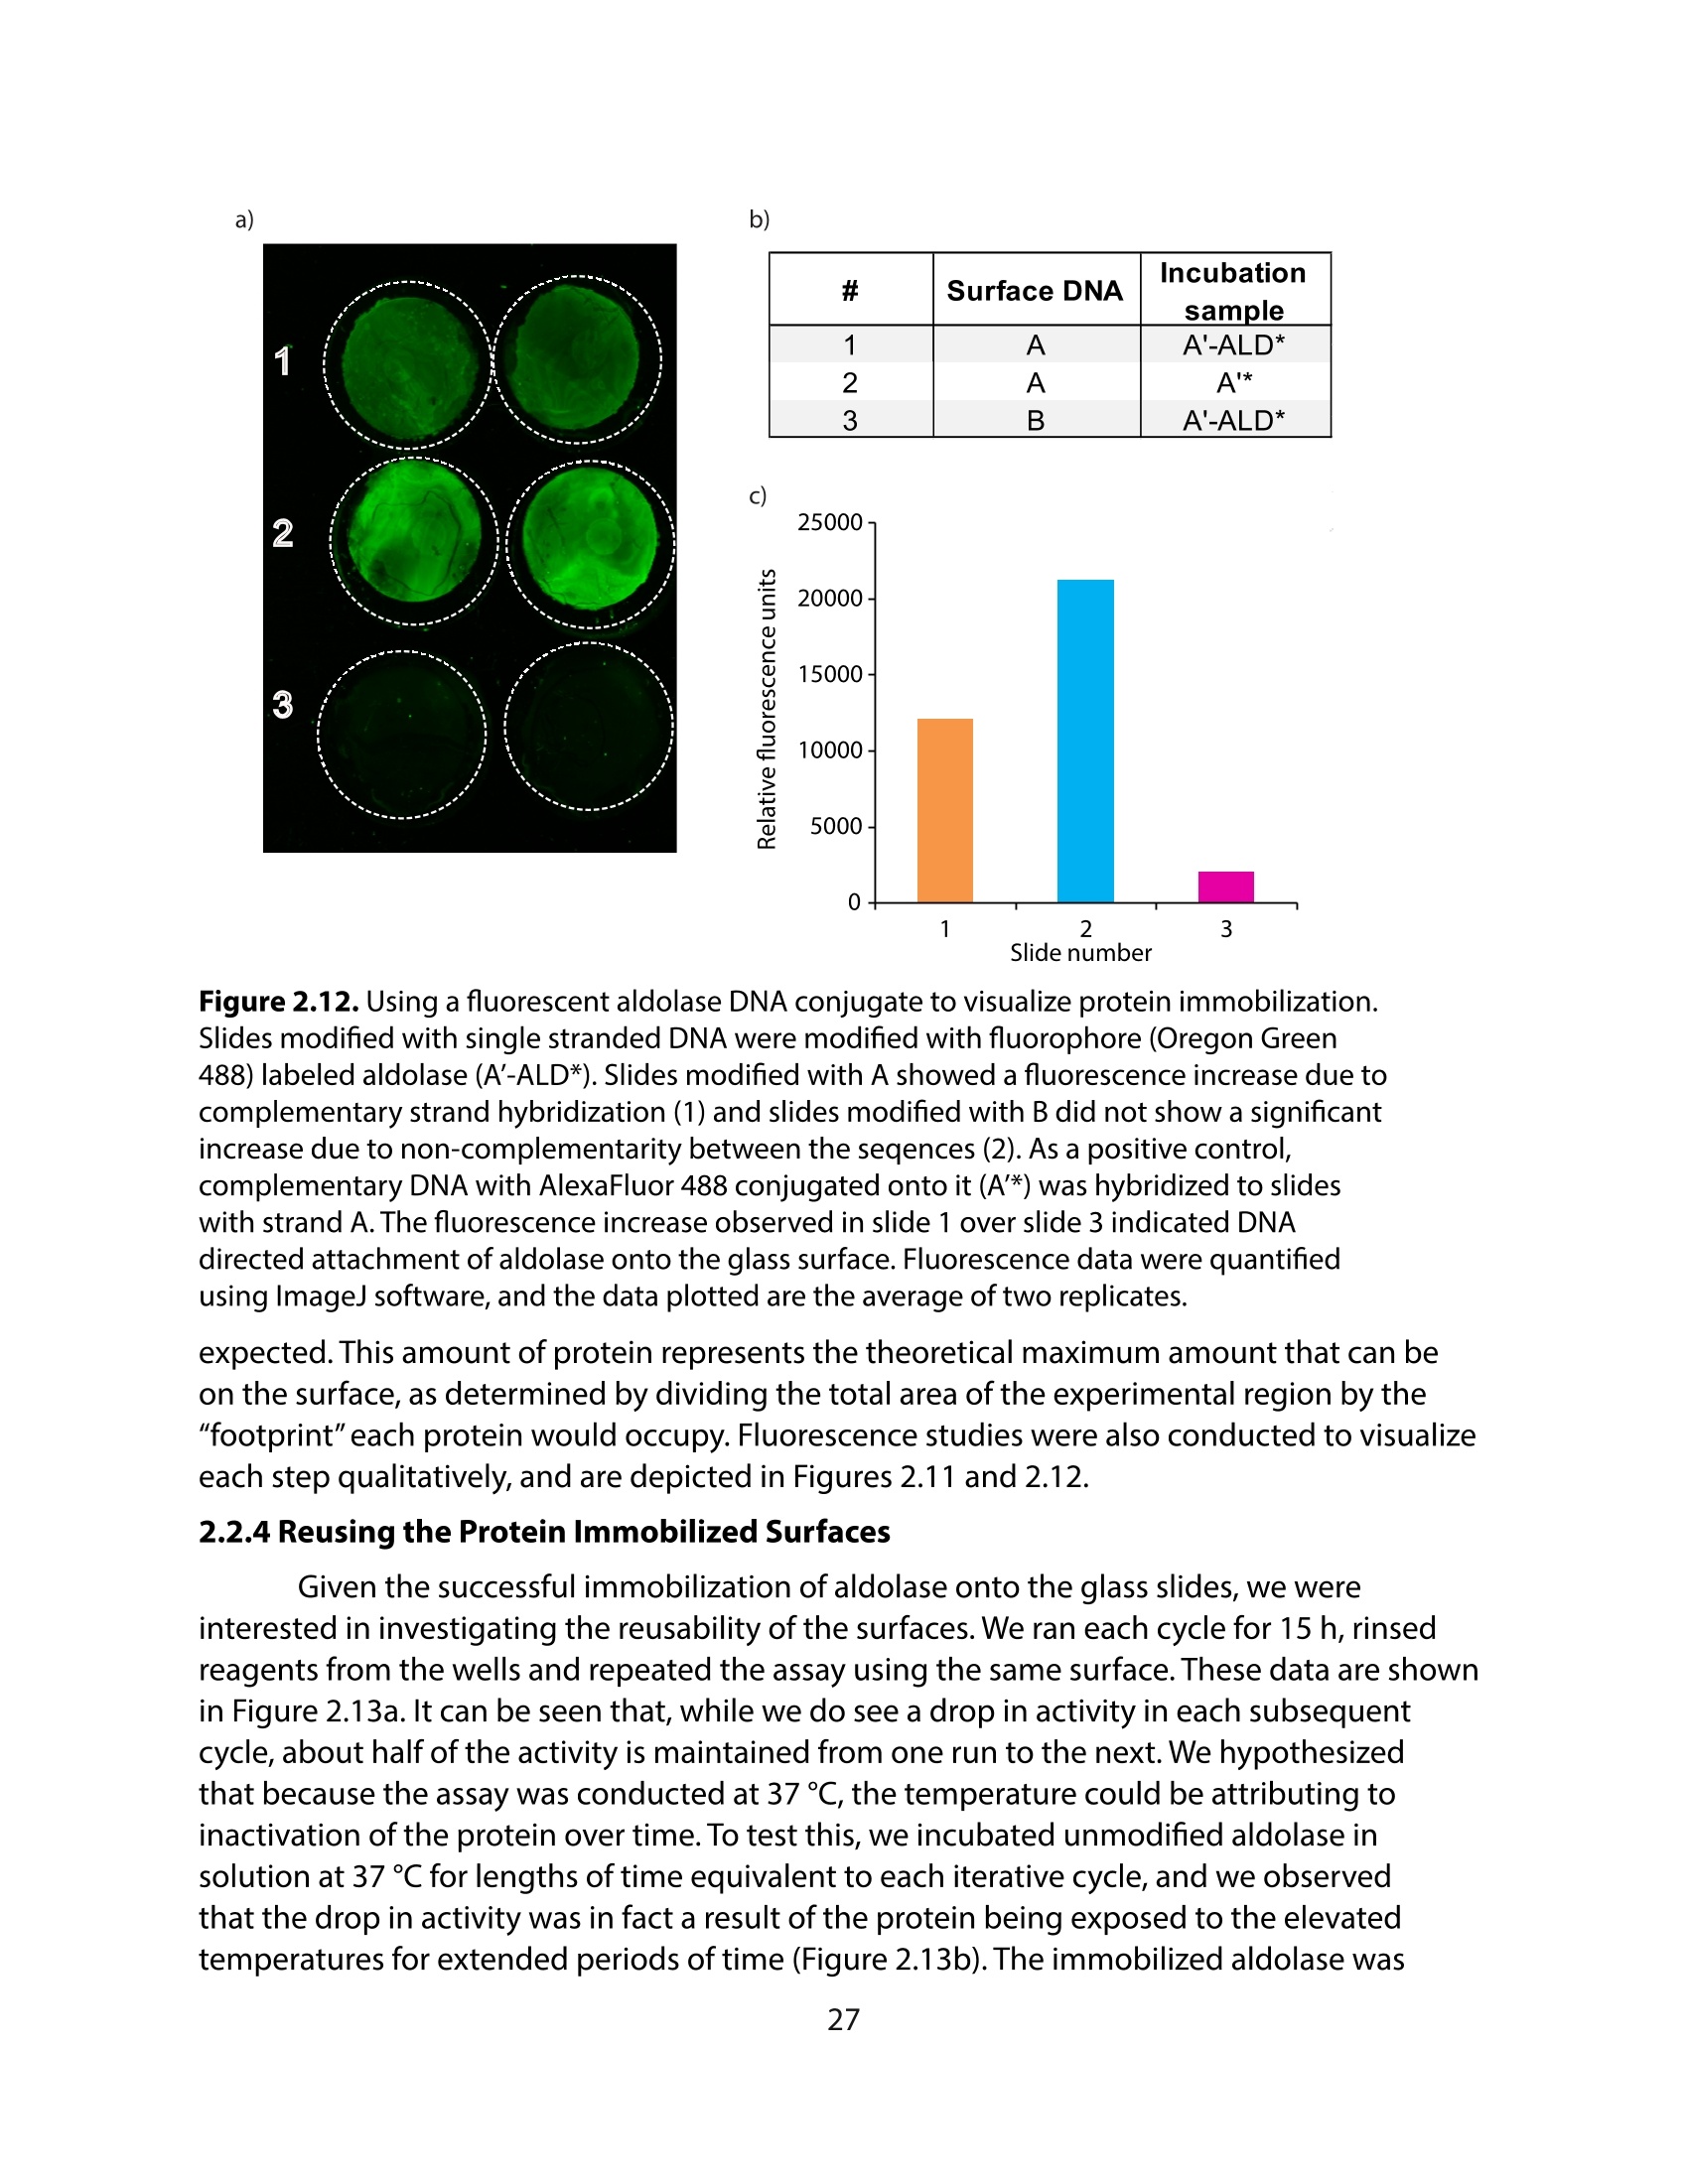
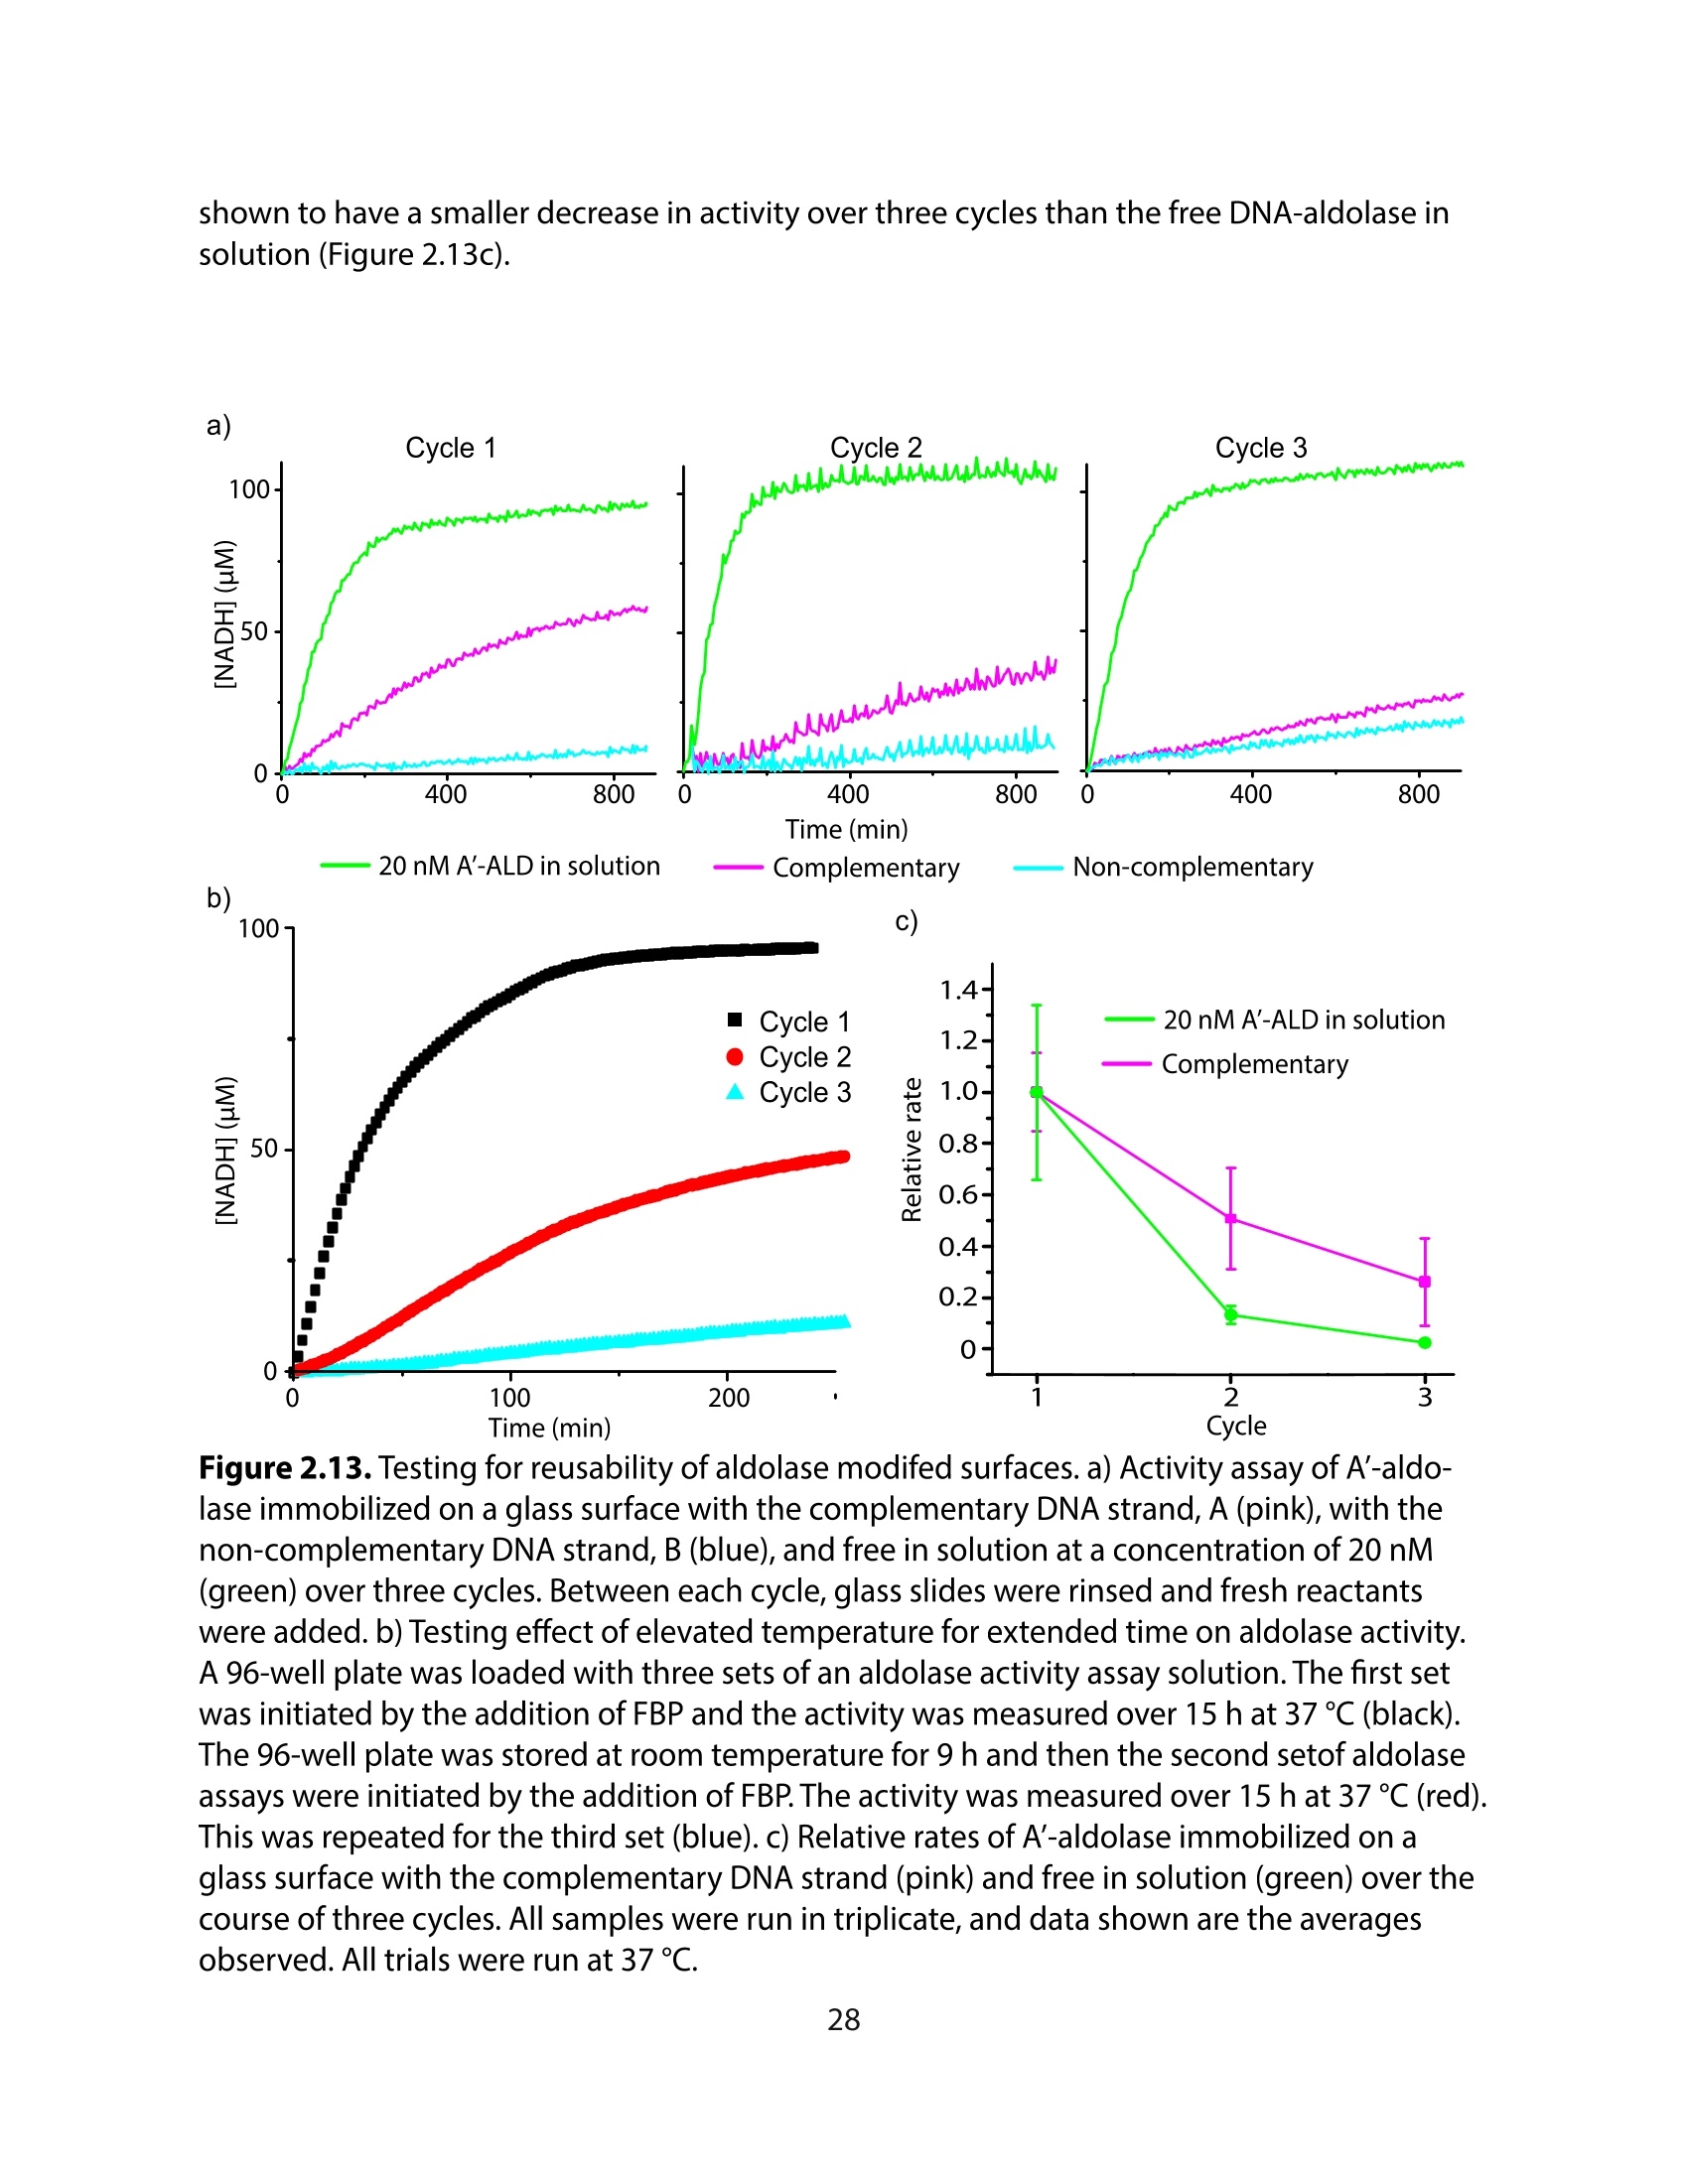
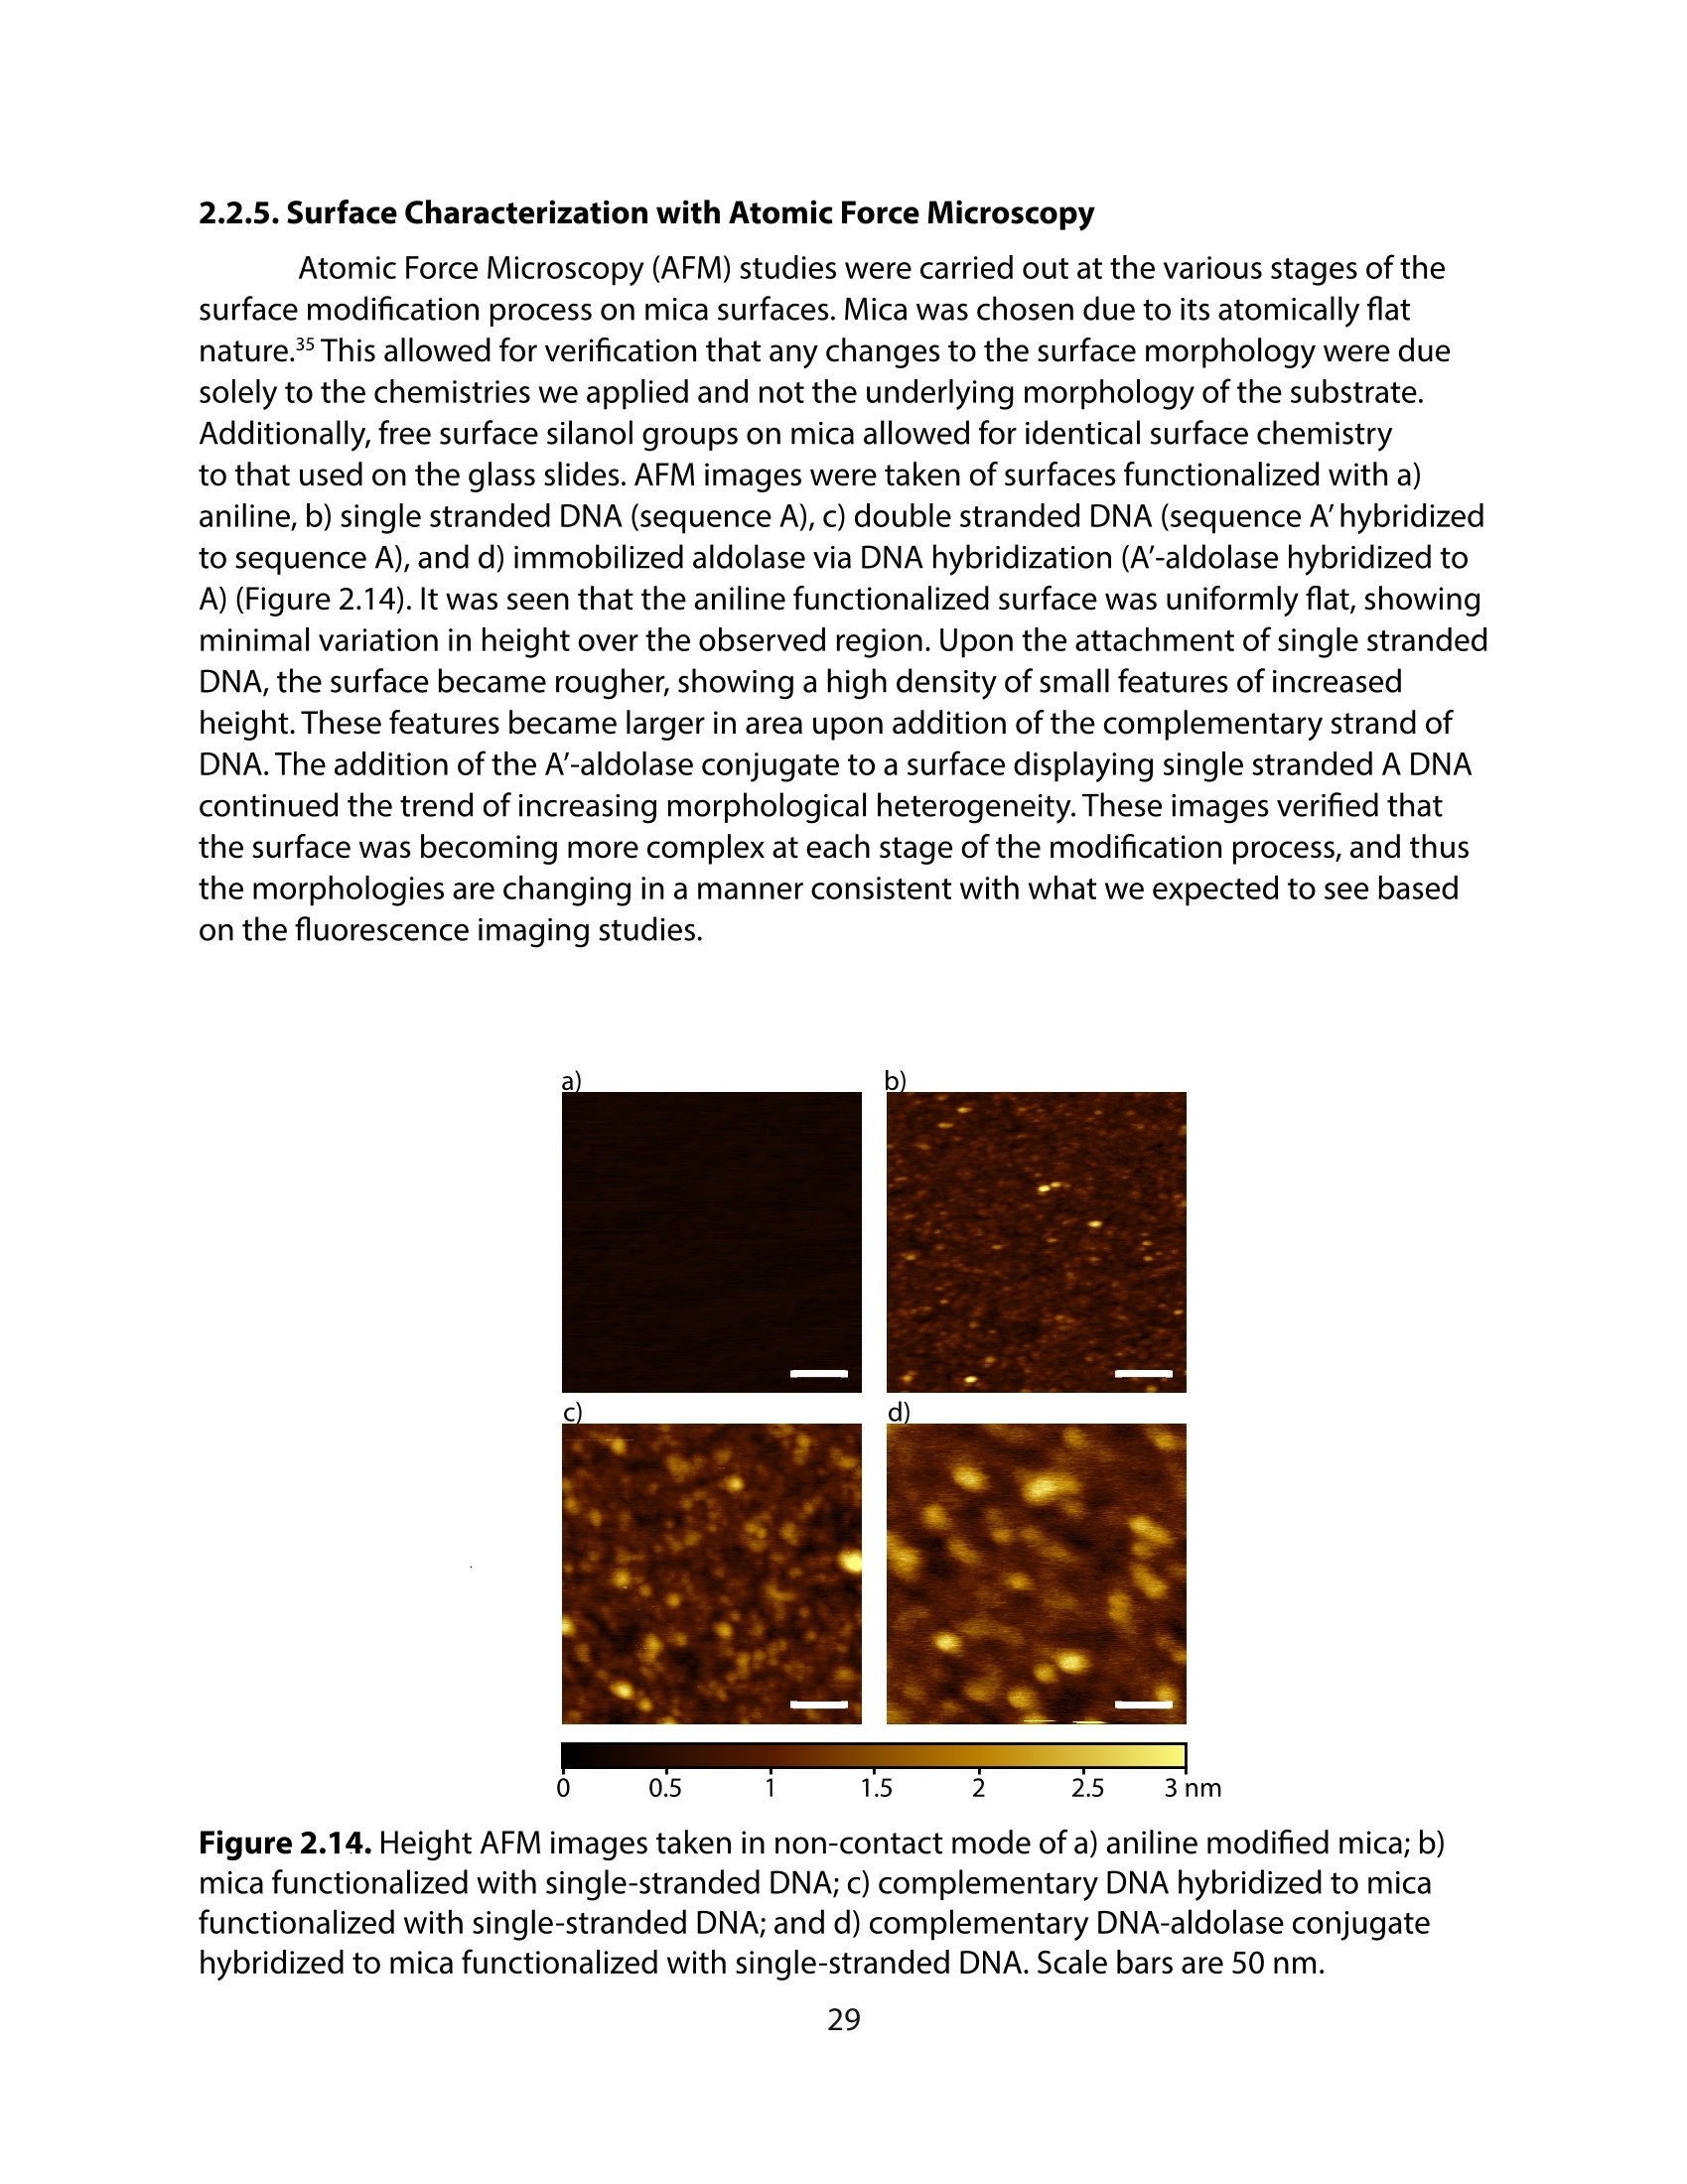
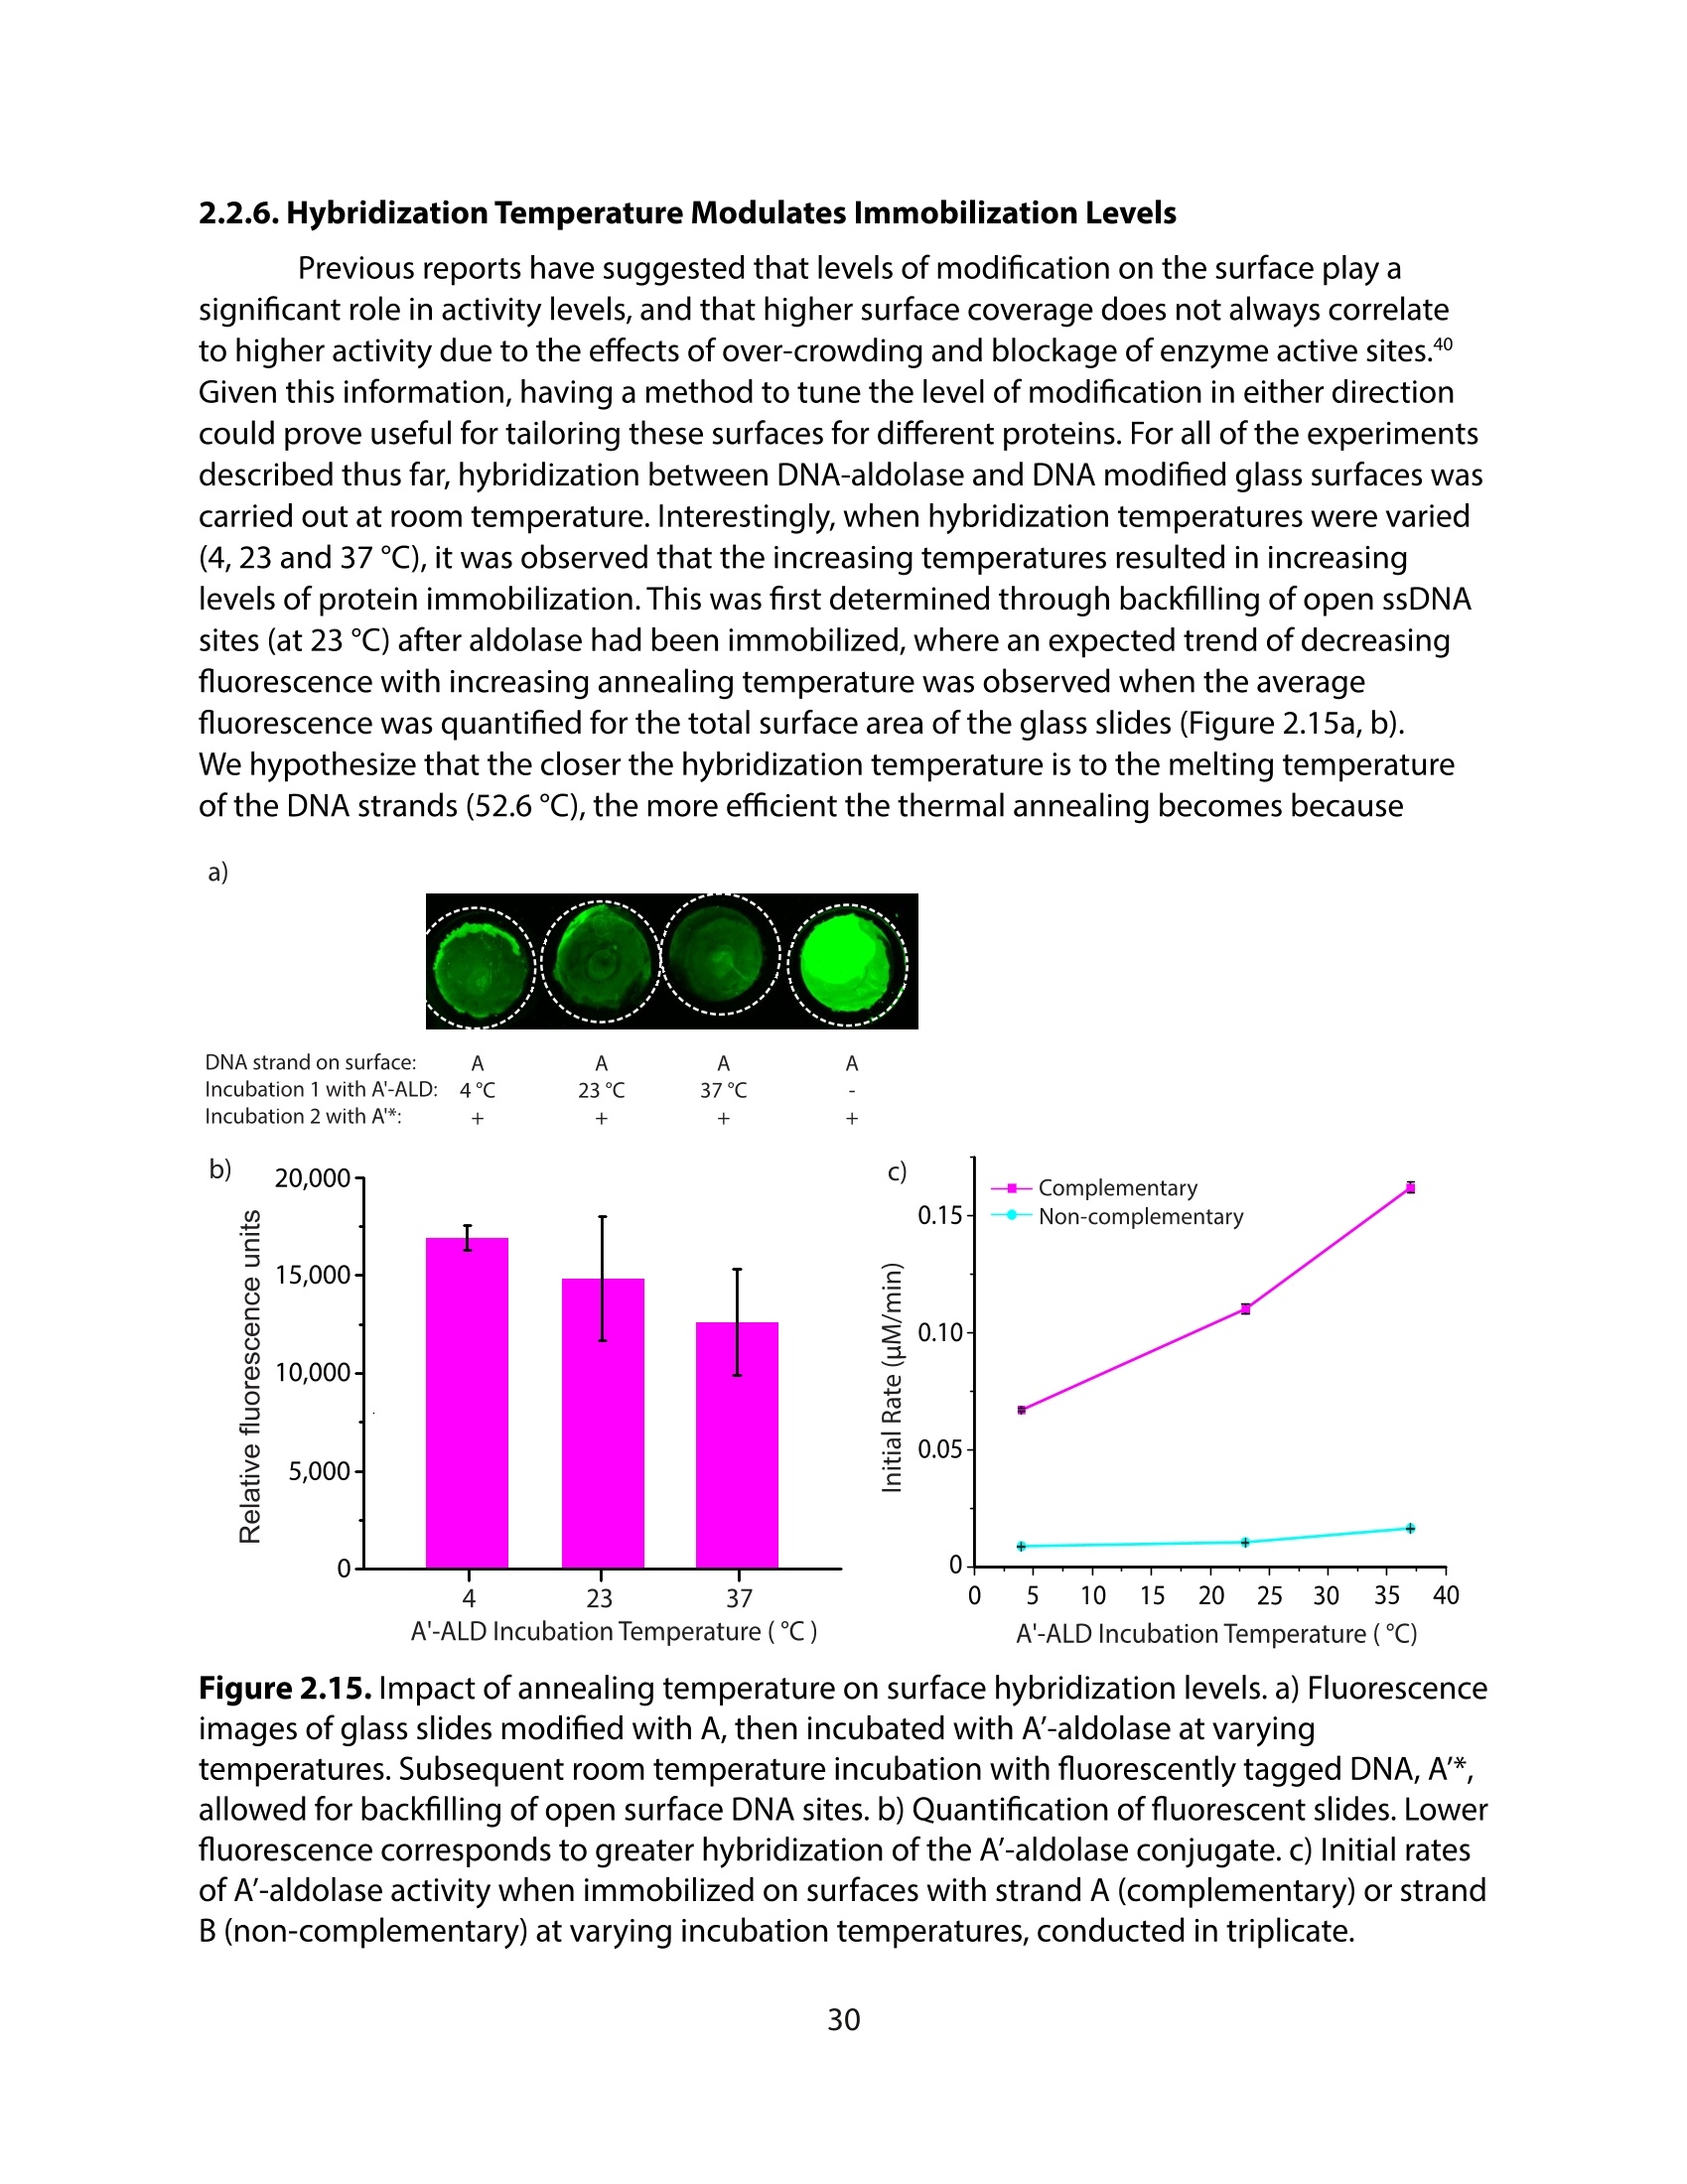
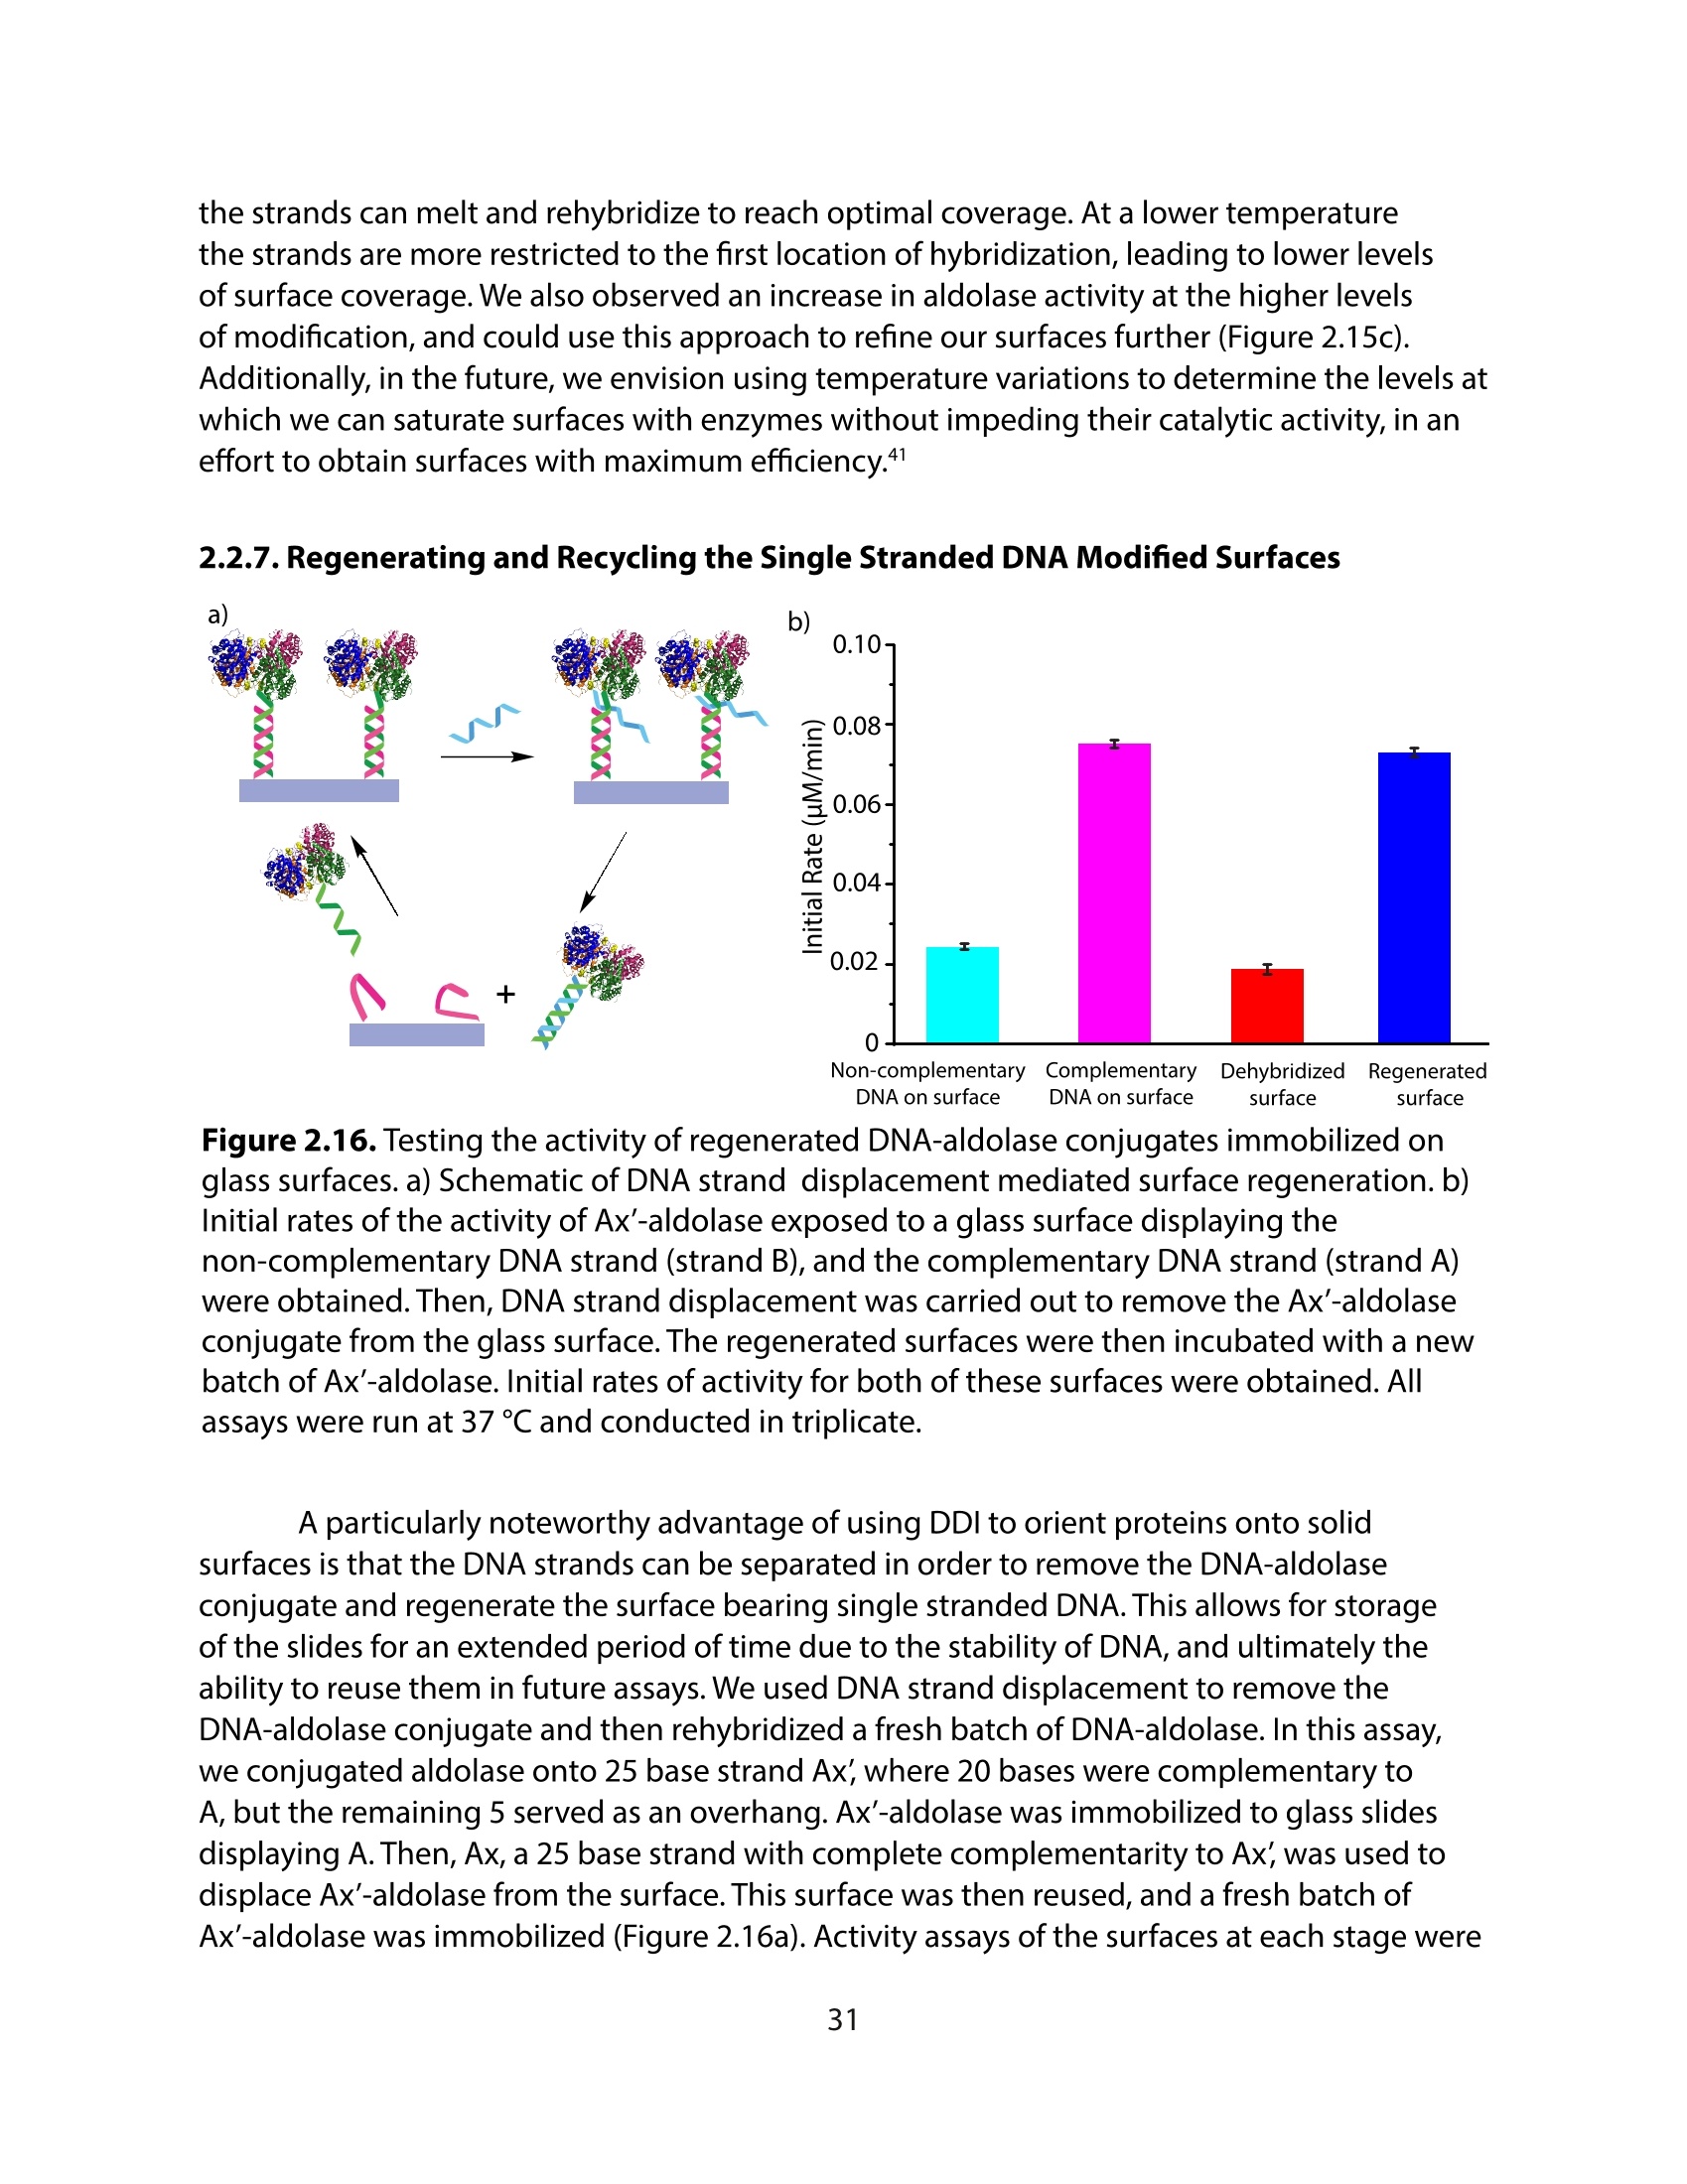
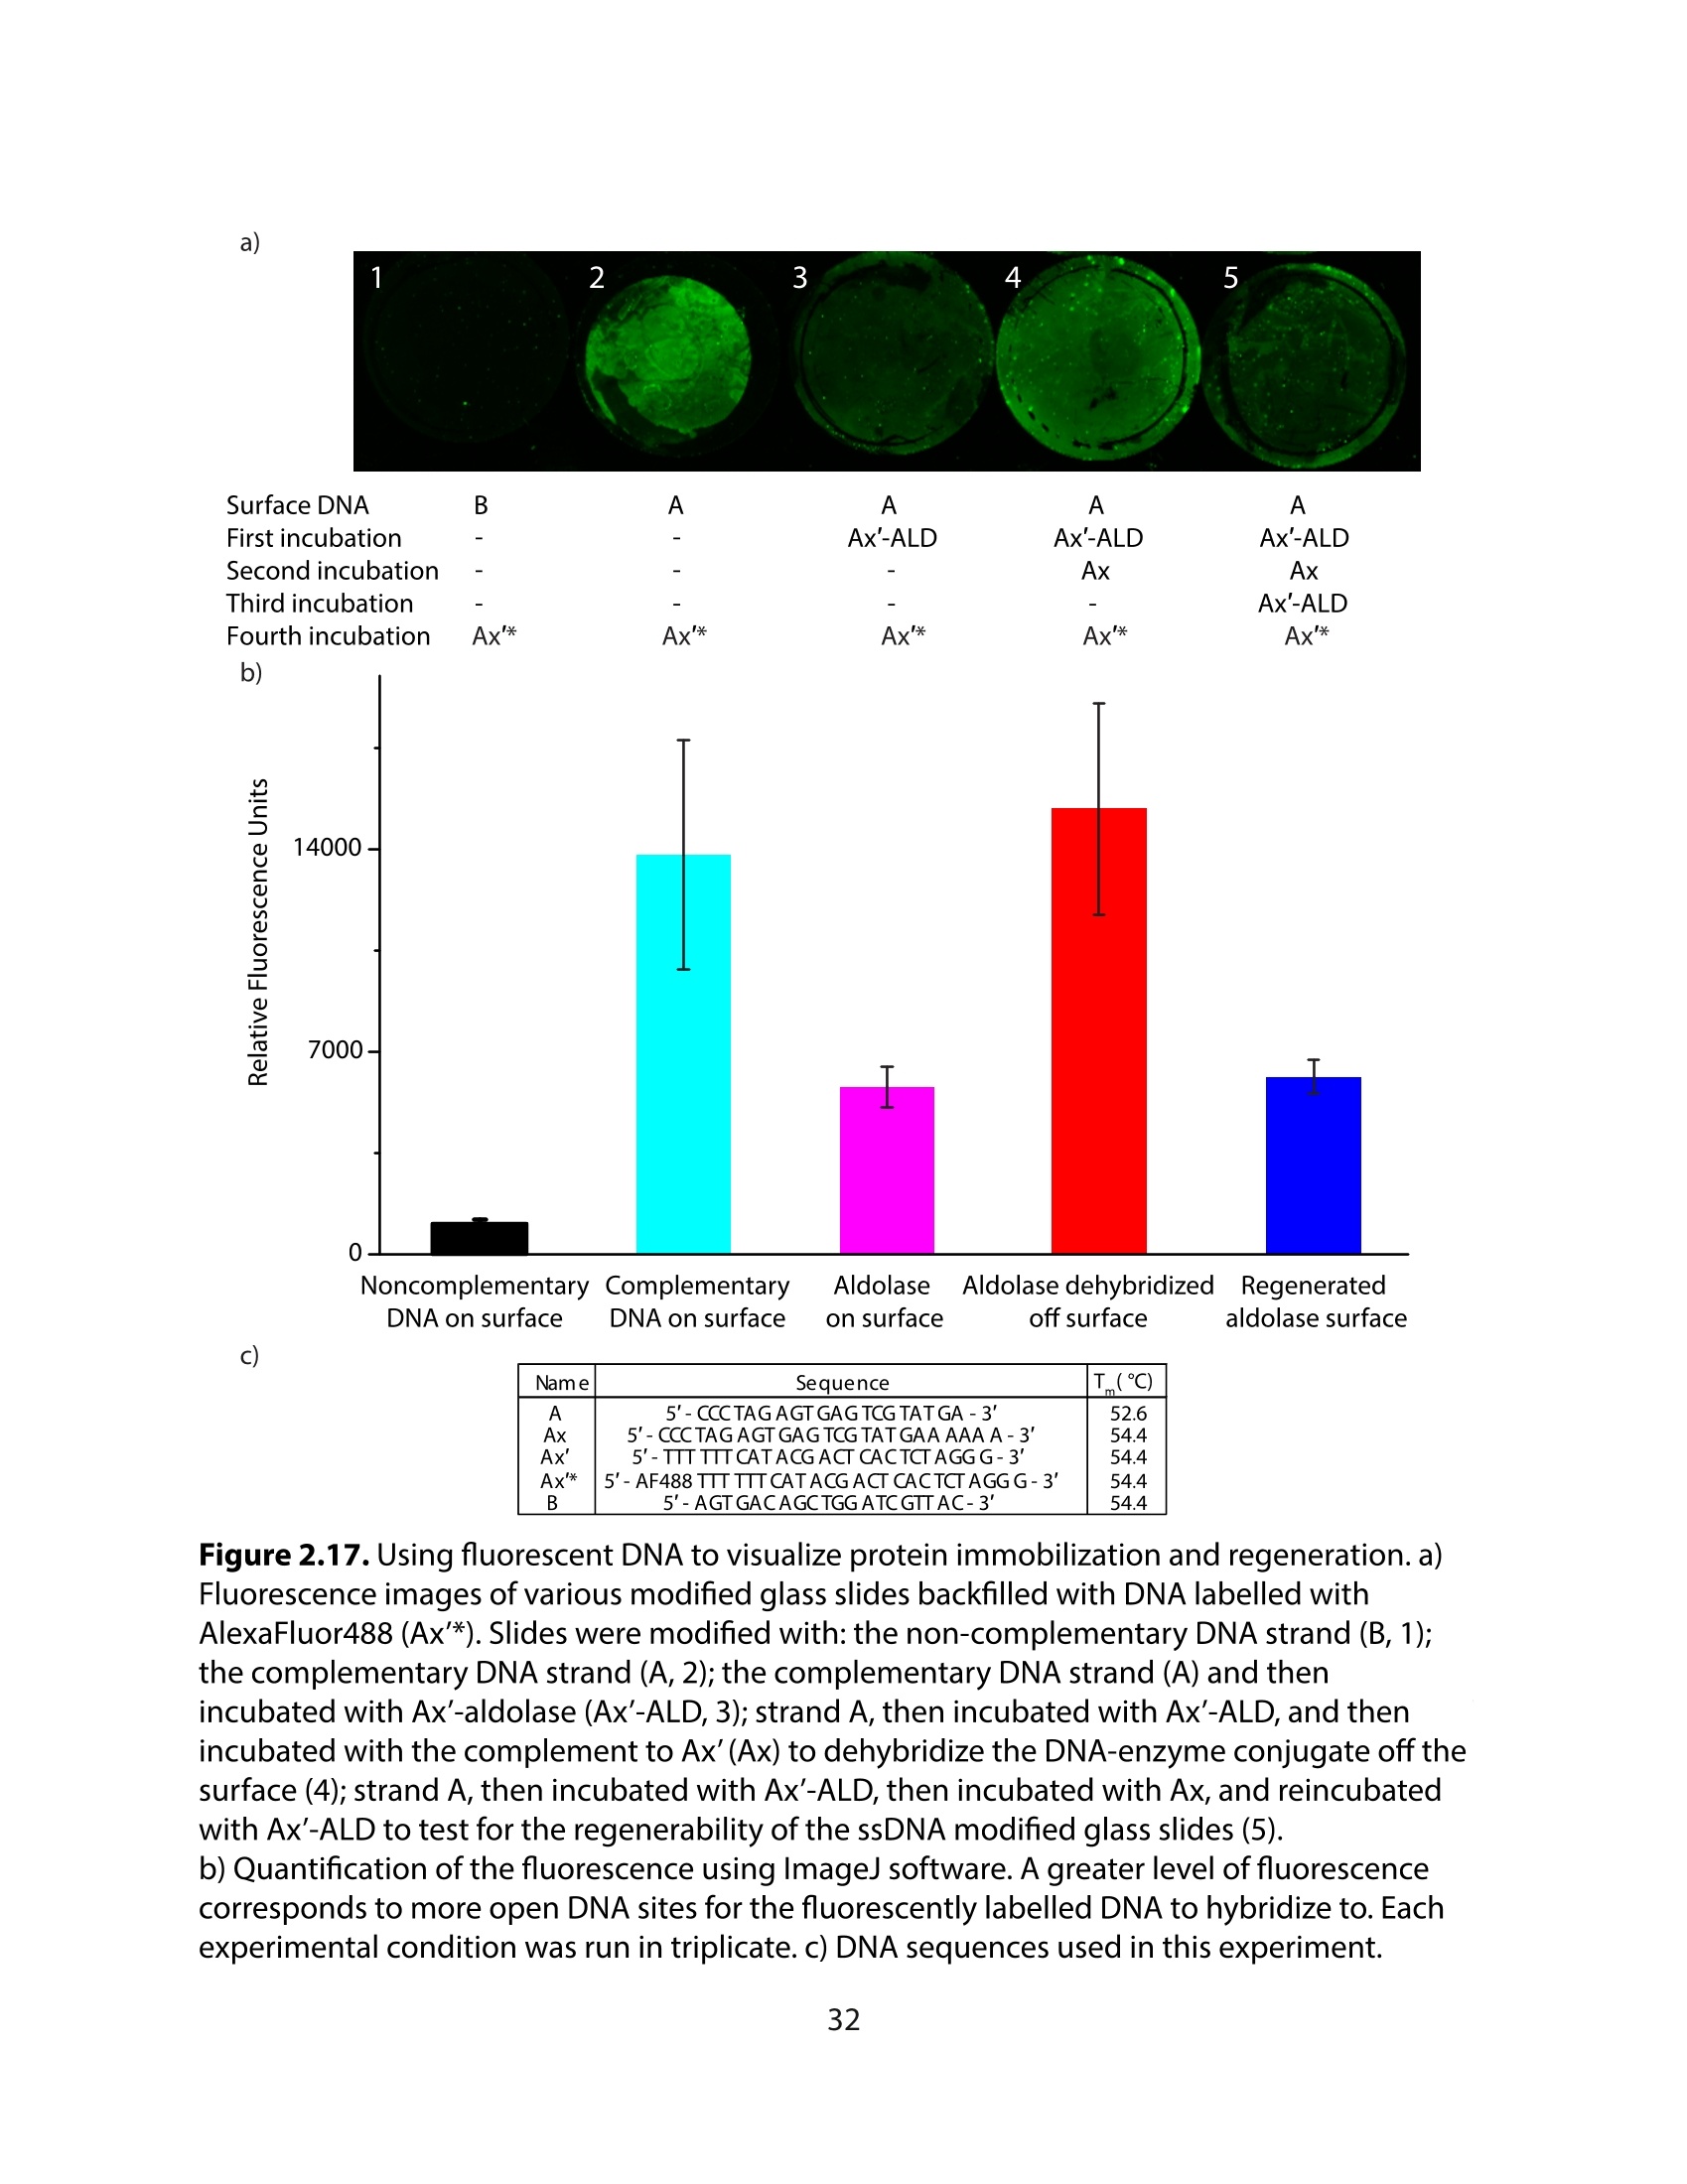
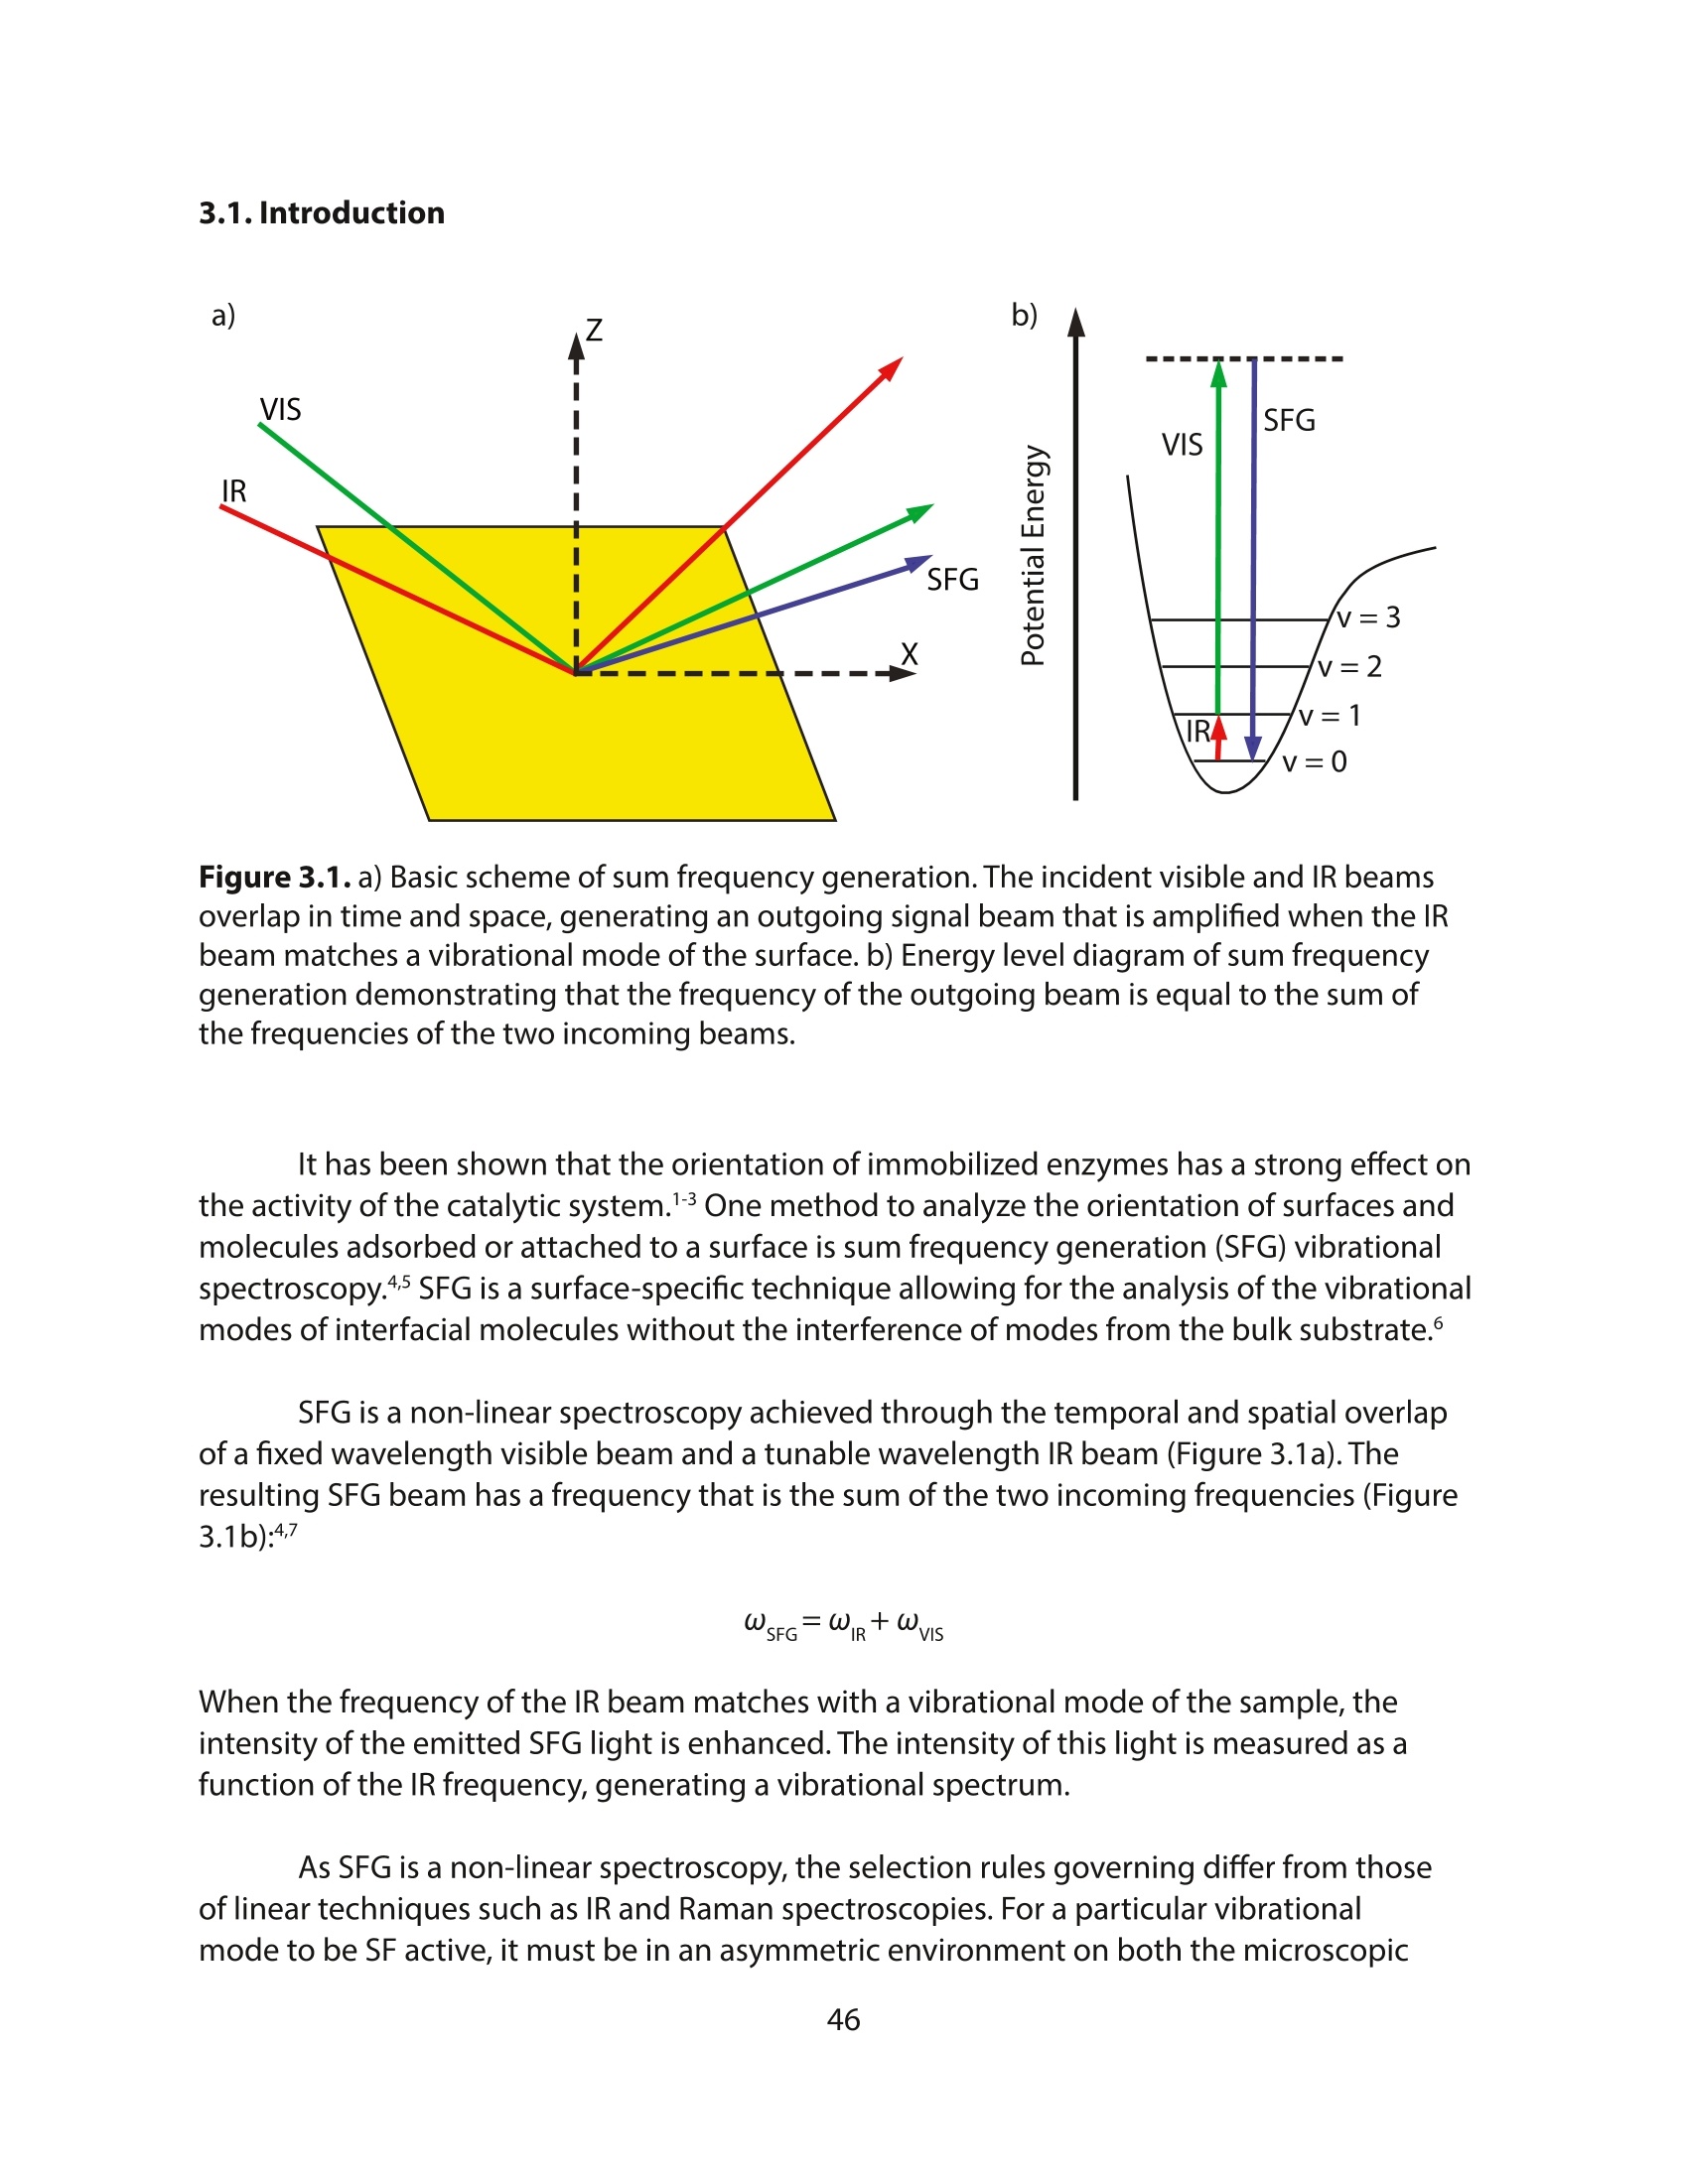
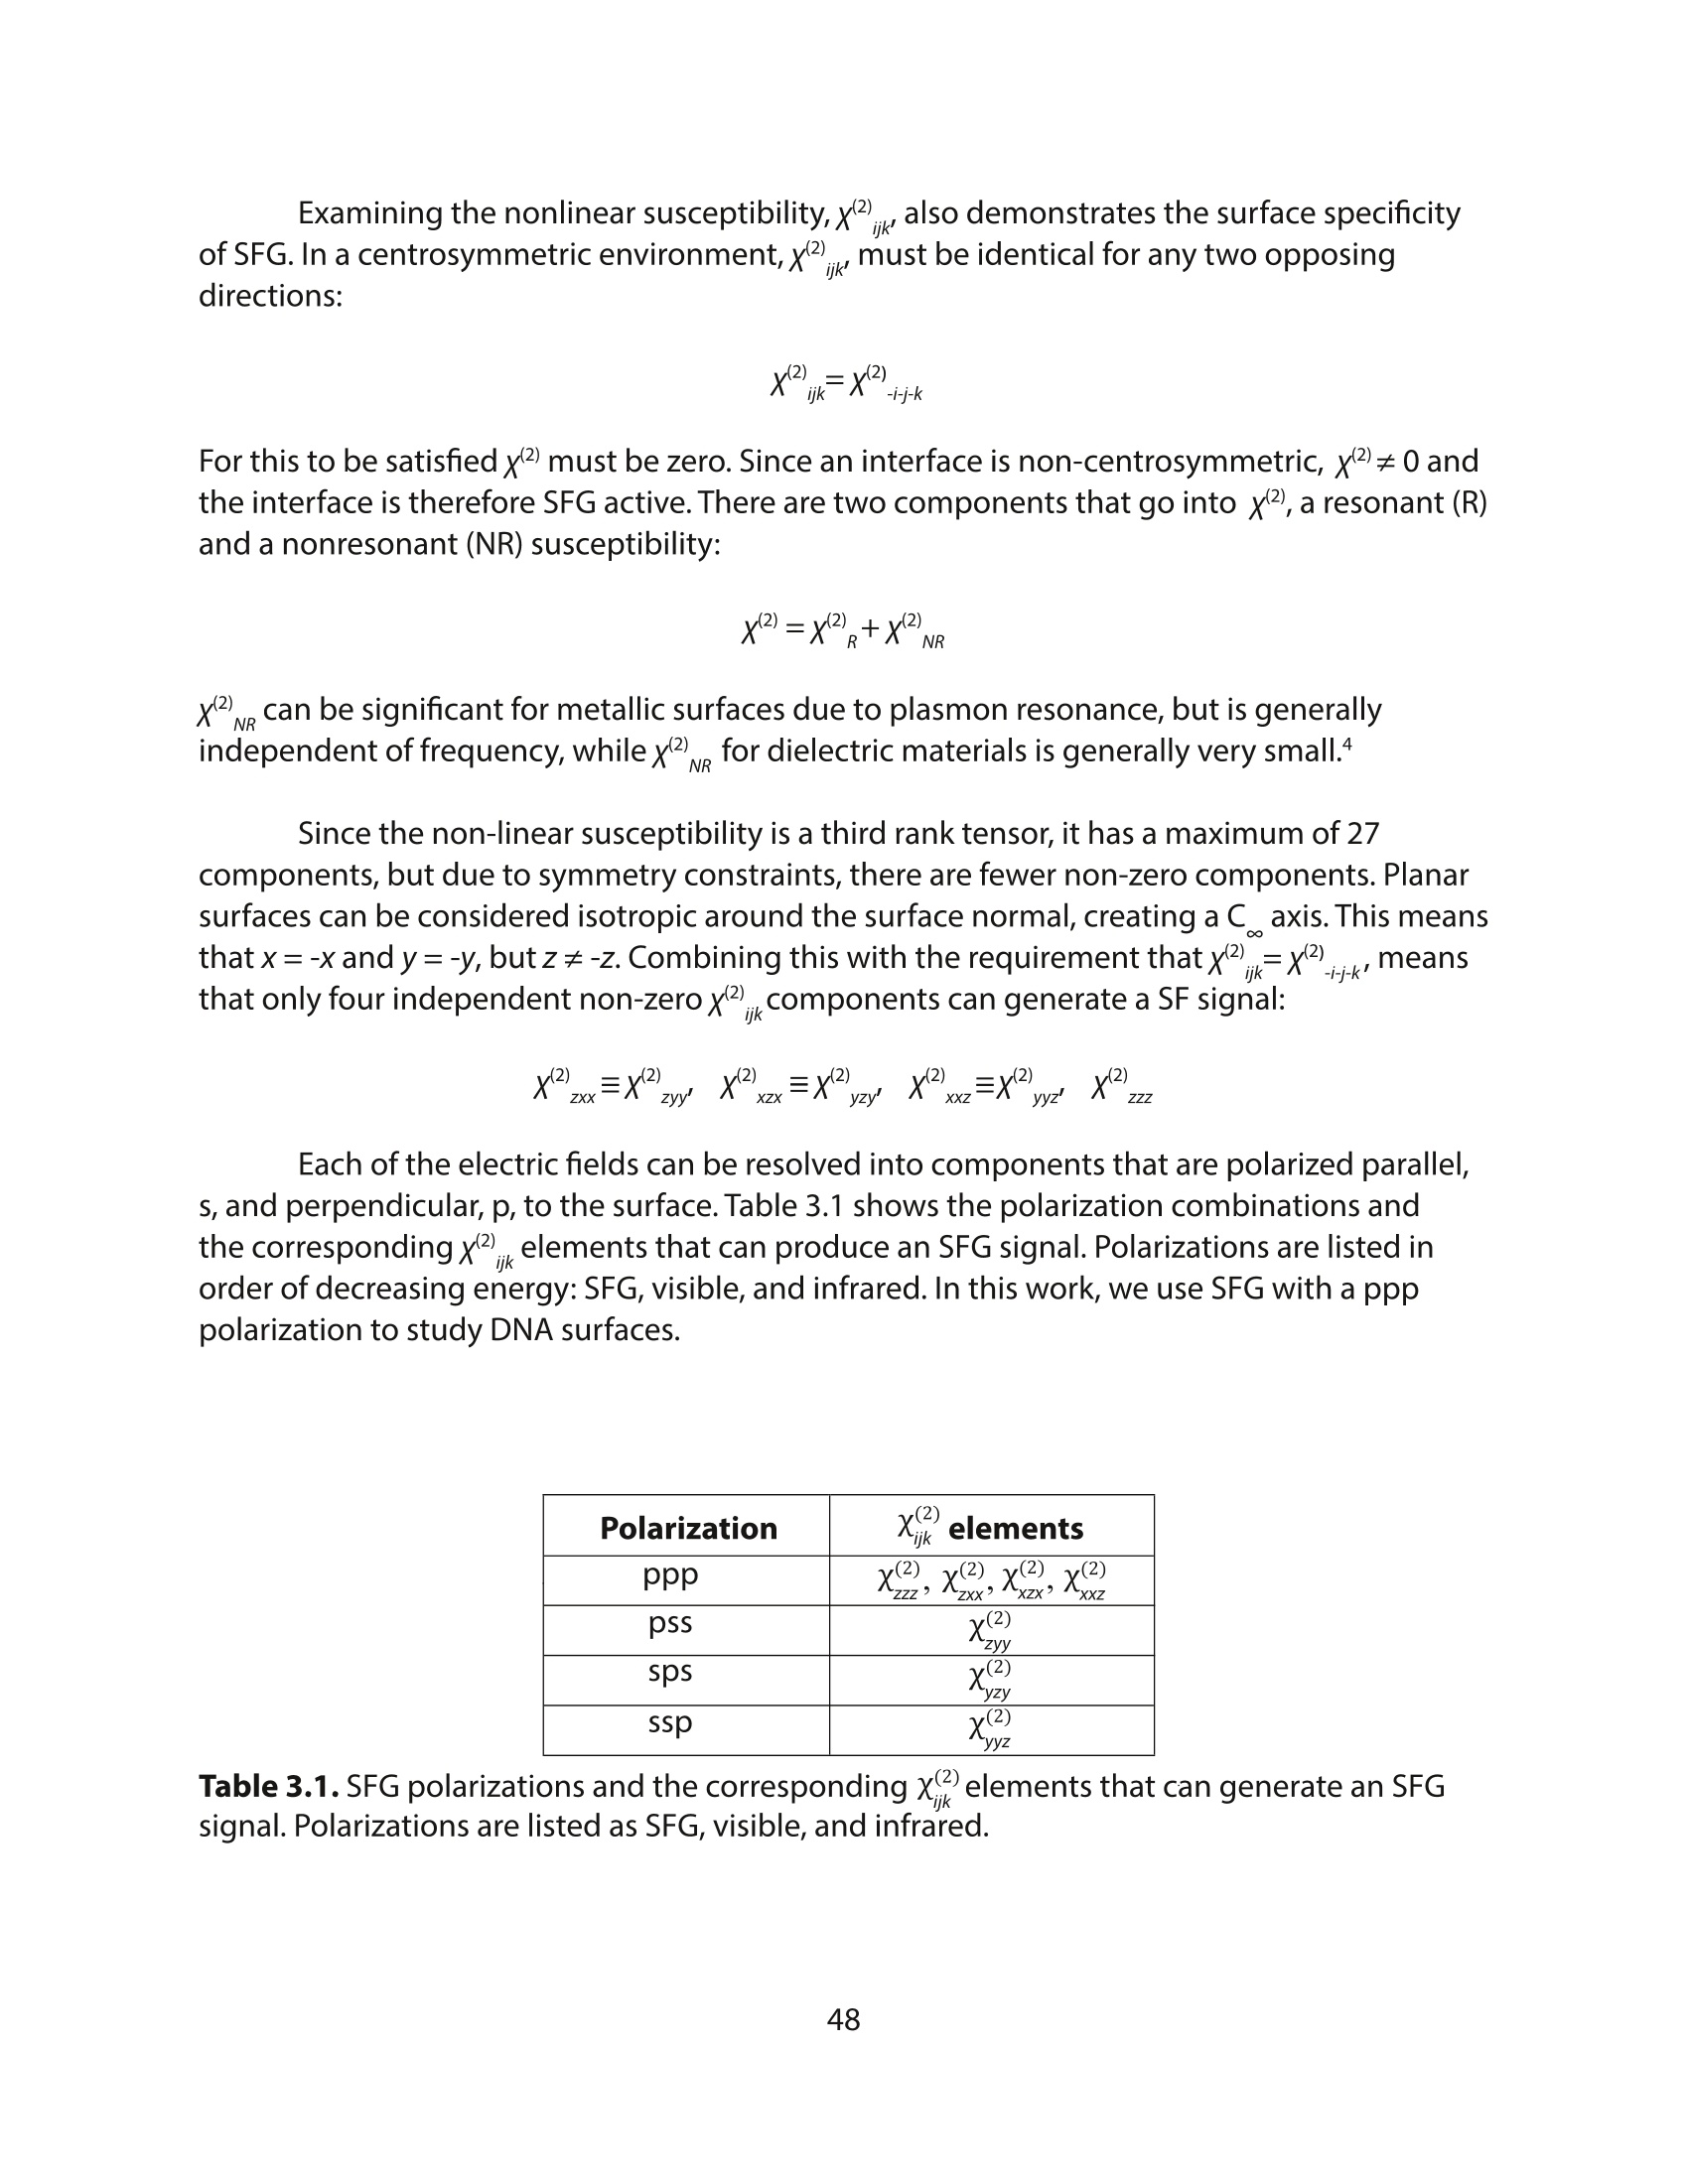
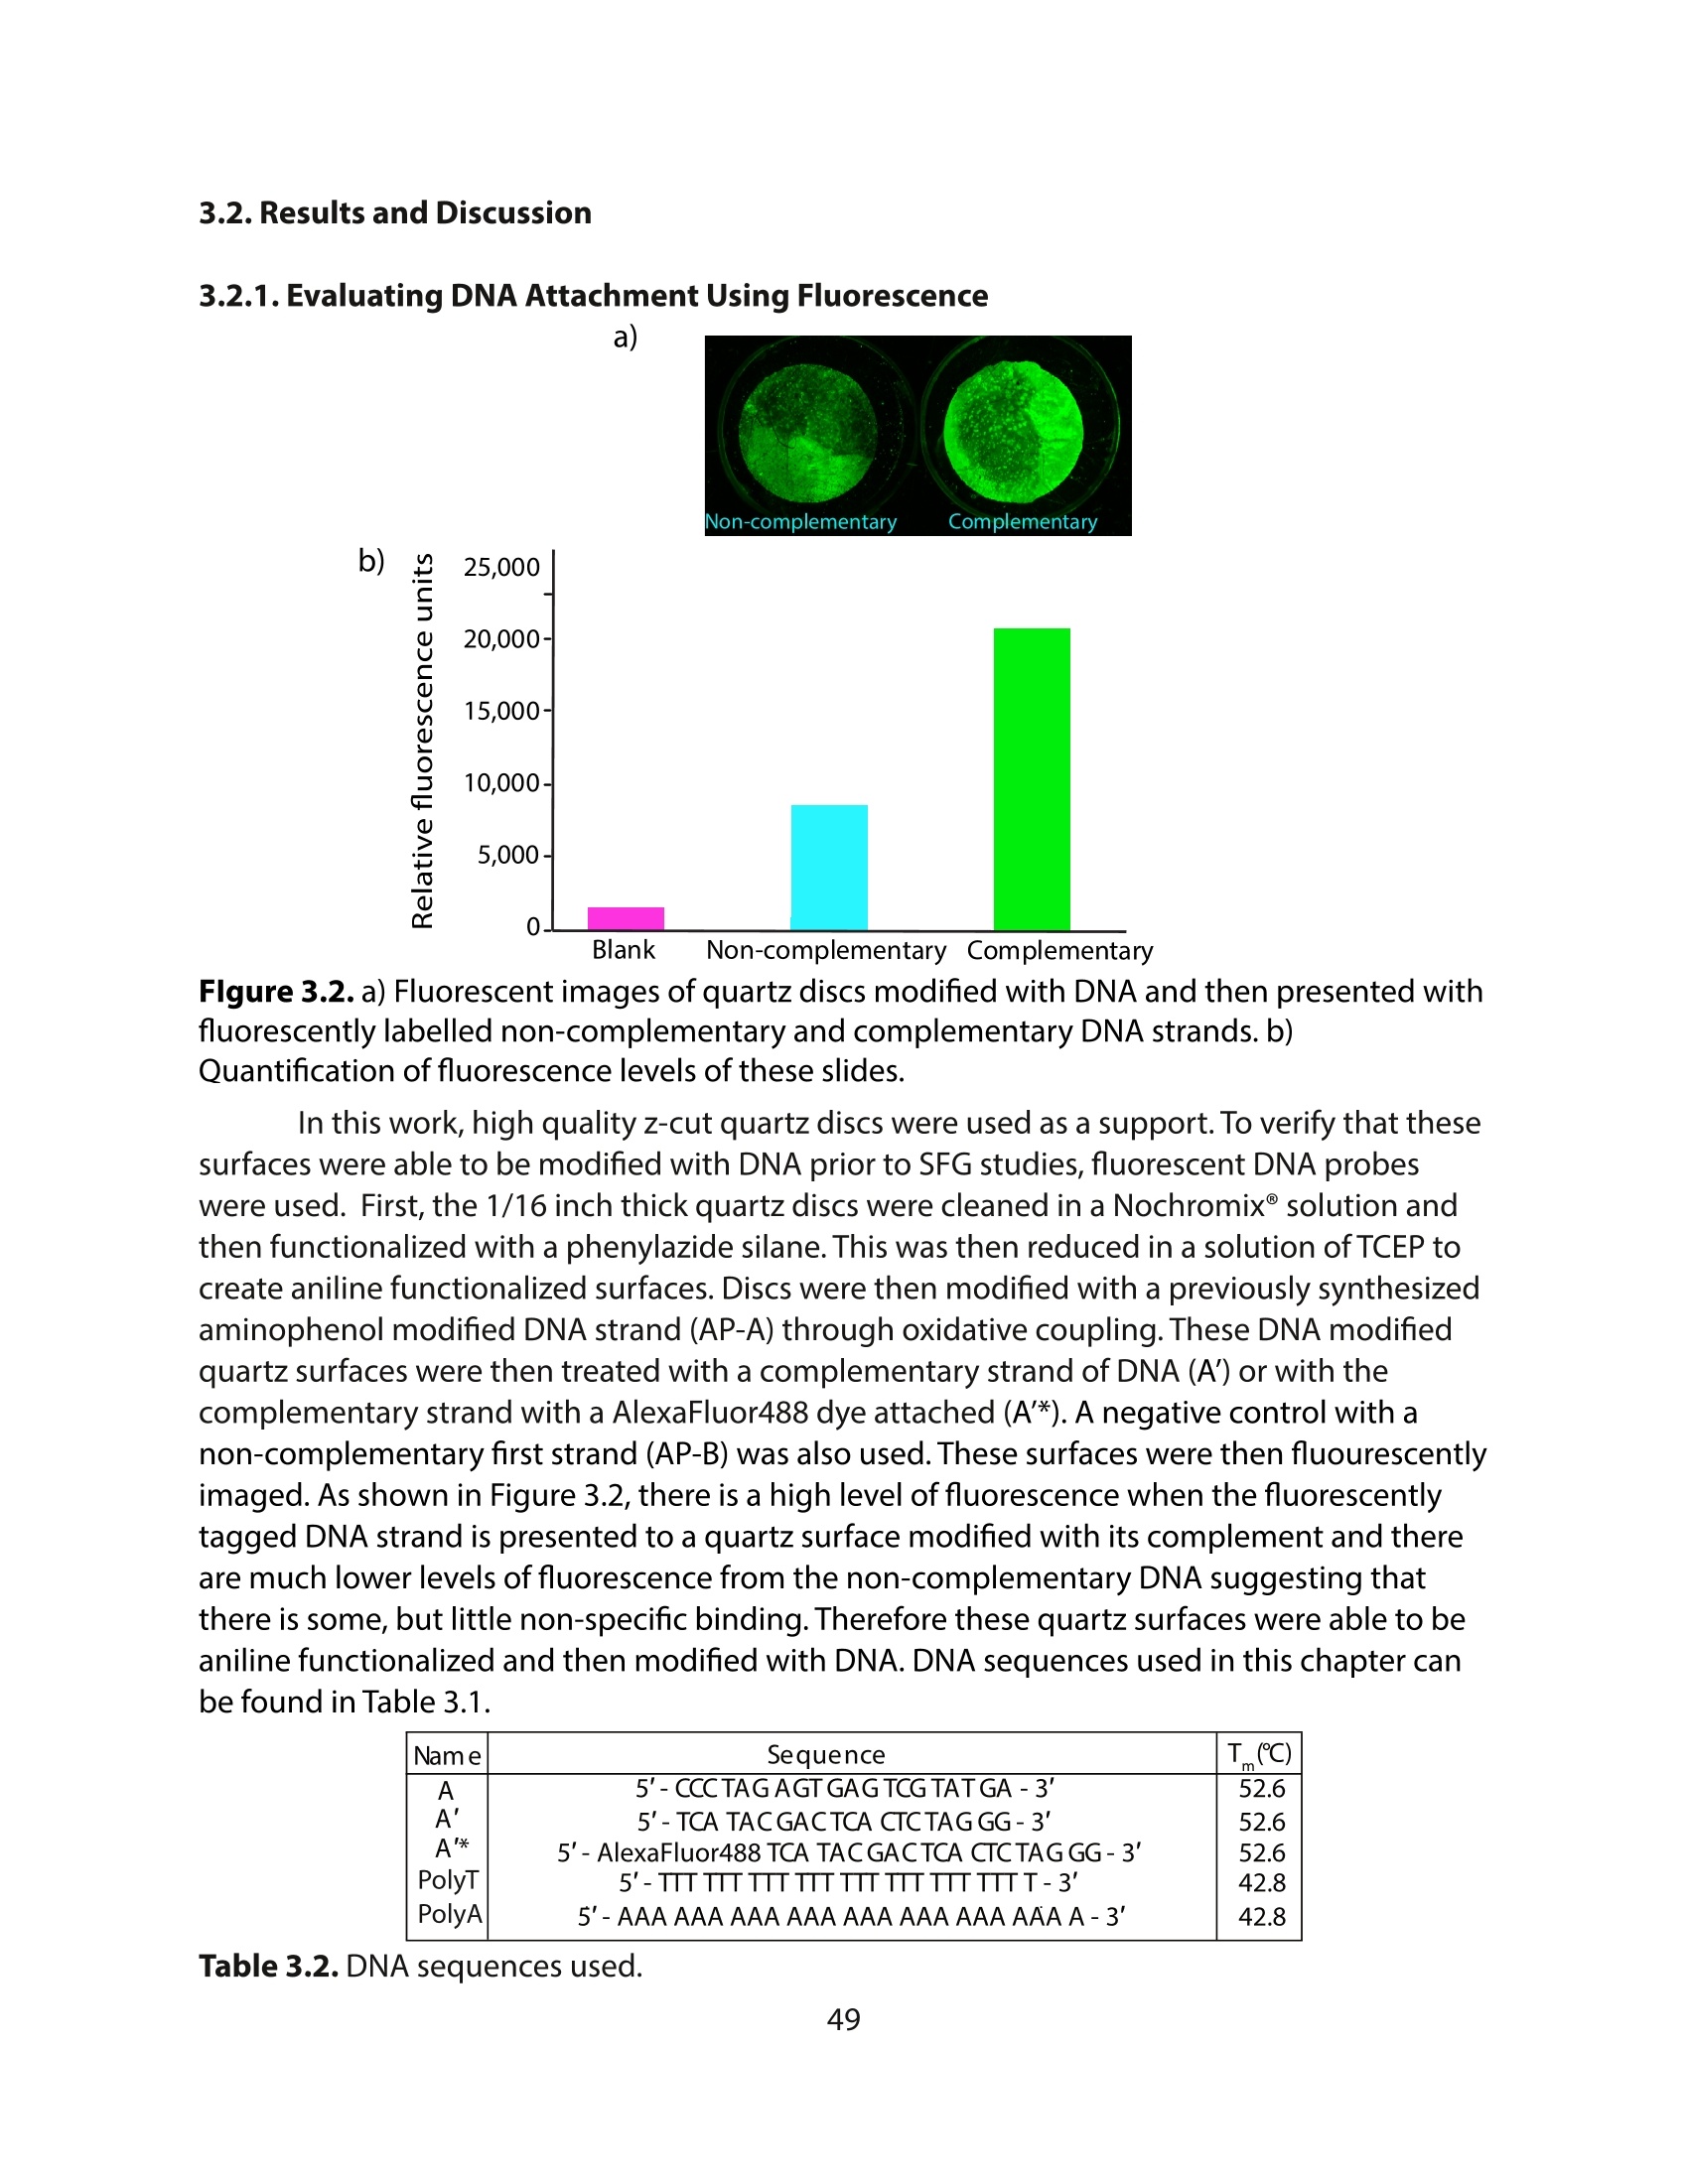
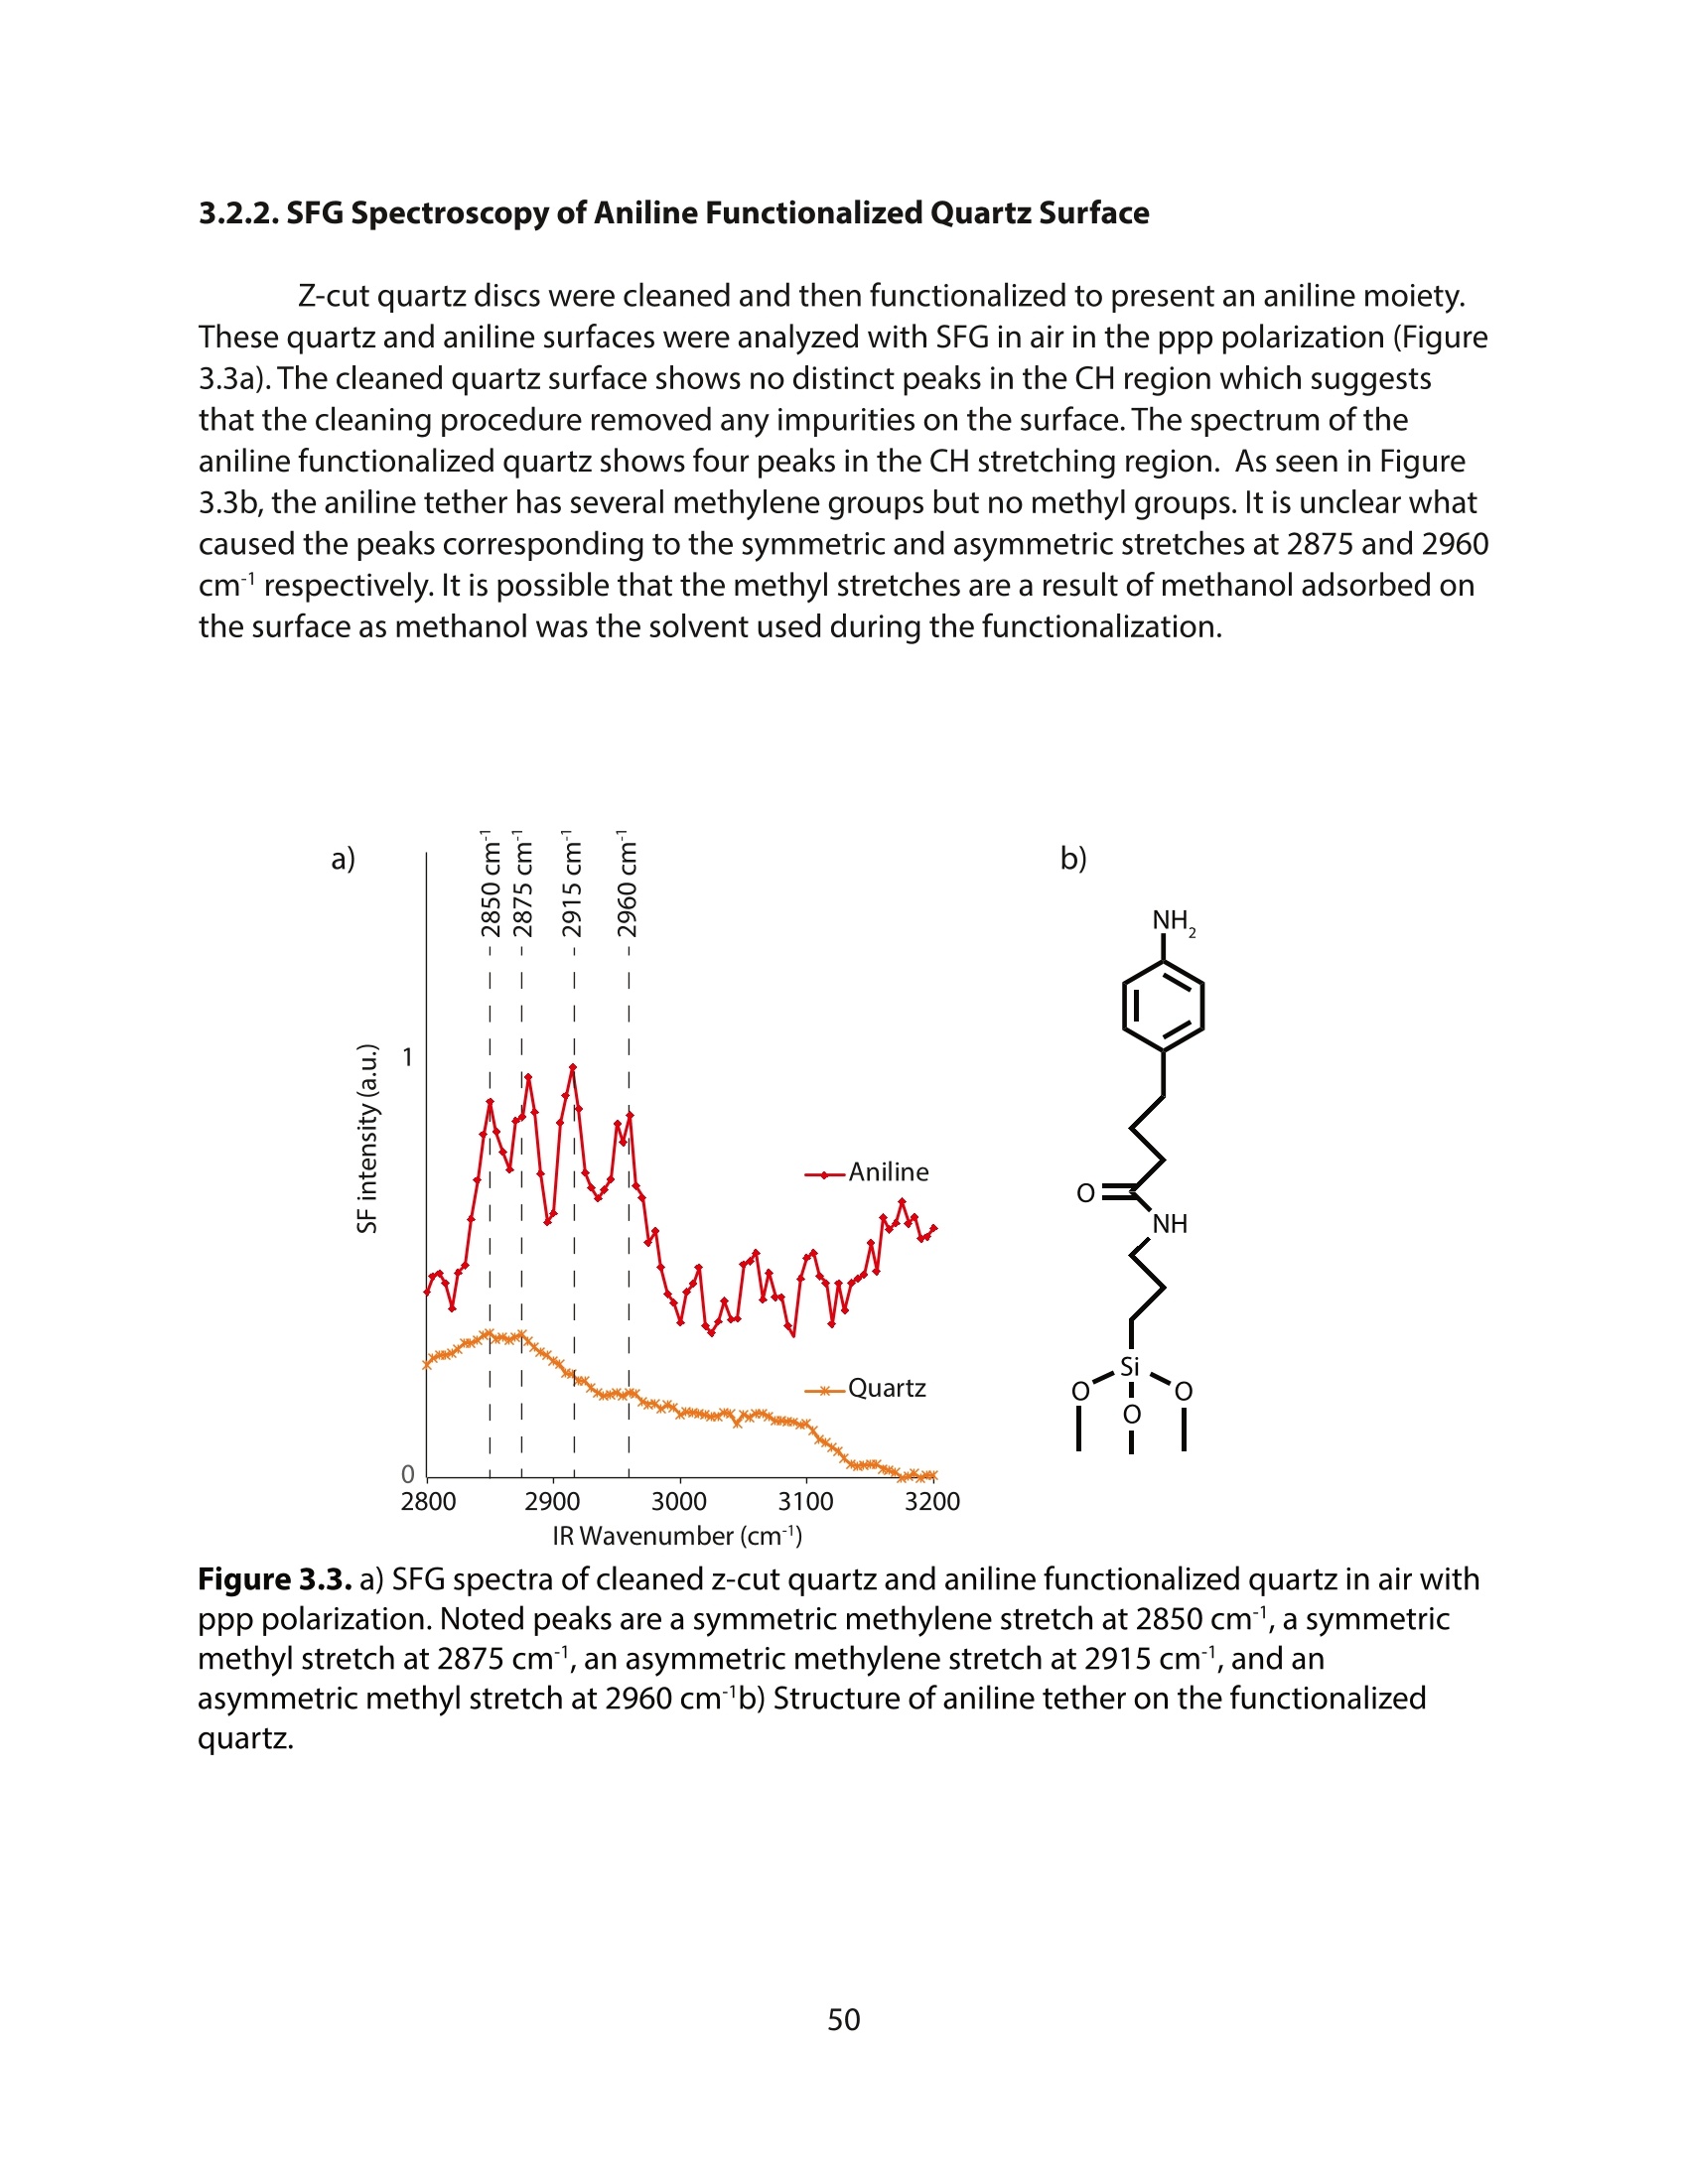
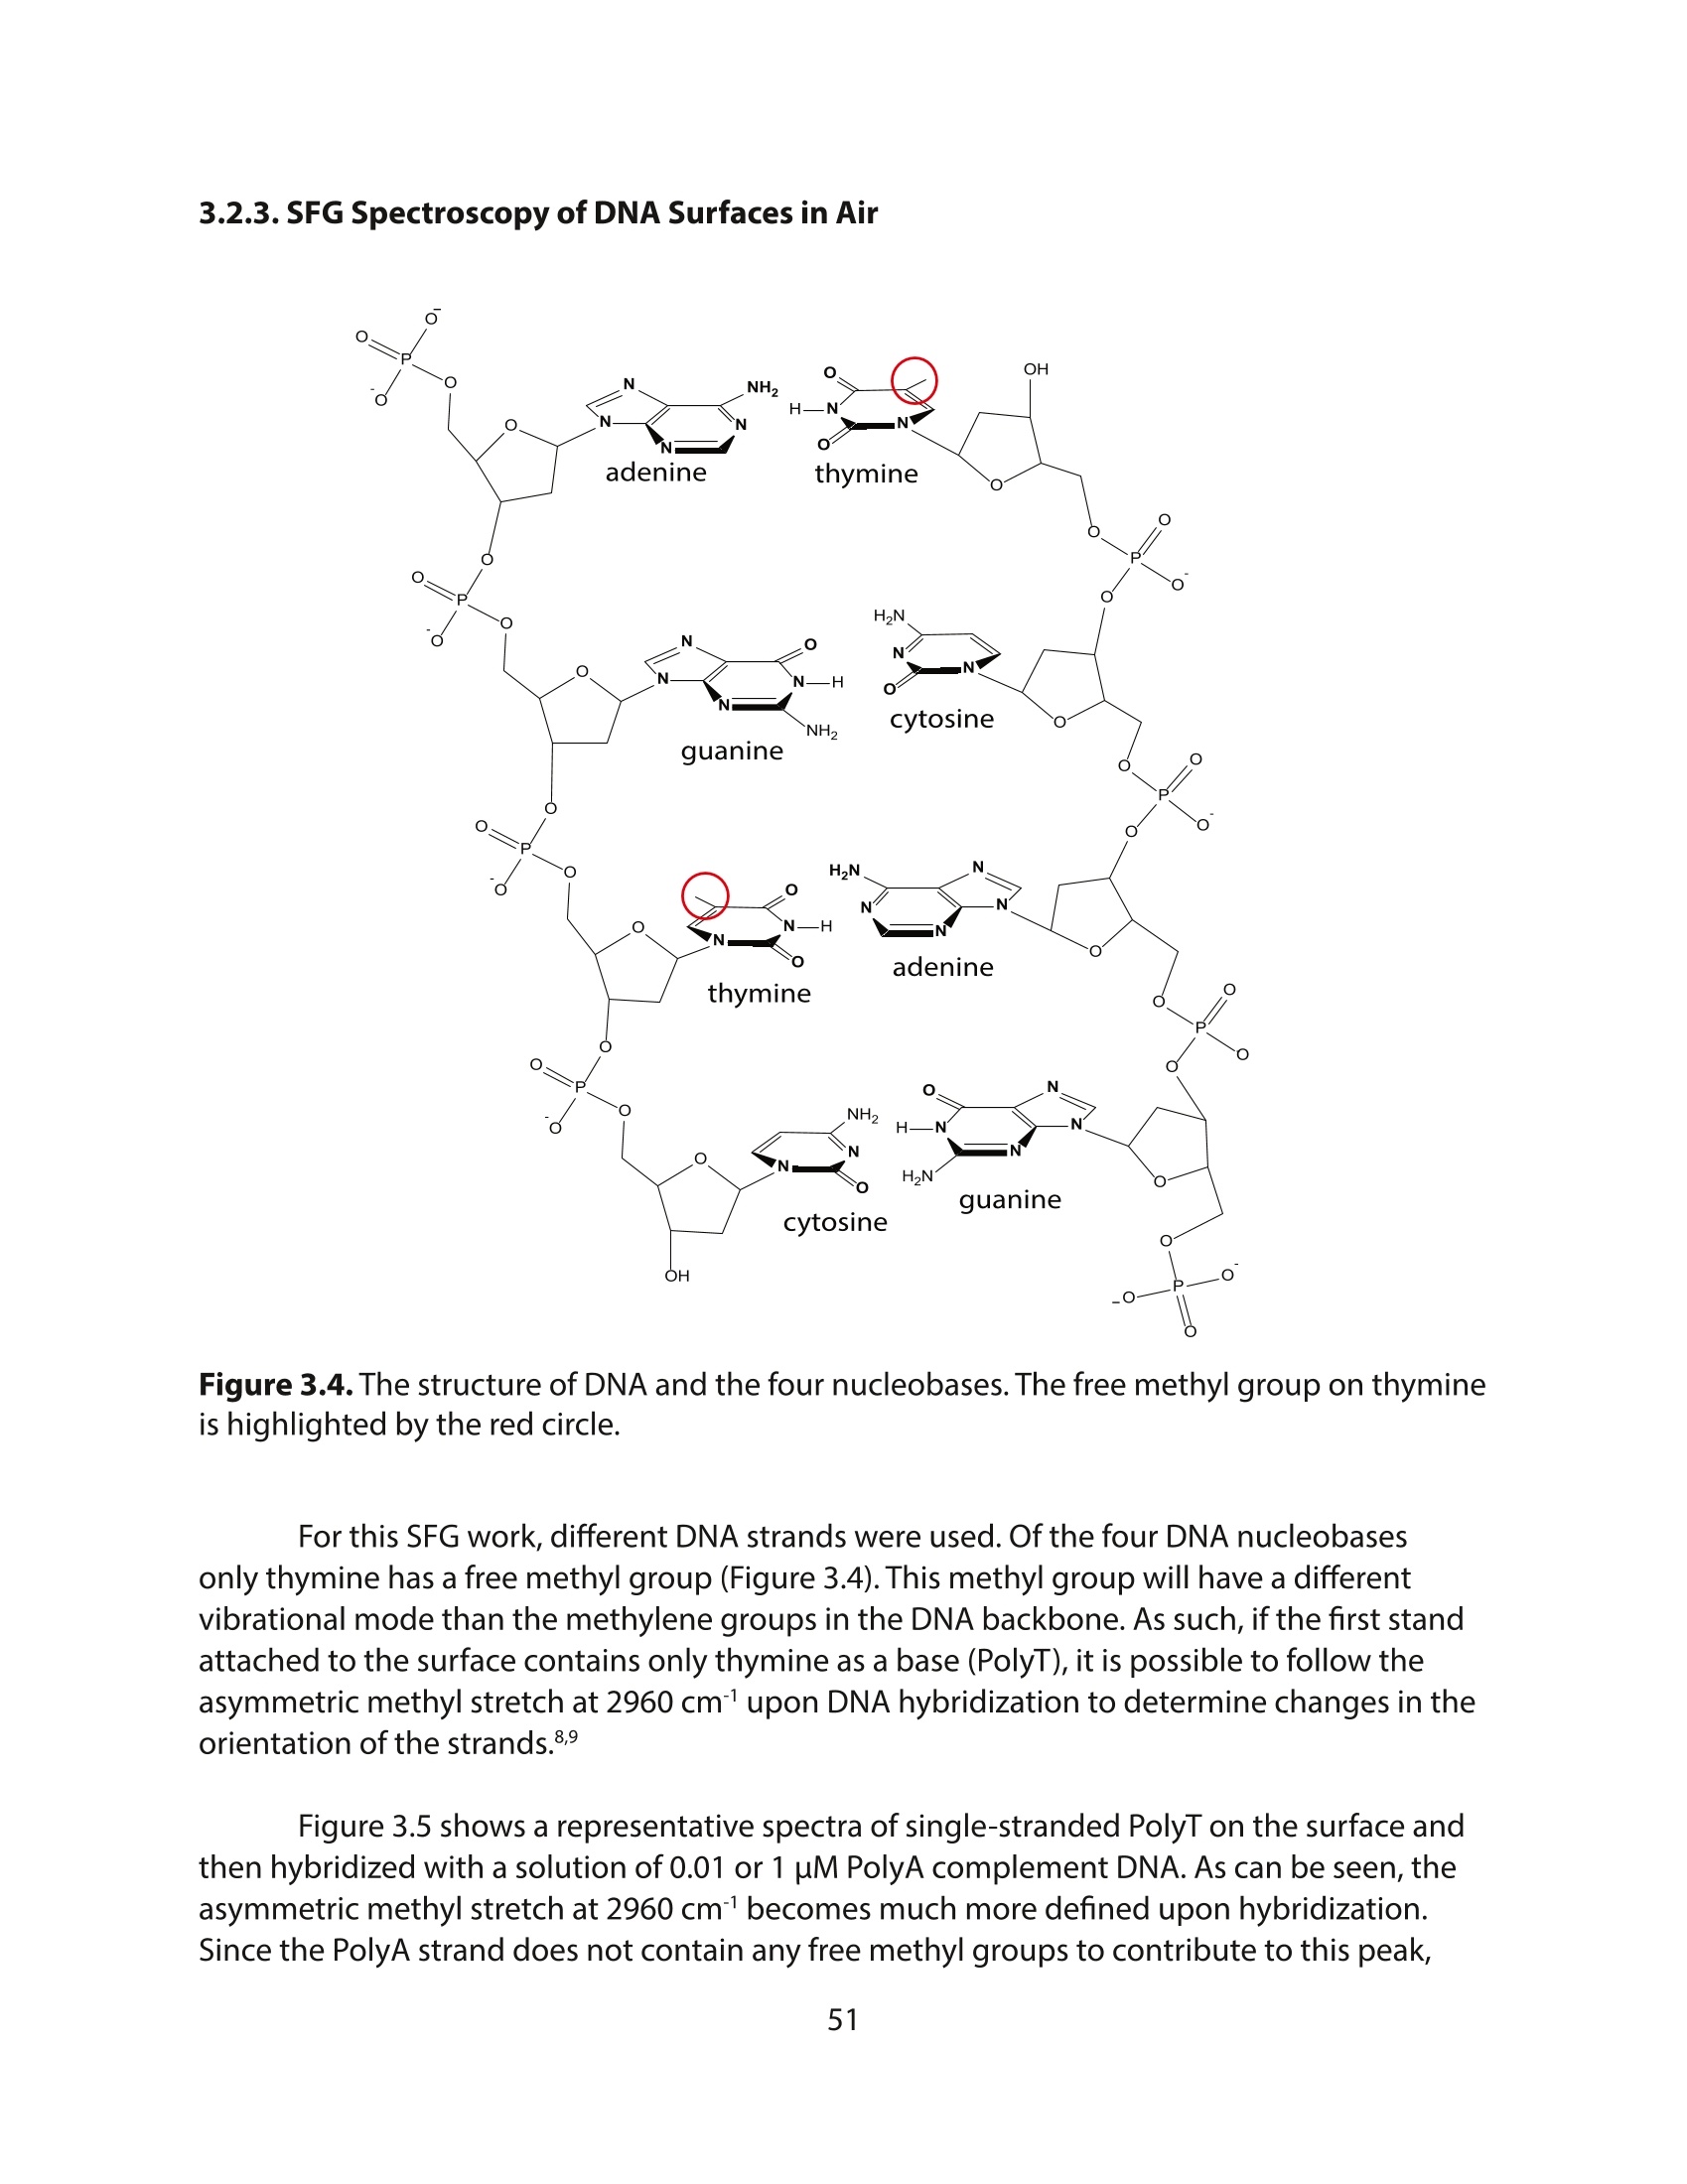
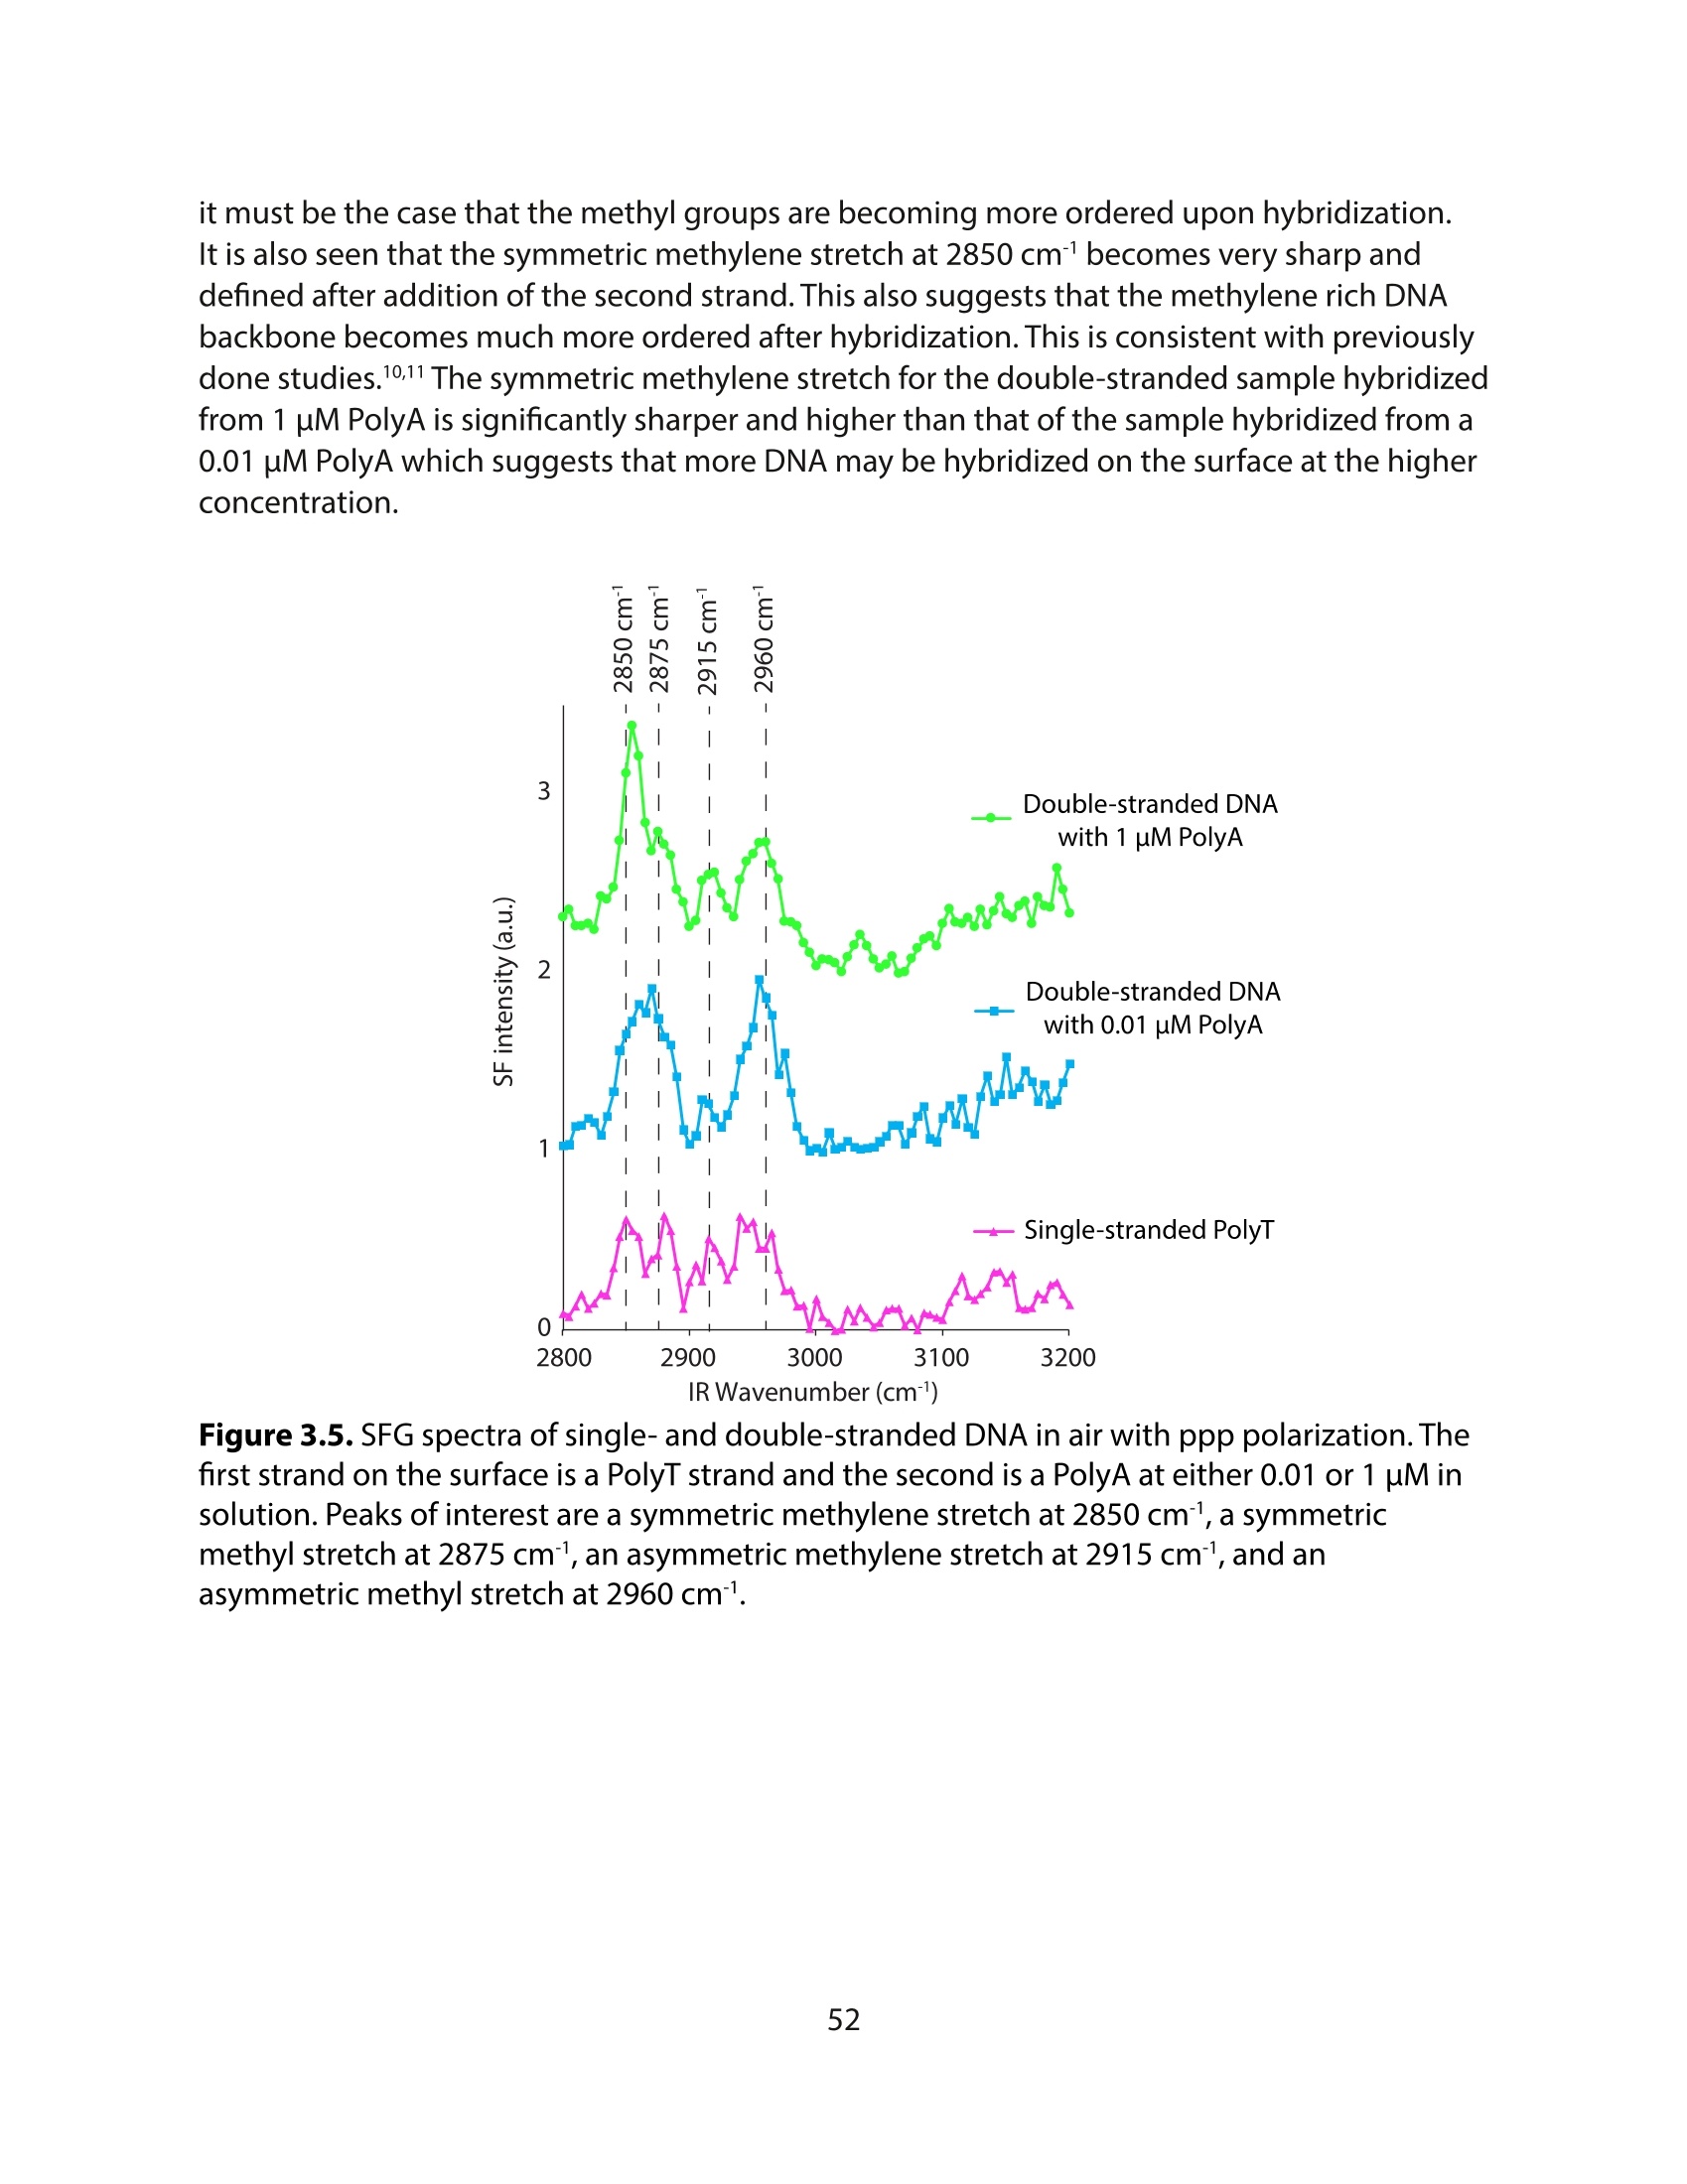
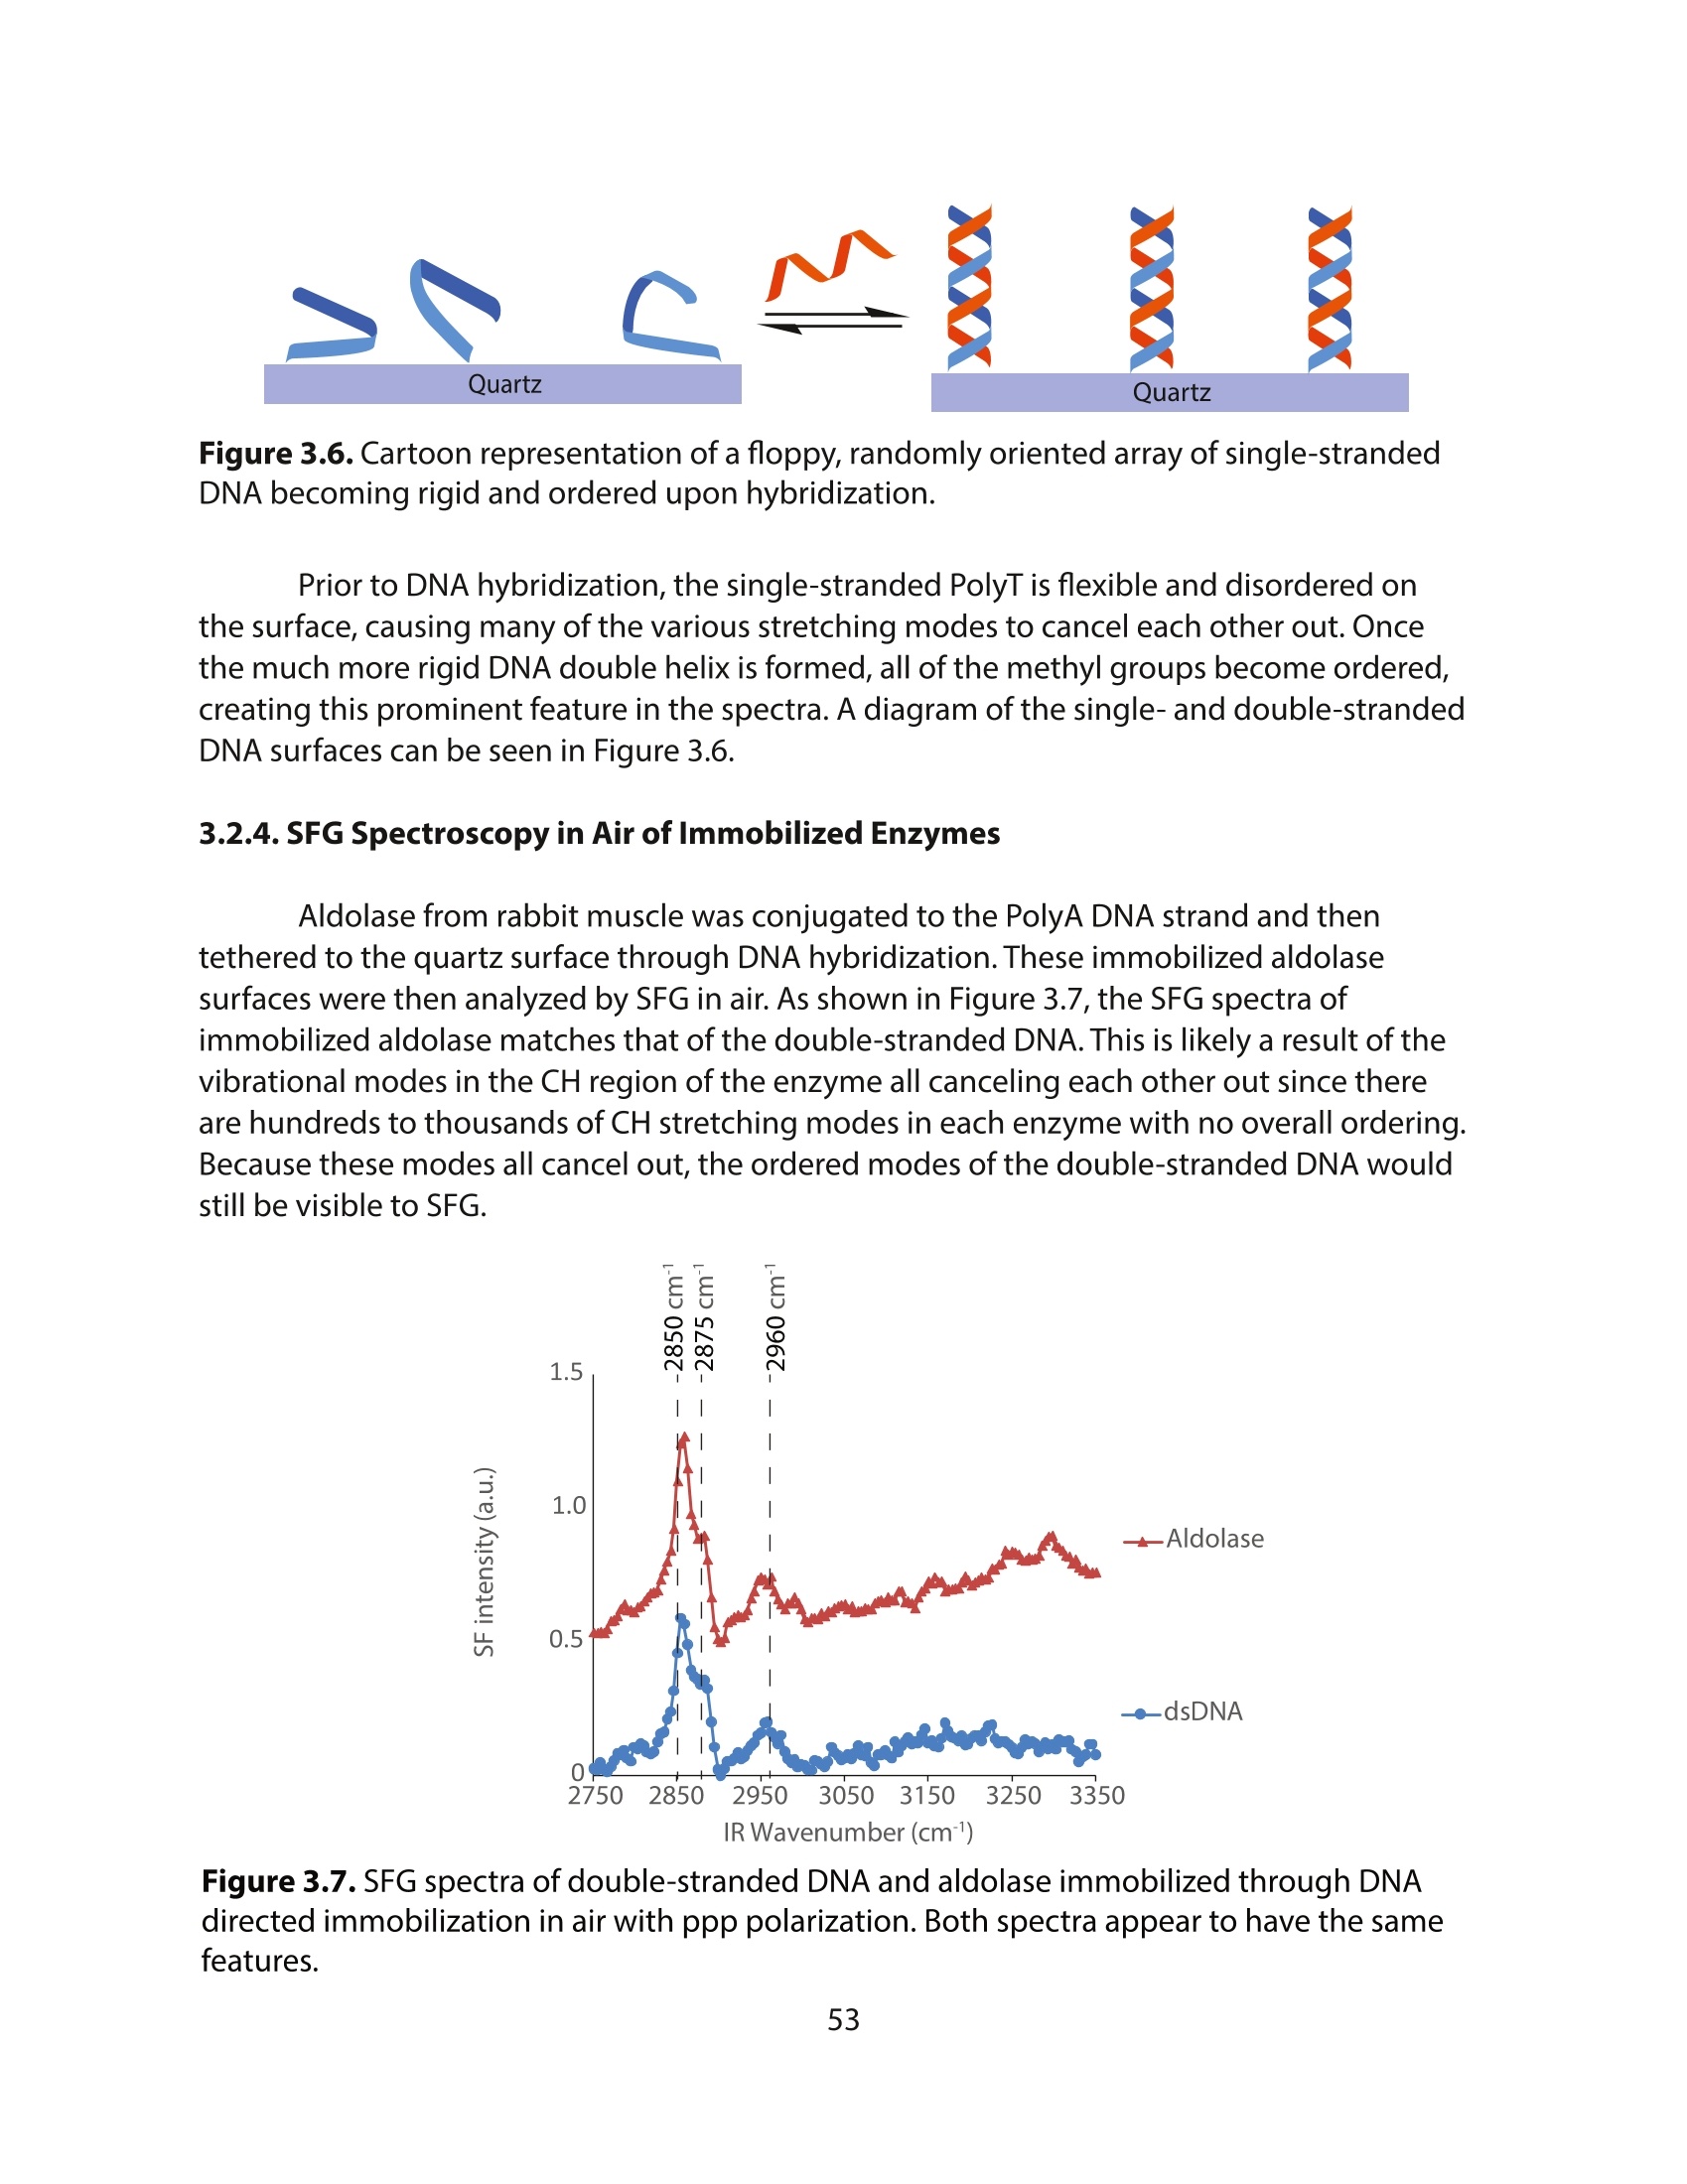
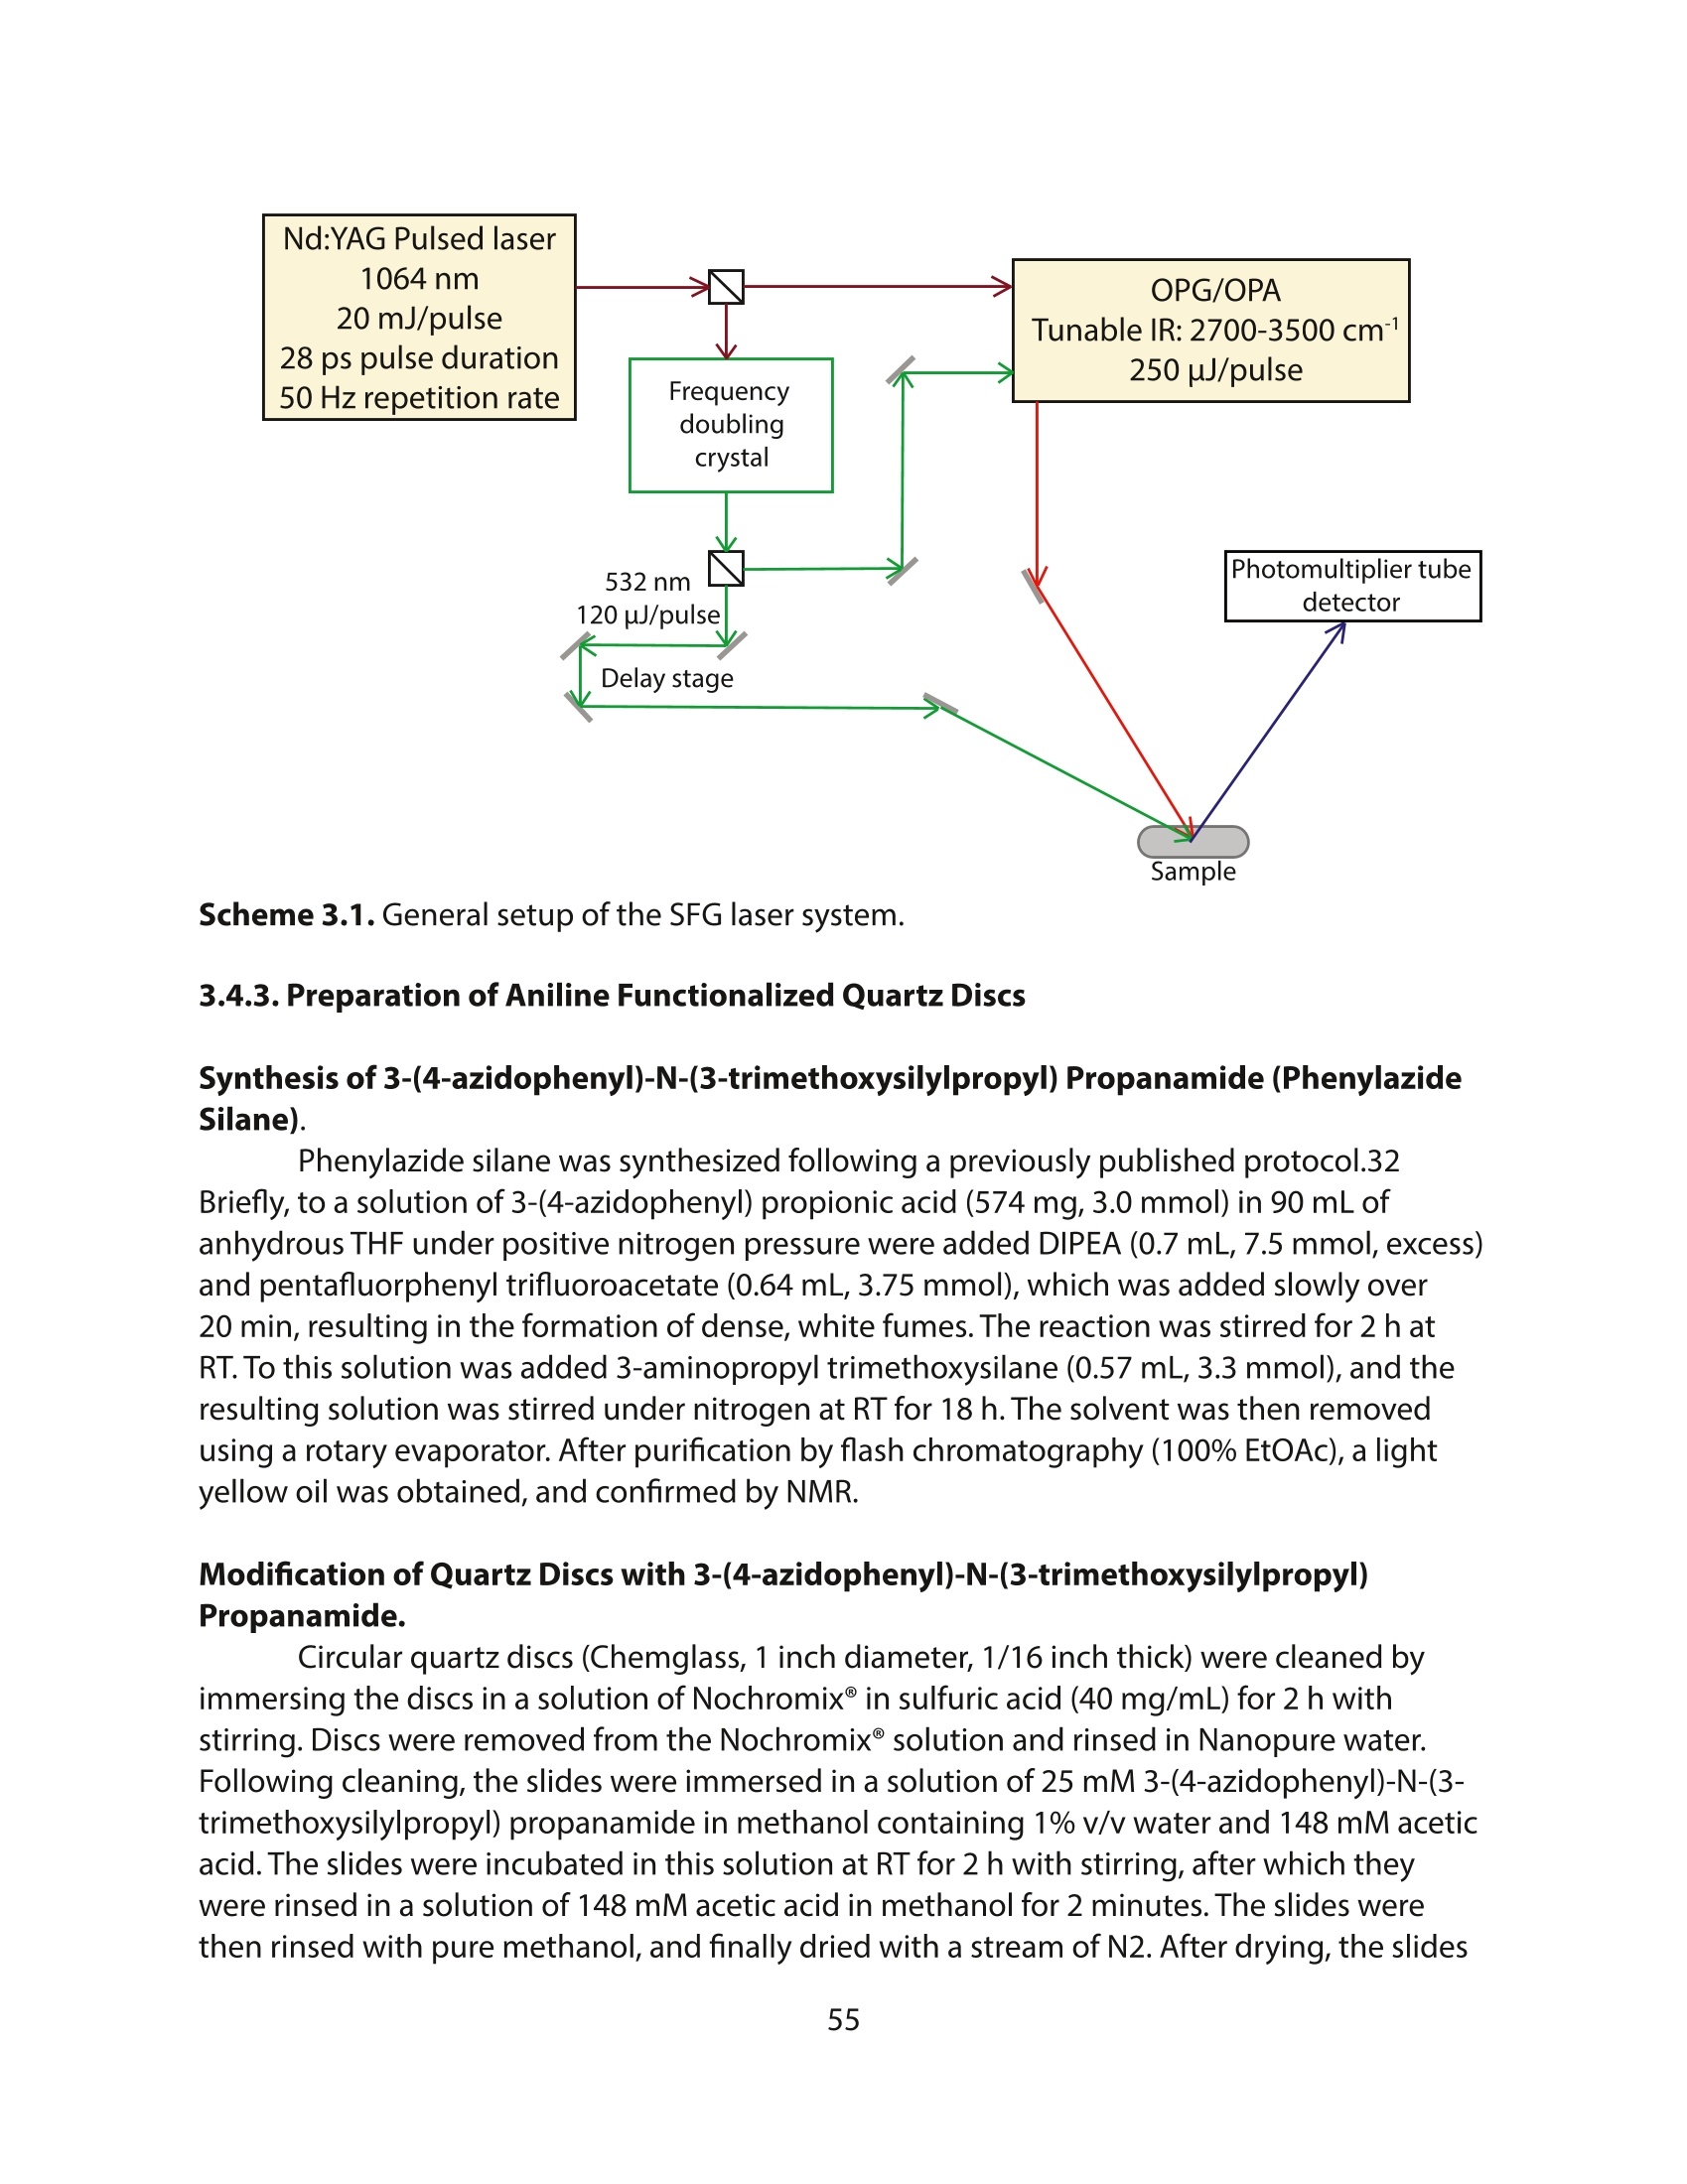

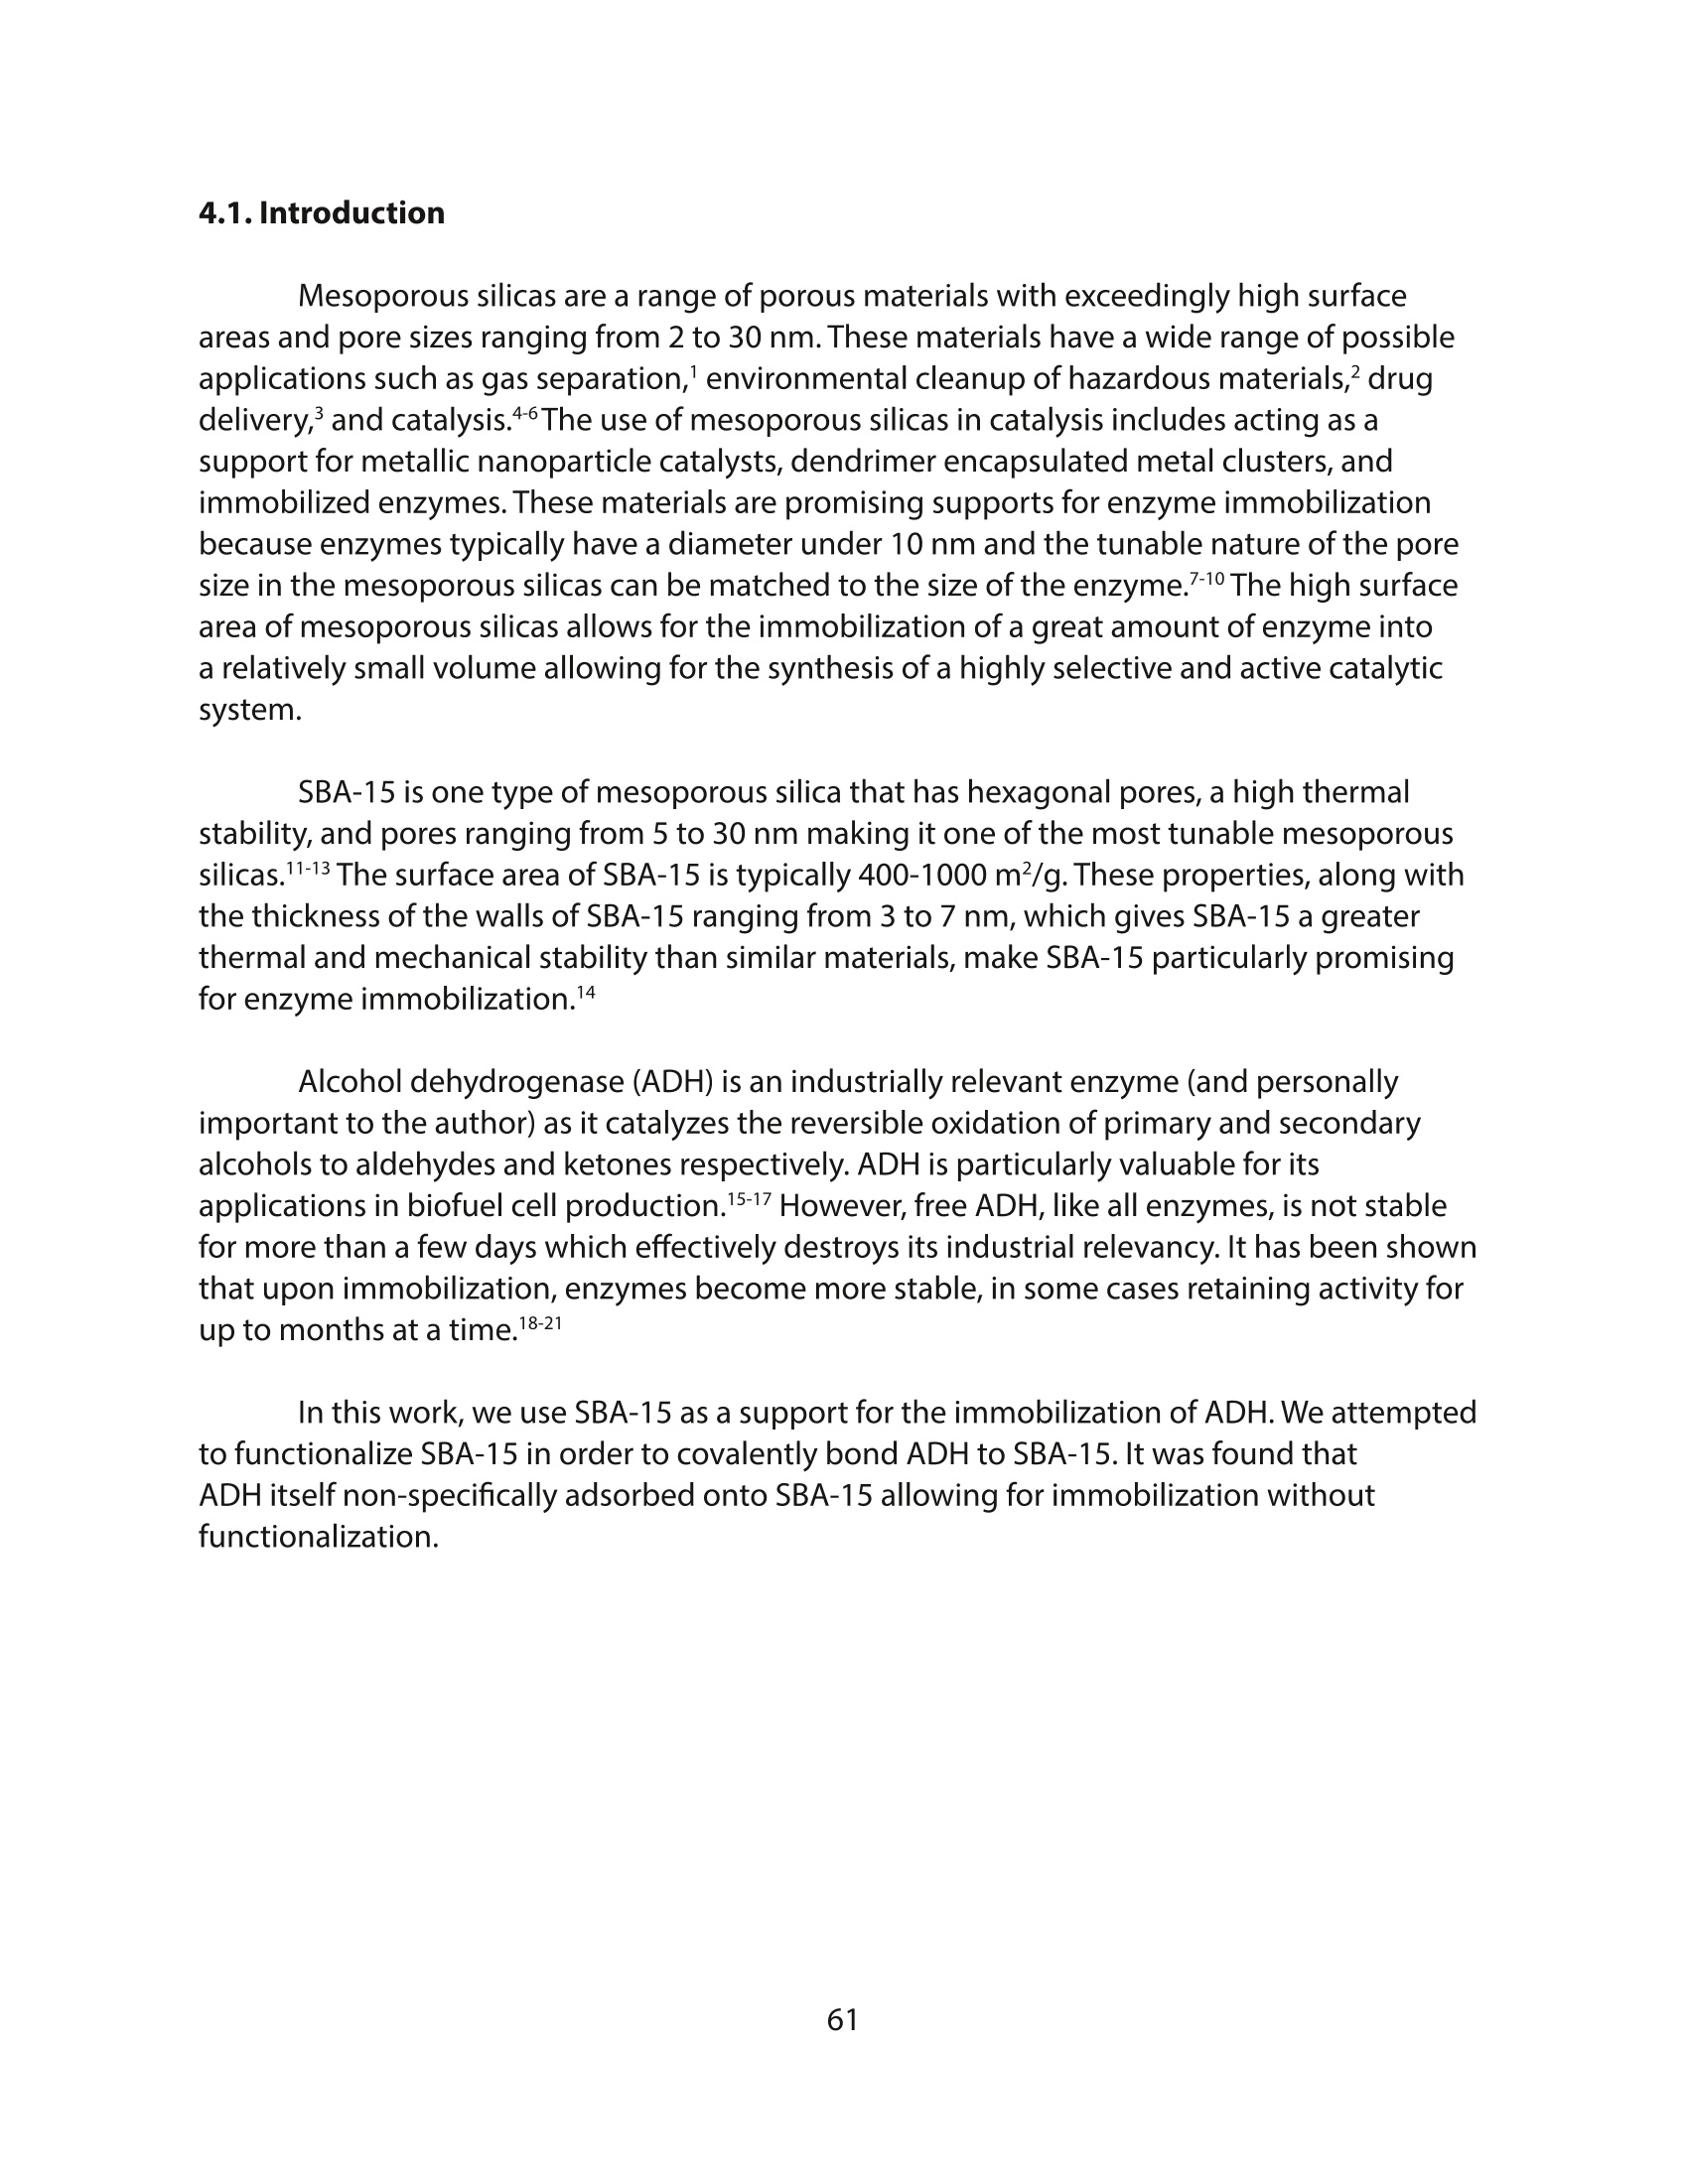
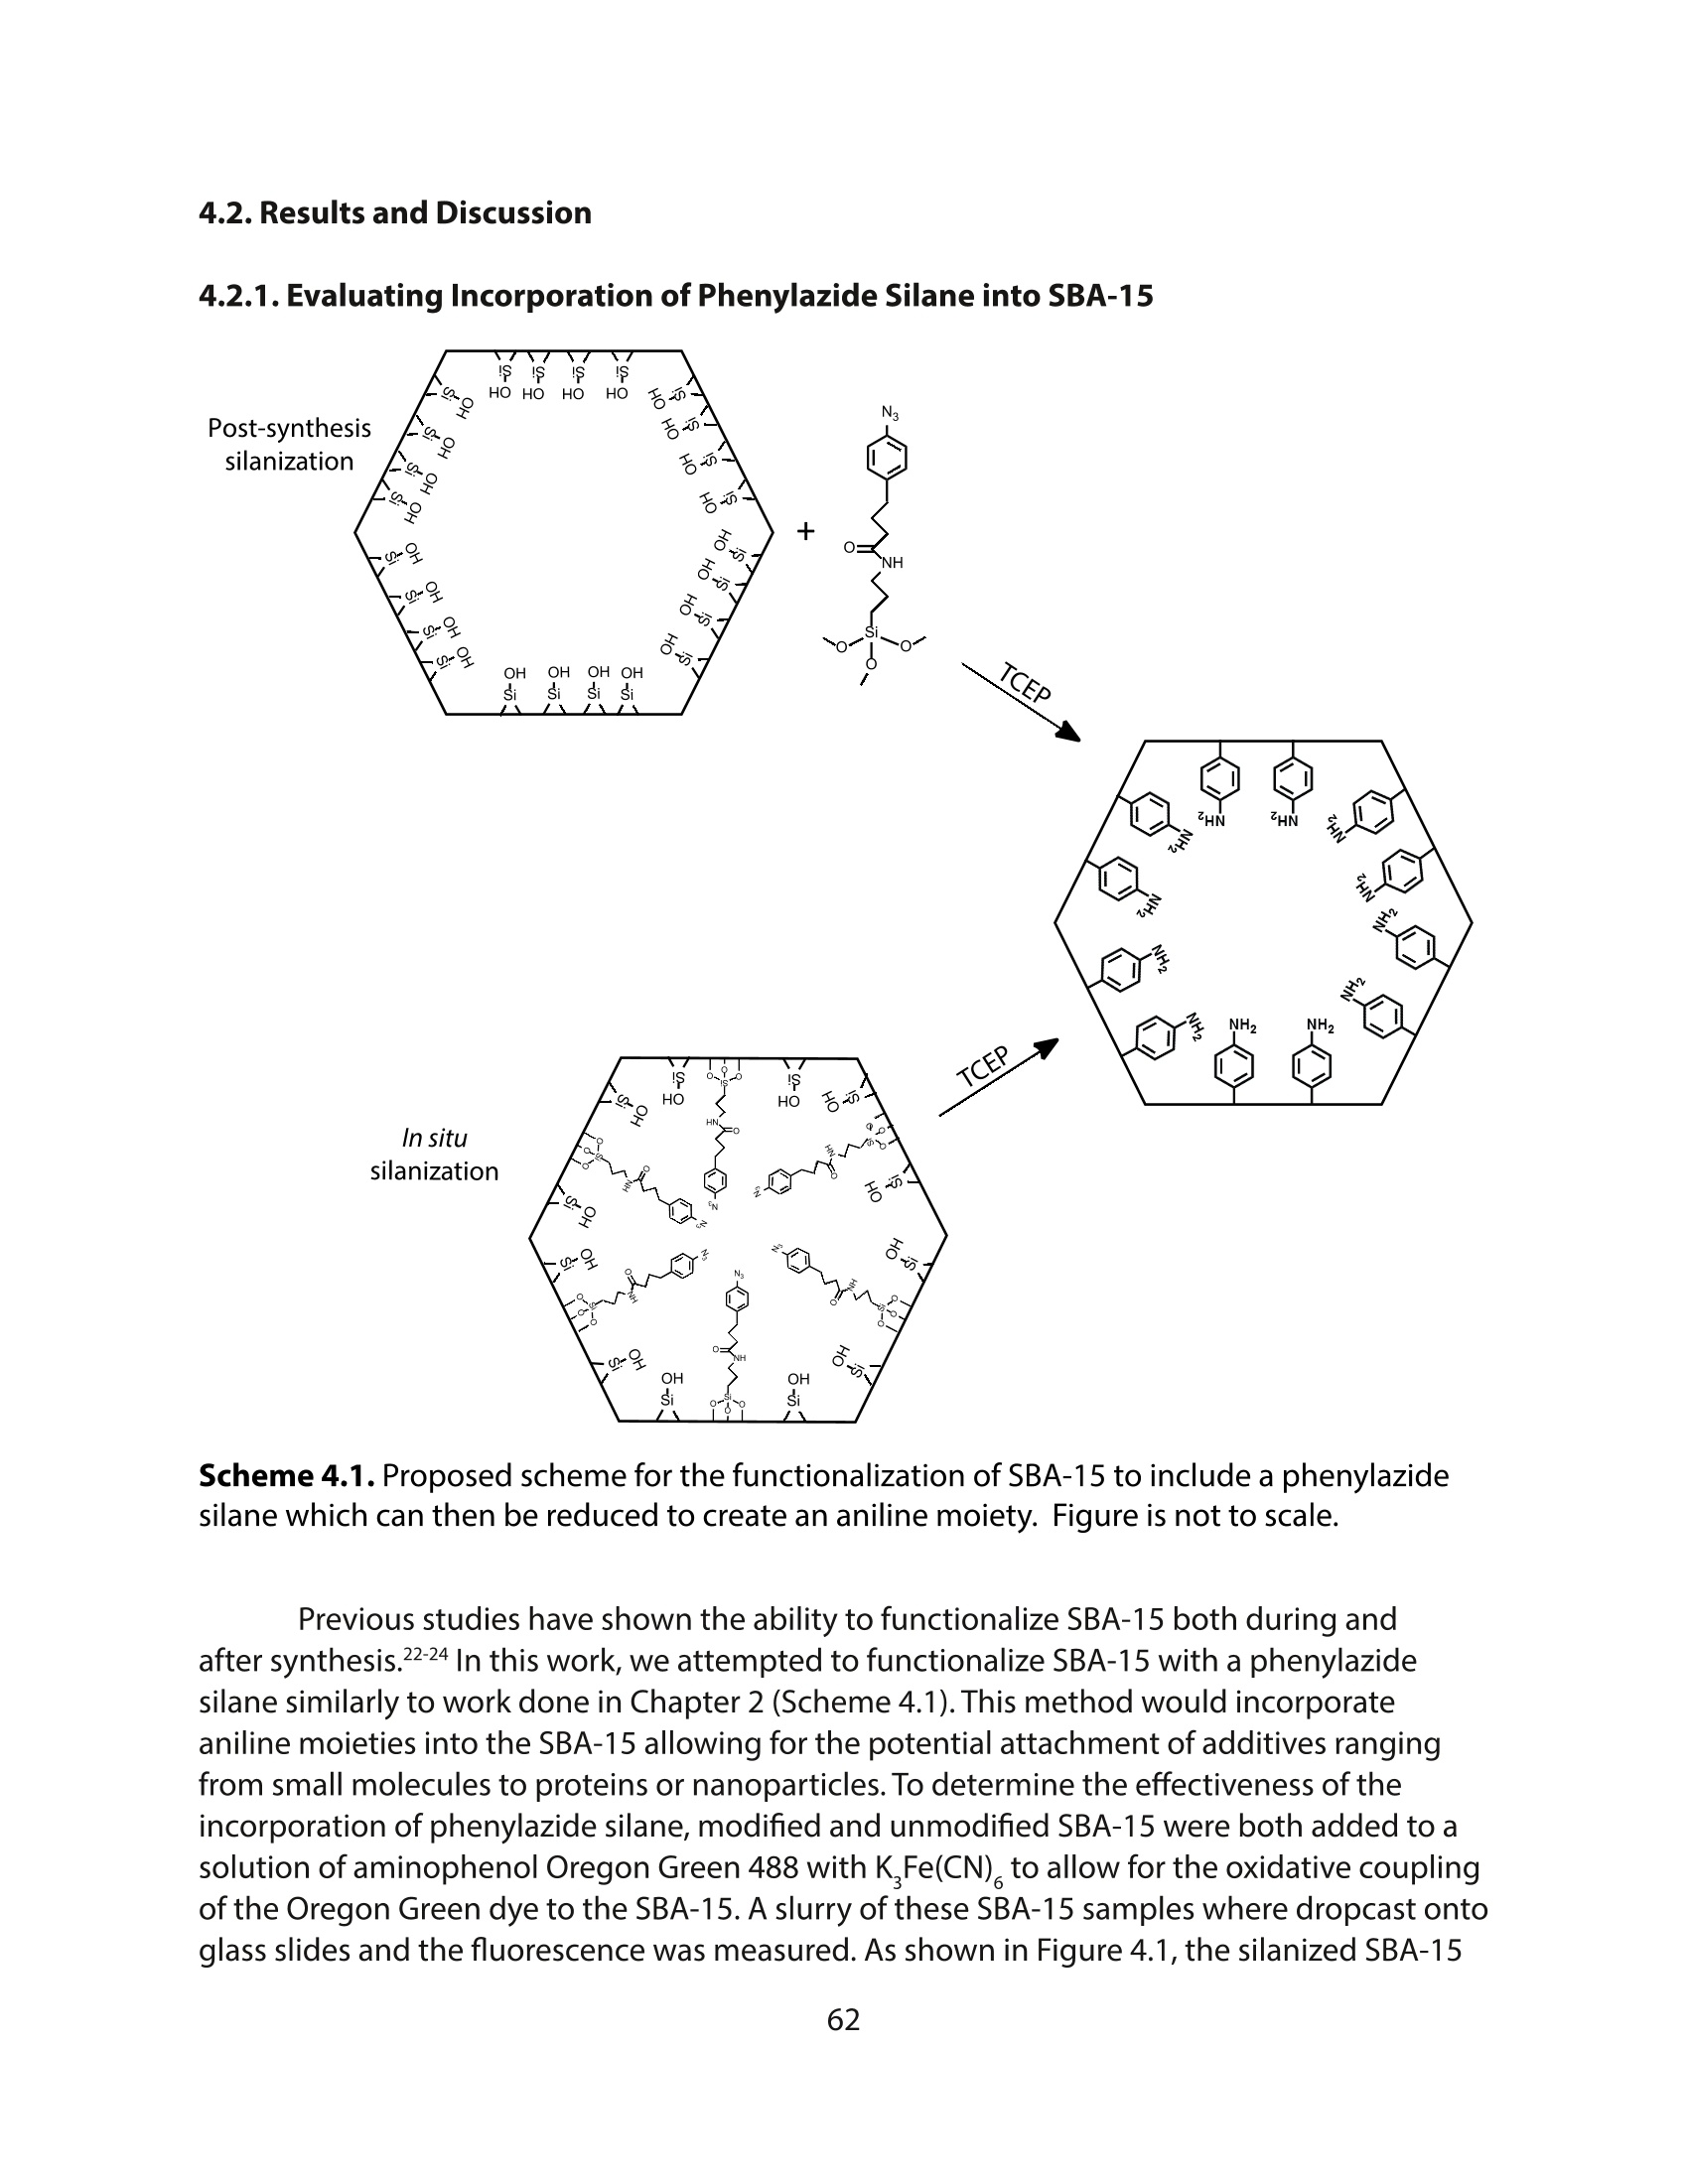
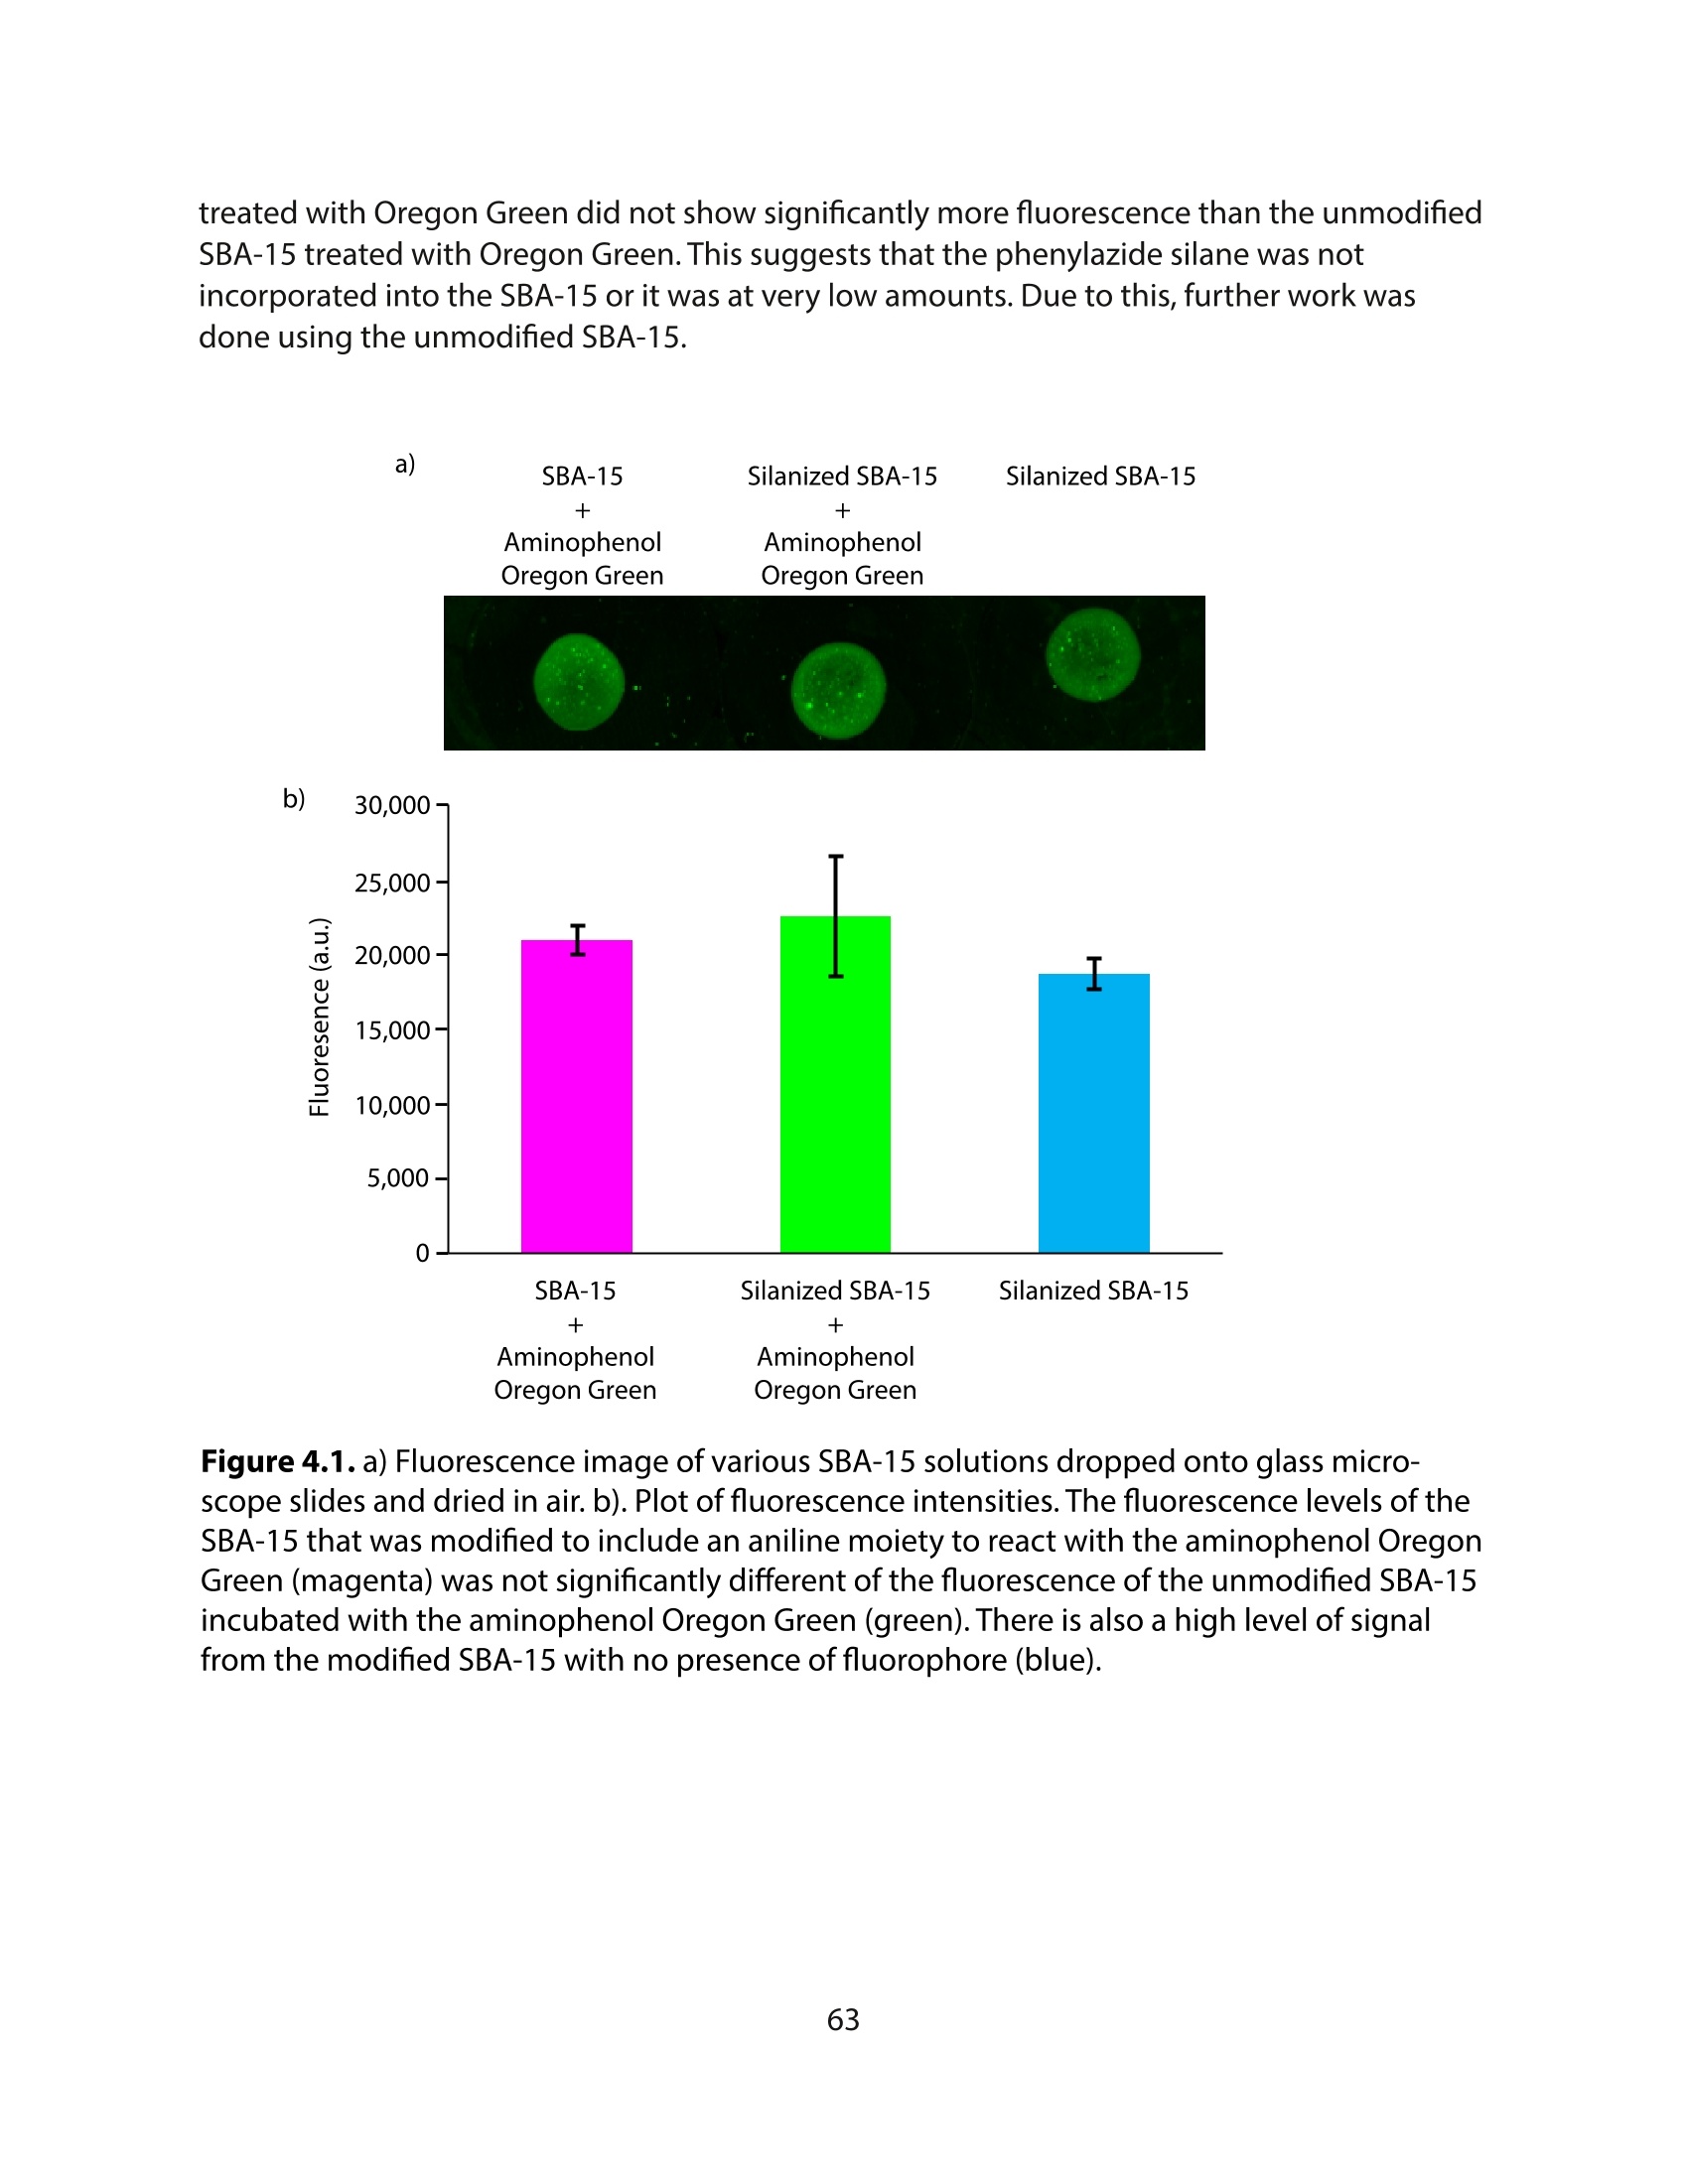
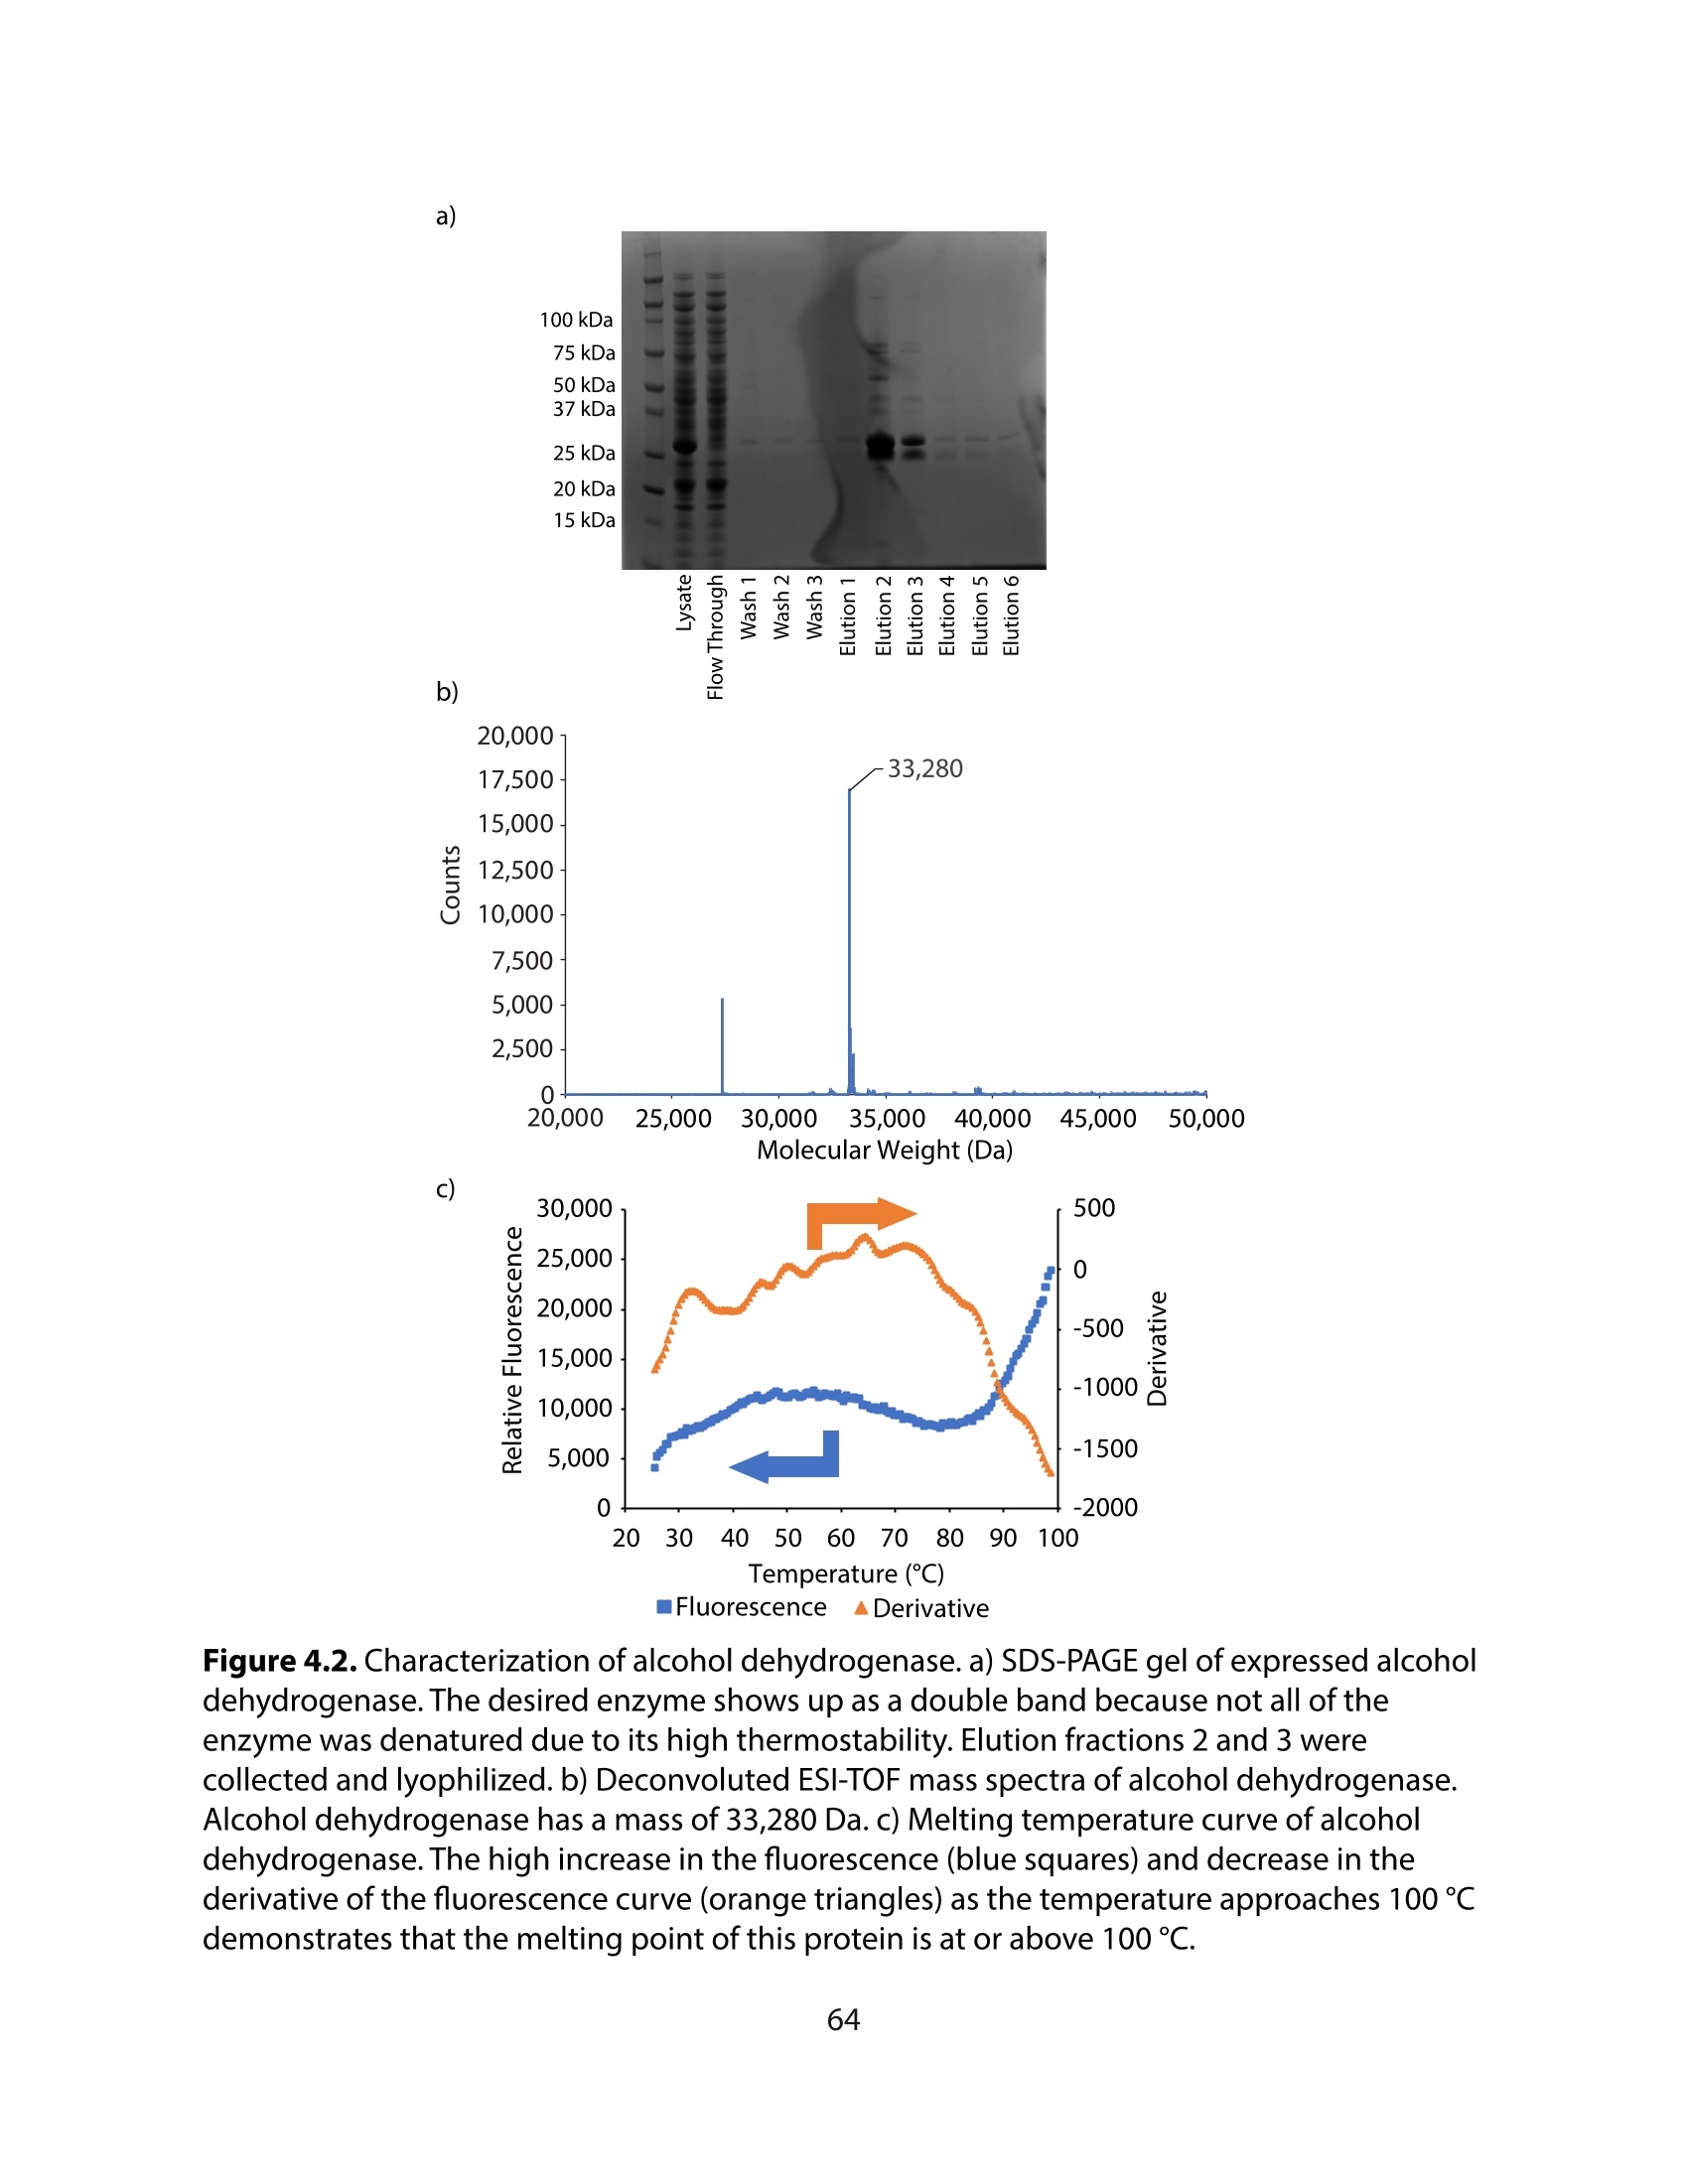
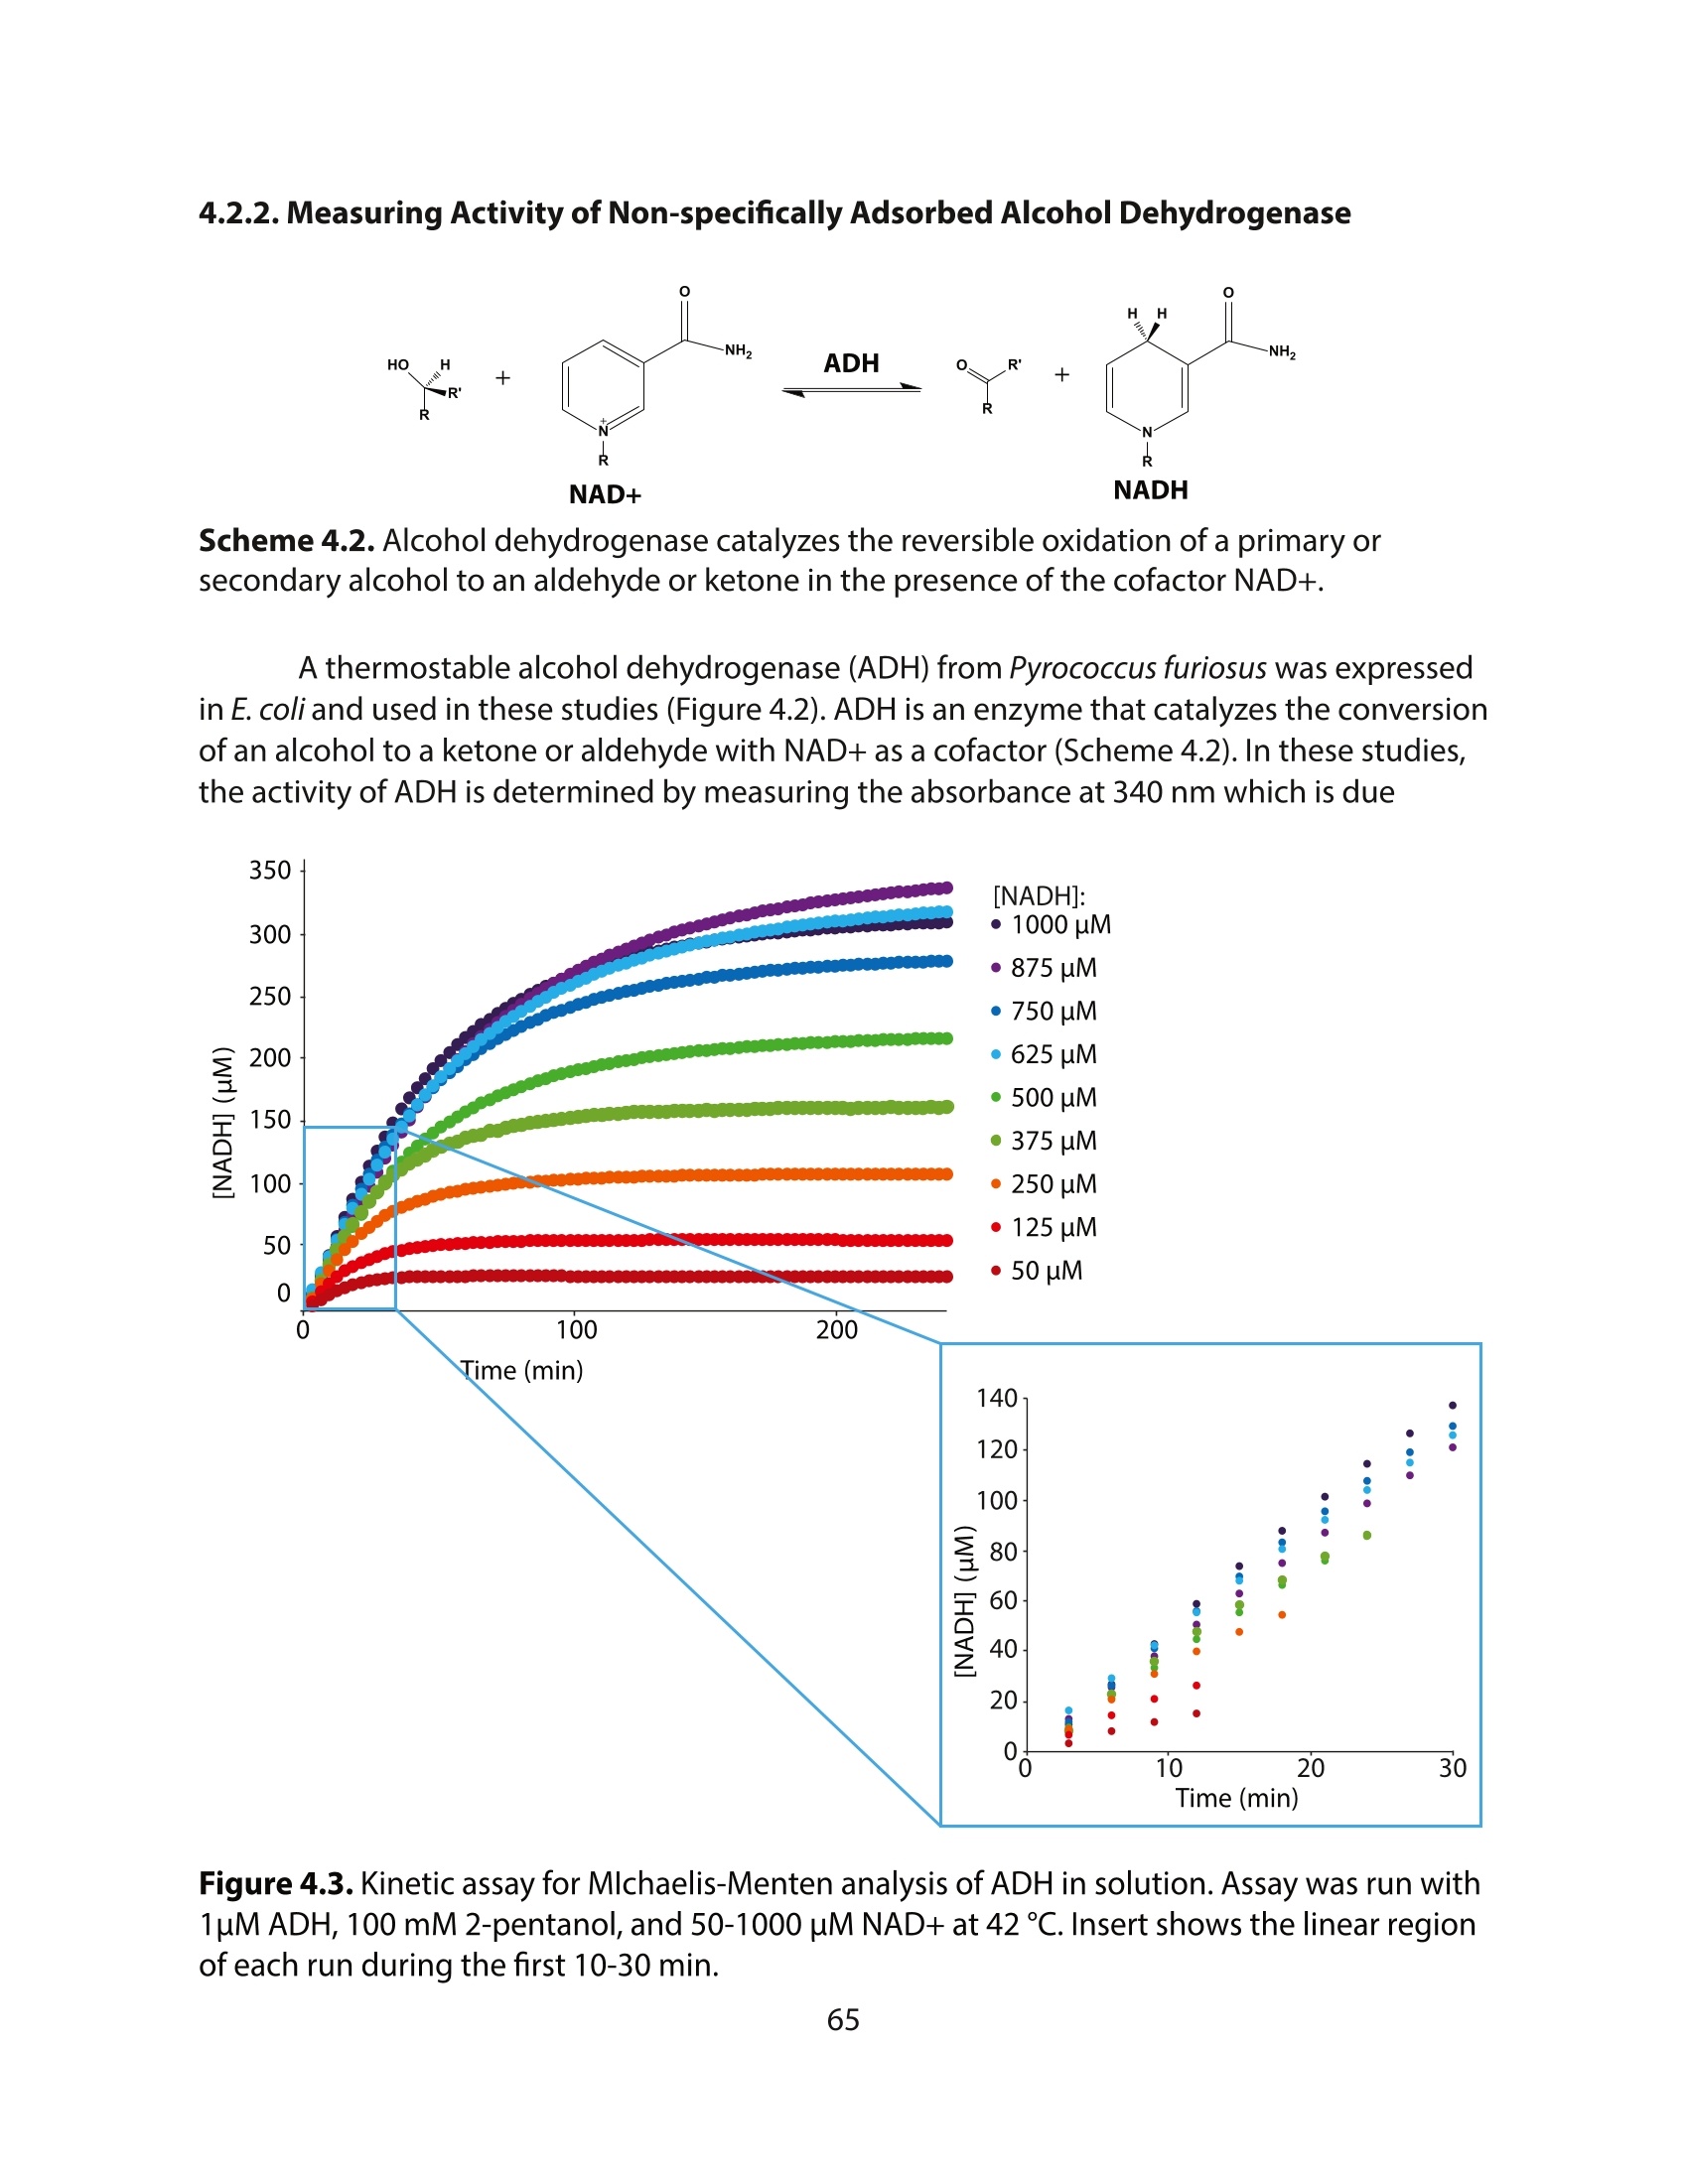
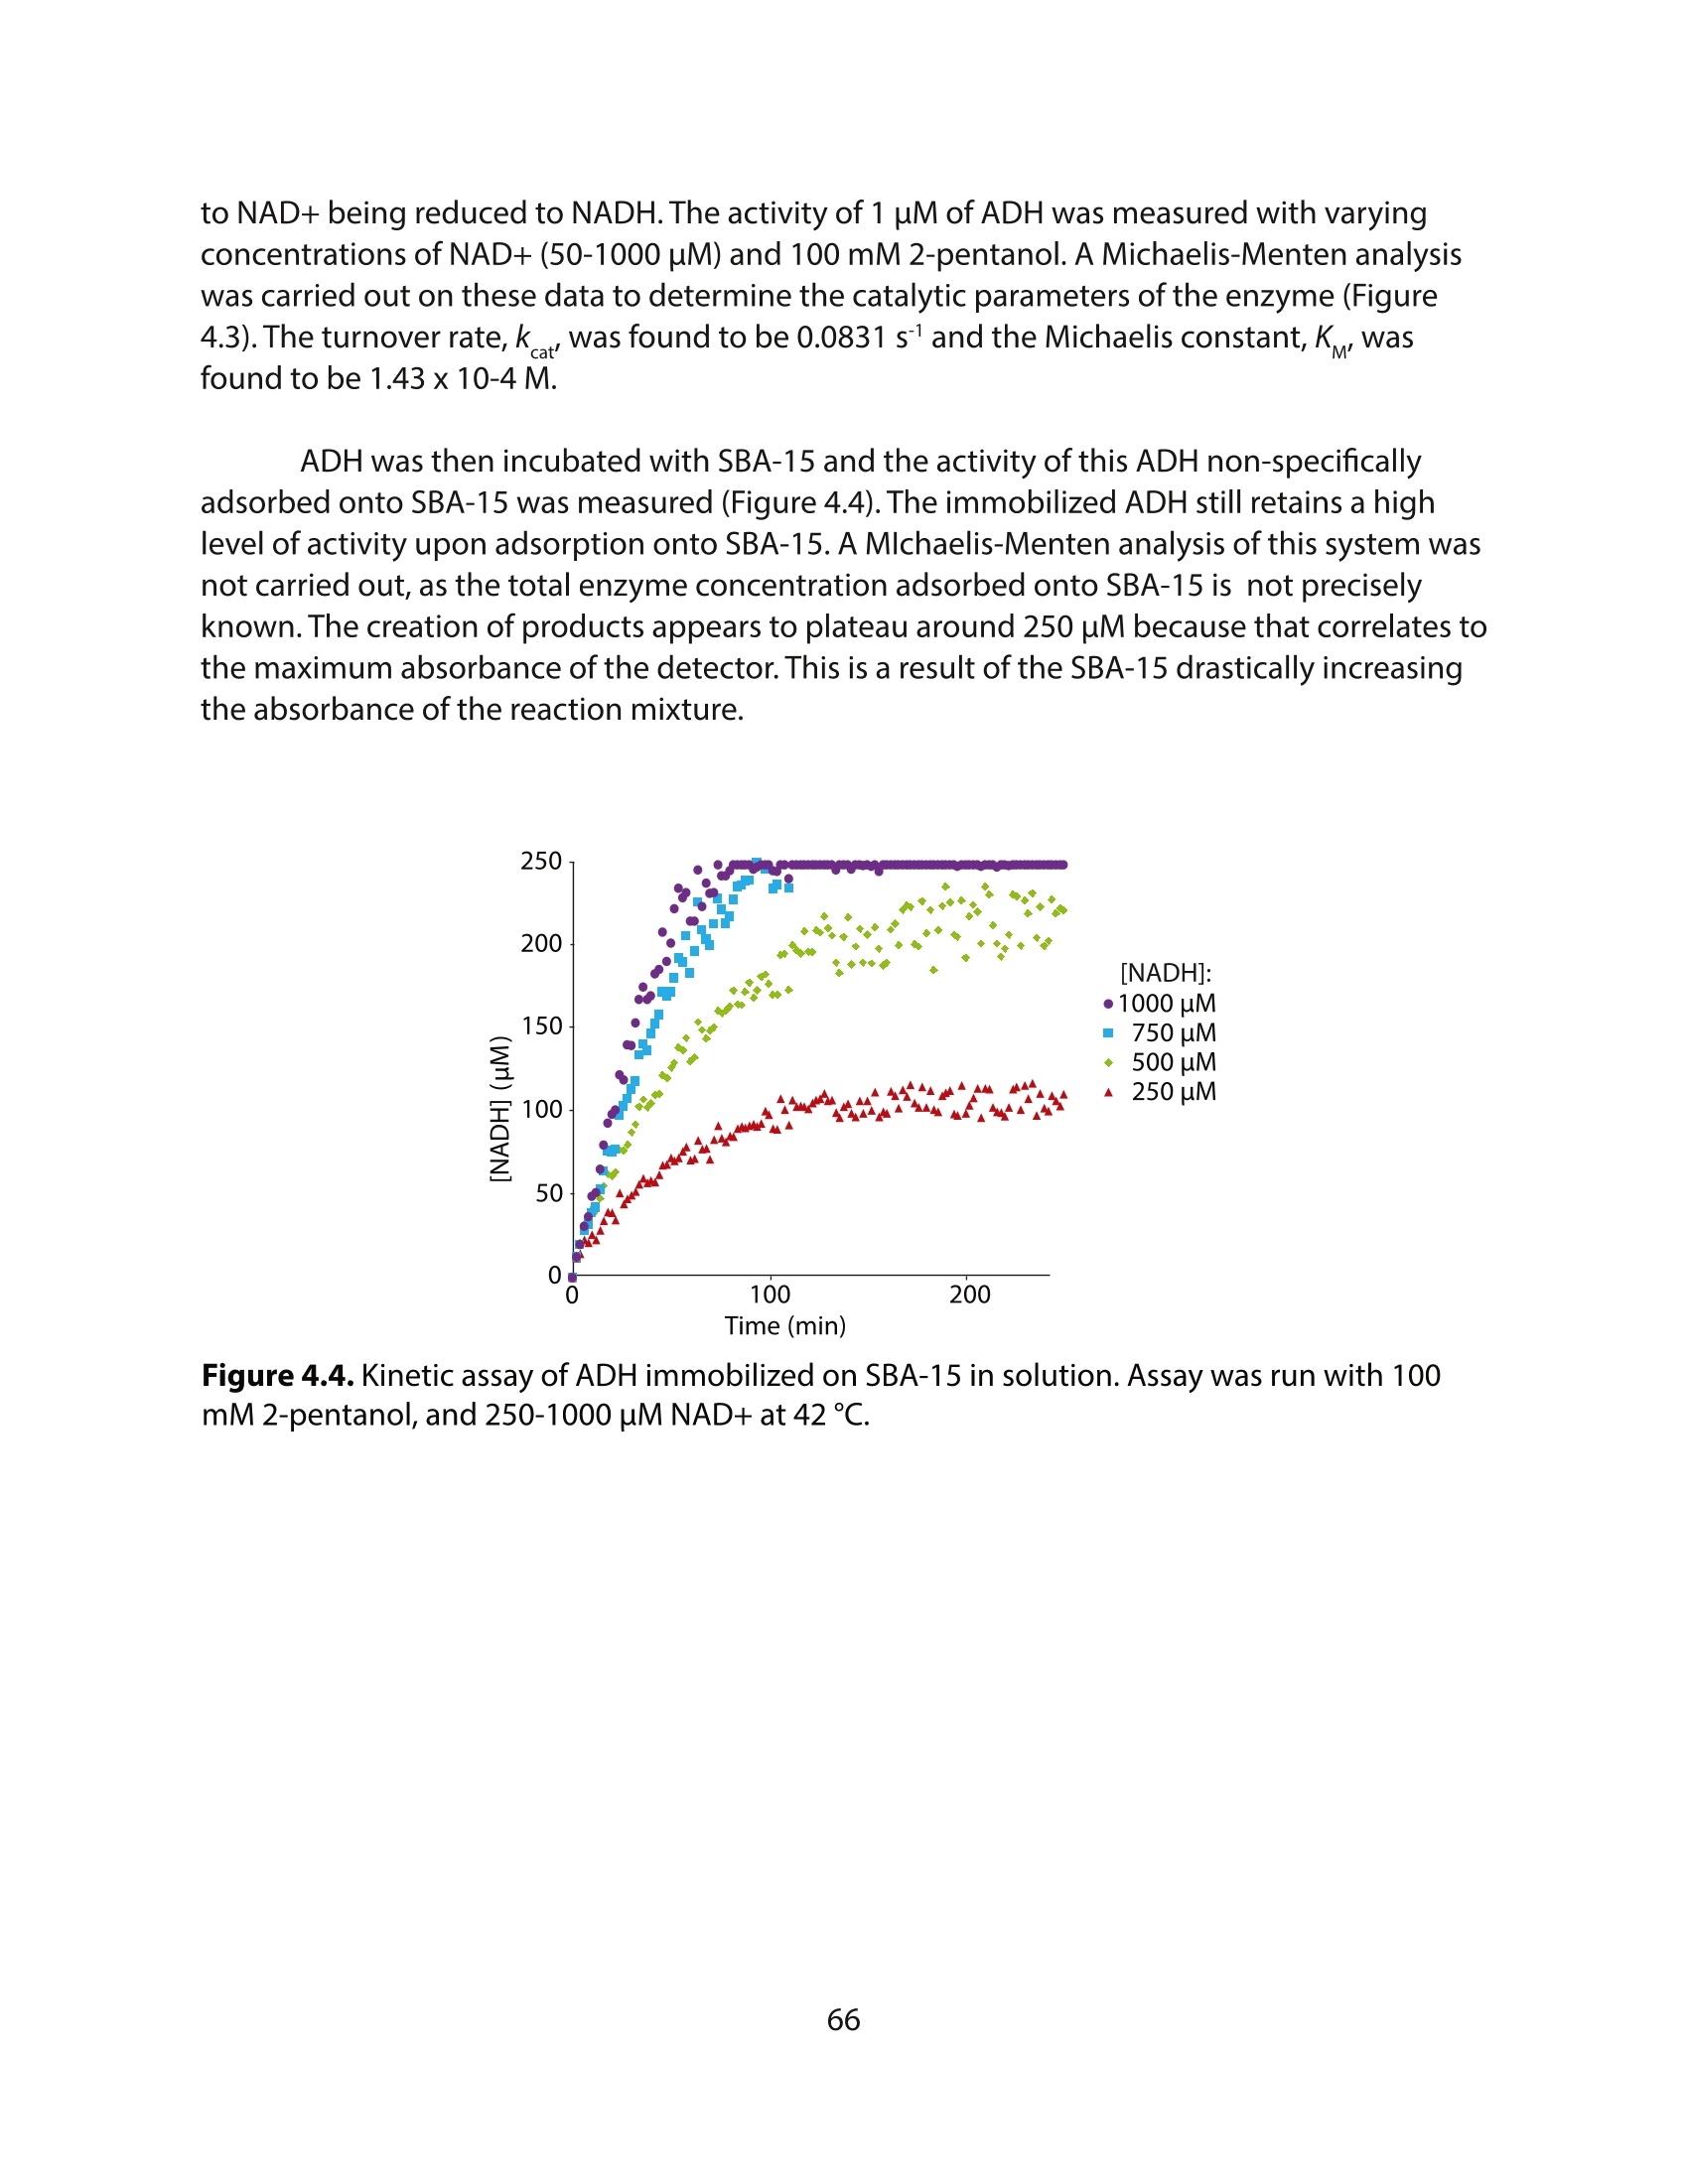
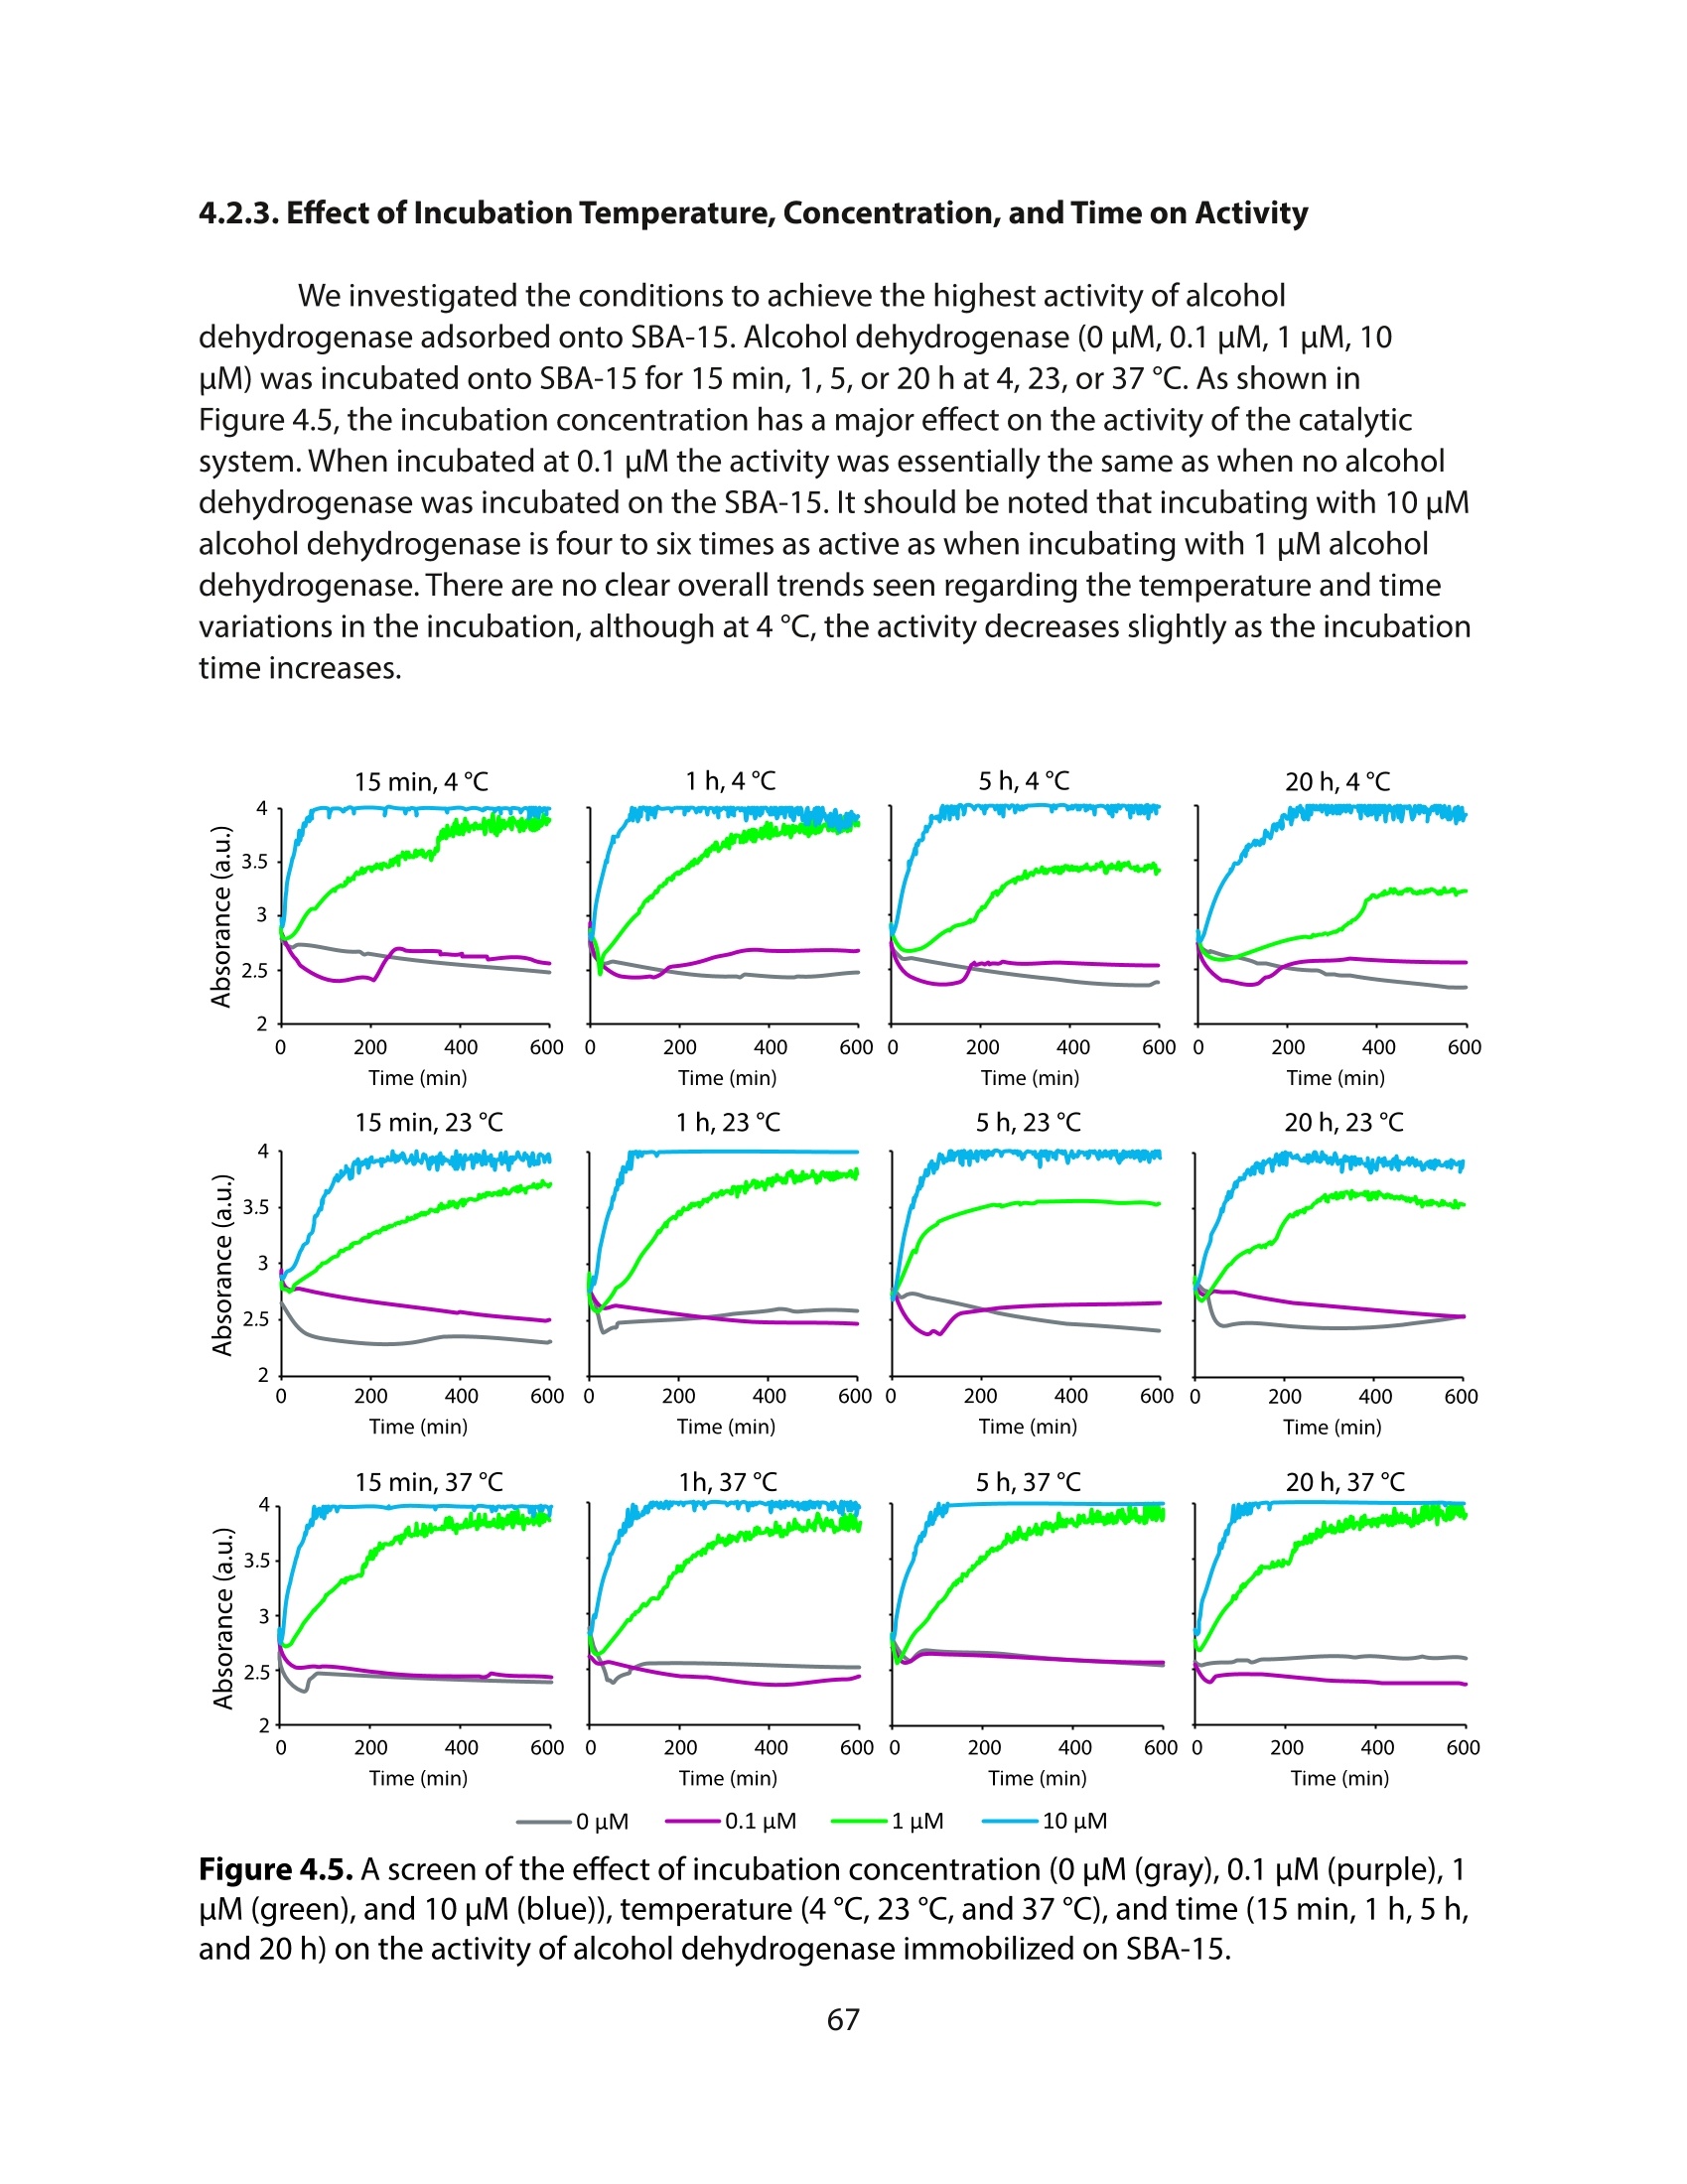
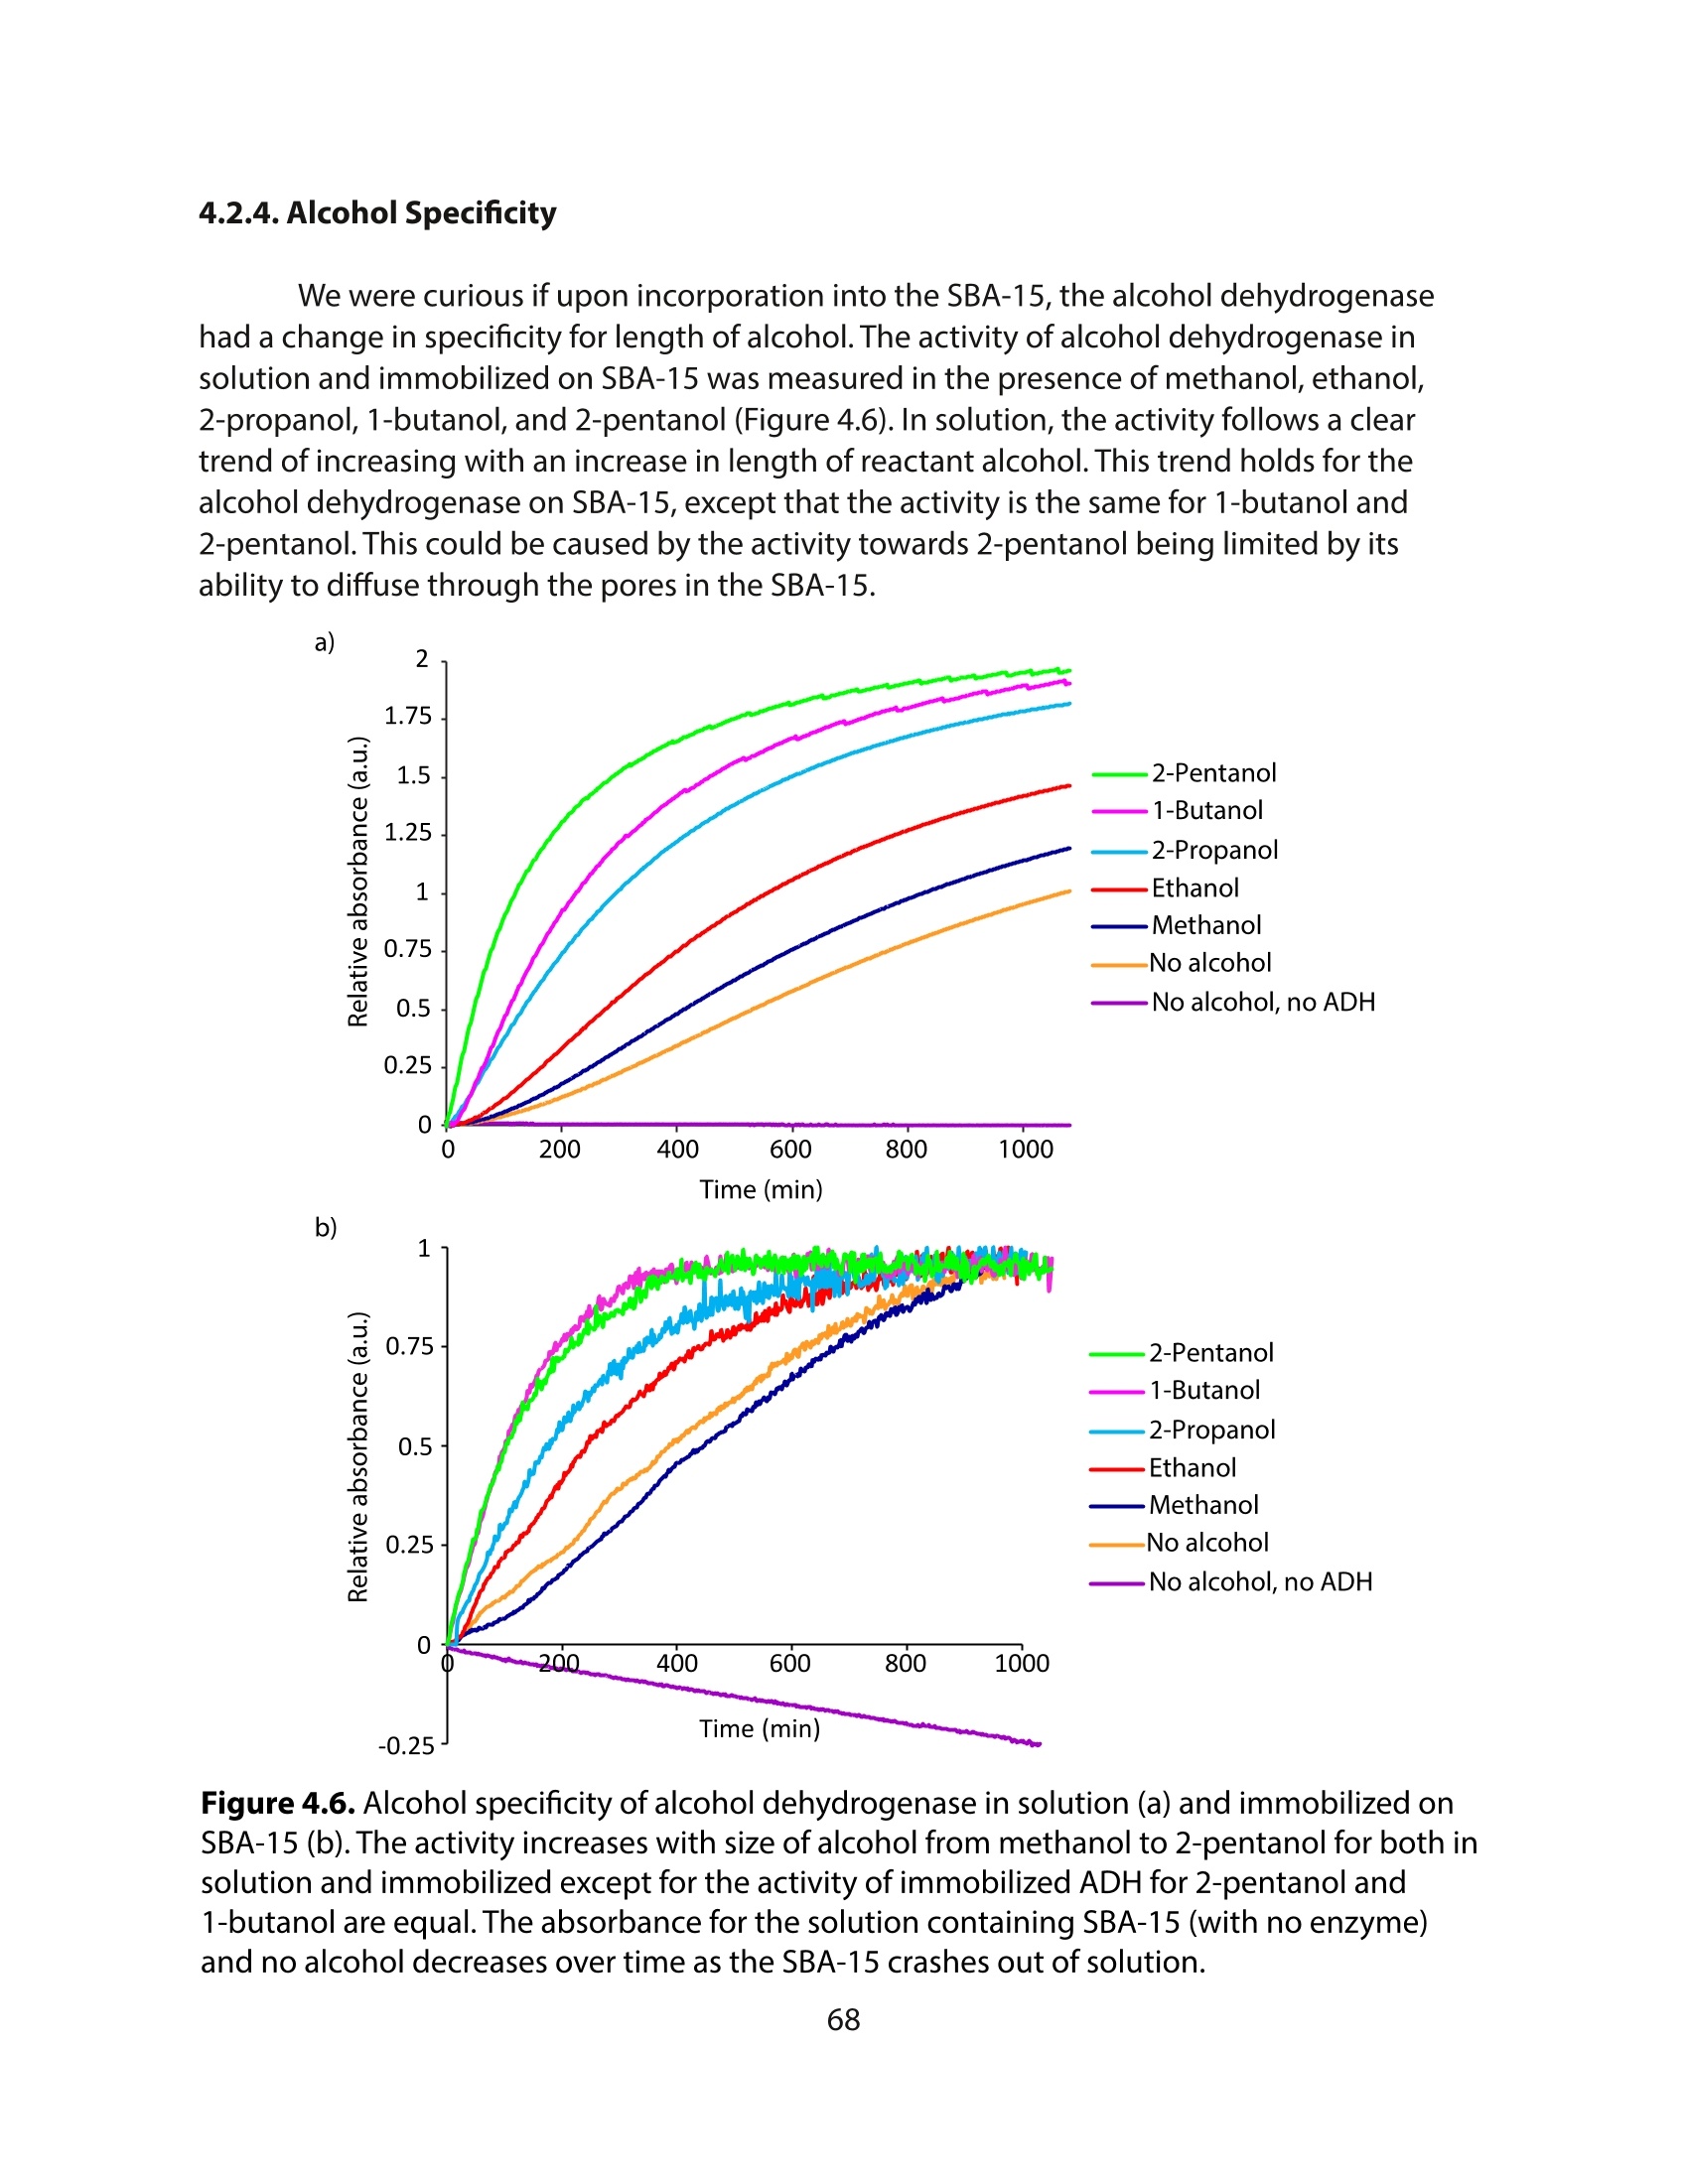
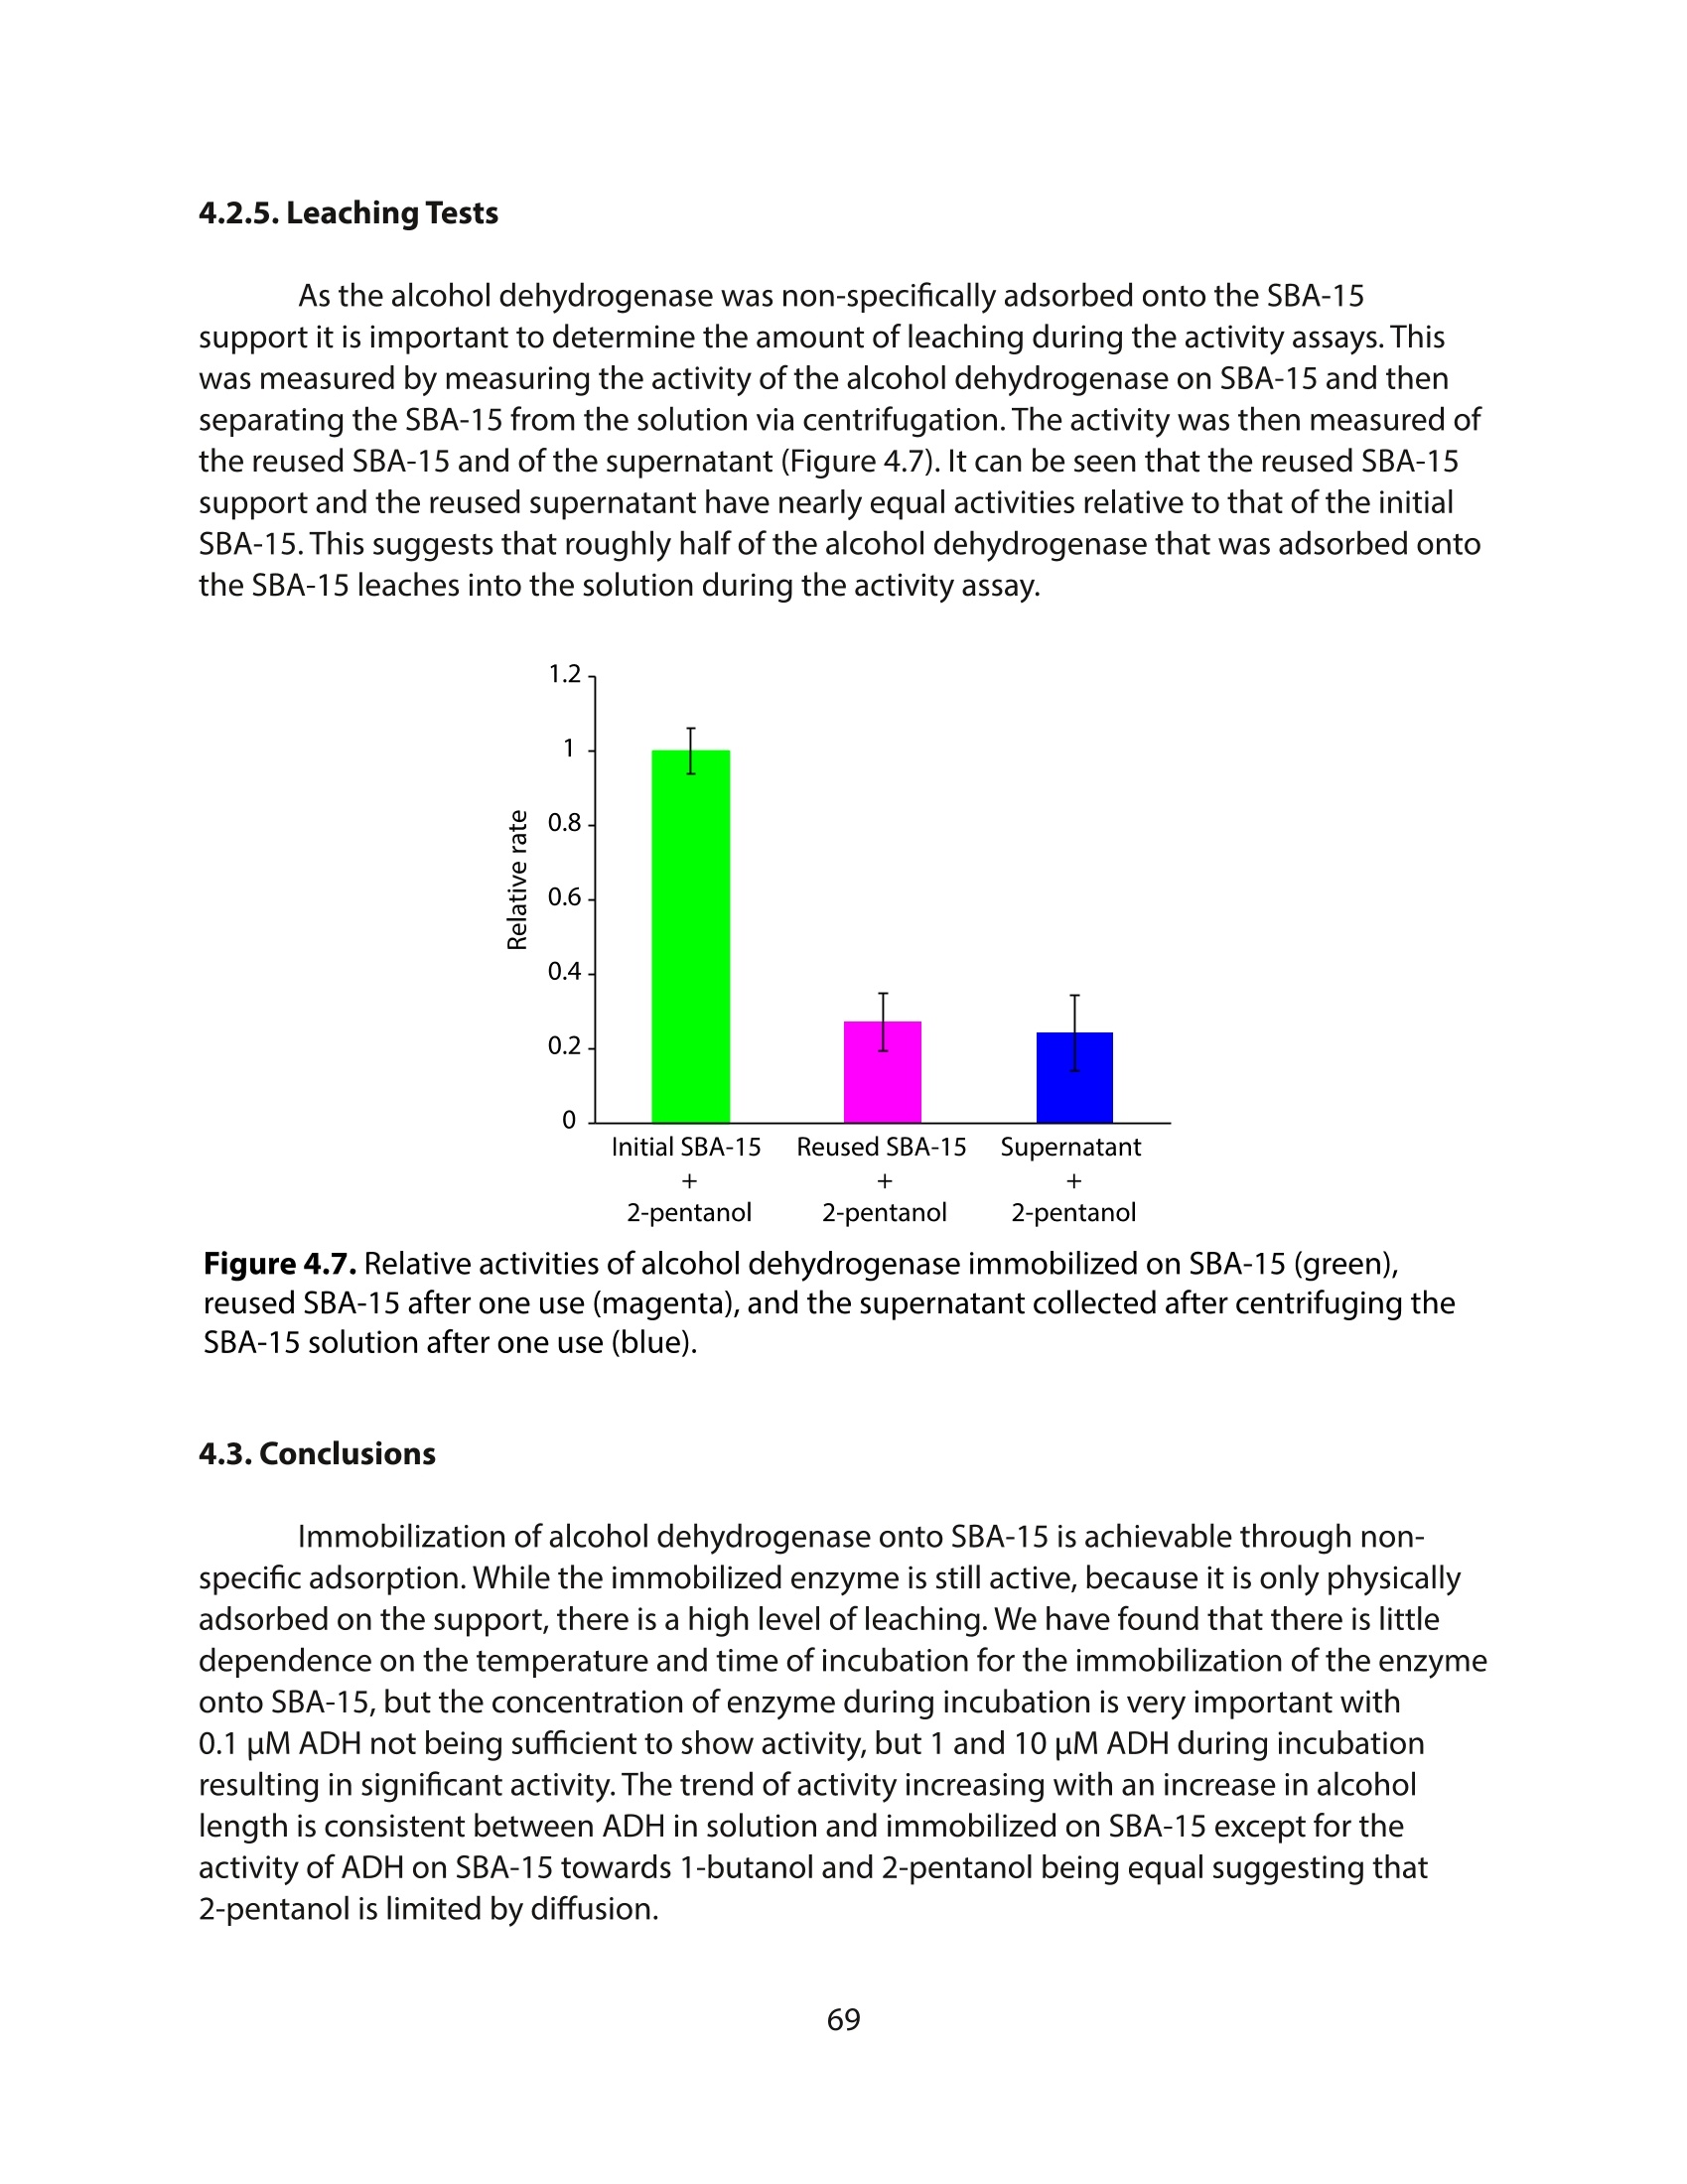
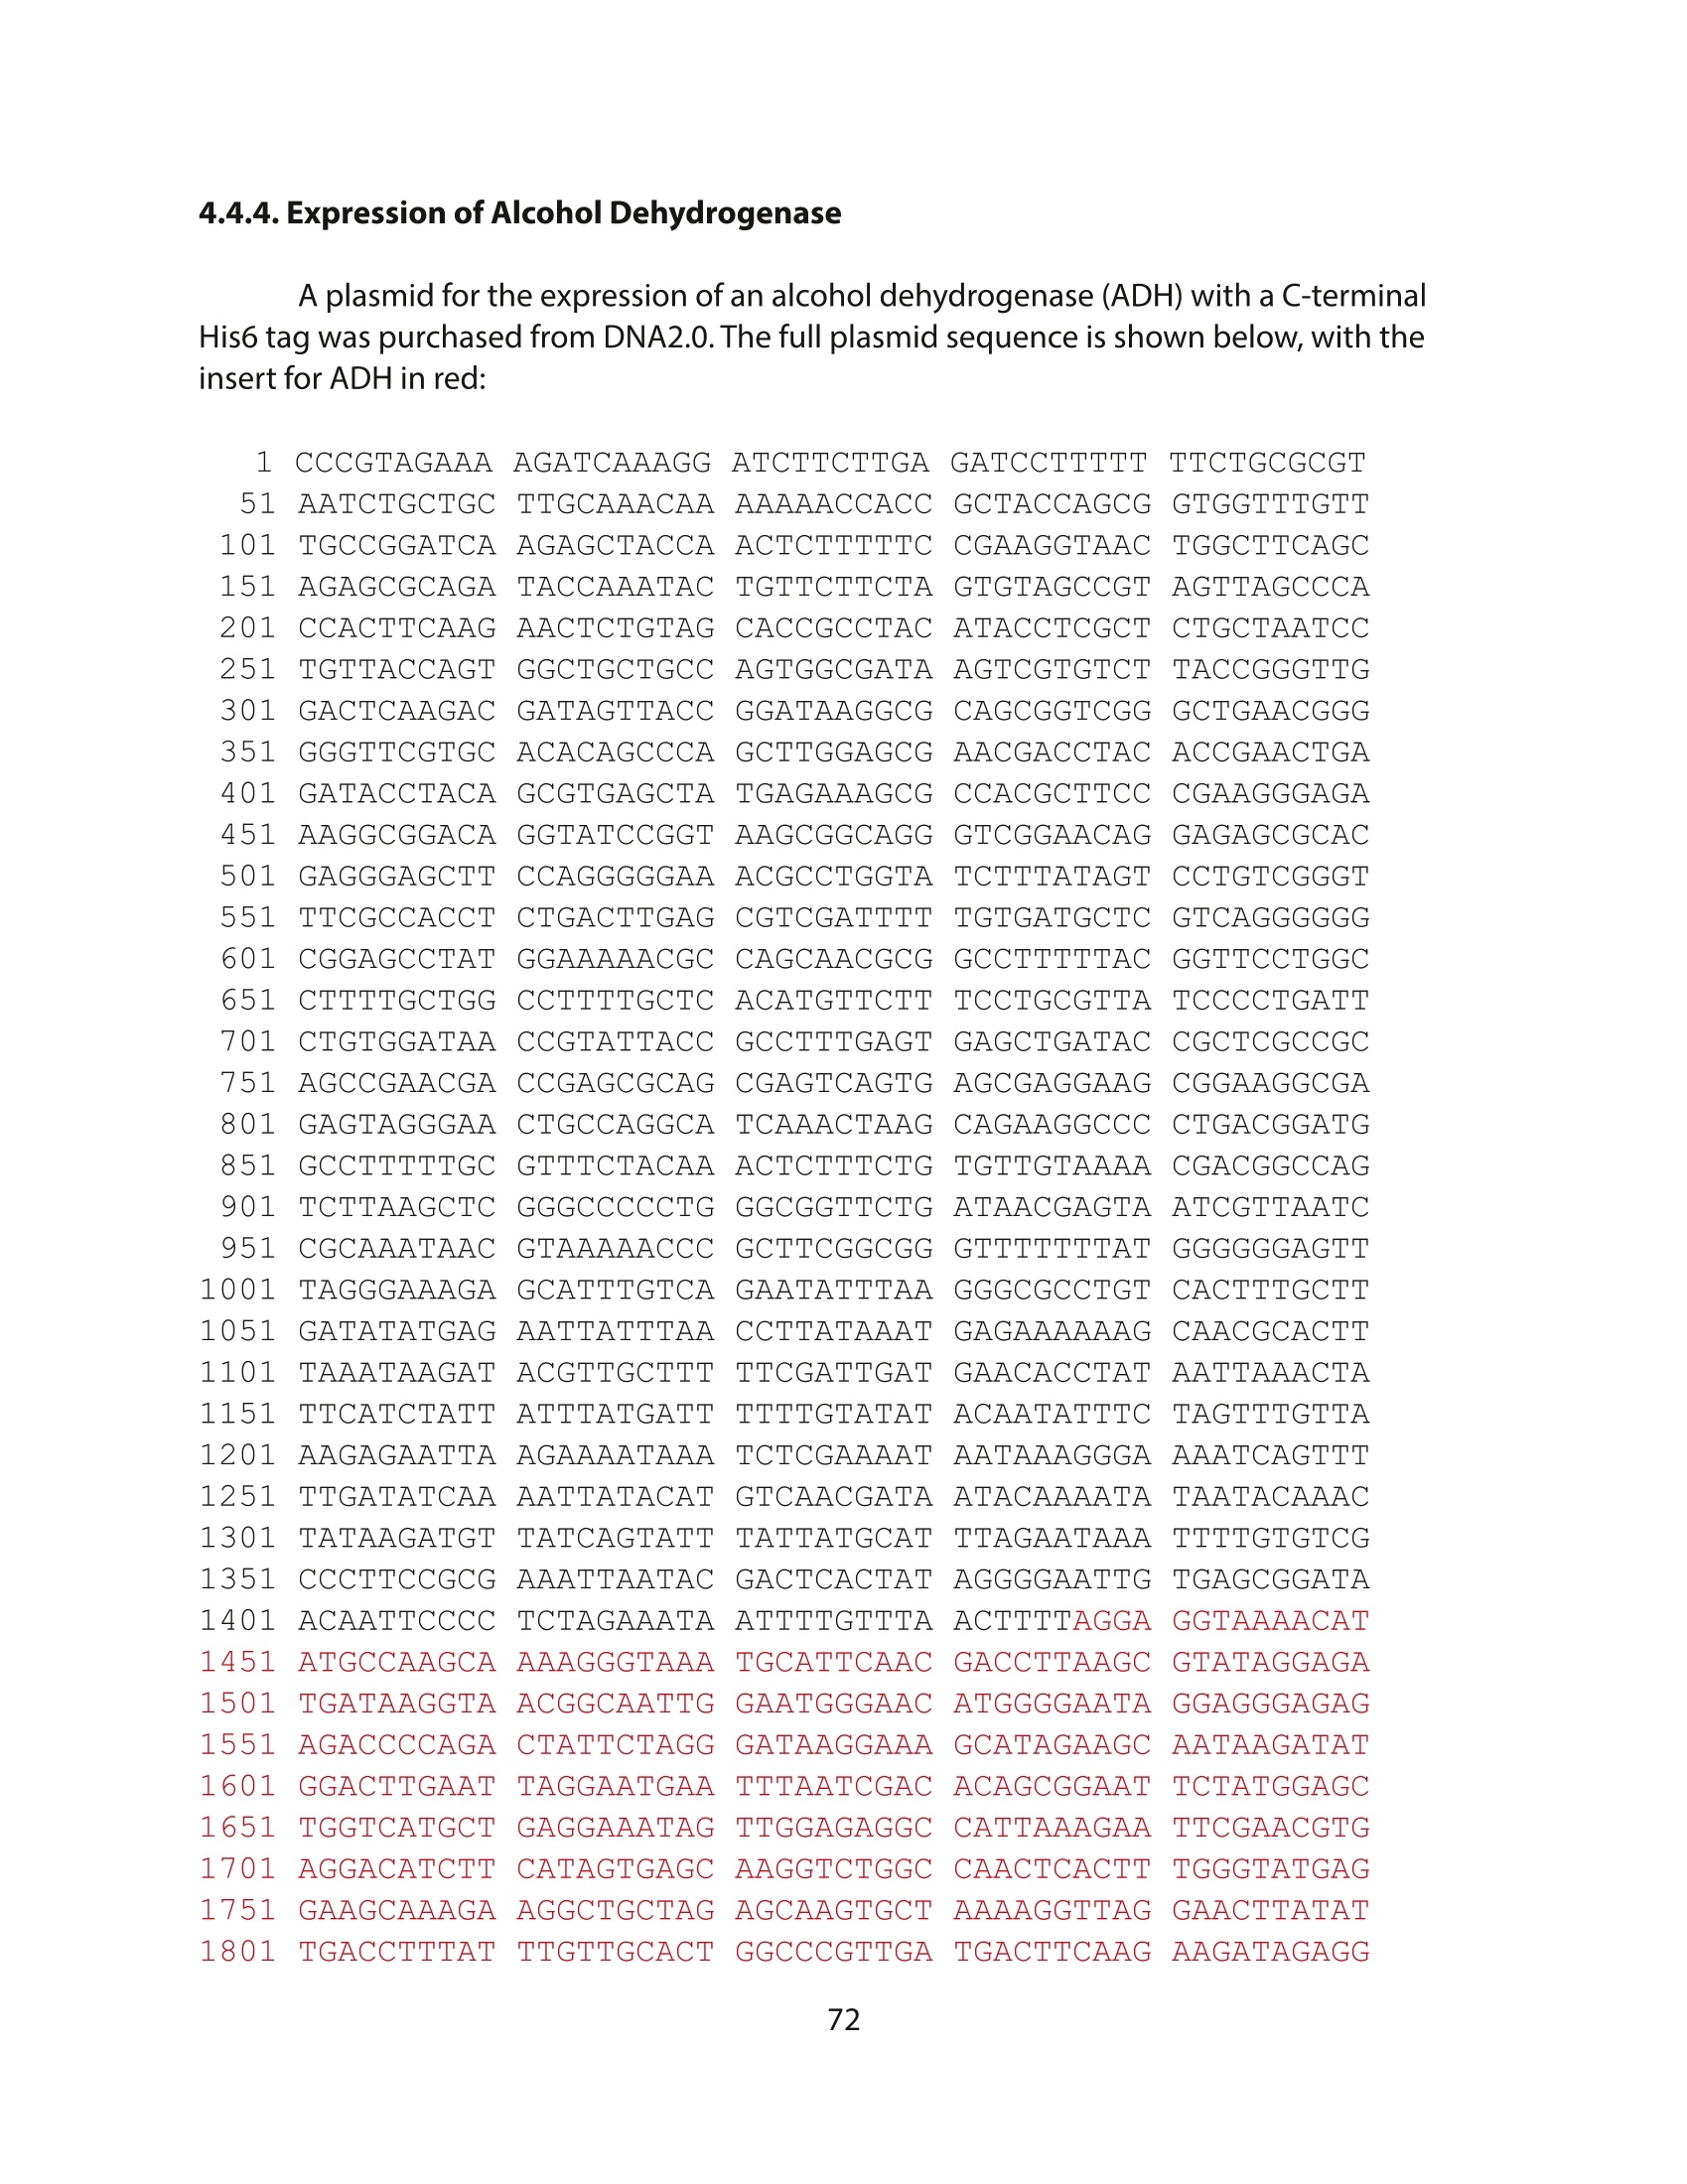
还剩84页未读,是否继续阅读?

产品配置单
北京欧兰科技发展有限公司为您提供《固定化酶中和频光谱检测方案(激光产品)》,该方案主要用于催化剂中理化分析检测,参考标准--,《固定化酶中和频光谱检测方案(激光产品)》用到的仪器有Ekspla PL2230型高能量皮秒激光器
推荐专场


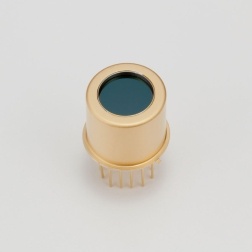

相关方案
更多
该厂商其他方案
更多