


方案详情
文
采用LaVision的科研级sCMOS相机,对用3D打印技术制成的微流提探头的流场特性进行了实验测量。
方案详情

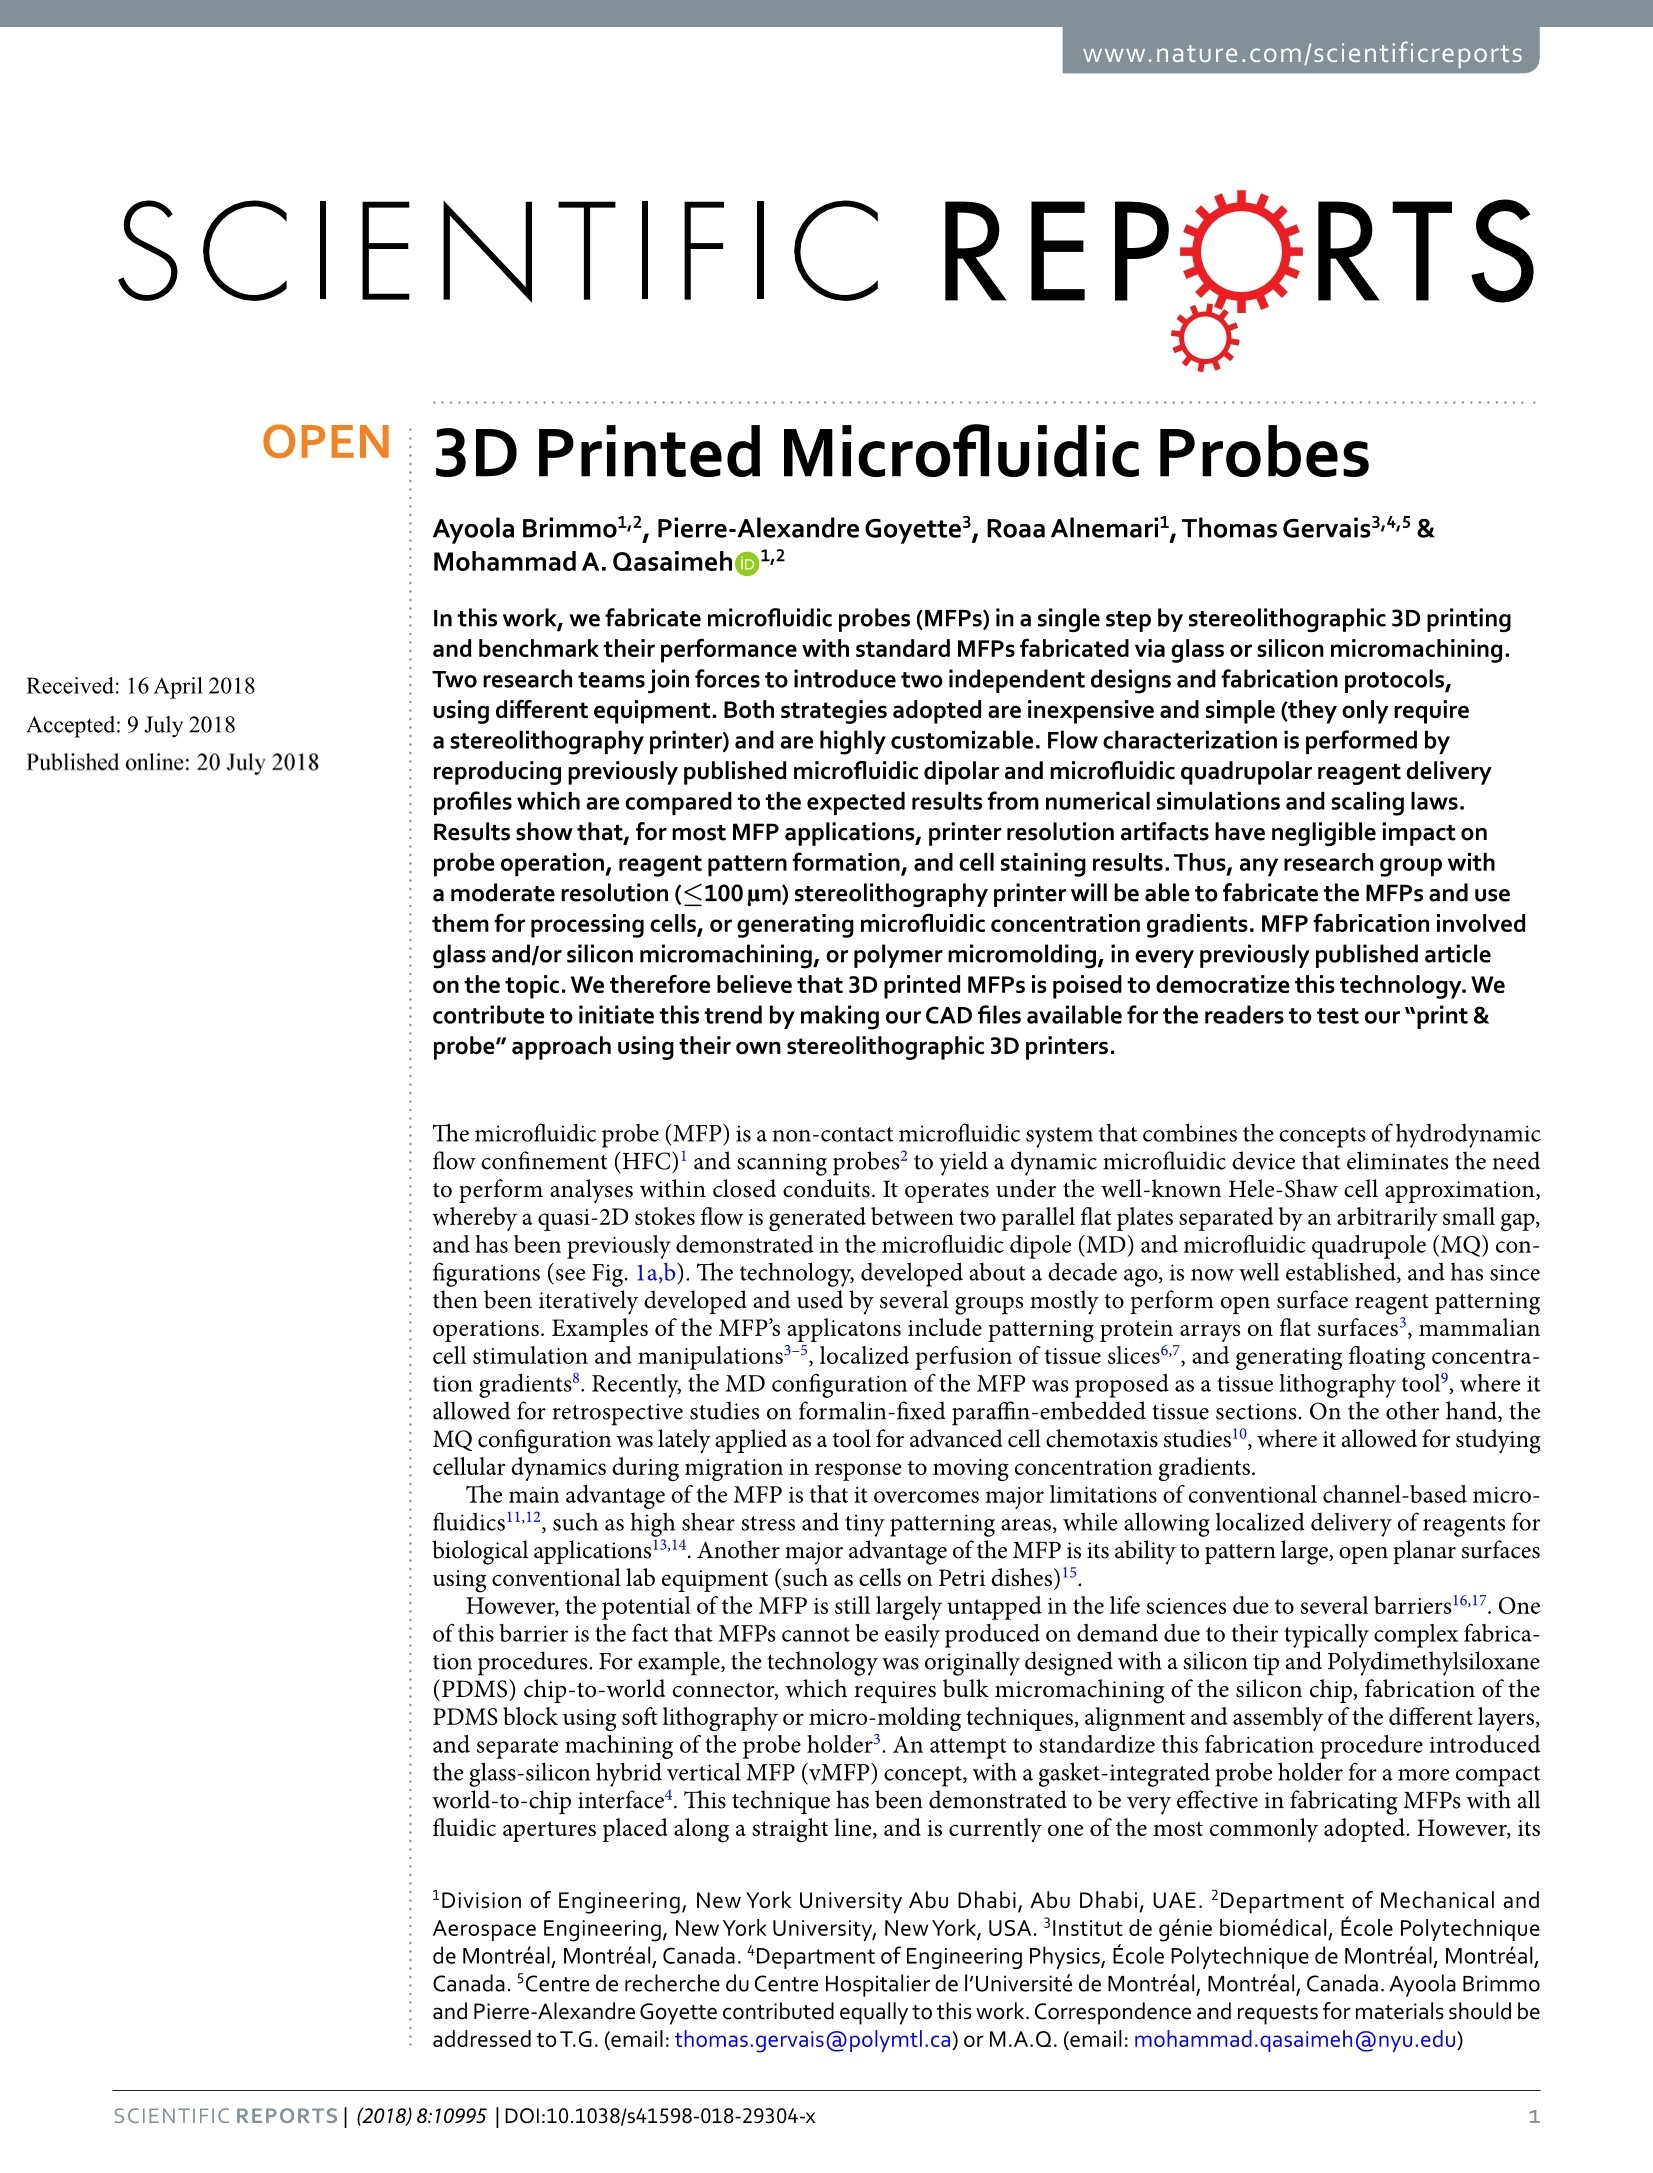
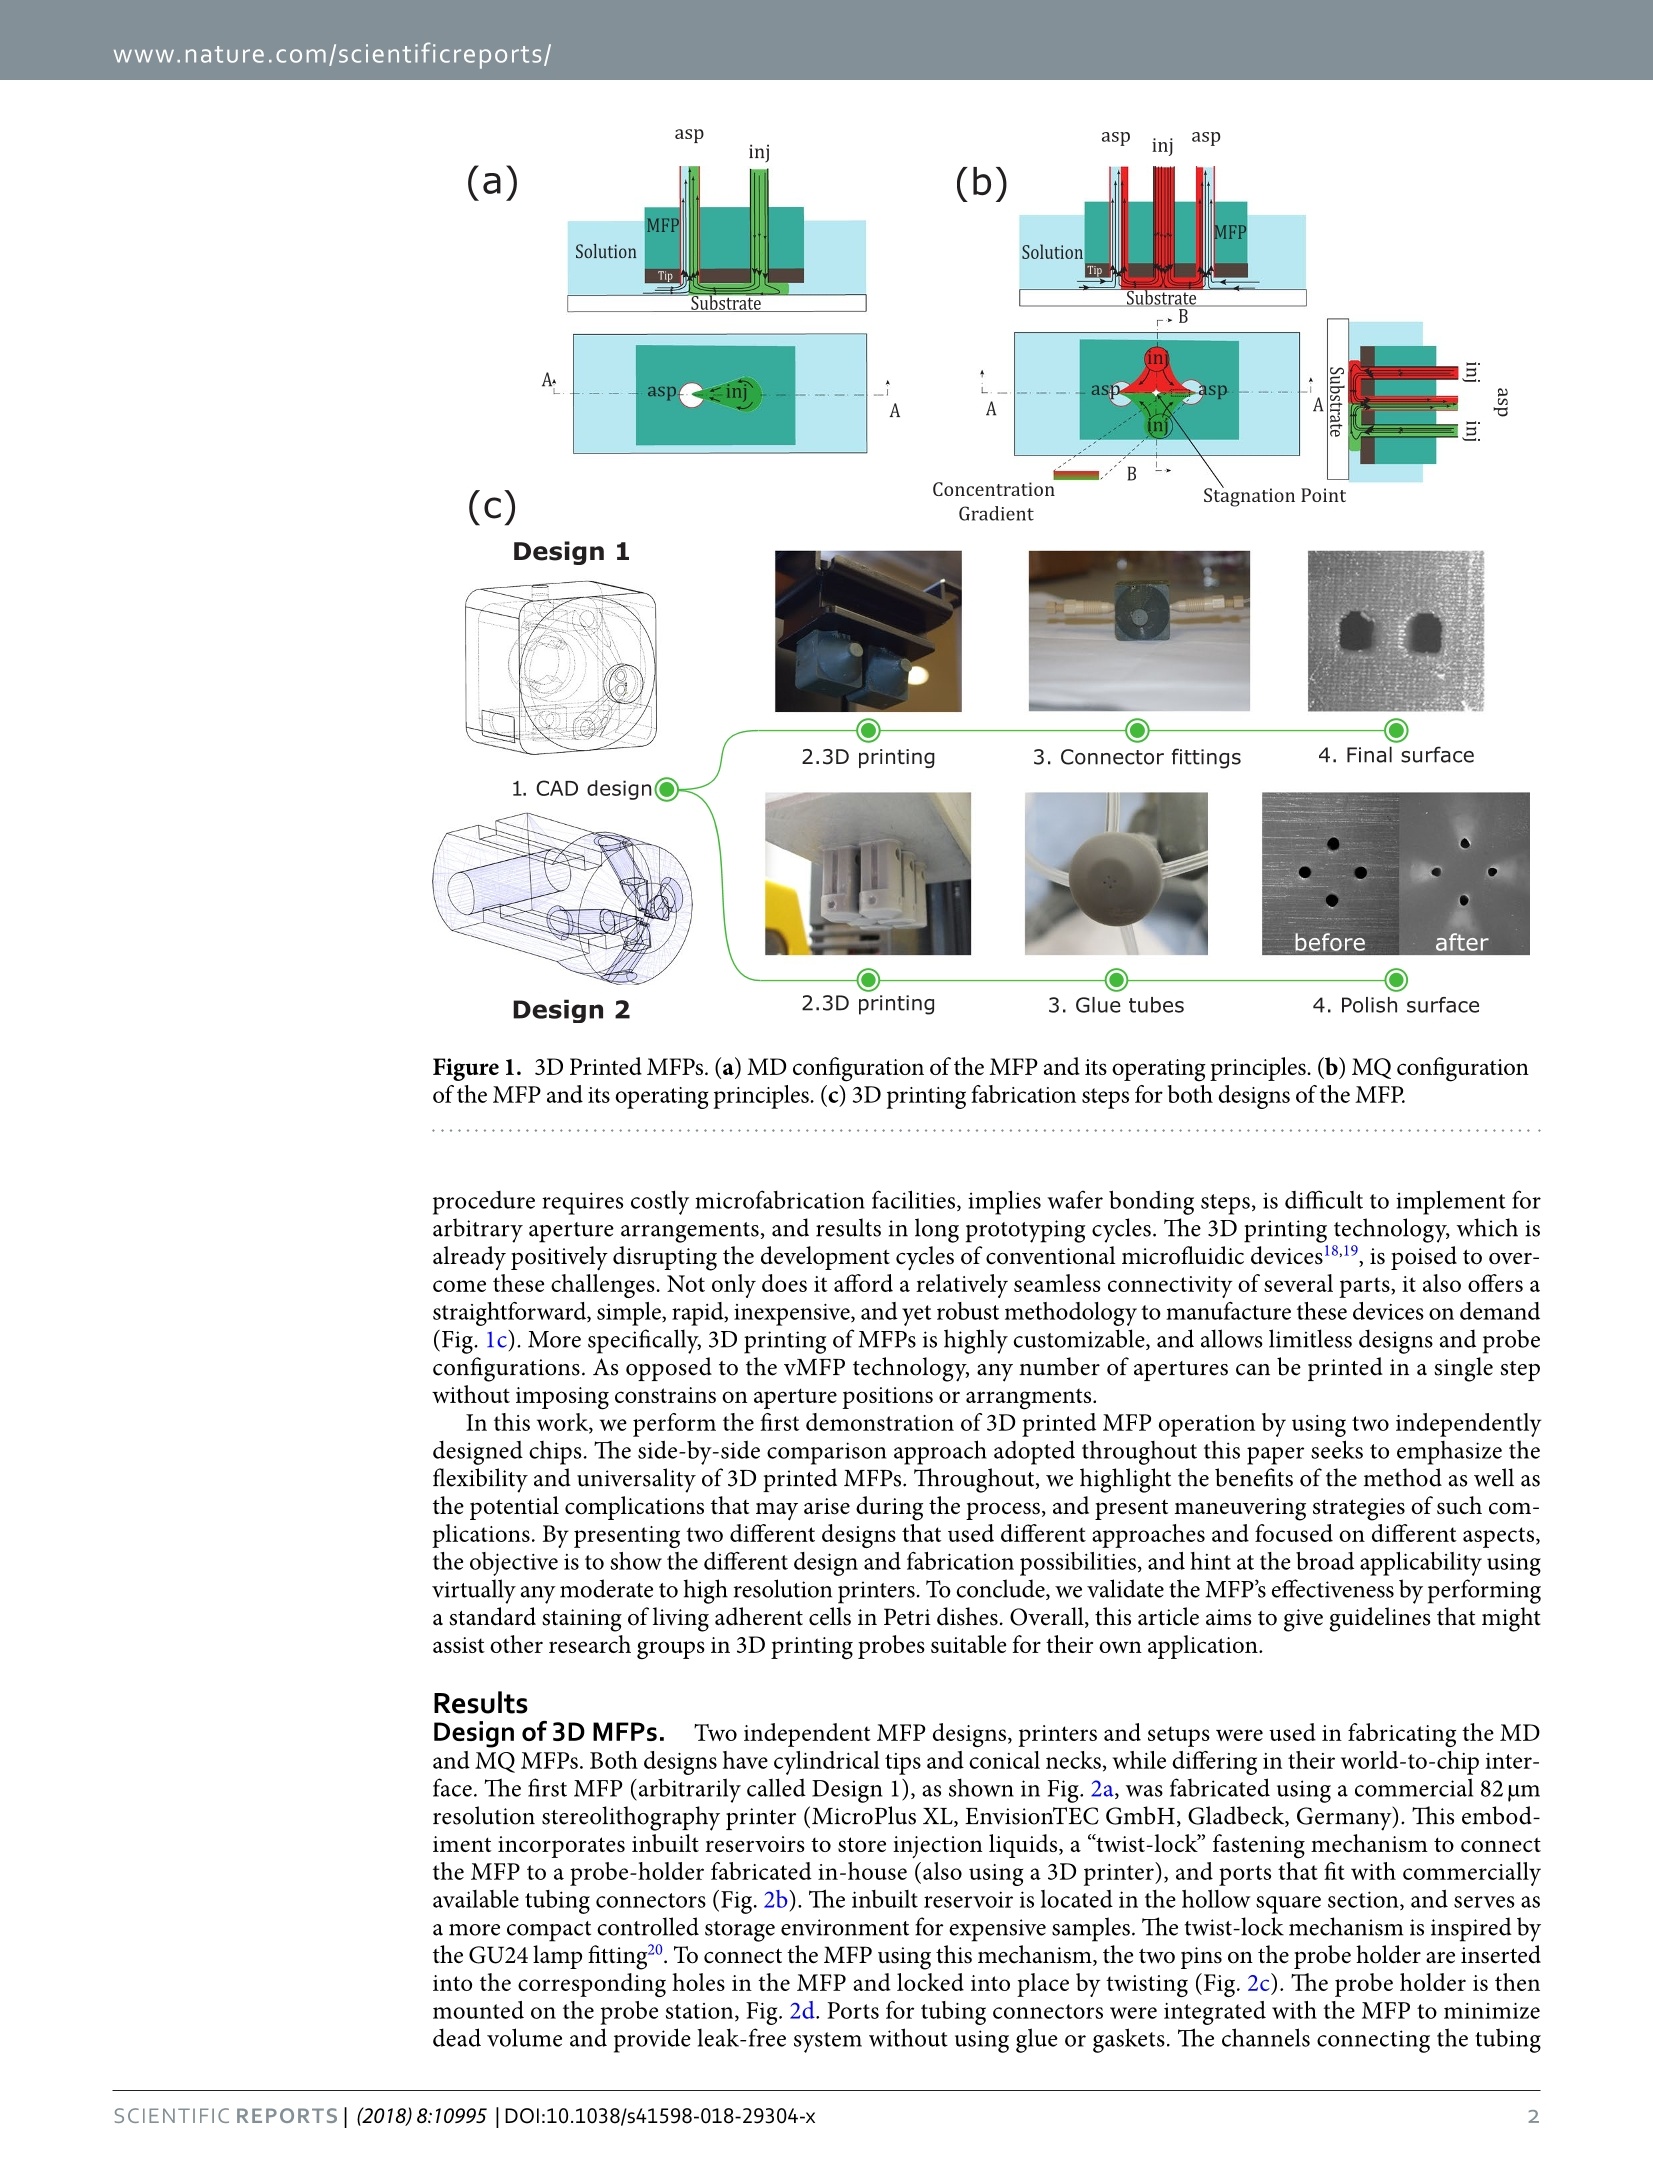
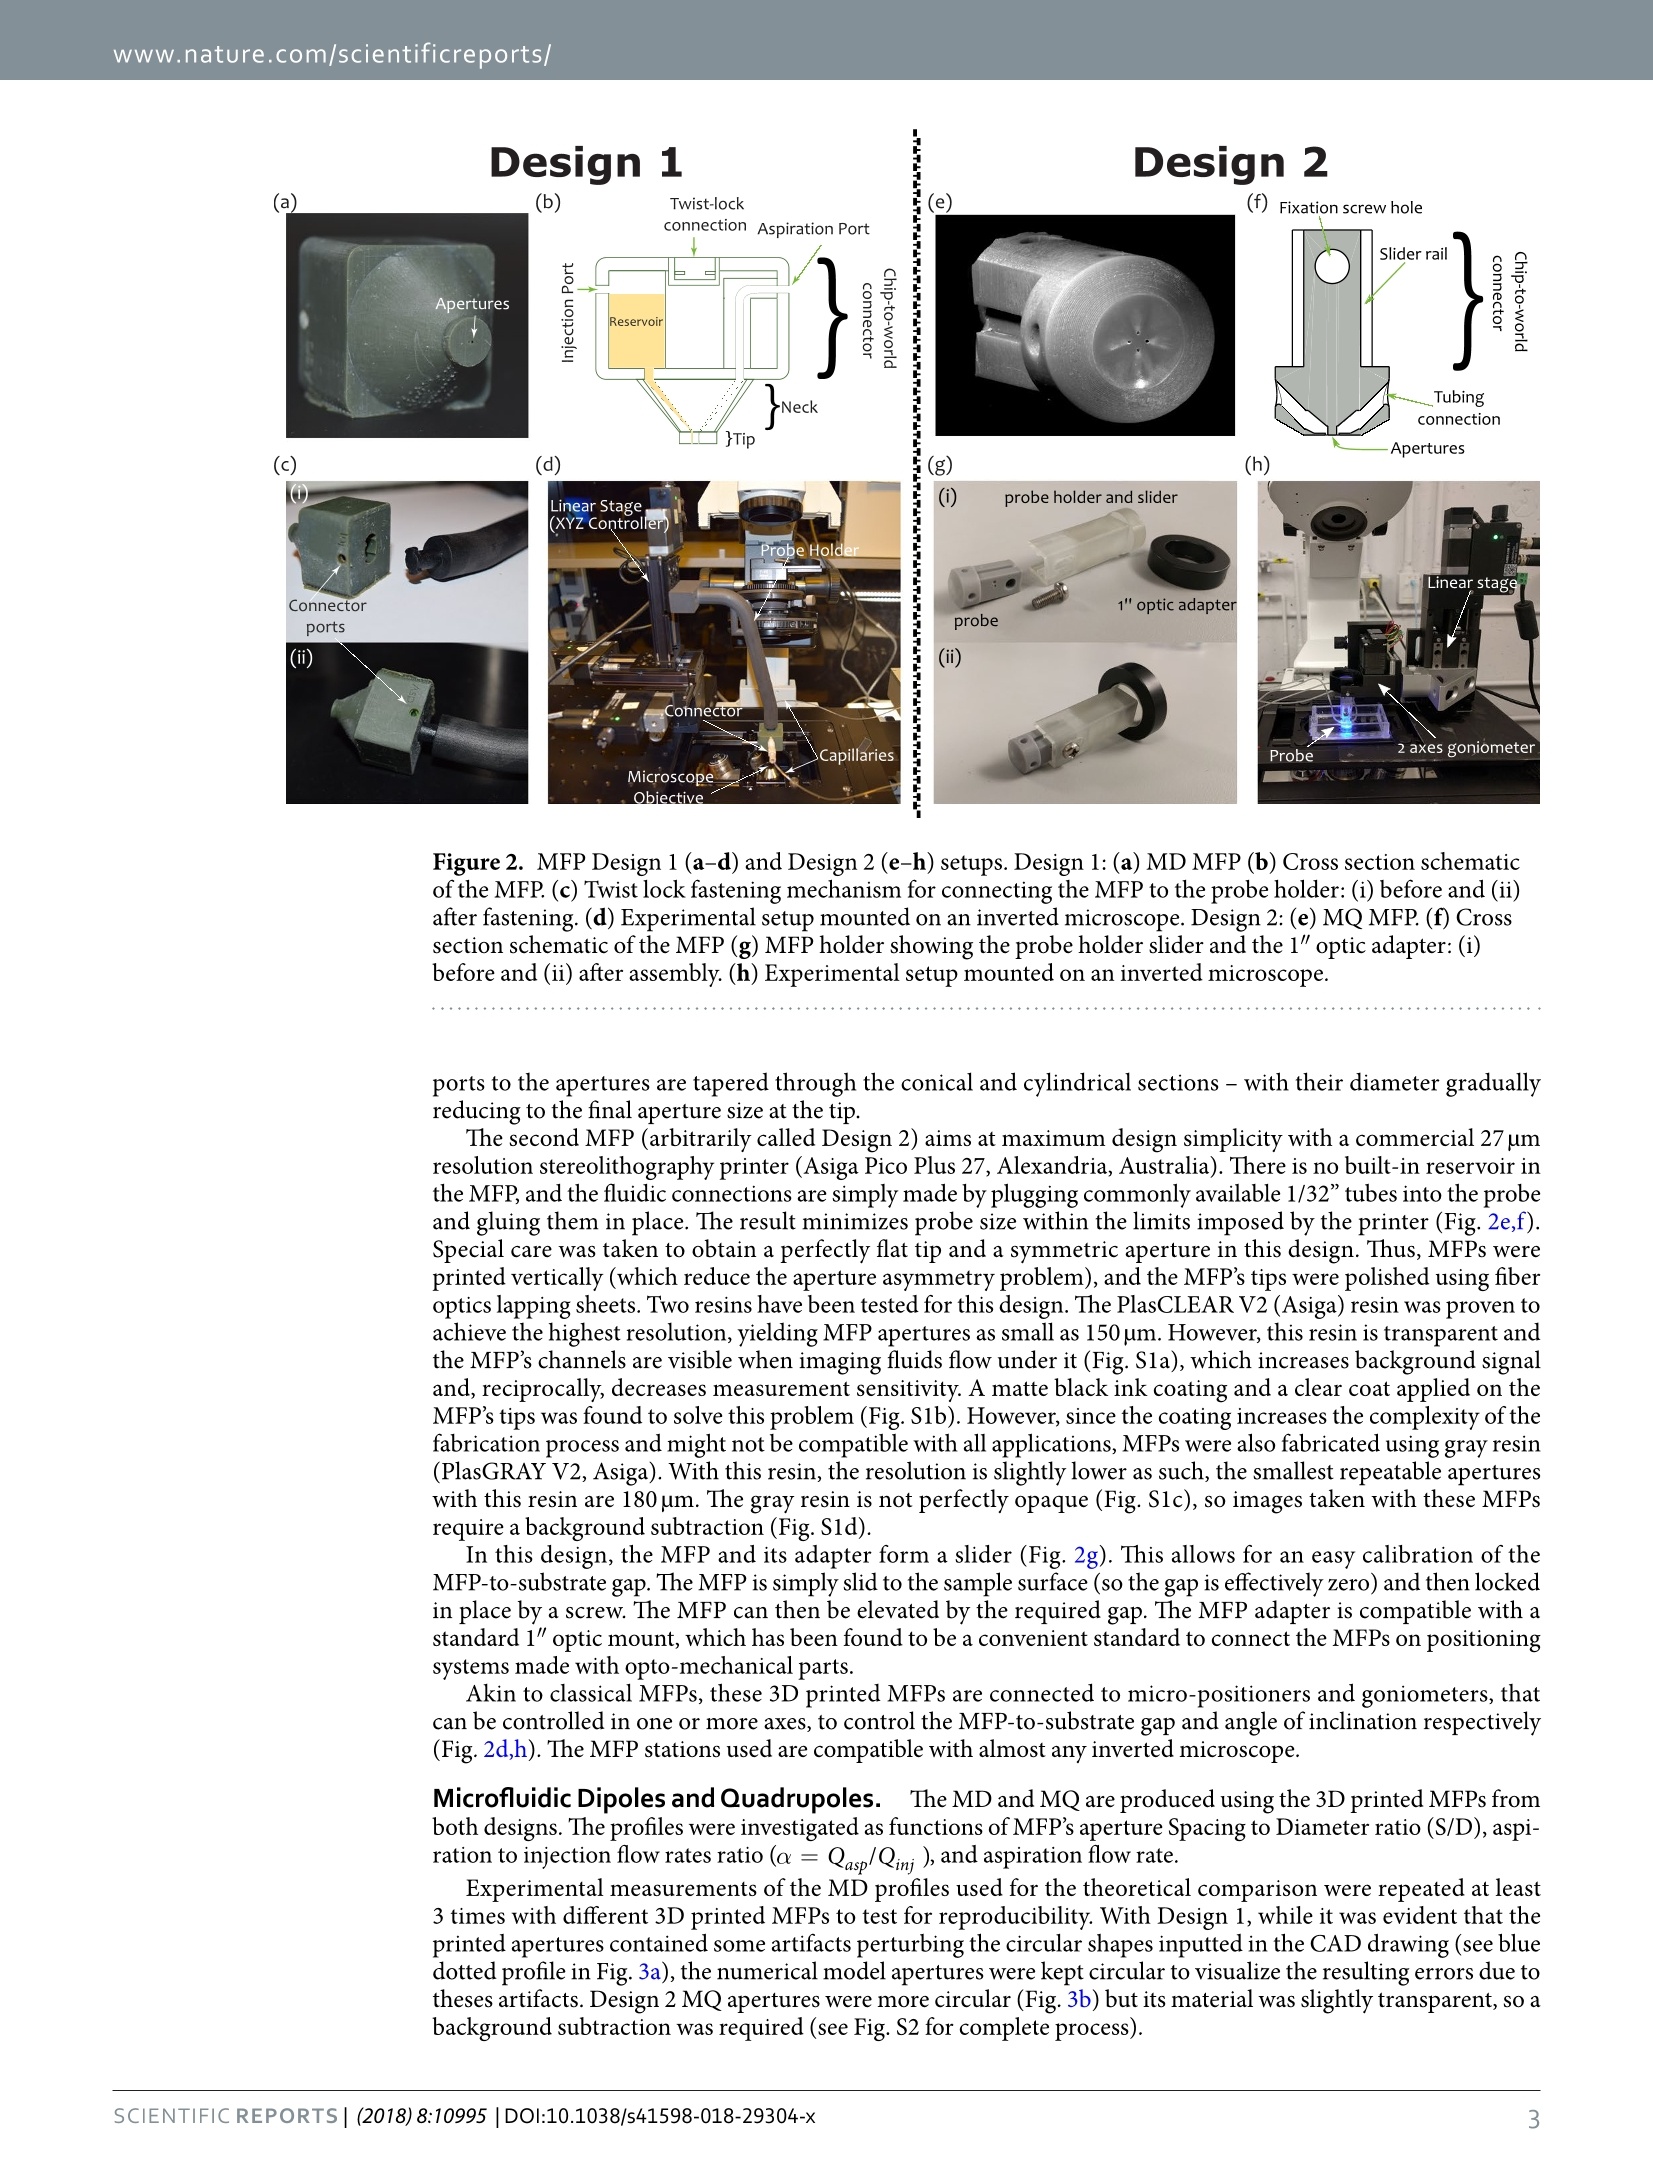
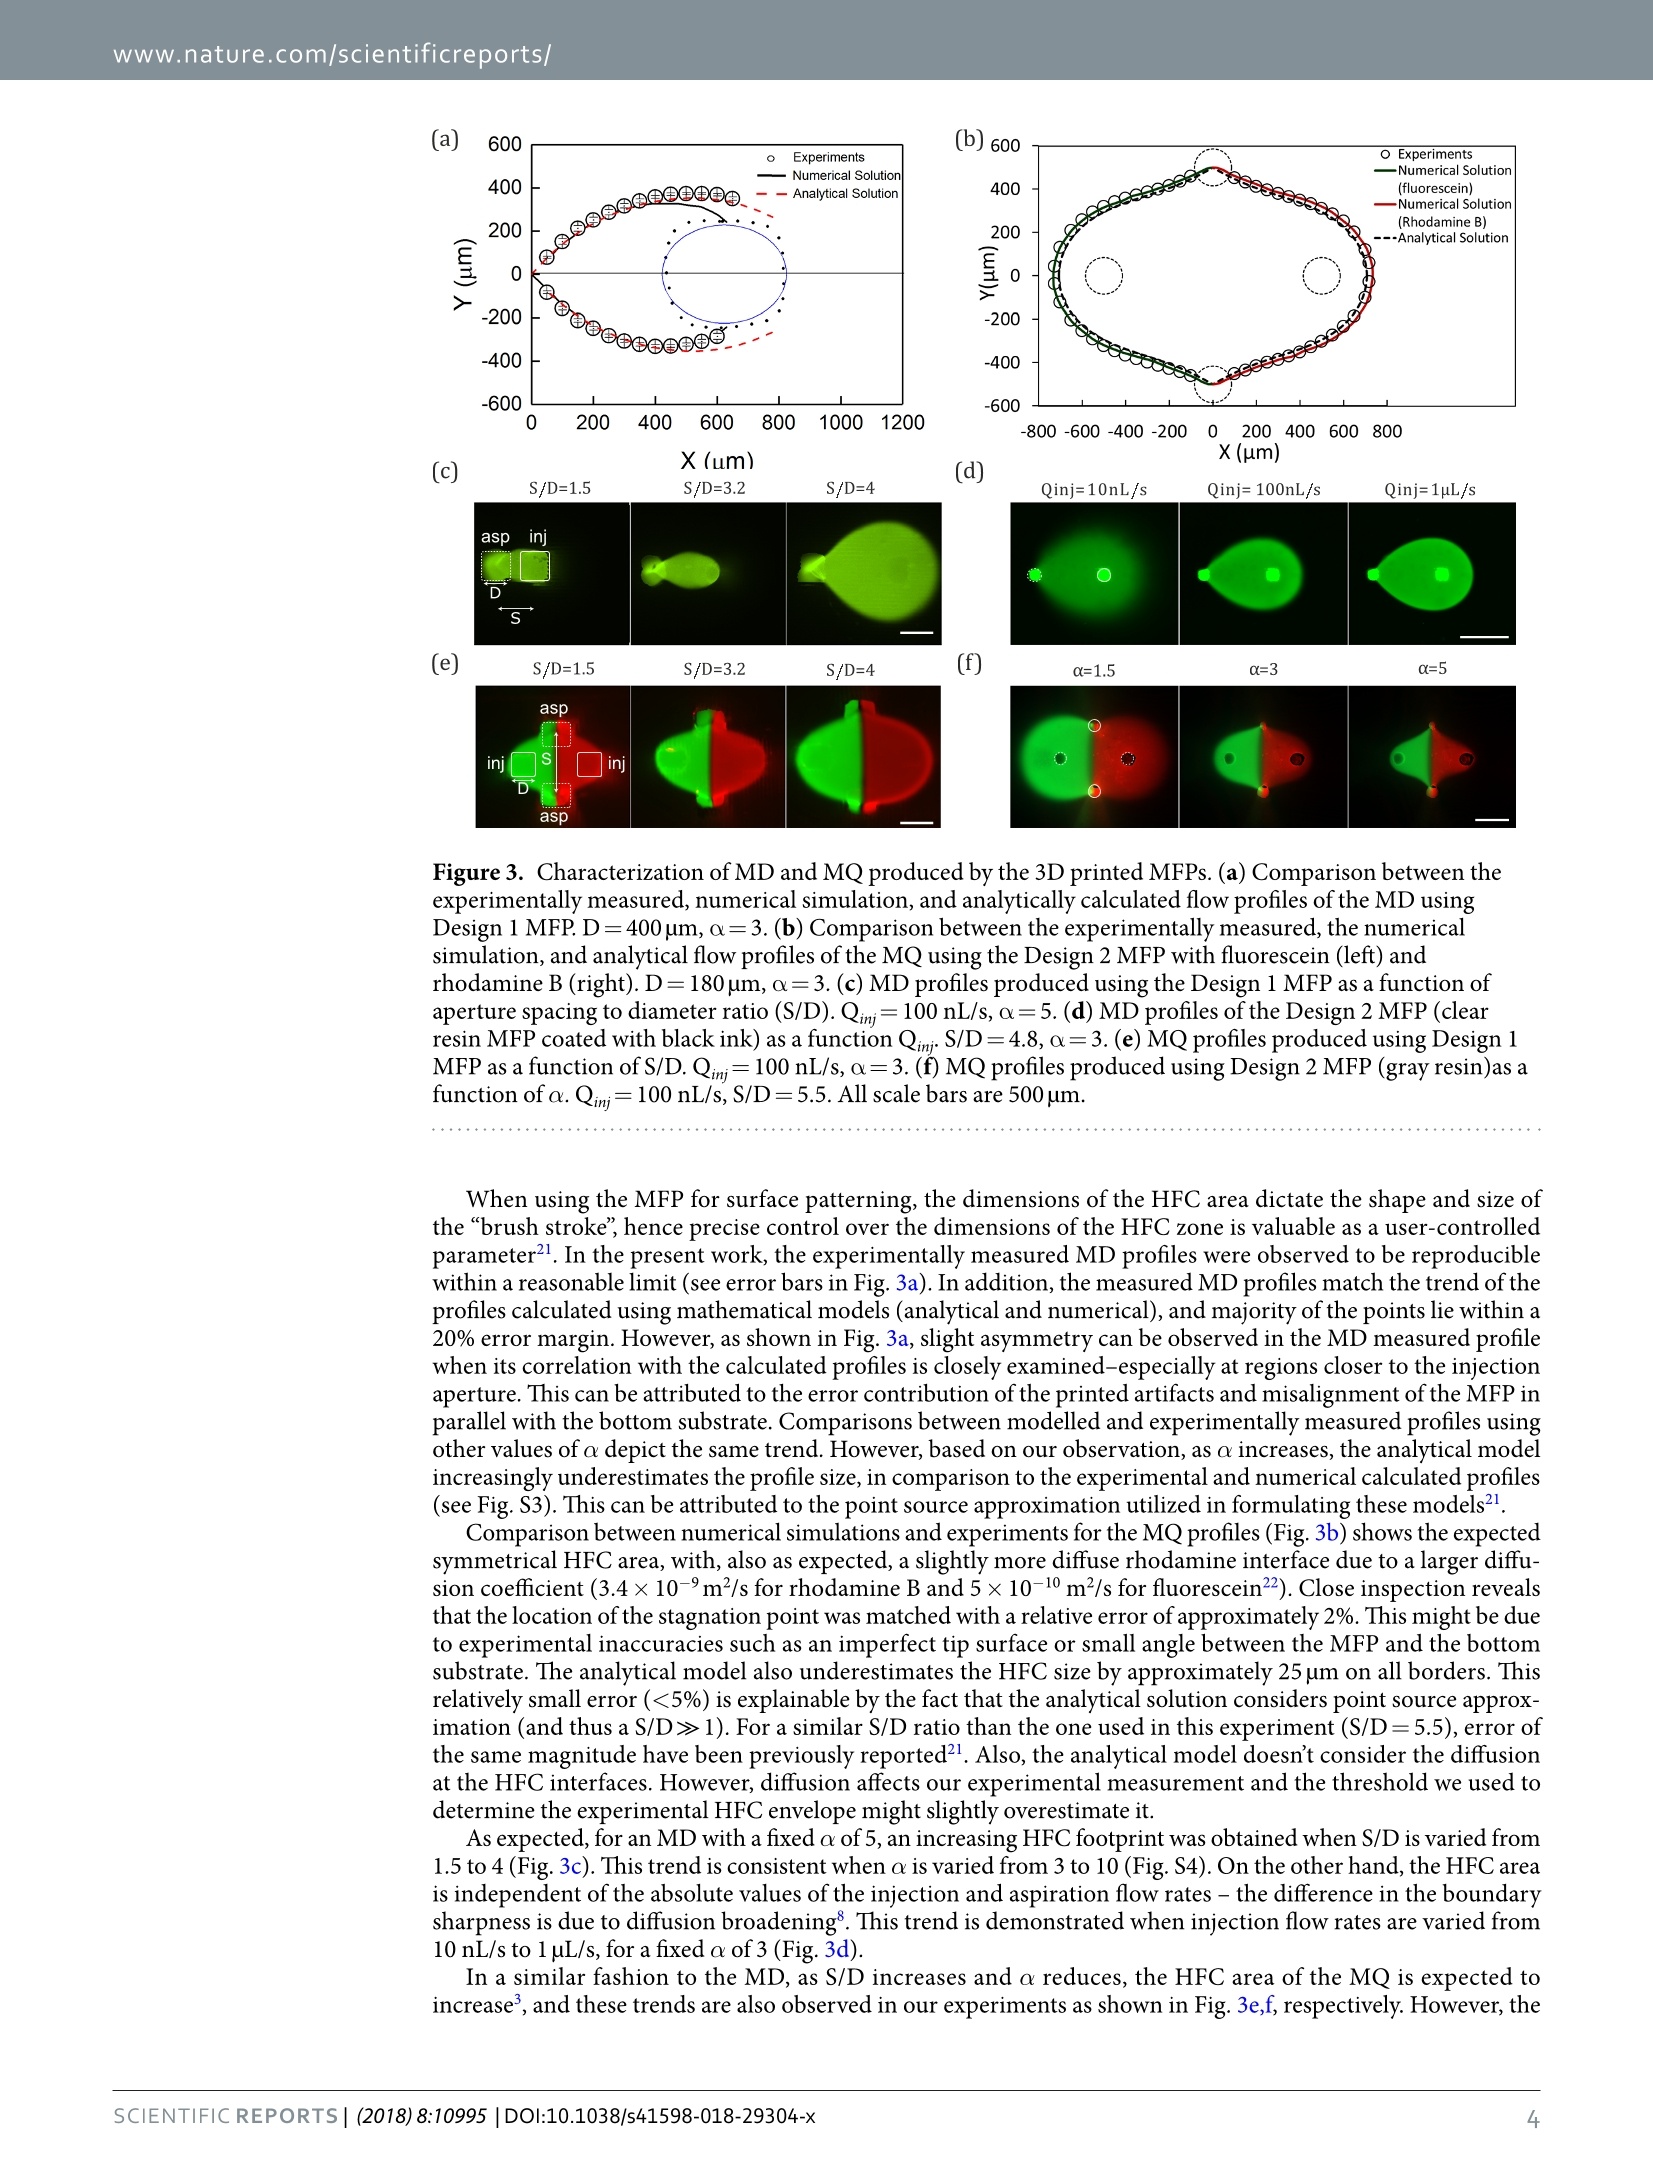
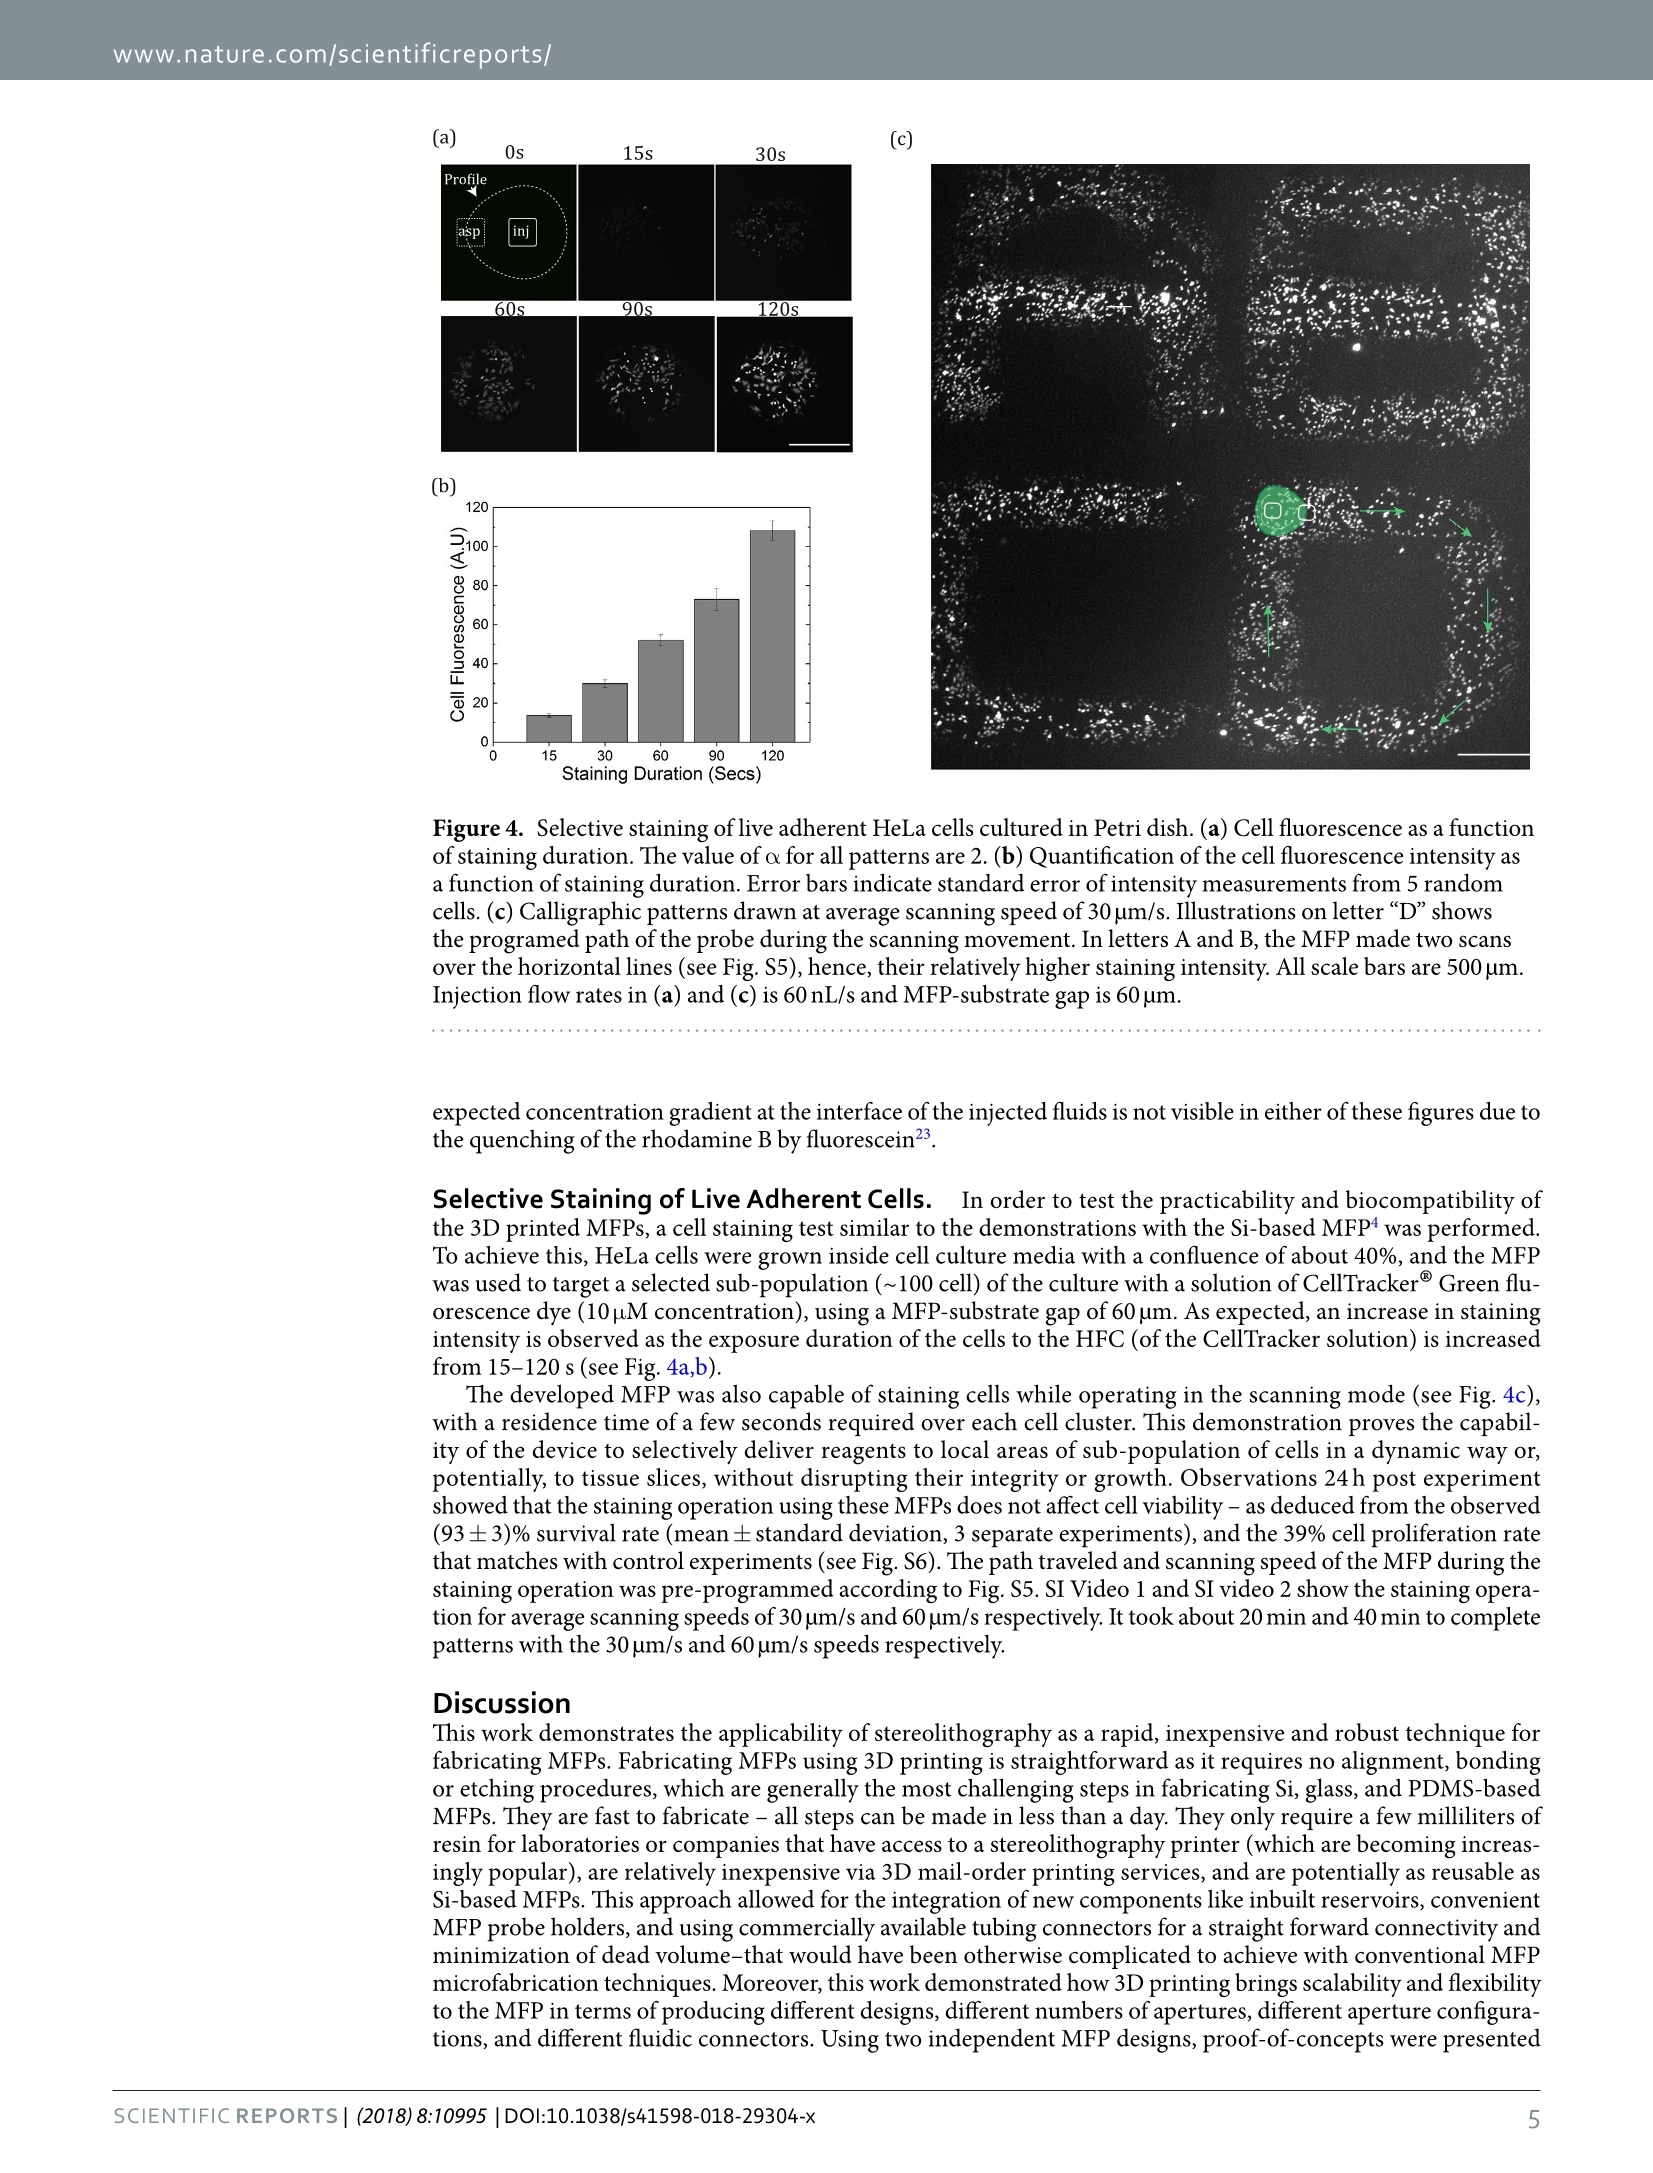
www.nature.com/scientificreports SCIENTIFIC REP :RTS OPEN3D Printed Microfluidic Probes Ayoola Brimmo1,2, Pierre-Alexandre Goyette3,Roaa Alnemaril,Thomas Gervais3,4,5 &Mohammad A. Qasaimeh(D12 Received: 16 April 2018 Accepted: 9 July 2018 Published online: 20 July 2018 In this work, we fabricate microfluidic probes (MFPs) in a single step by stereolithographic 3D printingand benchmark their performance with standard MFPs fabricated via glass or silicon micromachining.Two research teams join forces to introduce two independent designs and fabrication protocols,using different equipment. Both strategies adopted are inexpensive and simple (they only requirea stereolithography printer) and are highly customizable. Flow characterization is performed byreproducing previously published microfluidic dipolar and microfluidic quadrupolar reagent deliveryprofiles which are compared to the expected results from numerical simulations and scaling laws.Results show that, for most MFP applications, printer resolution artifacts have negligible impact onprobe operation, reagent pattern formation, and cell staining results. Thus, any research group witha moderate resolution (≤100 um) stereolithography printer will be able to fabricate the MFPs and usethem for processing cells, or generating microfluidic concentration gradients. MFP fabrication involvedglass and/or silicon micromachining, or polymer micromolding, in every previously published articleon the topic. We therefore believe that 3D printed MFPs is poised to democratize this technology. Wecontribute to initiate this trend by making our CAD files available for the readers to test our"print &probe"approach using their own stereolithographic 3D printers. The microfluidic probe (MFP) is a non-contact microfluidic system that combines the concepts of hydrodynamicflow confinement (HFC)' and scanning probes? to yield a dynamic microfluidic device that eliminates the needto perform analyses within closed conduits. It operates under the well-known Hele-Shaw cell approximation,whereby a quasi-2D stokes flow is generated between two parallel flat plates separated by an arbitrarily small ga一ap,nd has been previously demonstrated in the microfluidic dipole (MD) and microfluidic quadrupole (MQ) con-figurations (see Fig. la,b). The technology, developed about a decade ago, is now well established, and has sincethen been iteratively developed and used by several groups mostly to perform open surface reagent patterningoperations. Examples ofthe MFP's applicatons include patterning protein arrays on flat surfaces’, mammaliancell stimulation and manipulations3-5, localized perfusion of tissue slices, and generating floating concentra-tion gradients. Recently, the MD configuration of the MFP was proposed as a tissue lithography tool, where itallowed for retrospective studies on formalin-fixed paraffin-embedded tissue sections. On the other hand, theMQ configuration was lately applied as a tool for advanced cell chemotaxis studies 0, where it allowed for studyingcellular dynamics during migration in response to moving concentration gradients. The main advantage of the MFP is that it overcomes major limitations of conventional channel-based micro-fluidicsl1.12, such as high shear stress and tiny patterning areas, while allowing localized delivery of reagents forbiological applications13,14. Another major advantage ofthe MFP is its ability to pattern large, open planar surfacesusing conventional lab equipment (such as cells on Petri dishes)15. However, the potential of the MFP is still largely untapped in the life sciences due to several barriers16.17. Oneof this barrier is the fact that MFPs cannot be easily produced on demand due to their typically complex fabrica-tion procedures. For example, the technology was originally designed with a silicon tip and Polydimethylsiloxane(PDMS) chip-to-world connector, which requires bulk micromachining of the silicon chip, fabrication of thePDMS block using soft lithography or micro-molding techniques, alignment and assembly of the different layers,and separate machining of the probe holder. An attempt to standardize this fabrication procedure introducedthe glass-silicon hybrid vertical MFP (vMFP) concept, with a gasket-integrated probe holder for a more compactworld-to-chip interface. This technique has been demonstrated to be very effective in fabricating MFPs with allfluidic apertures placed along a straight line, and is currently one of the most commonly adopted. However, its 1Division of Engineering, New York University Abu Dhabi, Abu Dhabi, UAE. 2Department of Mechanical andAerospace Engineering, New York University, New York, USA. 3Institut de genie biomedical, Ecole Polytechniquede Montreal, Montreal, Canada.“Department of Engineering Physics, Ecole Polytechnique de Montreal, Montreal,Canada.5Centre de recherche du Centre Hospitalier de I'Universite de Montreal, Montreal,Canada. Ayoola Brimmoand Pierre-Alexandre Goyette contributed equally to this work. Correspondence and requests for materials should beaddressed to T.G. (email: thomas.gervais@polymtl.ca) orM.A.Q.(email: mohammad.qasaimeh@nyu.edu) asp asp iniasp in (a) (b) MFP MFP Solution Solution Tip Tip Substrate Substrate E A asp inj asp a:asp A A A B (c) Concentration Stagnation Point Gradient Design 1 Figure 1. 3D Printed MFPs. (a) MD configuration of the MFP and its operating principles. (b) MQ configurationof the MFP and its operating principles. (c) 3D printing fabrication steps for both designs of the MFP. procedure requires costly microfabrication facilities, implies wafer bonding steps, is difficult to implement forarbitrary aperture arrangements, and results in long prototyping cycles. The 3D printing technology, which isalready positively disrupting the development cycles of conventional microfluidic devices18.19, is poised to over-come these challenges.Not only does it afford a relatively seamless connectivity of several parts, it also offers astraightforward, simple, rapid, inexpensive, and yet robust methodology to manufacture these devices on demand(Fig.1c). More specifically, 3D printing of MFPs is highly customizable, and allows limitless designs and probeconfigurations. As opposed to the vMFP technology, any number of apertures can be printed in a single stepwithout imposing constrains on aperture positions or arrangments. In this work, we perform the first demonstration of 3D printed MFP operation by using two independentlydesigned chips. The side-by-side comparison approach adopted throughout this paper seeks to emphasize theflexibility and universality of 3D printed MFPs. Throughout, we highlight the benefits of the method as well asthe potential complications that may arise during the process, and present maneuvering strategies of such com-plications. By presenting two different designs that used different approaches and focused on different aspects,the objective is to show the different design and fabrication possibilities, and hint at the broad applicability usingvirtually any moderate to high resolution printers. To conclude, we validate the MFP’s effectiveness by performinga standard staining of living adherent cells in Petri dishes. Overall, this article aims to give guidelines that mightassist other research groups in 3D printing probes suitable for their own application. Results Design of 3D MFPs. Two independent MFP designs, printers and setups were used in fabricating the MDand MQ MFPs. Both designs have cylindrical tips and conical necks, while differing in their world-to-chip inter-face. The first MFP (arbitrarily called Design 1), as shown in Fig. 2a, was fabricated using a commercial 82 umresolution stereolithography printer (MicroPlus XL, EnvisionTEC GmbH, Gladbeck, Germany). This embod-iment incorporates inbuilt reservoirs to store injection liquids, a“twist-lock"fastening mechanism to connectthe MFP to a probe-holder fabricated in-house (also using a 3D printer), and ports that fit with commerciallyavailable tubing connectors (Fig. 2b). The inbuilt reservoir is located in the hollow square section, and serves asa more compact controlled storage environment for expensive samples. The twist-lock mechanism is inspired bythe GU24 lamp fitting20. To connect the MFP using this mechanism, the two pins on the probe holder are insertedinto the corresponding holes in the MFP and locked into place by twisting (Fig. 2c). The probe holder is thenmounted on the probe station, Fig. 2d. Ports for tubing connectors were integrated with the MFP to minimizedead volume and provide leak-free system without using glue or gaskets. The channels connecting the tubing Figure 2. MFP Design 1 (a-d) and Design 2(e-h) setups. Design 1: (a) MD MFP (b) Cross section schematicof the MFP. (c) Twist lock fastening mechanism for connecting the MFP to the probe holder: (i) before and (ii)after fastening. (d) Experimental setup mounted on an inverted microscope. Design 2: (e) MQ MFP. (f) Crosssection schematic of the MFP (g) MFP holder showing the probe holder slider and the 1"optic adapter: (i)before and (ii) after assembly. (h) Experimental setup mounted on an inverted microscope. ports to the apertures are tapered through the conical and cylindrical sections - with their diameter graduallyreducing to the final aperture size at the tip. The second MFP (arbitrarily called Design 2) aims at maximum design simplicity with a commercial 27 umresolution stereolithography printer (Asiga Pico Plus 27, Alexandria, Australia). There is no built-in reservoir inthe MFP, and the fluidic connections are simply made by plugging commonly available 1/32” tubes into the probeand gluing them in place. The result minimizes probe size within the limits imposed by the printer (Fig. 2e,f).Special care was taken to obtain a perfectly flat tip and a symmetric aperture in this design. Thus, MFPs wereprinted vertically (which reduce the aperture asymmetryproblem), and the MFP’s tips were polished using fiberoptics lapping sheets. Two resins have been tested for this design.The PlasCLEAR V2 (Asiga) resin was proven toachieve the highest resolution, yielding MFP apertures as small as 150 um. However, this resin is transparent andthe MFP's channels are visible when imaging fluids flow under it (Fig. Sla), which increases background signaland, reciprocally, decreases measurement sensitivity. A matte black ink coating and a clear coat applied on theMFP’s tips was found to solve this problem (Fig. S1b). However, since the coating increases the complexity of thefabrication process and might not be compatible with all applications, MFPs were also fabricated using gray resin(PlasGRAY V2, Asiga). With this resin, the resolution is slightly lower as such, the smallest repeatable apertureswith this resin are 180 um. The gray resin is not perfectly opaque (Fig.S1c), so images taken with these MFPsrequire a background subtraction (Fig. S1d). In this design, the MFP and its adapter form a slider (Fig. 2g). This allows for an easy calibration of theMFP-to-substrate gap. The MFP is simply slid to the sample surface (so the gap is effectively zero) and then lockedin place by a screw. The MFP can then be elevated by the required gap. The MFP adapter is compatible with astandard 1"optic mount, which has been found to be a convenient standard to connect the MFPs on positioningsystems made with opto-mechanical parts. Akin to classical MFPs, these 3D printed MFPs are connected to micro-positioners and goniometers, thatcan be controlled in one or more axes, to control the MFP-to-substrate gap and angle of inclination respectively(Fig.2d,h). The MFP stations used are compatible with almost any inverted microscope. Microfluidic Dipoles and Quadrupoles. The MD and MQ are produced using the 3D printed MFPs fromboth designs. The profiles were investigated as functions of MFP’s aperture Spacing to Diameter ratio (S/D),aspi-ration to injection flow rates ratio (a=Q/Qini),and aspiration flow rate. Experimental measurements of the MD profiles used for the theoretical comparison were repeated at least3 times with different 3D printed MFPs to test for reproducibility. With Design 1, while it was evident that theprinted apertures contained some artifacts perturbing the circular shapes inputted in the CAD drawing (see bluedotted profile in Fig. 3a), the numerical model apertures were kept circular to visualize the resulting errors due totheses artifacts. Design 2 MQ apertures were more circular (Fig.3b) but its material was slightly transparent, so abackground subtraction was required (see Fig. S2 for complete process). (a) 600 (b) 600 o Experiments O Experiments Numerical Solution -Numerical Solution 400 inj inj asp Figure 3. Characterization of MD and MQ produced by the 3D printed MFPs. (a) Comparison between theexperimentally measured, numerical simulation, and analytically calculated flow profiles ofthe MD usingDesign 1 MFP. D=400um,a=3. (b) Comparison between the experimentally measured, the numericalsimulation, and analytical flow profiles of the MQ using the Design 2 MFP with fluorescein (left) andrhodamine B (right). D=180 um, a=3.(c) MD profiles produced using the Design 1 MFP as a function ofaperture spacing to diameter ratio (S/D). Qini=100 nL/s, α=5. (d) MD profiles of the Design 2 MFP (clearresin MFP coated with black ink) as a function Qim.S/D=4.8,α=3.(e) MQ profiles produced using Design 1MFP as a function of S/D. Qini=100 nL/s, a=3. (f) MQ profiles produced using Design 2 MFP (gray resin)as afunction of a. Qinj=100 nL/s, S/D=5.5. All scale bars are 500 um. When using the MFP for surface patterning, the dimensions of the HFC area dictate the shape and size ofthe“brush stroke”, hence precise control over the dimensions of the HFC zone is valuable as a user-controlledparameter. In the present work, the experimentally measured MD profiles were observed to be reproduciblewithin a reasonable limit (see error bars in Fig. 3a). In addition, the measured MD profiles match the trend of theprofiles calculated using mathematical models (analytical and numerical), and majority of the points lie within a20% error margin. However, as shown in Fig. 3a, slight asymmetry can be observed in the MD measuredprofilewhen its correlation with the calculated profiles is closely examined-especially at regions closer to the injectionaperture. This can be attributed to the error contribution of the printed artifacts and misalignment of the MFP inparallel with the bottom substrate. Comparisons between modelled and experimentally measured profiles usingother values of a depict the same trend. However, based on our observation, as a increases, the analytical modelincreasingly underestimates the profile size, in comparison to the experimental and numerical calculated profiles(see Fig. S3). This can be attributed to the point source approximation utilized in formulating these models. Comparison between numerical simulations and experiments for the MQ profiles (Fig. 3b) shows the expectedsymmetrical HFC area, with, also as expected, a slightly more diffuse rhodamine interface due to a larger diffu-sion coefficient (3.4×10-m²/s for rhodamine B and5×10-10 m²/s for fluorescein22). Close inspection revealsthat the location of the stagnation point was matched with a relative error of approximately 2%. This might be dueto experimental inaccuracies such as an imperfect tip surface or small angle between the MFP and the bottomsubstrate. The analytical model also underestimates the HFC size by approximately 25 um on all borders. Thisrelatively small error (<5%) is explainable by the fact that the analytical solution considers point source approx-imation (and thus a S/D>1). For a similar S/D ratio than the one used in this experiment (S/D=5.5), error ofthe same magnitude have been previously reported2. Also, the analytical model doesn’t consider the diffusionat the HFC interfaces. However, diffusion affects our experimental measurement and the threshold we used todetermine the experimental HFC envelope might slightly overestimate it. As expected, for an MD with a fixed a of 5, an increasing HFC footprint was obtained when S/D is varied from1.5 to 4 (Fig. 3c). This trend is consistent when a is varied from 3 to 10 (Fig. S4). On the other hand, the HFC areais independent of the absolute values of the injection and aspiration flow rates - the difference in the boundarysharpness is due to diffusion broadening8. This trend is demonstrated when injection flow rates are varied from10 nL/s to 1 uL/s, for a fixed a of 3(Fig. 3d). In a similar fashion to the MD, as S/D increases and a reduces, the HFC area of the MQ is expected toincrease, and these trends are also observed in our experiments as shown in Fig. 3e,f,respectively. However, the (c) (b) Staining Duration (Secs) Figure 4. Selective staining of live adherent HeLa cells cultured in Petri dish. (a) Cell fluorescence as a functionof staining duration. The value of o for all patterns are 2. (b) Quantification of the cell fluorescence intensity asa function of staining duration. Error bars indicate standard error of intensity measurements from 5 randomcells. (c) Calligraphic patterns drawn at average scanning speed of 30 um/s. Illustrations on letter “D”showsthe programed path of the probe during the scanning movement. In letters A and B, the MFP made two scansover the horizontal lines (see Fig.S5), hence, their relatively higher staining intensity. All scale bars are 500 umInjection flow rates in (a) and (c) is 60 nL/s and MFP-substrate gap is 60 um. expected concentration gradient at the interface ofthe injected fluids is not visible in either of these figures due tothe quenching of the rhodamine B by fluorescein23. Selective Staining of Live Adherent Cells.In order to test the practicability and biocompatibility ofthe 3D printed MFPs, a cell staining test similar to the demonstrations with the Si-based MFP4 was performed.To achieve this, HeLa cells were grown inside cell culture media with a confluence of about 40%, and the MFPwas used to target a selected sub-population (~100 cell) ofthe culture with a solution of CellTracker@ Green flu-orescence dye (10pM concentration), using a MFP-substrate gap of 60 um. As expected, an increase in stainingintensity is observed as the exposure duration of the cells to the HFC (of the CellTracker solution) is increasedfrom 15-120 s (see Fig. 4a,b). The developed MFP was also capable of staining cells while operating in the scanning mode (see Fig. 4c),with a residence time of a few seconds required over each cell cluster. This demonstration proves the capabil-ity of the device to selectively deliver reagents to local areas of sub-population of cells in a dynamic way or,potentially, to tissue slices, without disrupting their integrity or growth. Observations 24h post experimentshowed that the staining operation using these MFPs does not affect cell viability - as deduced from the observed(93±3)% survival rate (mean±standard deviation, 3 separate experiments), and the 39% cell proliferation ratethat matches with control experiments (see Fig. S6). The path traveled and scanning speed of the MFP during thestaining operation was pre-programmed according to Fig. S5. SI Video 1 and SI video 2 show the staining opera-tion for average scanning speeds of 30 um/s and 60um/s respectively. It took about 20 min and 40 min to completepatterns with the 30 um/s and 60 um/s speeds respectively. Discussion This work demonstrates the applicability of stereolithography as a rapid, inexpensive and robust technique forfabricating MFPs. Fabricating MFPs using 3D printing is straightforward as it requires no alignment, bondingor etching procedures, which are generally the most challenging steps in fabricating Si, glass, and PDMS-basedMFPs. They are fast to fabricate- all steps can be made in less than a day. They only require a few milliliters ofresin for laboratories or companies that have access to a stereolithography printer (which are becoming increas-ingly popular), are relatively inexpensive via 3D mail-order printing services, and are potentially as reusable asSi-based MFPs. This approach allowed for the integration of new components like inbuilt reservoirs, convenientMFP probe holders, and using commercially available tubing connectors for a straight forward connectivity andminimization of dead volume-that would have been otherwise complicated to achieve with conventional MFPmicrofabrication techniques. Moreover, this work demonstrated how 3D printing brings scalability and flexibilityto the MFP in terms of producing different designs, different numbers of apertures, different aperture configurations, and different fluidic connectors. Using two independent MFP designs, proof-of-concepts were presented in the form of developing MDs, MQs, and selective labeling of adherent live cells within their culture medium ina“writing”mode. The MD and MQ profiles produced by the 3D printed MFPs closely matched numerical andanalytical calculations - the same way micromachined MFPs do - thus confirming similarities in their accuracies.Furthermore, cell staining applications were demonstrated, which validate the applicability of the 3D printedMFPs in performing bioassays. The use of affordable 3D printing in this field, however, comes with some drawbacks: (1) the current reso-lution of the affordable 3D printers limits the minimum aperture sizes ofMFPs. However, this didn’t affect thecapability of presented MFPs to target cluster of tens of cells and generate concentration gradients at resolutionssimilar to the original MQ8.10. (2) The printed MFPs contained some unavoidable channel artifacts - one designmore than the other - that had minor effect on the accuracy of the produced profiles. However, with 3D printingtechnology currently undergoing intense development to bring down costs and increase resolution, these limitsare expected to be continuously pushed back as new generations of 3D printers come to the market. In the case anMFP is required for an application that requires a single cell resolution, the same technology discussed here canbe adapted to more advanced 3D printers capable of printing 3D nanostructures, such as those involving directlaser writing and two-photon polymerization technologies24,25. (3) Biocompatibility of the polymers and resinsused in SLA is still a concern for applications where cells are directly cultured on the device26. However, in thecase of MFPs, cells are cultured in Petri dishes, or microtiter plates, and are never in contact with the 3D printeddevice, which limit the biocompatibility problem. Furthermore, research on new post-processing and sterilizationtechniques, and on biocompatible resin formulation, have been demonstrated to reduce protein adsorption andimprove long-term cell viability after experiments with 3D printed materials27-29. The HFC concept behind the MD and MQ have numerous potential applications, which could become evenmore accessible to the research community with this new fabrication strategy, lessons learned from our experi-ments, and the presented proof of its practical applicability. By demonstrating the simplicity and customizabilityof 3D printed MFPs, we believe that the technology will help spread the concept outside microfabrication lab-oratories and make its potential and versatility as an open reagent delivery tool directly available to life-sciencelaboratories. To support this assertion, all CAD and stl files used to print the above designs are made available (seeSupplementary Material) for any stereolithographic 3D printer owner to test. Materials and Methods 3D printing of MFPs.. Design 1: Designs were performed using a commercial CAD software (SolidWorks)and the MFPs were printed using a commercially available stereolithographic 3D printer (MicroPlus XL,EnvisionTEC GmbH, Gladbeck, Germany). The printer has a labeled XY resolution of 82 um, and Z resolutionof 25 um but our parametric study with this specific MFP design showed that the minimum diameter resolutionfor repeatable 3D channels is 250 um using a polymeric resin (HTM 140 resin, EnvisionTEC GmbH, Gladbeck,Germany). After printing, the chip was washed with ethanol, placed in a UV flood light curing system for 2 minand then washed again with DI water. The MFP holder was separately 3D printed (Dimensions SST 1200es 3DPrinter, Stratasys,Minnesota,US). Design 2: Designs were made using Catia v5 (Dassault Systeme, Velizy-Villacoublay, France) while abidingby two rules to minimize the risk of aperture clogging: 1) the length of apertures was kept the smallest possible(max 3 print layer long, 150 um) and 2) aperture size was kept over 6 printer’s pixel size (160 um). The MFPs wereprinted using an Asiga freeform Pico with a resolution of 27 um (Asiga, Alexandria, Australia). The resins usedwere PlasCLEAR V2 and PlasGRAY V2 (Asiga). MFPs were briefly soaked in an isopropanol bath to removeuncured resin. To thoroughly clean the microchannels, the MFPs were then put in an isopropanol bath in a soni-cator (Branson, Danburry, USA) for 20 minutes. Thereafter, MFPs were post-cured with UV light for 15 minutesto fully harden (Pico flash, Asiga). MFPs were designed to fit widely available 1/16"O.D. tubing. Tygon tubes(Cole Parmer, Vernon Hills, USA) were plugged in the MFP and glued with cyanoacrylate glue. To insure noglue would enter inside the MFP apertures and tubing, each tube was filled with water during this step. MFP tipswere manually polished using fiber optic lapping sheets (Thorlabs, Newton,USA). Sheet with 5 um, 3 um, 1 umand 0.3 um grits were used consecutively. Water was injected with the MFP's apertures after each polishing stepsto make sure no polishing residues would clog the apertures. MFPs made with clear resin were coated with blackink (black Indian ink, Winsor & Newton, London, UK) using an airbrush. A layer of aerosol clear coat (Protectiveclear coat finish, Dupli-color, Cleveland, USA) was then sprayed on the tip. ExperimentalCharacterizations. To characterize the MD and MQ, the MFP was positioned above a Petridish or a microscope slide with custom walls (depending on the design) located on the stage of an invertedmicroscope. Upon aligning the MFP with the objective of the microscope, the Z stage (X-LRM, Zaber, Vancouver,Canada) is used to slowly approach the substrate. When the MFP contacts the substrate, it is then lifted by therequired gap-height to produce the Hele-Shaw two parallel plates configuration. The Design 1 MFPs were visual-ized using the Epi-fluorescence inverted ECLIPSE Ti microscope (NIKON,Tokyo,Japan), and images were cap-tured using the DS-Qi2 camera (NIKON). Design 2 MFPs were visualized and imaged using the epi-fluorescenceinverted microscope Axio Observer.Z1 (Zeiss, Oberkochen, Germany) and the LaVision imager sCMOS cam-era (LaVision, Gottingen, Germany). MD images were taken by injecting a solution of dissolved green fluores-cein sodium salt (C20H1 NazOs) (Sigma Aldrich, Saint-Louis, USA). For the MQ, a solution of Rhodamine B(C28HClNzO3) (Sigma Aldrich) was injected through the second injection aperture. Injection and aspirationwere driven using the MFCS@-EZ microfluidic pressure pump (Fluigent, Kremlin-Bicetre, France) or by theneMESYS high precision syringe pump (CETONI, Korbufen, Germany) depending on the design used. Imagesof the profiles created by fluorescein and rhodamine B solutions were captured using their respective microscope'sfluorescent filter cubes, and then combined using Image J (Design 1) (National Institutes of Health Maryland) andMATLAB (Design 2). For Design 2 MQ,a background image was subtracted on both fluorescein and Rhodamine B channels before they were merged in a single image. The background used corresponds to an image of theMFP with injection or aspiration turned off. To deduct the diffusion region from the overall profile, we used the“Minimum Threshold"function in ImageJ, which was derived from the thresholding technique adapted in ref-erence30. Profiles were then traced out using a plot digitizer (GNU Library). For the dipole characterization, theexperiment was repeated with at least 3 different MFPs per profile to test reproducibility. The dimensions for eachinterval was averaged to produce the final plot with standard error estimates used as the error bars. Numerical Modeling. The 3D numerical models of the MD and MQ were developed using finite elementsimulations (COMSOL Multiphysics@v.5.2. COMSOL AB, Stockholm,Sweden). The solutions were obtainedusing a direct and stationary solver to compute the Navier-Stokes equation (laminar and no-slip wall conditions) coupled with the convection-diffusion equations.MFPs were modeled as circular surfaces with inlets andoutlets that correspond to the apertures. Dimensions used were those of the designed MFPs. Water was consid-ered incompressible with a density of 998.2kg/mand a dynamic viscosity of 0.001N-s/m. Diffusion coefficientsused were 0.5×10-m²/s for fluorescein and 3.4×10-m²/s for rhodamine B, which correspond to the diffusioncoefficients of these fluorophores in water. The boundary conditions at the flow domain's perimeter sides wereset as a pressure outlet with atmospheric conditions, and no slip condition was selected for the MFP tip and thesubstrate surface. The experimental values were used for injection and aspiration volume flow rates. For theconvection-diffusion equations, a zero-inward flux was set at the perimeter of the flow domain.The numericalsolution of the MQ was computed for fluorescein and rhodamine separately and then superposed. The samemethodology was used to deduct the diffusion region from the experimentally measured profile (thresholdingand profile tracing) was used on the numerical simulation result. Analytical Modeling.Exact solutions for the MD HFC profiles under the point source aperture approxima-tion are defined by the streamline obeying the following equation2: wherexand y are defined as 2x/S and 2y/S respectively (see schematic description of a, x, y and S in Fig. 3). Thisresult was obtained by deducing the stream function for MD and then finding the equation for the streamlinepassing by the stagnation point. Using the same method, the MQ's HFC area was determined using the streamfunction and the stagnation point for the MQ. This yields the equation: These equations consider only the streamline, and thus, neglects diffusion. The variables in the equation can-not be separated hence, for each value ofx, values ofy were calculated using WolframAlpha (Design 1) andMATLAB (Design 2). Selective cell labeling. HeLa cells (ATCC, VA) were cultured in sterile Petri Dishes (Thermo Scientific)in Dulbecco's Modified Eagle Medium (DMEM) supplemented with 10% FBS, 100U/mL penicillin, 100pg/mLstreptomycin and 0.2 mM L-glutamine (Invitrogen, MA) at 37°C and 5% CO,. Dishes were left in the incubatoruntil the time of the experiment. CellTracker Green BODIPY (Thermo Fisher Scientific) diluted in PBS bufferwith a final concentration of 10pM/mL. The solution was then mixed with fluorescein sodium salt (final concen-tration of 1 mg/mL) for visualizing the HFC using the microscope. The solution was then loaded into the MFP'sreservoir - by suction through the aperture of the MFP - and the MFP was positioned above the cell culturewith a MFP-substrate gap of 60 um. Monitoring of the cells' exposure time was performed using a stopwatch.The calligraphic labeling was performed by programming (C#) the XY stage movements in the Zaber scriptingenvironment. The spacing between each letter was achieved by rapid movement of the stages (~29 mm/s), fromthe end of one letter to the beginning of the other letter (See Supplementary Video 1,and SI 2). MFPs used with cells were sterilized by soaking in 99% ethanol for 24h. Washing with DI water, and curing,were then repeated and followed by soaking in DMEM for 12 h. Before preparing cell dishes used for the cellviability experiment, marks were randomly made at the bottom of the culture plates to ensure traceability ofthe target region. Cell viability was estimated by applying NucGreen Dead Cell Indicator (2 drops/mL of cellmedium) to the cell culture dish already exposed to the HFC from the MFP. As control, a cell dish prepared withthe same cell confluence as the processed dish, was kept in the incubator for the duration of the experiment andalso processed with the NucGreenM Dead Cell Indicator (Thermo Scientific) after 24 h. Counting of cells toevaluate death rate (number of dead cells after 24h/total number of cells before experiment), was done manuallyusing the ImageJ“Multi-Point"feature. References 1. Ainla, A., Jeffries, G. & Jesorka, A. Hydrodynamic flow confinement technology in microfluidic perfusion devices. Micromachines3(2),442-461(2012). 2. Quate, C. Scanning probes as a lithography tool for nanostructures. Surface Science 386(1-3), 259-264(1997). 3. Juncker, D., Schmid, H.& Delamarche, E. Multipurpose microfluidic probe. Nature Materials 4(8), 622-628(2005).p9 4. Kaigala, G., Lovchik, R., Drechsler, U. & Delamarche, E. A vertical microfluidic probe. Langmuir 27(9), 5686-5693 (2011). 5. Sarkar, A., Kolitz, S., Lauffenburger, D. & Han,J. Microfluidic probe for single-cell analysis in adherent tissue culture. Naturecommunications 5, 3421 (2014). ( 6. Queval, A. e t al. Chamber and microfluidic probe for m i croperfusion of organotypic brain slices. Lab on a Chip 10(3), 326-33 4 (2010). ) 7. Cors,J., Lovchik, R.,Delamarche, E. & Kaigala, G. A compact and versatile microfluidic probe for local processing of tissue sectionsand biological specimens. Review of Scientific Instrument 85(3),034301 (2014). T818. Qasaimeh,M., Gervais, T. & Juncker, D. Microfluidic quadrupole and floating concentration gradient. Nature communications 2,464(2011). ( 9. Cors, J., Kashyap, A., Khartchenko, A., Schraml, P . & Kaigala, G. Tissue lithography: M i croscale dewaxing to enable retrospective s tudies on formalin-fixed p a raffin-embedded (FFPE) tissue sections. PloS one 12(5), e01 7 6691(2017 ) . ) 10. Qasaimeh,M., Pyzik, M., Astolfi, M., Vidal, S., & Juncker, D. Neutrophil chemotaxis in moving gradients. Advanced Biosystems,1700243(2018). ( 11. Squires, T. & Quake, S. Microfluidics: Fluid physics at the nanoliter scale. Reviews ofmodern physics 77(3), 977 (2005) ) 12. Whitesides, G. The origins and the future of microfluidics. Nature 442(7101), 368-373 (2006). ( 13. Wheeler,A. et al. Microfluidic device for single-cell analysis. Analytical Chemistry 75(14),3581-3(2003). ) ( 14. Y in, H. & M a rshall, D. Microfluidics for single cell analysis. C u rrent op i nion in bi o technology 23(1),110-119(2012). ) ( 15. Brimmo, A. & Qasaimeh, M. Microfluidic Probes and Quadrupoles: A new era of open microfluidics. IEEE Nanotechnology Magazine 11(1), 20-31(2017). ) ( 16. Qasaimeh, M., Ri c oult, S. & Juncker, D. Microfluidic probes for use in life sciences and medicine. Lab on a Chip13(1), 40-50(2013). ) ( 17. Brimmo, A. & Qasaimeh, M. Stagnation point flows i n analytical chemistry and life sciences. RSC Advances, 7(81),51206-51232 (2017). ) ( 18. Ho, C., Ng, S., Li, K. & Yoon, Y. 3D printed microfluidics for biological application s . Lab on a Chip 15(18), 3627-3637 (2015). ) ( 19. Au, A., Huynh, W., Horowitz, L. & Folch, A. 3D-printed microfluidics. Angewandte Chemie International Edition 55(12), 3862-3881(2016). ) 20. Tufano, A., Noest, M., Levin, E. & Richter, J. Ceiling lamp holder to accept a non-incandescent lamp. (Washington, DC: U.S. Patent7,712,949,11 May, 2010). 21. Safavieh, M., Qasaimeh, M., Vakil, A., Juncker, D. & Gervais, T. Two-Aperture Microfluidic Probes as Flow Dipoles: Theory andApplications. Scientific reports 5,11943 (2015). ( 22. R ani,S., Pitts, B. & Stewart, P. Rapid Diffusion of Fluorescent Tracers into Staphylococcus epidermidis Biofilms Visualized by Time L apse Microscopy.An t imicrob. Agents Chemother 49(2), 728-732 (2005). ) ( 23. Setiawan, D., Kazaryan,A., Martoprawiro, M. & Filatov, M. A first principles study of f l uorescence quenching in rhodamine B . dimers: how can quenching occur in dimeric species? Physical Chemistry Chemical Physics 12(37),1 1 238-11244(2010). ) 24. ThIel, M. & Hermatschweiler, M. Three-dimensional laser lithography. Optik e Photonik 6(4), 36-39 (2011). ( 25. Selimis, A., Mironov, V. & Farsari, M. Direct laser writing: Principles and materials for scaffold 3D printing. MicroelectronicEngineering 132,83-89(2015). ) 26. Chia, H. & Wu, B. Recent advances in 3D printing of biomaterials. Journal of biological engineering 9(1), 4(2015). 27. Zhu, F, Macdonald, N., Cooper,J., Wlodkowic, D. Additive manufacturing of lab-on-a-chip devices: promises and challenges" In InMicro/Nano Materials, Devices, and Systems (Vol.8923), p. 892344 (International Society for Optics and Photonics, 2013) 28. Urrios, A. et al. 3D-printing of transparent bio-microfluidic devices in PEG-DA. Lab on a Chip 16(12), 2287-2294(2016). 29. Rogers, C., Pagaduan,J.,Nordin, G. & Woolley, A. Single-Monomer Formulation of Polymerized Polyethylene Glycol Diacrylate as a Nonadsorptive Material for Microfluidics. Analytical Chemistry 83(16), 6418-6425 (2011). 30. Prewitt, J. & Mendelsohn, M. The analysis of cell images. Annals ofthe New York Academy of Sciences 128, 1035-1053(1966). Acknowledgements A.B. acknowledges NYUAD Global PhD Fellowship. P.A.G. acknowledges funding from a FRQ graduatefellowship. A.B. and M.A.Q. acknowledge technical support from NYUAD core Technology platforms. T.G.Wishes to thank the Fonds de Recherche du Quebec (FRQ),“subvention aux nouveaux chercheurs"program,andthe National Science and Engineering Research Council of Canada (NSERC-RGPIN-06409). M.A.Q. gratefullyacknowledge financial support from New York University Abu Dhabi. AuthorContributions A.B. and M.A.Q. design the experiment (Design #1). P.A.G. and T.G. design the experiment (Design #2). A.B.carried out the experiment and the analysis of Design #1. P.A.G realized the experiment and the analysis ofDesign #2. A.B. and R.A. performed the cell staining experiment and analysis. A.B., P.A.G., T.G. and M.A.Q.wrote the manuscript. All authors reviewed the manuscript. Additional Information Supplementary information accompanies this paper at https://doi.org/10.1038/s41598-018-29304-x. Competing Interests: The authors declare no competing interests. Publisher’s note: Springer Nature remains neutral with regard to jurisdictional claims in published maps andinstitutional affiliations. Open Access This article is licensed under a Creative Commons Attribution 4.0 InternationalLicense, which permits use, sharing, adaptation, distribution and reproduction in any medium orformat, as long as you give appropriate credit to the original author(s) and the source, provide a link to the Cre-ative Commons license, and indicate if changes were made. The images or other third party material in this;1:4article are included in the article's Creative Commons license, unless indicated otherwise in a credit line to thematerial. If material is not included in the article’s Creative Commons license and your intended use is not per-mitted by statutory regulation or exceeds the permitted use, you will need to obtain permission directly from thecopyright holder. To view a copy of this license, visit http://creativecommons.org/licenses/by/4.0/. o The Author(s) 2018 SCIENTIFIC REPORTS|(DOI:sx 在这项工作中,我们用立体凹版3D打印技术一步完成了微流控探针(MFPs)的制作,并使用玻璃或硅微加工的标准MFPs对其性能进行了测试。两个研究小组联合使用不同的设备,介绍了两种独立的设计和制造方案。所采用的两种策略都是廉价和简单的(它们只需要立体印刷打印机),并且是高度可定制的。通过再现以前发表的微流态偶极和微流态四极试剂的输送特性,并与数值模拟和定标定律的预期结果进行比较,来进行流动特性表征。结果表明,在大多数MFP应用中,打印机分辨率对探针操作、试剂模式形成和细胞染色结果的影响微乎其微。因此,任何研究小组中分辨率(100μm)有限元打印机能够制造MFPs和用于处理细胞,或生成微流体浓度梯度。MFP的制造涉及玻璃和/或硅微加工,或聚合物微成型,在以前发表的每一篇文章的主题。因此,我们相信3D打印MFPs将使这项技术大众化。我们将CAD文件提供给读者,这样他们就可以用自己的立体光刻打印机来实践验证我们的“打印探头”方法。期望通过这一努力来为3D打印MFPs技术的大众化的启动做出贡献。
确定

还剩6页未读,是否继续阅读?

产品配置单


北京欧兰科技发展有限公司为您提供《微流体探头中速度场检测方案(CCD相机)》,该方案主要用于其他中速度场检测,参考标准--,《微流体探头中速度场检测方案(CCD相机)》用到的仪器有Imager sCMOS PIV相机、德国LaVision PIV/PLIF粒子成像测速场仪、LaVision DaVis 智能成像软件平台
推荐专场
CCD相机/影像CCD
更多


相关方案
更多
该厂商其他方案
更多