


方案详情
文
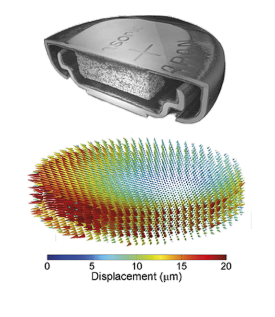
采用LaVision的体视全场形变应变测量分析软件平台DaVis-DVC,对泡沫材料的X光CT数据进行数字全场相关分析,获得了体视3D3C形变应变数据,并进而用于这类泡沫材料的刚度测量分析。
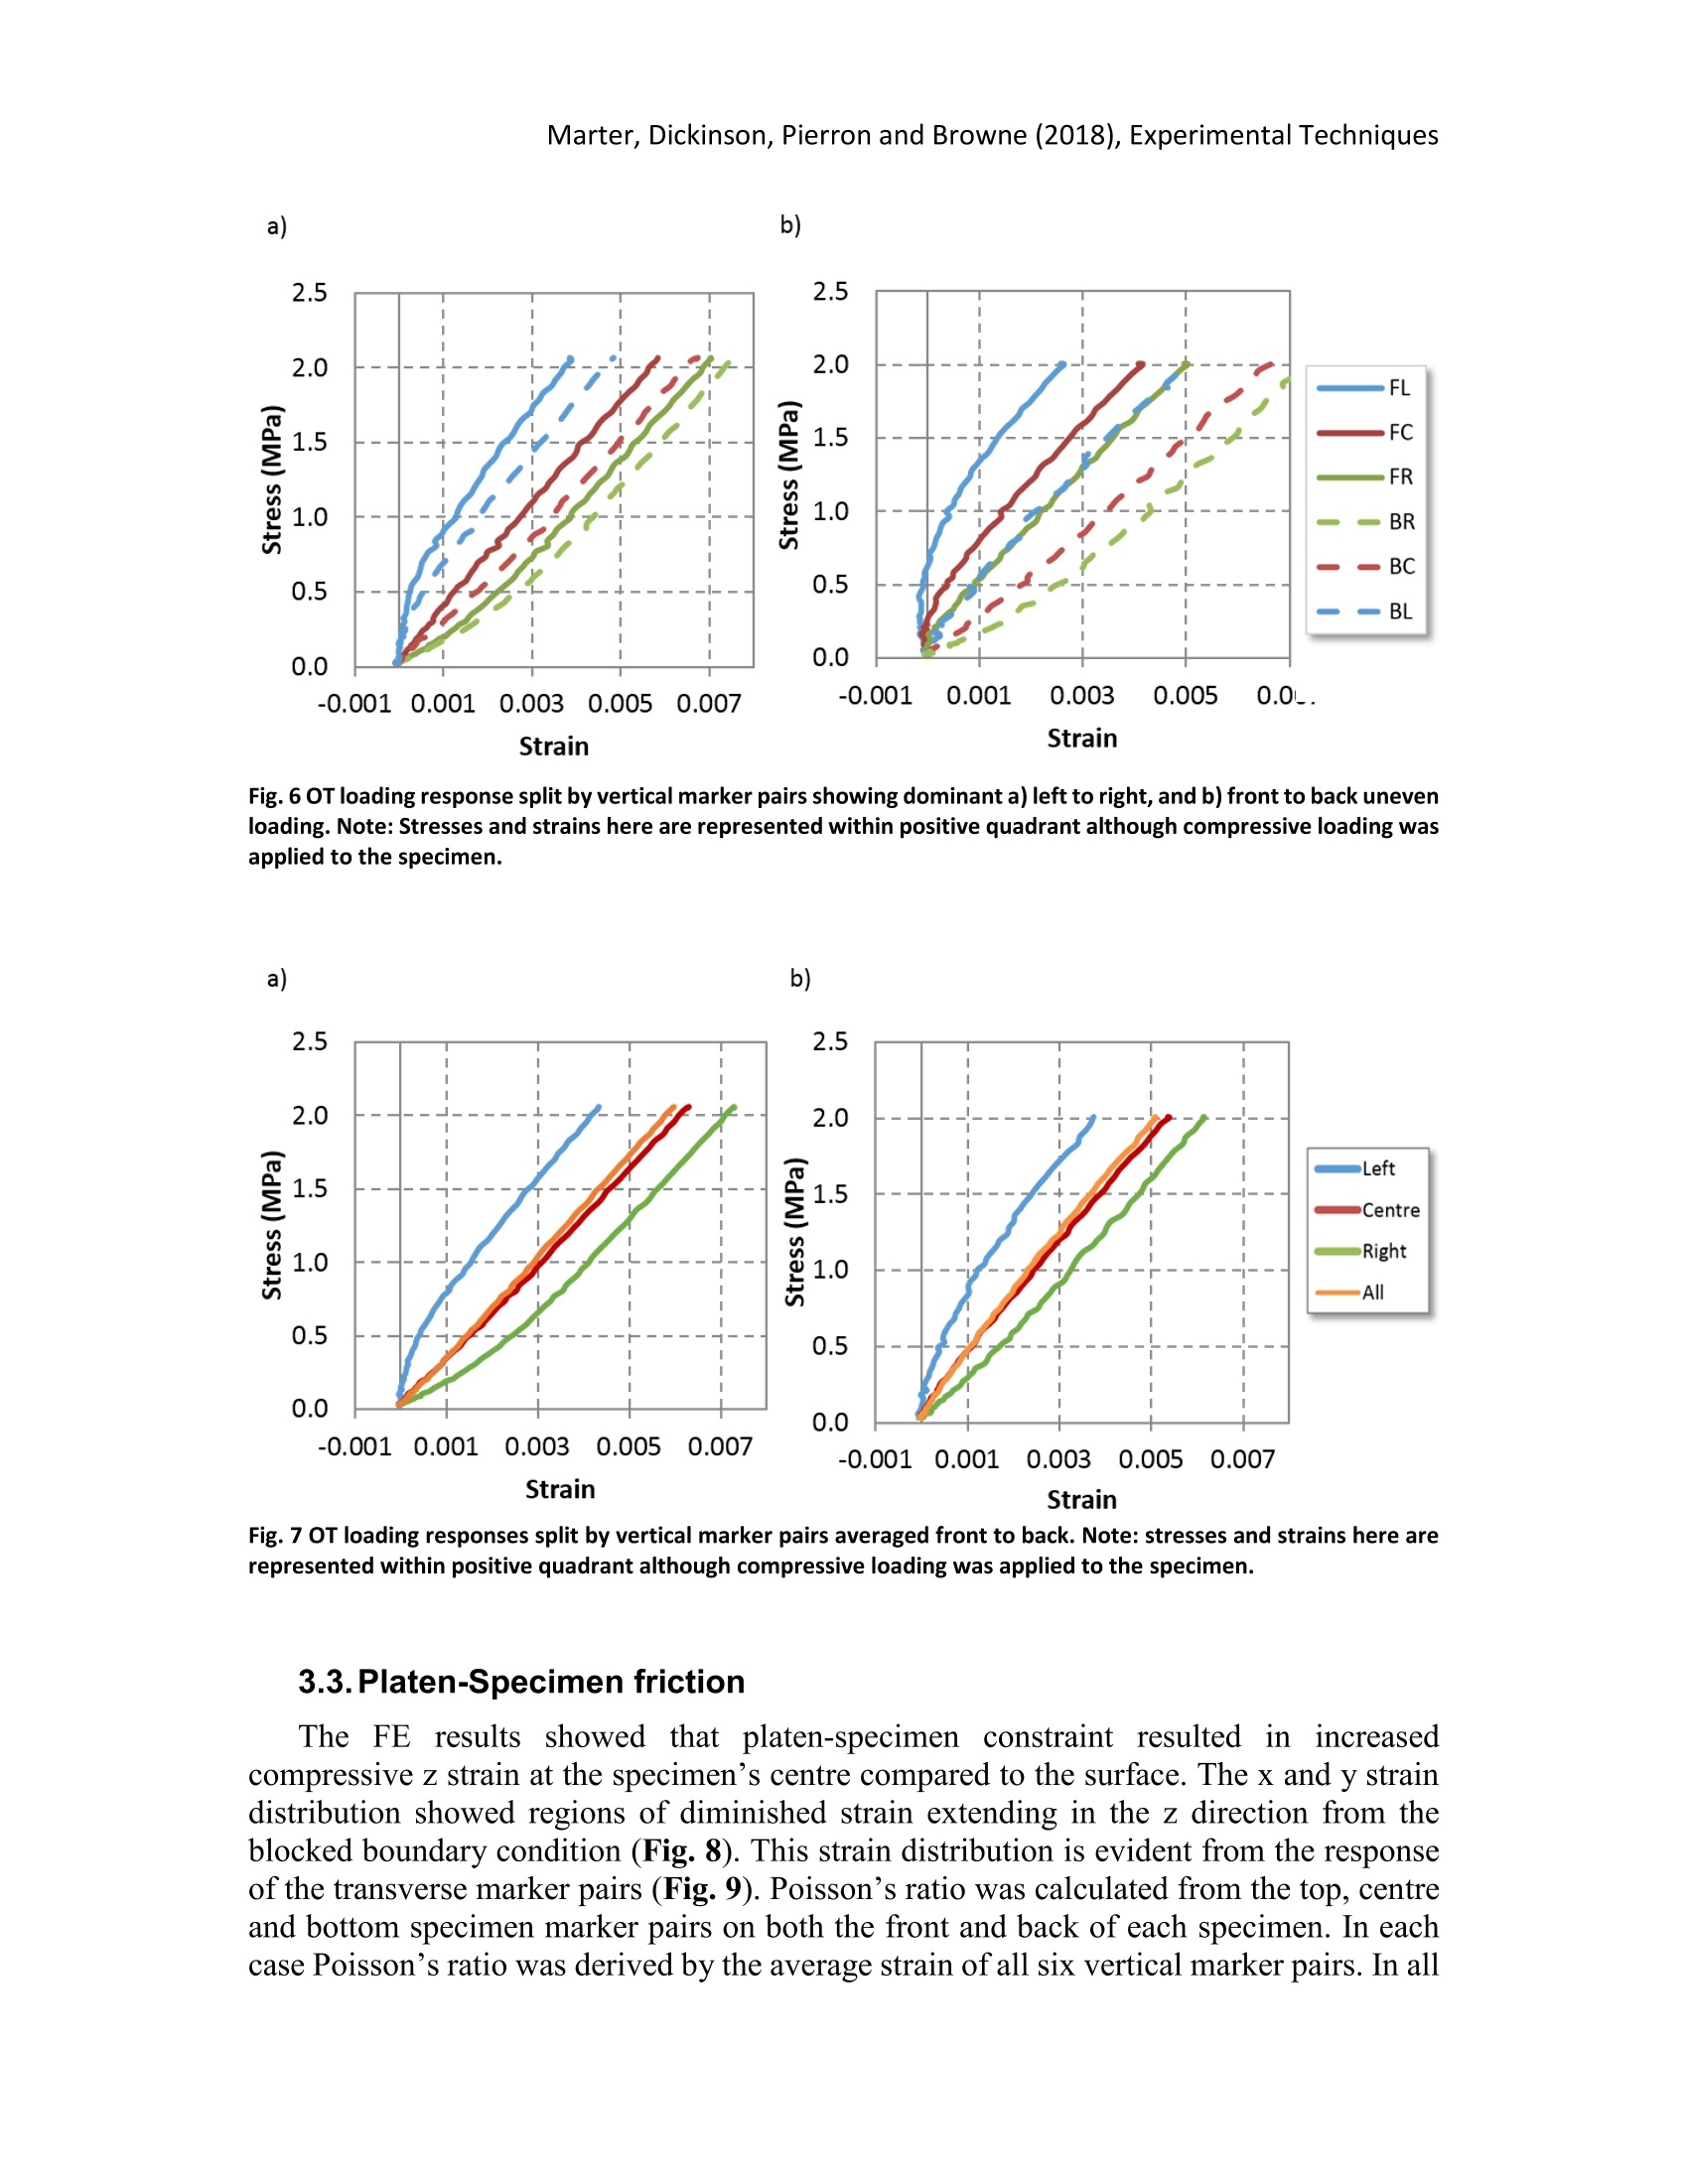
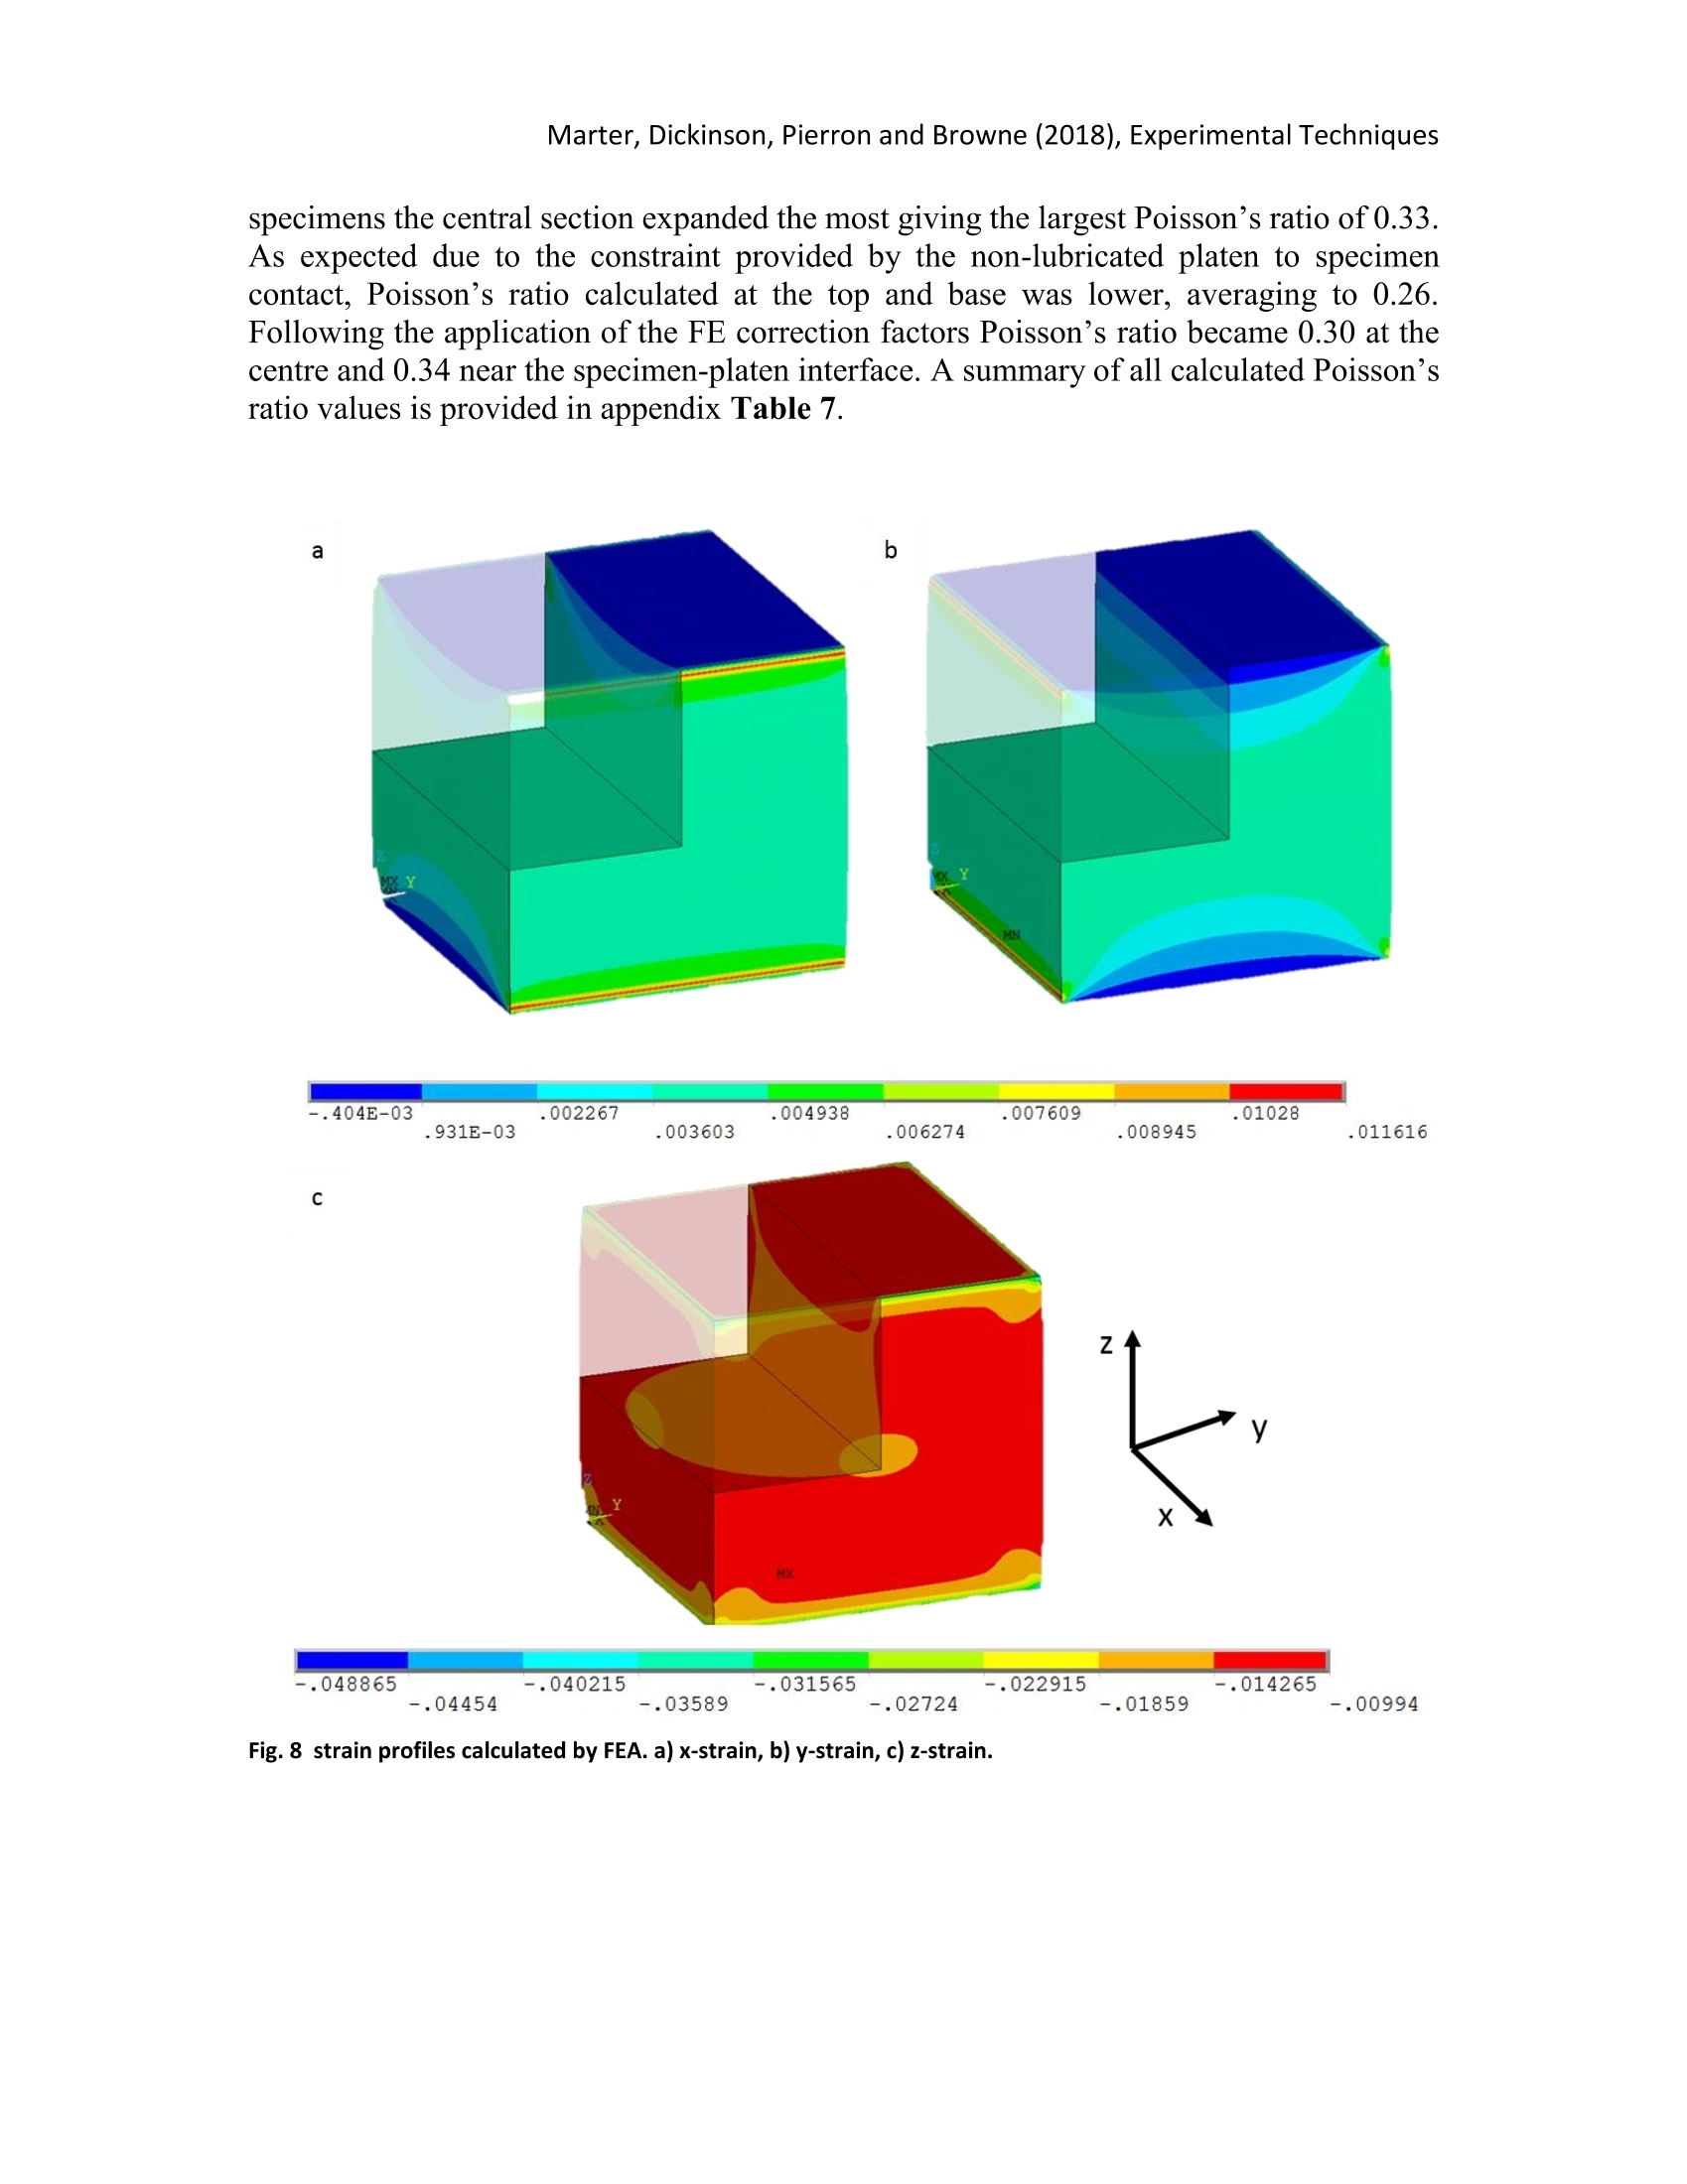
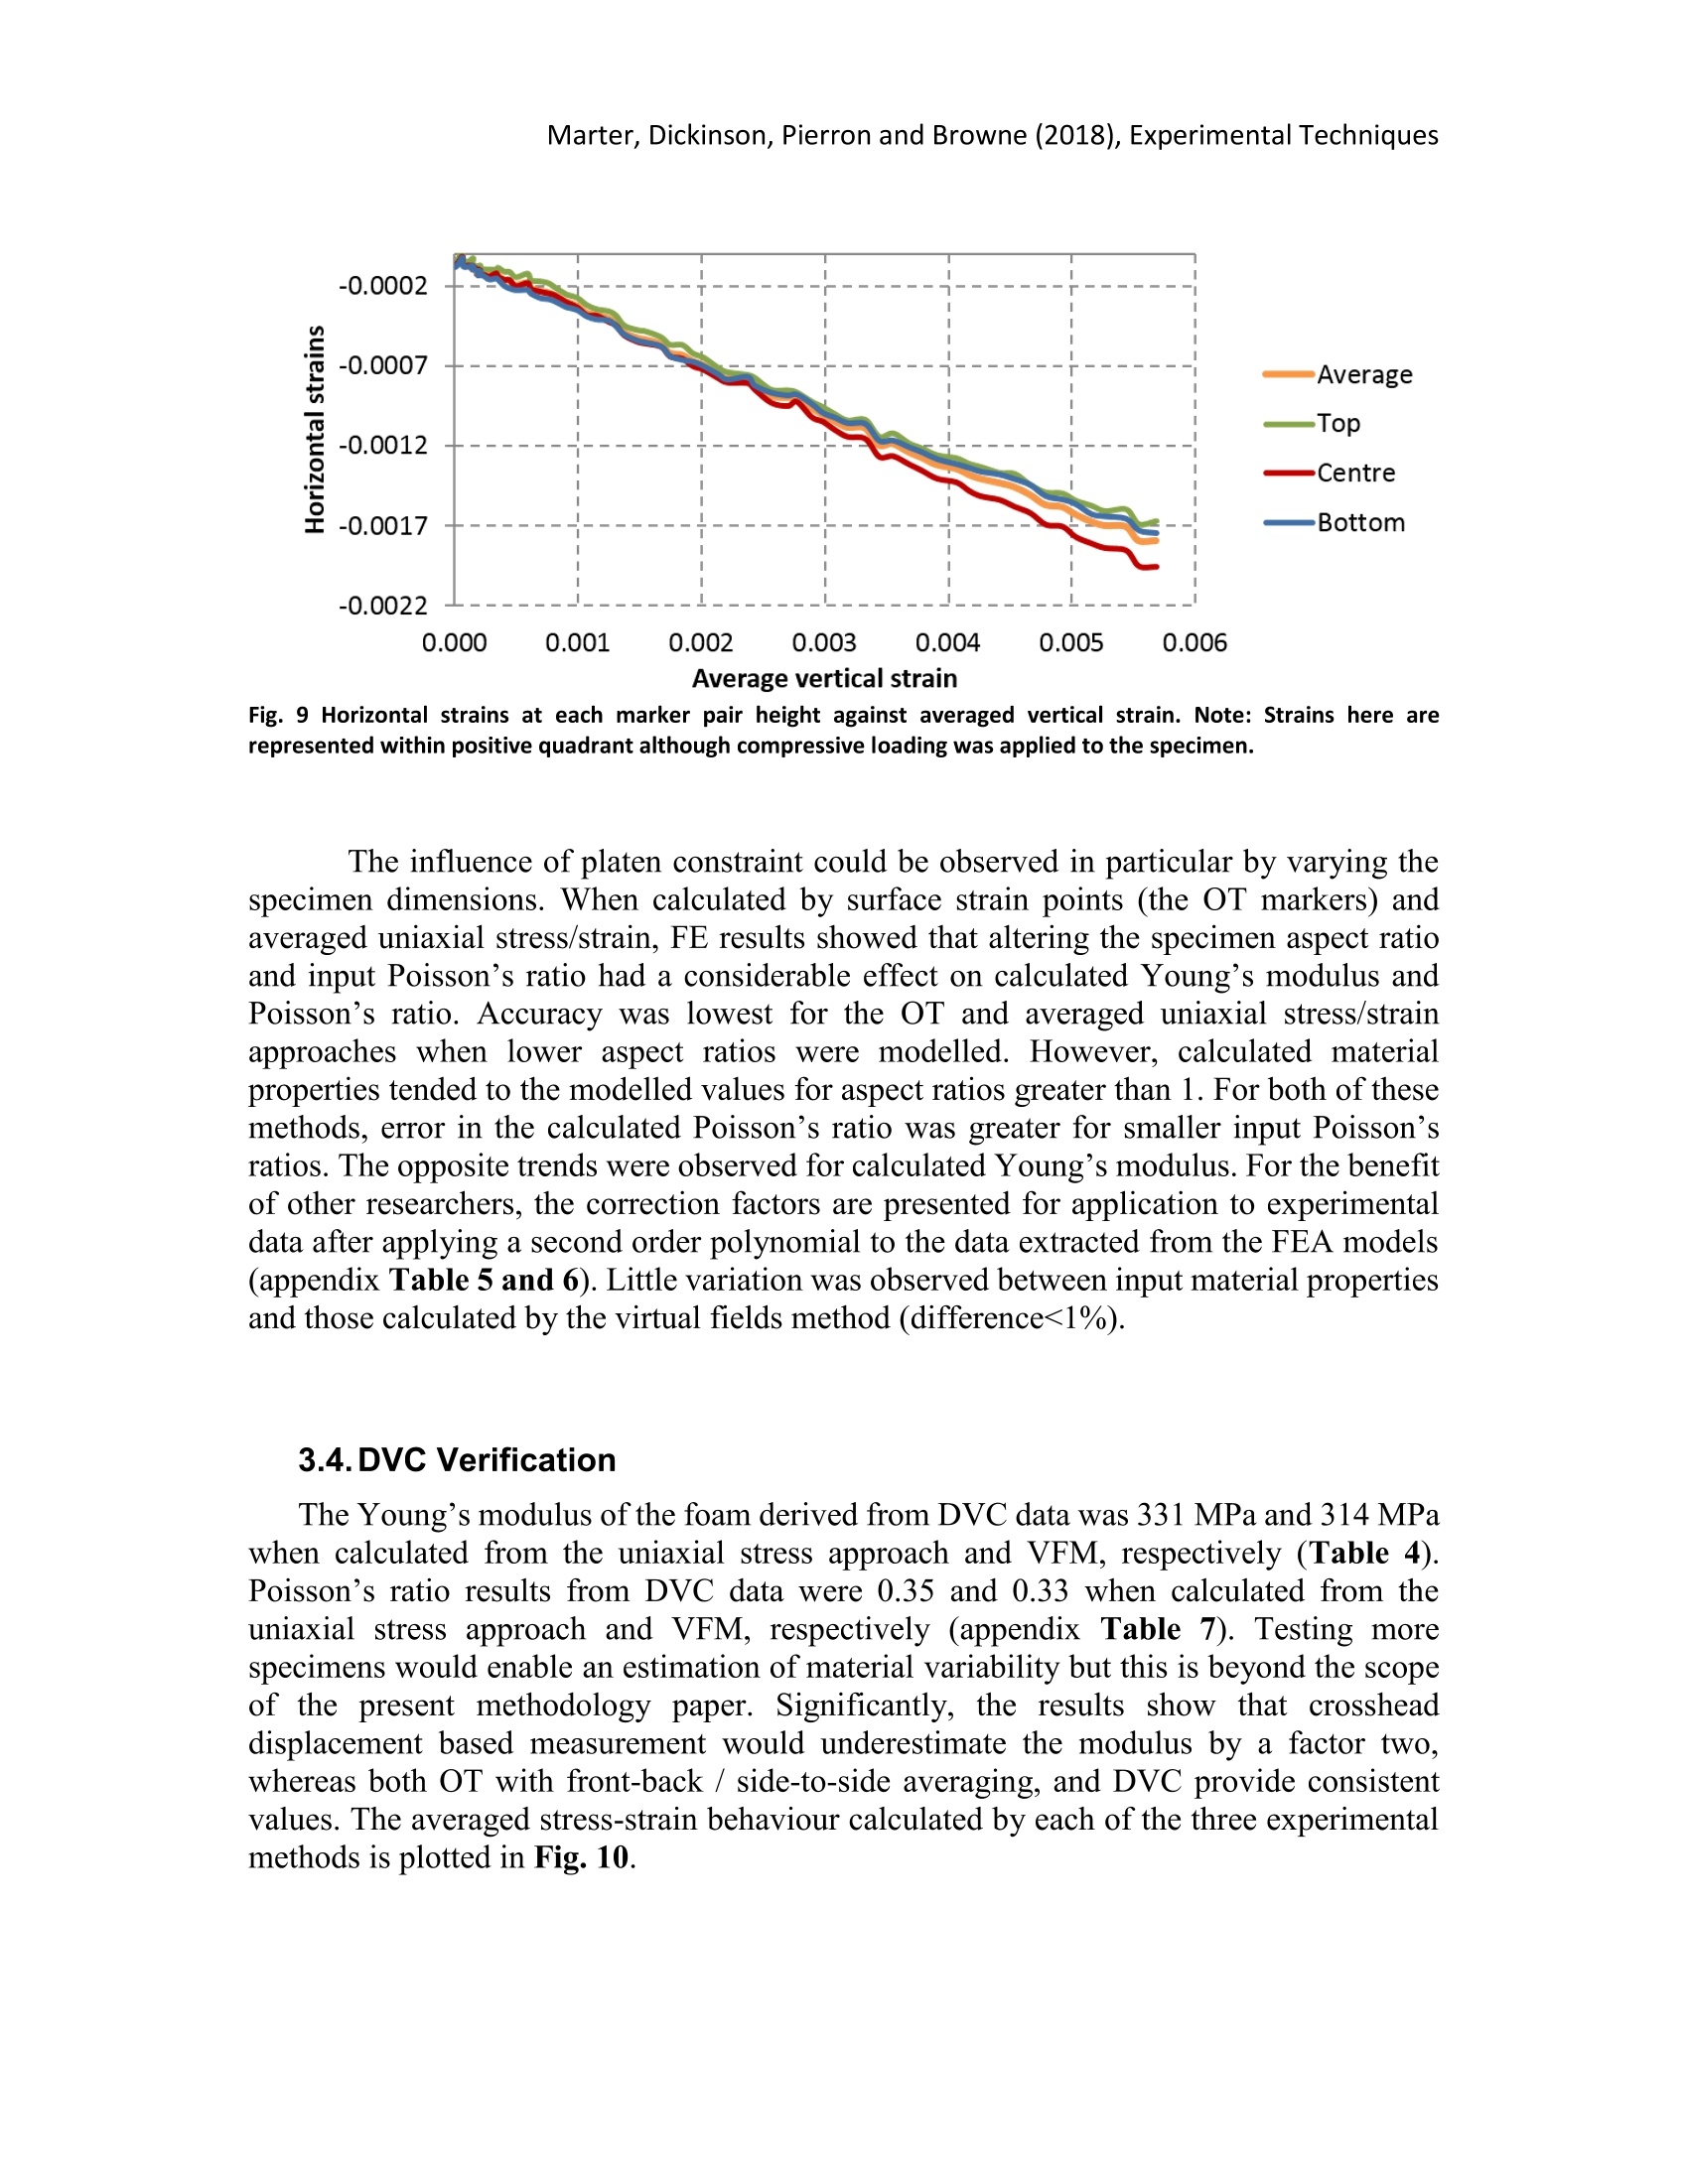
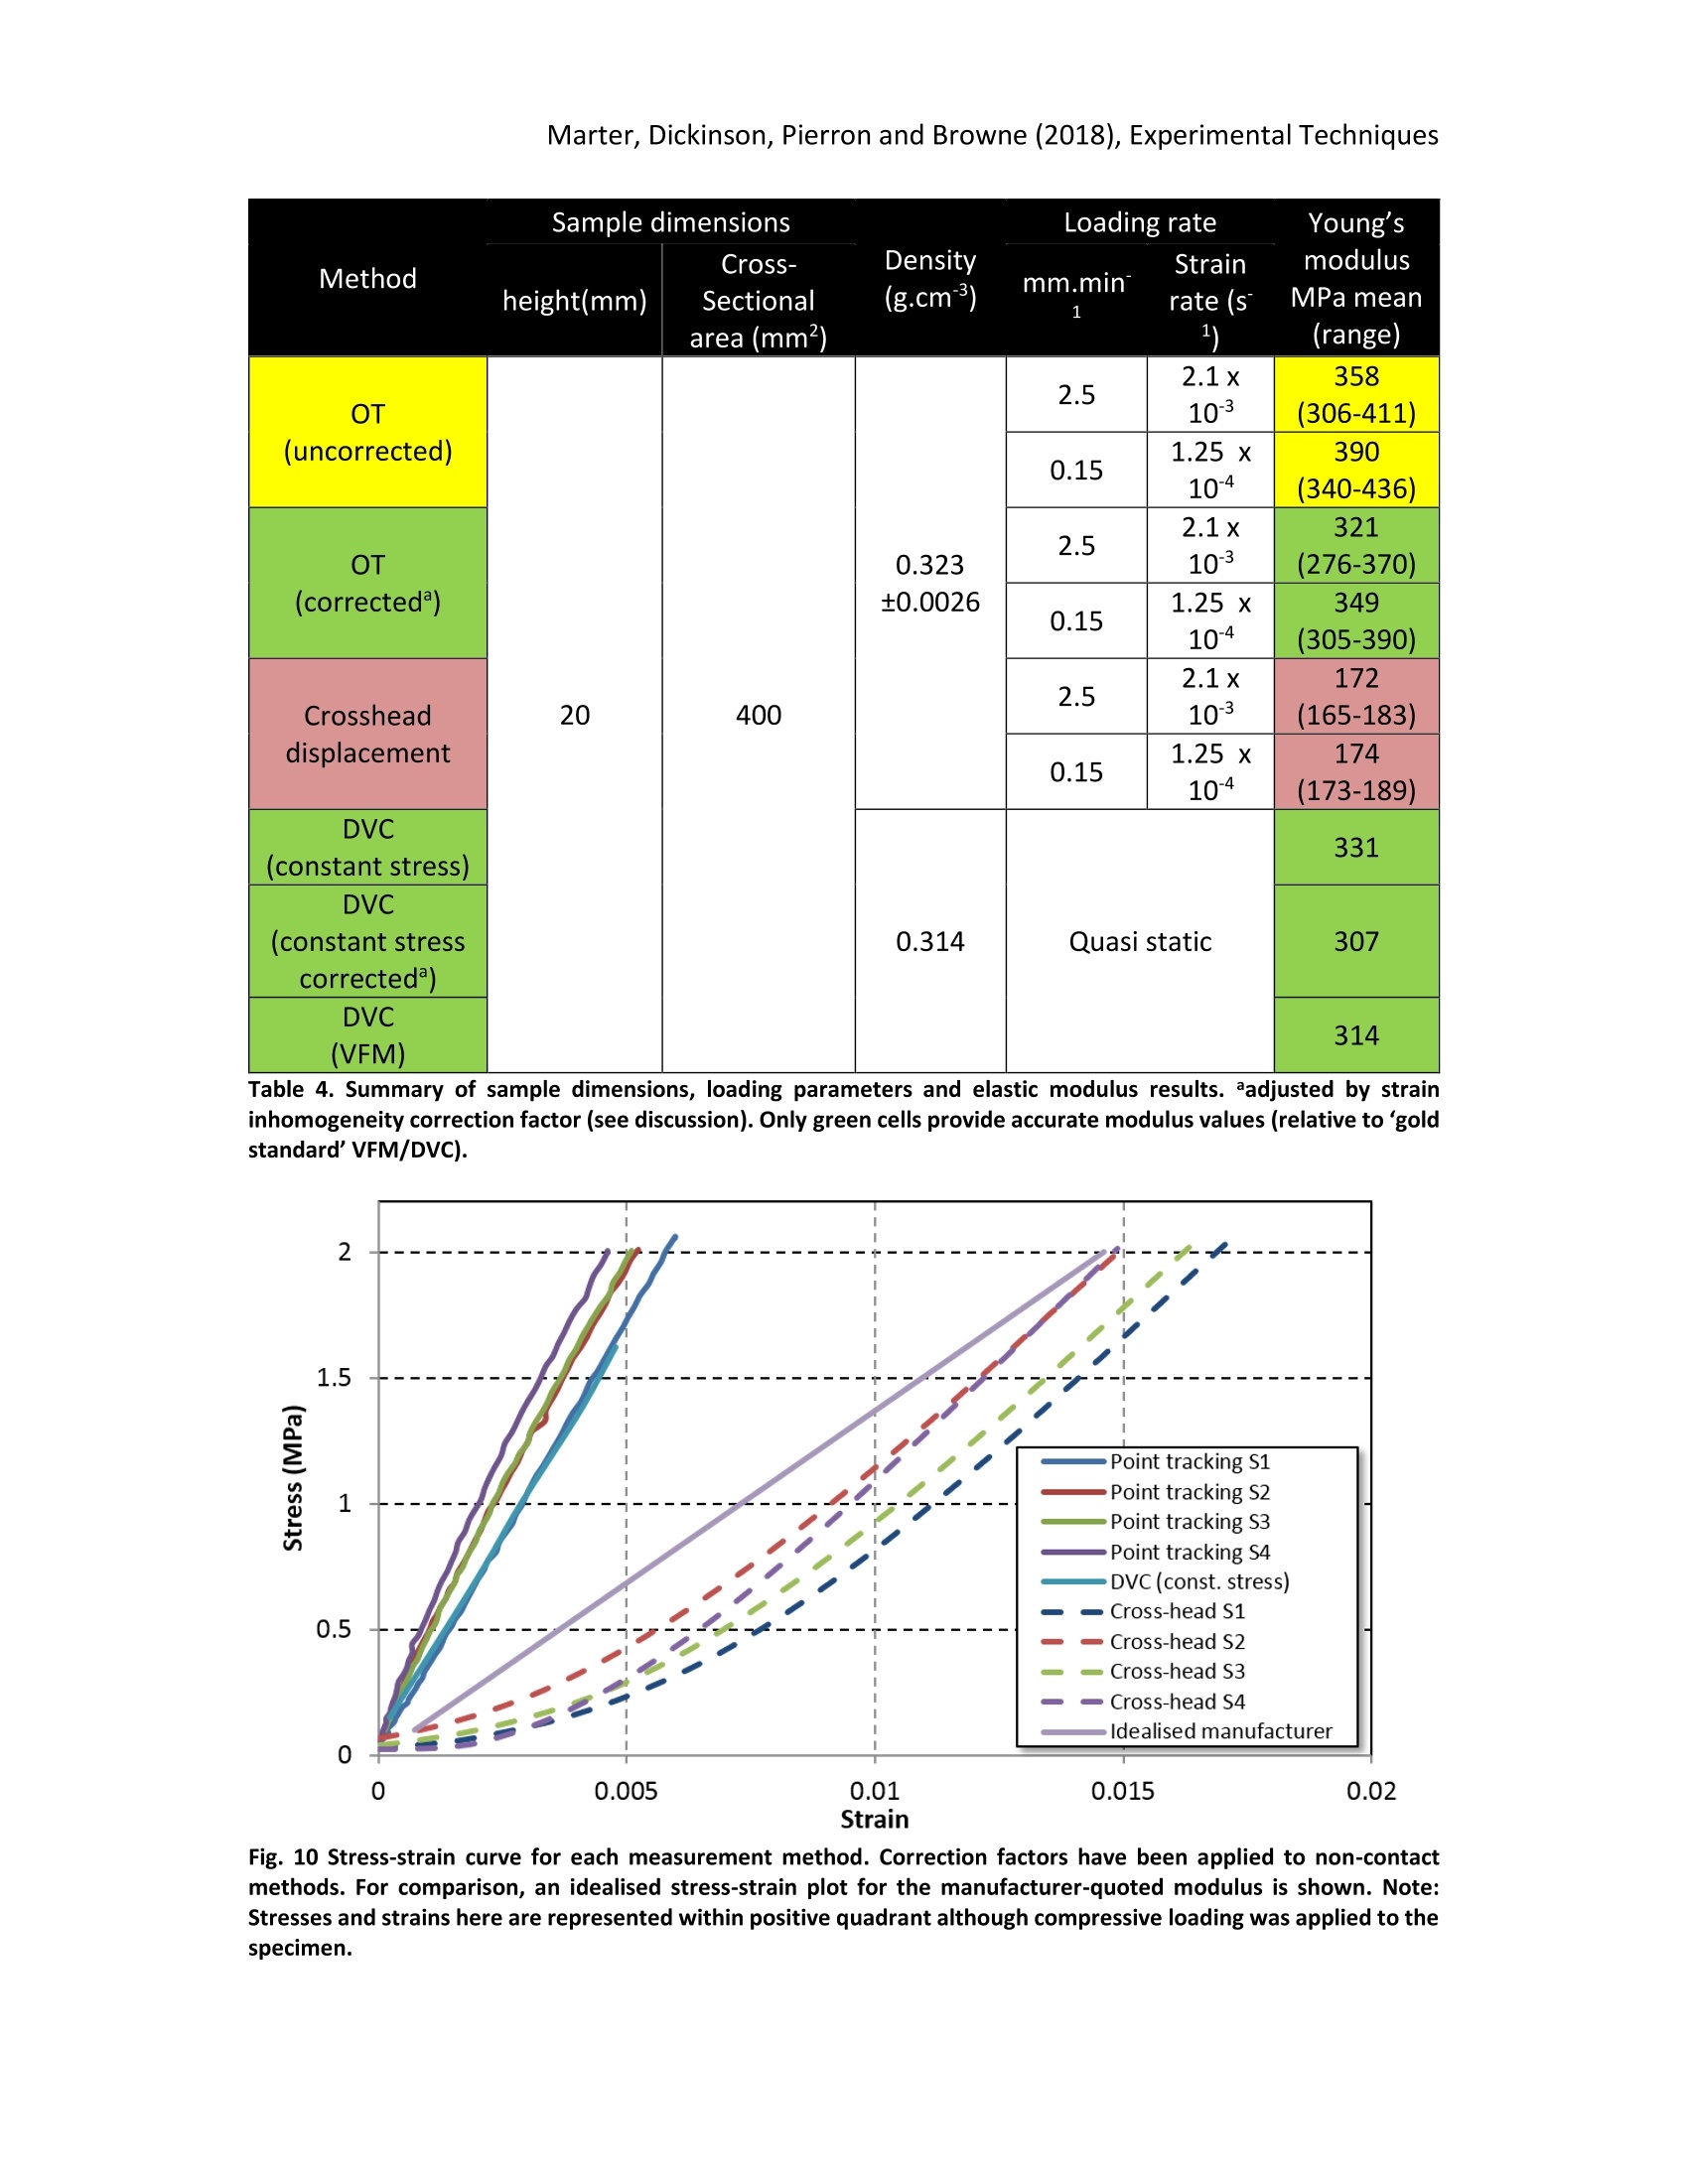
方案详情

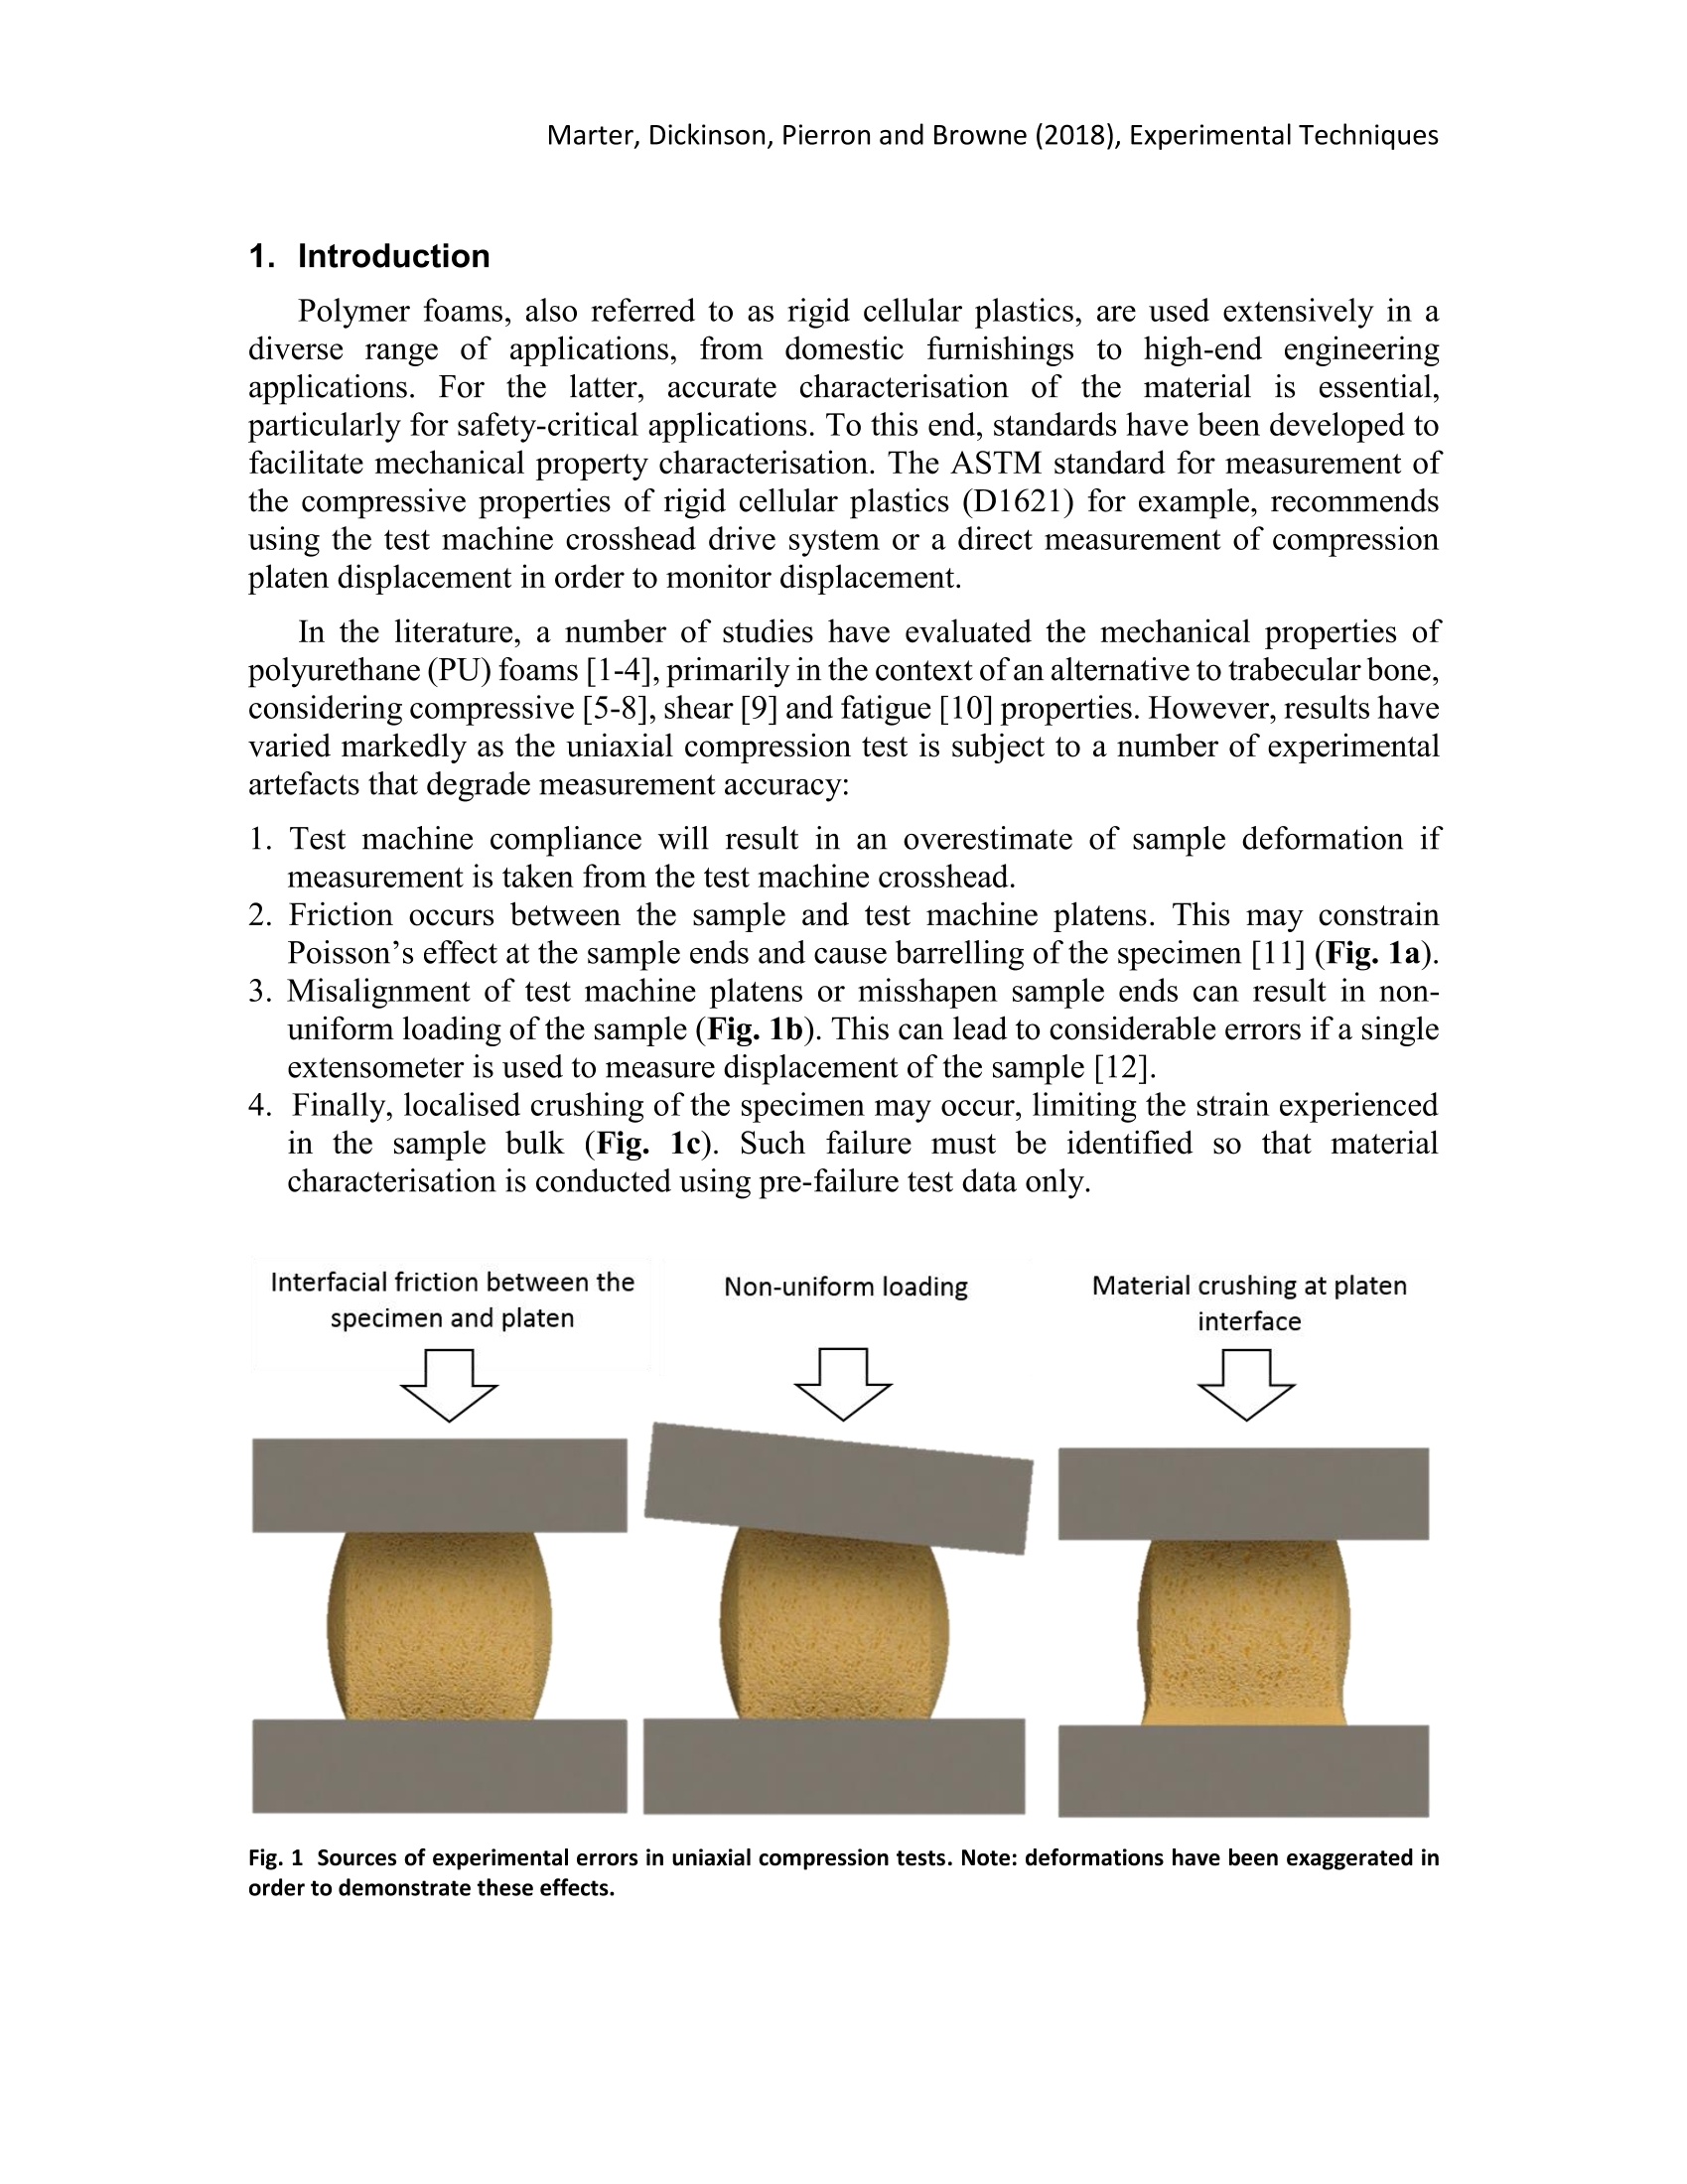
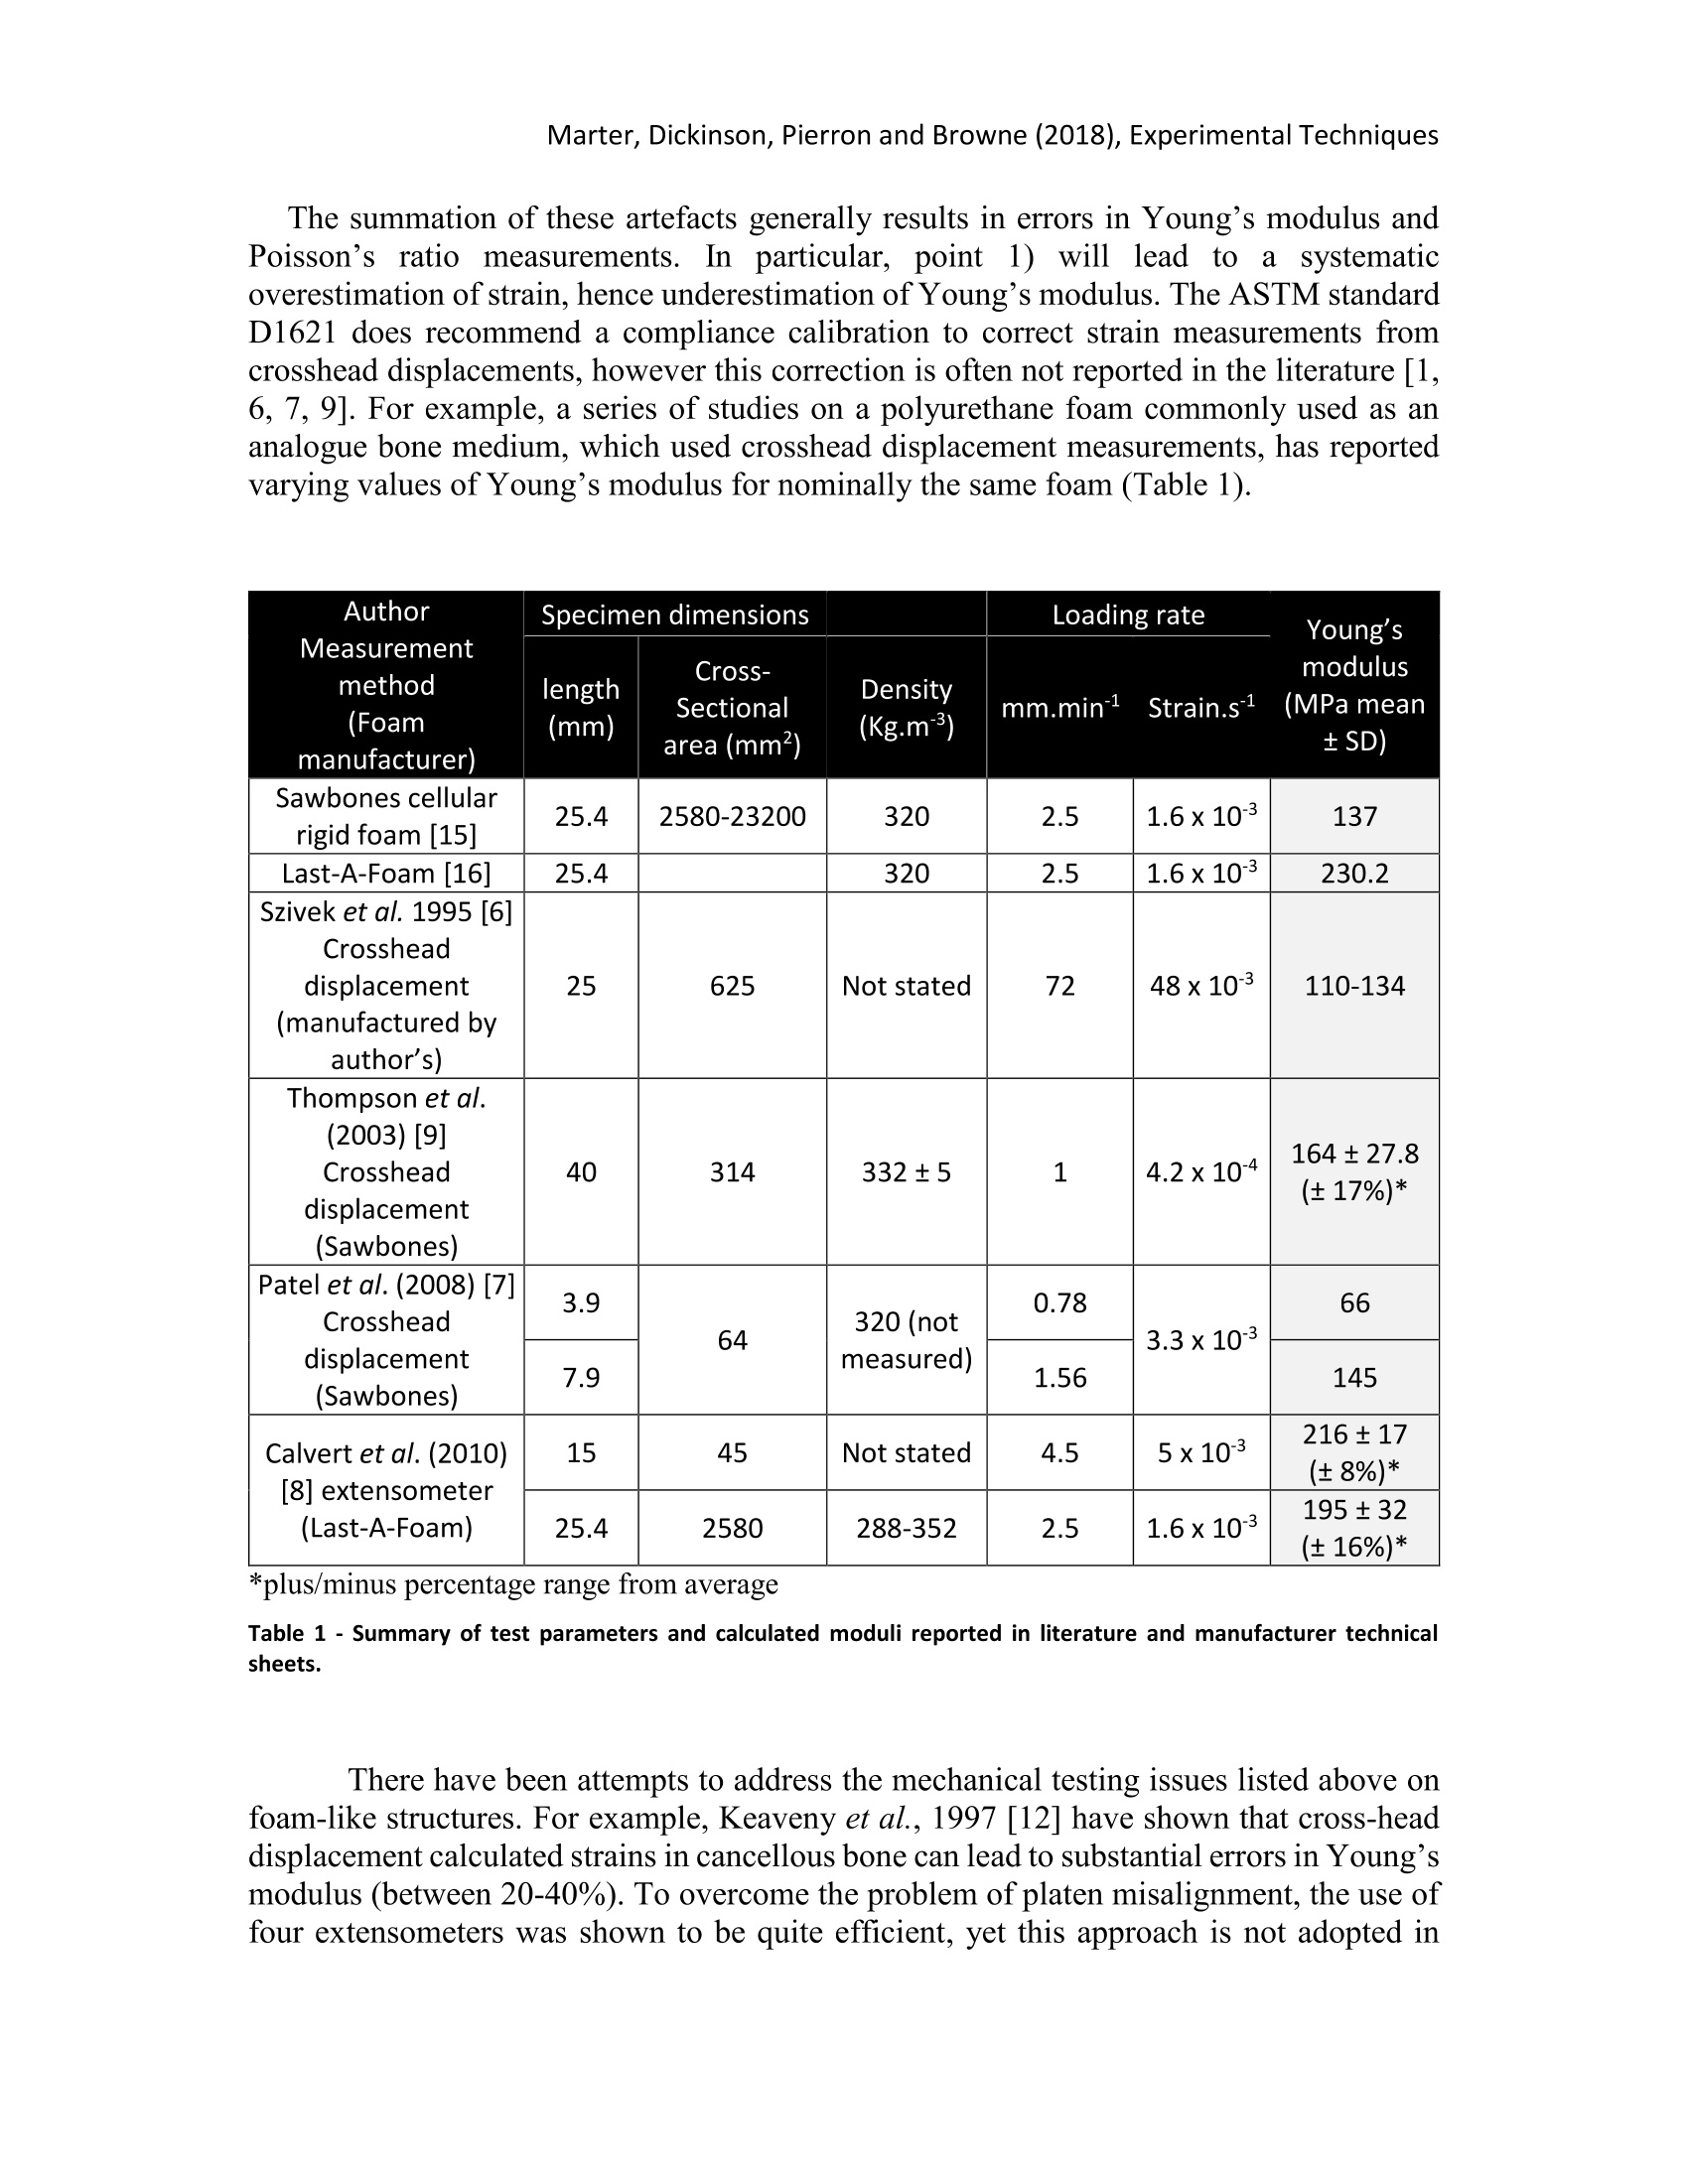
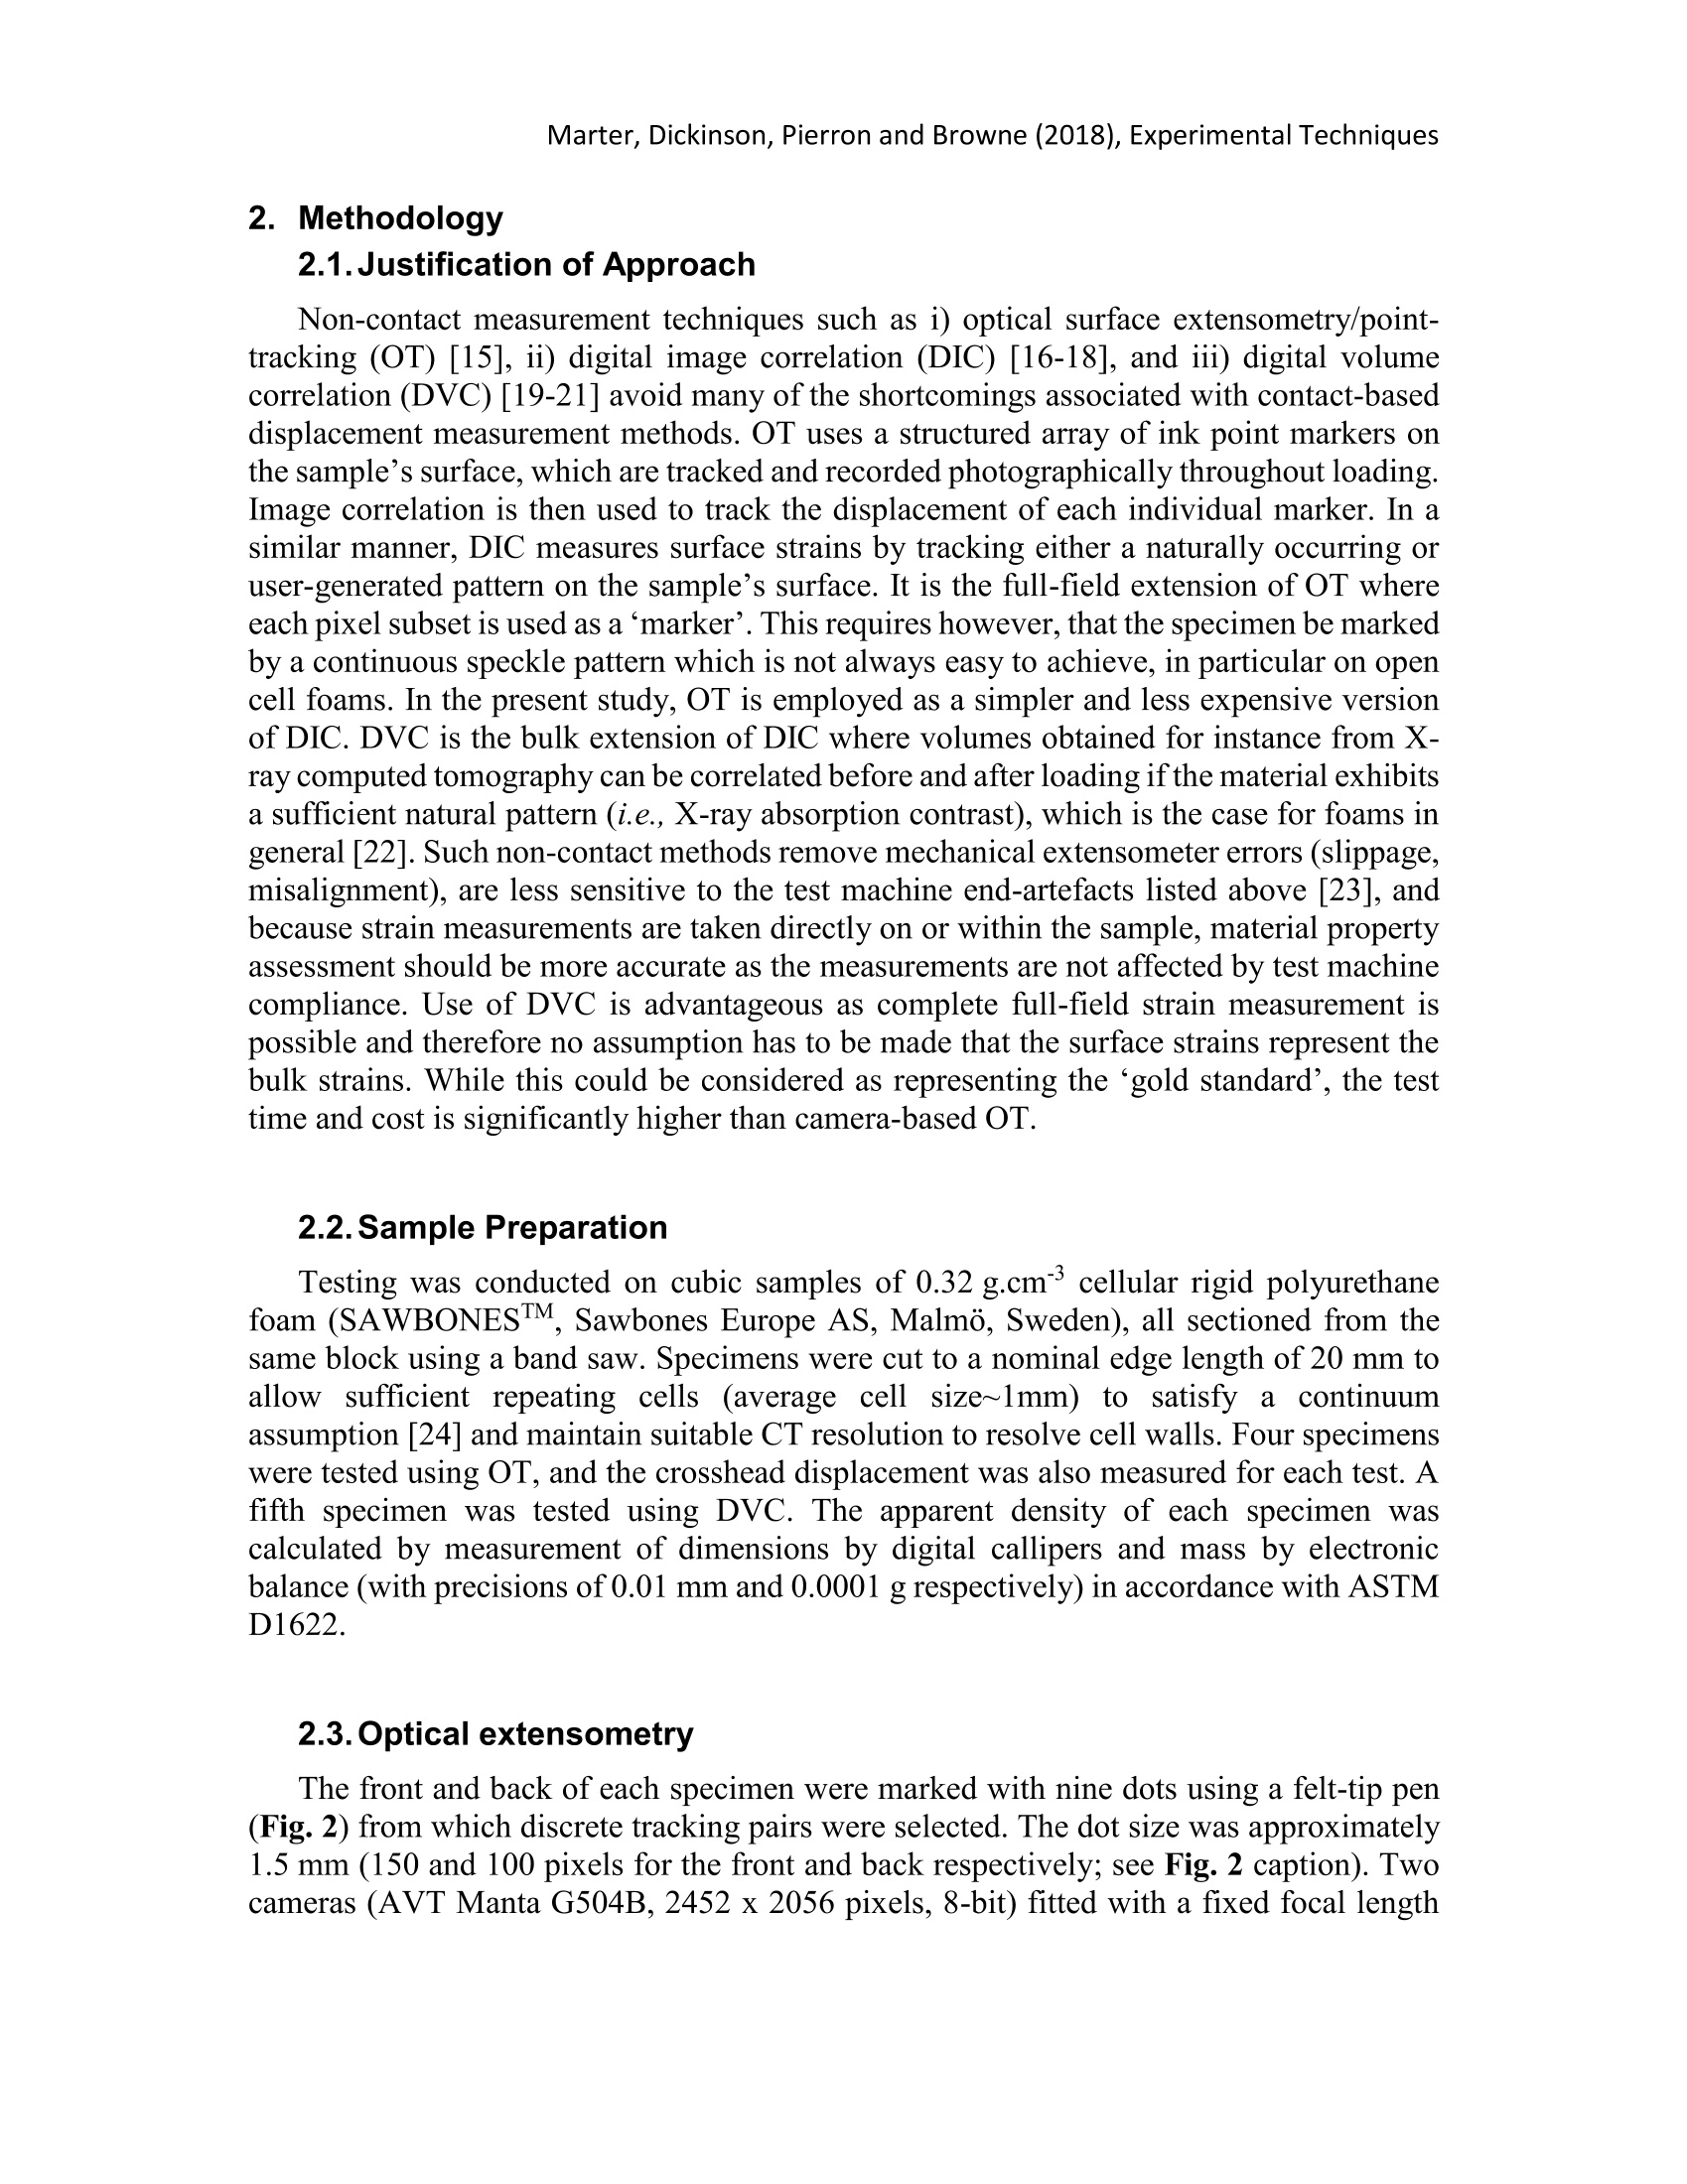
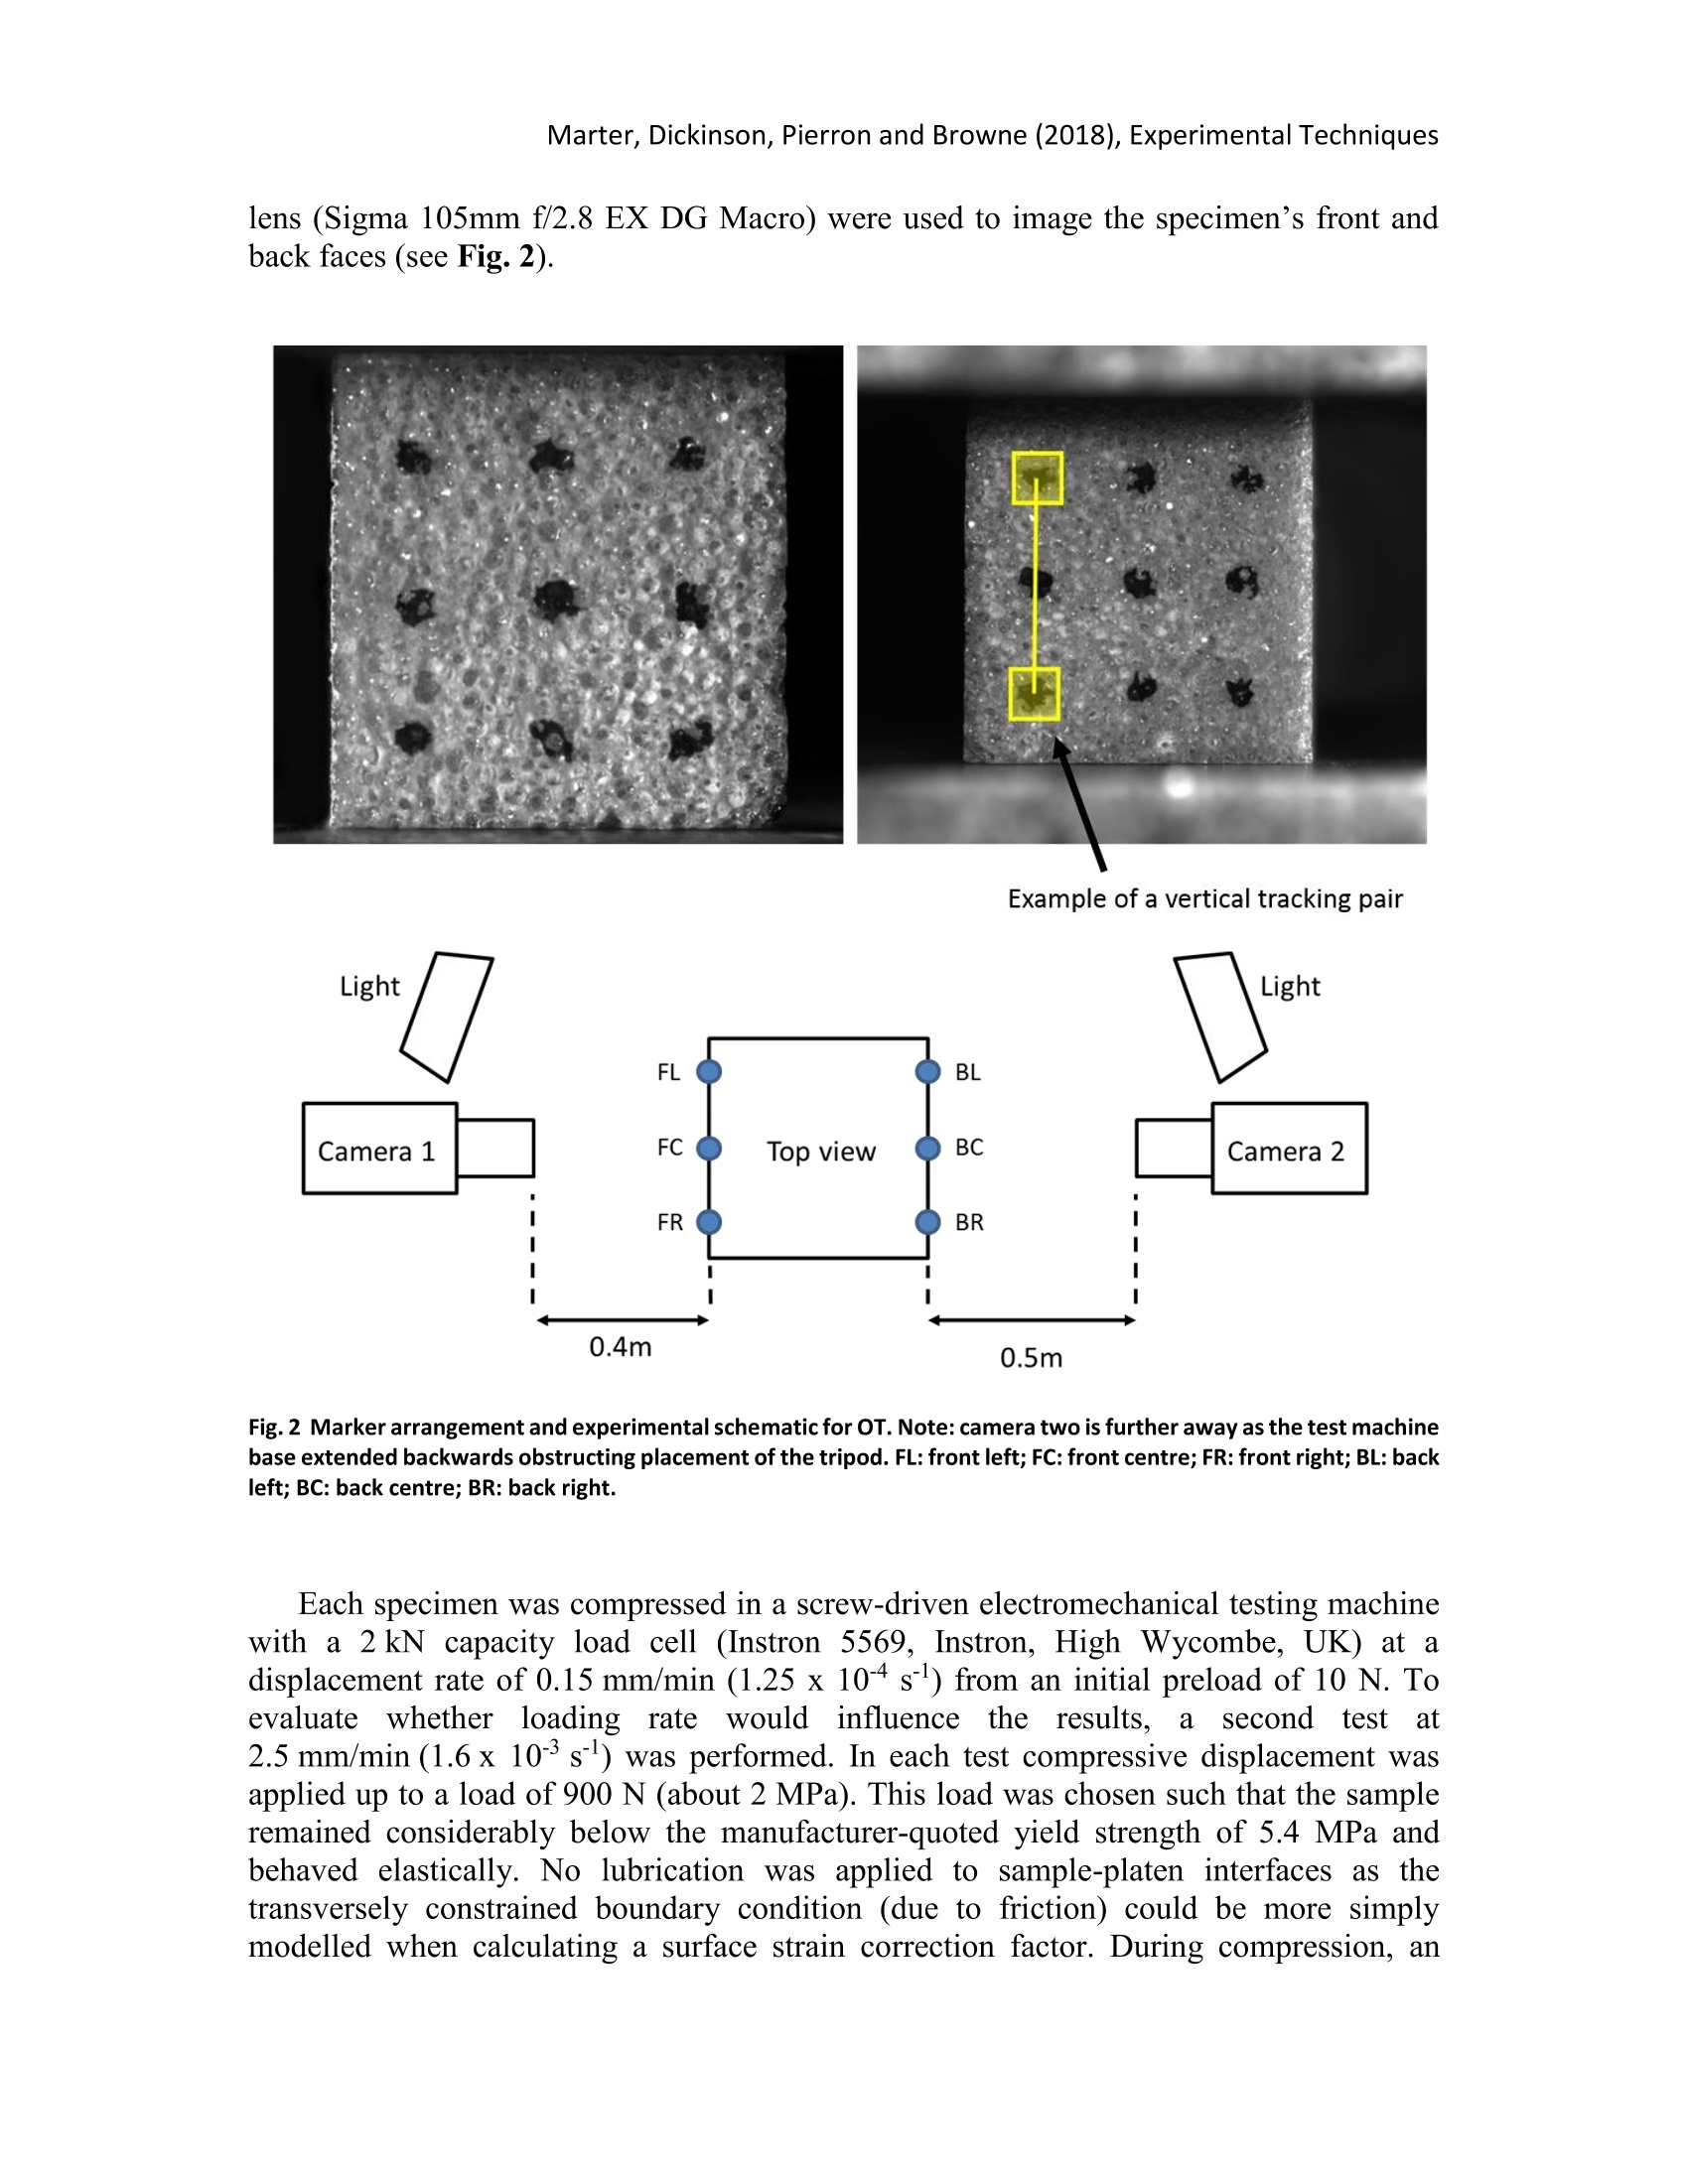
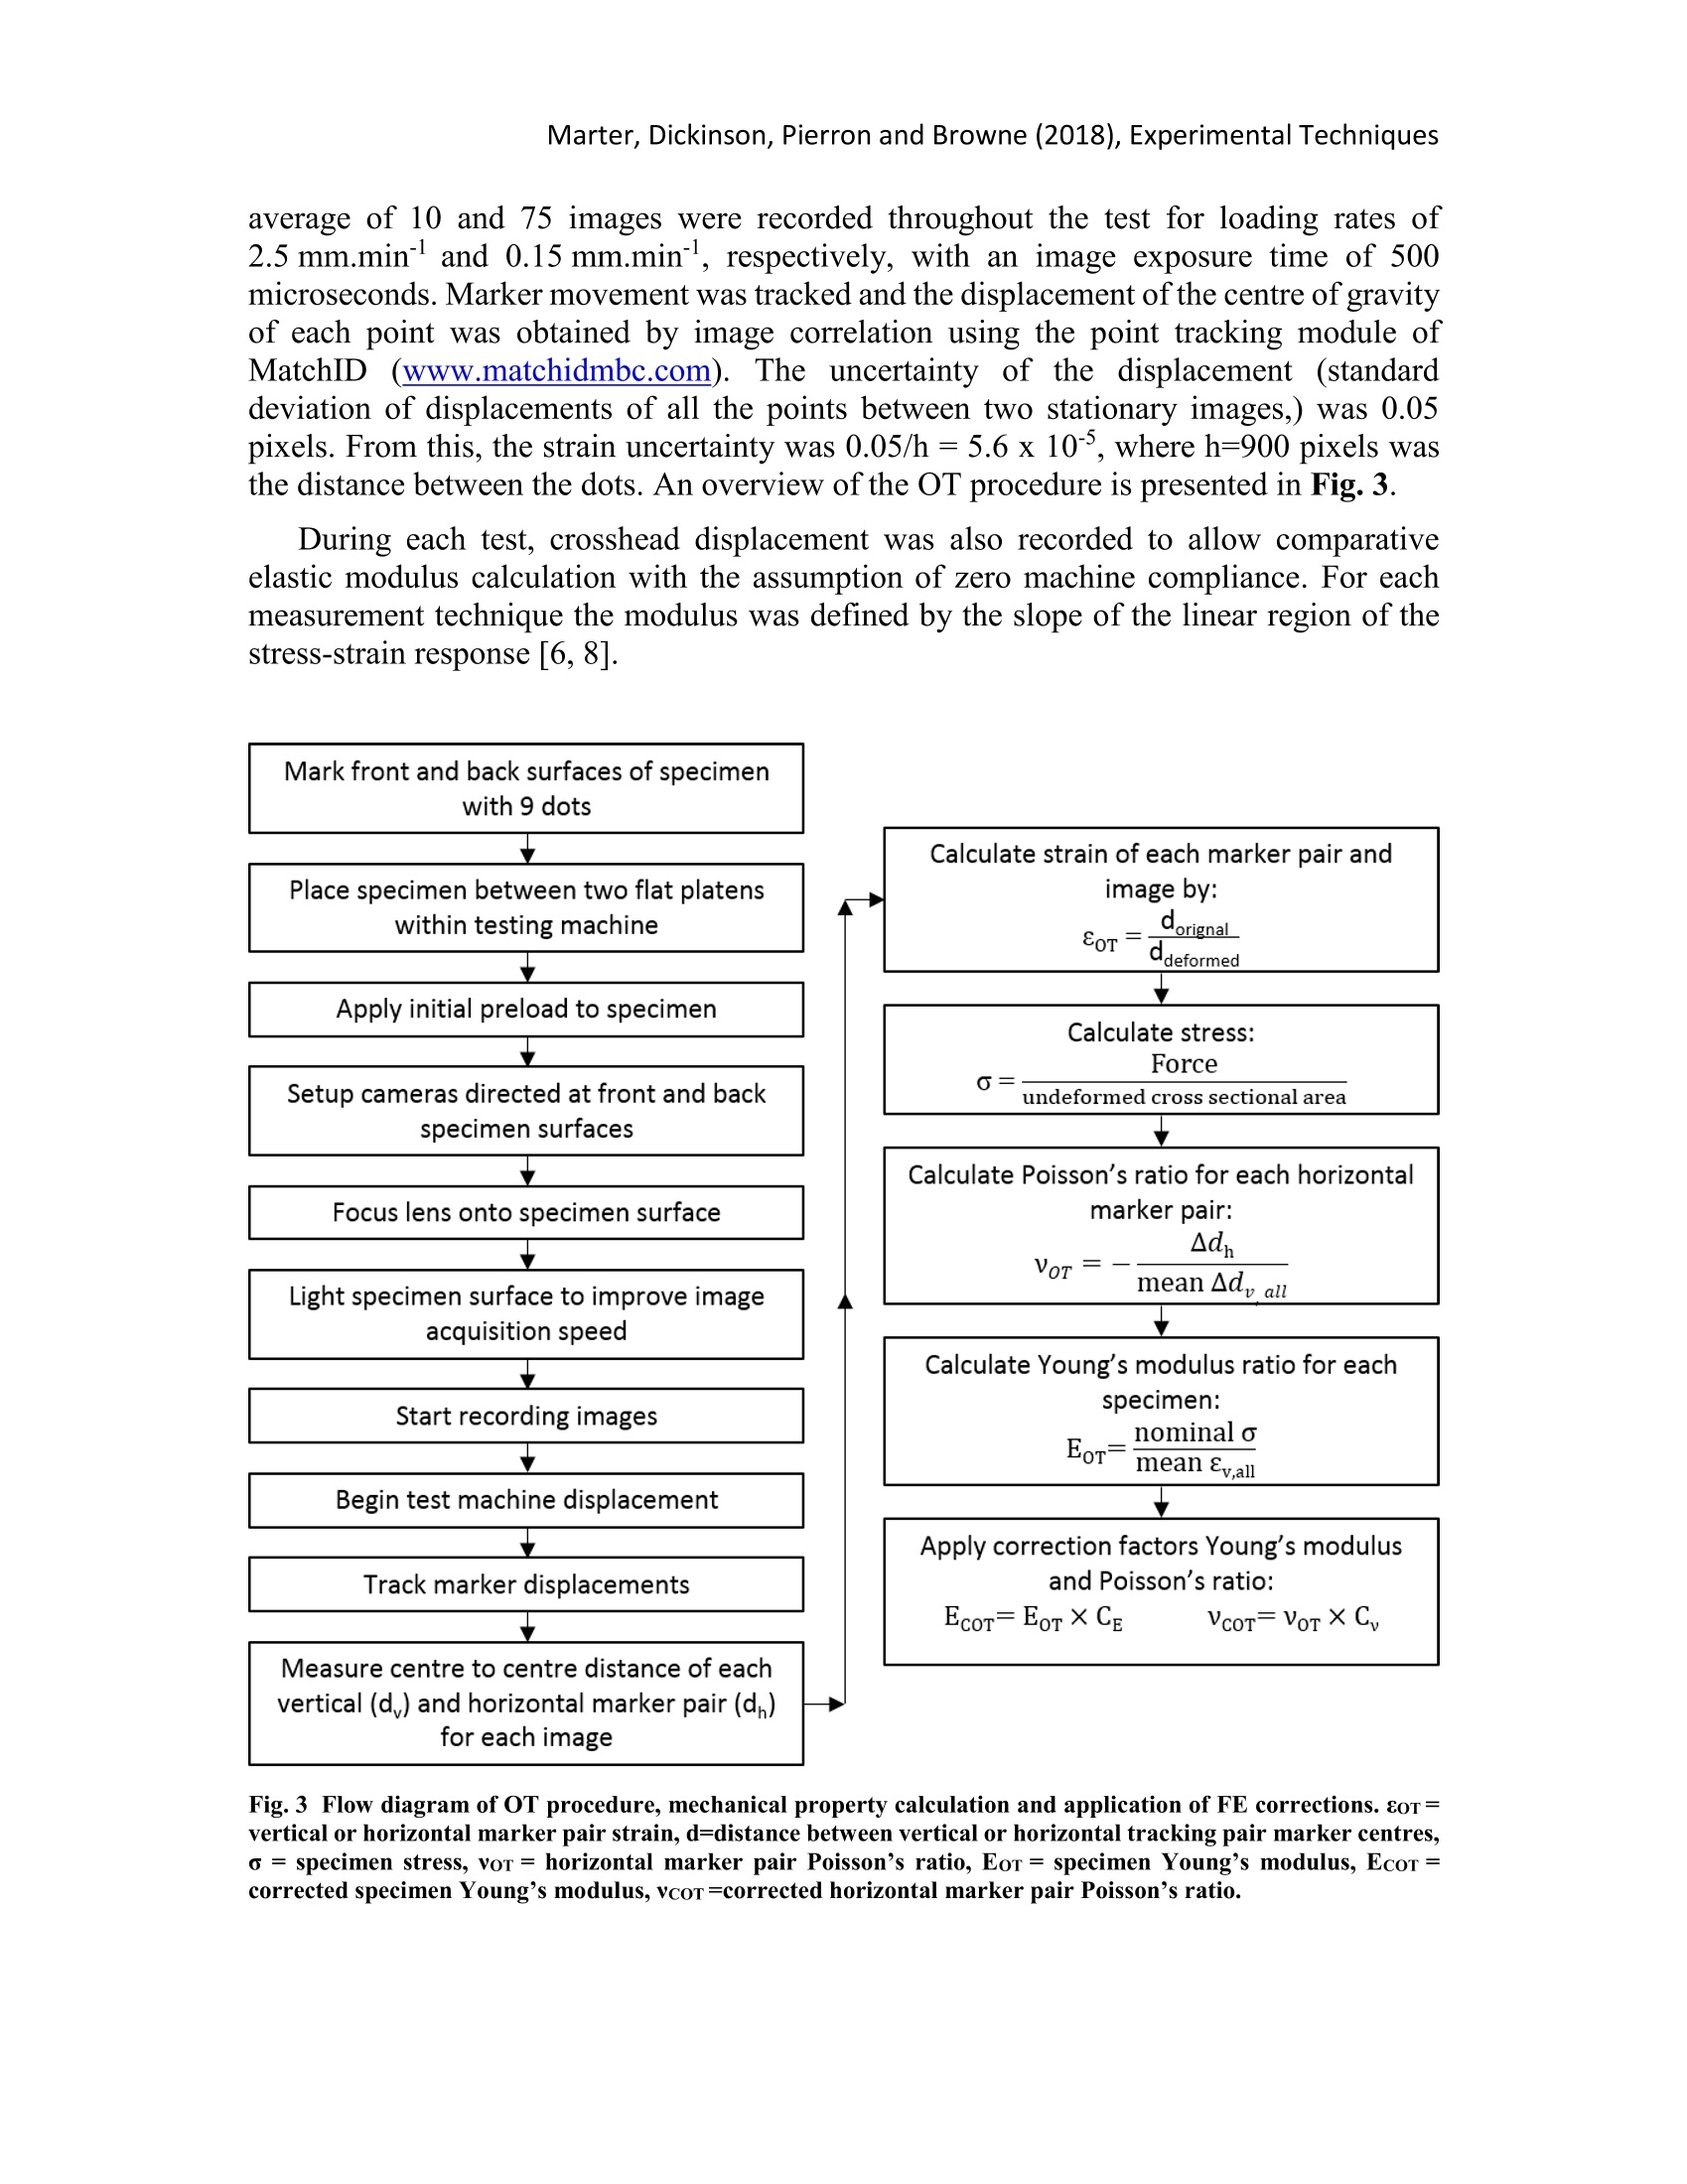
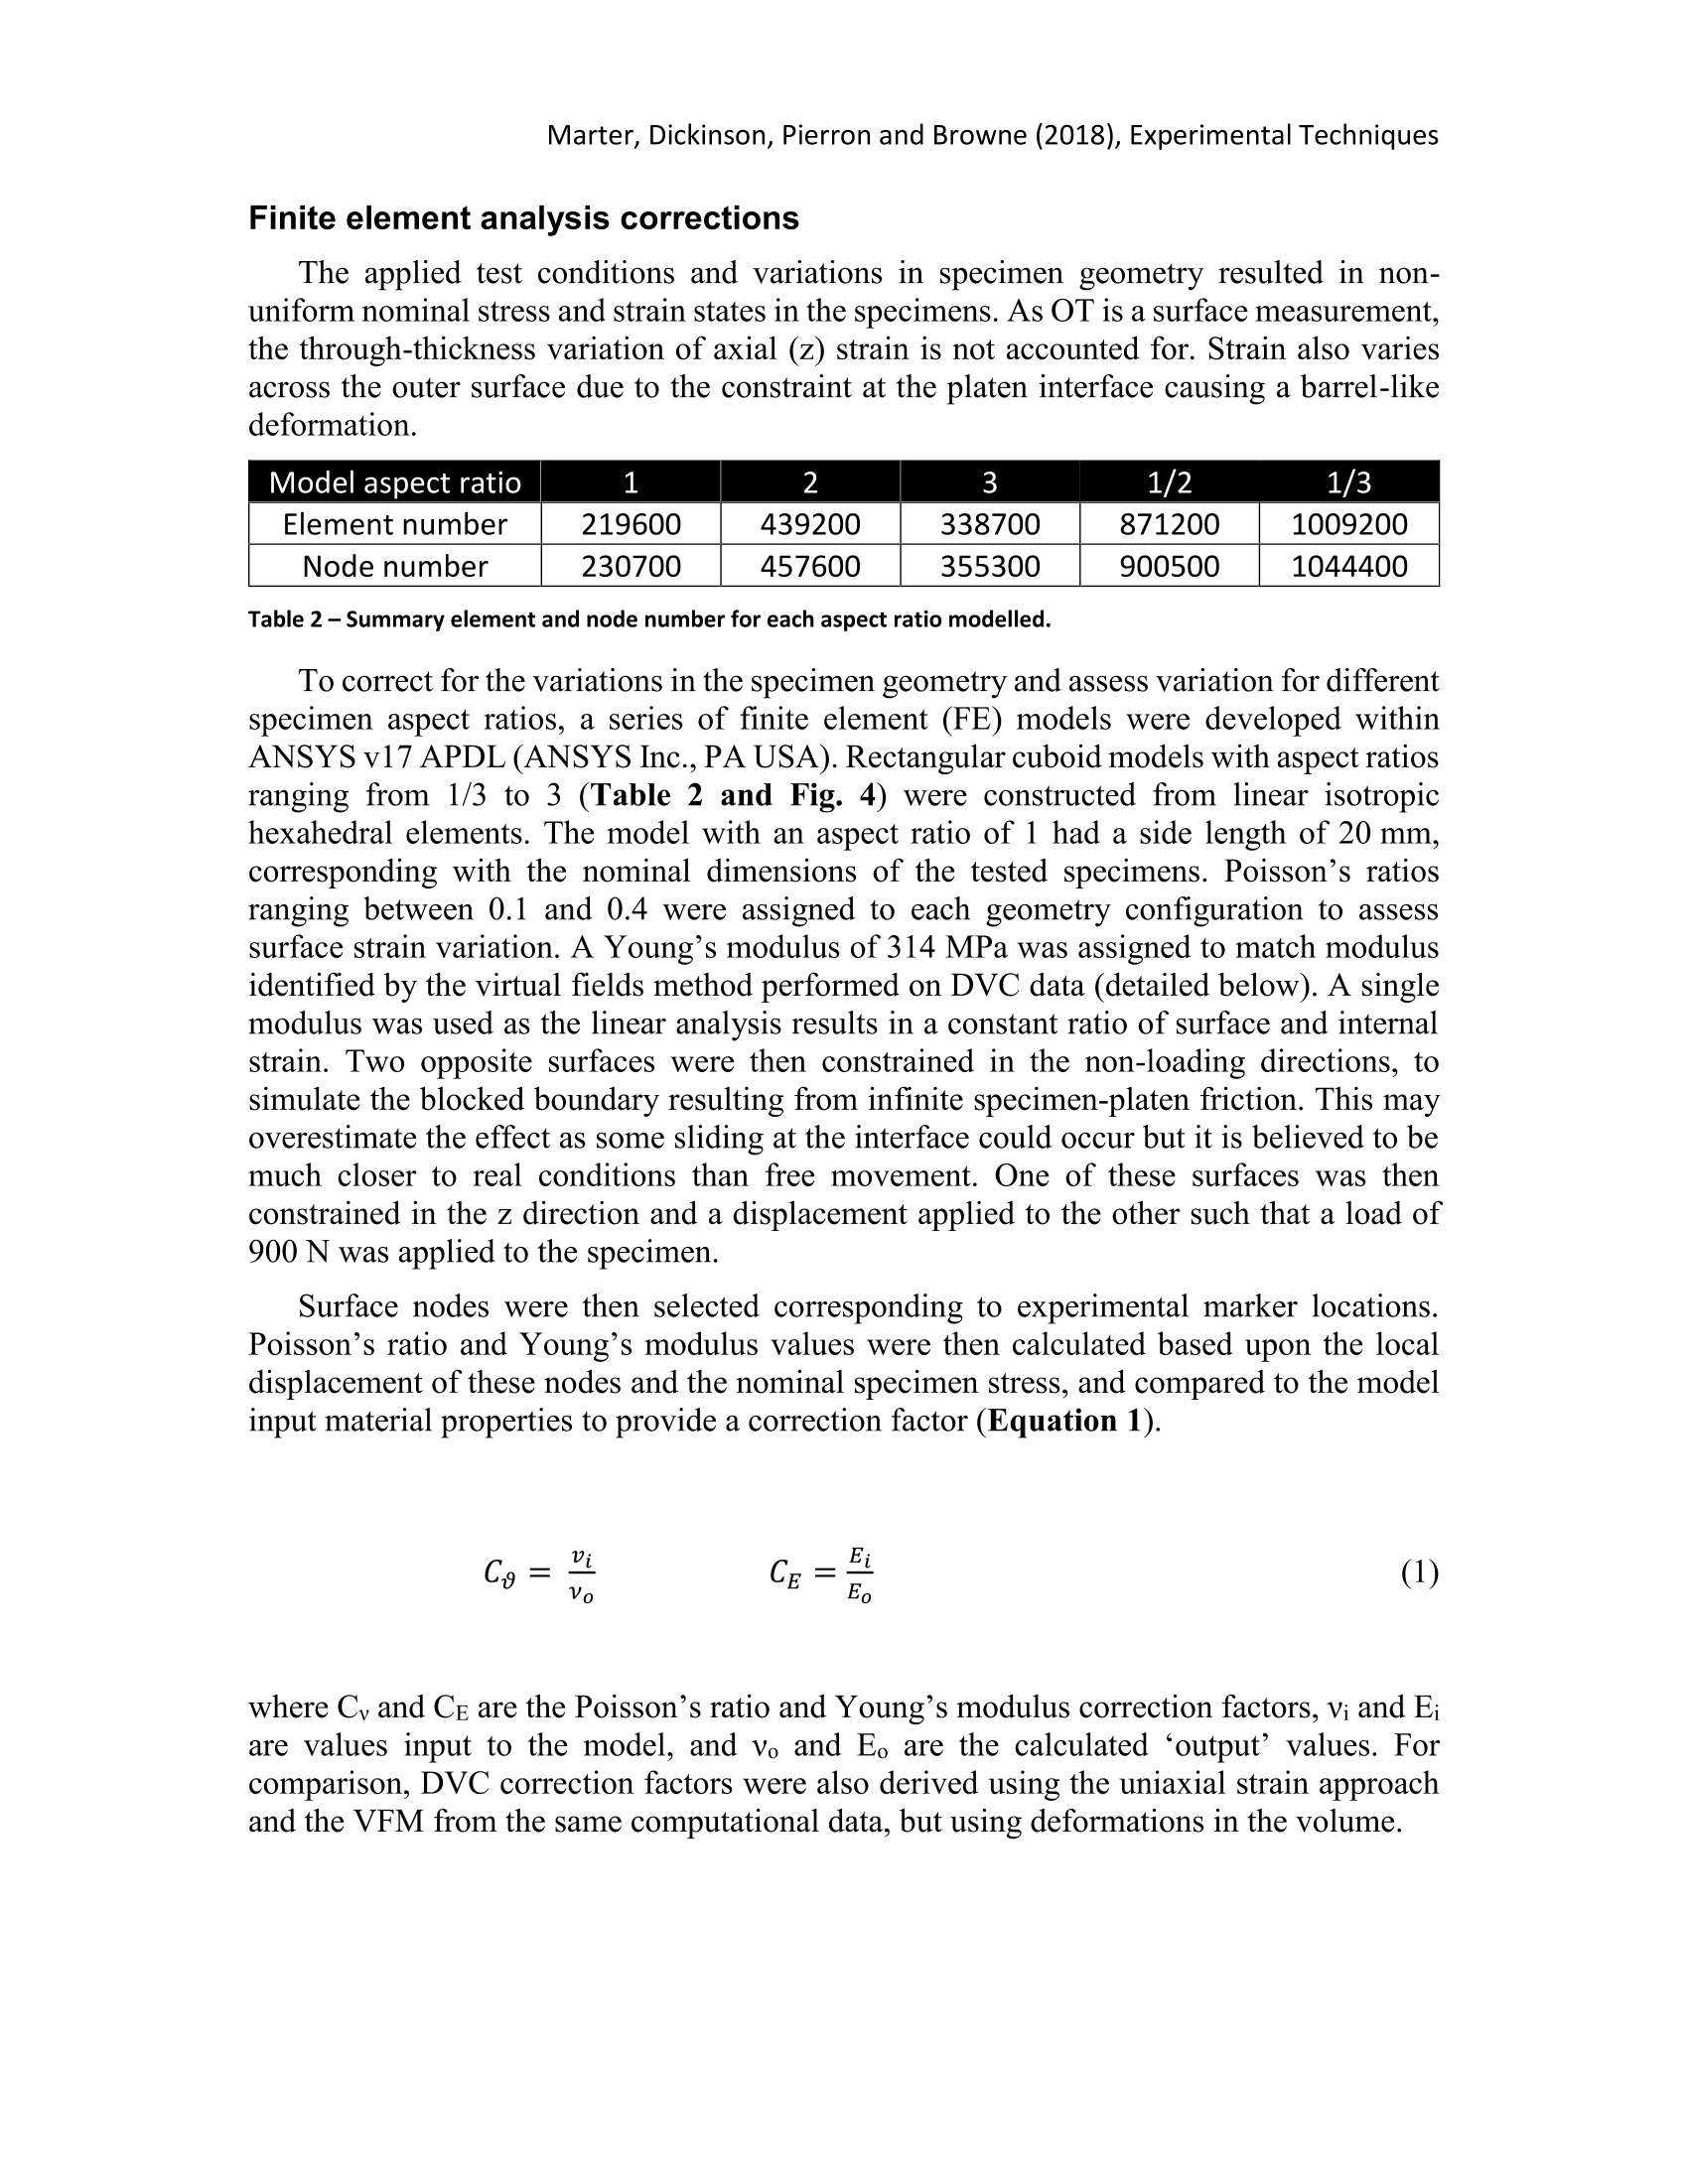
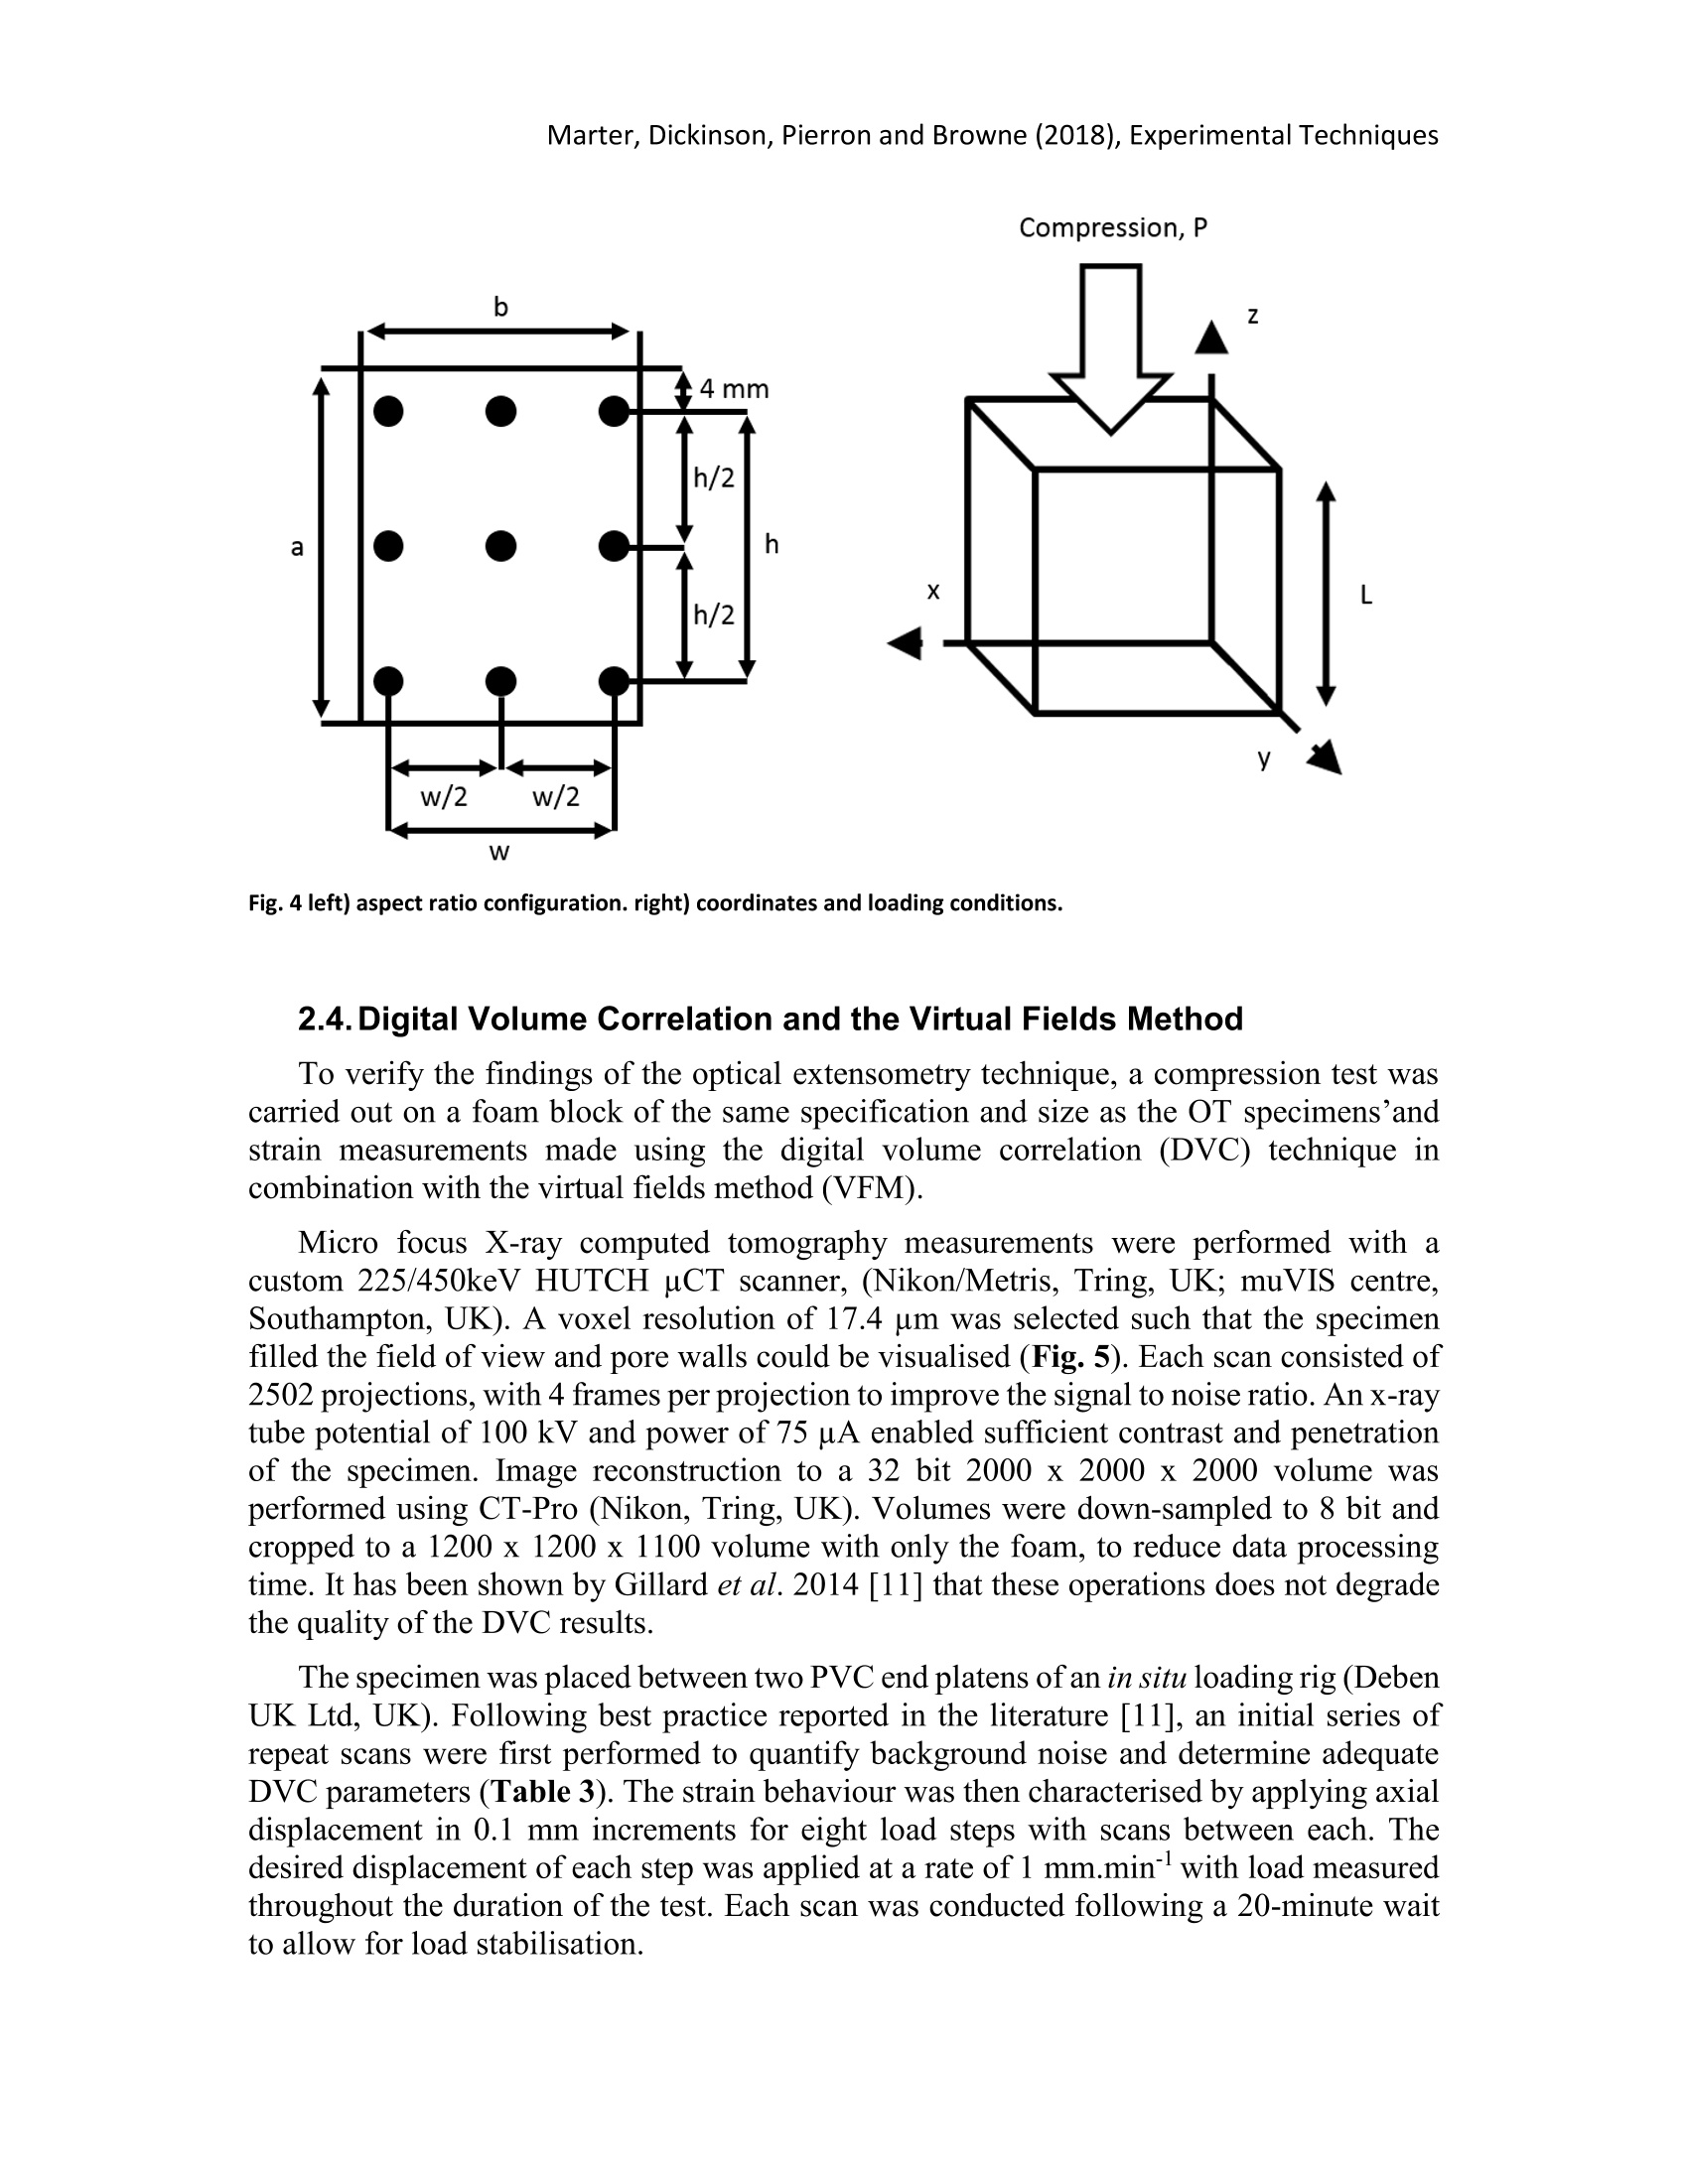
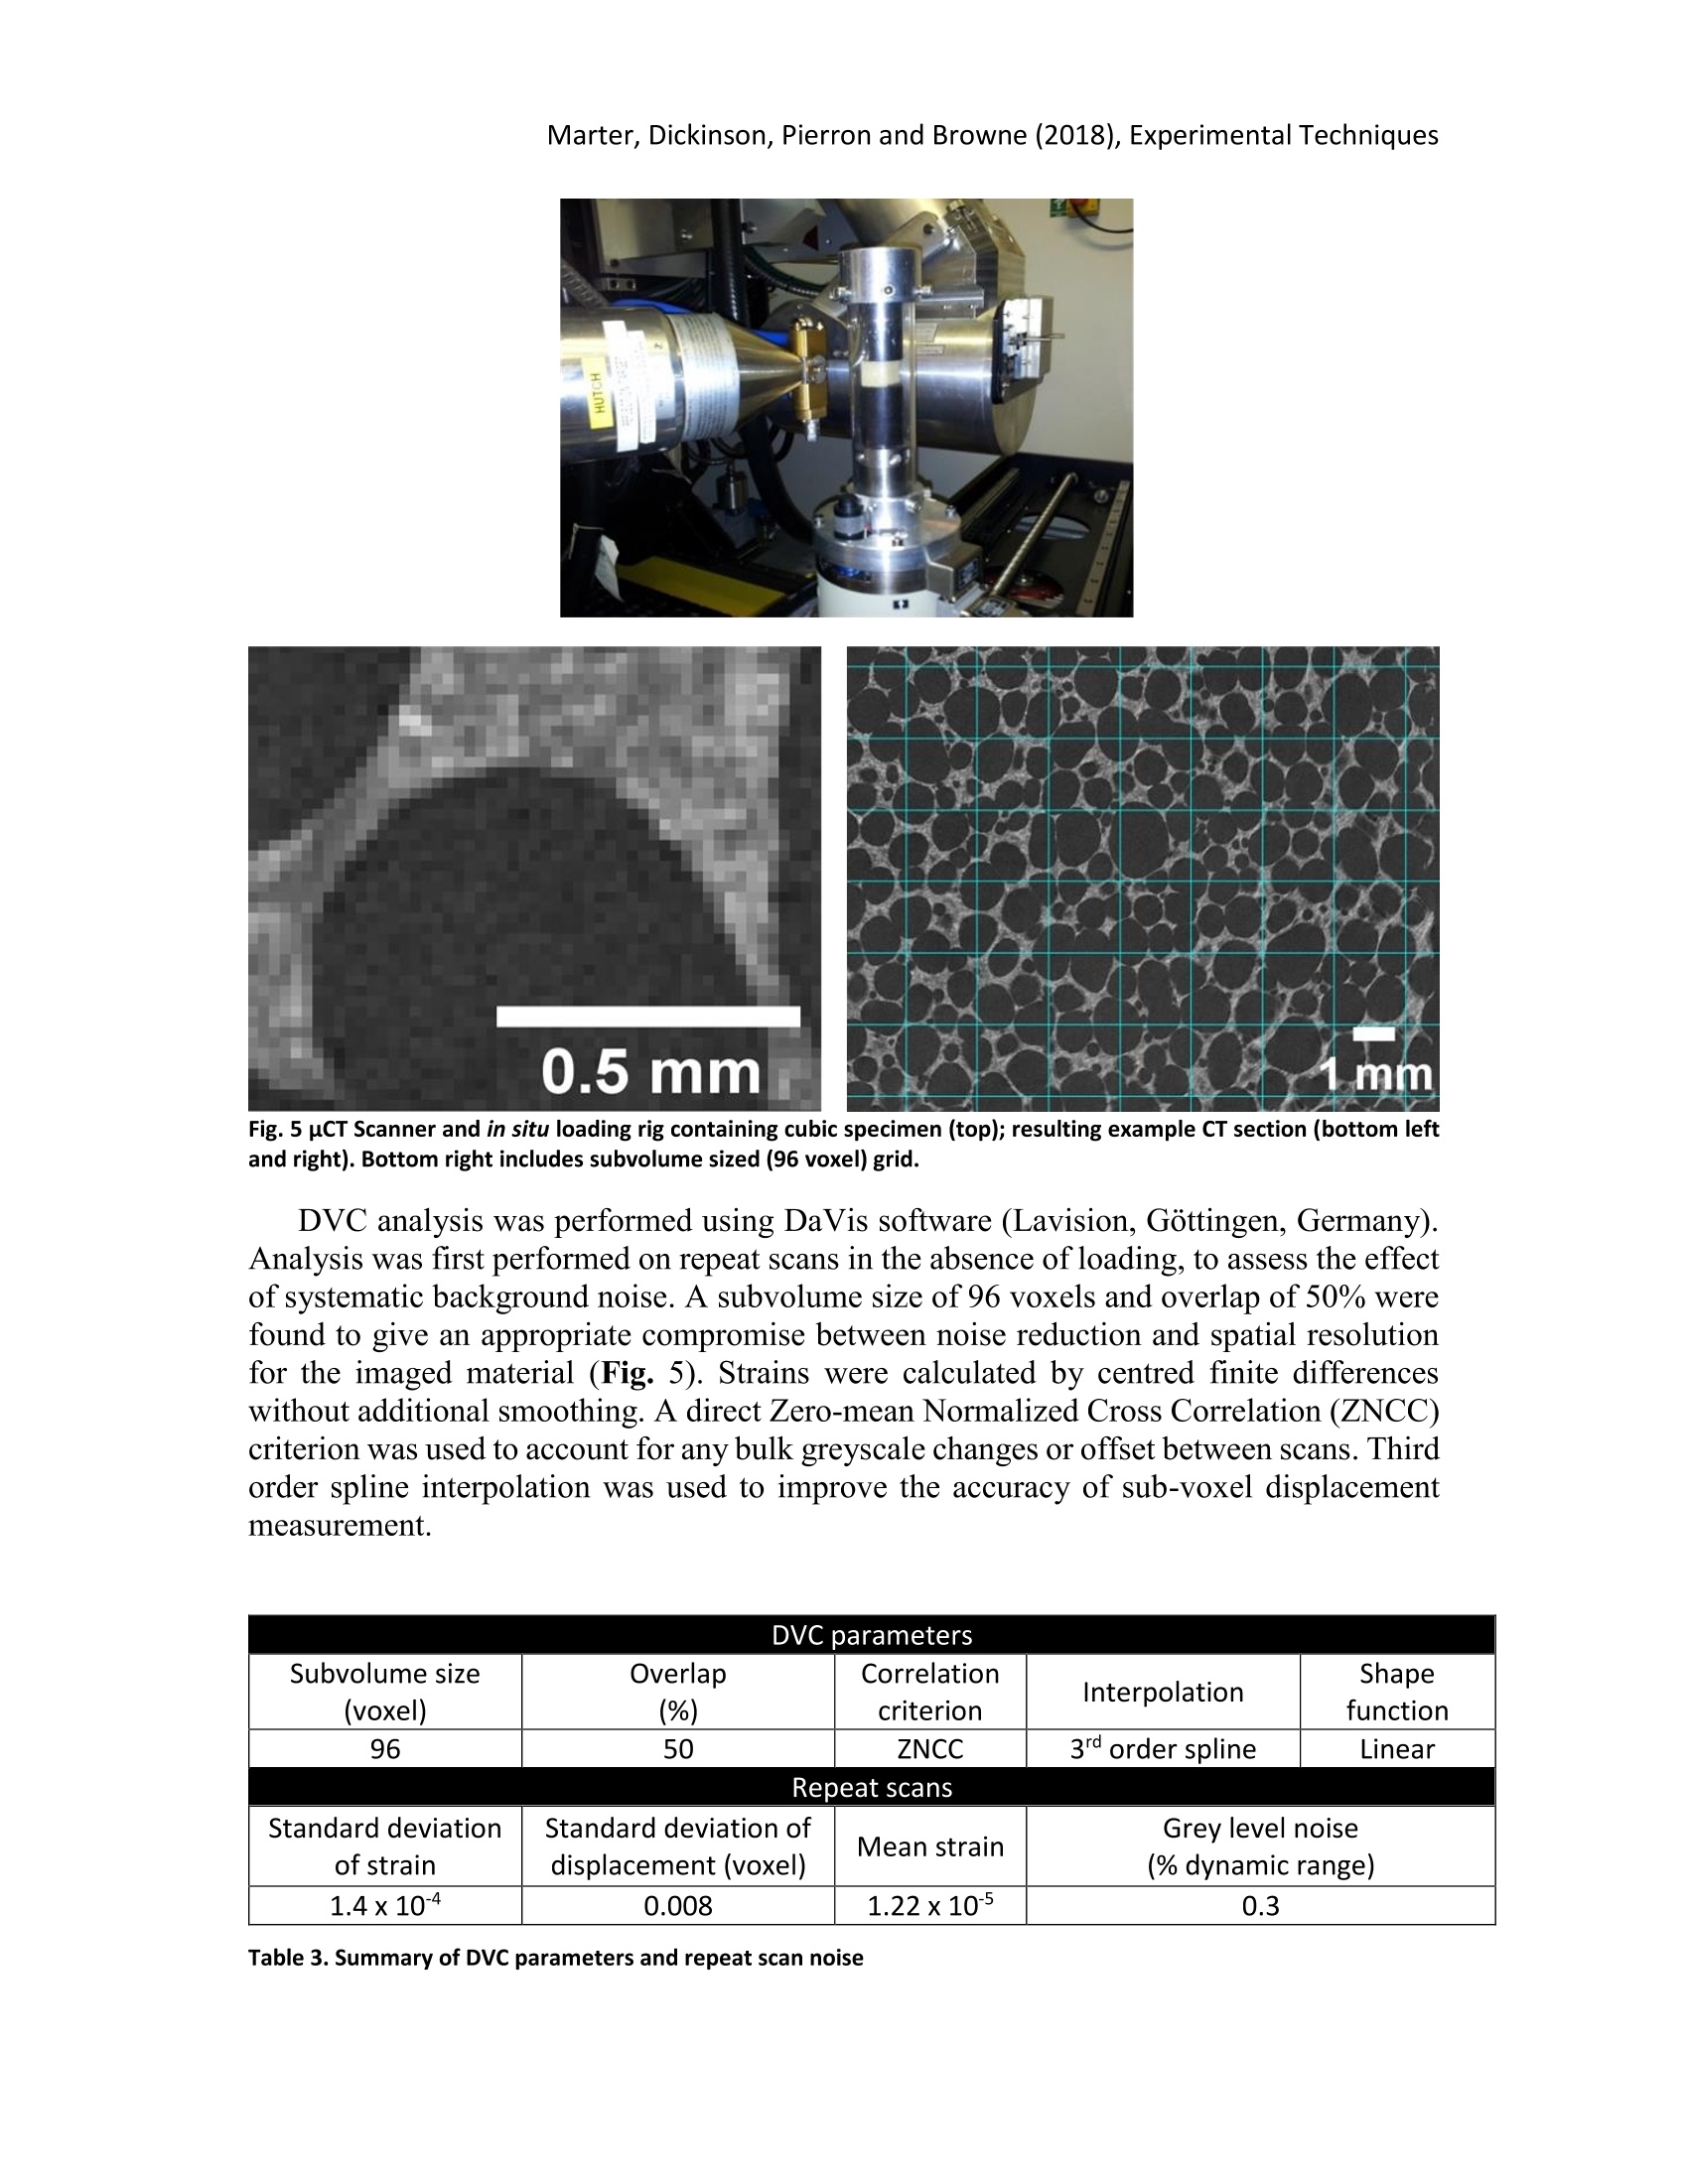
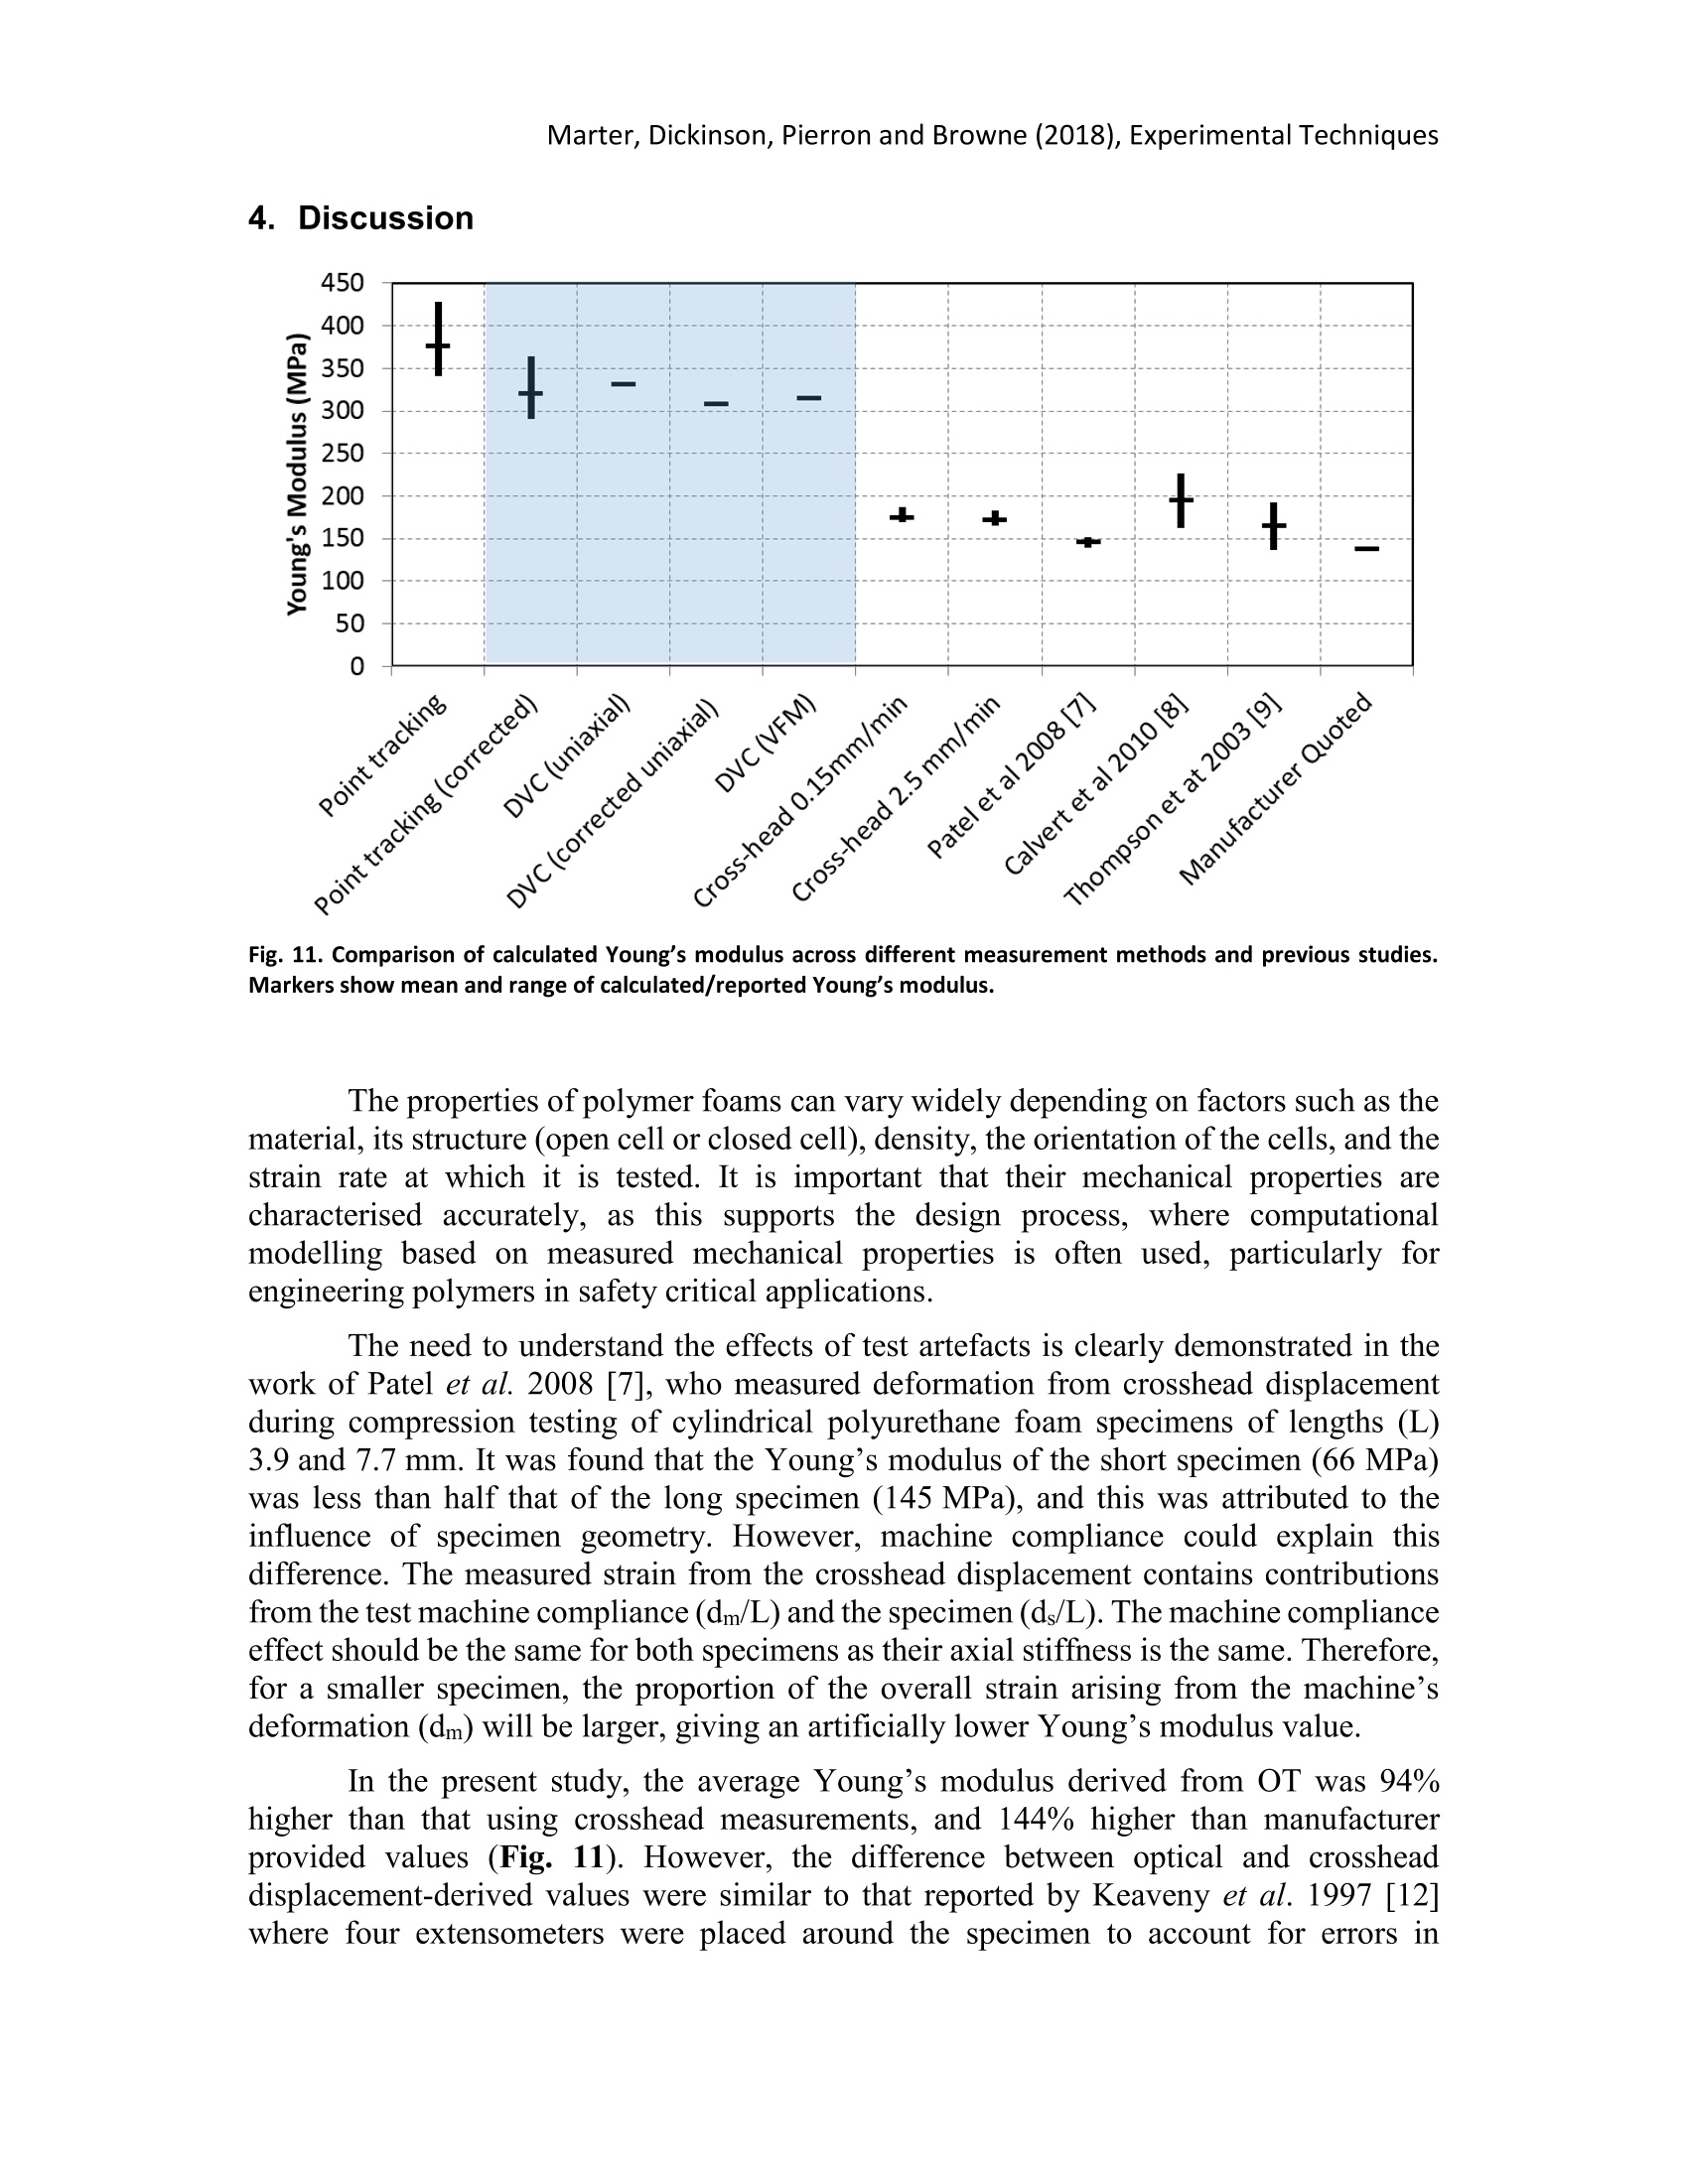
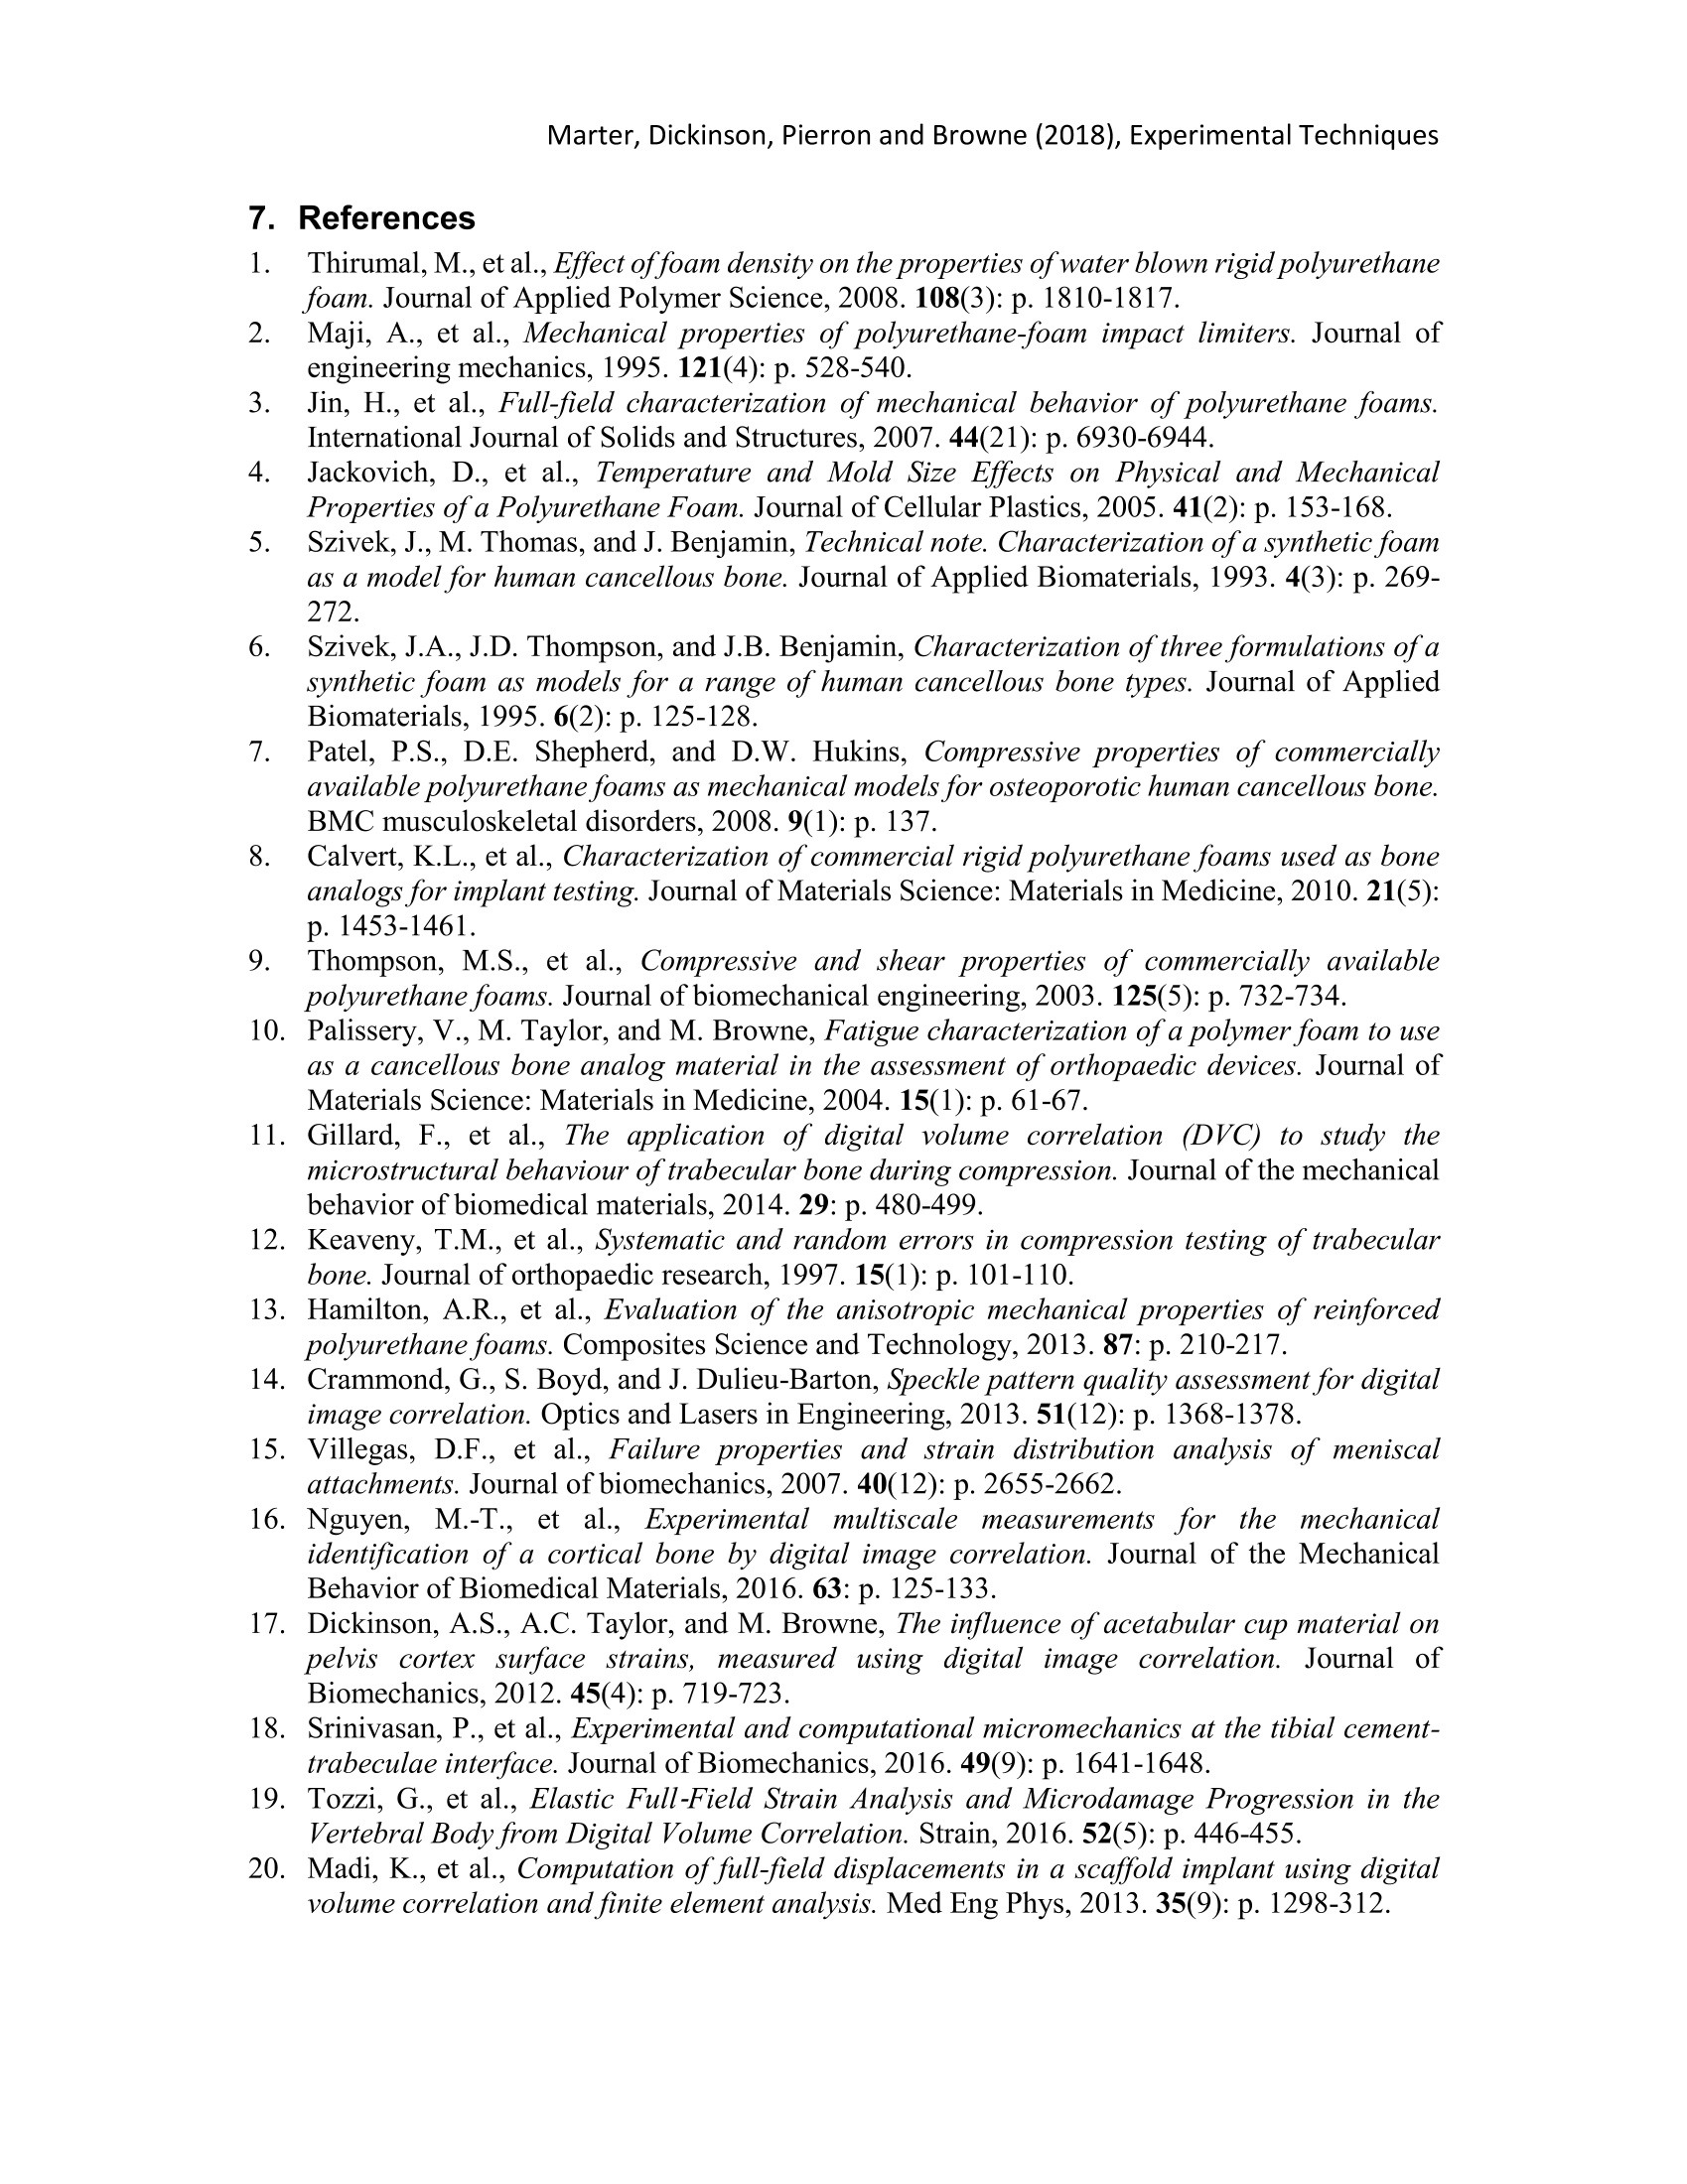
Marter, Dickinson,Pierron and Browne (2018), Experimental Techniques Table 7-Summary of Poisson's ratio results Note: this is an accepted draft of the peer-reviewed journal article: Marter, A.D., Dickinson, A.S., Pierron, F., Browne, M (2018):“A practical procedure for measuring the stiffness of foam like materials” Experimental Techniques X (X)pXXX-XXX This paper was accepted for publication on 22nd February 2018, subject to minor editorialchanges. This will be updated with a link to the final, fully proofed article once it is made availableby the publisher. Version 1, 22"d February 2018 Corresponding Author: Prof Martin Browne, doctor@soton.ac.uk A practical procedure for measuring the stiffness of foam like materials Alexander D Marter, Alexander S Dickinson, Fabrice Pierron, Martin Browne Bioengineering Science Research Group, Faculty of Engineering and the Environment,University of Southampton, UK 2 Engineering Materials Research Group, Faculty of Engineering and the Environment,University of Southampton, UK Abstract Polymer foams are used extensively in everyday life, from disposable packaging and softfurnishings through to engineering applications such as core structural materials in themarine industry or bone analogue materials for orthopaedic device testing. In theengineering field it is important that the mechanical behaviour of these materials ischaracterised correctly, as computationally based predictions of structural performancerely heavily on accurate input data. Mechanical property data from standard physical testssuch as uniaxial compression are subject to artefacts including non-uniformity of appliedloading, test fixture-sample contact conditions, and test machine compliance. These arewell-documented problems, which techniques such as extensometry and point tracking ofmarker pairs attempt to resolve. In particular, in addition to being non-contact, the use ofindividual marker pairs can reveal non-linear behaviours because of alignment issues. Inthe current work, a practical, accurate experimental methodology is introduced toinvestigate this issue. Uniaxial compression tests were conducted on cellular polyurethanefoam blocks. Both faces of the foam specimens were monitored using point tracking onmultiple marker pairstoaccount for misalignment. Sample deformationwassimultaneously measured by test-machine crosshead displacement. The Young’s modulusand Poisson’s ratio were calculated in both cases. To verify the measurements, digitalvolume correlation (DVC) was applied. DVC is a full-field non-contact strain measurementmethod that interrogates the interior structure of the foam to determine the physicalresponse. Results demonstrated that misalignment effects could easily be followed duringtesting, which averaged out on both front and back surfaces to produce a single modulusvalue. Considerable differences were evident between crosshead displacement calculatedmodulus and point tracking, indicating that artefacts can lead to substantial errors, asevidenced in the published literature. Keywords Polyurethane foam, optical extensometry, point tracking, digital volume correlation,DVC,test artefacts, analogue bone Acknowledgments The authors wish to extend thanks to Dr Mark Mavrogordato from the uVIS ComputedTomography Centre at the University of Southampton (Engineering and Physical SciencesResearch Council grant EP-H01506X) for performing the scans presented in this work. Mr A. Marter would like to acknowledge the Engineering and Physical SciencesResearch Council, who funded Alex’s CASE Conversion studentship via a DoctoralTraining Grant award ref EP/L505067/1 and DePuy Synthes. Prof. F. Pierronacknowledges support from the Wolfson Foundation through a Royal Society Wolfson Research Merit Award. Dr A. Dickinson acknowledges Research Fellowship funding fromthe Royal Academy of Engineering (Grant RF/130). These funding bodies had no directinvolvement in conducting the study or the decision to submit it for publication. The Authors declare that there is no conflict of interest. 1. Introduction Polymer foams, also referred to as rigid cellular plastics, are used extensively in adiverse range of applications, from domestic furnishings to high-end engineeringapplications. For the latter, accurate characterisation of the material is essential,particularly for safety-critical applications. To this end, standards have been developed tofacilitate mechanical property characterisation. The ASTM standard for measurement ofthe compressive properties of rigid cellular plastics (D1621) for example, recommendsusing the test machine crosshead drive system or a direct measurement of compressionplaten displacement in order to monitor displacement. In the literature, a number of studies have evaluated the mechanical properties ofpolyurethane (PU) foams [1-4], primarily in the context of an alternative to trabecular bone,considering compressive [5-8], shear [9] and fatigue [10] properties. However, results havevaried markedly as the uniaxial compression test is subject to a number of experimentalartefacts that degrade measurement accuracy: 1. Test machine compliance will result in an overestimate of sample deformation ifmeasurement is taken from the test machine crosshead. 2. Friction occurs between the sample and test machine platens. This may constrainPoisson’s effect at the sample ends and cause barrelling of the specimen [11] (Fig.1a). 3. Misalignment of test machine platens or misshapen sample ends can result in non-uniform loading of the sample (Fig. 1b). This can lead to considerable errors if a singleextensometer is used to measure displacement of the sample [12]. 4.. Finally, localised crushing of the specimen may occur, limiting the strain experiencedin the sample bulk (Fig. 1c). Such failure must be identified so that materialcharacterisation is conducted using pre-failure test data only. Fig. 1 Sources of experimental errors in uniaxial compression tests. Note: deformations have been exaggerated inorder to demonstrate these effects. The summation of these artefacts generally results in errors in Young’s modulus andPoisson’s ratio measurements. In particular, point 1) will lead to asystematicoverestimation of strain, hence underestimation of Young’s modulus. The ASTM standardD1621 does recommend a compliance calibration to correct strain measurements fromcrosshead displacements, however this correction is often not reported in the literature [1,6, 7, 9]. For example, a series of studies on a polyurethane foam commonly used as ananalogue bone medium, which used crosshead displacement measurements, has reportedvarying values of Young’s modulus for nominally the same foam (Table 1). Loading rate Strain.s Young’smodulus(MPa mean±SD) Author Measurementmethod(Foammanufacturer) length(mm) Specimen dimensions Cross-Sectionalarea(mm²) Density(Kg.m3) mm.min-1 Sawbones cellularrigid foam [15] 25.4 2580-23200 320 2.5 1.6x10³ 137 Last-A-Foam [16] 25.4 320 2.5 1.6x10³ 230.2 Szivek et al. 1995 [6]Crossheaddisplacement (manufactured byauthor's) 25 625 Not stated 72 48x10 110-134 Thompson et al.(2003) [9]Crosshead displacementSawbones) 40 314 332±5 1 4.2x10 164±27.8(±17%)* Patel et al. (2008) [7]Crossheaddisplacement (Sawbones) 3.9 64 320 (notmeasured) 0.78 3.3x10 66 7.9 1.56 145 Calvert etal. (2010)8] extensometer(Last-A-Foam) 15 45 Not stated 4.5 5x10³ 216±17(±8%)* 25.4 2580 288-352 2.5 1.6x10³ 195±32(±16%)* *plus/minus percentage range from average Table 1- Summary of test parameters and calculated moduli reported in literature and manufacturer technicalsheets. There have been attempts to address the mechanical testing issues listed above onfoam-like structures. For example, Keaveny et al., 1997 [12] have shown that cross-headdisplacement calculated strains in cancellous bone can lead to substantial errors in Young’smodulus (between 20-40%). To overcome the problem of platen misalignment, the use offour extensometers was shown to be quite efficient, yet this approach is not adopted in recent publications. More recently, digital image correlation (DIC)techniques have beenemployed for the assessment of fibre reinforced polyurethane foams [13]. While DIC isdata rich and can provide total surface displacement information, its capability is limitedwhen the structure being monitored does not have a pattern that can be tracked easily. Forexample, a solid foam, a foam with a very small cell size or a foam with a regular patternwould need a random speckle pattern applied on its surface. In addition the accuracy ofmeasurement is driven by the quality of the speckle pattern [14]. In the search for simplerexperimental methods that can capture this variability,the objective of the present studywas to assess a method of non-contact, direct specimen strain measurement for thecharacterisation of foam like materials. This was motivated by the need to obtain accuratemechanical property data for computational modelling, and to explain the variability indata reported in the literature. While Keaveny's study investigated the issue of strainmeasurement in a robust manner, Poisson’s ratio was not addressed, and nor was thenominal heterogeneity of stress and strain through the specimen thickness because of thehigh specimen thicknesses employed in these tests. The use ofextensometers is also subjectto slippage, contact with the specimen may influence its behaviour, simultaneousmeasurement of Poisson’s ratio is challenging, to account for uneven loading fourextensometers are required to measure each surface and they are required to be reattachedfor each specimen. The present study determines both Poisson’s ratio and Young'smodulus using an optically based point tracking technique using two cameras, equivalentto Keaveny’s four extensometers approach. This is verified using a data rich in-situ X-rayCT/DVC test. 2.. Methodology 2.1.Justification of Approach Non-contact measurement techniques such as i) optical surface extensometry/point-tracking (OT) [15], ii) digital image correlation (DIC) [16-18], and iii) digital volumecorrelation (DVC) [19-21] avoid many of the shortcomings associated with contact-baseddisplacement measurement methods. OT uses a structured array of ink point markers onthe sample’s surface, which are tracked and recorded photographically throughout loading.Image correlation is then used to track the displacement of each individual marker. In asimilar manner, DIC measures surface strains by tracking either a naturally occurring oruser-generated pattern on the sample’s surface. It is the full-field extension of OT whereeach pixel subset is used as a‘marker’. This requires however, that the specimen be markedby a continuous speckle pattern which is not always easy to achieve, in particular on opencell foams. In the present study, OT is employed as a simpler and less expensive versionof DIC. DVC is the bulk extension of DIC where volumes obtained for instance from X-ray computed tomography can be correlated before and after loading if the material exhibitsa sufficient natural pattern (i.e., X-ray absorption contrast), which is the case for foams ingeneral [22]. Such non-contact methods remove mechanical extensometer errors (slippage,misalignment), are less sensitive to the test machine end-artefacts listed above [23], andbecause strain measurements are taken directly on or within the sample, material propertyassessment should be more accurate as the measurements are not affected by test machinecompliance. Use of DVC is advantageous as complete full-field strain measurement ispossible and therefore no assumption has to be made that the surface strains represent thebulk strains. While this could be considered as representing the ‘gold standard’, the testtime and cost is significantly higher than camera-based OT. 2.2.Sample Preparation Testing was conducted on cubic samples of 0.32 g.cm’cellular rigid polyurethanefoam (SAWBONESTM, Sawbones Europe AS, Malmo, Sweden), all sectioned from thesame block using a band saw. Specimens were cut to a nominal edge length of 20 mm toallow sufficient repeating cells(average cell size~lmm) to satisfy a continuumassumption [24] and maintain suitable CT resolution to resolve cell walls. Four specimenswere tested using OT, and the crosshead displacement was also measured for each test. Afifth specimen was tested using DVC. The apparent density of each specimen wascalculated by measurement of dimensions by digital callipers and mass by electronicbalance (with precisions of 0.01 mm and 0.0001 g respectively) in accordance with ASTMD1622. 2.3.Optical extensometry The front and back of each specimen were marked with nine dots using a felt-tip pen(Fig.2) from which discrete tracking pairs were selected. The dot size was approximately1.5 mm (150 and 100 pixels for the front and back respectively; see Fig.2 caption). Twocameras (AVT Manta G504B, 2452 x 2056 pixels, 8-bit) fitted with a fixed focal length lens (Sigma 105mm f/2.8 EX DG Macro) were used to image the specimen’s front andback faces (see Fig.2). Fig. 2 Marker arrangement and experimental schematic for OT. Note: camera two is further away as the test machinebase extended backwards obstructing placement of the tripod. FL: front left; FC: front centre; FR: front right; BL: backleft; BC: back centre;BR: back right. Each specimen was compressed in a screw-driven electromechanical testing machinewith a 2kN capacity load cell (Instron 5569, Instron, High Wycombe, UK) at adisplacement rate of 0.15 mm/min (1.25 x 10⁴sl) from an initial preload of 10 N. Toevaluate whether loading rate would influence the results, seco est at2.5 mm/min (1.6x 10’s) was performed. In each test compressive displacement wasapplied up to a load of 900 N (about 2 MPa). This load was chosen such that the sampleremained considerably below the manufacturer-quoted yield strength of 5.4 MPa andbehaved elastically. No lubrication was applied to sample-platen interfaces as thetransversely constrained boundary condition (due to friction) could be more simplymodelled when calculating a surface strain correction factor. During compression, an average of 10 and 75 images were recorded throughout the test for loading rates of2.5 mm.minand 0.15 mm.min, respectively, with an image exposure time of 500microseconds. Marker movement was tracked and the displacement of the centre of gravityof each point was obtained by image correlation using the point tracking module ofMatchID (www.matchidmbc.com). The uncertainty of the displacement(standarddeviation of displacements of all the points between two stationary images,) was 0.05pixels. From this, the strain uncertainty was 0.05/h=5.6 x 10, where h=900 pixels wasthe distance between the dots. An overview of the OT procedure is presented in Fig. 3. During each test, crosshead displacement was also recorded to allow comparativeelastic modulus calculation with the assumption of zero machine compliance. For eachmeasurement technique the modulus was defined by the slope of the linear region of thestress-strain response [6, 8]. Fig. 3 Flow diagram of OT procedure, mechanical property calculation and application of FE corrections. Eor=vertical or horizontal marker pair strain, d=distance between vertical or horizontal tracking pair marker centres,o = specimen stress, vor= horizontal marker pair Poisson’s ratio, Eor= specimen Young’s modulus, EcoT =corrected specimen Young’s modulus, vcor=corrected horizontal marker pair Poisson’s ratio. Finite element analysis corrections The applied test conditions and variations in specimen geometry resulted in non-uniform nominal stress and strain states in the specimens. As OT is a surface measurement,the through-thickness variation of axial (z) strain is not accounted for. Strain also variesacross the outer surface due to the constraint at the platen interface causing a barrel-likedeformation. Model aspect ratio 1 2 3 1/2 1/3 Element number 219600 439200 338700 871200 1009200 Node number 230700 457600 355300 900500 1044400 Table 2-Summary element and node number for each aspect ratio modelled. To correct for the variations in the specimen geometry and assess variation for differentspecimen aspect ratios, a series of finite element (FE) models were developed withinANSYS v17 APDL (ANSYS Inc., PAUSA). Rectangular cuboid models with aspect ratiosranging from 1/3 to 3 (Table 2 and Fig. 4) were constructed from linear isotropichexahedral elements. The model with an aspect ratio of 1 had a side length of 20 mm,corresponding with the nominal dimensions of the tested specimens. Poisson’s ratiosranging between 0.1 and 0.4 were assigned to each geometry configuration to assesssurface strain variation. A Young’s modulus of 314 MPa was assigned to match modulusidentified by the virtual fields method performed on DVC data (detailed below). A singlemodulus was used as the linear analysis results in a constant ratio of surface and internalstrain. Two opposite surfaces were then constrained in the non-loading directions, tosimulate the blocked boundary resulting from infinite specimen-platen friction. This mayoverestimate the effect as some sliding at the interface could occur but it is believed to bemuch closer to real conditions than free movement. One of these surfaces was thenconstrained in the z direction and a displacement applied to the other such that a load of900 N was applied to the specimen. Surface nodes were then selected corresponding to experimental marker locations.Poisson’s ratio and Young’s modulus values were then calculated based upon the localdisplacement of these nodes and the nominal specimen stress, and compared to the modelinput material properties to provide a correction factor (Equation 1). where Cy and CE are the Poisson’s ratio and Young’s modulus correction factors, vi and E;are values input to the model, and vo and E。 are the calculated ‘output’values. Forcomparison, DVC correction factors were also derived using the uniaxial strain approachand the VFM from the same computational data, but using deformations in the volume. Fig. 4 left) aspect ratio configuration. right) coordinates and loading conditions. 2.4. Digital Volume Correlation and the Virtual Fields Method To verify the findings of the optical extensometry technique, a compression test wascarried out on a foam block of the same specification and size as the OT specimens'andstrain measurements made using the digital volume correlation (DVC) technique incombination with the virtual fields method (VFM). Micro focus X-ray computed tomography measurements were performed with acustom 225/450keV HUTCH uCT scanner, (Nikon/Metris, Tring, UK; muVIS centre,Southampton, UK). A voxel resolution of 17.4 um was selected such that the specimenfilled the field of view and pore walls could be visualised (Fig.5). Each scan consisted of2502 projections, with 4 frames per projection to improve the signal to noise ratio. An x-raytube potential of 100 kV and power of 75 uA enabled sufficient contrast and penetrationof the specimen. Image reconstruction to a 32 bit 2000 x 2000 x 2000 volume wasperformed using CT-Pro (Nikon, Tring, UK). Volumes were down-sampled to 8 bit andcropped to a 1200 x 1200 x1100 volume with only the foam, to reduce data processingtime. It has been shown by Gillard et al. 2014 [11] that these operations does not degradethe quality of the DVC results. The specimen was placed between two PVC end platens of an in situ loading rig (DebenUK Ltd, UK). Following best practice reported in the literature [11], an initial series ofrepeat scans were first performed to quantify background noise and determine adequateDVC parameters (Table 3). The strain behaviour was then characterised by applying axialdisplacement in 0.1 mm increments for eight load steps with scans between each. Thedesired displacement of each step was applied at a rate of 1 mm.min-with load measuredthroughout the duration of the test. Each scan was conducted following a 20-minute waitto allow for load stabilisation. 0.5 mmmm Fig.5 pCT Scanner and in situ loading rig containing cubic specimen (top); resulting example CT section (bottom leftand right). Bottom right includes subvolume sized (96voxel) grid. DVC analysis was performed using DaVis software (Lavision, Gottingen, Germany).Analysis was first performed on repeat scans in the absence of loading, to assess the effectof systematic background noise. A subvolume size of 96 voxels and overlap of 50% werefound to give an appropriate compromise between noise reduction and spatial resolutionfor the imaged material (Fig.5). Strains were calculated by centred finite differenceswithout additional smoothing. A direct Zero-mean Normalized Cross Correlation (ZNCC)criterion was used to account for any bulk greyscale changes or offset between scans. Thirdorder spline interpolation was used to improve the accuracy of sub-voxel displacementmeasurement. DVC parameters Subvolume size(Voxel) overlap(%) Correlation Interpolation Shape criterion function 96 50 ZNCC 3rd order spline Linear Repeat scans Standard deviation Standard deviation of Mean strain Grey level noise displacement (voxel) (% dynamic range) of strain 1.4x10⁴ 0.008 1.22x10 0.3 Table 3. Summary of DVC parameters and repeat scan noise The virtual fields method (VFM) was used to remove the effect of possible unevenloading in the calculation of Young’s modulus and Poisson’s ratio. The VFM has beensuccessfully used to investigate the mechanical properties of a variety of materials,including composites [25,26], polymers [27, 28], and metals [29, 30]. These studies usedsurface measurements, requiring the assumption of through-thickness uniformity. Gillardet al. 2014 [11] used full-field micro CT data with DVC analysis to determine the Poisson’sratio of porcine cancellous bone. However, their experimental setup did not allow for insitu measurement of load and hence Young’s modulus was not obtained. The VFM uses full field strain data to find a stress field that satisfies equilibrium.This is based on the principle of virtual work, which is the work done on a particle by theforces which act on it following the application of a hypothetical displacement [31]. Oncethe stress field is known, and displacement is monitored by following identifiable featureswithin the material volume, it is possible to establish Young's modulus and Poisson’s ratioof the material. For a full description ofthe VFM, the reader is referred to the work ofPierron and Grediac [321. For verification, Poisson’s ratio and Young’s modulus were also calculated byusing the spatial averages of Exx, Syy and Ezz over the entire volume and the ozz stress fromthe compressive load divided by the loaded cross sectional area. This however assumes auniaxial state of uniform compressive stress, while the VFM does not. 3.. Results Test machine compliance, platen/specimen friction, misalignment and crushing of thespecimen can affect the measurement of strain. The issue of crushing was circumvented inthis study by operating well below the yield strength of the material. However, theremaining factors could have influenced strain measurement and are each presented below. 3.1. Test machine compliance Modulus calculated by crosshead data was 172 MPa and 174 MPa for specimenstested at 2.5 mm.min and 0.15 mm.min°(Table 4), respectively. However, these resultsinclude the deflection of the test machine, leading to an underestimation of Young’smodulus of the specimen. By using the OT technique, calculated from the average of thesix strain measurements, then scaled by the FE derived correction factor to account forthrough thickness strain variation, specimen displacements are directly measured andhence exclude machine compliance effects. This led to the average elastic modulus derivedfrom the OT data of 321 MPa and 349 MPa for specimens tested at 2.5 mm.min and0.15 mm.min(Table 4), respectively. 3.2. Platen Misalignment Using the OT technique, it is possible to track how strain varies in a specimen as aresult of platen misalignment (illustrated in Fig. 1). For example tracking the movement ofthe FL and BL markers (Fig. 2) allows the stress-strain response on the left of the specimento be determined. In one specimen (Fig. 6a),the response is initially non-linear, with arapid stress increase followed by a linear region. Conversely, the stress-strain curve formarker pairs FR and BR produced an almost mirrored response, with a marked toe-inbefore becoming linear, indicating that while load is applied immediately on the left of thespecimen, there is a delay before the load is registered on the right hand side. By averagingeach vertical tracking pair front to back any non-uniform loading in this direction wasremoved, as well as possible effects of out-of-plane movement. This resulted in the centralregion response converging towards the linear all-marker average (Fig. 7a). As some non-uniform loading still occurred left to right, the front-to-back averaged marker pairs on theouter extremity still showed a non-linear response,mirroring the response of the other side.A similar effect was noted in a further specimen where uneven loading primarilypropagated from front to back (Fig. 6b and Fig. 7b). When measurements were averagedacross all locations a near linear response was observed (R2>0.99). For each specimen, themaximum strain observed varied by measurement location, typically between 2000 ue and7000 pe. This resulted in a maximum variation in Young’s modulus of 80 MPa (front toback) and 73 MPa (left to right), representing 19 % and 17% of the mean response acrossthe whole specimen. a) b) Fig.6 OT loading response split by vertical marker pairs showing dominant a) left to right, and b) front to back unevenloading. Note: Stresses and strains here are represented within positive quadrant although compressive loading wasapplied to the specimen. Fig. 7 OT loading responses split by vertical marker pairs averaged front to back. Note: stresses and strains here arerepresented within positive quadrant although compressive loading was applied to the specimen. 3.3.Platen-Specimen friction The FE results showed that platen-specimen constraint resulted in increasedcompressive z strain at the specimen’s centre compared to the surface. The x and y straindistribution showed regions of diminished strain extending in the z direction from theblocked boundary condition (Fig. 8). This strain distribution is evident from the responseof the transverse marker pairs (Fig.9). Poisson’s ratio was calculated from the top, centreand bottom specimen marker pairs on both the front and back of each specimen. In eachcase Poisson’s ratio was derived by the average strain of all six vertical marker pairs. In all specimens the central section expanded the most giving the largest Poisson’s ratio of 0.33.As expected due to the constraint provided by the non-lubricated platen to specimencontact, Poisson’s ratio calculated at the top and base was lower, averaging to 0.26.Following the application of the FE correction factors Poisson’s ratio became 0.30 at thecentre and 0.34 near the specimen-platen interface. A summary of all calculated Poisson’sratio values is provided in appendix Table 7. Fig. 8 strain profiles calculated by FEA. a) x-strain,b) y-strain, c) z-strain. Fig. 9 Horizontal strains at each marker pair height against averaged vertical strain. Note: Strains here arerepresented within positive quadrant although compressive loading was applied to the specimen. The influence of platen constraint could be observed in particular by varying thespecimen dimensions. When calculated by surface strain points (the OT markers) andaveraged uniaxial stress/strain, FE results showed that altering the specimen aspect ratioand input Poisson’s ratio had a considerable effect on calculated Young’s modulus andPoisson’s ratio. Accuracy was lowest for the OT and averaged uniaxial stress/strainapproaches when lower aspect ratios were modelled. However, calculated materialproperties tended to the modelled values for aspect ratios greater than 1. For both of thesemethods, error in the calculated Poisson’s ratio was greater for smaller input Poisson’sratios. The opposite trends were observed for calculated Young’s modulus. For the benefitof other researchers, the correction factors are presented for application to experimentaldata after applying a second order polynomial to the data extracted from the FEA models(appendix Table 5 and6). Little variation was observed between input material propertiesand those calculated by the virtual fields method (difference<1%). 3.4.DVC Verification The Young’s modulus of the foam derived from DVC data was 331 MPa and 314 MPawhen calculated from the uniaxial stress approach and VFM, respectively (Table 4).Poisson’s ratio results from DVC data were 0.35 and 0.33 when calculated from theuniaxial stress approach and VFM, respectively (appendix Table 7). Testing morespecimens would enable an estimation of material variability but this is beyond the scopeof the present methodology paper. Significantly, the results show that crossheaddisplacement based measurement would underestimate the modulus by a factor two,whereas both OT with front-back/ side-to-side averaging, and DVC provide consistentvalues. The averaged stress-strain behaviour calculated by each of the three experimentalmethods is plotted in Fig. 10. Method Sample dimensions Density(g.cm) Loading rate Young's height(mm) Cross-Sectional area (mm²) mm.min1 Strainrate (s 1) modulusMPa mean (range) OT uncorrected) 20 400 0.323±0.0026 2.5 2.1x10⁻³ 358 (306-411) OT(corrected) 0.15 1.25 x10⁴ 390(340-436) 2.5 2.1x10³ 321 (276-370) Crossheaddisplacement 0.15 1.25x10⁴ 349(305-390) 2.5 2.1x10³ 172(165-183) DVC (constant stress) 0.15 1.25 x10⁴ 174 (173-189) DVC (constant stresscorrected) 0.314 Quasi static 331 307 DVC (VFM) 314 Table 4. Summary of sample dimensions, loading parameters and elastic modulus results. adjusted by straininhomogeneity correction factor (see discussion). Only green cells provide accurate modulus values (relative to‘goldstandard'VFM/DVC). Fig. 10 Stress-strain curve for each measurement method. Correction factors have been applied to non-contactmethods. For comparison, an idealised stress-strain plot for the manufacturer-quoted modulus is shown. Note:Stresses and strains here are represented within positive quadrant although compressive loading was applied to thespecimen. 4.Discussion Fig. 11. Comparison of calculated Young’s modulus across different measurement methods and previous studies.Markers show mean and range of calculated/reported Young’s modulus. The properties of polymer foams can vary widely depending on factors such as thematerial, its structure (opencell or closed cell), density, the orientation of the cells, and thestrain rate at which it is tested. It is important that their mechanical properties arecharacterised accurately, as this supports the design process, where computationalmodelling based on measured mechanical properties is often used, particularly forengineering polymers in safety critical applications. The need to understand the effects of test artefacts is clearly demonstrated in thework of Patel et al. 2008 [7], who measured deformation from crosshead displacementduring compression testing of cylindrical polyurethane foam specimens of lengths (L)3.9 and 7.7 mm. It was found that the Young’s modulus of the short specimen (66 MPa)was less than half that of the long specimen (145 MPa), and this was attributed to theinfluence of specimen geometry. However, machine compliance could explain thisdifference. The measured strain from the crosshead displacement contains contributionsfrom the test machine compliance(dm/L) and the specimen (ds/L). The machine complianceeffect should be the same for both specimens as their axial stiffness is the same. Therefore,for a smaller specimen, the proportion of the overall strain arising from the machine’sdeformation (dm) will be larger, giving an artificially lower Young’s modulus value. In the present study, the average Young’s modulus derived from OT was 94%higher than that using crosshead measurements, and 144%higher than manufacturerprovided values (Fig. 11). However, the difference between optical and crossheaddisplacement-derived values were similar to that reported by Keaveny et al. 1997 [12]where four extensometers were placed around the specimen to account for errors in misalignment. The method used in the present study has the additional advantage oftransverse measurement enabling the calculation of Poisson’s ratio. Such a highdiscrepancy in Young’s modulus could have implications for modelling the foam, where,for example, the assignment of a lower Young’s modulus for the foam (often used torepresent bone) based on manufacturer quoted values, would predict higher than expecteddeflection of an implant under loading. A further advantage of the OT method is theavoidance of test machine dependency, through direct measurement of the sample itself.Testing the same material on two different machines could lead to different stress/strainresponses, which in turn would lead to variances in Young’s modulus (Table 1 and Fig10). Using OT, the average Young’s modulus was 374 MPa, 13% higher than the DVCresults (Table 4 and Fig. 11). However, on inspection of the FE data for this specimengeometry, the average z-strains over the specimen volume were 10.5% higher than thoseat the surface. Using this as a correction factor the estimated elastic modulus becomes335MPa, within 6% of the reference DVC calculated modulus, where strains are measuredand averaged in the volume, inherently accounting for this inhomogeneity. One of the difficulties when using single camera imaging for OT or DIC is that anyout-of-plane movement will result in spurious strains by changing the magnification [33].The out-of-plane movements caused by Poisson’s effect can be neglected [28] but anyrigid-body movement will generally cause significant strains. These spurious strains aregiven by dx/x where dx is the out-of-plane movement and x is the imaging distance.However, if the specimen moves forward to the front camera, causing a positive spuriousstrain, it will move away from the back camera, causing a negative strain of the samemagnitude. Hence,averaging between front and back using two cameras effectivelyremoves this effect, as demonstrated in Moulart et al. 2006 [34].Using this configuration,any misalignment or uneven loading that occurs may also be compensated by averagingacross tracking pairs (Moulart et al.2006 [34]). Use of horizontal marker pairs enabledPoisson's ratio calculation at different heights of the specimen. This configuration isequivalent to the four extensometers approach of Keaveny et al.1997 [12], where the sidemarkers replace markers on the lateral faces, enabling the use of only two cameras insteadof four, which greatly simplifies the procedure. OT strain results showed notable variability at different measurement locations onthe same specimen (Fig.6), indicating non-uniform loading did occur within all specimens,despite the care taken to try to apply uniform loading. However, averaging across multiplepoints compensated for these effects, as also reported in Keaveny et al. 1997 [12], andyielded linear profiles. This approach has also been adopted in plate specimens, where frontand back strains differed substantially but averaged to give the expected result [34-36]. Theobserved variability is likely multi-causal (specimen shape, platen-specimen contact,platen to test machine connection, test machine cross-head alignment, out-of-planespecimen movement), highlighting the need to measure at multiple locations, theimportance of avoiding specimen skew during preparation, and the large errors resultingfrom crosshead displacement use. When all experimental care described previously hasbeen taken, intra-specimen variability was low in comparison to inter specimen variability.As the foaming rise direction was not recorded prior to the machining of specimens, andspecimens were always tested in the same direction, it is possible that material anisotropy caused some of the inter-specimen variability. In addition, the sample material includedshort fibre reinforcement of unknown fibre orientation and distribution. As such the sampledimensions may not have been sufficient to ensure completely uniform properties betweenspecimens. The FE results illustrate that the VFM, which used bulk measurements, wascompletely insensitive to specimen aspect ratio as there is no hypothesis on stress state andvolume strains are processed instead of surface strains. For the OT approach it was evidentthat testing samples with aspect ratios less than one should be avoided, as this could resultlarge errors to both Young’s modulus and Poisson’s ratio, unless correction factors wereapplied. The Poisson’s ratio measurements were consistently higher at the centre of thespecimen face. As the Poisson’s ratio is unlikely to vary so much within one sample, thisconfirms that the loaded surfaces were constrained by frictional effects at the test machineplatens resulting in reduced transverse deformation at the sample ends. Once averagedfront-to-back, Poisson’s ratios measured at the top and bottom typically converged towithin 10%. This may be explained by marker position variability. After the application ofthe correction factor Poisson’s ratios from each location did not converge to a single valueindicating that the fully transverse displacement constrained boundary conditionoverestimated the constraint as some sliding must occur at the specimen/platen interface.In practice, this means that the correction factors in appendix Table 5 and 4 areoverestimated for the areas close to the specimen’s top and bottom boundaries, which isconsistent with the corrected results in Table 5 (after correction,Poisson's ratios at the topand bottom are slightly larger). Following the application of the correction factor theaverage Poisson’s ratio was 0.33, within 3% of that calculated by DVC. The Young’s modulus values derived from crosshead displacement were 27%higher than manufacturer quoted values, but consistent with the range of values found inliterature for the same density foam [9]. Modulus results from both crosshead displacementand OT were found to have a slight inverse relation between loading rate and Young’smodulus, in agreement with Linul et al. 2013 [37]. 5.. Limitations and Sources of error Using the OT methodology some small errors will result from out of plane movementof the specimen due to Poisson’s ratio effects. As a result, markers will appear larger,increasing measured strain. However, for the experimental setup within this paper, thiserror will be small (less than 1%[28]). Markers of each specimen were drawn on by handand therefore not in identical positions for each specimen. This is primarily an issue forPoisson’s ratio calculation as endpoint effects will be dependent on their proximity to theends due to Saint-Venant’s effects [38]. Errors also arise from the imaging itself. Lens distortion has not been taken intoaccount, mainly because specimen displacement during the test was negligible comparedto the specimen size. Lighting variation and varying air index distortions can sometimescause some errors, even though they are generally small when the testing conditions are well controlled [39]. As stated previously, the main error associated with out-of-planemovements is accounted for by the back-to-back camera set-up. The OT methodology results were supported by good agreement with spatially richDVC results. Some error in the DVC calculation will result from noise present in scansbeing falsely interpreted as strain. However initial analysis performed on repeat (unloaded)scans showed a positive mean strain bias of~1.2 x 10 and standard deviation of strain of1.4 x 10. The sparse closed pore structure of the foam required a relatively highsubvolume size as sufficient material is required for accurate correlation. This meant thathigh strain gradients could not be measured; while they may exist within the microstructure(pore connections), no sharp discontinuity was observed over the bulk material. 6. Conclusions This study demonstrates that methods of measuring displacement data on cellularfoams must be carefully considered, as artefacts can lead to significant errors. In particular,strains derived from cross-head displacement should not be used without compliancecorrection as they lead to gross underestimation of the Young’s modulus. OT was found tobe an inexpensive and highly accurate measurement option (when tested againstVFM/DVC), which avoids measurement artefacts and setup issues associated with the useof multiple extensometers. The accuracy of Poisson’s ratio and Young’s modulus could befurther improved by using an FE-derived correction factor taking into account the fact thatthe strains are not uniform through the thickness (for Young’s modulus and Poisson’s ratio)and the fact that the end constraints block Poisson’s effect (for Poisson’s ratio). Thiscorrection depends on the specimen size and nominal Poisson’s ratio as shown inappendix Table 5. The present study sought to develop a methodology that could evaluate the effect ofexperimental artefactsassociated with uniaxial compression, through non- Ctmeasurement and FE-based correction. The full-field DVC strain measurement techniquecoupled with VFM was found to account for these artefacts. However, the OT methodcould also identify heterogeneous responses during testing, which could be aggregated toproduce an overall response at considerably reduced expense and complexity. Thepresented procedure could lead to a standard method to simply and accurately measurestiffness properties of rigid foam blocks, taking full advantage of the availability ofinexpensive CDD cameras and image processing software. 7. References 1. Thirumal, M., et al., Effect of foam density on the properties of water blown rigid polyurethanefoam. Journal of Applied Polymer Science, 2008.108(3): p.1810-1817. 2. Maji, A., et al., Mechanical properties of polyurethane-foam impact limiters. Journal ofengineering mechanics, 1995.121(4): p.528-540. 3. Jin, H., et al., Full-field characterization of mechanical behavior of polyurethane foams.International Journal of Solids and Structures, 2007.44(21): p.6930-6944. ( 4. Jackovich, D ., e t al., Temperature a nd Mold Size E f fects on P h ysical and MechanicalProperties ofa Polyurethane Foam. Journal of Cellular Plastics, 2005.41 ( 2): p. 1 5 3-168. ) ( 5. Szivek, J., M. Thomas, and J. Benjamin, Te c hnical note. Characterization ofa synthetic foamas a model for human cancellous bone. Journal of Applied Biomaterials, 199 3 .4(3): p. 269 - 272. ) ( 6. Szivek, J.A., J.D. Thompson, and J.B. B e njamin, Characterization ofthree formulations ofasynthetic foam as models for a range of human c ancellous b one t ypes. Journal of AppliedBiomaterials, 1995.6(2):p.1 2 5-128. ) ( 7. Patel, P.S., D.E . Shepherd, and D .W. Hukins, Co m pressive properties of commerciallyavailable polyurethane foams as mechanical models for osteoporotic human cancellous bone.BMC musculoskeletal disorders, 2008.9(1): p. 13 7 . ) ( 8. Calvert, K.L., et al., Characterization of commercial rigid polyurethane foams used as boneanalogs for implant testing. Journal of Materials S cience: Materials in M edicine, 2010.21(5): p. 1453-1461. ) ( 9. Thompson, M . S., et al., C ompressive a n d shear properties o f commercially av a ilablepolyurethane foams. Journal of biomechanical engineering, 2 003. 1 25(5): p. 732-734. ) ( 10. P I alissery, V., M. Taylor , and M. B rowne, Fatigue characterization ofa polymer foam to u s eas a c ancellous bone analog ma t erial in th e as s essment ofo r thopaedic devices. Journal ofMaterials Science: Materials in Medicine, 2004.1 5 (1):p.61 - 67. ) ( 11. Gillard, F., et al., The a pplication of d i gital v o lume correlation (D V C) to s t udy themicrostructural behaviour oftrabecular bone during compression. Journal of the mechanicalbehavior of biomedical materials, 2014.29: p. 480-499. ) 12. Keaveny, T.M., et al., Systematic and random errors in compression testing oftrabecularbone. Journal of orthopaedic research, 1997.15(1): p. 101-110. 13. Hamilton, A.R., et al., Evaluation of the anisotropic mechanical properties of reinforcedpolyurethane foams. Composites Science and Technology,2013.87: p. 210-217. 14.(Crammond, G., S. Boyd,and J. Dulieu-Barton, Speckle pattern quality assessment for digitalimage correlation. Optics and Lasers in Engineering, 2013.51(12): p. 1368-1378. 15.Villegas, D.F., et al., Failure properties and strain distribution analysis of meniscalattachments. Journal of biomechanics, 2007.40(12): p.2655-2662. 16. Nguyen, M.-T., et al., Experimental multiscale measurements for the mechanicalidentification of a cortical bone by digital image correlation. Journal of the MechanicalBehavior of Biomedical Materials, 2016. 63: p.125-133. 17.IDickinson, A.S., A.C. Taylor, and M. Browne, The influence ofacetabular cup material onpelvis cortex surface strains, measured using digital image correlation.Journal ofBiomechanics, 2012. 45(4): p. 719-723. 18..SSrinivasan,P., et al., Experimental and computational micromechanics at the tibial cement-trabeculae interface. Journal of Biomechanics,2016. 49(9): p.1641-1648. 19.Tozzi, G., et al., Elastic Full-Field Strain Analysis and Microdamage Progression in the.Vertebral Body from Digital Volume Correlation. Strain, 2016.52(5): p.446-455. 20. MNadi, K., et al., Computation of full-field displacements in a scaffold implant using digitalvolume correlation and finite element analysis. Med Eng Phys, 2013.35(9): p. 1298-312. 21. Sukjamsri, C., et al., Digital volume correlation and micro-CT: An in-vitro technique formeasuring full-field interface micromotion around polyethylene implants. Journa fbiomechanics,2015. 22. BFay, B.K., et al., Digital volume correlation: Three-dimensional strain mapping using x-raytomography.Experimental Mechanics, 1999.39(3): p. 217-226. 23. Keaveny, T.M., et al., Biomechanics of trabecular bone. Annual Review of BiomedicalEngineering, 2001.3(1): p. 307-333. ( 24. H arrigan, T.P., et al., Limitations of the continuum assumption in cancellous bone. Journal ofbiomechanics, 1988.21(4): p . 269-275. ) 25. Moulart, R., et al., Full-field strain measurement and identification of composites moduli athigh strain rate with the virtual fields method. Experimental Mechanics, 2011.51(4): p. 509-536. ( 26. K im, J . H., et al., Identification ofthe local stiffness reduction ofa damaged composite plateusing the virtual fields method . Composites Part A-Applied Science and Manufacturing, 2007.38(9): p.2065-2075. ) ( 27. G ( rediac,M., et al., The virtual fields method for extracting cons t itutive para m eters from f u ll-field measurements: a review. S train, 2006. 42(4): p.233-253. ) ( 28. P ierron, F., I dentification of Poisson's ratios ofstandard and auxetic low-density polymeric f oams f r om full-field measurements. T h e Journal of Strain Analysis fo r Engineering Design, 2010.45(4):p.233-253. ) ( 29. . Tattoli, F., et al., Full-Field Strain Measurement On Titanium Welds And Local Elasto-PlasticIdentification With The V irtual Fields Method. International C onference o n A d vances inMaterials and Processing Technologies, Pts One and Two, 2010. 131 5 : p.860-865. ) ( 30. A vril, S ., e t al., Identificatio n of elasto-visco-plastic parameters and characterization ofLuders behavior using digital image correlation and the virtual fields method. Mechanics of M aterials, 2008.40(9): p. 7 29-742. ) 31. Dym, C.L. and I.H. Shames, Solid mechanics. 1973: Springer. ( 32. P ierron, F . a nd M . Grediac, Th e vir t ual fields method: ext r acting con s titutive mechanicalparameters from full-field deformation measurements. 2012: S p ringer Science & Business Media. ) ( 33. Pannier, Y . , et al., I d entification of elasto-plastic constitutive par a meters from s tatic a llyundetermined tests using the virtual fields method . Experimental Mechanics, 2006. 46(6): p.735-755. ) ( 34. 1 Moulart, R., S. Avril, and F. Pierron, Identification of the through-thickness rigidities of athick laminated c omposite t u be. Composites Pa r t A: Ap p lied Sci e nce and Manu f acturing,2006.37(2): p.326-336. ) 35.Pierron, F., Saint-Venant effects in the Iosipescu specimen. Journal of Composite Materials,1998.32(22): p. 1986-2015. 36. PIierron, F., F. Cerisier, and M. Grediac, A numerical and experimental study of wovencomposite pin-joints. Journal of Composite Materials, 2000.34(12): p. 1028-1054. 37.LIinul, E., et al. Study of factors influencing the mechanical properties ofpolyurethane foamsunder dynamic compression. in Journal ofPhysics: Conference Series. 2013. IOP Publishing. 38. dce Saint-Venant, M., Memoire sur la torsion des prismes: avec des considerations sur leurflexion ainsi que sur l'equilibre interieur des solides elastiques en general: et des formulespratiques pour le calcul de leur resistance à divers efforts s'exercant simultanement. 1856:Imprimerie nationale. 39. Badaloni,M., et al., Impact of Experimental Uncertainties on the Identification ofMechanicalMaterial Properties using DIC. Experimental Mechanics, 2015.55(8): p. 1411-1426. 8. Appendix Poisson's ratio Correction Factor (Cv) Young's modulus Centre Boundary Correction Factor (Ce) Measured V Aspectratio 0.1 0.2 0.3 0.4 0.1 0.2 0.3 0.4 0.1 0.2 0.3 0.4 0.33 2.63 1.76 1.39 1.18 3.27 2.18 1.72 1.46 0.93 0.84 0.71 0.52 0.5 1.85 1.31 0.94 0.87 0.77 0.65 1 1.04 0.98 0.92 0.87 1.56 0.96 0.93 0.90 0.86 0.97 0.95 1.13 1.10 1.06 1.03 0.99 0.98 0.97 0.96 3 0.99 1.10 0.99 0.99 0.99 0.99 Table 5 - FEA-based correction factors for Poisson’s ratio and Young's modulus values obtained from OT forspecimens with a range of aspect ratios. Poisson's ratio Correction Factor (Cv) MeasuredVAspectRatio 0.1 0.2 0.3 0.4 0.1 0.2 0.3 0.4 0.33 2.47 1.83 1.51 1.31 0.98 0.93 0.84 0.68 0.5 1.97 1.58 1.35 1.20 0.98 0.94 0.87 0.76 1.17 1.09 0.99 0.97 0.93 0.88 1 2 1.16 1.09 1.05 0.99 0.98 0.96 0.94 3 1.10 1.08 0.99 0.98 0.97 0.96 Table 6-FEA-based correction factors for Poisson's ratio and Young’s modulus for a range of specimen aspect ratios,when calculated from averaged volumetric DVC stress and strain data. OT Front Back Averaged front to back Sample Top Centre Bottom Top Centre Bottom 1op Centre Bottom average Maximum 0.33 0.37 0.33 0.35 0.41 0.31 0.32 0.38 0.29 Minimum 0.21 0.26 0.20 0.11 0.10 0.18 0.17 0.30 0.23 Average 0.26 0.32 0.28 0.26 0.33 0.25 0.26 0.33 0.26 0.28 FEA-Corrected 0.34 0.30 0.34 0.33 DVC Correcteduniaxial strain: 0.35 VFM:0.325 Polymer foams are used extensively in everyday life, from disposable packaging and soft furnishings through to engineering applications such as core structural materials in the marine industry or bone analogue materials for orthopaedic device testing. In the engineering field it is important that the mechanical behaviour of these materials is characterised correctly, as computationally based predictions of structural performance rely heavily on accurate input data. Mechanical property data from standard physical tests such as uniaxial compression are subject to artefacts including non-uniformity of applied loading, test fixture-sample contact conditions, and test machine compliance. These are well-documented problems, which techniques such as extensometry and point tracking of marker pairs attempt to resolve. In particular, in addition to being non-contact, the use of individual marker pairs can reveal non-linear behaviours because of alignment issues. In the current work, a practical, accurate experimental methodology is introduced to investigate this issue. Uniaxial compression tests were conducted on cellular polyurethane foam blocks. Both faces of the foam specimens were monitored using point tracking on multiple marker pairs to account for misalignment. Sample deformation was simultaneously measured by test-machine crosshead displacement. The Young’s modulus and Poisson’s ratio were calculated in both cases. To verify the measurements, digital volume correlation (DVC) was applied. DVC is a full-field non-contact strain measurement method that interrogates the interior structure of the foam to determine the physical response. Results demonstrated that misalignment effects could easily be followed during testing, which averaged out on both front and back surfaces to produce a single modulus value. Considerable differences were evident between crosshead displacement calculated modulus and point tracking, indicating that artefacts can lead to substantial errors, as evidenced in the published literature.
确定


还剩23页未读,是否继续阅读?

产品配置单
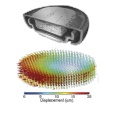

北京欧兰科技发展有限公司为您提供《泡沫状材中形变应变场检测方案(其它无损检测仪器/设备)》,该方案主要用于其他中形变应变场检测,参考标准--,《泡沫状材中形变应变场检测方案(其它无损检测仪器/设备)》用到的仪器有LaVision StrainMaster DVC 体视全场应变测量系统、LaVision DaVis 智能成像软件平台
推荐专场


相关方案
更多