


方案详情
文
The fled of biologics, i.e. proteins, particularly monoclonal antibodies (mAbs), as pharmaceutical drugs, is the fastest growing segment in the biopharmaceutical industry. Therapeutic formulations of monoclonal antibodies usually require concentrations on the order of 100 mg/mL or more, a condition that exacerbates protein denaturation and aggregation tendencies. Selecting the monoclonal antibody with the best denaturation/aggregation profile and identifying the solution conditions (formulation) that maximize the long term stability of the antibody are major goals in the development process. To accomplish these goals, researchers routinely measure different aspects of protein denaturation and aggregation using various complementary or orthogonal techniques. Some techniques measure the conformational stability of the protein (e.g., differential scanning calorimetry, differential scanning ?uorometry, isothermal chemical denaturation) and other techniques measure aggregation after lengthy sample incubation (e.g., size exclusion chromatography, light scattering). Since the expected long term stability is longer than one year, incubation times are usually reduced by accelerating denaturation/aggregation process by, for example, increasing the incubation temperature or stressing the sample in different ways. It would be highly desirable for a more efficient development of new therapeutic mAbs, to have access to a technique that provides the rate of denaturation/aggregation fast and accurately. In this technical note, we introduce the Thermal Activity Monitor (TAM) as a way to measure the rates of denaturation and aggregation of monoclonal antibodies and other proteins at constant temperature.
方案详情

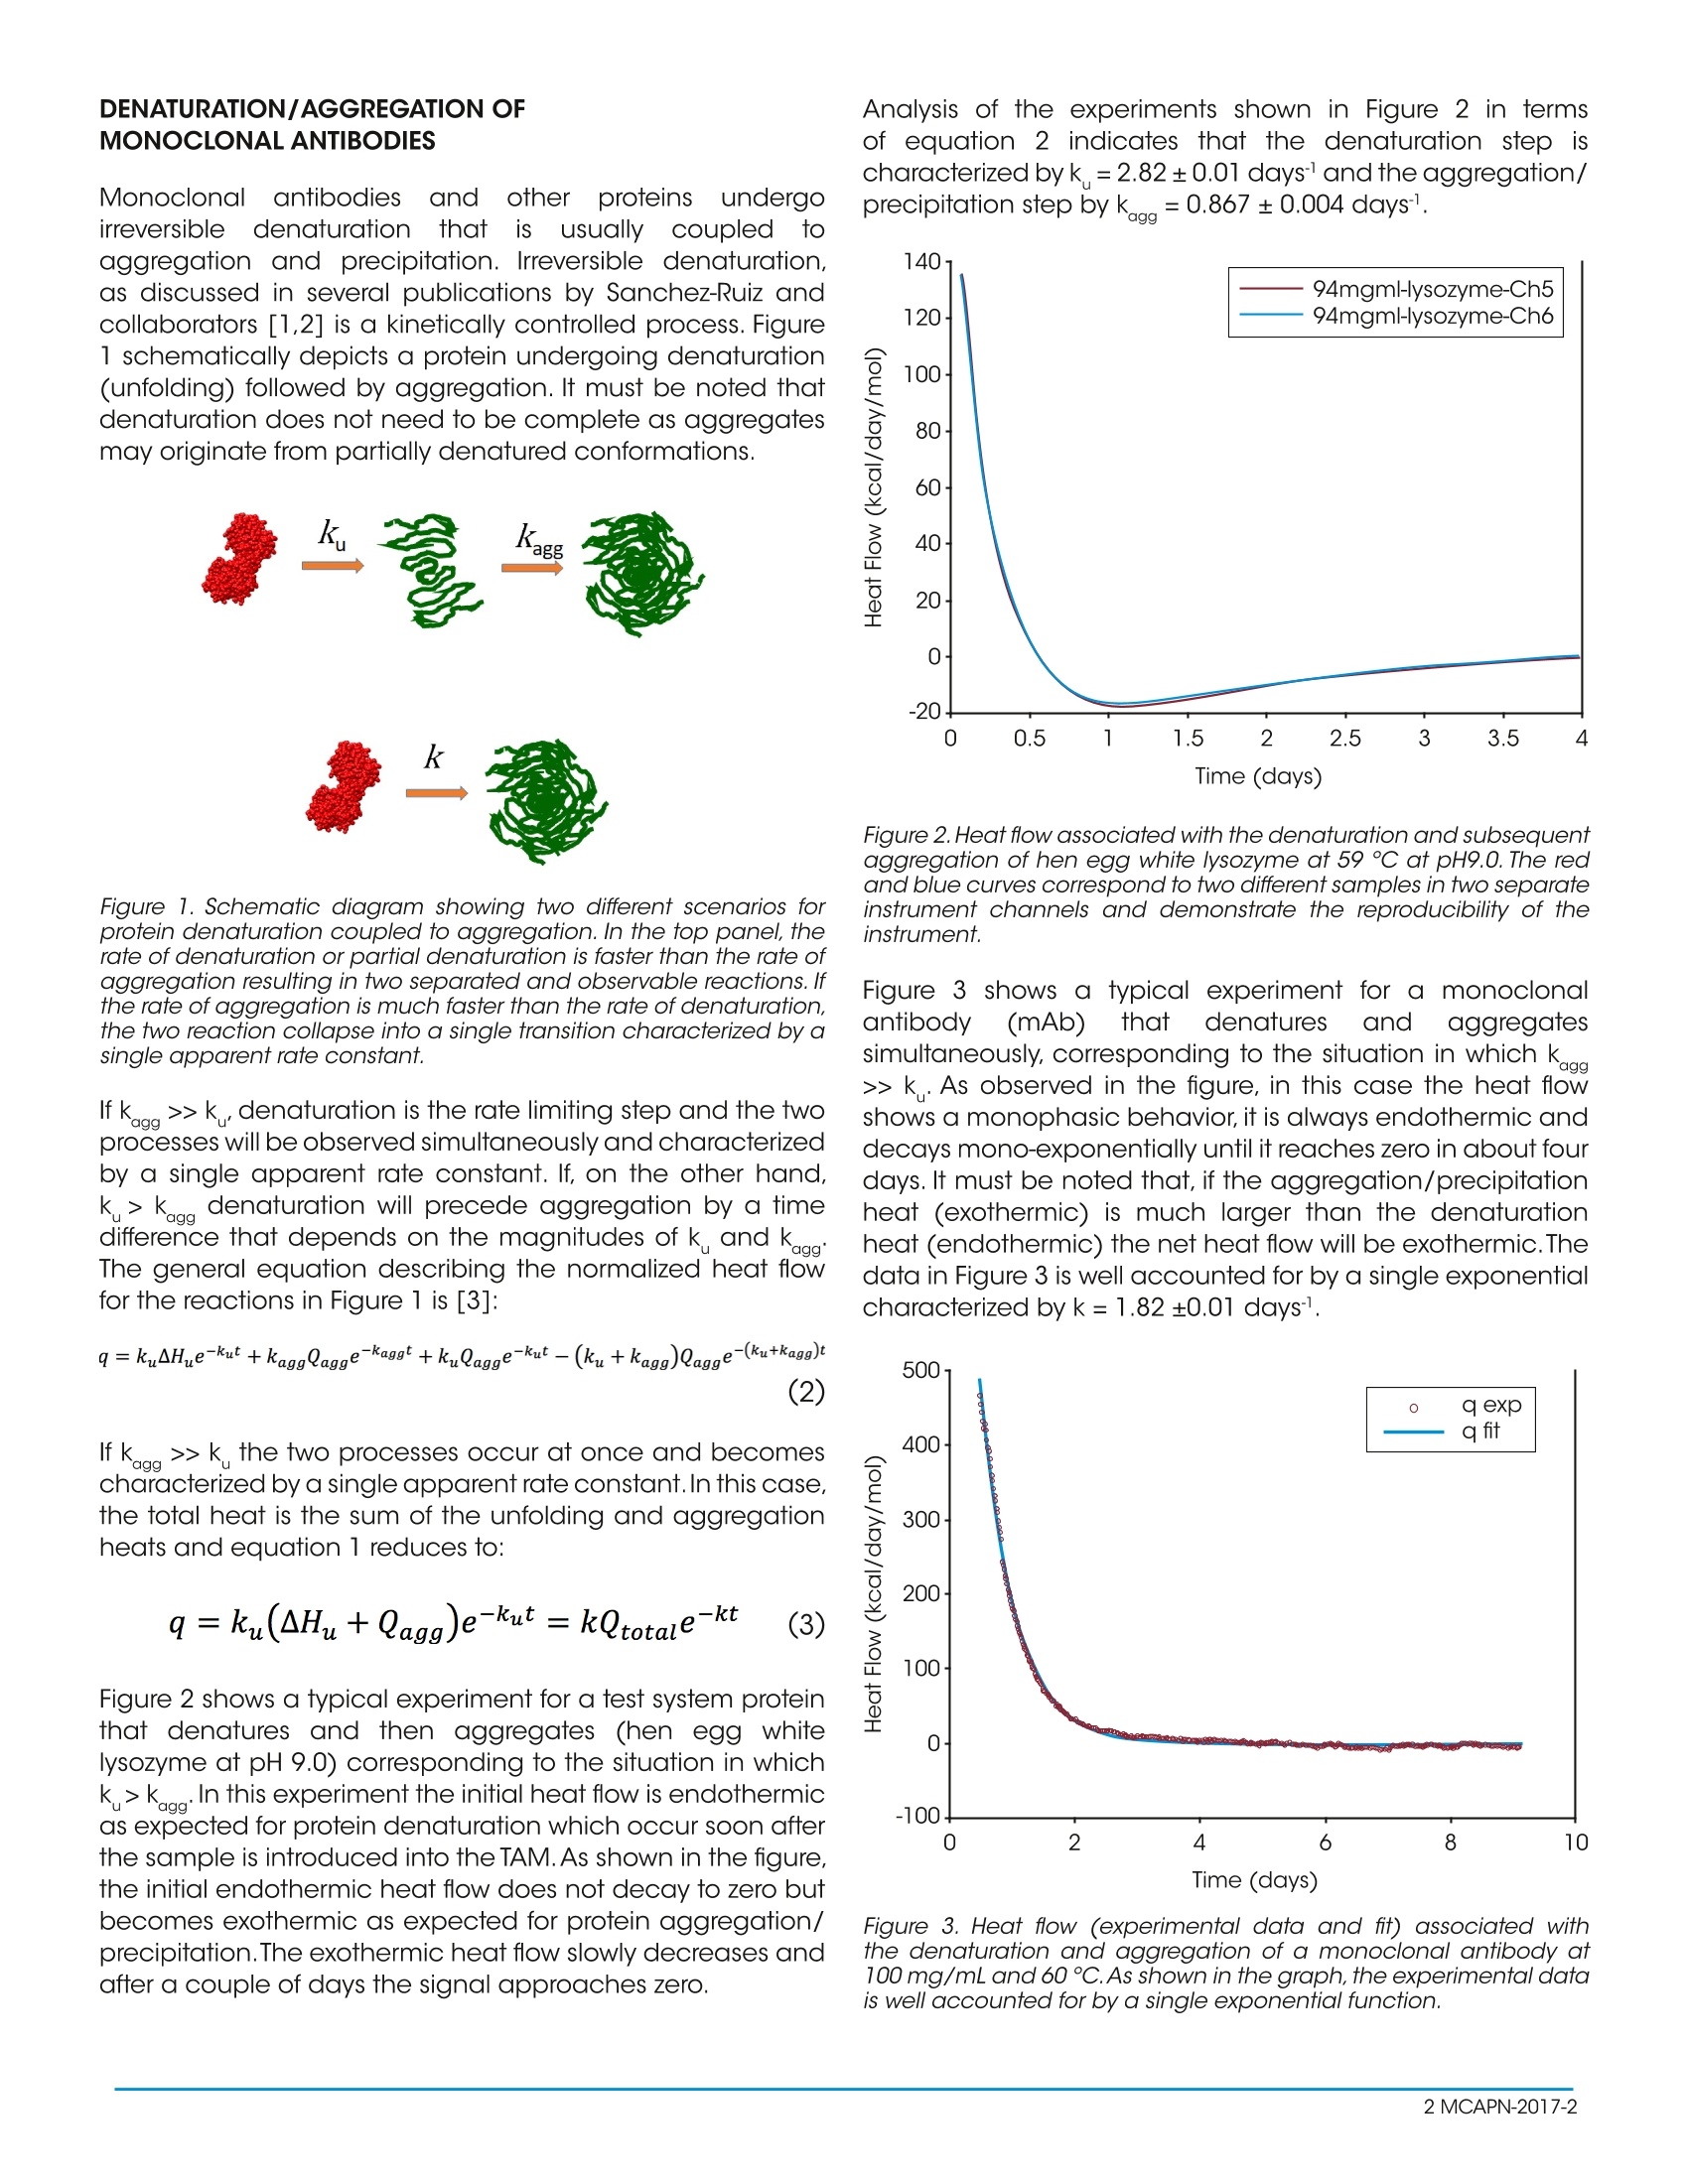
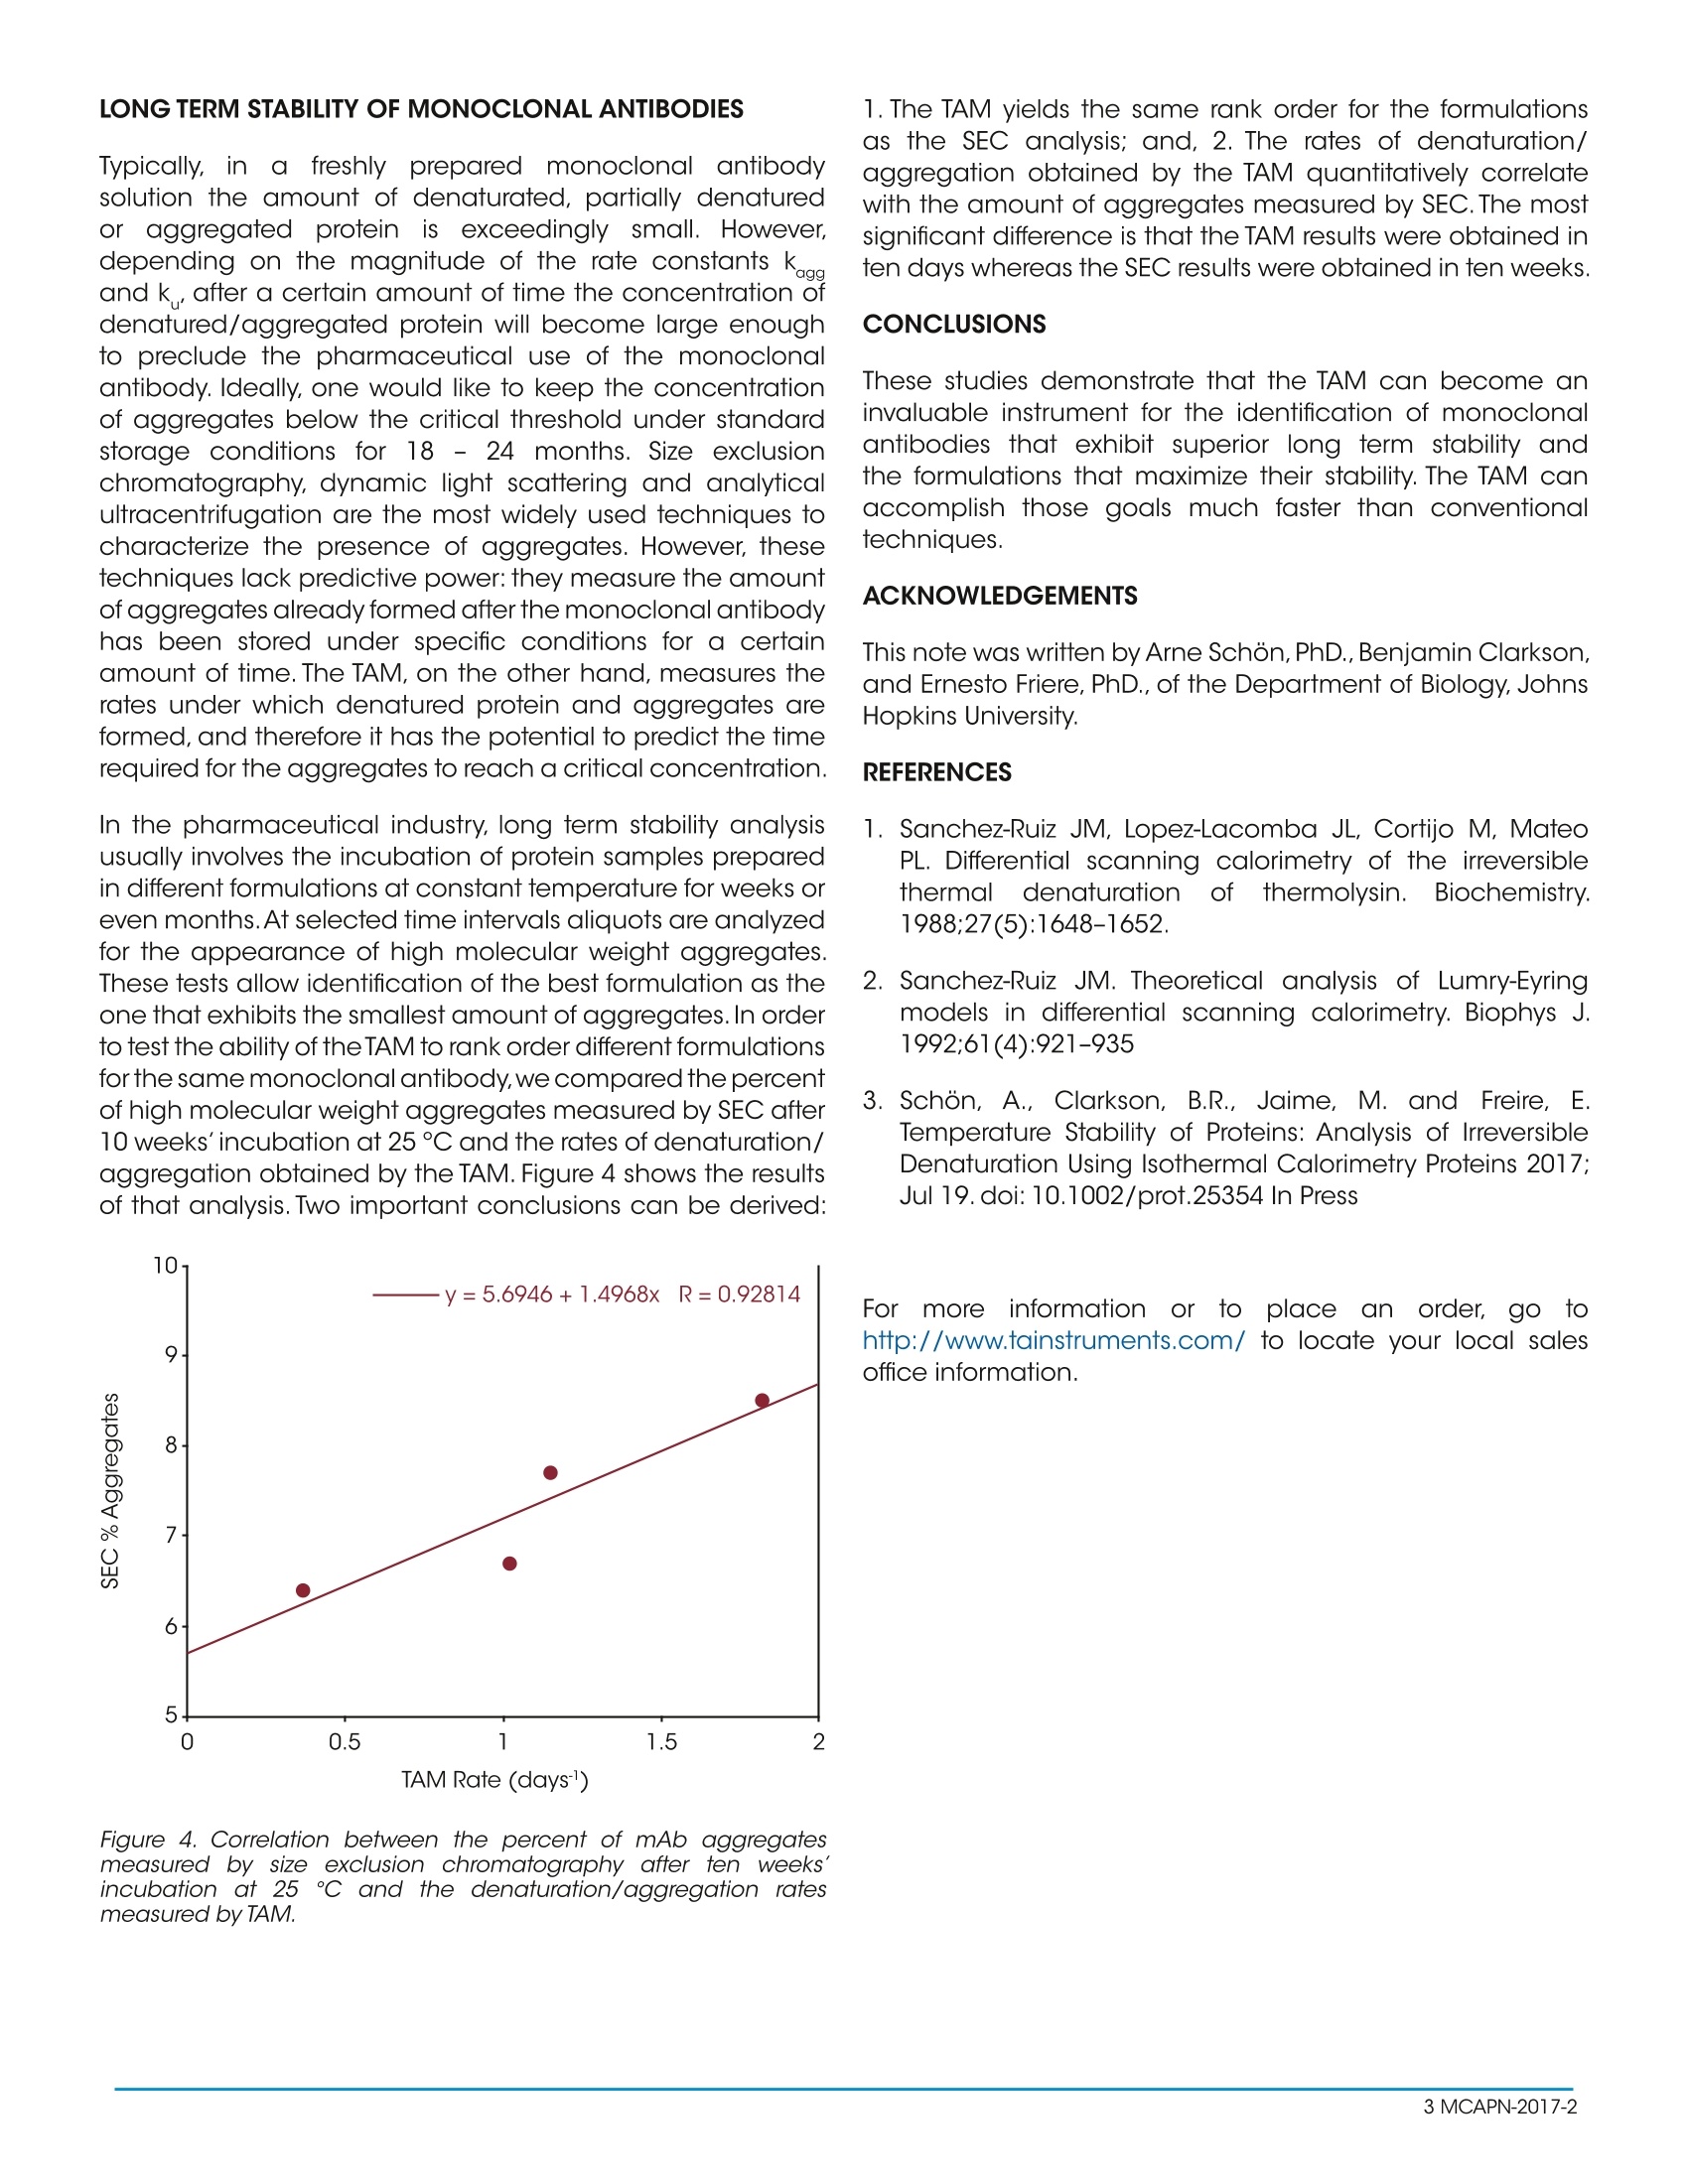
Keywords:TAM, biopharmaceuticals, shelf-life, aggregation, antibodies MCAPN-2017-2 INTRODUCTION The field of biologics, i.e. proteins, particularly monoclonalantibodies (mAbs), as pharmaceutical drugs, is the fastestgrowing segmentin thebiopharmaceuticalindustry.Therapeutic formulations of monoclonal antibodies usuallyrequire concentrations on the order of 100 mg/mL ormore, a condition that exacerbates protein denaturationand aggregation tendencies. Selecting the monoclonalantibody with the best denaturation/aggregation profileandidentifying the solution conditions((formulation)that maximize the long term stability of the antibody aremajor goals in the development process. To accomplishthesegoals,researchers routinelynmeasure differentaspects of protein denaturation and aggregation usingvarious complementary or orthogonal techniques. Sometechniques measure the conformational stability of theprotein (e.g., differential scanning calorimetry, differentialscanning fluorometry, isothermal chemical denaturation)and other techniques measure aggregation after lengthysample incubation(e.g., size exclusion chromatography,light scattering). Since the expected long term stability islonger than one year, incubation times are usually reducedby accelerating denaturation/aggregation process by, forexample, increasing the incubation temperature or stressingthe sample in different ways. It would be highly desirablefor a more efficient development of new therapeutic mAbs,to have access to a technique that provides the rate ofdenaturation/aggregation fast and accurately. In thistechnical note, we introduce the Thermal Activity Monitor(TAM) as a way to measure the rates of denaturation andaggregation of monoclonal antibodies and other proteins atconstant temperature. The TAM is an isothermal calorimeter system that measuresthe rate at which heat is released or absorbed (heat flow)as a function of time by a spontaneous process occurring atconstant temperature.The TAM operates in the temperaturerange 4-150 ℃ with a long term stability <±100 p℃/24h.The TAM is capable of measuring heat effects on the orderof± 200 nW with a short term noise and baseline drift of<±100 nW and < 200 nW/24 h respectively. The TAM canbe equipped with up to 48 measuring cells providing theopportunity to measure several monoclonal antibodies and/or different formulations simultaneously. THE EXPERIMENTAL SETUP The first task is the determination of the experimentaltemperature for the initial TAM experiment. Additionaltemperatures can be selected once the first experiment isperformed. As a rule of thumb, a temperature ten degrees below T as measured by DSC, usually results in denaturation/aggregation rates on the order of several days which is idealfor the TAM. A lower temperature will result in slower kineticsand conversely a higher temperature will result in faster rates. In our laboratory, we have customarily used proteinconcentrations of 25, 50 and 100 mg/mL and a total volumeof 1 mL using the 4 mL glass ampoules. Higher proteinconcentrations can be used if desired. The TAM should beset to the experimental temperature at least 12 hours prior tothe start of the experiment. Best results are also achieved ifthe disposable caps for the glass ampoules are conditionedovernight at the experimental temperature. In addition toampoules for the sample solution, 2-3 ampoules shouldbe included as references and run simultaneously as thesamples. A heat capacity balanced reference is fixed at alltimes and is important as it allows the calorimeter to achieveheat flow stability more quickly. The reference ampoules willhave the same volume of the buffer used for the sample.Theglass ampoules are filled with sample solution or buffer andsealed hermetically with crimp caps.To begin an experiment,an initial baseline is recorded for 30 minutes without anyinserted ampoules.After the baselines have been recorded,the sample and reference ampoules are inserted into thecalorimetric channel at a position where they are allowed toequilibrate to the experimental temperature for 45 minutes.The ampoules are then lowered into the measuring position.The heat flow, dQ/dt (J/s), is recorded until a stable plateauis reached. The ampoules are then removed from thecalorimeter and final baselines with empty calorimeters arerecorded for 30 minutes. A straight line interpolation betweenthe initial and final baselines defines the instrumentalbaseline, which should be subtracted before the data isprocessed further. The signal from the ampoule containingonly buffer is subtracted from the heat flow recorded fromthe sample and the differential signal is then normalized permole of protein.Because of the duration of the experiment it isconvenient to normalize the data and express the final signalin kcal/(dayxmol). The final signal including subtraction ofthe buffer signal, normalization per mole, and conversion tokcal/(day x mol) is thus obtained by performing the followingcalculation: where, V is the sample volume and[P] the proteinconcentration, and the division by 4.184 is the conversionfrom joules to calories (1 cal=4.184J). By multiplying the finalsignal by -1, positive and negative heat flows will correspondto endothermic and exothermic processes, respectively,which is the standard convention in protein calorimetry. DENATURATION/AGGREGATION OFMONOCLONAL ANTIBODIES Monoclonallantibodies(and othererproteinsundergoirreversiblee denaturation thatis usuallycoupledtoaggregation and precipitation. Irreversible denaturation,as discussed in several publications by Sanchez-Ruiz andcollaborators [1,2] is a kinetically controlled process. Figure1 schematically depicts a protein undergoing denaturation(unfolding) followed by aggregation. It must be noted thatdenaturation does not need to be complete as aggregatesmay originate from partially denatured conformations. Figure 1. Schematic diagram showing two different scenarios forprotein denaturation coupled to aggregation. In the top panel, therate of denaturation or partial denaturation is faster than the rate ofaggregation resulting in two separated and observable reactions. Ifthe rate of aggregation is much faster than the rate of denaturation,the two reaction collapse into a single transition characterized by asingle apparent rate constant. If kaag>>k, denaturation is the rate limiting step and the twoprocesses will be observed simultaneously and characterizedby a single apparent rate constant. lf, on the other hand,k> kagg denaturation will precede aggregation by a timedifterence that depends on the magnitudes of k cnd kag heeral ; the normali;for the reactions in Figure 1 is [3]: If k.aa>>k the two processes occur at once and becomescharacterized by a single apparent rate constant. In this case,the total heat is the sum of the unfolding and aggregationheats and equation 1 reduces to: Figure 2 shows a typical experiment for a test system proteinthat denatures and then aggregates (hen egg whitelysozyme at pH 9.0) corresponding to the situation in whichk>k_.In this experiment the initial heat flow is endothermicas expected for protein denaturation which occur soon afterthe sample is introduced into the TAM. As shown in the figure,the initial endothermic heat flow does not decay to zero butbecomes exothermic as expected for protein aggregation/precipitation.The exothermic heat flow slowly decreases andafter a couple of days the signal approaches zero. Analysis of the experiments shown in Figure 2 in termsof equation 2 indicates that the denaturation step ischaracterized by k=2.82±0.01 days and the aggregation/precipitation step byk..=0.867±0.004 days. Figure 2. Heat flow associated with the denaturation and subsequentaggregation of hen egg white lysozyme at 59℃ at pH9.0. The redand blue curves correspond to two different samples in two separateinstrument channels and demonstrate the reproducibility of theinstrument. Figure 3 shows a typical experiment for a monoclonalantibody((mAb)that denaturesi and aggregatessimultaneously, corresponding to the situation in which kaag>>k. As observed in the figure, in this case the heat flowshows a monophasic behavior, it is always endothermic anddecays mono-exponentially until it reaches zero in about fourdays. It must be noted that, if the aggregation/precipitationheat (exothermic) is much larger than the denaturationheat (endothermic) the net heat flow will be exothermic.Thedata in Figure 3 is well accounted for by a single exponentialcharacterized by k= 1.82±0.01 days1. Figure 3. Heat flow (experimental data and fit) associated withthe denaturation and aggregation of a monoclonal antibody at100 mg/mL and 60 C. As shown in the graph, the experimental datais well accounted for by a single exponential function. r, inafreshly prepared monoclonal antibody Typically,solution the amount of denaturated, partially denaturedor aggregated protein isi exceedingly small. However,depending on the magnitude of the rate constants k..andk, after a certain amount of time the concentration ofdenatured/aggregated protein will become large enoughto preclude the pharmaceutical use of the monoclonalantibody. Ideally,one would like to keep the concentrationof aggregates below the critical threshold under standardstorage conditions for 18 - 24 months. Size exclusionchromatography, dynamic light scattering and analyticalultracentrifugation are the most widely used techniques tocharacterize the presence of aggregates. However, thesetechniques lack predictive power: they measure the amountof aggregates already formed after the monoclonal antibodyhas been stored under specific conditions for a certainamount of time. The TAM, on the other hand, measures therates under which denatured protein and aggregates areformed, and therefore it has the potential to predict the timerequired for the aggregates to reach a critical concentration.1. In the pharmaceutical industry, long term stability analysisusually involves the incubation of protein samples preparedin different formulations at constant temperature for weeks oreven months.At selected time intervals aliquots are analyzedfor the appearance of high molecular weight aggregates.These tests allow identification of the best formulation as theone that exhibits the smallest amount of aggregates.In orderto test the ability of the TAM to rank order different formulationsfor the same monoclonal antibody, we compared the percentof high molecular weight aggregates measured by SEC after10 weeks'incubation at 25°℃ and the rates of denaturation/aggregation obtained by the TAM. Figure 4 shows the resultsof that analysis. Two important conclusions can be derived: Figure 4. Correlation between the percent of mAb aggregatesmeasured by size exclusion chromatography after ten weeks'incubation at 25℃ and the denaturation/aggregation ratesmeasured by TAM. 1. The TAM yields the same rank order for the formulationsas the SEC analysis; and, 2. The rates of denaturation/aggregation obtained by the TAM quantitatively correlatewith the amount of aggregates measured by SEC.The mostsignificant difference is that the TAM results were obtained inten days whereas the SEC results were obtained in ten weeks. CONCLUSIONS These studies demonstrate that the TAM can become aninvaluable instrument for the identification of monoclonalantibodies that exhibit superior long term stability andthe formulations that maximize their stability. The TAM canaccomplish those goals much faster than conventionaltechniques. ACKNOWLEDGEMENTS This note was written by Arne Schon,PhD.,Benjamin Clarkson,and Ernesto Friere, PhD., of the Department of Biology, JohnsHopkins University. REFERENCES 1. Sanchez-Ruiz JM, Lopez-Lacomba JL, Cortijo M, MateoPL. Differential scanning calorimetry of the irreversiblethermal denaturation offthermolysin.Biochemistry.1988;27(5):1648-1652. 2. Sanchez-Ruiz JM. Theoretical analysis of Lumry-Eyringmodels in differential scanning calorimetry. Biophys J.1992;61(4):921-935 3. Schon, A., Clarkson, B.R., Jaime, M. and Freire,E.Temperature Stability of Proteins: Analysis of IrreversibleDenaturation Using Isothermal Calorimetry Proteins 2017;Jul 19. doi: 10.1002/prot.25354 In Press For morelinformation or to place an order, go tohttp://www.tainstruments.com/ to locate your local salesoffice information. MCAPN- The fled of biologics, i.e. proteins, particularly monoclonal antibodies (mAbs), as pharmaceutical drugs, is the fastest growing segment in the biopharmaceutical industry. Therapeutic formulations of monoclonal antibodies usually require concentrations on the order of 100 mg/mL or more, a condition that exacerbates protein denaturation and aggregation tendencies. Selecting the monoclonal antibody with the best denaturation/aggregation profile and identifying the solution conditions (formulation) that maximize the long term stability of the antibody are major goals in the development process. To accomplish these goals, researchers routinely measure different aspects of protein denaturation and aggregation using various complementary or orthogonal techniques. Some techniques measure the conformational stability of the protein (e.g., differential scanning calorimetry, differential scanning fluorometry, isothermal chemical denaturation) and other techniques measure aggregation after lengthy sample incubation (e.g., size exclusion chromatography, light scattering). Since the expected long term stability is longer than one year, incubation times are usually reduced by accelerating denaturation/aggregation process by, for example, increasing the incubation temperature or stressing the sample in different ways. It would be highly desirable for a more efficient development of new therapeutic mAbs, to have access to a technique that provides the rate of denaturation/aggregation fast and accurately. In this technical note, we introduce the Thermal Activity Monitor (TAM) as a way to measure the rates of denaturation and aggregation of monoclonal antibodies and other proteins at constant temperature.
确定
还剩1页未读,是否继续阅读?

产品配置单

TA仪器为您提供《生物制品中稳定性检测方案(差示扫描量热)》,该方案主要用于其他中稳定性检测,参考标准--,《生物制品中稳定性检测方案(差示扫描量热)》用到的仪器有TA仪器+等温量热仪+TAM Air
推荐专场


相关方案
更多
该厂商其他方案
更多