


方案详情
文
采用LaVision公司的体视数字图像相关分析DVC平台,对实验室X射线断层扫描测量所获得的数据进行体相关处理分析,研究了材料特性和性能与内部结构演变的相关性。
方案详情

materials Materials 2018, 11,17952 of 26 Materials 2018,11,1795; doi:10.3390/ma11101795www.mdpi.com/journal/materials Review Correlation of Materials Property and Performancewith Internal Structures Evolvement Revealed bvLaboratory X-ray Tomography Le1i Zhang *D and Shaogang Wang* Shenyang National Laboratory for Materials Science, Institute of Metal Research, Chinese Academy of Sciences,Shenyang 110016, China * Correspondence: lzhang@imr.ac.cn (L.Z.); wangshaogang@imr.ac.cn (S.W.);Tel.: +86-24-2397-1551(L.Z.); +86-24-2397-1823 (S.W.) Received: 17 July 2018; Accepted: 19 September 2018; Published: 21 September 2018 check forupdates Abstract: Although X-rays generated from a laboratory-based tube cannot be compared withsynchrotron radiation in brilliance and monochromaticity, they are still viable and accessible in-housefor ex situ or interrupted in situ X-ray tomography. This review mainly demonstrates recent worksusing laboratory X-ray tomography coupled with the measurements of properties or performancetesting under various conditions, such as thermal, stress, or electric fields. Evolvements of correlatedinternal structures for some typical materials were uncovered. The damage features in a gradedmetallic 3D mesh and a metallic glass under mechanical loading were revealed and investigated.Micro-voids with thermal treatment and void healing phenomenon with electropulsing were clearlydemonstrated and quantitatively analyzed. The substance transfer around an electrode of a Li-Sbattery and the protective performance of a Fe-based metallic glass coating on stainless steel weremonitored through electrochemical processes. It was shown that in situ studies of the laboratoryX-ray tomography were suitable for the investigation of structure change under controlled conditionsand environments. An extension of the research for in situ laboratory X-ray tomography can beexpected with supplementary novel techniques for internal strain, global 3D grain orientation, and afast tomography strategy. Keywords: X-ray tomography; in situ; mechanics; corrosion; biomaterial; battery 1. Introduction It is of common interest to understand the properties or performance of materials with theirunderlying structures in the corresponding length scales from atomic to macro in materials research.In practice, the structures of materials are examined by sampling before or after the measurements ofthe properties or performance testing.Samples need to be cut and carefully prepared to fulfill variousanalytical instruments by which the structural information can be obtained. Then, the researcherexplains or deduces the material properties from the data collected statically. Technical obstacles makeit difficult to understand the properties of the materials or the performances involved in changes ininternal structures during their measurement or testing in real conditions and living states. Images, patterns, and spectroscopy are commonly employed to show the material’s structurethrough morphology, crystallography, or chemistry. These techniques of microanalysis originate fromthe reflection, diffraction, and interaction of materials with physical probes, such as light, lasers, X-rays,electrons, neutrons, or ions, etc. By manipulating these probes on a micro and nano scale, microanalysiscan provide two-dimensional (2D) data of the material's structure with spatial resolution in termsof the interaction volume. Researchers are likely to use this individual cross-section of the material structure to relate to the property of the bulk material. This works reasonably well for properties relatedto homogenous or uniformly distributed structure, for example, the elastic modulus of structuralmaterials. However, the structure of the sliced material may miss some critical information on localor heterogeneous structural variation on which the property of the material relies. Crack growthin composites and damage induced by void accumulation in plastic deformation are two obviouscases [1]. Tomography is a state-of-the-art technique to complement the ordinary characterization ofthe planar structure with the spatial structure in three dimensions (3D). With the increases in computerpower and software resources, it is now feasible to reconstruct a 3D digital volume of a sample withan enormous amount of planar structural data. One can use either stacked tomography from slicedstructural data produced layer by layer or computed tomography (CT) from projections with therotation angles downstream to the probe beam transmission of the sample. The stacked tomography by optical microscopy (OM) and scanning electron microscopy (SEM)need a number of consecutive sections from a sample surface, called serial sections, which can beperformed by microtomy, ion milling, or consecutive polishing steps [2]. When accompanied witha focused ion beam (FIB) or a plasma FIB [3], recently-developed SEM tomography can be mademore automatic while the data collection is interlaced with removing of material layer-by-layer on thesample surface. Practically, the spatial resolution can be as high as 10 nm with FIB serial sectioning. Sofar atom probe tomography (APT) is the most advanced technique producing a 3D volume composedof atom species in stacked tomography [4]. In practice, the outmost atomic layer at the tip of a needleshaped sample can be ionized and kicked off layer by layer in a pulsed high-voltage field. A flat paneltime-of-flight (TOF) detector continuously collects the atomic-layer signals in sequence, from whichthe tip of the sample can be reconstructed [5,6]. However, the preparation of the needle sample withtens of nanometers in diameter needs skillful thinning and sharpening techniques. These stackedtomography techniques are inevitably destructive. In computed tomography, transmission electronmicroscopy (TEM) combined with CT technique,3D-TEM, can reconstruct in 3D the volume with aresolution down to the nanometer range [7,8]. However, the sample has to be thinned down to tens ofnanometers for the penetration of the high-voltage accelerated electrons. X-ray tomography (XRT) isanother popular class in computed tomography. The obvious feature of XRT is that it is nondestructive.The XRT technique is, nowadays, commonly employed for clinical diagnosis as X-rays can easilypenetrate biological tissues and bones. It can also be used for materials analysis through optionalhigher energy X-rays suitable for the penetration of specified materials and sample thicknesses. 1.1. XRT and In Situ Experiment In addition to the ability to show the internal structure of a wide variety of materials in static states,the capability of XRT to set test conditions facilitates two paralleled processes of both 3D imagingof internal structures and measurement of properties in dynamic states. Their relationship can becorrelated more easily and directly. Pioneering works of the in situ XRT in materials science can betraced back to the 1990s. Guvenilir et al. investigated the crack evolution in an aluminum-lithiumalloy employing XRT combined with in situ loading experiments [27]. Since then, the damageinside materials induced by processing, cycling,or deformation have been investigated from 3Dviewpoint. Vivid 3D structures of materials and quantitative analysis of the temporal state providevaluable insights as material properties rely on microstructure evolvement. Research works are still very active and versatile in the experimental mechanics field. Deformation and fracture arestill common interest for metals and alloys [28-42], foams and porous materials [11,14,43-46], andcomposites [13,47-49]. XRT has also been considerably extended with other in situ measurementsincluding materials processing [50-55], materials interaction with specified conditions involvingextreme temperature [56,57], corrosion [58-60], electrochemical environments, as in batteries [61-63],etc. The finite element (FE) method has also been employed to analyze the dynamic processes withthe change of applied fields based on 3D models from XRT [16,64-66]. Detailed reviews have alsobeen published on in situ XRT for materials science [20,67],which clearly shows the fast growth ofthe technique in the past two decades. Such in situ experiments usually provide comprehensive 3Dquantitative data and related properties or the performance of materials. 1.2. Laboratory-Based and Synchrotron Radiation XRT X-rays from either a laboratory-based (LB) tube or synchrotron radiation (SR) are available tocarry out XRT with in situ experiments. Due to the X-ray characteristics from different sources, theinstrumentation for a specified experiment has to be considered beforehand. On one hand, X-ray source and imaging methods affect the quality of XRT for fine structures.LB-XRT usually uses radiography or cone beam imaging using a micro-focus source, which is usuallya feature of a divergent and polychromatic X-ray source. The spatial resolution from a point sourcecombined with the geometric magnification has routinely reached the micrometer range. Tuning thefocus of the electron beam on a metallic thin film can produce an X-ray source with finer spotsize down to hundreds of nanometers range. Such nano CT systems are commercially available,including the GE Nanotom and the Skyscan Ultra-High Resolution Nano-CT, with a resolution ofaround 200~400 nm [10]. A nano CT system based on the SEM was also developed accordingly [68].Another type of the LB-XRT approaching 50 nm in spatial resolution was produced by Xradia (nowmerged into Zeiss). X-ray optics, such as condenser and Fresnel zone plates (FZP), were employed [69].The other popular X-ray source is from synchrotron radiation due to magnetic field bending chargedparticles with relativistic velocity. Brilliance of the third generation SR might be ten orders ofmagnitude greater than that emitted from the LB X-ray tube [70]. The electromagnetic wave fromSR has a wide range of spectra, covering hard X-ray to micro waves. X-ray beams used for imagingor computed tomography can be focused or parallel, polychromatic or monochromatic by tuningoptics like a mirror and monochromator on the beamline. Characteristics of higher brightness andtunable wavelength bring significant improvement and possibility to X-ray imaging and computedtomography. The resolution can be below 50 nm for full field imaging or tomography by using opticslike a Kirkpatrick-Baez (KB) focus mirror and FZP for the X-ray source in SR [20,71,72]. 1.3. Timing for XRT For LB cone beam system, one absorption contrast XRT needs to take a series of projectionswith a full 360 degrees of sample rotation. Hundreds or thousands of images with a specifiedvoxel size according to the resolution requirements are recorded within a durable time, in whichthe sample structure is expected to be unchanged. Therefore, 3D imaging data collection by XRT istime consuming. The typical acquisition time is approximately in hours to obtain a 3D volume of1024×1024×1024 voxels with a pixel size down to 1 um for a LB XRT. A brighter X-ray source ismore effective in resolving features with very small differences of absorptivity with a better relativesignal to noise ratio (SNR). For comparison of cone beam system on the third SR, new optics anddetectors used facilitated the spatial resolution reaching below 100 nm and the acquisition time inminutes to obtain a volume of 1024 × 1024× 1024 voxels. There is no technical problem to combineXRT with an in situ experiment. However, the temporal resolution of XRT must be in the sametime scale so that the structure does not change when the specified condition is applied with themeasurement of property or performance testing. A higher contrast images are more easily acquiredwhen using a brighter source. It can easily infer that the XRT by the SR source is much faster than thatby the LB source in terms of the imaging speed with a proper contrast. Increase exposure time helps toimprove the contrast of the imaging. In addition to XRT with absorption contrast, which related to local density variation of theinterior of materials, the chemical components of internal structure can be revealed by XRT withdifferent approaches. Based on X-ray absorption near edge spectroscopy (XANES), a specific elementor a chemical state can be distinguished by a full field imaging near its absorption edge. With thecomplementation of XRT, it is also feasible to show the elemental distribution not only in a 2D imagingbut also in a volume of materials [75]. The 3D XANES microscopy was used to study electrochemicalreduction and re-oxidation of the NiO electrode at a voxel size down to 30 nm ×30nm×30 nm ina FOV of 15 um x 15 um × 15 um. The XANES XRT at one energy out of 13 distinct energy pointsspent about 1.4 h [76]. Due to the polychromatic X-ray source of the LB tube, alternative approachesfor an elemental contrast tomography were developed. Dual-energy CT systems can differentiatecomponent in materials by X-ray absorption contrast at low and high tube energies. However, extradata processing steps and calibration are required. Instead of changing tube energy, Ross-pair filterscan also be utilized to produce tunable X-rays with defined energy bandwidths [77]. In terms ofthe K-edge energy of Rh,a combination of two filter pairs of Nb/Mo and Pd/Ag was selected forthe LB XRT to identify the Rh in the Al foam. The exposure time of 15 seconds for one projectionis acceptable for the LB-XRT. The other approach by employing a hyperspectral detector has muchmore potential applications for 3D chemical imaging. Every pixel of the newly developed detector isable to detect individual photons and extract quantitative hard X-ray spectra [78], and obtain higherspectral statistics with optimized retrieval method [79]. Such spectroscopy LB-XRT shows advantagesof discrimination of the chemical components with different X-ray energies [80]. It was demonstratedin the characterization of the metallic catalyst in a porous structure and in the identification of theinclusion phases in an ore sample [81]. Another advantage of the spectroscope LB-XRT is that only onescan is needed to acquire chemical information in a 3D volume, and the scanning time is similar tonormal LB-XRT. 1.4. Effective Factors ofLB-XRT The brightness of the X-ray sources is not the only factor for in situ XRT. The quality of theimaged projections also relies on the penetration of the X-rays through the material by considering theabsorption for a proper sample thickness. In principle, hard X-rays can transmit most materials withthe energy spectrum from keV to a hundred keV. However, limitations exist for in situ experimentswith the LB or SR-XRT, especially for the samples with high density such as ferrous metals and alloys,copper alloys and refractory alloys, etc. To image millimeter sized samples of such kinds of materials,the X-ray energy needs to be more than a hundred keV. In addition to the attenuation coefficient of materials at different X-ray energy, resolution and the full pixels of the detector also constrain thechoice of sample size. 50 um is estimated to be the largest dimension for a full view of the detectorwith 1000-2000 pixels at the resolution of 50 nm [82]. When the available sample thickness is reduceddown to hundreds or tens of micrometers, however, the in situ experiment is difficult due to samplepreparation and manipulation. To acquire magnified image with a resolution in micrometers, X-ray microscopy with cone beamprojection is available for LB-XRT by using a focused point X-ray source and geometric magnification(GM). To further enlarge the image, optical magnification (OM) of visible light converted by ascintillator was feasible in the Xradia XRT systems [83]. In a SEM, cone beam X-ray can also begenerated from finely focused electrons on a thin foil target. The X-ray source size can be limited bysmaller interaction volume between the electrons and the thinner target, and produce the XRT with aresolution better than 100 nm [84,85]. Higher resolution in tens of nanometers are routinely availableby employing X-ray objective lens as FZP to magnify full field imaging for both LB and SR-XRT.Associated with the focus of a line emission X-ray source, hard X-rays with energy at 8 keV can resolve30 nm lines of a gold spoke pattern by using SR X-ray imaging [86] and 50 nm thick Cu tracks on a Sisubstrate by using LB X-ray imaging [87]. However, it takes minutes for a single projection and daysfor a 3D tomography with such LB systems. Table 1 shows the capability of full-field imaging andthe characteristics of XRT on some typical SR beamlines and LR facilities. A comprehensive reviewsummarized and compared these arts on X-ray nanotomography [82]. The key limitation of LB-XRT isthe brightness of the available X-ray source. Recently, increment of nearly two orders of magnitude inbrightness is demonstrated by using a liquid metal target in LB X-ray source. This emerging techniquecan load more power on the target with better heat dissipation and without melting anymore [88].It isexpected to enhance the capability of LB-XRT for faster tomography with higher resolution. Table 1. Typical SR beamlines and LB facilities for X-ray nano tomography with full field view. Source Facility Beamline/ Model Energy keV Flux phs/s Res. nm Ref. XRT SR ESRF ID11 18-140 ~1014 100 [89] Monochromatic/Pink APS 34ID-C 5-15 5×10 100 [90] Tunable energy Minutes Tomo. Spring-8 BL29XUL 4.4-37.8 6×10¹³ 50 [91] Time-lapse Tomo. SSRF B13W1 8-72.5 3×10¹⁰ 100 [92] Absorption contrast Phase contrast LB* MXIF Gatan XuM 9.7 200 Web. Polychromatic/Monochromatic IMR Xradia Versa 500 30-160 5×10⁸ 700 Spec. Hours Tomo. Interrupted Tomo. IMR Xradia 810 Ultra 8 50 Spec. Absorption contrast Phase contrast *Data from the website (Web.) and the specifications (Spec.) measured with the facility. One also needs to take the X-ray absorption differences of the material components intoconsideration. On one hand, large absorption differences may result in the over exposure due to highdensity phases. Suitable energy selection for the SR-XRT can be utilized to resolve small concentrationsof the specified element in 3D volume. Dual or more energies of the SR X-ray can be used to increasesensitivity to tell the features in different phases. With the help of the sharp variation at the elementalabsorption edge, the enhanced contrast provides information on the chemical difference. On theother hand, if the X-ray attenuation of different phases is similar, the absorption contrast is difficultto tell any significant differences of the phases in the grey level. The techniques of X-ray phasecontrast imaging (PCI) can be applied to emphasize the appearance of the refraction at the phaseinterfaces. Coherent X-ray beams from SR can resolve the phase information in a straightforwardapproach with several mature techniques such as interferometry, propagation, edge-illumination, andgrating-analyzer, etc. The propagation method of the PCI is much more easily and commonly appliedto SR-XRT. Phase ring [87,93,94] and increment of propagation distance [80] are usually employed for phase contrast imaging for LB-XRT with a polychromatic cone-beam based on absorption contrast.The methods for the reconstruction of phase contrast tomography have two classes, phase retrievaland direct methods. The phase retrieval is to derive the refractive part of the X-ray through a sampleand produce differential phase contrast imaging [95]. The direct method directly obtain the refractiveindex from the in-line plane intensity without intermediate step of phase retrieval [96]. The filteredback projection (FBP) algorithm is also commonly used for the reconstruction of such phase contrastimages, by which reconstruction is processed in one step. Alternatively, an iterative algorithm canproduce good reconstruction by using fewer and noisy images. A fast 3D reconstruction strategy wasrecently developed to perform reconstruction in 3D rather than slice-by-slice [97]. The unique characteristics of synchrotron radiation X-rays play a very important role in theadvancement of in situ XRT for materials research.Environmental fixtures can be settled in the SRimaging beamline, and are employed to simulate a similar condition under service circumstancesincluding mechanical, thermal, electrical, and electrochemical environments. Most recently, SR-XRT isable to monitor dynamic processes at high temperature. Powder sintering or liquid droplet nucleationcan be recorded in 3D in real time [71]. One XRT with a voxel size about 100 nm° could be completedwithin 20 s. The temporal and spatial resolution of high speed SR-XRT has opened new windows forin situ experiments to investigate the dynamic evolution of the structures in a nanoscale range. Although there are many advantages of SR-XRT, access to the facilities is limited by theavailabilities of scheduled beam time. LB-XRT systems will help to fulfill the growth in usage forspecified applications with in situ experiments. LB-XRT is currently undergoing fast developmentand growth with various applications. Some companies produce commercial LB-XRT systems withcontinuous improvement for conventional X-ray sources and optics. Routinely, available spatialresolutions have fallen into the sub-micrometer and even nanometer range. For in situ experiments,the add-on accessories can be self-made in terms of the specified object for loading, heating, charging,and so on. 1.5. Studied Cases with In Situ XRT Most in situ experiments investigate the performance of materials, whether in a modality of atime-lapse or an interrupted in situ, can be carried out with LB-XRT and SR-XRT [98,99]. Heating andcooling apparatus were used for the materials processing studies. The in situ XRT clearly exhibitedthe evolution of solid/liquid mixtures and dendritic growth, and can produce real digital structuresfor the simulation of phase-field methods. The dendritic coarsening was mimicked in 3D view, andthe speed of the interface movement could be calculated [100]. The deformation response of highlyporous materials during loading was studied by in situ XRT [15,16]. The evolution of the cellularmicrostructure was characterized quantitatively, and the deformation mechanisms deduced by finiteelement simulation with the meshed model from the XRT. Damage in materials due to loading orfatigue has also been a favorable subject for in situ XRT studies [5]. The mechanisms of damageformation such as cavitation, fracture, micro-cracking, fatigue cracking, and stress corrosion crackingare proposed from a 3D viewpoint. Failure parameters of fracture and damage have been extracted andexamined with the quantitative analysis of tomography images. The internal deformation of differenttypes of materials during loading and heating were quantified and analyzed with the implementationof self-designed loading and heating equipment for the XRT [67]. SR-XRT is favorable for these in situexperiments with its advantages in brightness, monochrome, or energy options, and even space for theaccessories of the in situ instrumentation. However, in situ LB-XRT experiments need to consider morelimitations, e.g., the contrast from the polychromatic source, and the spaces for the sample coupledwith the process and the condition control for a static and stable state during XRT acquisition. The following review will focus on our recent works with LB-XRT exploring the mechanical,physical, chemical properties, and the correlated response of microstructures with the change ofenvironments including mechanical loading, heat treatment, electrical treatment, corrosion, and electrochemical reactions for some typical materials. In addition, the latest advancements of in situexperiments with nano scale LB-XRT from the work of Patterson et al. will also be introduced [31]. 2. Experimental Method All XRT works were carried out on our LB system, an Xradia Versa XRM-500 system (Carl ZeissX-ray Microscopy Inc., Pleasanton, California, United States). This cone beam system was operatedwith the voltage in a range of 50-160 keV. The generated point X-ray source utilized Bremsstrahlungcontinuum spectrum. Transmitted X-ray through the sample with the geometric magnified projectionstraveled down to detector. The X-ray was then converted to visible light by a scintillator. The imagesignal magnified by optical lens was recorded by a 2000 ×2000 CCD camera (Andor TechnologyLtd., Belfast, Northern Ireland, UK). The absorption contrast was imaging for the internal structureinvestigation in terms of the density difference from compositions, phases, or defects like voids, cracks,etc. Generally, 1600~2000 projections with a 360° rotation were taken for one 3D volume with a pixelsize in the range of 0.5~40 um. All of the datasets were performed a correction of beam hardening andthen reconstructed by the bundled software kit with the FBP algorithm. Reconstructed 3D tomographydata were visualized and processed with Avizo software (V7.1, Visualization Sciences Group, Bordeaux,France). through which segmentation and quantitative analysis can provide clear and solid informationof the internal structure as the concern of the investigated properties. The thickness of the samplesused in the following cases was carefully determined with the consideration of the attenuation of theinvestigated materials and checked by real XRT prior to subsequent in situ study. The properties andperformances varied case by case. The experimental details are briefly described in each case. One canfind more information in the referred literature of the specified cases. 3. LB-XRT Examples In this section, several typical examples were selected and introduced to show what role insitu LB-XRT can play in the understanding of the correlation of materials property and performancewith internal structures evolvement. The focus was the new insights obtained from in situ LB-XRTcompared to the traditional characterization techniques. These examples covered some developingadvanced materials such as additive manufacturing titanium alloys, zirconium-based bulk metallicglasses, third-generation single-crystal nickel-based superalloy, iron-based amorphous coatings, andnew degradable biomaterials, and their key properties and performance under service environmentsincluding mechanical loading, high temperature, corrosion, electrochemical conditions, etc. 3.1. Mechanical Loading Metallic cellular structures have potential applications in the human body if porous architecture,improved fatigue properties, and high energy absorption capability can be simultaneously satisfied.However, homogeneous cellular structures always own mutually opposing properties between porousarchitecture and mechanical strength. The topological design of the porous material may solve thisproblem. Zhao et al. illustrated that functionally graded Ti-6Al-4V interconnected meshes fabricatedthrough additive manufacturing not only manifested high fatigue strength, but also integrated lowdensity and high energy absorption, which could not be achieved by the ordinary uniform meshes [101].Considering the coarse surface roughness of the mesh struts and requirements to see failure evolution,two kinds of in situ XRT experiments were used to elucidate the basic principles responsible for theunique mechanical behavior of the graded meshes. The first in situ experiment was a uniaxial compression test on the specimens with a dimensionof 15 x 30 ×30 mm at a displacement rate of 1 × 10⁻³ mm/s [101]. The loading direction wasperpendicular to the graded direction. The test was stopped at 1000 N, and the specimen was scannedusing XRT. Then, the specimen was continually loaded to 2000 N. Such an interruption scanning wasadopted at 1000 N, 2000 N, and 3000 N, respectively, in Figure 1a. The digital volume correlations (DVC)technique running on Davis platform offered by LaVision (LaVision GmbH, Gottingen, Germany) was used to analyze the displacement and strain field of the graded meshes based on the XRT results [101].The color in Figure 1c-e represents the glyph vector magnitude in ParaView software. The 2D XRTslices in Figure 1f-h were used to track the sites of cracks generated at 1000 N, 2000 N, and 3000 N,respectively. The results indicated that the G1 mesh endured a process of the highest stress (Figure 1b),the highest strain (Figure 1c), cracks formed (Figure 1g), and the modulus decreased. Then, the G2mesh successively exhibited a similar process followed by the G3 mesh. Under compressive load,such a non-uniform deformation behavior in the entire meshes originated from the graded mechanicalproperties of the G1, G2, and G3 meshes. The G1 part had the highest modulus and strength, soit could support the highest stress. Once cracks nucleated in the G1 part, the redistribution of thestress occurred. While many studies captured the outer or surface deformation features of gradedmeshes during compression test by a camera or scanning electron microscopy [102,103], the resultshere showed the interior deformation characteristics of graded meshes during compression by insitu XRT. This internal information gave new insights into how the substructure of graded meshesdeformed and the crack nucleated in microscale while the entire sample was under elastic deformationin macroscale. Figure 1. (a) Force-extension result acquired from in situ compression, (b) stress-strain behaviors ofindividual uniform meshes, (f-h) 2D slices showing the site of cracks marked in red circles, and (c-e)displacement vector fields of the graded structures corresponding to three interruptions during insitu compression. From the displacement maps, a phenomenon of the transition of the maximumdeformation sites could be observed [101]. The second in situ experiment was a high cycle compressive fatigue test on the specimens with adimension of 2 × 6 × 10 mm at a stress ratio, R, of 0.1 and a frequency of 10 Hz [101]. The loadingdirection was also perpendicular to the graded direction. The strain-cycle curves (e-N) of the gradedcellular structures in Figure 2 could be divided into three stages according to the slope of the curves inFigure 2a. In situ XRT was employed to find the sites of the cracks during cyclic compressive fatiguedeformation in Figure 2b. In stage I, the cracks first formed in the G1 part. In stage II, the old cracks inthe G1 part propagated at a slow speed while new cracks were detected in both the G1 and G2 parts.In stage III, additional new cracks were detected in the G3 mesh when the fatigue cycles achieved thesudden increase strain zone. The behavior of nucleation and propagation showed that the cracks were prone to initiate in the G1, G2, and G3 parts than near the transition zone, even though the distributionof the stress at the transition zone was not continuous. The progressive initiation of the cracks inthe order of G1, G2, and G3 made a big difference from the crack behavior of the uniform mesheswhere the cracks propagated quickly until the whole mesh sample fractured once the cracks initiated.It was implied that the graded meshes with continuous stress redistribution could retard the abruptcollapse during fatigue, which might also be the origin of the unique cyclic ratcheting rate for thegraded meshes in Figure 2. It should be noted that the theoretical analyses also showed that the fatiguebehavior of the graded meshes was mainly determined by the stress distribution in the constituentmeshes during cyclic compressive fatigue deformation [101]. Such a stress distribution phenomenonfor graded meshes was the origin of the combination of low density, high fatigue strength, and highenergy absorption, which could not be simultaneously achieved according to the reported metalliccellular structures with uniform density [104-106]. Figure 2. (a) strain-cycle curves of the graded mesh,(b) XRT images of the graded meshes which arecorresponding to the arrow points shown in (a). 2D slices A, B, C, and D are located at the G3, G2, andG1 part is shown specifically sitting in the volume rendering of the sample. The numbers 0, 1, 2, 3, and4 are in accordance with the 5 arrow point, respectively. The colored dash cycles in (b) indicate thesites of the cracks observed at each arrow point [101]. The above two experiments displayed the internal deformation and fracture behavior of gradedmeshes under different loading mode. One was loaded at a constant displacement rate; the other wasloaded and unloaded under compression cyclic mode with a stress smaller than 3.6 MPa. These insitu XRT results would enrich and deepen the understanding of the relationship between topologicaldesigns of graded structure and different properties. For metallic glass (MG), how the shear band (SB) cracks if there is no negative pressure is still anopen question. To answer this question, three uniaxial compression tests at a strain rate of 10-4 s-lusing the same sample with dimensions of 2 ×2× 4 mm for the ductile Zr65FesAl10Cu20 (at %) MGwas conducted [107]. After the first compression, the specimen was taken away to be scanned usingXRT. Then, the specimen performed the second compression, followed by the second XRT scanningand the third compression and XRT scanning. XRT was used to reveal the evolution behavior of theinterior SB cracks during in situ compression in Figure 3. To our knowledge, this XRT work was thepioneering study of 3D imaging on internal shear-banding cracks and their evolution. Several keyfindings were obtained from the longitudinal 2D slices and 3D extracted cracks. A phenomenonof discontinuous nucleation, linkage, and propagation of the crack, as well as shrinkage or closurewas seen along the major SB. The long-narrow-thin 3D crack with a thickness of 16-27 umcan beregarded as the affected zone of shear-banding, which was much larger than the initial SB (~10nm).Some unique features such as non-coplanar behavior and the largest crack with a curved plane werealso captured. These in situ XRT results accompanied by SEM results verified that SB cracking may betraced back to one or a combination of the three sources including the excess free volume [108-110],shearing of non-planar SB [111,112], and SB interaction. The reported experiments in the literaturesusually obtained limited SB cracking results from either fracture surface morphology or polishedsections [111,113,114]. This in situ XRT results contributed new findings on how SB evolves into crackunder compression loading mode. Figure 3. Shear band cracking behavior in an in situ compression test. The compression, SEM, and XRTresults in the rows after the first stop (a-e), after the second stop (f-j), and after the third stop (k-o),respectively [107]. Generally, most materials will have a more brittle behavior at low temperatures when comparedwith a high temperature. Surprisingly, when a relatively brittle Ti32.8Zr30.2Ni5.3CugBe22.7(at%)MGwas tested under compression at a strain rate of 10-4 s-1 using the sample with dimensions of2×2×4 mm, both the plasticity and the yield strength were improved while the apparent softeningrate decreased with the decrease of the temperature from room temperature to 173 K as shown inFigure 4[115]. The XRT was used to extract the 3D internal cracks to understand the shear band cracking behavior of the MG. Two samples deformed at 198 K and 173 K unloaded at different periodsof compressive deformation showed interesting XRT images in Figure 4. Scattered and small crackswere found in the shear band plane for the sample with a 68 um shear offset tested at 198 K, while longand large cracks were observed for the sample with a 701 um shear offset tested at 173 K. This illustratedthat the testing temperature accompanied by the amount of shear plastic deformation influenced thecrack evolution. In addition, a split crack was detected in the sample at 173 K in Figure 4c2-d2, whichmay have originated from the local bending moment. The 2D slices and 3D XRT images also showedmany uncracked areas which carried the load during the test. These uncracked areas would decrease,while total stress reduced when the plastic deformation increased accordingly. As a consequence, theapparent softening behavior occurred. Within several samples instead of one of the same samples,these XRT results clearly demonstrated that the apparent softening was more likely to come from SBcracking rather than the commonly accepted view of SB dilation. Figure 4. Typical engineering stress-strain curves under compression at temperatures from298 K to 173 K showing the influence of testing temperature on the stress-strain behavior ofTi32.8Zr30.2Ni5.3Cu9Be22.7 metallic glass and the XRT results corresponding to the samples at 198 K(a1-d1) and 173 K(a2-d2). (a1-a2) the global 3D volume renderings of the samples. (b1-b2) 2D slice orcross-section showing the internal cracks well located in the shear band plane. (c1-c2) and (d1-d2) 3Dextracted internal cracks observed from different perspectives. The XRT volume renderings togetherwith the 3D internal cracks show the temperature effect on the deformation of the MG sample [115]. 3.2. Heat Treatment The high-temperature capabilities make single-crystal (SX) nickel-based superalloys one of thematerial choices in turbine blades. Key properties such as the fatigue and creep properties of SXsuperalloys are critically affected by micro-pores. Micro-pores are associated with solidification andheat treatment. In the final stage of solidification, the liquid metal contracts, and gas solubility sharplydecreases. The pores formed in this process are called S-pores. The solution heat treatment time andtemperature can also generate micro-pores named H-pores. Although many studies have reported thegrowth of micro-pores at high temperatures [116,117], the S-pores and H-pores in these studies weretreated as the same micro-pores. How the S-pore and H-pore evolve and their respective fundamentalmechanisms are still unsolved issues [118]. In situ XRT was performed on the same sample with dimensions of 10 mm in length and1 mm ×1 mm in cross-section to characterize the S-pores and H-pores and quantitatively study theevolution behavior of each pore during solution heat treatment at 1603 K for 1, 4, 7, 12, and 20 h,respectively. The samples were first scanned using XRT, then sealed in vacuum tubes and exposed at1603 K for 1 h for the solution heat treatment. After that, the samples were taken out to be re-scannedusing XRT. This process was repeated several times with the only difference of the solution heattreatment was time, by substituting 4, 7, 12, and 20 h for one hour [118]. The XRT volume renderingsof the micro-pores in the same sample showed the characteristics during the solution heat treatment inFigure 5. It is quite interesting to observe that new H-pores (indicated by the arrows) formed and grewduring the solution heat treatment. For the S-pores, the volume fraction gradually decreased at 1603 Kat 1 and 4 h, then increased at 7,12, and 20 h. For the H-pores, the volume fraction increased during theentire solution process. Considering that the cross-diffusion of elements was imbalanced, a vacancywould form and diffuse during heat treatment. Such vacancy behavior was believed to be related to theevolution of both S-pores and H-pores. The micro-pores may have a maximum volume fraction duringthe solution heat treatment according to the experimental results [116] and theoretical study [119].Such a maximum was not observed in the present solution heat treatment at 1603 K for less than 20 h.If the solution heat treatment time was further increased, the maximum would eventually occur. Figure 5. Cont. Figure 5. XRT volume renderings of micro-pores in a same sample with a heat treatment at 1603 K for(a) 0 h, (b)1 h,(c) 4 h, (d) 7 h, (e) 12 h, and (f) 20 h. The equivalent diameter (um) of the S-pores is alsogiven [118]. 3.3. Electropulsing Treatment Twinning-induced plasticity (TWIP) steel, as a future candidate for the aerospace industry, greatlycombines high tensile strength and uniform elongation by means of the high strain-hardening capacity.If TWIP steels are subjected to plastic deformation, the initiation of micro-voids could underminethe strain-hardening capability and result in premature failure. Improving the mechanical propertiesis expected by eliminating the micro voids using electropulsing treatment (EPT) [120]. Figure 6a-cshows an interesting phenomenon where EPT could recover the strength and plasticity, but annealingtreatment had no such ability. The evidence on the sample surface as shown in Figure 6d-g proved thatthe voids could indeed be healing as well as that the inclusions could be eliminated by EPT. This led tothe increase of the strain-hardening capability and resulted in the recovery of strength and plasticity ofthe TWIP steels samples when compared with those annealed counterparts. One may doubt that thevoid healing effect may be a pseudomorph on the sample surface due to the quasi in situ processing. To clarify the internal structure change, in situ XRT was used to verify the healing effect of EPT.A specimen with dimensions of 1.8 ×1.8 ×50 mm was scanned using XRT before EPT. Then, thespecimen was electropulse treated using self-made equipment with a capacitor bank discharge circuitwith the discharge voltage of 250 V and current pulse duration of 400 ns at room temperature. AfterEPT, the specimen was re-scanned using XRT to detect the evolution of the macro voids and cracks. Figure 6. (a-c) tensile results, (d-g) SEM images, and (h-i) XRT volume renderings of a crack forFe-22Mn-0.9C TWIP steel specimens. These results show the healing effect with EPT, which is superiorto the annealing technique [120]. 3.4. Protective Coating from Corrosion Thermal sprayed coatings have been widely used in industry to protect the surfaces of metalsand alloys against corrosion and wear. The corrosion resistance of the coatings is related to the coatingporosity, which can be categorized as through-porosity and non-through porosity on the basis of itsbehavior in the corrosion of the coated materials. According to the potentiodynamic polarizationcurves of the Fe49.7Cr18Mn1.9Mo74W1.6B15.2C3.8Si2.4 amorphous coating with different thicknesses, theanodic current density increased when the coating thickness decreased from 700 um to 60 um whenthe potential was higher than 0.3 VscE [124]. This phenomenon was inferred to be related with thethrough-porosity, which could lead to direct paths between the substrate and corrosive environment.The electrolyte easily penetrated the substrate from through-porosity, and caused the substrate todissolve once the potential was above the pitting potential of the substrate. However, direct evidencewas needed to confirm the substrate corrosion beneath the coating. In situ XRT technique was used to observe the substrate corrosion evolution beneath the coatingbefore and after electrochemical measurements. The initial specimen with a coating thickness of 150 umand coating surface of 1 mm×1 mm was scanned using XRT, and then taken out to be dynamicallypolarized in the anodic direction at a rate of 0.333 mV/s and interrupted at 0.7 VscE for the followingXRT measurement. To clearly demonstrate substrate corrosion, a further potentiostatic polarization testwas performed on the specimen at 0.7 VscE for 10,000 s, and then scanned by XRT. All XRT scanningwas configured with the same parameters. The 3D XRT volume renderings are given in Figure 7a-g for the same coated sample acquiredbefore and after the potentiodynamic polarization test and subsequent potentiostatic polarization.A preferential site in the substrate for corrosion at the interface between the coating and substrate wasfound and tracked. A large corrosion pit was verified at the last stage. Focusing the view on the coating surface, we could see that the corrosion products accumulated and piled, which may be attributed tothe continuous flow of corrosion products from the through-porosity (Figure 7h). This evidence helpsconfirm that the abrupt variation of the anodic current of a thinner coating at the potentials above0.3 VscE originated from the through-porosity. Compared with non-through porosity, through-porositycould cause increased detriment to the coated material [125,126].Until this work, direct evidence ofsubstrate corrosion beneath the coating was captured. If the presence and the role of through-porosityis known, the critical coating thickness can be estimated, which is beneficial for the development ofadvanced metallic coatings for corrosion resistance. Figure 7. (a-g) 3D XRT images showing the substrate corrosion evolution beneath the coating duringthree stages, and (h) coating surface morphology showing the accumulation of corrosion products [124]. Magnesium-based biodegradable implants can be used in the fields of orthopedics because of theirsafe degradation behavior and no need to remove after bone healing. The application limitation mainlyfocuses on the initial rapid degradation, which will lead to hydrogen bubbling and loss of mechanicalsupport, and then, decrease the bone growth. Surface modification may solve this potential issue forfuture applications. Han et al. [89] fabricated an Mg-1.5 wt % Sr alloy with Sr-Ca-P containing amicro-arc oxidation (MAO) coating to evaluate the role of the coating on the degradation behavior ofthe implants. Since in vitro degradation measurements including mass loss, hydrogen evolution, andelectrochemical behavior cannot draw complete maps for the in vivo status, 3D XRT with a pixelsize of 25.94 um was applied to visualize the in vivo degradation amount of the distal femora ofrabbit at the implantation periods of eight weeks post-surgery. The dimensions of the rods for theMAO-coated Mg-Sr alloy and the control Mg-Sr alloy without coating were 1.5 mmx 20 mm. Figure 8 displays the 2D slices and volume renderings of the remaining Mg-Sr alloy with andwithout Sr-Ca-P coating implants as well as the surrounding bone tissue in the rabbit distal femur. For the Mg-Sr alloy, pitting corrosion occurred around the entire rod after eight weeks, and onlythe central area remained in the original state. In comparison, uniform corrosion was observed onthe Mg-Sr alloy with MAO coating except for some pitting areas. The lower part of the rod stillmaintained its integrity while the upper part in the proximal site showed severe degradation. Similarphenomena were also reported by Gu et al. [127]. After the calculations according to the uncorrodedparts using the quantitative XRT results, the Mg-Sr alloy with MAO coating showed a degradationspeed of 0.75 mm/year while the speed of the Mg-Sr alloy without coating was about 1.3 mm/ year.These results manifested that the MAO coating can play a role as a corrosion barrier [128] and help tokeep the integrity of the Mg-Sr alloy in vivo [129]. Figure 8.2D slices and 3D volume renderings of (a,b) Mg-Sr alloy and (c,d) Mg-Sr alloy with Sr-CaPcoating visualized in vivo using the XRT technique after implantation of 8 weeks in rabbit femur [129]. 3.5. Electrochemical Reaction The Li-Sbattery is regarded as an excellent potential candidate for high capacity energy storagedevices [130,131]. The limitations of advanced high energy density Li-S batteries in real use mainlyfocus on two factors: low sulfur loading and low sulfur content when the electrode is only considered.This problem impedes the commercial application of Li-S batteries. In the common sense of thecommunity of Li-S batteries, it is hard to simultaneously increase the electrochemical performance andsulfur loading. Therefore, it is still an unresolved key issue on how to increase the sulfur loading andsulfur content without the sacrifice of the electrochemical performance. Design cathodes with a 3Dstructure may be a solution to this problem [132-134]. 3D graphene foam electrodes were subtly designed to achieve high sulfur loading for high energydensity Li-S batteries. The highest sulfur loading was about 10.1 mg cm-2. During the XRT tests, two samples were used. One sample of 3D graphene foam electrodes before cycling was cut into piecesand scanned using XRT. The other sample was assembled into 2025-type stainless steel coin cells.After 1000 cycles, the graphene foam electrodes were taken out to perform XRT scanning at differentlength scales. Before cycling, we could visualize the 3D structure of graphene foam using the XRT techniquewith a pixel size of 0.68 um in Figure 9a,b. It was quite easy to distinguish the sulfur particles from thecarbon black and graphene. The sulfur particles were located at the network of the 3D graphene foam.The areal capacity of the electrode with the highest sulfur loading could achieve 13.4 mA h cm-.Such an excellent value of the electrochemical performance was superior to the published results forthe Li-S electrodes. After 1000 cycles, there was still a large amount of sulfur in the active materiallayer in the electrode. Both the shape and size of the sulfur greatly changed in Figure 9c,d. The pixelsize of 0.68 um was not enough to provide clear details of the sulfur, so an Xradia 800 ultra was usedfor ultra-high spatial resolution. Figure 9e,fpresent the XRT results with a pixel size of 64 nm. It canbe clearly seen that the size of the large sulfur with a needle-like shape was in a range of 150 nmto 20 um while the size of small sulfur is less than 150 nm. All the sulfur distributed on the outersurface of the slurry. This work displayed the sulfur morphology and distribution change beforecycling and after 1000 cycles. Such a 3D XRT characterization on the electrodes of Li-S batteriesafter 1000 cycles has never been done before. Researchers have been more prone to capture thechanges during different stages of one cycle using the 2D synchrotron XRT method [135] or haveinvestigated the sulfur degradation behavior during the initial 10 cycles using X-ray phase contrasttomography [136]. Nevertheless, the above results proved that the design of a 3D graphene foambased flexible electrode can satisfy the demand for the Li-S battery with high energy density, highpower density, and long cyclic life to some extent. Figure 9. 3D XRT volume renderings and 2D slices of the 3D grapheme foam electrodes with 10.1 mgcm-² sulfur loading: (a,b) original state; (c-f) after 1000 charge/discharge cycles; (a-d) the pixel size isabout 0.7 um; and (e,f) the pixel size is about 64 nm. 3.6. Nano XRT In Situ Experiment Most works of in situ LB-XRT under mechanical loading, heating or harsh environment havea limited resolution at the micrometer scale. Recently, the spatial resolution of the in situ LB-XRThas been greatly improved. It was claimed that the initiation and propagation of the crack couldbe accurately probed at the scale of 200 nm [31]. This progress was achieved by using an in situmechanical stage where a load arm was driven by a piezo motor. This stage had been integrated intothe nano X-ray tomography systems. Three operating modes including nanoindentation, compression,and tension were supported on this assembly. Data could be recorded in a quasistatic, interrupted insitu manner while one 3D tomographic data acquisition needed several hours. The crack growth in the dentin of elephant tusk under nanoindentation was investigated.It provided insights into anisotropic fracture behavior and crack-shielding mechanisms. In thisin situ experiment, a cone indenter with a tip radius of 1 um and tip angle of 90° was used to initiateand propagate cracks on a cone shape dentin sample with the height of 1 mm and top surface diameterof 50 um. The load was applied incrementally and held in a manner of displacement control at differentstages (Figure10a-c). Zernike phase contrast mode was used with 721 projections. Each projectionwas exposed for 60 s with 64 nm pixel size. Figure 10a-c present continuous crack propagation asthe indentation was increased. Further information was obtained from the 3D segmented image(Figure 10e). The extension of the crack was mainly in a radial direction from the indenter, whichseemed to be a crack path with low energy. A deflecting crack path could also be deduced from thecracks growing in other directions. Therefore, cracking and bridging seem to be the main fracturetoughening mechanisms of tubules for the tusk. This example demonstrated that enhanced insight onmaterial performance was no longer limited in synchrotron-based X-ray tomography, and could beexplored through lab-based X-ray nano-tomography. Figure 10. (a-c) 2D slices showing crack evolution corresponding to the different stages of indenterloading. (d) The force-displacement curve during the nano-indentation test. (e)3D volume renderingof an extracted crack at the loading point (b) on the force-displacement curve showing the relationshipof the crack with selected dentin tubules [31]. 4. Conclusions and Perspective With high brilliance and monochromatic X-rays, the advantages of the SR-XRT boosted the insitu experiments for the investigation of the temporal evolution of the 3D structure coupled with themeasurements of the properties. The researchers now are devoted to develop 3D tomography systemwith the temporal resolution stepped into seconds, the voxel size down to a few tens of nanometers,or even the combination. Meanwhile, the brightness of the X-ray tube in the laboratory constrainsthe advancement towards real-time in situ XRT. However, LB-XRT is also viable and easily accessiblefor specified research interests covering a controllable condition or environment where the structurestudied can be stable and imaged by 3D tomography statically. As in the cases we showed in thisreview, LB-XRT is feasible for some common properties or performances of materials to correlate withtheir 3D structures. It can focus on, but is not limited to, research fields such as crack or damagegrowth during loading or electric stressing, structure and void evolution with thermal processing,composition change or transport in controllable chemical or electrochemical environment, etc. Expanded application fields for LB-XRT need to be explored by a coordination of noveltechnologies. One of them nowadays attracts fast growing interest. The 3D digital volume froma real structure can be meshed and simulated by the Finite Elements tool kit to see the local straindistribution with the corresponding structure variation in the applied field. Another technique is theso-called digital volume correlation (DVC), which can be performed to measure the local displacementinside the bulk and reveal the strain field in a 3D global manner [35,140-143]. The combination ofthese novel techniques will play a critical role in investigating materials with heterogeneous structuressuch as various composites, architecture materials made by additive manufacturing, biomaterials withhierarchical structures,etc. To understand the mechanism of the initiation and extension of cracksor damage in such materials and improve the resistivity with structure tuning might be fascinatingresearch for the LB-XCT to be used. Acknowledgments: The authors acknowledge all of the professional cooperators and continuous support fromthe Shenyang National Laboratory for Materials Science in the past six years. Conflicts of Interest: The authors declare that they have no conflicts of interest. ( References ) ( 1. Withers, P.J.;Preuss, M. Fatigue and damage in structural materials studied by X-ray tomography. Annu. Rev. Mater. Res. 2012,42,81-103.[C rossRef| ) ( 2. Zankel, A.; Wagner, J.; Poelt, P. Serial sectioning methods for 3D investigations in materials science. Micron2014, 62,66-78. [ CrossRe f] [Pu b Med] ) 3. Burnett, T.L.; Kelley, R.; Winiarski, B.; Contreras, L.; Daly, M.; Gholinia, A.; Burke, M.G.; Withers, P.J. Largevolume serial section tomography by Xe plasma FIB dual beam microscopy. Ultramicroscopy 2016, 161,119-129. [CrossRef] [PubMed] ( 4. Gault, B. Atom probe microscopy. In Springer Series in Materials Science; Springer: New York, NY, USA, 2012; p.396. ) ( 5. Cerezo, A.; Clifton, P.H.; Lozano-Perez, S.; Panayi, P.; Sha, G.; Smith, G.D.W. Ov e rview: Rece n t progr e ssin three-dimensional atom probe instruments and app l ications. Mic r osc. Mic r oanal. 200 7 ,13,408-4 1 7.[ CrossR e f ] [Pu bMe d ] ) ( 6. Blavette, D.; Cadel,E . ; Pareige, C.; D econihout, B. ; Caron, P. Phase transformation and segregation to latticedefects in Ni-base superalloys. Microsc. Microanal. 2007, 13, 464-483. [CrossRef ][ P ubM e d] ) ( 7. Saghi, Z.;Midgley, P.A. Electron tomography in the ( S)TEM: From nanoscale morphological analysis to 3Datomic imaging. Annu. Rev. M a ter. R e s. 2012, 42,59-79. [C r o ssRef] ) ( 8. Midgley, P.A.; Weyland, M. 3D electron microscopy in the physical sciences: The development of Z-contrastand EFTEM tomography. Ult r amicroscopy 2003, 96, 413-431. [ C r ossRef] ) ( 9. Stock, S.R. X-ray microtomography of materials. Int . Ma t er. Re v . 19 9 9,44,141-164. [Cro s s Ref] ) ( 10. Stock, S.R. Recent advances in X-ray microtomography applied to m a terials. Int. Mater. Rev . 2008,53,129-181.[ C rossRef ] ) ( 11. Atturan,U.A.;N a ndam, S.H.; Murty, B.S.; Sankaran,S. Deformation behaviour of in-situ TiB2 reinforcedA357 aluminium alloy composite foams und e r compressive and impact loading. Mater. Sci. E ng. A 2017, 684,178-185. [ C rossR e f] ) ( 12. Ferre, A.; Dancette, S.;Maire,E. Damage characterisation in aluminium matrix composites reinforced with amorphous metal in c lusions. Mater. Sci. Technol. L ond. 2 015,31,579-586.[Cro ssRef] ) ( 13. Nikishkov, Y.; Seon, G.; Makeev, A.; S honkwiler, B. In-situ measurements of fracture toughness pro p erties incomposite laminates. Mater. Des . 2016,94,303-313.[C rossRef] ) ( 14. Dillard, T .;Guyen, F. ; Ma i re, E.;Salvo, L.; For e st, S.; Bienvenu, Y.; B ar t out, J.D.; Croset, M.;Dendievel, R.;Cloetens, P. 3D quantitative image analysis of open-cell n ickel foams under tension and compression loadingusing X-ray m icrotomography. Philos. Mag. 20 0 5,85,2147-2175. [Cro s s R e f] ) ( 15. Maire, E. X -ray tomography applied to t h e characterization of highly porous materials. Annu. R ev. Ma t er. R es.2012, 42, 163-178. [CrossRe f ] ) ( 16. Petit, C. ; Meille, S.; Maire, E. Cellular solids studied by X-ray tomography and finite element modeling-A review. J. Mater. Res.2013,28,2191-2201. [ CrossRef] ) ( 17. Hornberger, B.; Bale, H.; Merkle, A.;Fe s er, M.; Harris, W.; Etchin, S.; Leibowitz, M.; Qiu, W.; Tkachuk, A.; Gu, A. ; et al. X-ray microscopy for in situ characterization of 3D nanostructural evolution in the laborator yIn X-ray Nanoimaging: Instruments and Methods II; SPIE: Bellingham WA, USA, 2015; Volume 9592. ) ( 18. Fratini , M. ; Campi, G.; Bukreeva, I.; Pellicci a , D . ; Burghammer, M. ; Tromba, G.; Cancedda, R .; Mastrogiacomo, M . ; C e dola, A. X-ray micro-beam techniques and phase contrast tomography applied to biomaterials. Nucl. Instrum. Methods B 2015 , 364,93-97. [ CrossRef ] ) ( 19. Bradley, R.S.; Withers, P.J. Correlative multiscale tomography of biological m aterials. Mrs Bull. 2 016, 41,549-554. [ CrossRef] ) ( Maire, E.; Withers, P.J. Quantitative X-ra y tomography. Int. Mater . Rev . 2014,59,1-43. [ C ro ssRef] 20. ) ( Ludwig, W.; King, A.; H e rbig, M.; Reischig, P.; Marrow, J.; Babout,L.; L a uridsen,E.M.; Proudhon, H.;Buffiere, J.Y. Characterization of polycrystalline materials using synchrotron X-ray i m aging and diffractiontechniques. JOM 2010,62, 22-28. [C r o ssRef] ) 23. Poulsen, H.F. An introduction to three-dimensional X-ray diffraction microscopy.J. Appl. Crystallogr. 2012,45,1084-1097.CrossRef 24. Poulsen, H.F; Jensen, D.J.; Vaughan, G.B.M. Three-dimensional X-ray diffraction microscopy usinghigh-energy X-rays. MRS Bull. 2004, 29,166-169. [CrossRef] 25. Requena, G.; Degischer, H.P. Three-dimensional architecture of engineering multiphase metals. Annu. Rev.Mater. Res. 2012, 42, 145-161.[CrossRef] ( 26. Toda, H.; Maire, E.; Aoki, Y. ; Kobayashi, M. Three-dimensional strain mapping using in situ X-raysynchrotron microtomography. J. Strain. Anal.Eng. 2011, 46,549-561. [C rossRef] ) ( 27. . Guvenilir, A .; Breunig, T .M.; K inney,J.H.; Stock, S.R. Direct observation of c r ack opening as a function of applied load i n the i nterior of a notched tensile sample of Al-Li 2090. A cta Mater. 1997, 45,1 9 77-1987. [ CrossRef l ) ( 28. Babout, L.;Maire, E.; Fougeres, R. Damage initiation in model metallic materials: X-ray tomography andmodelling. Acta Mater. 2 004,52,2475-2487. [Cr ossRef] ) ( 29. Hannard,F.;Pardoen,T.;Maire, E.; Le Bourlot, C.; Mokso,R.; Simar, A. Characterization and micromechanicalmodelling of microstructural heterogeneity effects on ductile fracture of 6xxx aluminium alloys. Acta Mater.2016,103,558-572. [C r o ssRef] ) ( 30. Maire, E .;Zhou, S.X.; Adrien, J.;Dimichiel, M. Damage qu a ntification in aluminium alloys using in situ tensile tests in X-ray tomography. Eng. Fract. Mech. 2011, 78, 2679-2690. [ C r o ssRef] ) ( 31. Patterson, B.M.; Cordes,N . L.; Henderson, K.; Mertens, J. C .E.; C l arke, A . J.; Hornberger, B . ; M erkle, A.;Etchin, S.; T kachuk, A.; Leibowitz, M.; et al. In situ laboratory-based transmission X-ray microscopy andtomography of material deformation at the nanoscale. E xp. Mech. 2016,56,1 5 85-1597.[C r o ss R ef ] ) ( 32. Pottmeyer, F.;Bittner, J; Pinter, P.; Weidenmann, K.A. I n-situ CT damage analysis of metal inserts embeddedin carbon fiber-reinforced plastics. Exp. Mech. 2 017,57, 1411-1422. [Cr os s Ref] ) ( 33. Revil-Baudard, B.; Cazacu, O.; Flater, P.; Chandola, N.; Alves, J.L. Unusual plastic deformation and damagefeatures in titanium: Experimental tests and constitutive modeling. J. Mech. Phys. Solids 2016,88, 100-122. 「 CrossRef l ) ( 34. 4. Marrow,J.;Reinhard, C.; Vertyagina, Y.; Saucedo-Mora, L.; Collins, D.; Mostafavi, M. 3D studies of dam; by c ombined X-ray to m ography and digital volu m e correlation. Proc. Mater . Sci. 2014, 3, 15 5 4- 1 559. 「 CrossRef l ) ( 35. Mostafavi, M.; Collins, D.M.; Cai, B.; Bradley, R.; Atwood, R.C.; Reinhard, C.; Jiang, X.; Galano, M.; Lee, P.D.; Marrow, T.J. Yield behavior beneath hardness indentations in ductile metals, measured by three-dimensionalcomputed X-ray tomography and digital volume correlation. Acta Mater. 2015,82, 468-482.[Cro ssRef] ) ( 36. Mostafavi, M.; Vertyagina, Y . ; Reinhard, C . ; Bradley, R . ; Jiang, X.; Galano, M.; Marrow, J.3D studies ofindentation by combined X-ray tomography and digital volume correlation. Key Eng. Mater. 2014, 3, 592-593. C rossRef l ) ( 37. 7 . G ( irault, B .; Vidal, V.; Thilly, L. ; Renault, P.O.; Goudeau, P.; Le Bourhis, E.; V i llain-Valat, P.; Geandier, G.; T ranchant, J.; Landesman, J.P.; et al. Small scale mechanical properties of polycrystalline materials: In s itudiffraction studies. Int.J. Nanotechnol.2008,5,609-630. [ CrossR e f] ) ( 38. Salvo, L .; B elestin, P .; Maire, E.; J acquesson, M.; Ve c chionacci, C.; Bol l er, E.; Bo r nert, M.; Dou m alin, P. Structure and mechanical properties o f AFS sandwiches studied by in - situ compression tests in X-ray microtomography. Adv. En g . Mater. 20 0 4, 6, 411-415. [Cr os s Ref] ) ( 40. Phillion, A.B.; Cockcroft, S.L.; Le e , P.D. A new methodology for measurement of semi-solid constitutive behavior and its application to examination of as-cast porosity and hot tearing in aluminum alloys. Mater. Sci. Eng. A 2008, 491, 237-247.[ CrossRef] ) ( 41. Gan, Y.Y.; Mo, K.; Yun, D.; Ho e lzer, D.T.; Mia o , Y.B.; Liu, X.; Lan, K.C.; Park, J.S.; Almer, J.; Chen, T.Y.; et al. T emperature effect of elastic anisotropy and interna l strain development in advanced n anostructured alloys:An in-situ synchrotron X-ray investigation. Mater. Sci. E n g. A 2017,692,53-61.[Cross Ref] ) ( 42. Wang, S.G.; Sun, M.Y.; Song, Z.Q.; Xu, J. Cast defects induced sample-size dependency on compressivestrength and fracture toughness of Mg-Cu-Ag-Gd bulk metallic glass. In t ermetallics 2 012, 29, 123-132. [ CrossRe f l ) ( 43. Marcadon, V.;Davoine, C.; Passilly,B.; Boivin, D.;Popoff, F.; Rafray, A.; Kruch, S. Mechanical behaviour ofhollow-tube stackings: E x perimental characterization and modelling of the role of their constitutive materialbehaviour. Acta Mater. 2012,60,5626-5644. [C rossR e f] ) ( 44. Siegkas, P .; Tagarielli, V. ; Petrinic, N.; Lefebvre , L.P. Rat e dependency of the response of Ti foams incompression. Material 2012,2,661-666. ) ( 45. Patterson, B.M.; Henderson, K . ; Gilbertson, R .D.; T ornga, S.; Cordes, N .L.; C havez, M . E.; Smith, Z . Morphological and performance measures of polyurethane foams using X-ray CT and mechanical testing. Microsc. Microanal. 2014,20,1284-1293.[ C ro ssRef ][ Pu bMe d] ) ( 46. Ou, X.X.; Zhang, X.;Lowe,T.; Blanc, R.; Rad, M.N.; Wang, Y.; Bat a il, N.; Pham, C.; Shokri, N.; Garforth, A.A.;et al. X-ray micro computed tomography characterization of cellular SiC foams for their applications inchemical engineering. M a ter. Charact. 2017,123,20-28. [Cro ssRef] ) ( 47. Hu, X.F.; Wang, L.B.;Xu, F.;Xiao, T.Q.;Zhang, Z. In situ observations of fractures in short carbon fiber/epoxycomposites. Carbon 2014, 67,368-376. [ CrossRe f ] ) ( 48. Bayraktar, E.; Bessri, K.; Bathias, C. Deformation behaviour of elastomeric matrix composites under staticloading conditions. E ng. F ract. Mech. 2 008, 75,2695-2706.[Cr oss R ef] ) ( 49. Patterson, B.M.; Cordes, N.L.; Henderson, K.; Williams,J.J.; Stannard, T.; Singh, S.S.; Ovejero, A.R.; Xiao, X.H.; Robinson, M.; Chawla, N . In s itu X-ray synchrotron tomographic i maging during the c ompression of hyper-elastic polymeric materials. J. Mate r . S c i.2016,5 1 ,171-187.[ Cro s sRef ] ) ( 50. T ourret, D.; Mertens, J.C.E.; Lieberman, E.; Imhoff, S.D.; Gibbs, J.W.;Henderson, K.; Fezzaa, K.; Deriy, A.L.;Sun, T.; Lebensohn, R.A.;et al. From solidification processing to microstructure to mechanical properties: Amulti-scale X-ray study of an Al-Cu a lloy sample. M etall. Mater. Trans. A 2017,48A,5529-5546.[Cro s s Ref] ) ( 51. Daudin, R.; Terzi, S.; Lhuissier, P.; Salvo, L.; Boller, E. Remelting and solidification of a 6082 Al alloycontaining submicron yttria particles: 4D experimental s t udy by in situ X-ray microtomography. Mater. Des. 2015,87,313-317.[C rossRef] ) ( 52. Daudin, R.; Terzi, S.; Lhuissier, P.; Tamayo,J.; Scheel, M.; Babu, N.H.; Eskin, D . G.; Salvo, L. Particle-inducedmorphological modification of Al alloy equiaxed dendrites revealed by sub-second in s itu microtomography. Acta Mater. 2017,125,303-310. [ C rossRef] ) ( 53. Schleef, S.; Lowe, H .; S chneebeli, M. H o t-pressure si n tering of lo w -density snow anal y zed by X- r ay microtomography and in situ microcompression. Acta Mater.2014, 71,185-194. [Cros sRef] ) ( 54. Wu,Z.;Sun, L.C.; Wang, J.Y. Effects of sintering method and sintering temperature on the microstructureand properties of porous Y2SiOs. J. Mater. Sci. Technol. 2015,31,1237-1243.[ C r ossRe f ] ) ( 55. ) . Cai, B.; Wang, J; Kao, A .; Pericleous, K.; Phillion , A.B.; Atwood, R.C.; Lee, P.D. 4D synchrotron X-raytomographic quantification of the transition from cellular to dendrite growth during directional solidification.Acta Mater. 2016,117, 1 60-169.[C rossR e f] ) ( 56. Alvarez-Murga, M.;Perr i llat, J.P.; Le Godec, Y.; Be r game, F; Philippe, J.;King, A.; Guignot, N.;Mezoua r , M.; Hodeau, J.L. Development of synchrotron X -ray micro-tomography under extreme conditions of pressure and temperature. J. Synchrotron Radiat . 2017,24,240-247. [CrossRef ] [ P ubMed] ) ( 57. Liu, D.; G ludovatz, B.; B a rnard, H.S.; K u ball, M.; Ritchie,R.O. Da m age tolerance of nuclear graphite atelevated temperatures. Nat. C ommun. 2017,8, 15942.[Cr ossRe f ] [ Pu b M ed] ) ( 58. Galli, S.; Hammel,J.U.; Herzen, J.; D amm,T.; Jimbo, R.; B e ckmann, F; Wennerberg, A.; Willumeit-Romer, R. Evaluation o f t he d egradation b e havior o f resorbable metal im p lants for in vivo os t eosynthesis by synchrotron radiation based X-ray tomography and his t ology. Proc. SPIE 2016, 9967,996704. ) ( 59. 1 . Singh, S.S.; Stannard, T.J.; Xiao, X.H.; Chawla,N. In situ X-ray microtomography of stress corrosion crackingand corrosion fatigue in aluminum alloys. JOM 201 7 , 69, 1404-1414. [Cros sRef] ) ( 60. Wang, S . G.; Wang, S.C.; Z h ang, L. Application of high resolution transmission X-ray tomography in material science. Acta Metall. Sin . 2013,49,897-910. [C rossRef ] ) ( 61. Brushett, F.R.; Trahey, L.;Xiao, X.H.; Vaughey, J.T. Full-field synchrotron tomography of nongraphitic foamand laminate anodes for lithium-ion batteries. A C S Appl. Ma t er. Int. 2014,6,4524-4534. [Cros sRe f ] [Pub Me d] ) ( 62. Drozhzhin, O.A.; Sumanov, V .D.; Karakulina, O.M.; Abakumov, A .M.; H adermann,J.; B a ranov, A.N.;Stevenson, K.J. ; Antipov, E.V . Switching between solid solution and t wo-phase regimes in t h eLi1 - xFe1-yMnyPO4 cathode materials during lithium (de)insertion: C o mbined pitt, in si t u X R PD andelectron diffraction tomography study. Electrochim. Acta 2016, 191,149-157. [Cr ossRef] ) ( 63. Harris, S. J .; Lu, P . Effects of inhomogeneities-nanoscale to m e soscale-on the durability of Li-ion batteries.J. Phys. Chem. C 2013,117,6481-6492. [ CrossRef ] ) ( 64. Michailidis, N. Strain rate dependent compression response of Ni-foam investigated by experimental and FEM simulation methods. Mater. Sci. Eng. A 2011,528, 4204-4208. [Cros sRef] ) ( 65. Michailidis, N.; Stergioudi,F.;Omar, H.; Papadopoulos,D.; Tsipas, D.N. Experimental and FEM analysis ofthe material response of porous m e tals imposed to mechanical loading. Colloid Sur f . A 2011, 382, 124-131. [ CrossRe f ) ( 66. P etit, C.; Maire, E. ; Meille,S. ; Adrien, J. Two-scale study of the fracture of an aluminum f o am by X-raytomography and finite element modeling.M a ter. Des. 2017,120,117-127.[Cr ossRef] ) ( 67. Buffiere, J.Y.; Maire, E.; Adrien, J; Masse, J.P . ; Boller, E. In s i tu experiments with X-ray tomography:An attractive tool for experimental mechanics. Ex p . Mech. 2010, 50, 289-305. [Cr o s sRef] ) ( 68. Mayo,S.C.; Miller, P.R.; Wilkins,S.W.; Davis, T.J . ; Gao, D. ; Gureyev, T.E.; Paganin, D.; Parry, D.J.;Pogany, A.;Stevenson, A.W. Quantitative X-ray projection microscopy: Phase-contrast and multi-spectral imaging.J. Microsc.2002,207,79-96.[ CrossRe f ] [ PubMed] ) ( 69. Wang, S.; Lau, S.H.; Tkachuk, A.; Druewer, F; Chang, H.; Feser, M.; Yun, W.B. Non-destructive 3D imagingof nano-structures with multi-scale X-ray microscopy. NSTI Nanotech. 20 0 8,1,822-825. ) ( 70. Als-Nielsen,J.;McMorrow, D. Elements of Modern X-ray Physics; Wiley: New Y o rk, NY, USA; Chichester, UK,2001. ) ( 71. Villanova, J; Daudin, R. ; Lh u issier, P.; Jauffres, D . ; L o u, S. Y .; Martin, C.L.; Laboure, S.; T uc o ulou, R.; Martinez-Criado, G.; S a lvo, L. Fast in situ 3D nanoimaging: A new tool for dynamic characterization in materials science. Mater. Today 2017,20,354-359. [ C rossRef] ) ( 72. Lee, S.; Kwon, I . H.; Kim, J.Y.; Yang, S.S.; Kang, S.; L i m, J. Early commissioning results for spectroscopicX-ray nano-imaging beamline BL 7C SXNI at PLS-II. J. Synchrotron Radiat. 2017, 24,1276-1282.[C r o ssRef] [ PubMed ] ) ( Baruchel, J. X-ray Tomography in Material Science; Hermes Science: Paris, France, 2000; p. 204. ) ( Vedula, V.S.V.M.; Munshi, P. An improved algorithm for beam-hardening corrections in experimental X - raytomography. Ndt8E Int. 2008,41,25-31. ) ( 75. Rau, C.; Somogyi, A.;Simionovici, A. Microimaging and tomography with chemical speciation. Nucl. Instrum.Meth. B 2003,200,444-450.[C rossRef] ) ( 76. Meirer, F.; Cabana, J.; Liu, Y.J.; Mehta, A.; Andrews, J.C.; Pianetta, P. Three-dimensional imaging of chemical phase transformations at the nanoscale with full-field transmission X-ray microscopy.J. Synchrotron Radiat. 2011,18,773-781.[ CrossRef ] [ Pub M ed ] ) ( 77. Arhatari, B .D.; Gureyev, T.E.; Abbey, B. Elemental contrast X-ray tomography using ross filter pairs with apolychromatic laboratory source. Sci. Rep.UK 2017,7 , 218. [C rossRef] [P u bMed] ) ( 78. Fullagar, W.; Uhlig, J; Walczak, M.; C anton, S.; Sundstrom, V. T h e us e and cha r acterization of a backilluminated charge-coupled device i n i n vestigations o f p ulsed X -ray a n d radiation s o urces. Rev. Sci. Instrum. 2008, 79,103302. [Cros s Ref ] [Pub M ed] ) ( 79. Fullagar, W.K.; P aziresh, M.; Latham, S.J.;Myers, G.R.; Kingston, A.M. The index of dispersion as a metric ofquanta—Unravelling the fano factor. Acta Crystallogr. B 2017,73,675-695.[Cro s s Ref] [P ub Med ] ) ( 80. Jacques,S.D.M.;Egan, C.K.; Wilson, M.D.; Veale, M.C.; Seller, P.; Cernik,R.J. A laboratory system for elementspecific hyperspectral X-ray imaging. Analyst 2013, 138, 755-759. [ C r o s s R ef][P ub Me d ] ) ( 81. Egan,C.K.; Jacques, S.D.M.; Wilson, M.D.; Veale, M.C.; Seller, P.; Beale, A.M.; Pattrick, R.A.D.; Withers, P.J.; Cernik, R.J. 3D chemical imaging in t he l aboratory b y hyperspectral X -ray computed to m ography. Sci. Rep. UK 2015,5, 15979. [ CrossR e f ] [ PubM e d] ) ( Withers,P.J.X-ray nanotomography. Mater. T oday 2007, 1 0,26-34.[C rossRef] ) ( Wang, Y.X.;Duewer,F.;Kamath,S.; Scott, D.; Yun, W.B. A novel X-ray microtomography system with highresolution and throughput. NSTI Nanotech. 2004,3,503-507. ) ( 84. Bleuet, P. ; Laloum, D.; Audoit, G.; Torrecillas, R.; Gaillard, F . X. SEM-base d system for 100nm X-raytomography for the analysis of porous silicon. I n D e velopments in X-ray Tomography IX; S PIE: Bellingham, WA,USA, 2014; Volume 9212, p. 92120Z. ) ( 85. Perini,L.A.G.; Bleuet, P.; Filevich, J; Parker, W.; Buijsse, B.; Kwakman, L.F.T. Developments on a SEM-basedX-ray tomography system: Stabilization scheme and performance evaluation. Rev. Sci. Instrum. 2017,8 8 , 063706. ) ( 86. Yin, G.C.; Song,Y.F.; Tang, M.T.; Chen, F.R.; Liang, K.S.; Duewer, F.W.; Feser, M.; Yun, W.B.; Shieh,H.P.D . 30 n m resolution X-ray imaging at 8 keV using third order diffraction of a zone plate l ens objective in atransmission microscope. Appl. P h ys. L e tt. 2 006,89,221122. [Cr ossRef] ) ( 88. Harding, G.; David, B.; Schlomka, J.P. Liquid metal anode X-ray sources and their potential applications.Nucl. I nstrum. M ethods B 2004, 213, 189-196. [Cr os sR ef] ) ( 89. Snigireva, I.; Vaughan, G.B.M.; Snigirev, A. High-energy nanoscale-resolution X-ray microscopy based on refractive optics on a long beamline. AIP Conf. Proc. 2011,1365,188-191. ) ( 90. Rau, C.; C recea, V . ; Richter, C .P.; P eterson, K.M.; J e mian, P. R .; N e uhausler, U.; Schneider, G.; Yu, X.; Braun, P.V.;Chiang, T.C.; et al. A hard X-ray KB-FZP microscope for tomography with s u b-100-nm resolution.In Proceedings of the Developments in X-Ray Tomography V, S an D iego, CA, U SA, 15-17 August 2006;Volume 6318, p. 63181G. ) ( 91. Matsuyama, S.; Yasuda, S.; Yamada,J.;Okada, H.; Kohmura, Y.; Yabashi, M.;Ishikawa, T.; Yamauchi, K. 50-nm-resolution full-field X-ray microscope without chromatic aberration using total-reflection imaging mirrors. Sci . Rep . UK 2017, 7, 4635 8 . [CrossRe f ] [Pu bM ed ] ) ( 92. F eng, B .G.; Deng, ,, B . ;B . R;e nR,en, Y. Q .; Wa n g, Y . D.; Du, G . H.; Tan, H.; Xue, Y.L.; Xiao, T.Q. F u ll-field X raynano-imaging system designed and constructed at ss r f. Chin. Opt. L ett. 2 016,14,093401. [ C rossRef] ) ( 93. Bradley, R.S.; Liu, Y. ; Burnett, T.L.;Zhou, X.;Lyon, S.B.; Withers,P.J.;Gholinia, A.;Hashimoto, T.; Gr a ham, D.;Gibbon, S.R.; et al. Time-lapse lab-based X-ray nano-CT study of corrosion damage. J. Mi c rosc. Oxf. 2017, 267,98-106.[ CrossRef ] [ P u b Med ] ) ( 94. Patterson, B.M.; Henderson, K.C.; Gibbs, P.J.; Imhoff, S.D.; Clarke, A.J. Laboratory micro- and nano s caleX-ray tomographic in v estigation of Al-7 at%Cu solidification structures. Mater. Cha r act. 201 4 , 95, 18-26. CrossRe f l ) ( 95. Wu,X.Z.; Liu, H.; Yan, A. Phase-contrast X-ray tomography: Contrast mechanism and roles of phase retrieval.Eur. J. Radiol. 2008,68,S8-S12. [CrossRef] [ P u bMed] ) ( 96. Bronnikov, A.V. Phase-contrast CT: Fundamental theorem an d fast im a ge reconstruction algorithms. Proc. SPIE 2006, 6318,Q3180. ) ( 97. McCann, M.T.; Nilchian, M.; Stampanoni, M.; Unser, M. Fast 3D reconstruction method for differential phas e contrast X-ray CT. Opt. Express 2016,24,14564-14581. [ CrossRe f] [Pu b Med] ) ( 98. Salvo, L.; Suery, M.; Marmottant, A.; Limodin,N.; B e rnard, D. 3D imaging in material science: Applicationof X-ray tomography.C. R. Phys. 2010, 11, 641-649.[C ros s Ref] ) ( 99. Wu, S.C.; X iao, T.Q.; Withers, P.J. The imaging of failure in structural materials by synchrotron r adiation X-ray microtomography. Eng. Fract. Mech. 2017,182,127-156.[C rossRef] ) ( 100. R owenhorst, D.J.; Voorhees, P.W.Measurement of interfacial evolution in three dimensions. Annu. R ev. Mater. Res. 2012,42,105-124. [CrossRef ) ( 101. Z hao, S.; Li, S.J.; Wang, S.G.; Hou, W.T.; Li, Y.;Zhang, L.C.; Hao, Y.L.; Yang,R.;Misra, R.D.K.; Murr, L.E. Compressive and fatigue behavior of functionally graded Ti-6Al-4V meshes fabricated by electron beammelting. Acta Mater.2018, 150,1-15. [ Cr o ssRef ] ) ( 102. C hoy, S.Y.; Sun, C.N.; Leong, K.F; Wei,J. Compressive properties of functionally graded lat t ice structuresmanufactured by selective laser melting. Mater. Des. 2017, 131, 112-120. [ C rossRef] ) ( 103. L immahakhun, S.; Oloyede, A.; Sit t hiseripratip, K.;Xi a o, Y.; Yan, C. Stiffness and strength t a iloring ofcobalt chromium graded cellular structures fo r stress-shielding reduction. M a ter. D e s.20 1 7, 114, 633-641. 「 CrossRe f ] ) ( 104. L i, S.J.; Murr , L.E . ; Cheng, X.Y.; Zhang , Z.B.; Hao, Y.L.; Yang, R.; Medina, F.;Wicker, R.B. Compressionfatigue behavior of Ti-6Al-4V mesh arrays fabricated by electron beam melting. Acta Mater. 2012, 60,793 - 802. I CrossRef l ) ( 106. L i,S.J.;Zhao, S.; Hou, W.T.; Teng, C.Y.; H a o, Y.L.; Li, Y.; Yang, R.; Misra, R.D.K. Functionally graded Ti-6Al-4Vmeshes with high strength and energy absorption. Adv. E n g.Mater.2016,18, 3 4-38.[Cross Ref] ) 107. Qu, R.T.; Wang, S.G.; Wang, X.D.; Liu, Z.Q.;Zhang, Z.F. Revealing the shear band cracking mechanism inmetallic glass by X-ray tomography. Scr. Mater. 2017, 133,24-28. [CrossRef] 108. ILuo, J.; Shi, Y.F. Tensile fracture of metallic glasses via shear band cavitation. Acta Mater. 2015,82, 483-490.「CrossRefl 109. Flores, K.M.; Sherer, E.; Bharathula, A.; Chen, H.; Jean, Y.C. Sub-nanometer open volume regions in a bulkmetallic glass investigated by positron annihilation. Acta Mater. 2007, 55, 3403-3411. [CrossRef] 110. Shao,Y.; Yang,G.N.; Yao, K.F.;Liu, X. Direct experimental evidence of nano-voids formation and coalescencewithin shear bands. Appl. Phys. Lett. 2014, 105,181909. [CrossRef] ( 111. M aass, R.; Birckigt, P.; Borchers, C.; Samwer, K.; Volkert, C.A. Lo n g range stress fields and cavitation along ashear band in a m e tallic glass: The local origin of fracture. Acta Mater. 2015,98,94-102. [Cro s s Ref] ) 112. Zhao, Y.Y.; Zhang, G.L.; Estevez, D.A.; Chang, C.T.; Wang,X.M.; Li, R.W. Evolution of shear bands intocracks in metallic glasses. J. Alloys Compd. 2015, 621,238-243. [CrossRef] ( 113. Zhang, Z.F.; He, G.; Eckert, J.; Schultz, L. Fracture mechanisms in bulk metallic glassy materials. Phys. Rev . Lett.2003,91,045505. [ C rossRe f ] [ P u bMed] ) ( 114. W V ang, S.G.; X u , J . Strengthening and toughening of Mg-based bulk metallic glass via in-situ formed B2-typ e AgMg ph a se. J. Non-Cryst. Solids 2013,379,40-47. [C r ossRef] ) ( 115. Wu,S.J.; Wang, X.D.; Qu, R.T.; Zhu, Z.W.; Liu, Z.Q.;Zhang, H.F.;Zhang, Z.F. Gradual shear band crackingand apparent softening of metallic glass under low temperature compression. Intermetallics 2017, 87, 45-54. 「 CrossRef | ) ( 116. Anton, D.L.; Giamei, A.F. Porosity distribution and growth during homogenization in single-crystals of a nickel-base superalloy. Mater. Sci. Eng. 1985,76,173-180.[ C r ossRef] ) ( 117. L ink, T.; Zabler, S.;Epishin, A .;Haibel, A.; Bansal, A.; Thibault, X. Synchrotron tomography of poro s ity insingle-crystal nickel-base superalloys. Mater. Sci. Eng . A 2006,425,47-54. [ Cr o ssR e f] ) ( 118. .I Li, X.W.; Wang, L.;D o ng, J.S.; Lou, L.H.; Zhang, J. Evolution of micro-pores in a single-crystal nickel-basedsuperalloy d uring solution heat treatment. Metall. Mater. Trans. A2017,48A, 2682-2686.[Cro ssRe f ] ) ( 119. B E okstein, B.S.;Epishin, A.I.; Link, T.; Esin, V.A.; Rodin, A.O.; Svedov, I.L. Model f or the porosity growth i n single-crystal nickel-base superalloys during homogenization. Scr. Mater. 2007,57,801-804.[ CrossRef] ) ( 120. Y ang, C.L.; Yang, H.J.; Zhang, Z.J.;Zhang, Z.F. Rec o very of tensile properties of twinning-induced plasticitysteel via electropulsing induced void healing. S c r. Mater. 2018,147,88-92.[Cros sRef] ) ( 121. Z Z ha h n a g, W.; Sui, M.L.; Zhou, Y.Z.; Li, D.X. Evolution of microstructures in materials induced by electropulsing. Micron 2003, 34, 189-198. [ C rossRef] ) ( 122. Q in, R.S.; Su, S.X. Thermodynamics of crack healing under electropulsing. J. Mater. Res. 2002,17,2048-2052. C rossRef l ) ( 123. G uo, J.D.; Wang, X.L.; Dai, W.B. Microstructure evolution in metals induced by high density electric currentpulses. Mater. Sci.Technol.Lond. 2015,31,1545-1554.[C rossRef] ) ( 124. Z 2 hang, S.D.; Zhang, W.L.; Wang, S.G.; Gu, X.J.; Wang, J.Q. Characterisation of three-dimensional porosity inan Fe-based amorphous coating and its correlation with corrosion beha v iour. Corros. Sci. 2 015,93, 211-221. 「 C r ossRef l ) ( 125. S uegama, P.H.; Fugivara, C.S.; Benedetti, A.V.; Fernandez, J.; Delgado, J.; Guilemany, J.M. Electrochemicalbehavior of thermally sprayed stainless steel coatings in 3.4% NaCl solution. Corros. Sci. 20 0 5, 47, 605-620. CrossRef l ) ( 126. Suegama,P.H.;Fugivara, C.S.; Benedetti, A.V.; Fernandez, J.;Delgado, J.; Guilemany, J.M. Electrochemicalbehaviour of thermally sprayed Cr3C2-NiCr coatings in 0.5 m HzSO4 medi a . J. Appl. Electrochem. 2002, 32, 1287-1295.[ Cross R e f ) ( 12 7 . G u, X.N.; Li, N.;Zhou, W.R.; Zheng, Y.F.;Zhao, X.;Cai, Q.Z.;Ruan, L.Q. Corrosion resistance and surfacebiocompatibility of a microarc oxidation co a ting on a M g - C a alloy . Acta Bioma t er. 2011, 7, 1880- 1 889.[ CrossRef ] [ Pub M e d ] ) ( 128. W ang, W.; Wan,P.; Li u , C.; Tan, L . ; Li, W.;Li, L.;Yang, K. Degradation and biological properties of Ca-P contained micro-arc oxidation self-sealing coating on pure magnesium for bone fixation. Regen. Biomater. 2015,2,107-118.[ Cro s sRef ] [ P ubMed ] ) ( 129. H an,J.J; Wan, P.;Sun, Y.; Liu, Z.Y.;Fa n , X. M .; Tan, L.L.; Yang, K. Fabrication and evaluation of a bioactiveSr-Ca-P contained micro-arc oxidation coating on magnesium strontium alloy for bone repair application.J. Mater. Sci. Technol. 2016, 32,233-244. [ C ros s Ref] ) ( 130. Z hou, G.M.;Li, L . ;M a , C.Q.; Wang, S.G.; Shi, Y.; Koratkar, N.; Ren, W.C.; Li, F; Cheng, H.M. A graphenefoam electrode with high sulfur loading for flexible and high energy Li-Sbatteries. Nano Energy 2015, 11,356-365. [ C r o s sRef] ) ( 131. Zhou, G.M.; P e i, S . F.; L i, L.; Wang, D.W.; W a ng, S.G.; Hu a ng, K.; Yin, L.C.; Li, F.; Cheng, H.M. Agraphene-pure-sulfur sandwich structure for ultrafast, long-life lithium-sulfur batteries. Ado.Mater. 2 014,26,625-631.[ CrossRef ] [ P ub Med ] ) ( 132. F ang, R.P.; Zhao, S.Y.; Hou, P.X.; Cheng, M.; Wang, S.G.; Cheng, H.M.; Liu , C.; Li, F. 3D interconnectedelectrode materials with ultrahigh areal s ulfur loading for Li-S batteries. Adv. Mater. 2 016,28, 3374-3382.[ C r ossRef ] [Pu b Med] ) ( 133. Hu, G.J.; Xu, C.; Sun, Z.H. ; Wang, S.G. ; Cheng, H.M.; Li, F; Ren, W.C. 3D graphene-foam-reduced-graphene-oxide hybrid nested h i erarchical n etworks f o r high-performance Li - S batteries. A dv. M a ter.2016,28,1603-1609. [ CrossRef ] [ Pub M ed] ) ( 134. Zhou, G.M.; Li, L . ; Wang, D.W.; Shan, X.Y.; Pei, S.F.; L i , F.; Cheng, H.M. A flexible sulfur-graphene-polypropylene separator integrated electrode for advanced Li-S batteries. Ad v . Mater. 201 5 ,27,641-647.[ C r ossRe f ] [Pu b Med ] ) ( 135. N elson,J;Mi s ra,S.; Yang, Y.; Jackson, A.;Liu, Y.J.;Wang, H.L.;Dai, H.J.; Andrews, J.C.;Cui, Y.; Toney, M . F.In operando X-ray diffraction and transmission X-ray microscopy of lithium sulfur batteries. J. Am. Chem. Soc . 2012,134,6337-6343.[ C r ossRef ] [PubMed ] ) ( 136. Zielke, L . ; Barchasz, C.; Walus, S.; Alloin,F.; L epretre, J.C.; Spettl, A.; Schmidt, V.; Hilger, A.;Manke, I.; Banhart, J.; et al . Degradation of Li/S battery electrodes on 3D current collectors studied using X-ray phase contrast tomography. Sci. Rep. UK 2015, 5, 10921. [C rossRef][ Pu b Me d] ) ( 137. M cDonald, S.A.; H o lzner, C.; Lauridsen, E. M .; Re i schig, P.; Merkle, A.P.; Withers, P . J. Microstructuralevolution during sintering of copper p articles studied by laboratory diffraction contras t tomography(LabDCT). Sci. Rep . UK 2017,7,5251 . [ CrossRef ] [ P ub Med ] ) ( 138. S Sun, J; Lyckegaard, A .; Zhang,Y.B.; Catherine, S.A.; P atterson, B.R.; Bachmann, F.; Gueninchault, N.; Bale, H.; Holzner, C.; Lauridsen, E.; et al . 4D study of grain growth in armco iron using laboratory X-raydiffraction contrast tomography. In Proceedings of the 38th Riso International Symposium on MaterialsScience, San Diego, CA, USA, 4-8 September 2017; IOP Science: San Diego, CA, USA, 2017. ) ( 139. King, A.; Reischig, P.; Adrien,J; Ludwig, W. Firs t laboratory X-ray diffraction contrast tomography for grainmapping of polycrystals. J. Appl. Crystallogr.2013,46,1 7 34-1740.[C r o ssRef] ) ( 140. W ang, B.; Pan, B.; Lubineau, G.M o rphological evolution and internal strain ma p ping of pomelo peel usingX-ray computed tomography and digital volume correlation. Mater. Des. 2018,137,305-315. [ CrossRef] ) ( 141. Lachambre,J.; Re t hore, J.; Weck, A.; Buffiere, J.Y. E xtraction of stress intensity factors for 3D small fatiguecracks using digital volume correlation and X-ray tomography. Int. J. Fatigue 2015, 71, 3-10. [ CrossRef] ) ( 142. K hoshkhou, D.; Mostafavi, M.; Re i nhard, C.; Ta y lor,M.P.; Ri c kerby, D.S.; Edmonds, I.M.; Eva n s, H.E.;Marrow, T.J.; Connolly, B.J. Three-dimensional displacement mapping of diffused Pt th e rmal barrier coatingsvia synchrotron X-ray computed tomography and digital volume correlation. Scr. M ater. 2016, 115,100-103. [ C r ossRef l ) ( 143. Germaneau, A.; Doumalin, P.;Dupre, J.C.Comparison between X-ray micro-computed tomography and optical scanning tomography for full 3D strain measurement by digital volume correlation. Ndt&E Int.2008, 41,407-415. ) ( 144. L eclerc,H.;Roux, S.; Hild, F. Projection savings i n CT-based digital volume correlation. Exp. Mech. 2 0 15,55,275-287. [ C ro s sRef] ) ( 145. T aillandier-Thomas, T.; Roux, S.; Hild, F . Soft route to 4D tomography.Ph y s. Re v . Le t t. 2 0 16, 1 1 7,025501.[ C r ossRe f ] [P ubMe d ] ) ( O 2018 by th e authors. Licensee MDPI, Basel,Switzerland. This article is a n open acc e ss CC article distributed under the terms and conditions of the Creative Commons Attribution (CC BY) license (http://creativecommons.org/licenses/by/4.0/). ) Although X-rays generated from a laboratory-based tube cannot be compared withsynchrotron radiation in brilliance and monochromaticity, they are still viable and accessible in-house for ex situ or interrupted in situ X-ray tomography. This review mainly demonstrates recent works using laboratory X-ray tomography coupled with the measurements of properties or performance testing under various conditions, such as thermal, stress, or electric fields. Evolvements of correlated internal structures for some typical materials were uncovered. The damage features in a graded metallic 3D mesh and a metallic glass under mechanical loading were revealed and investigated. Micro-voids with thermal treatment and void healing phenomenon with electropulsing were clearly demonstrated and quantitatively analyzed. The substance transfer around an electrode of a Li-S battery and the protective performance of a Fe-based metallic glass coating on stainless steel were monitored through electrochemical processes. It was shown that in situ studies of the laboratory X-ray tomography were suitable for the investigation of structure change under controlled conditionsand environments. An extension of the research for in situ laboratory X-ray tomography can be expected with supplementary novel techniques for internal strain, global 3D grain orientation, and a fast tomography strategy.
确定
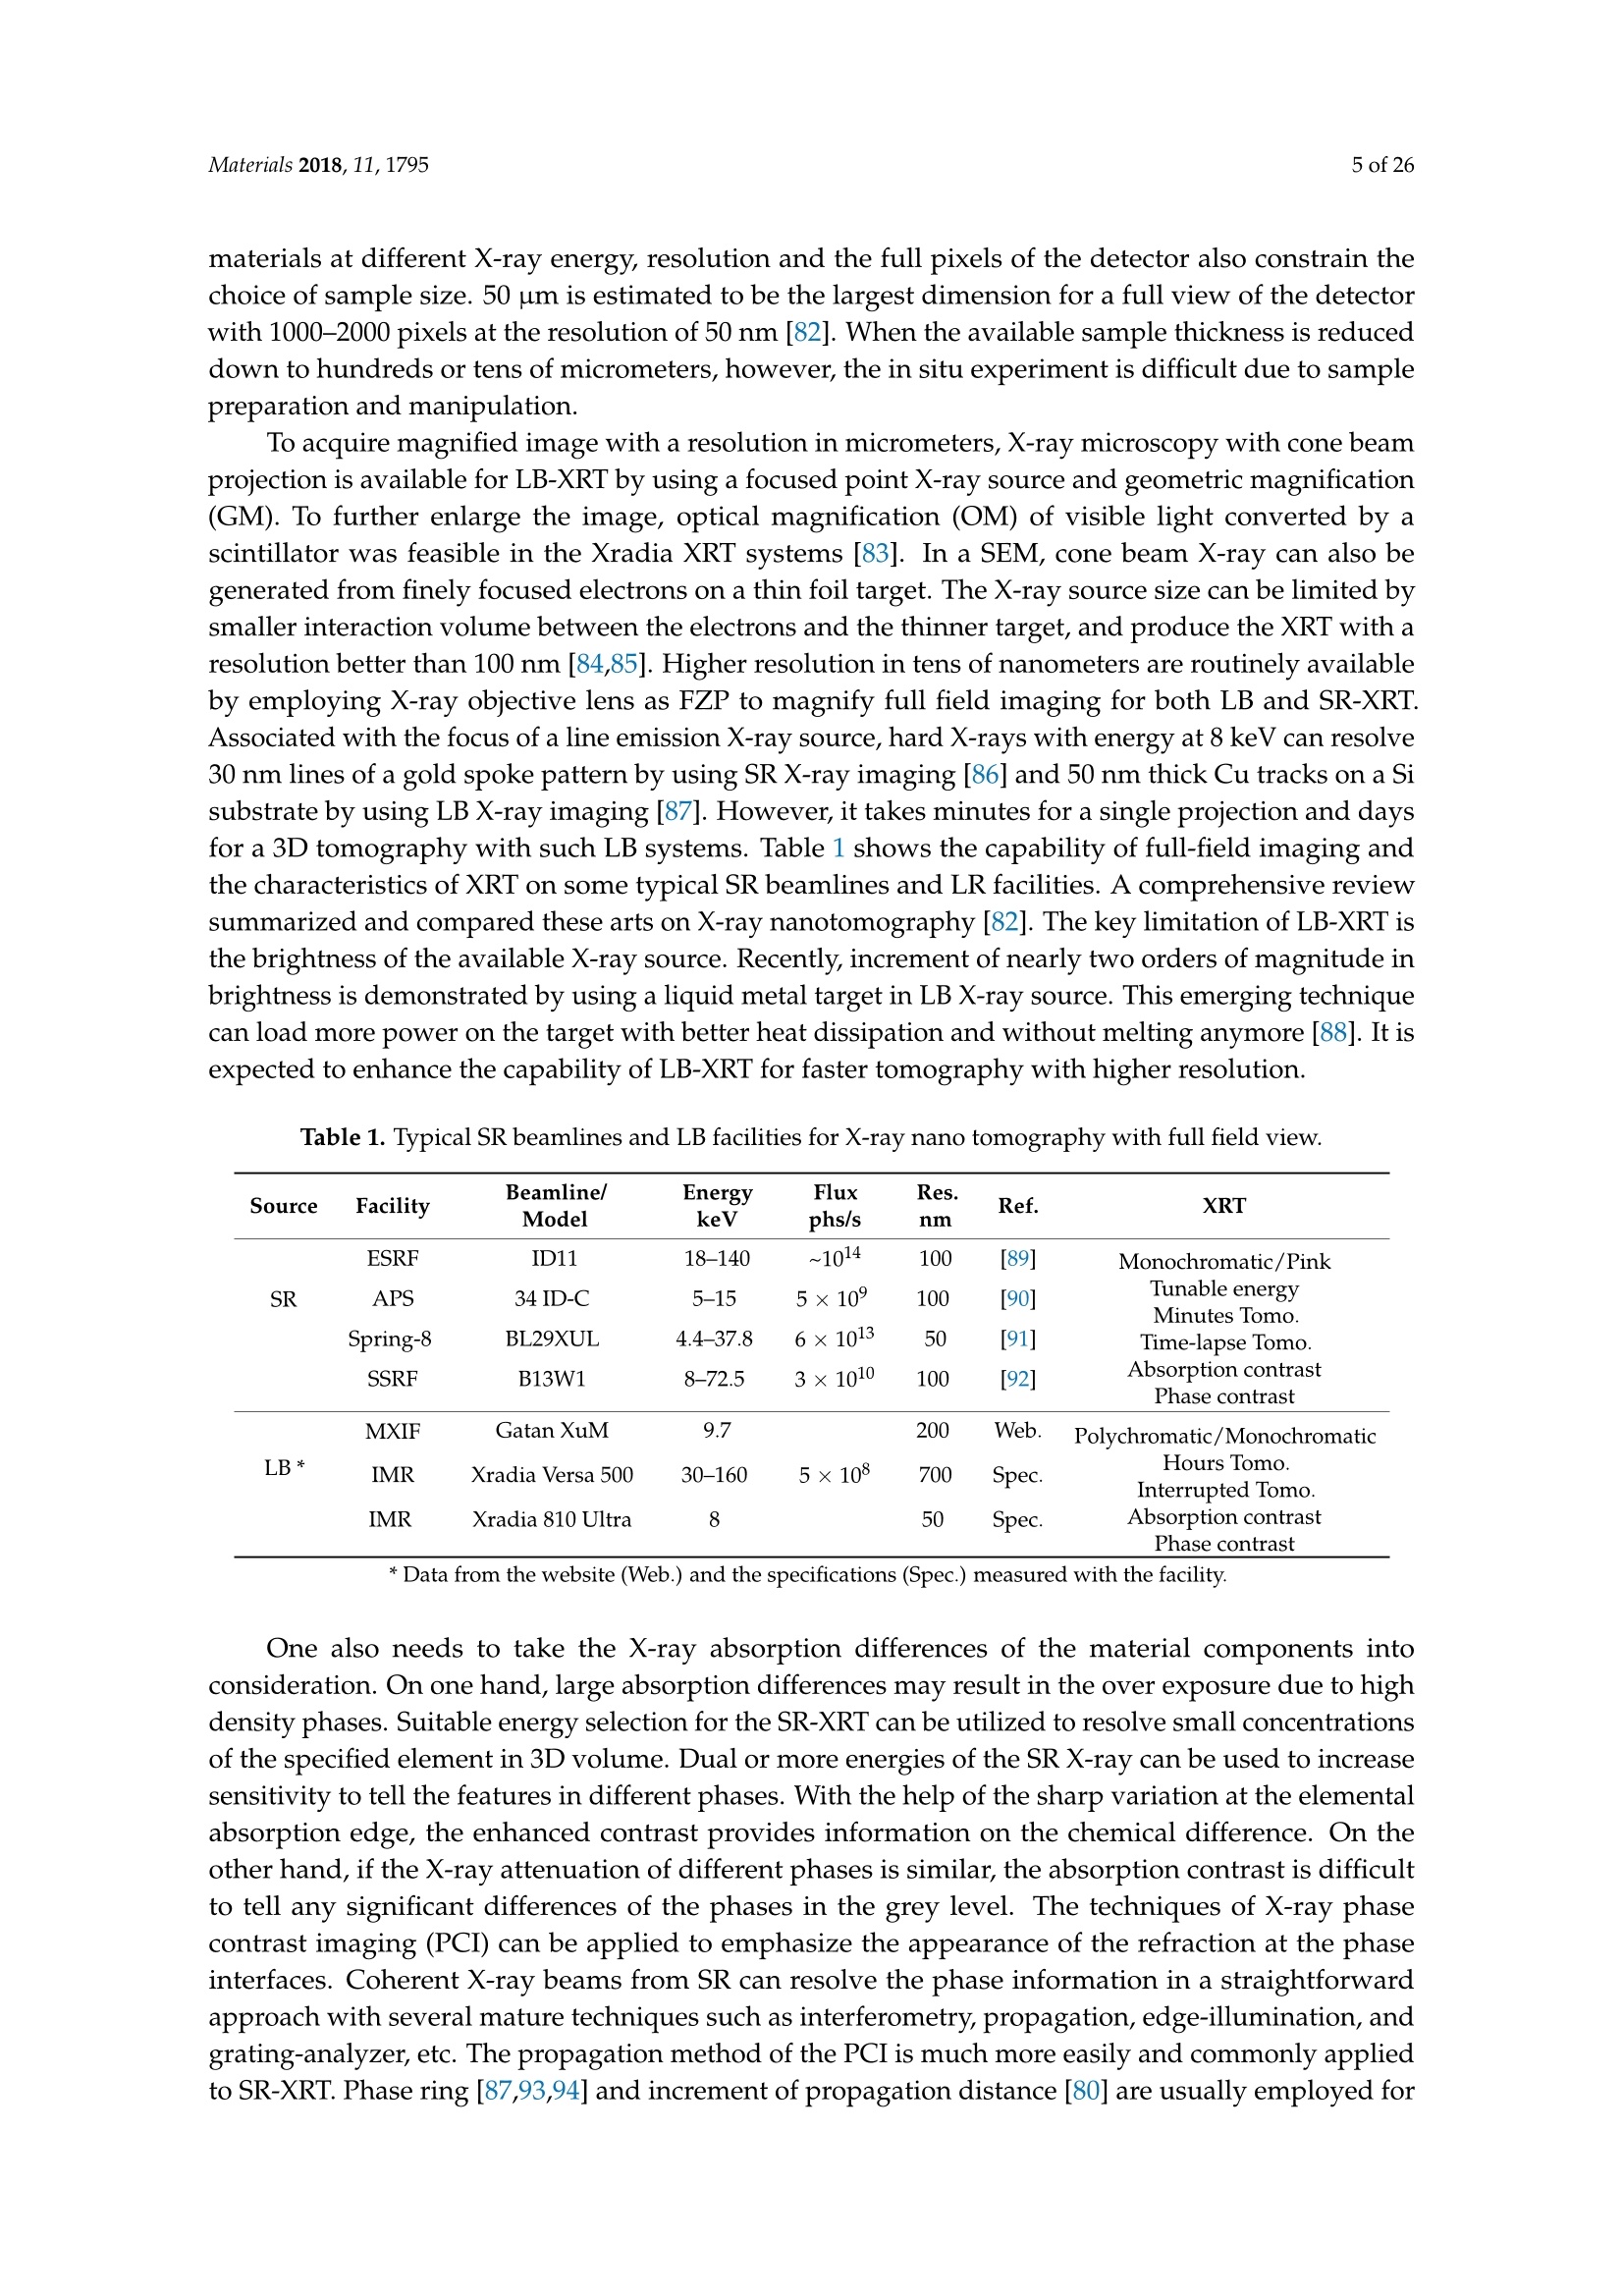
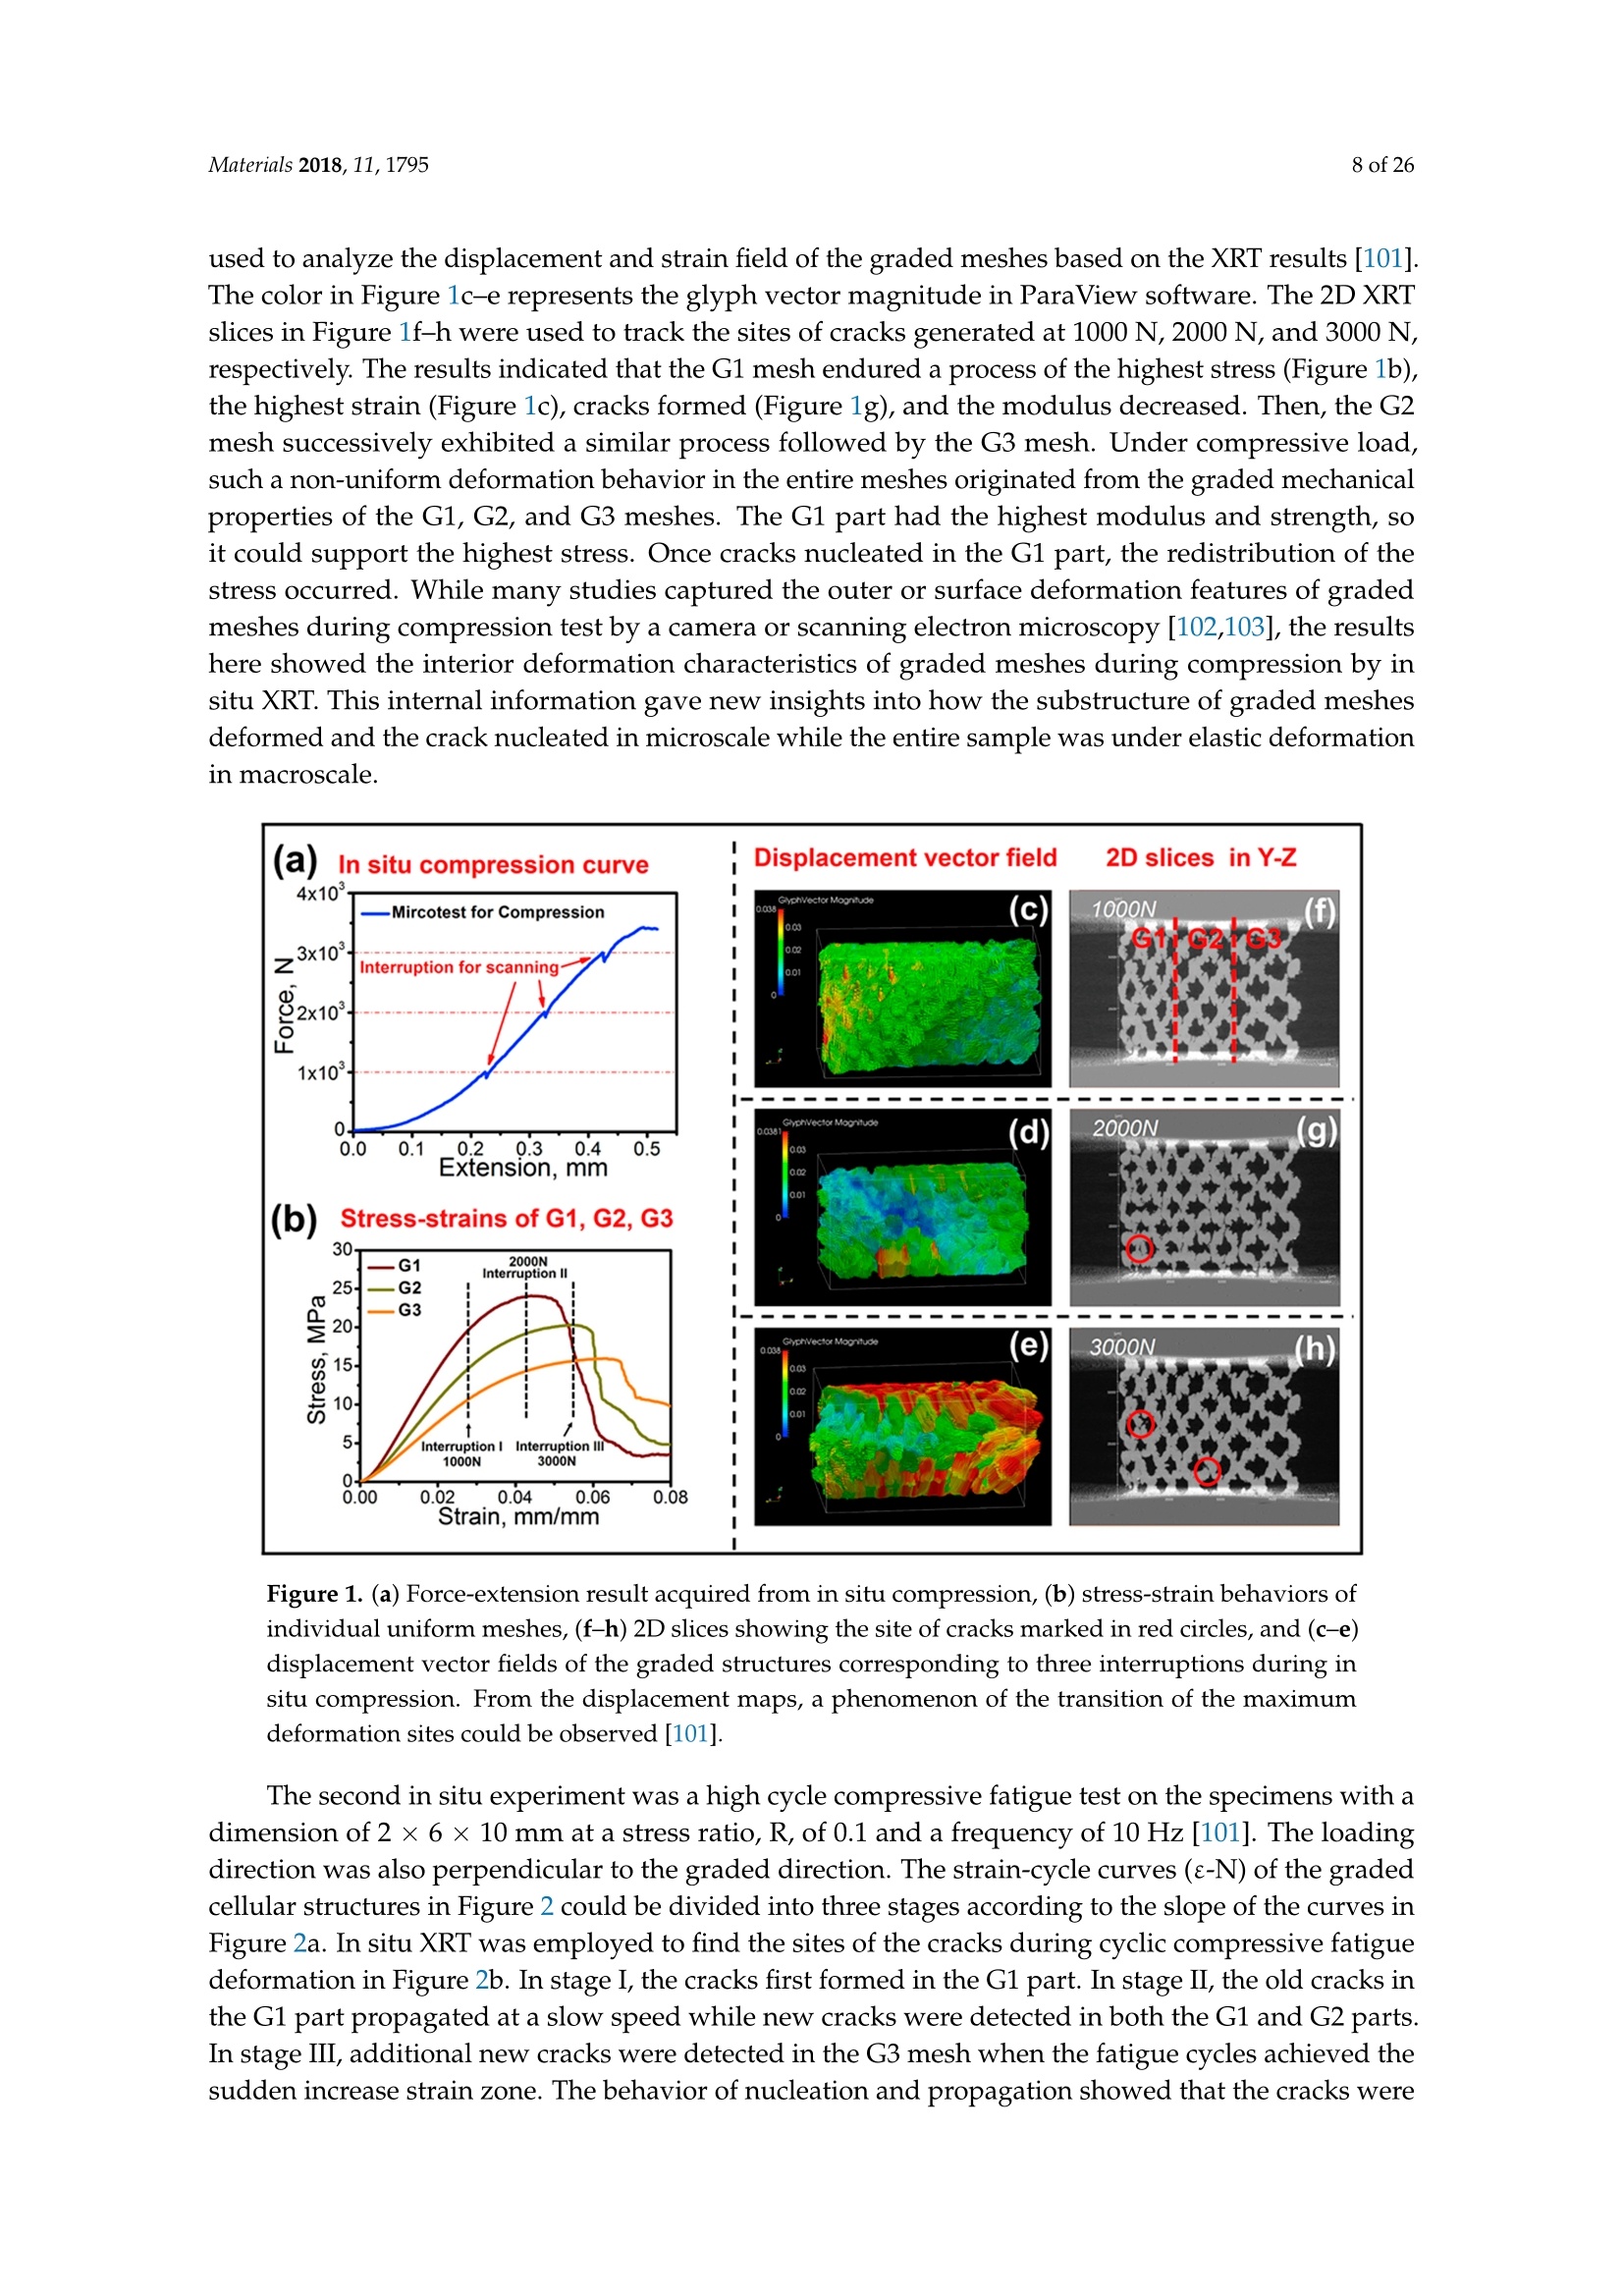
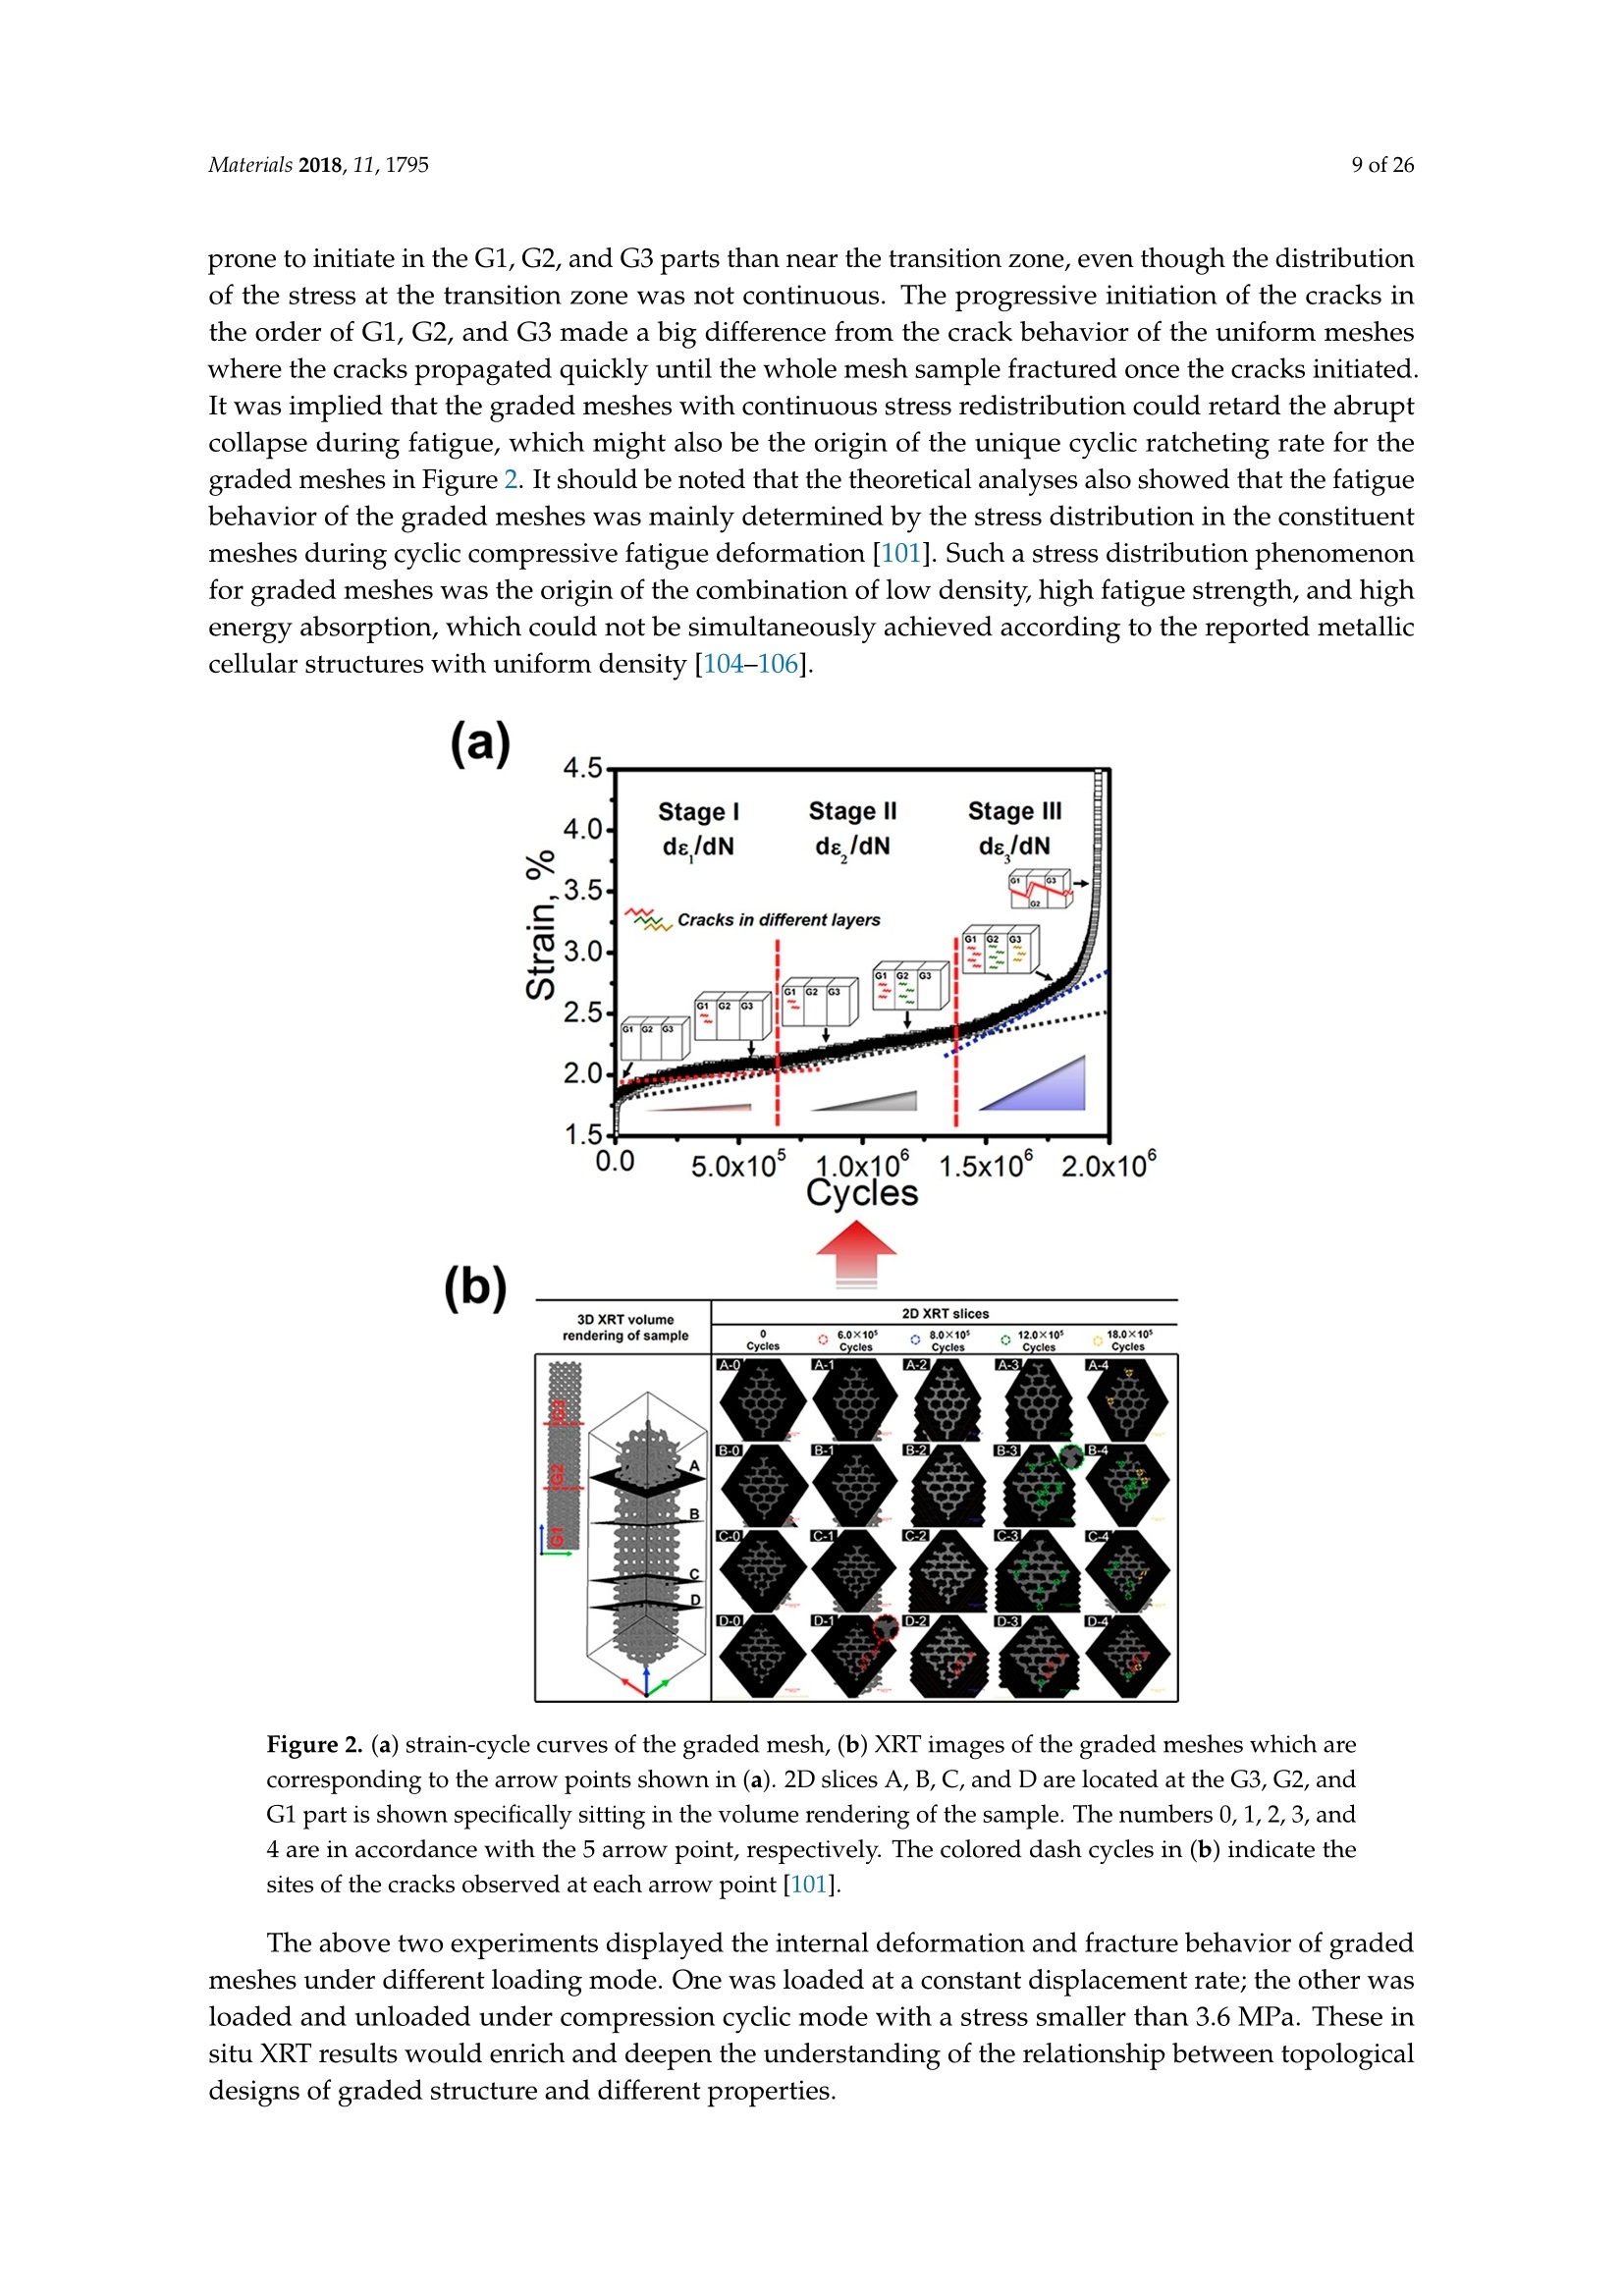
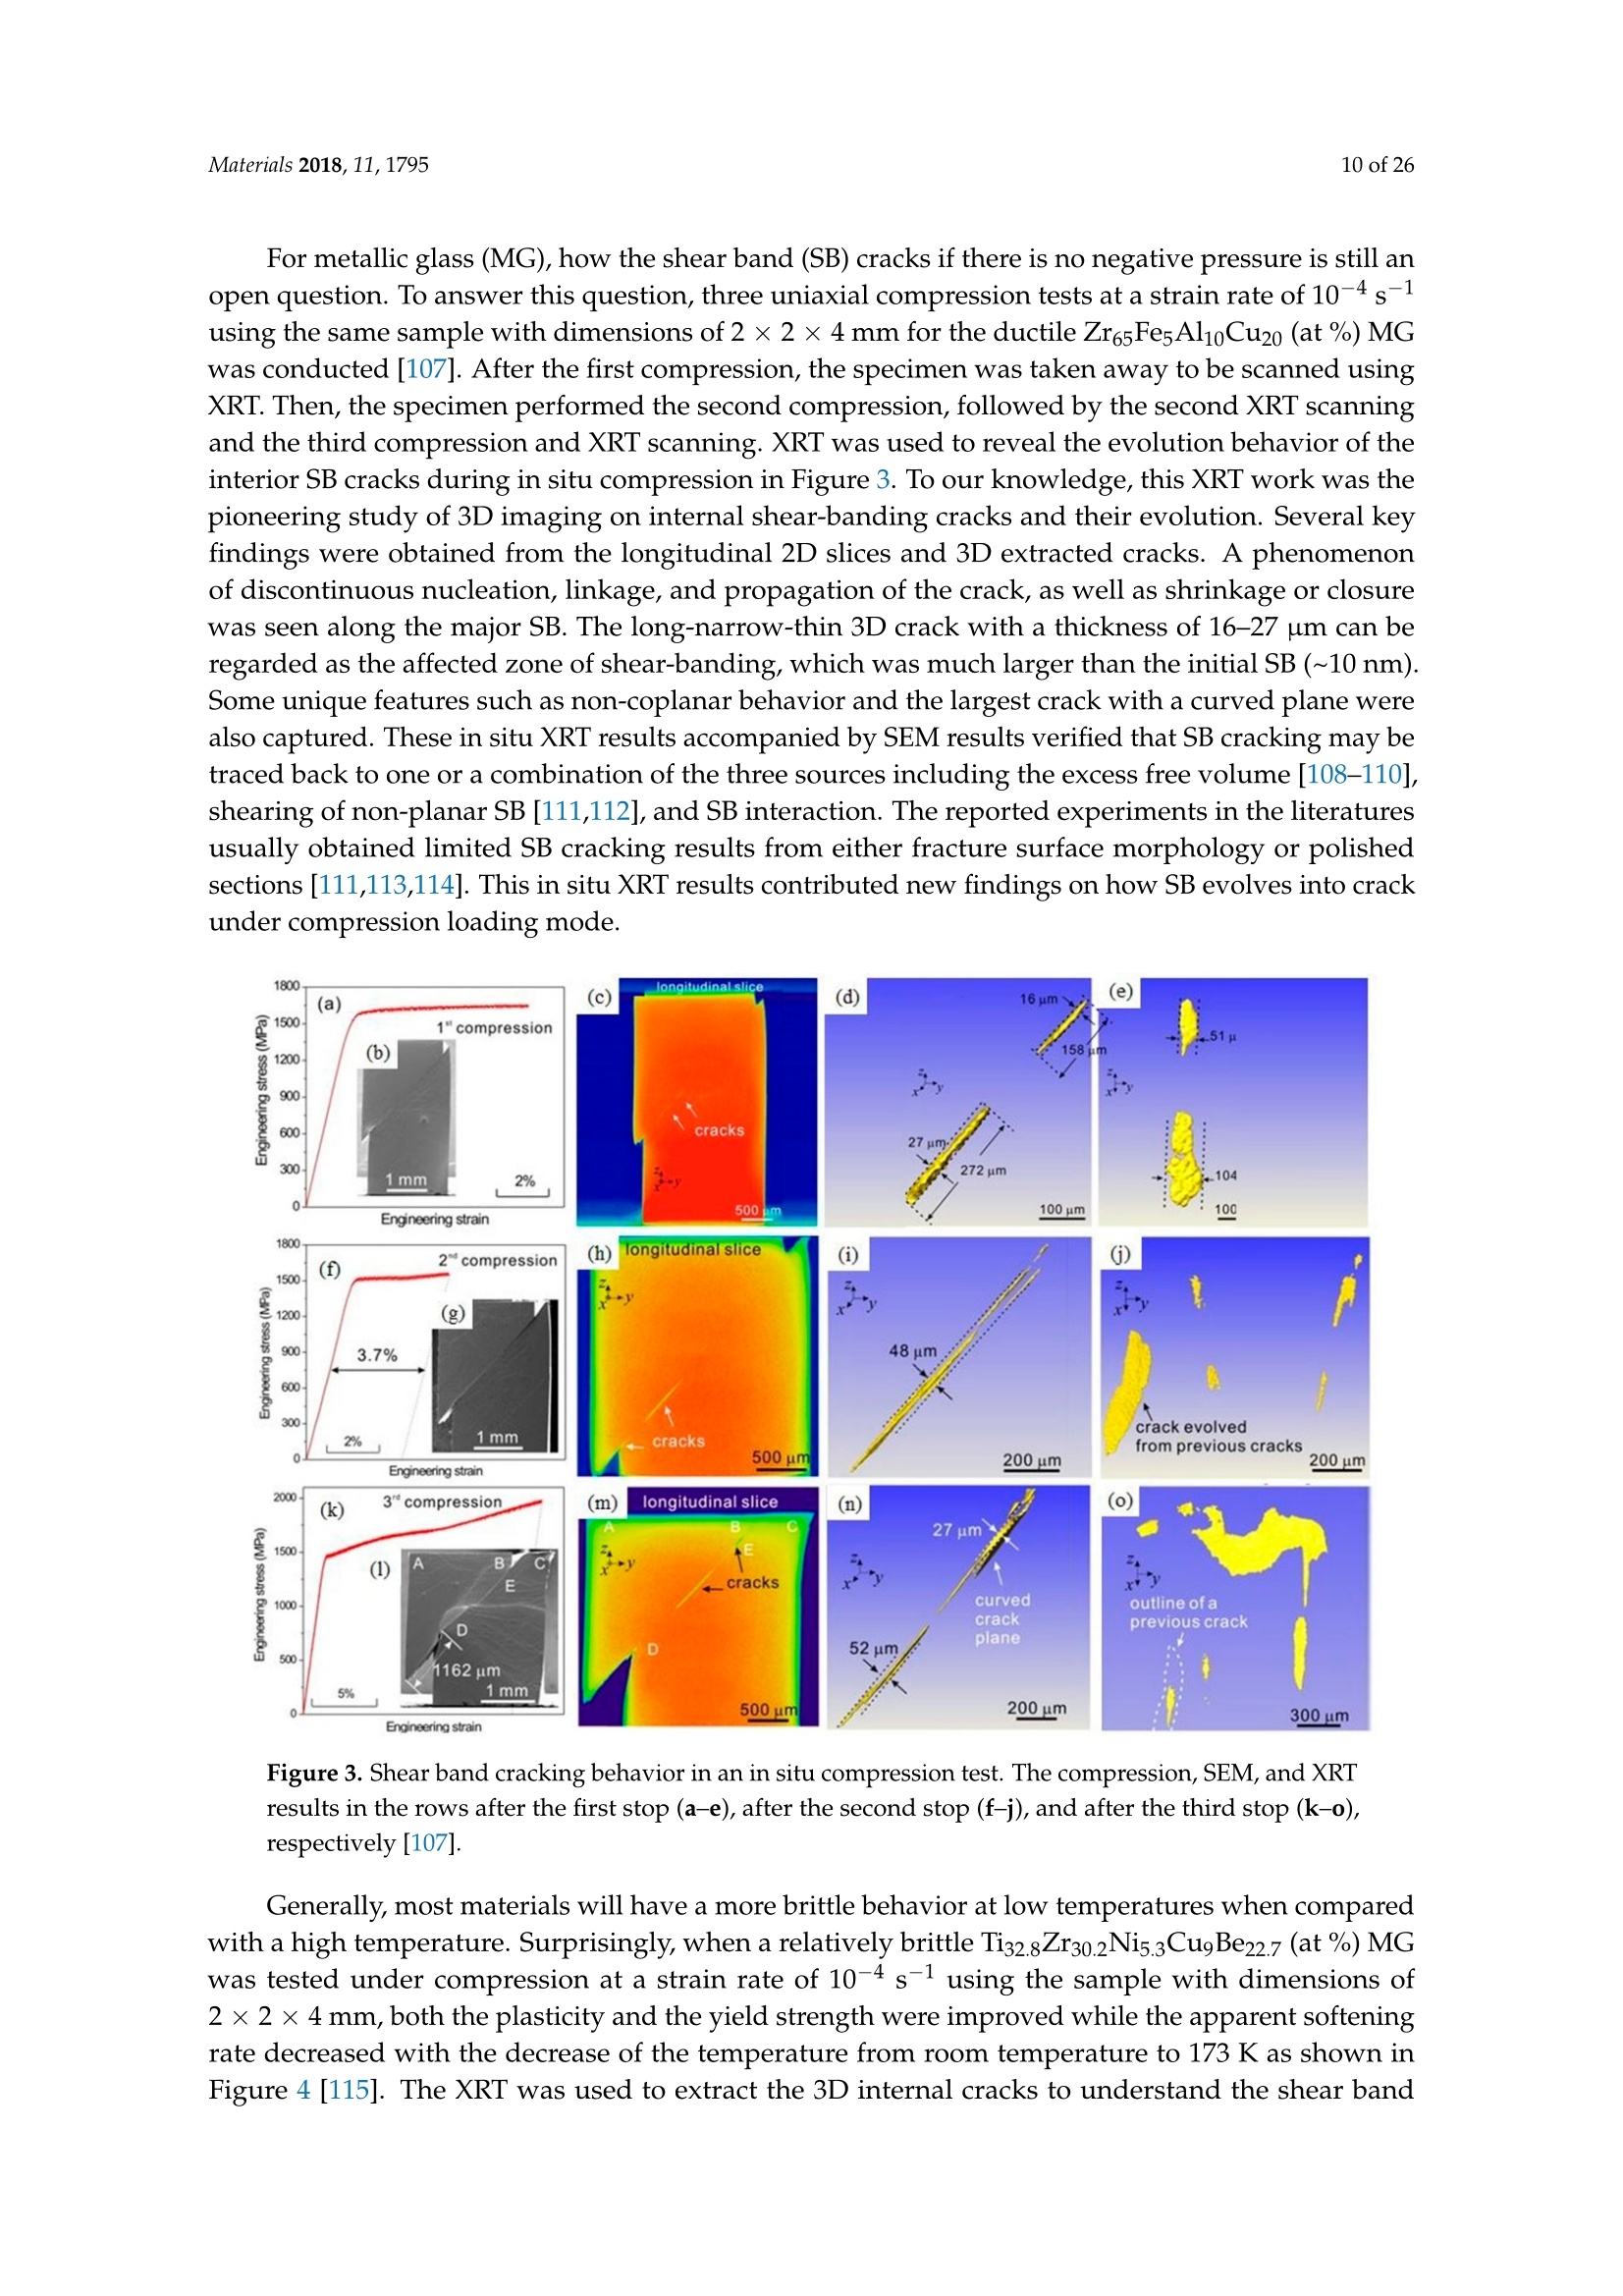
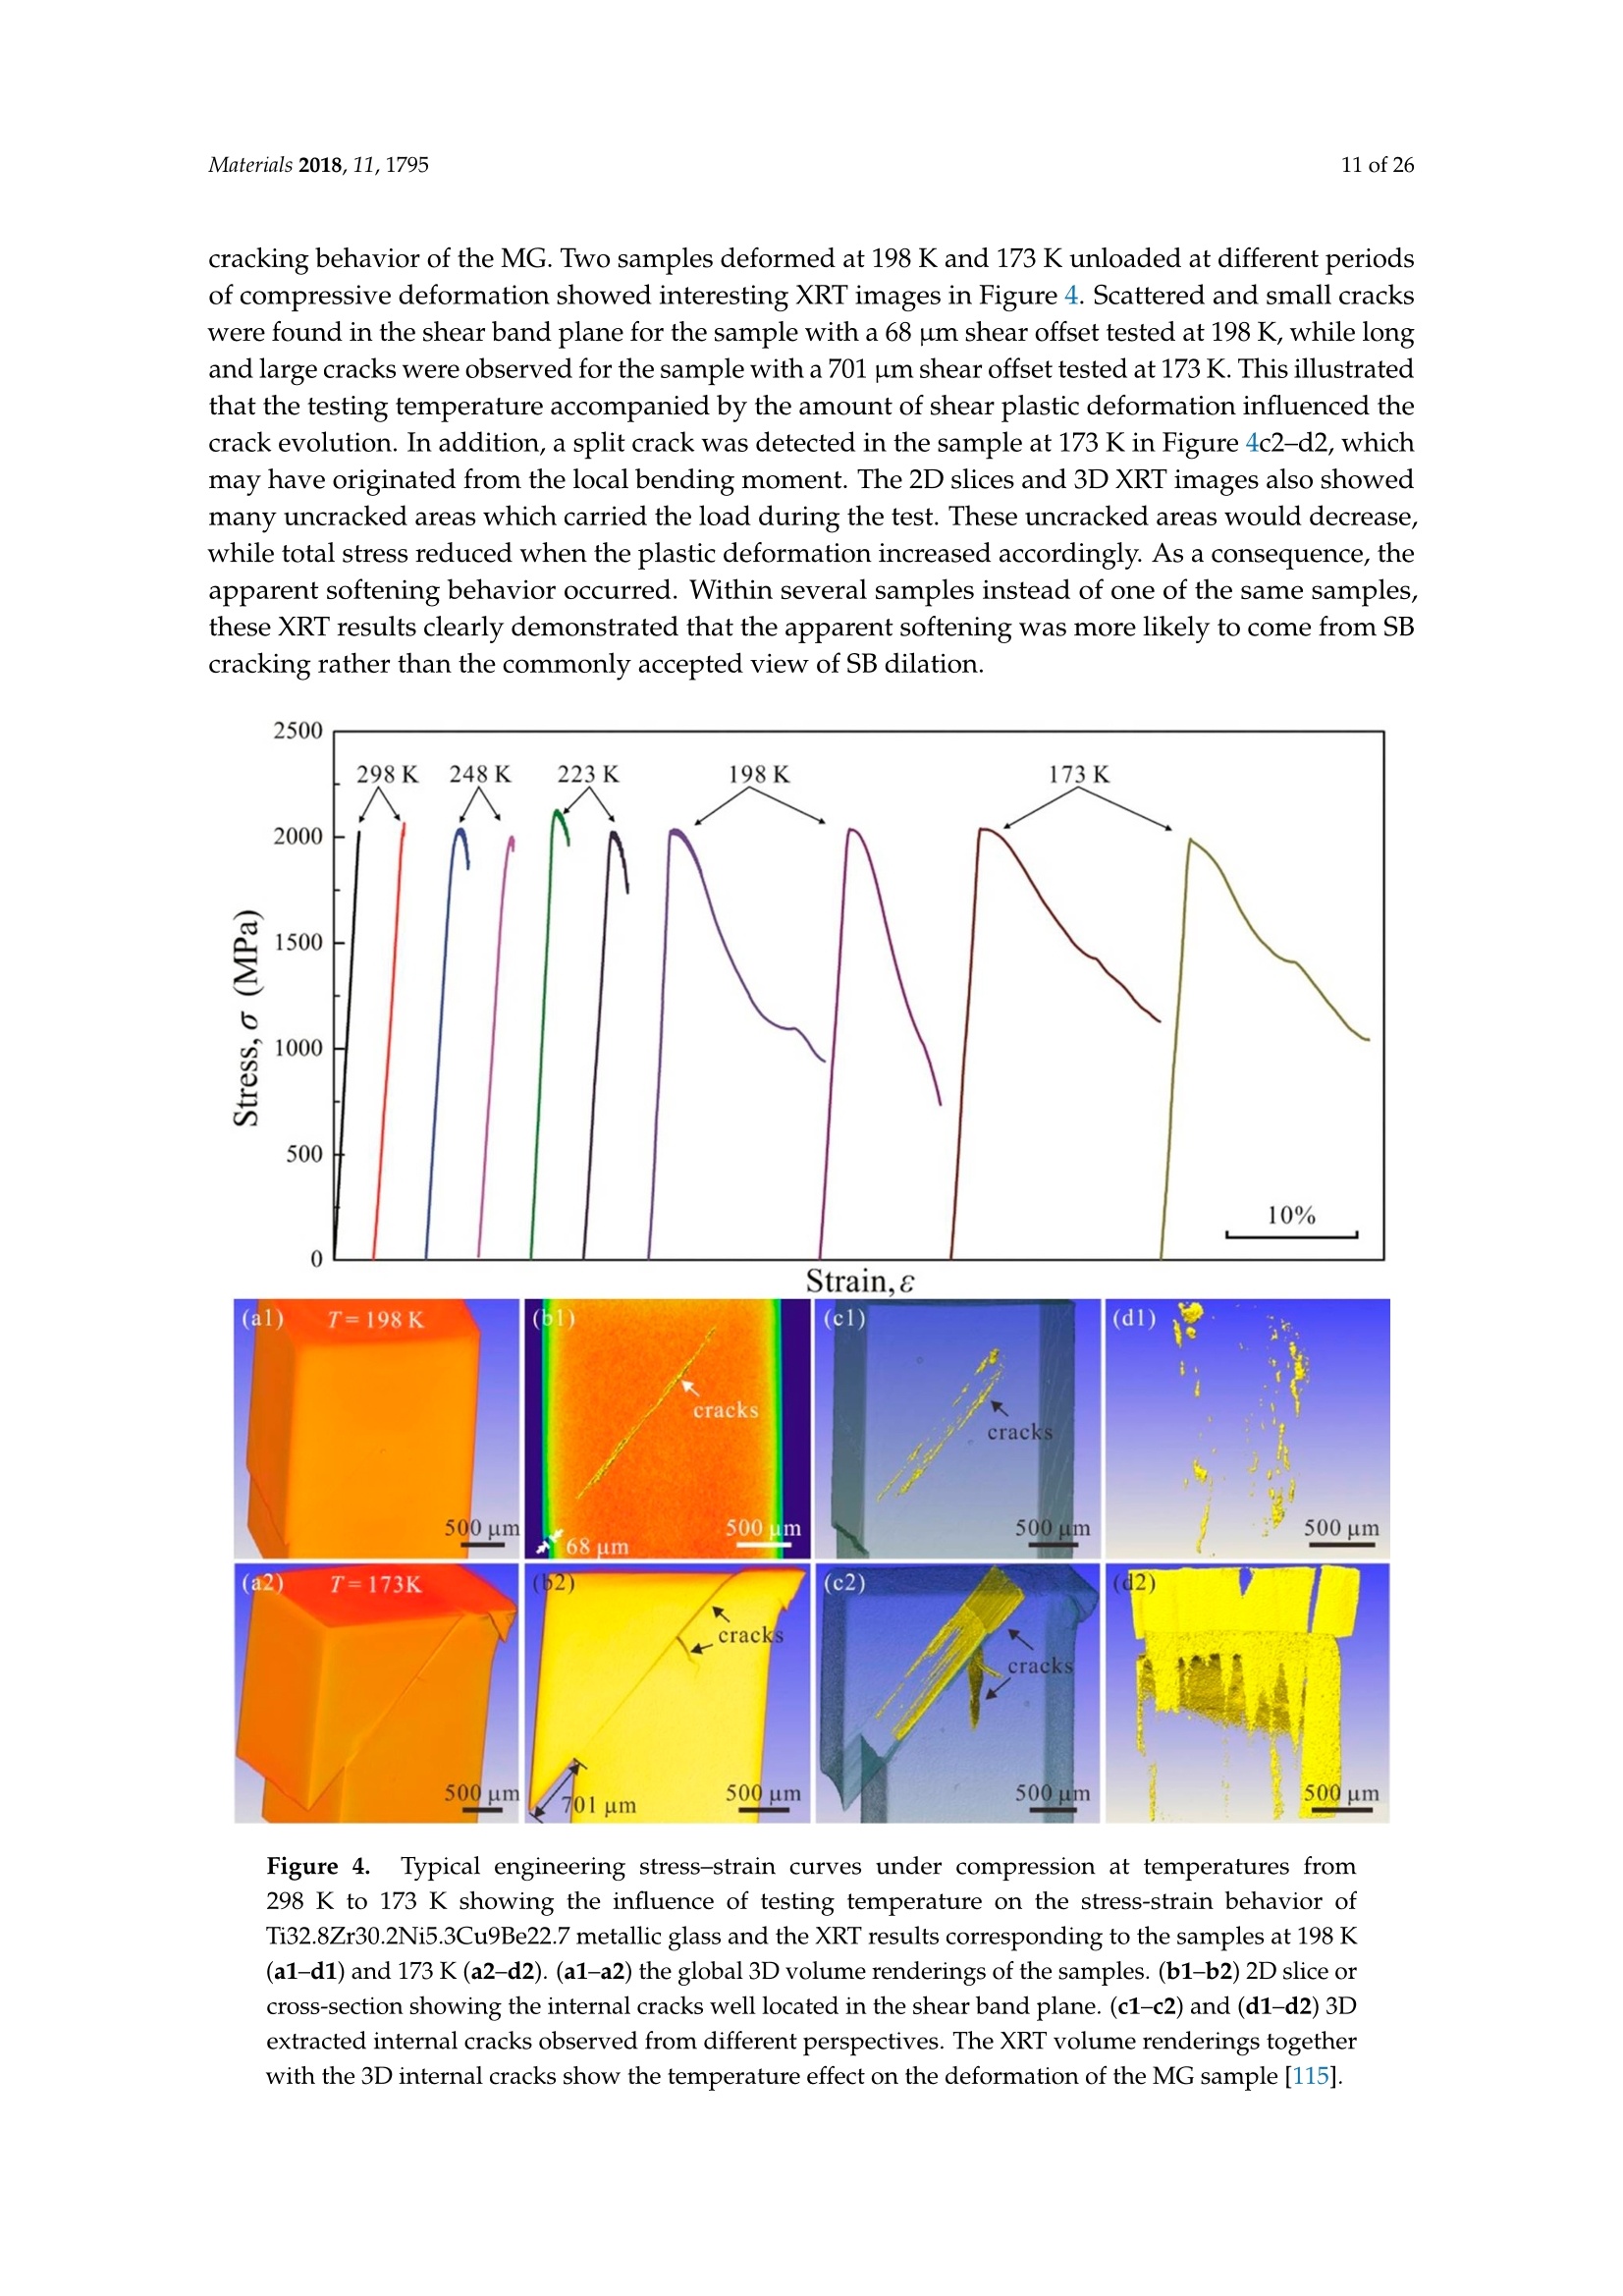
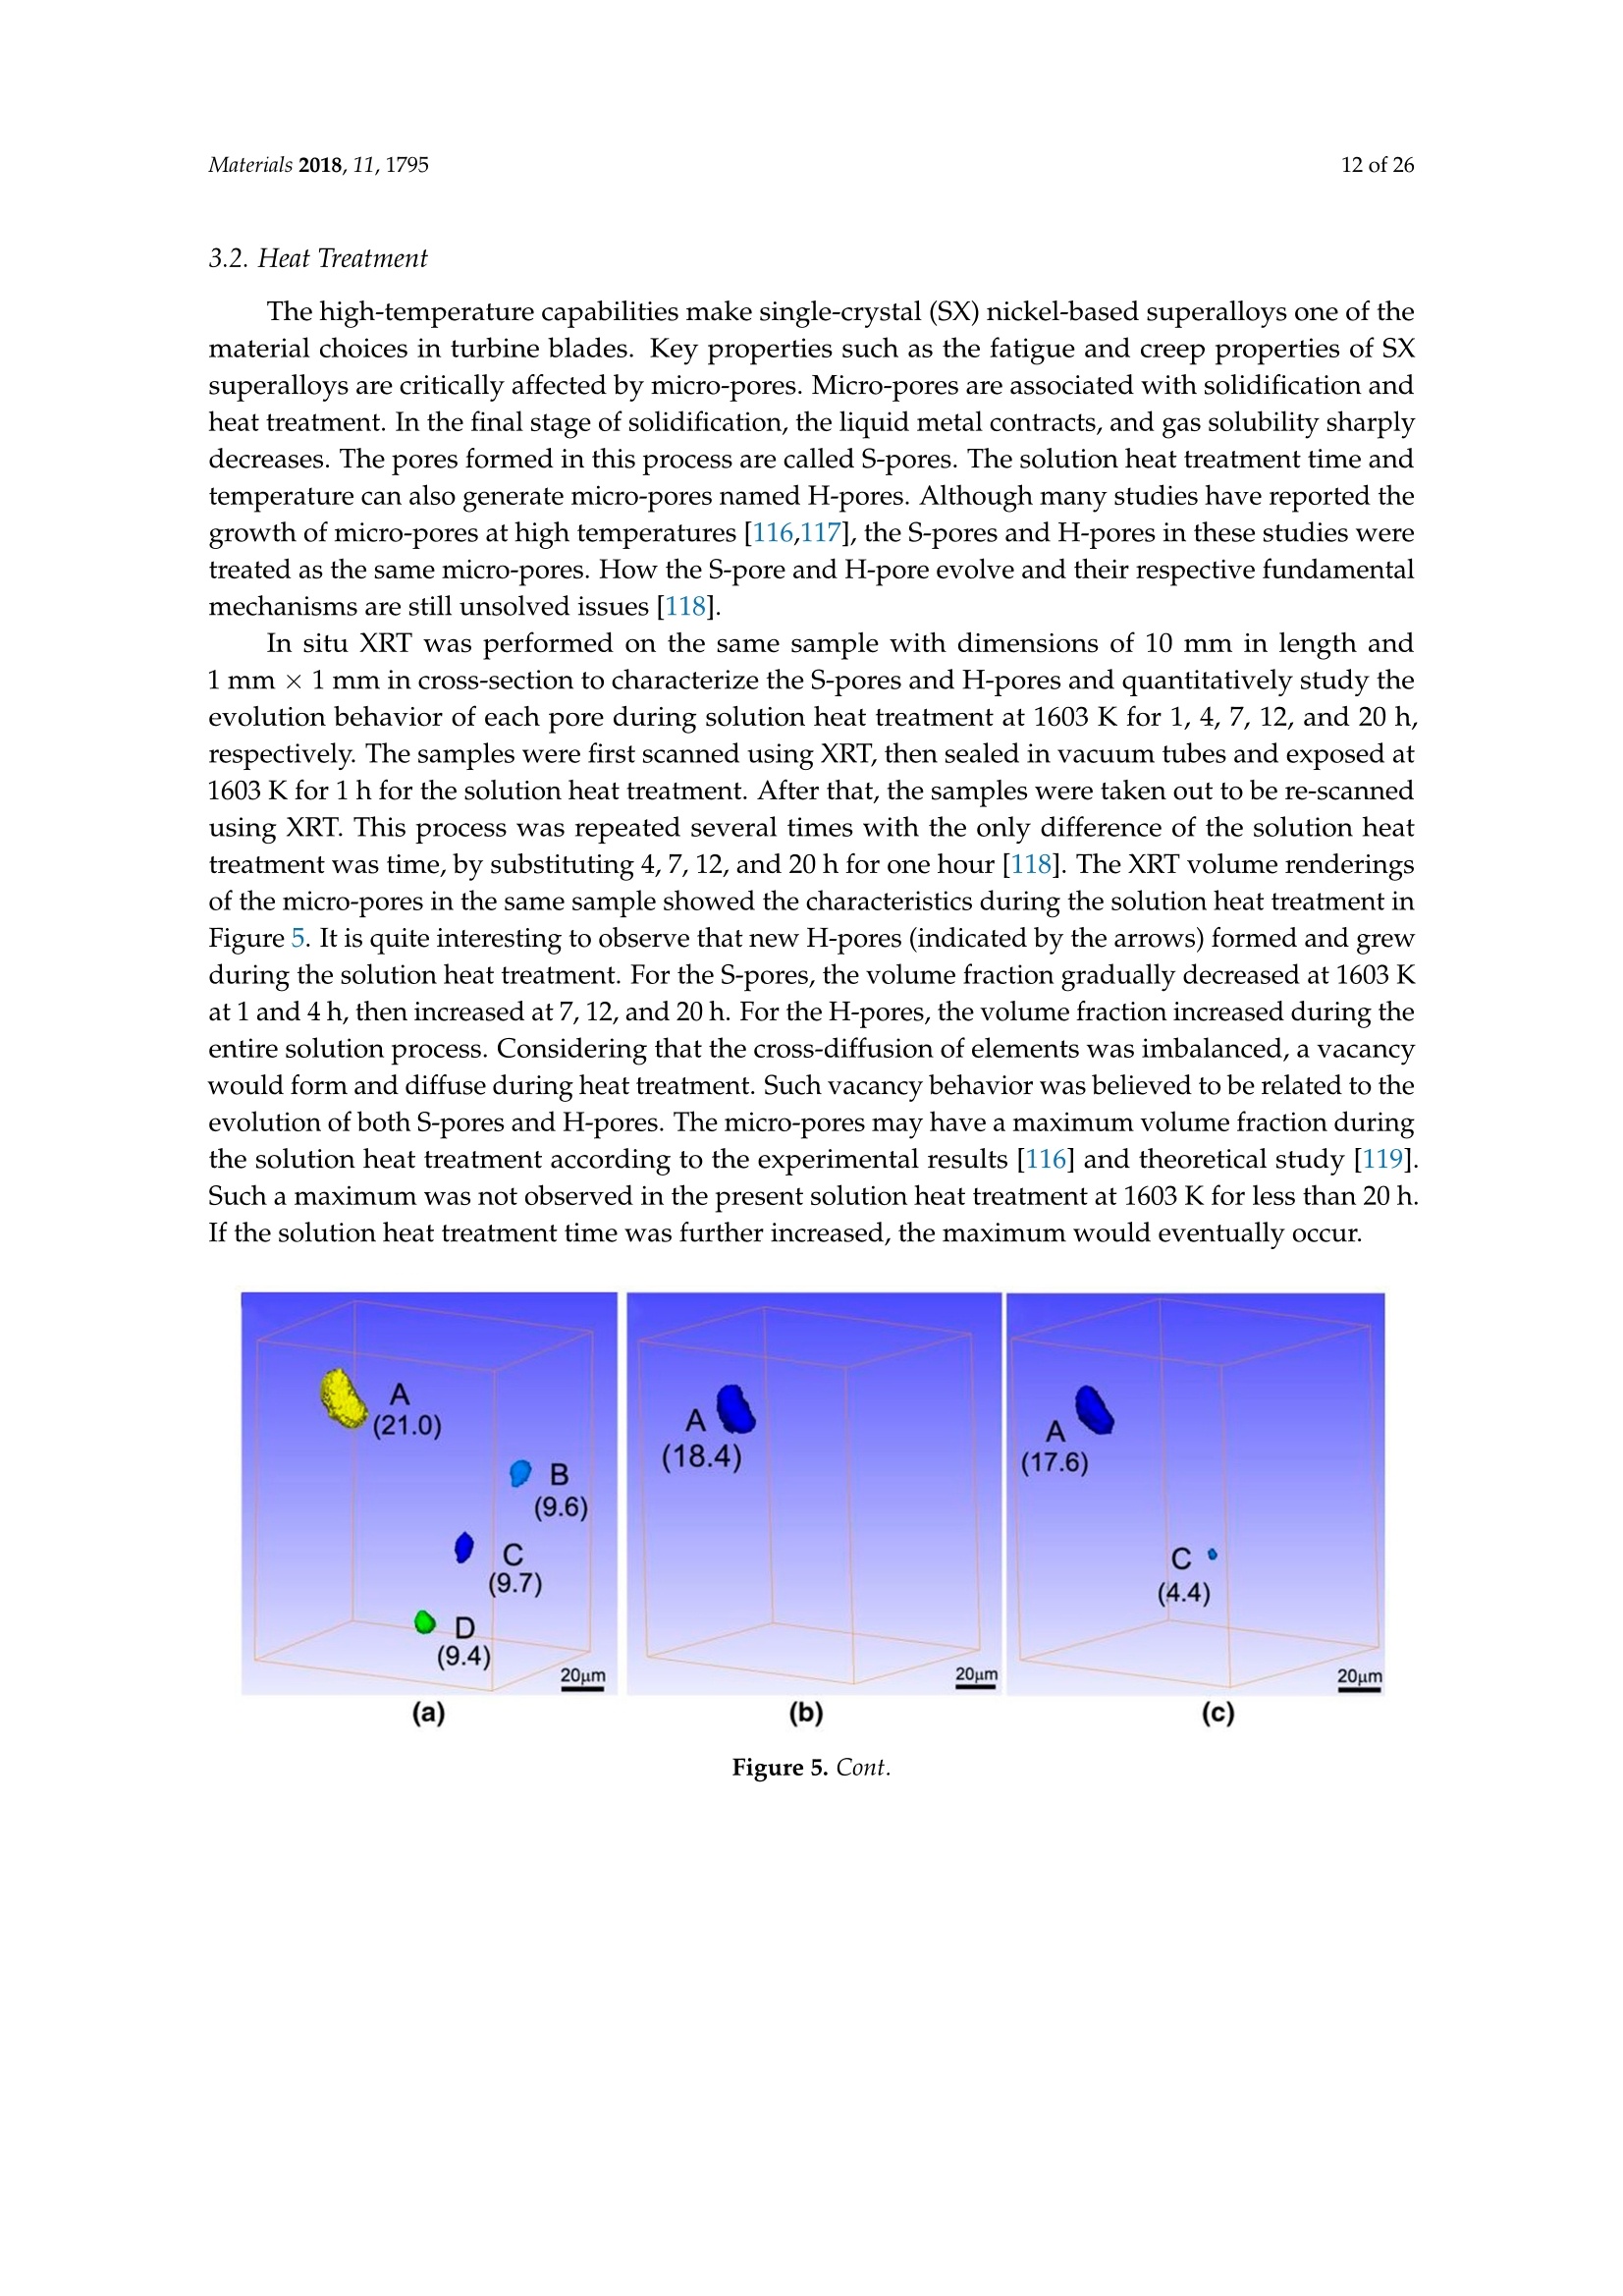
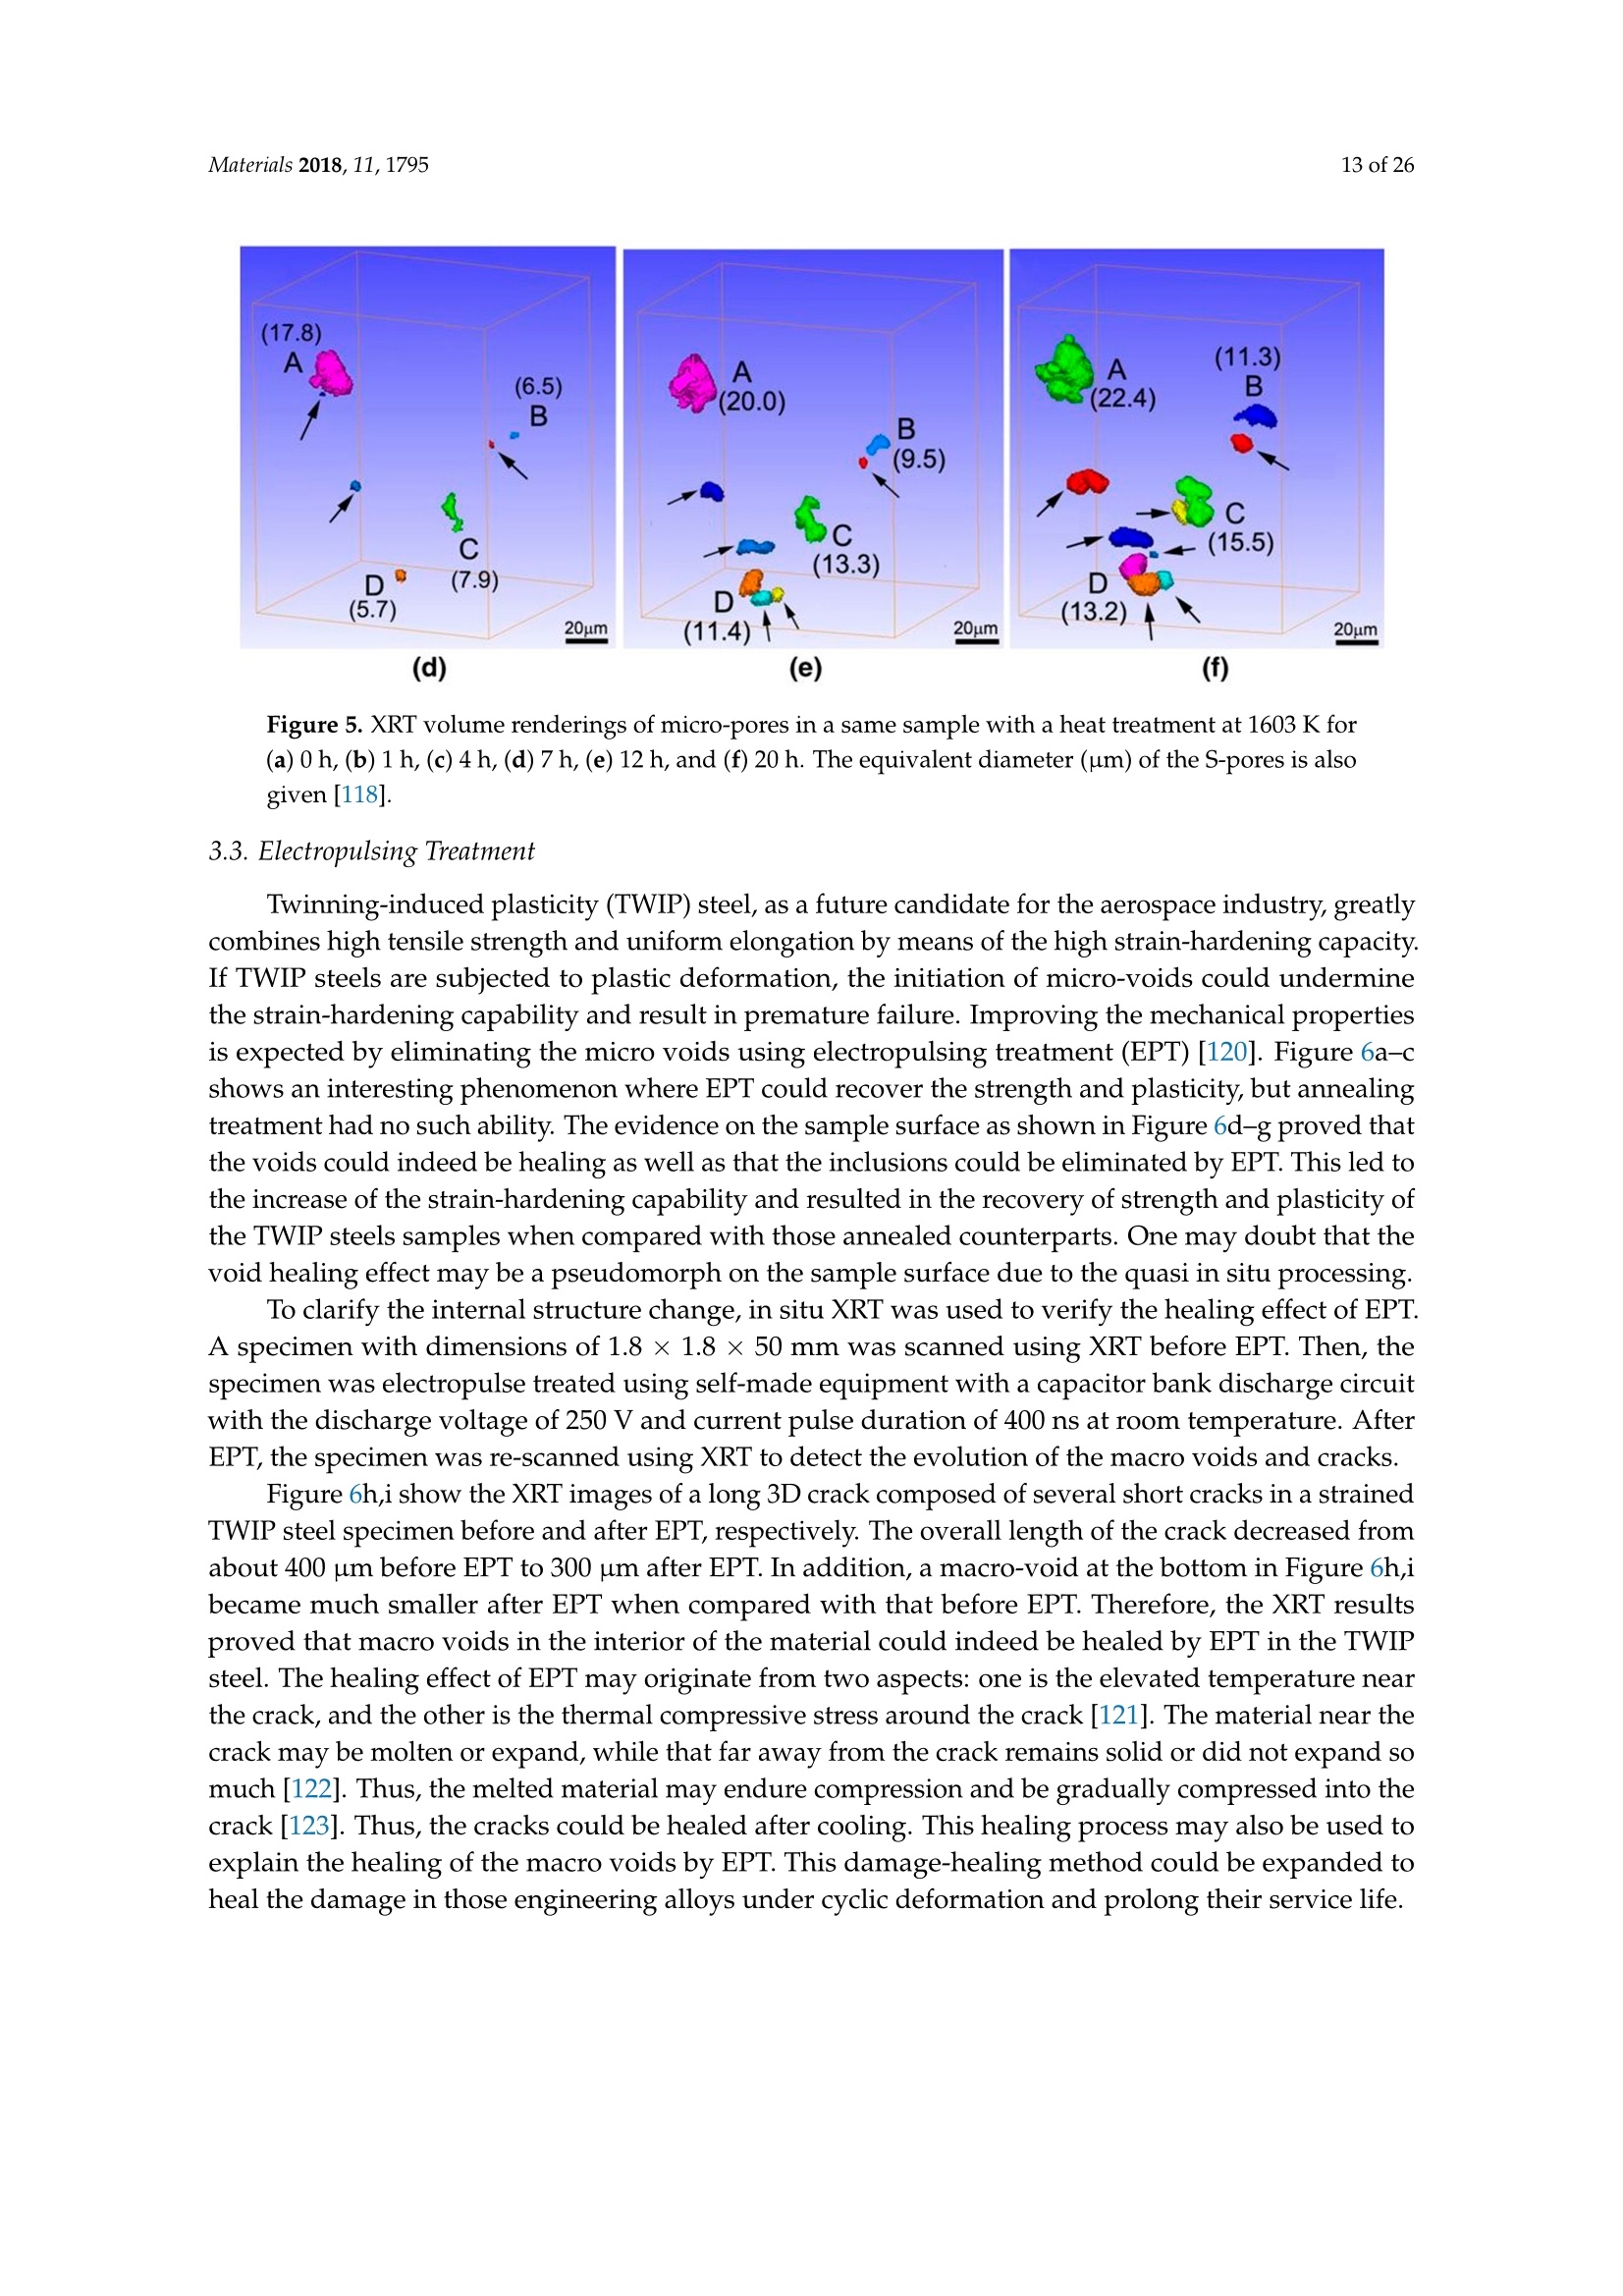
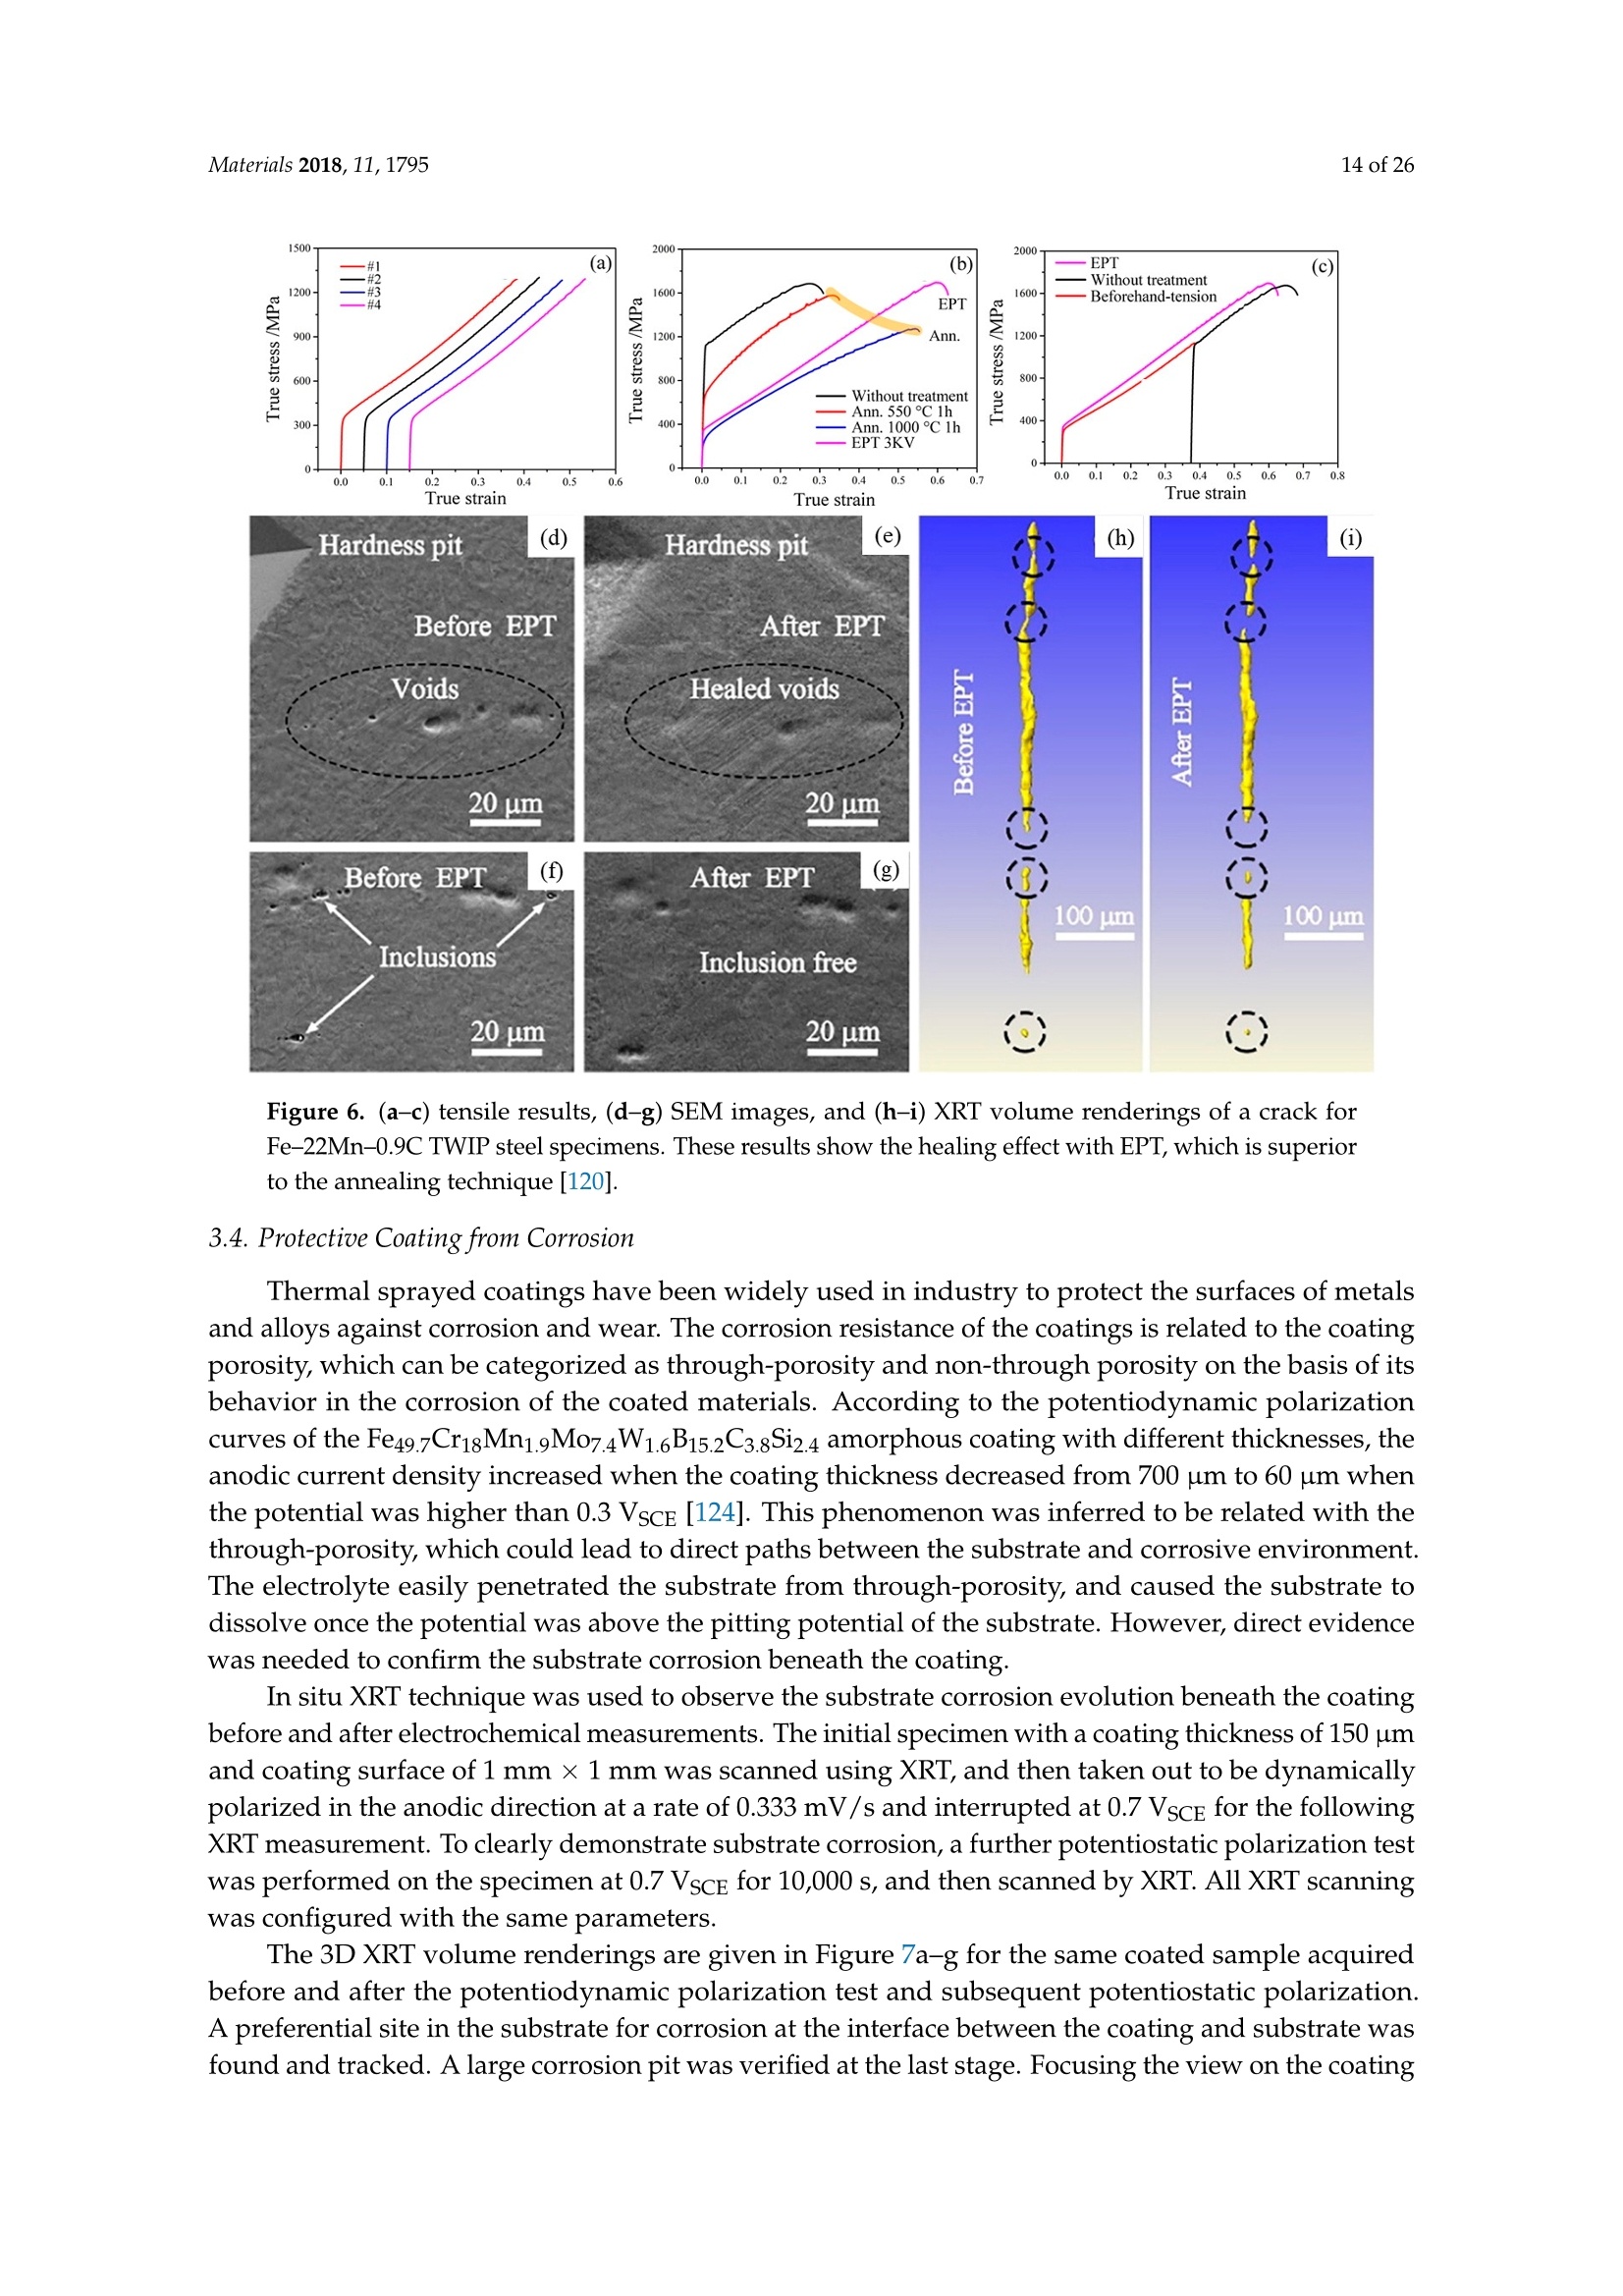
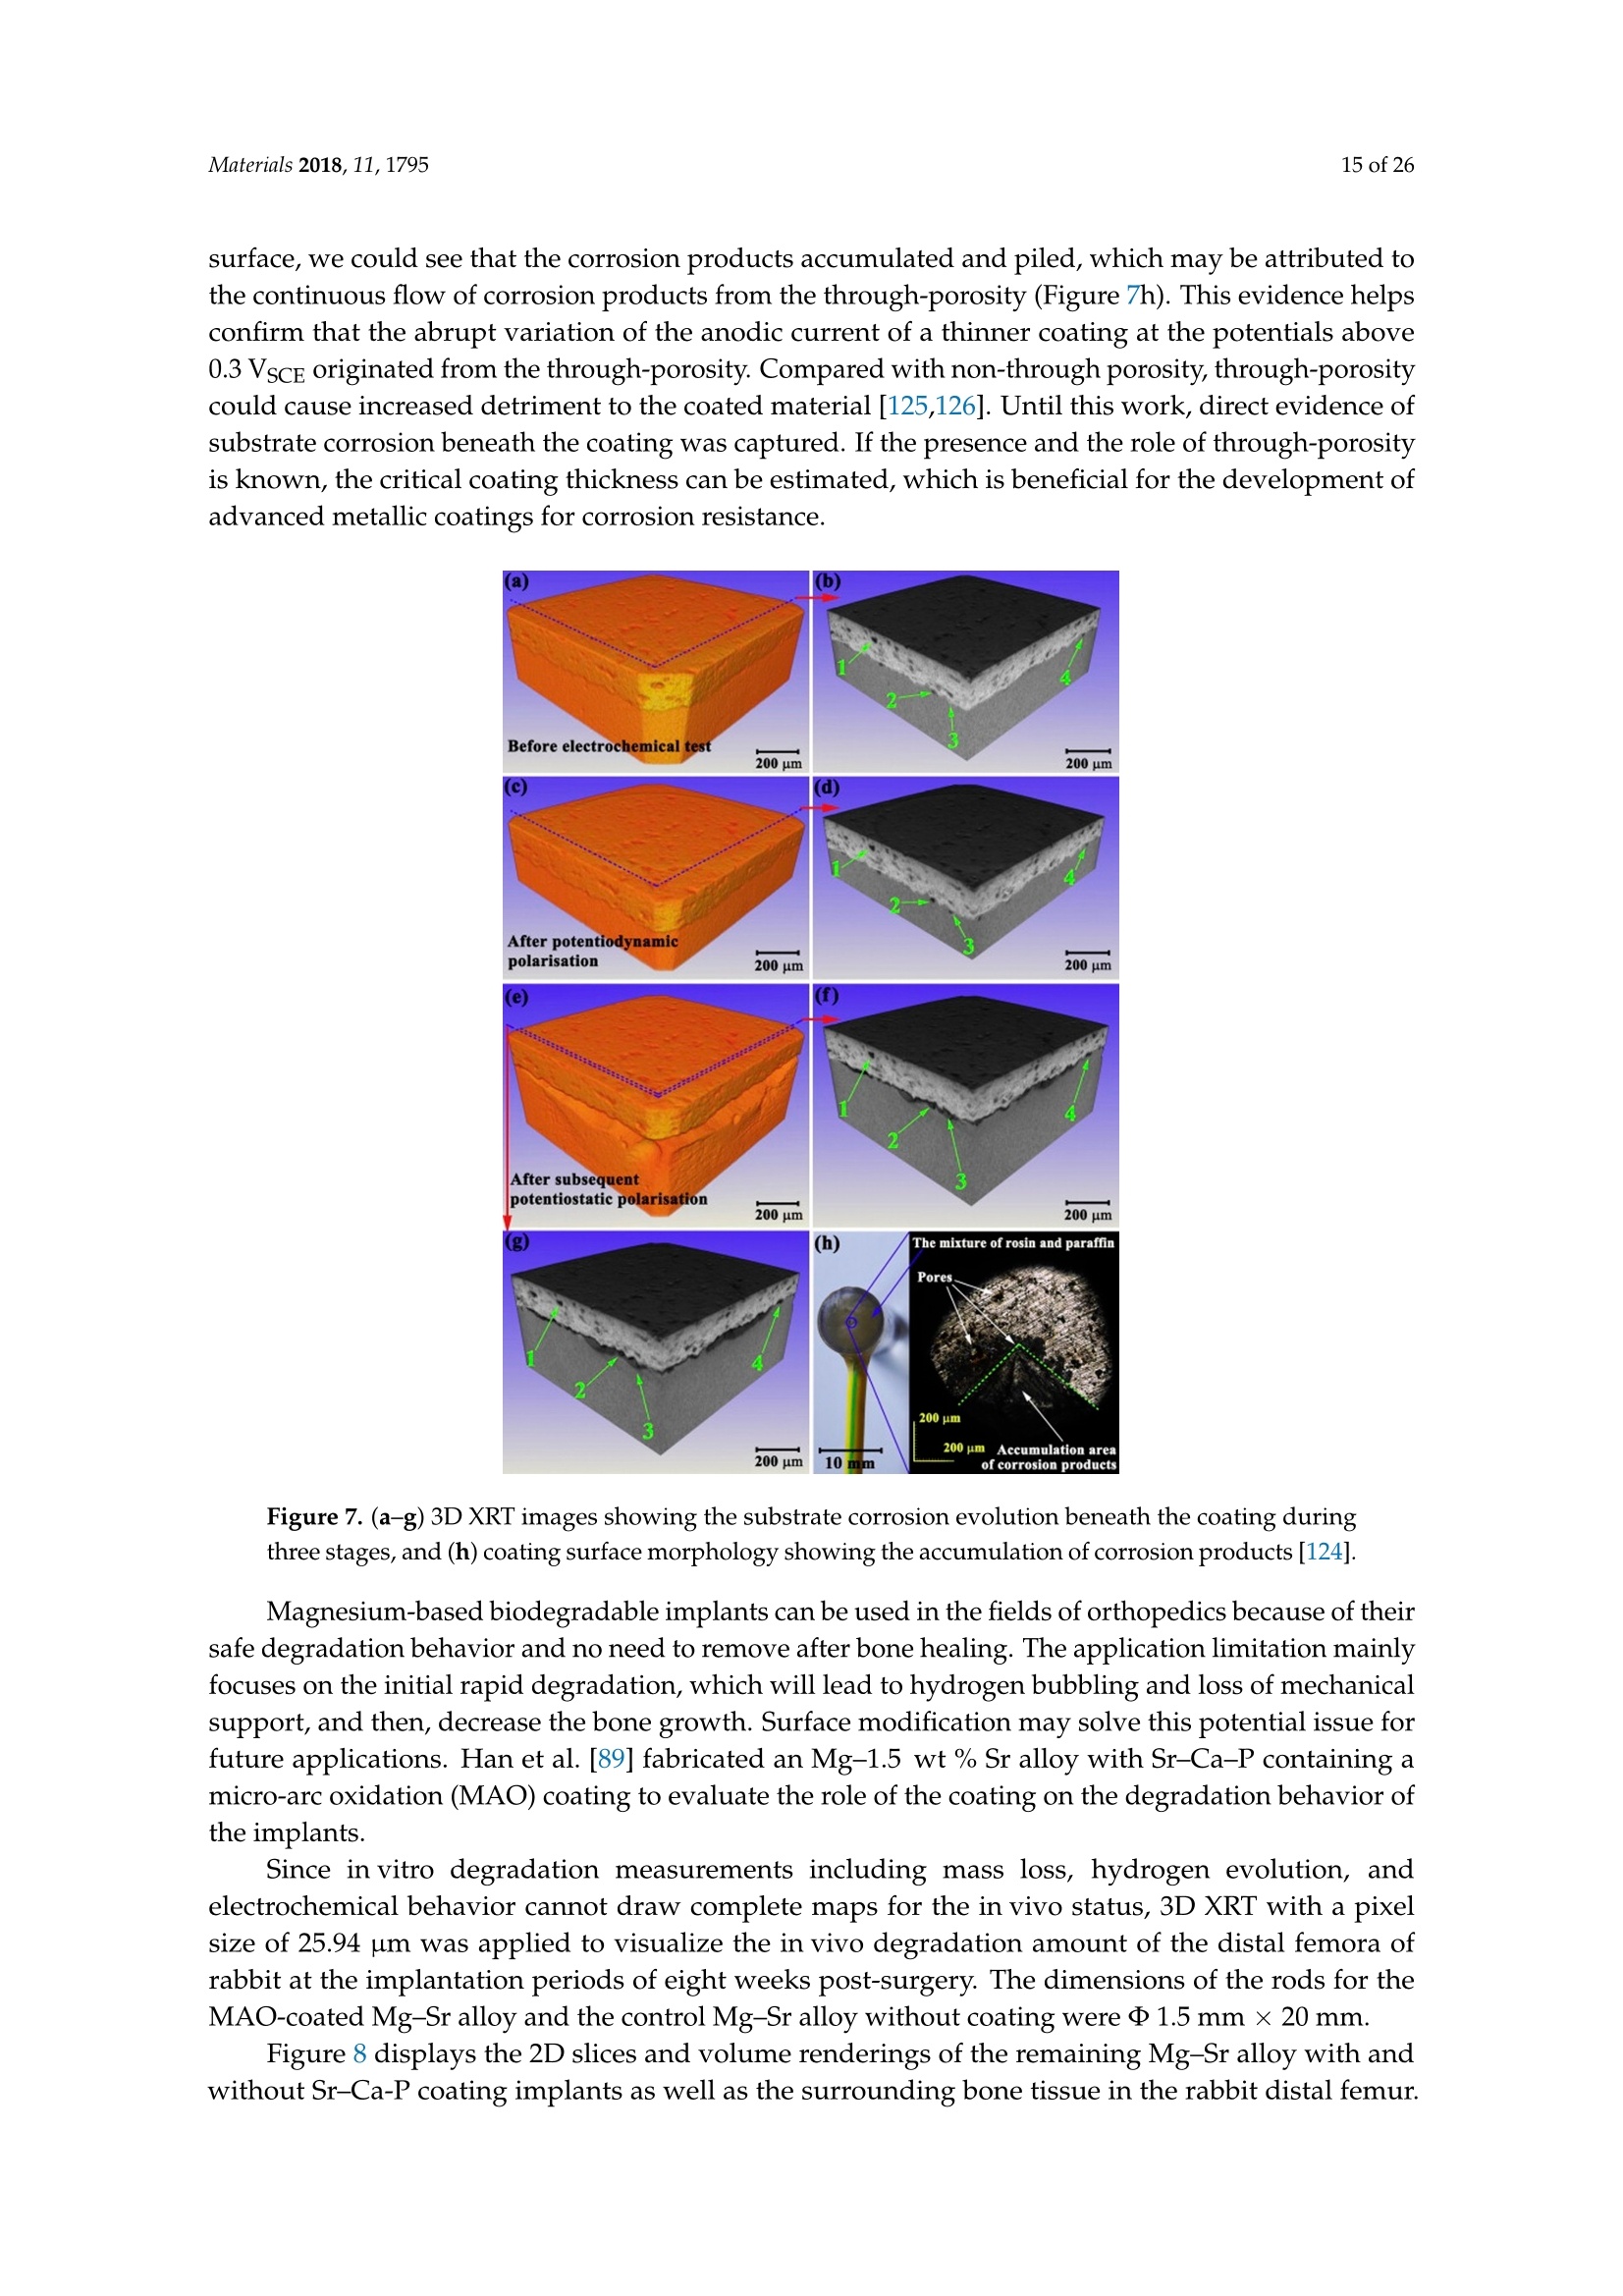
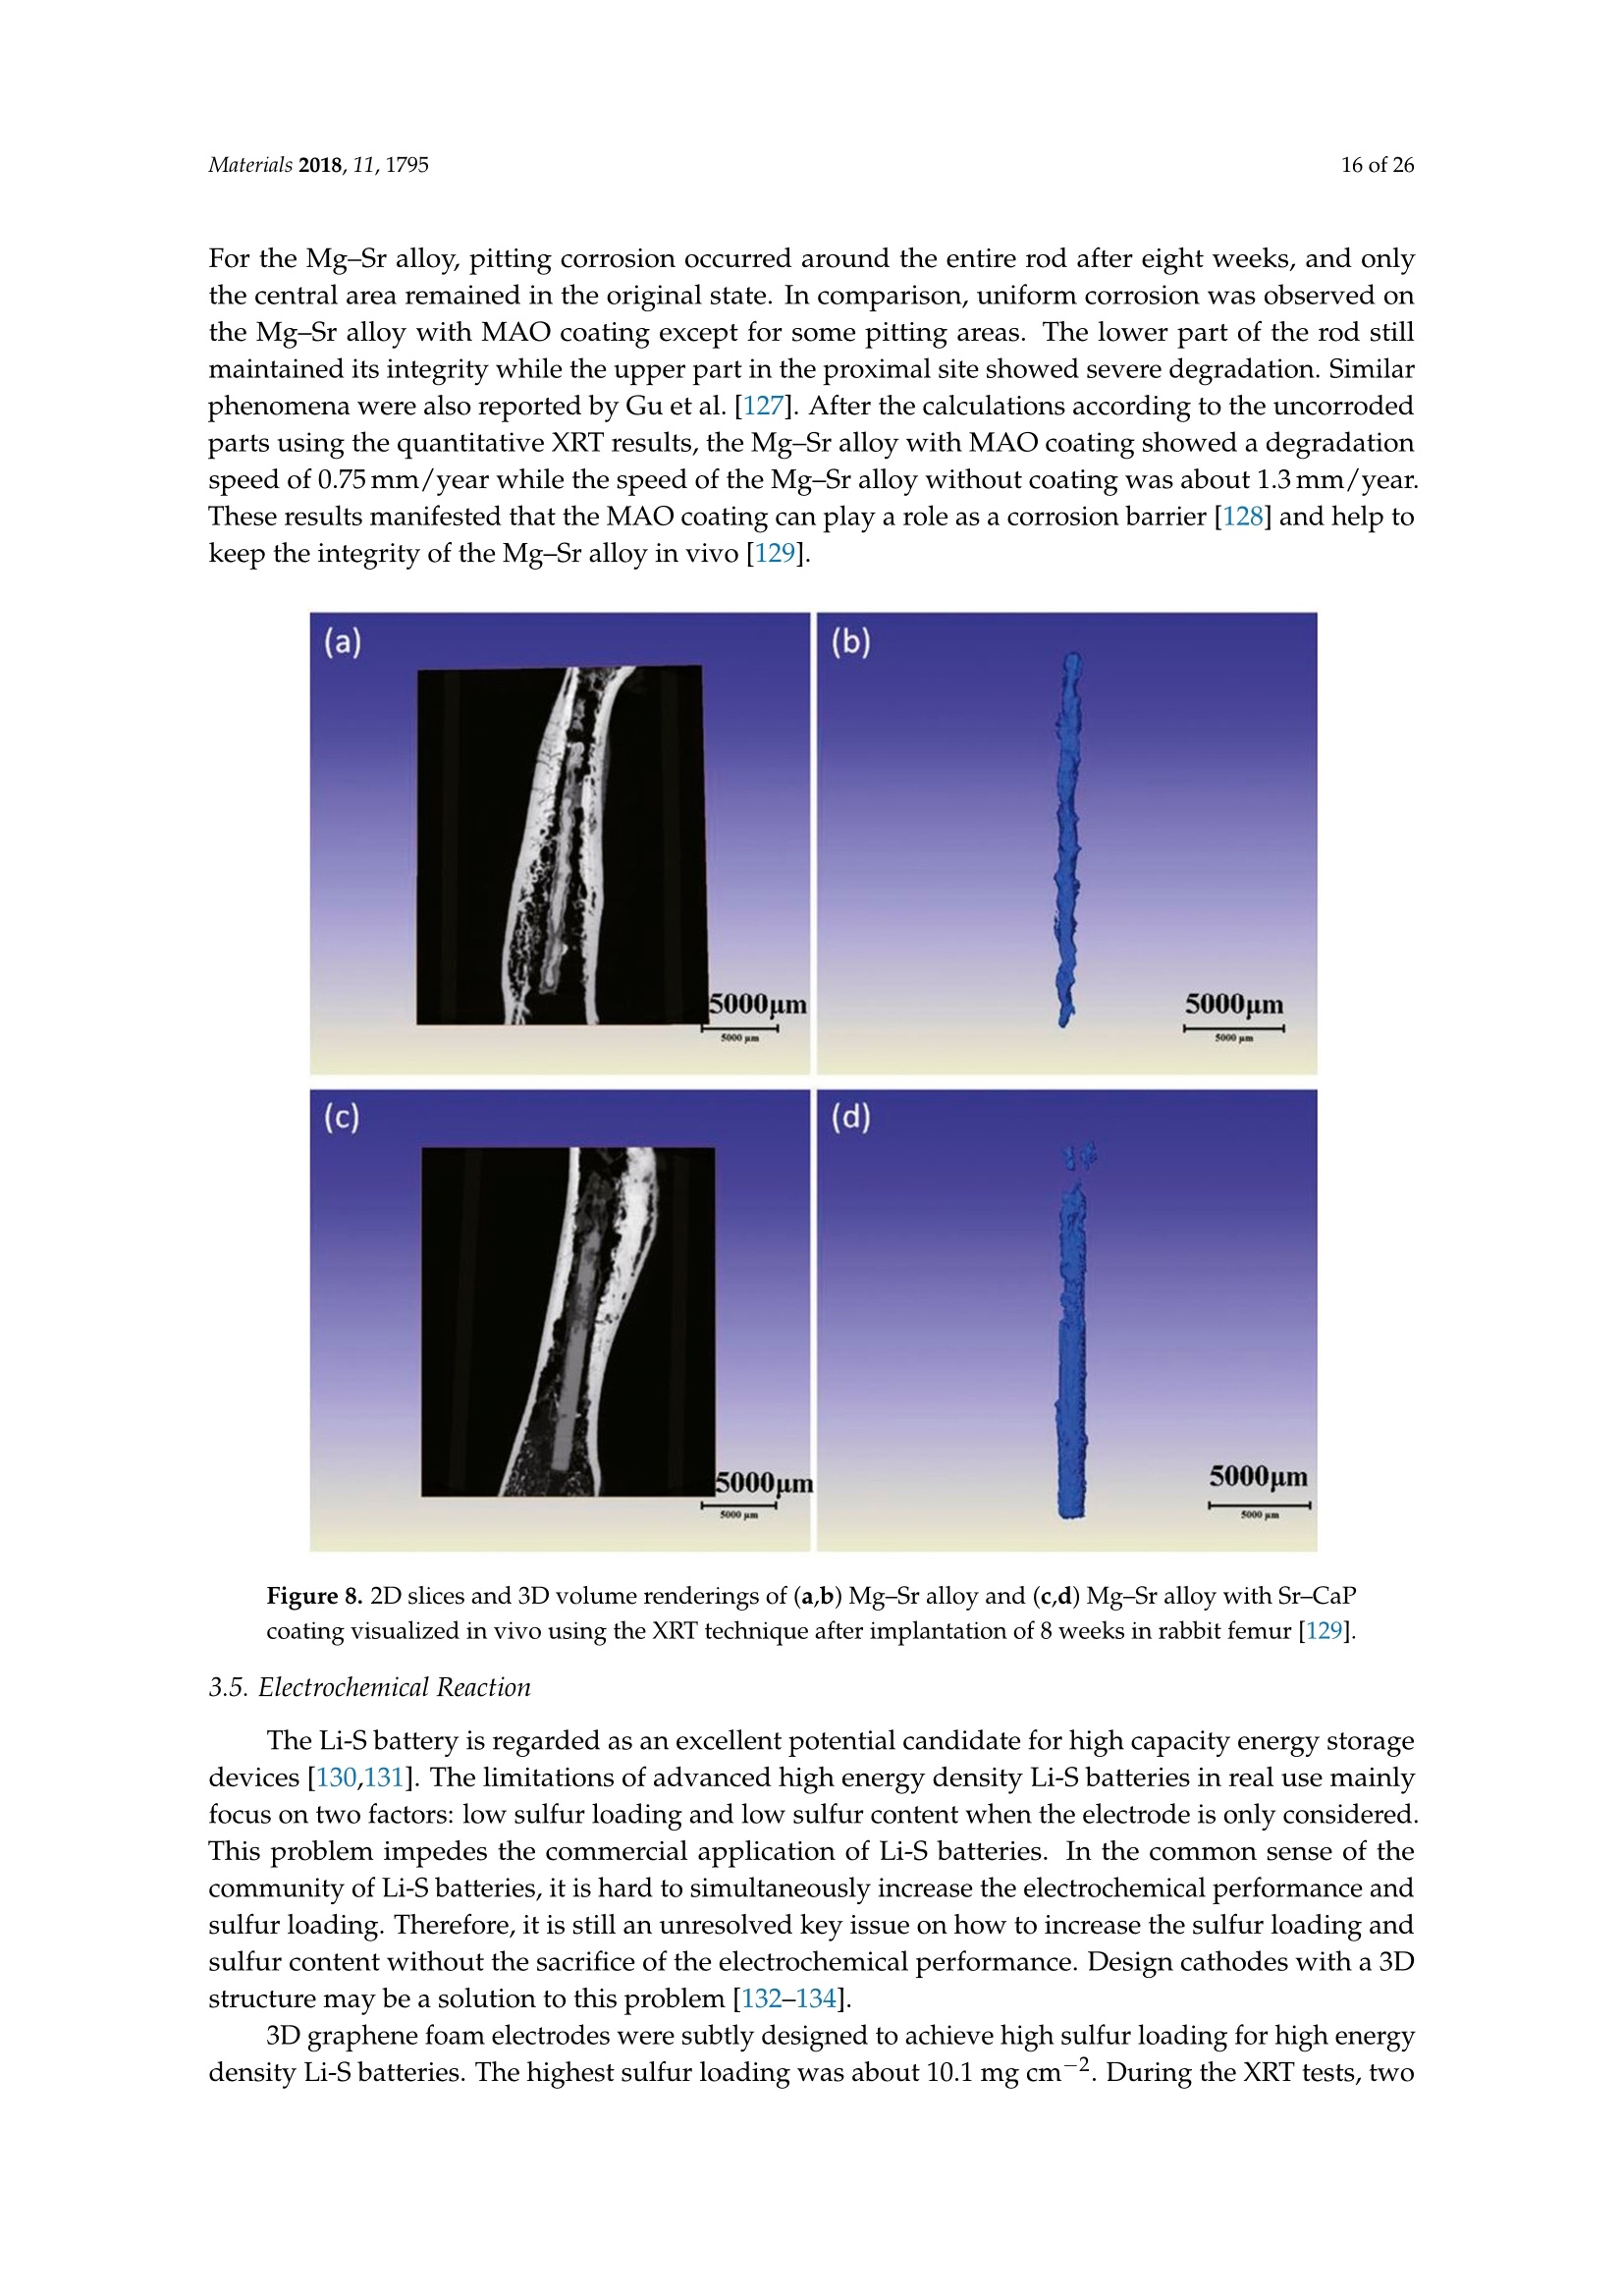

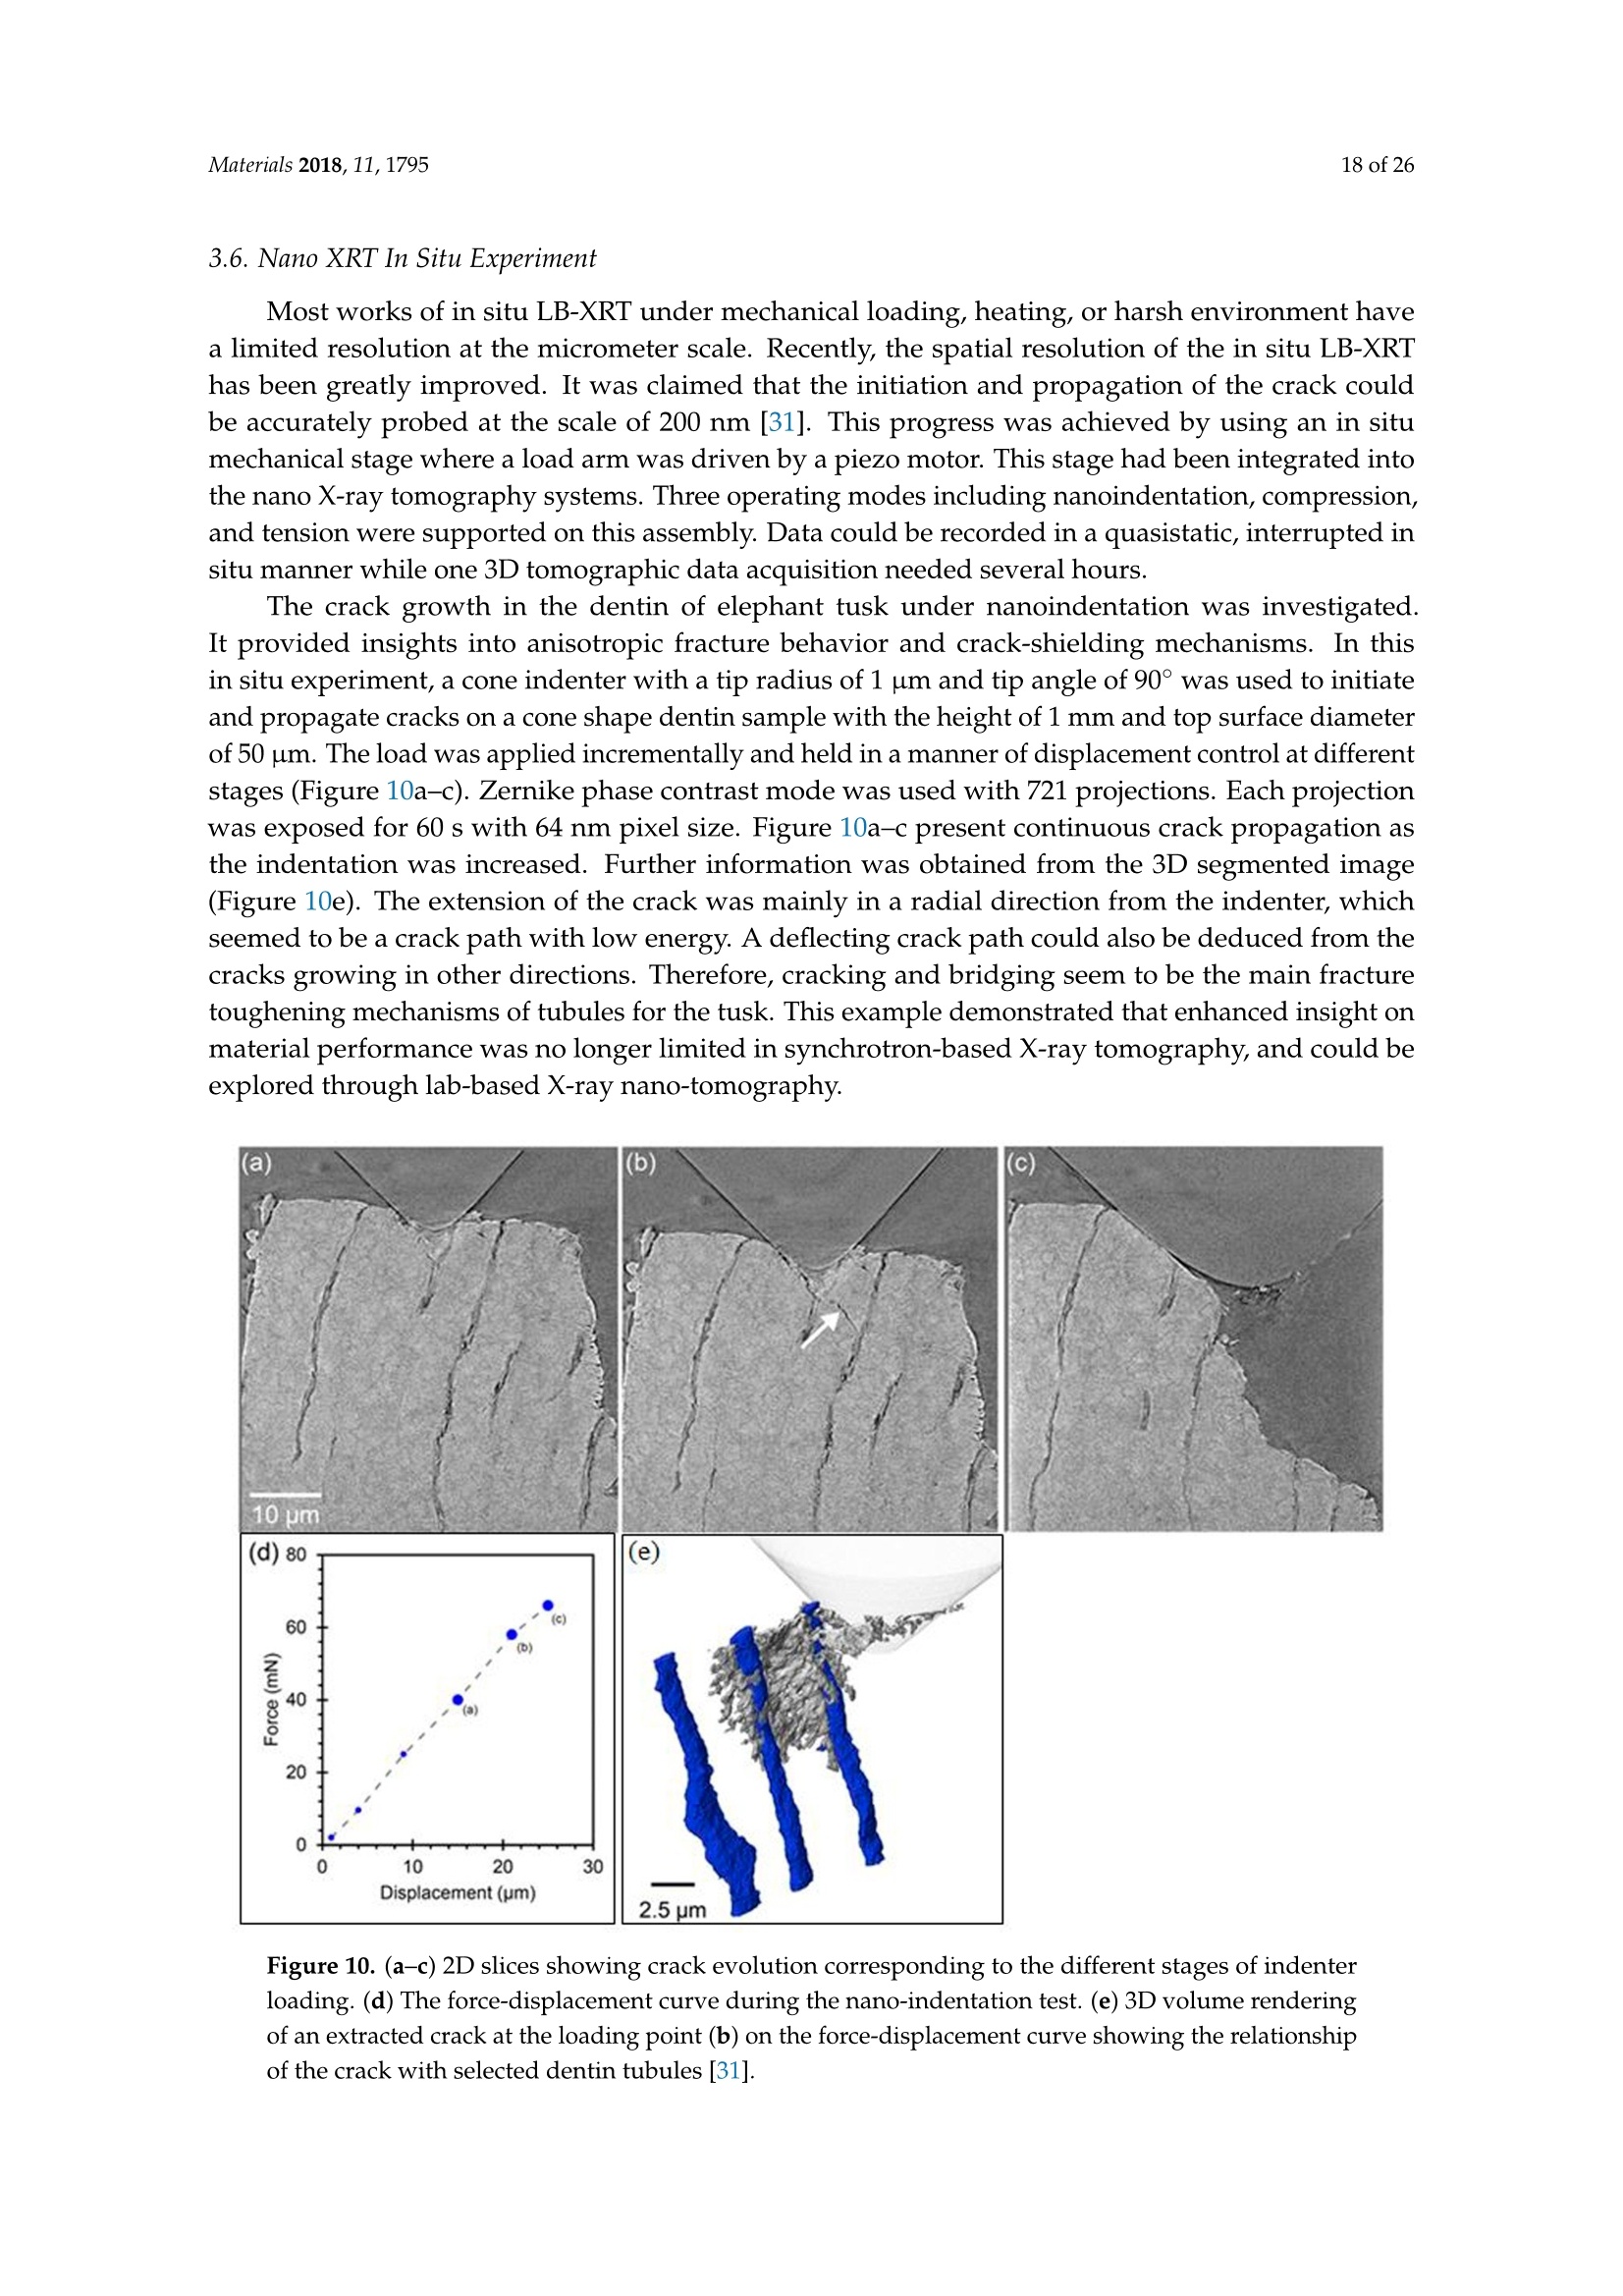
还剩24页未读,是否继续阅读?

产品配置单


北京欧兰科技发展有限公司为您提供《材料中内部应力应变检测方案(其它无损检测仪器/设备)》,该方案主要用于其他中内部应力应变检测,参考标准--,《材料中内部应力应变检测方案(其它无损检测仪器/设备)》用到的仪器有LaVision 紧凑型全场立体应变测试分析仪、LaVision DaVis 智能成像软件平台
推荐专场
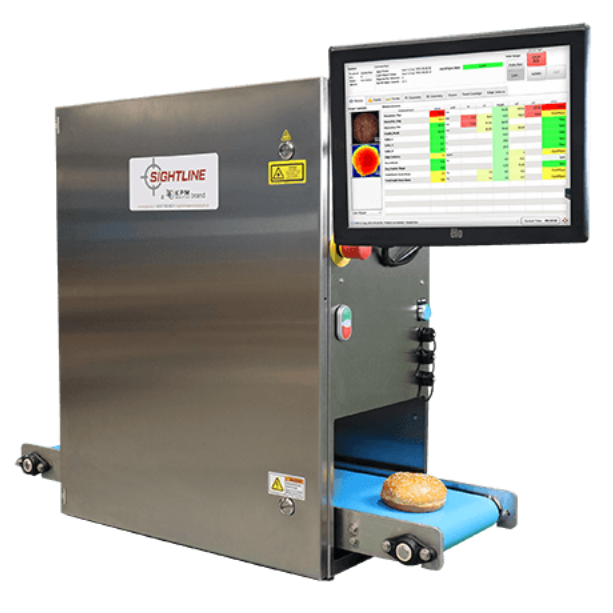


相关方案
更多
该厂商其他方案
更多