


方案详情
文
采用LaVision的Imager Intense型,ImagerProX型相机。PTU9型可编程时序控制器,和软件平台,分别搭建了2DPIV,2DPTV,3D层析PIV和3DPTV测量系统,并对湍流边界层的流场进行了测量分析。
方案详情

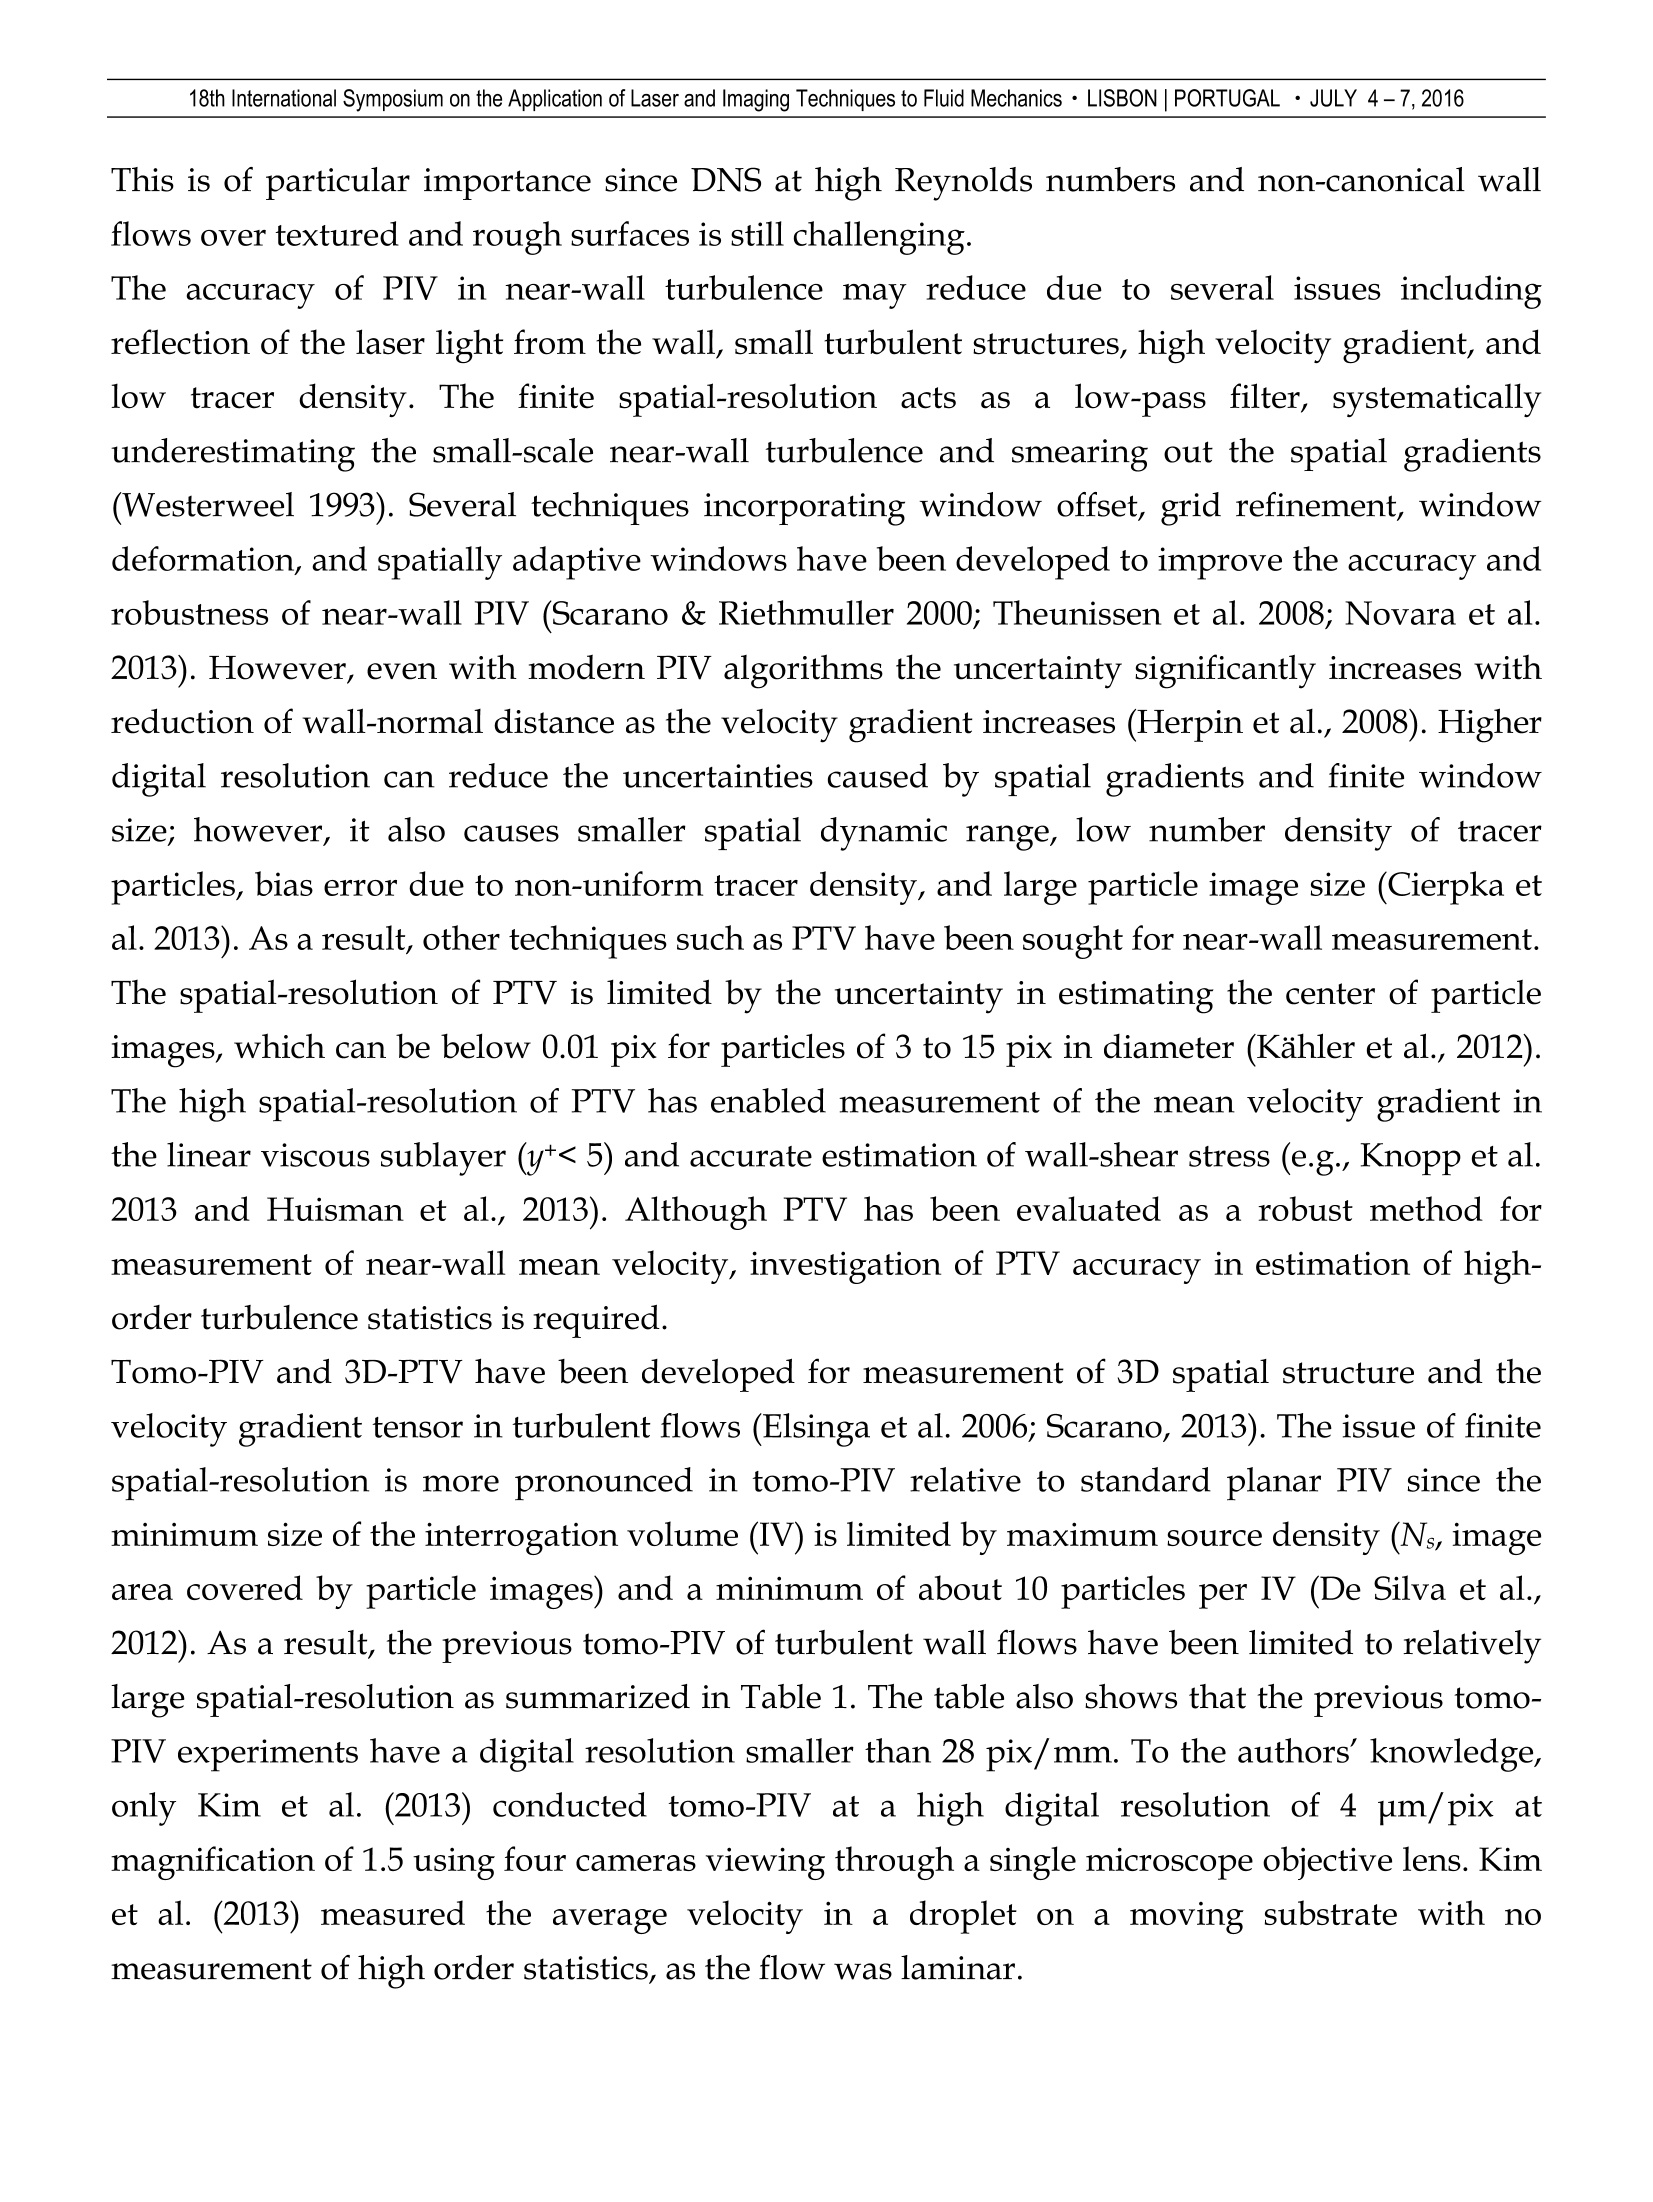
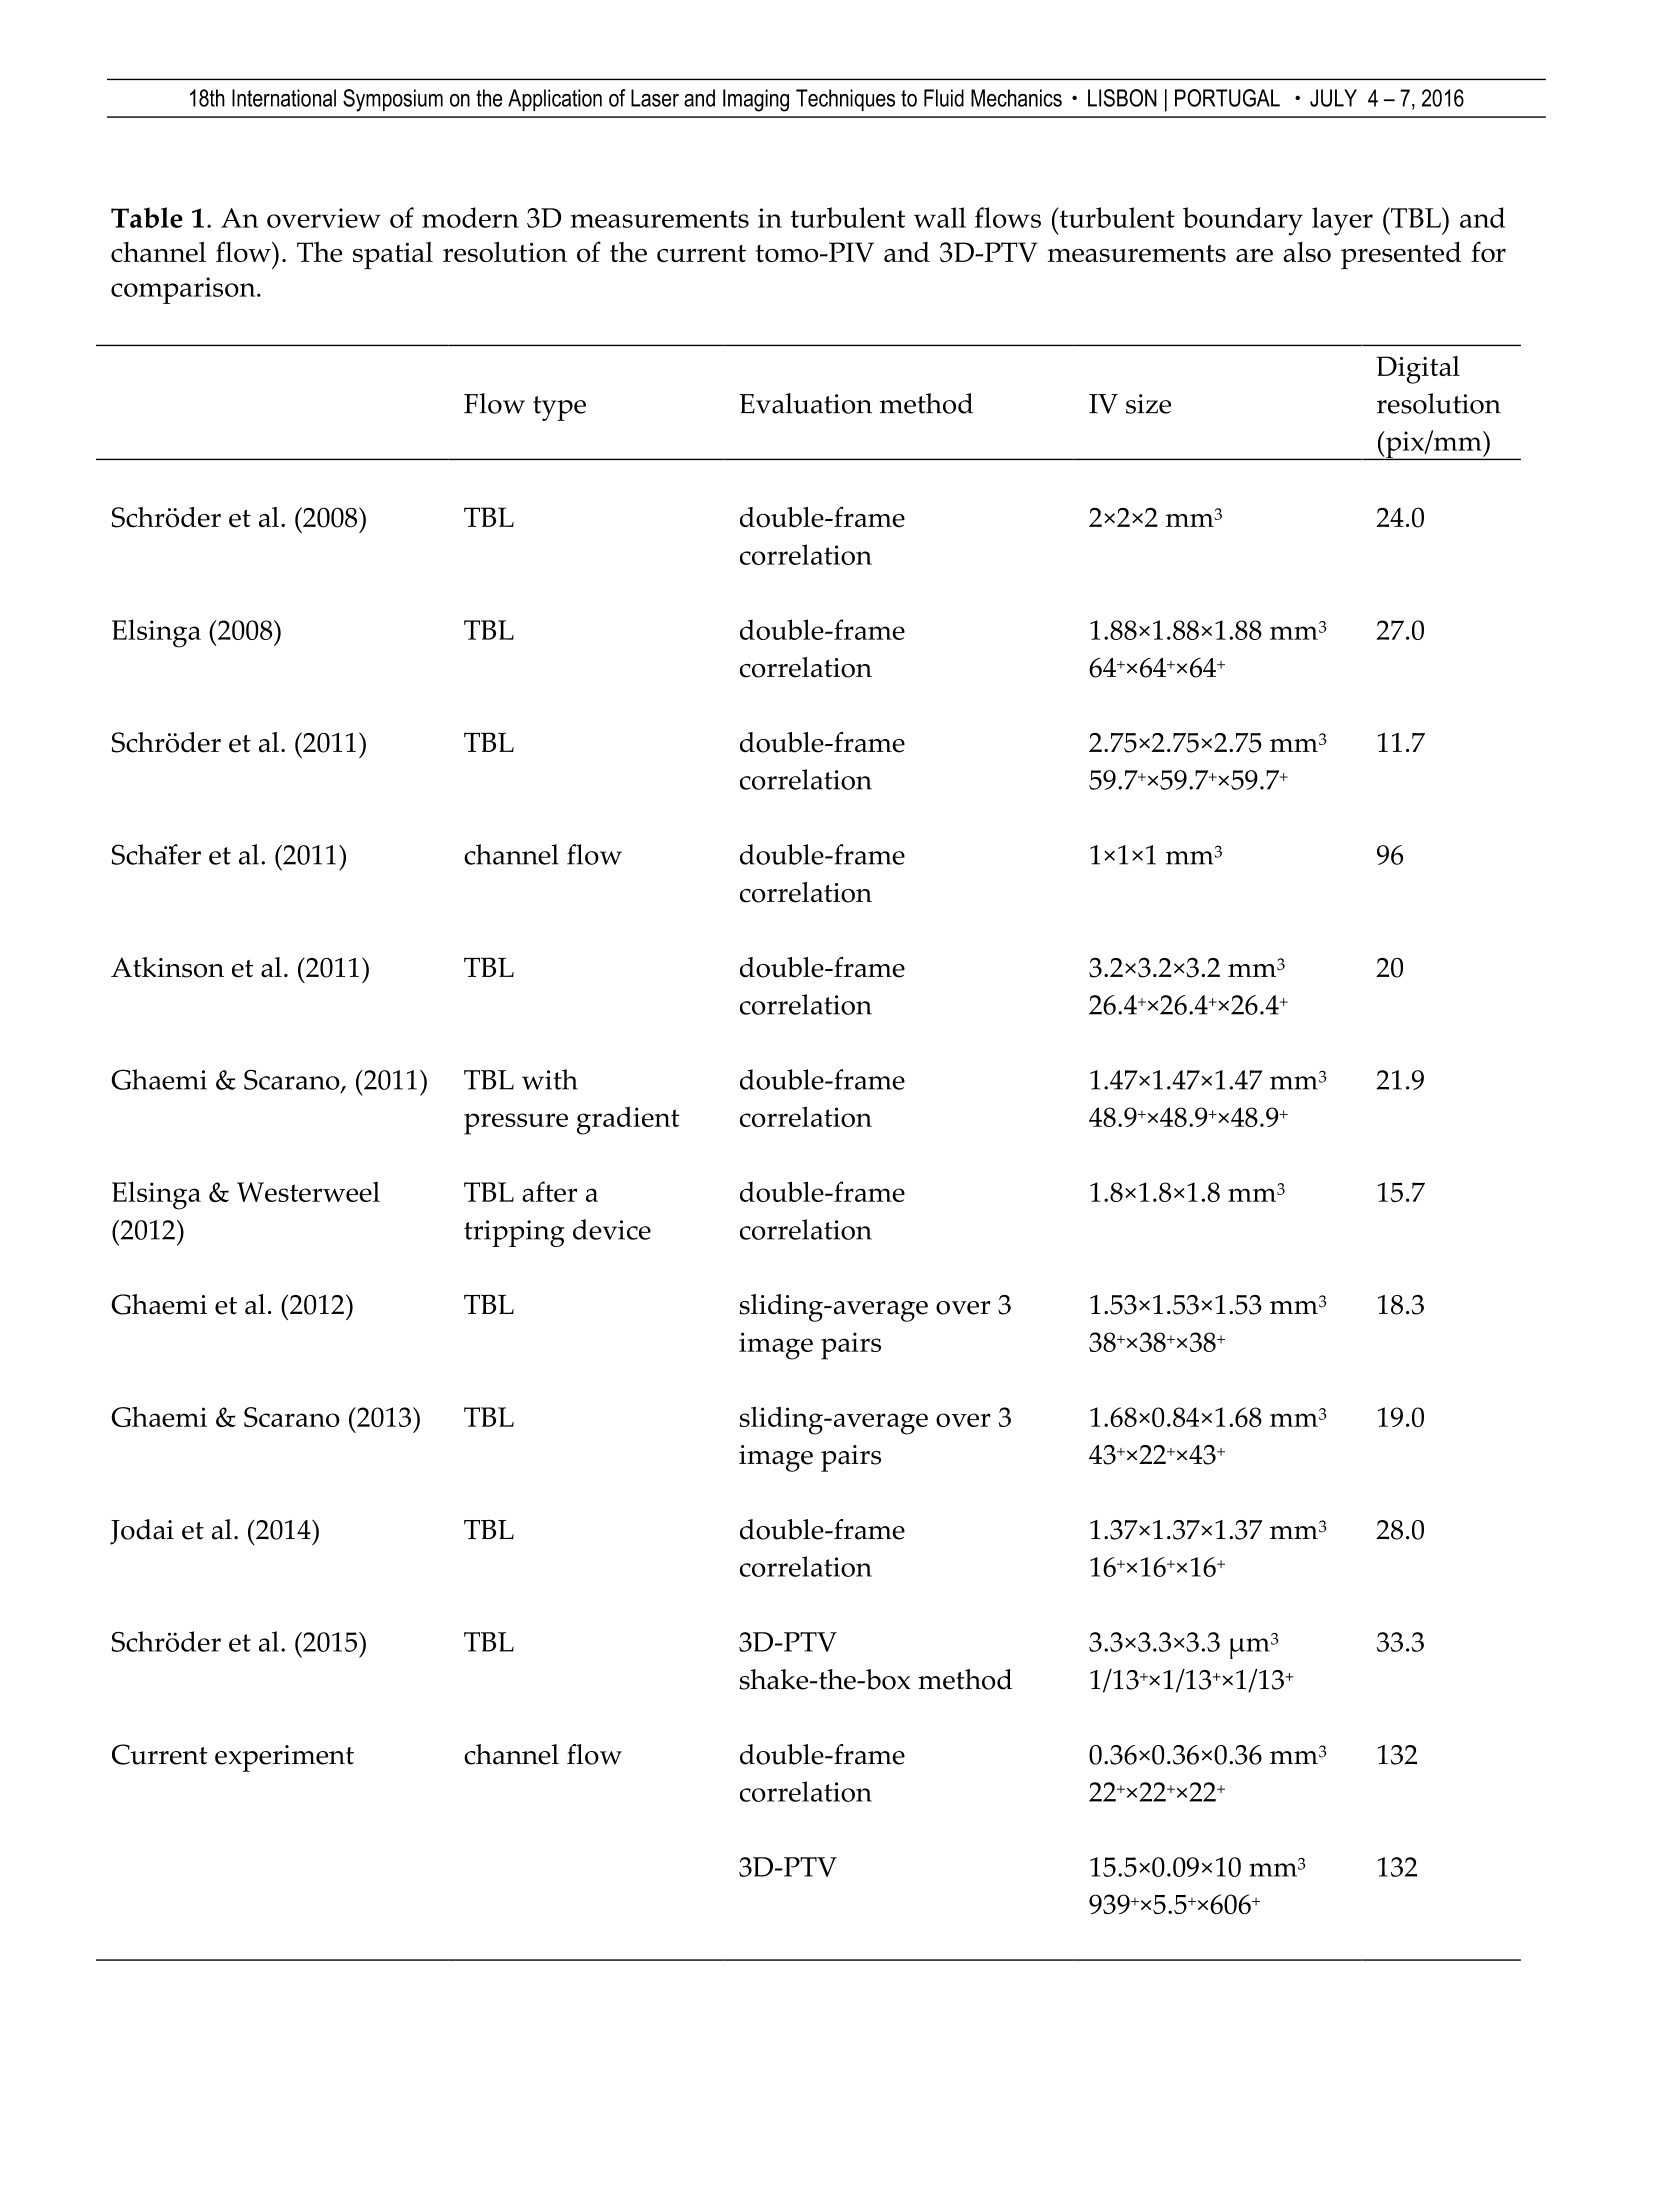
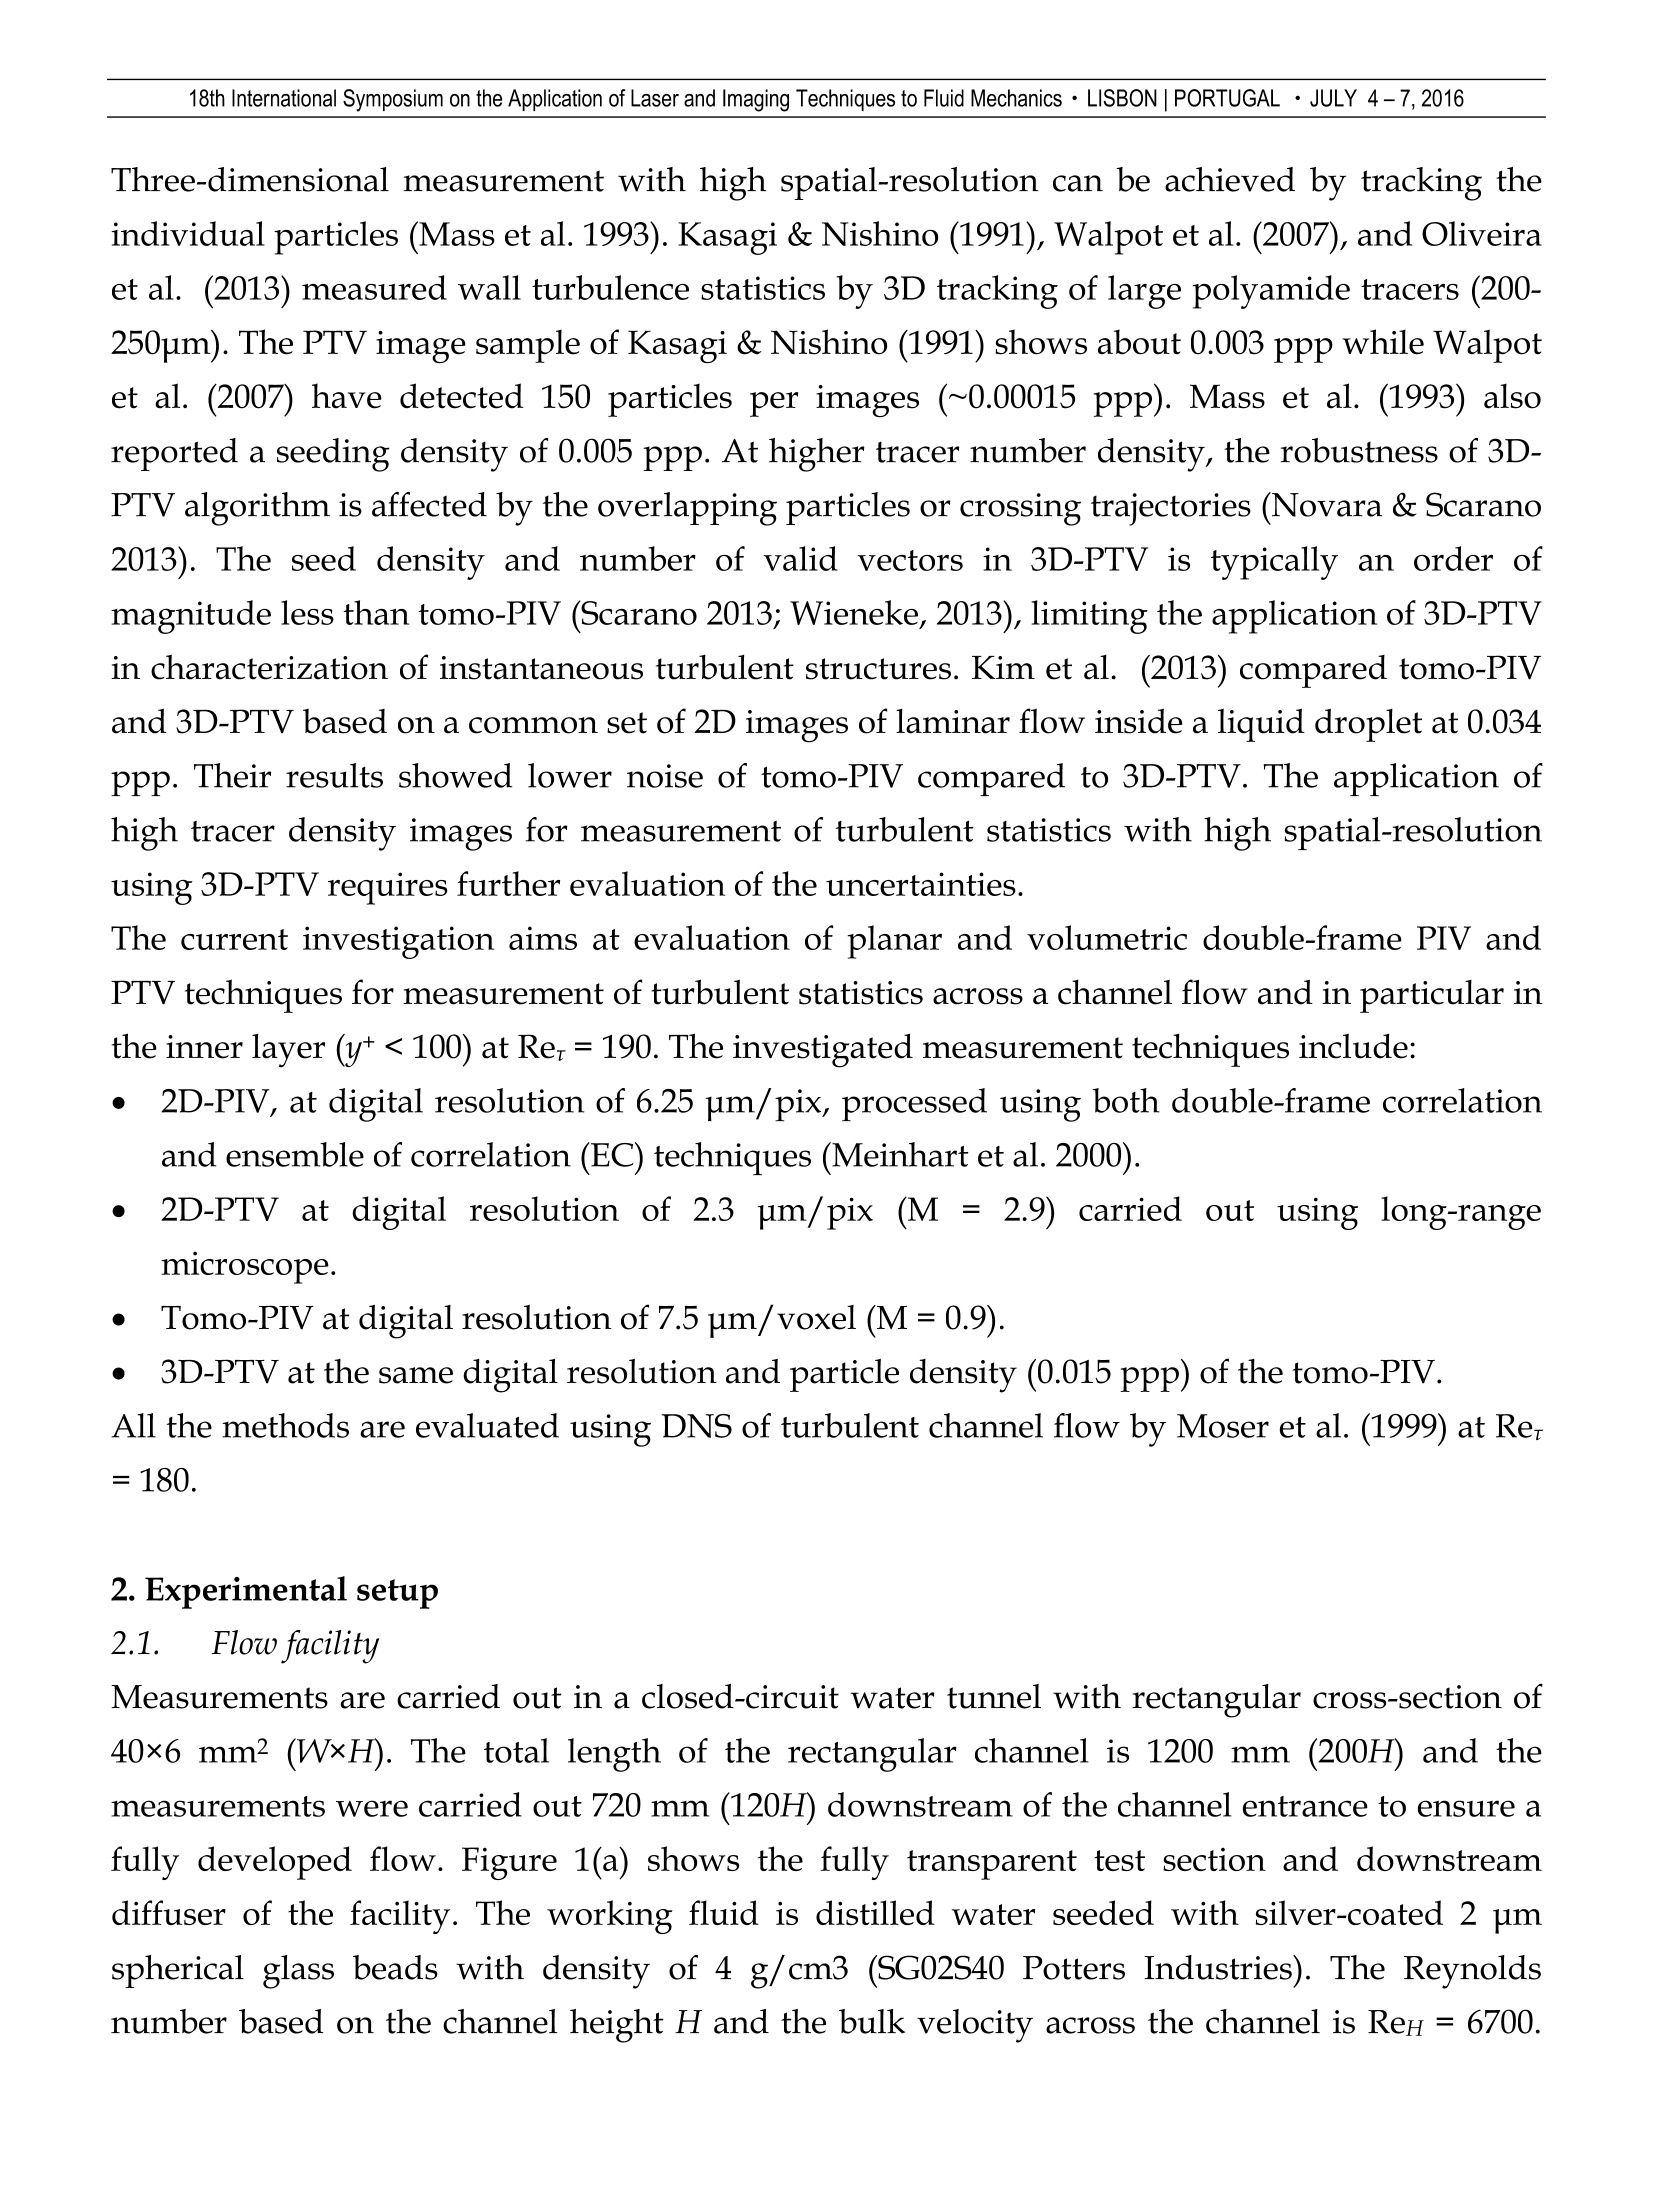
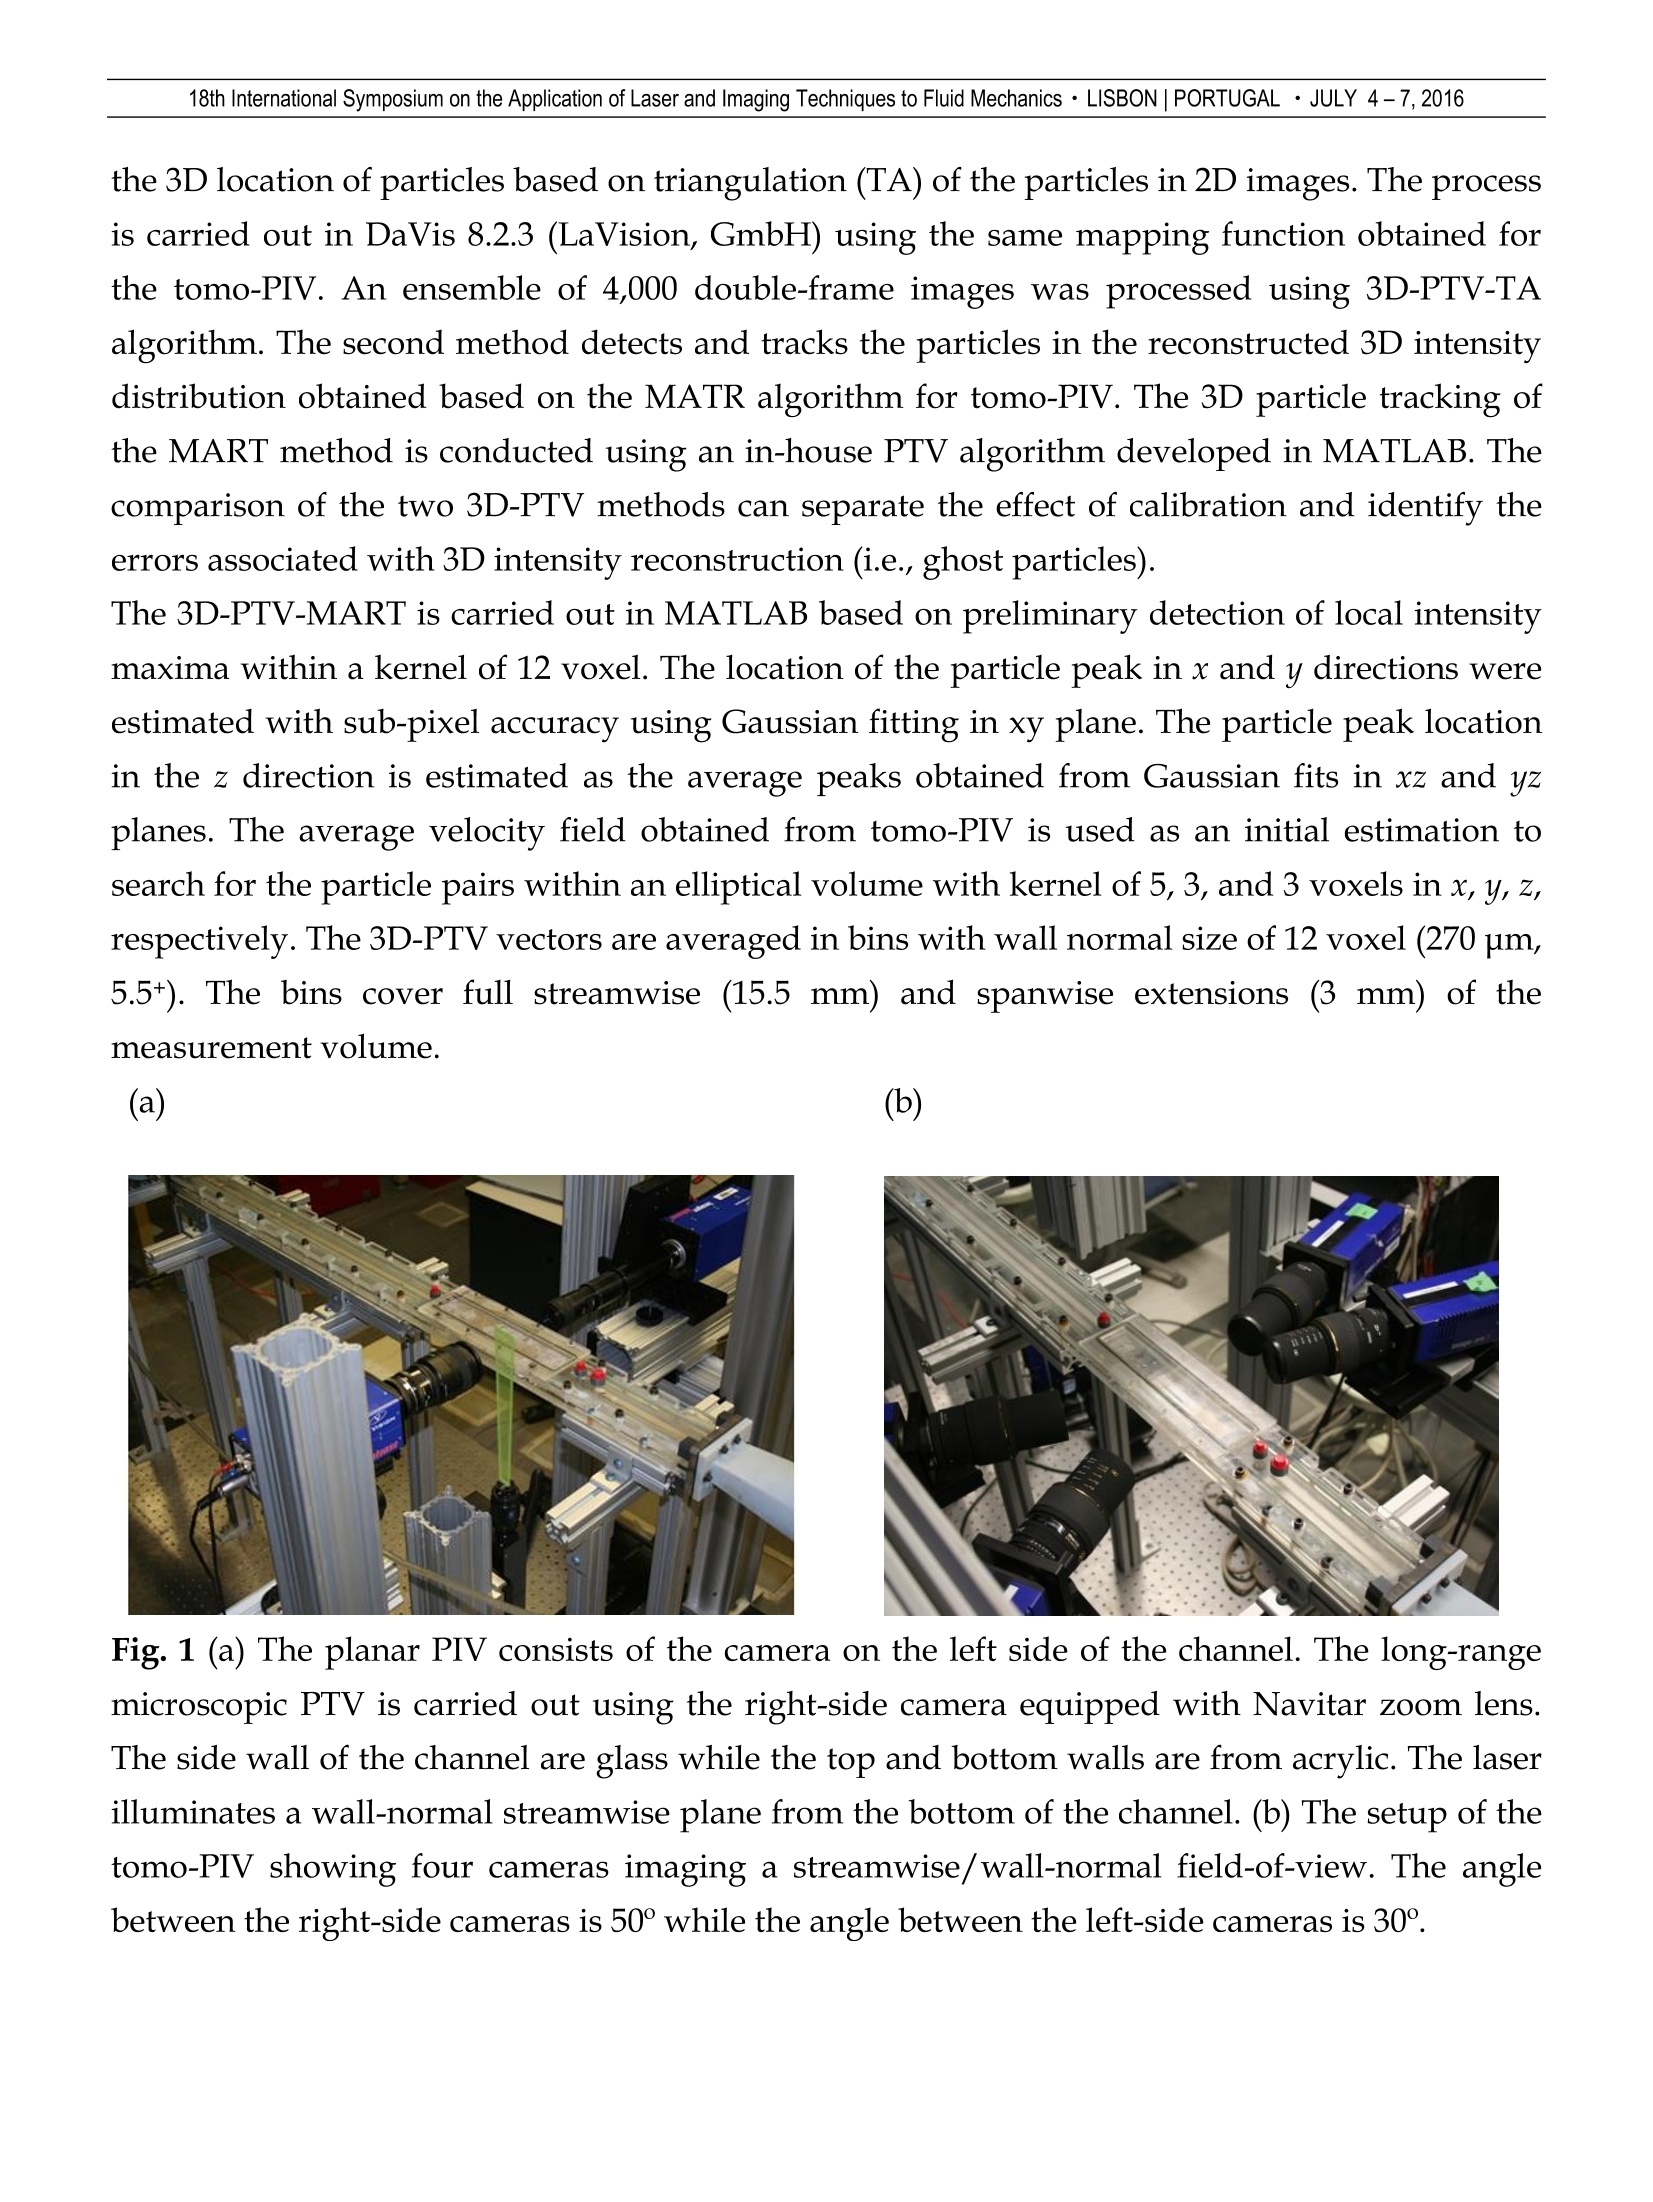
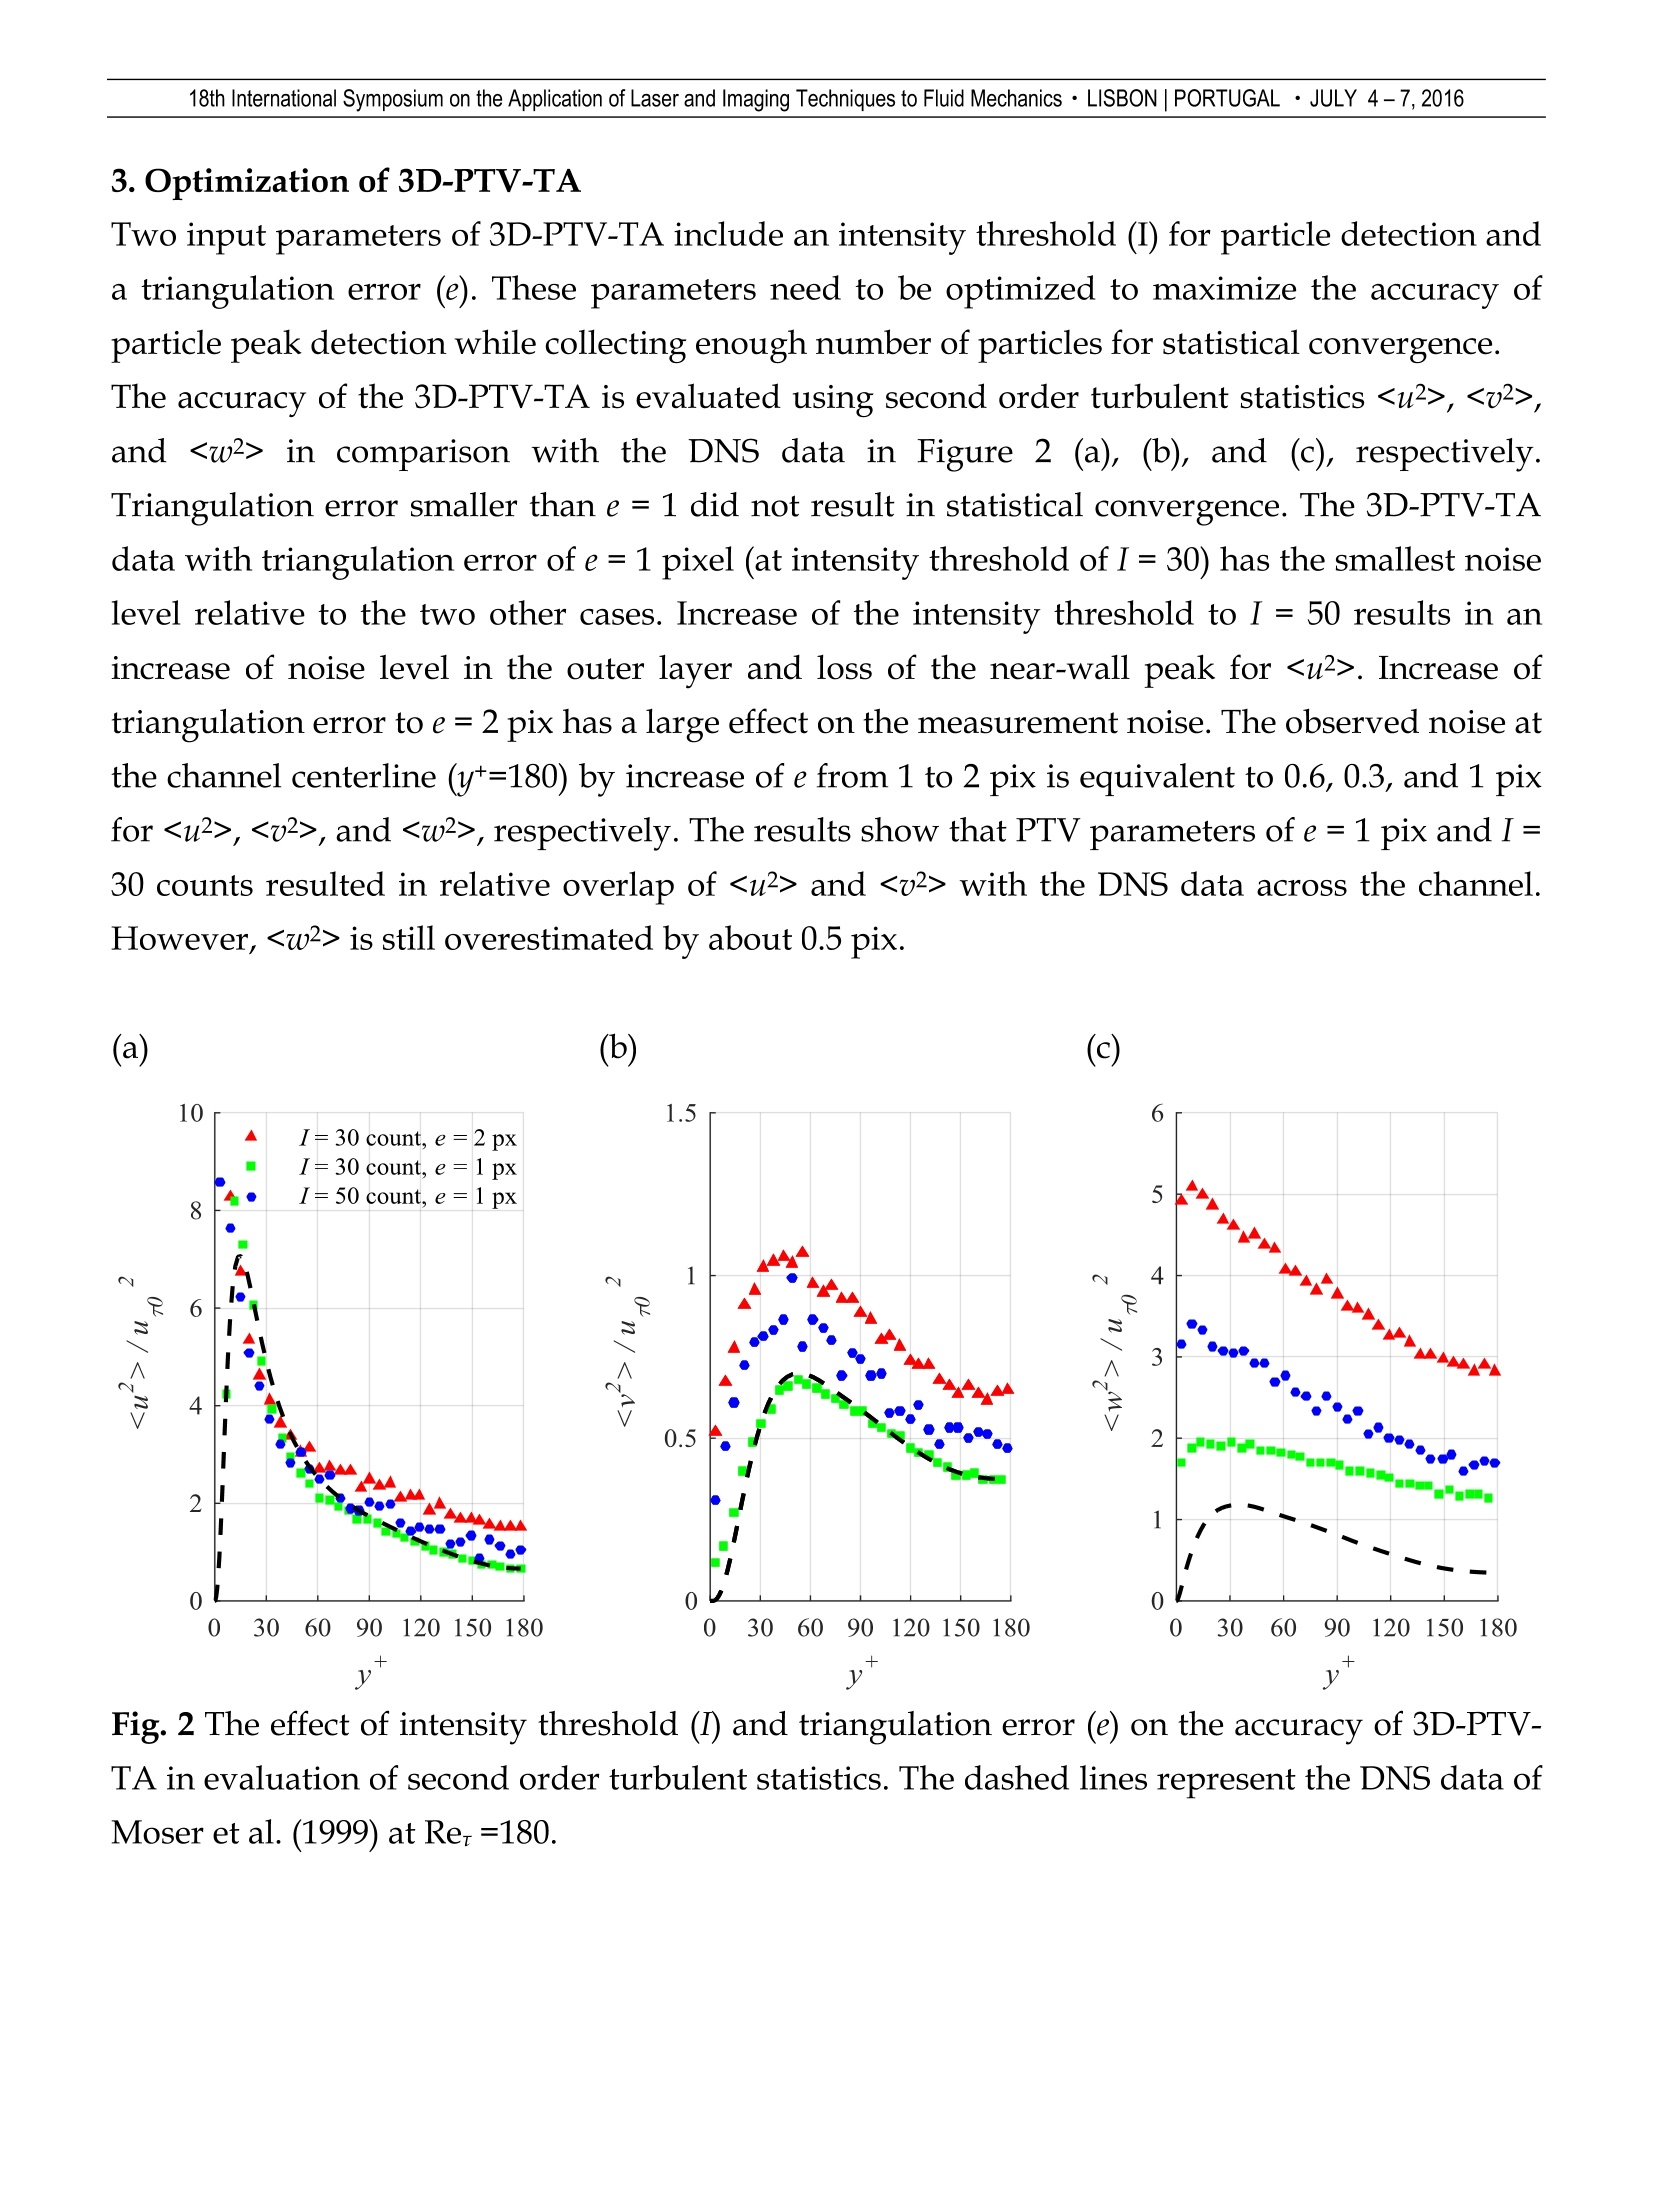
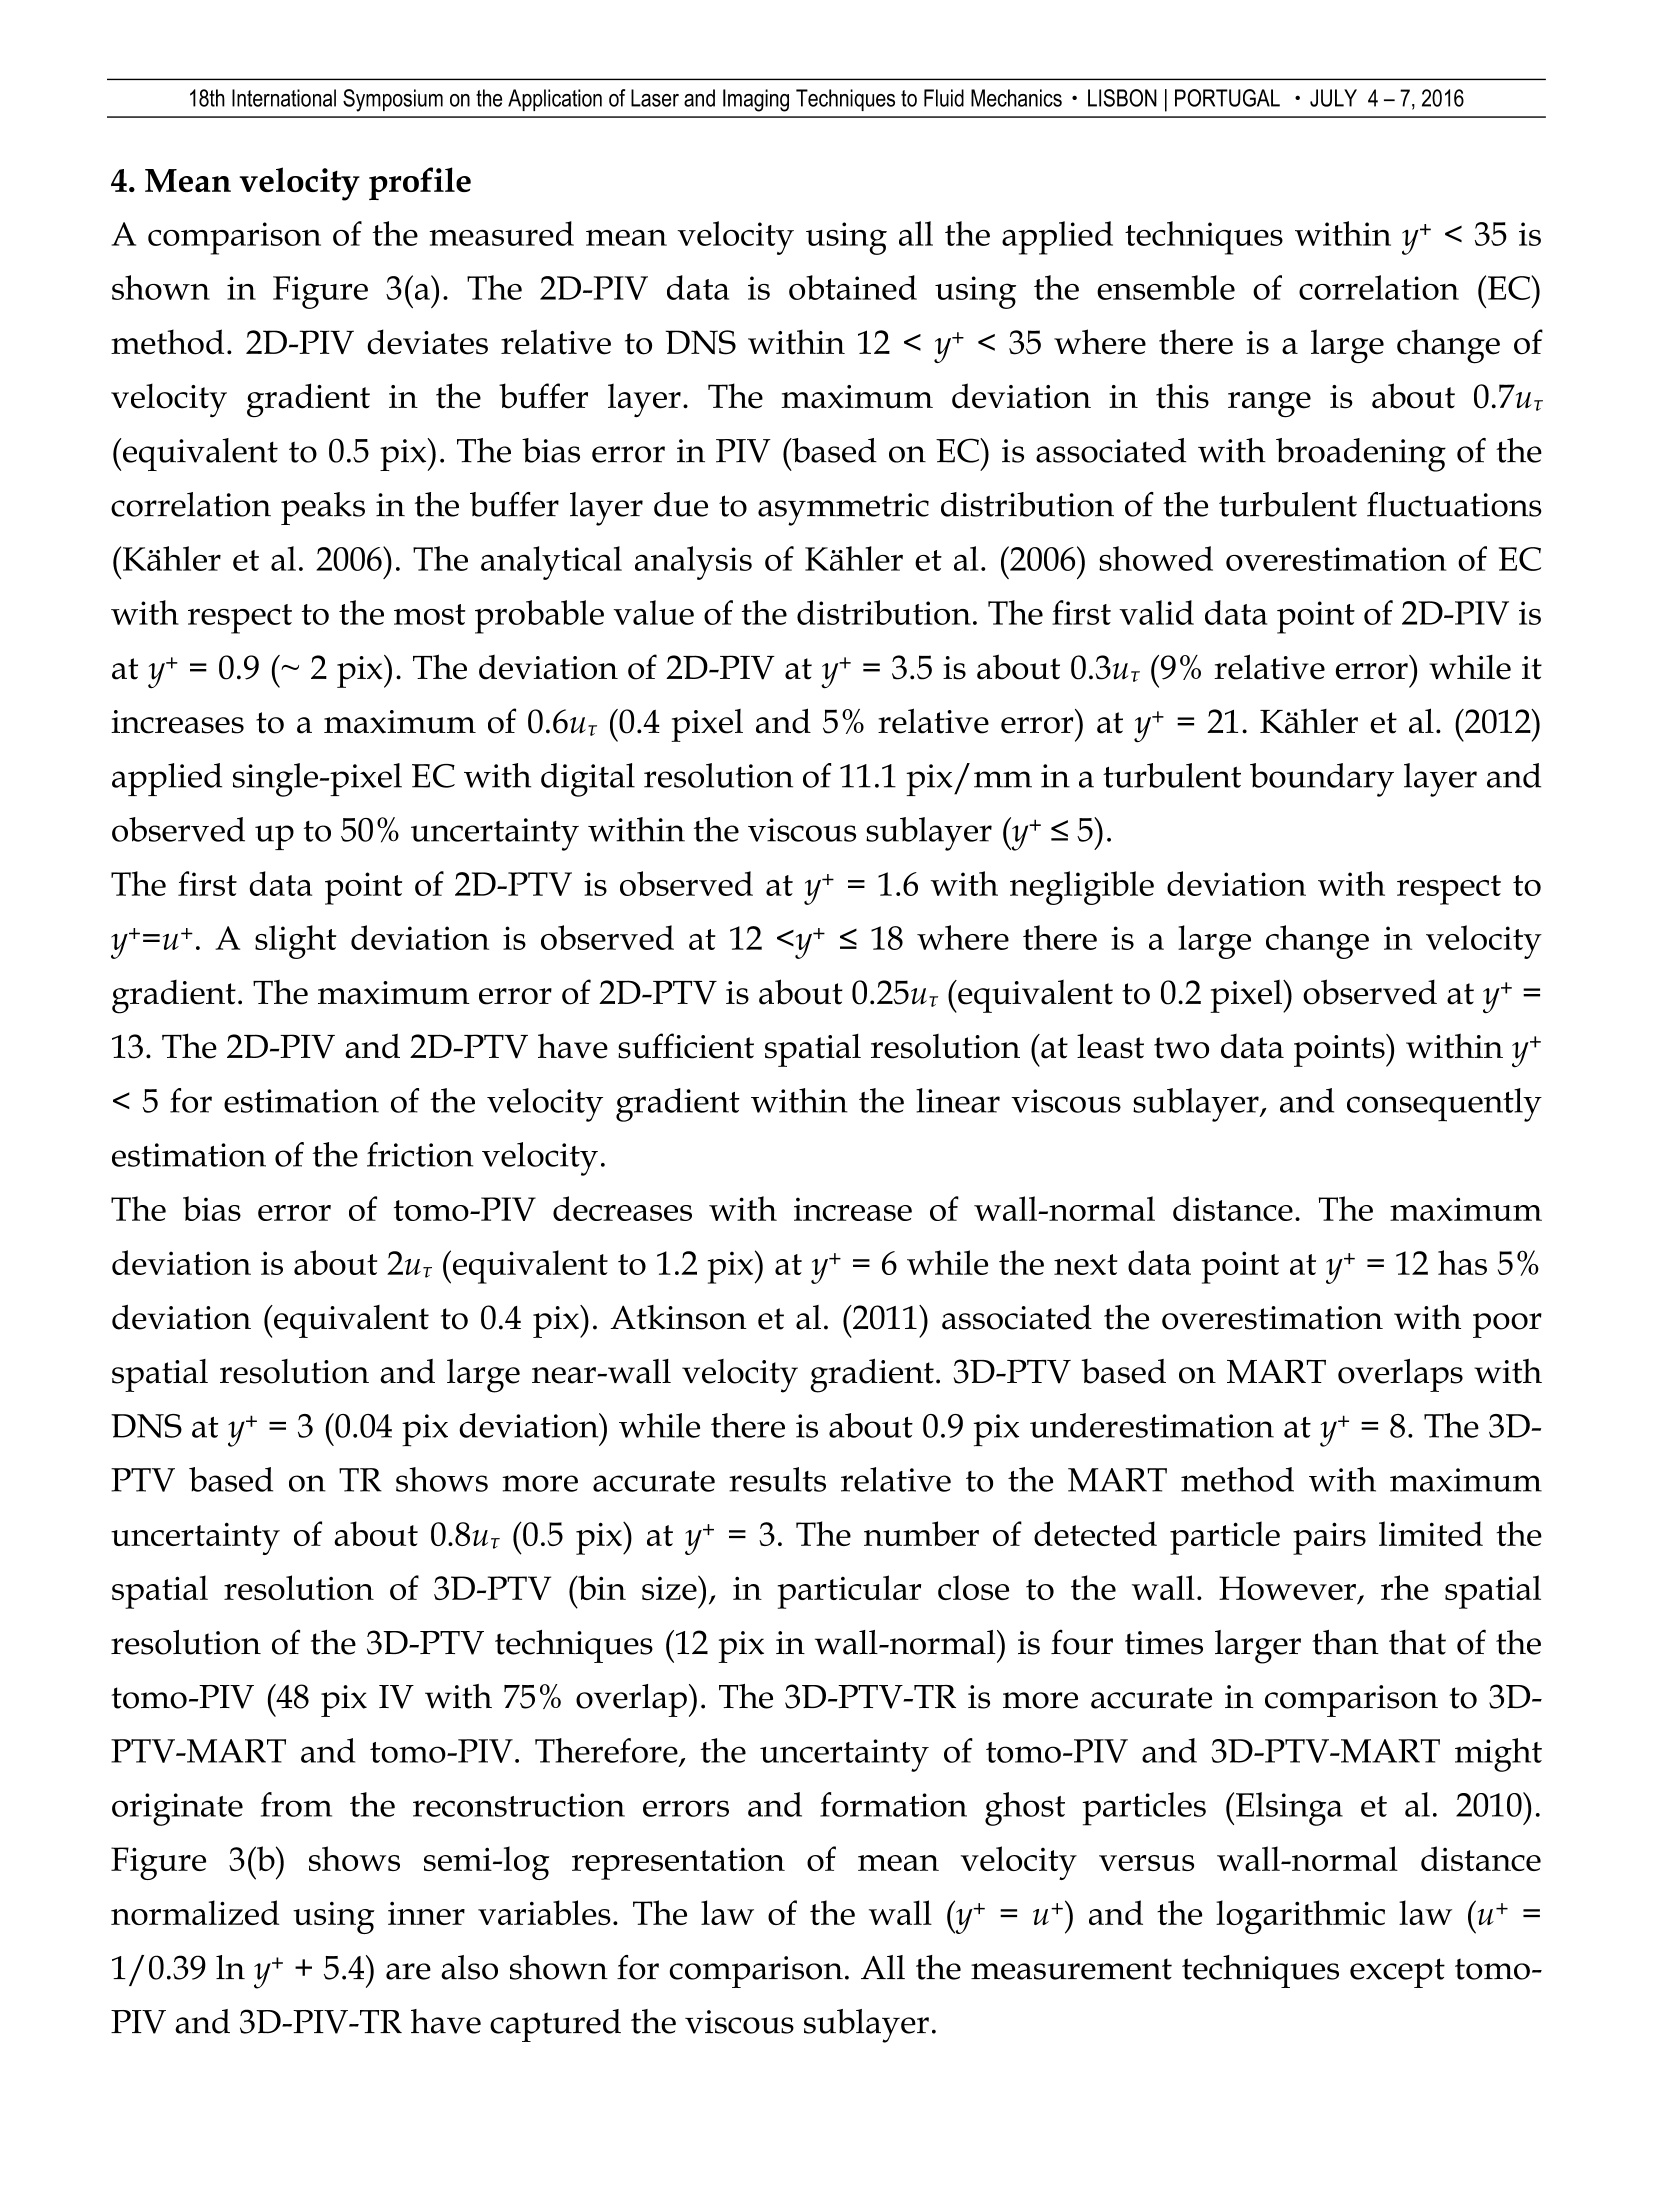
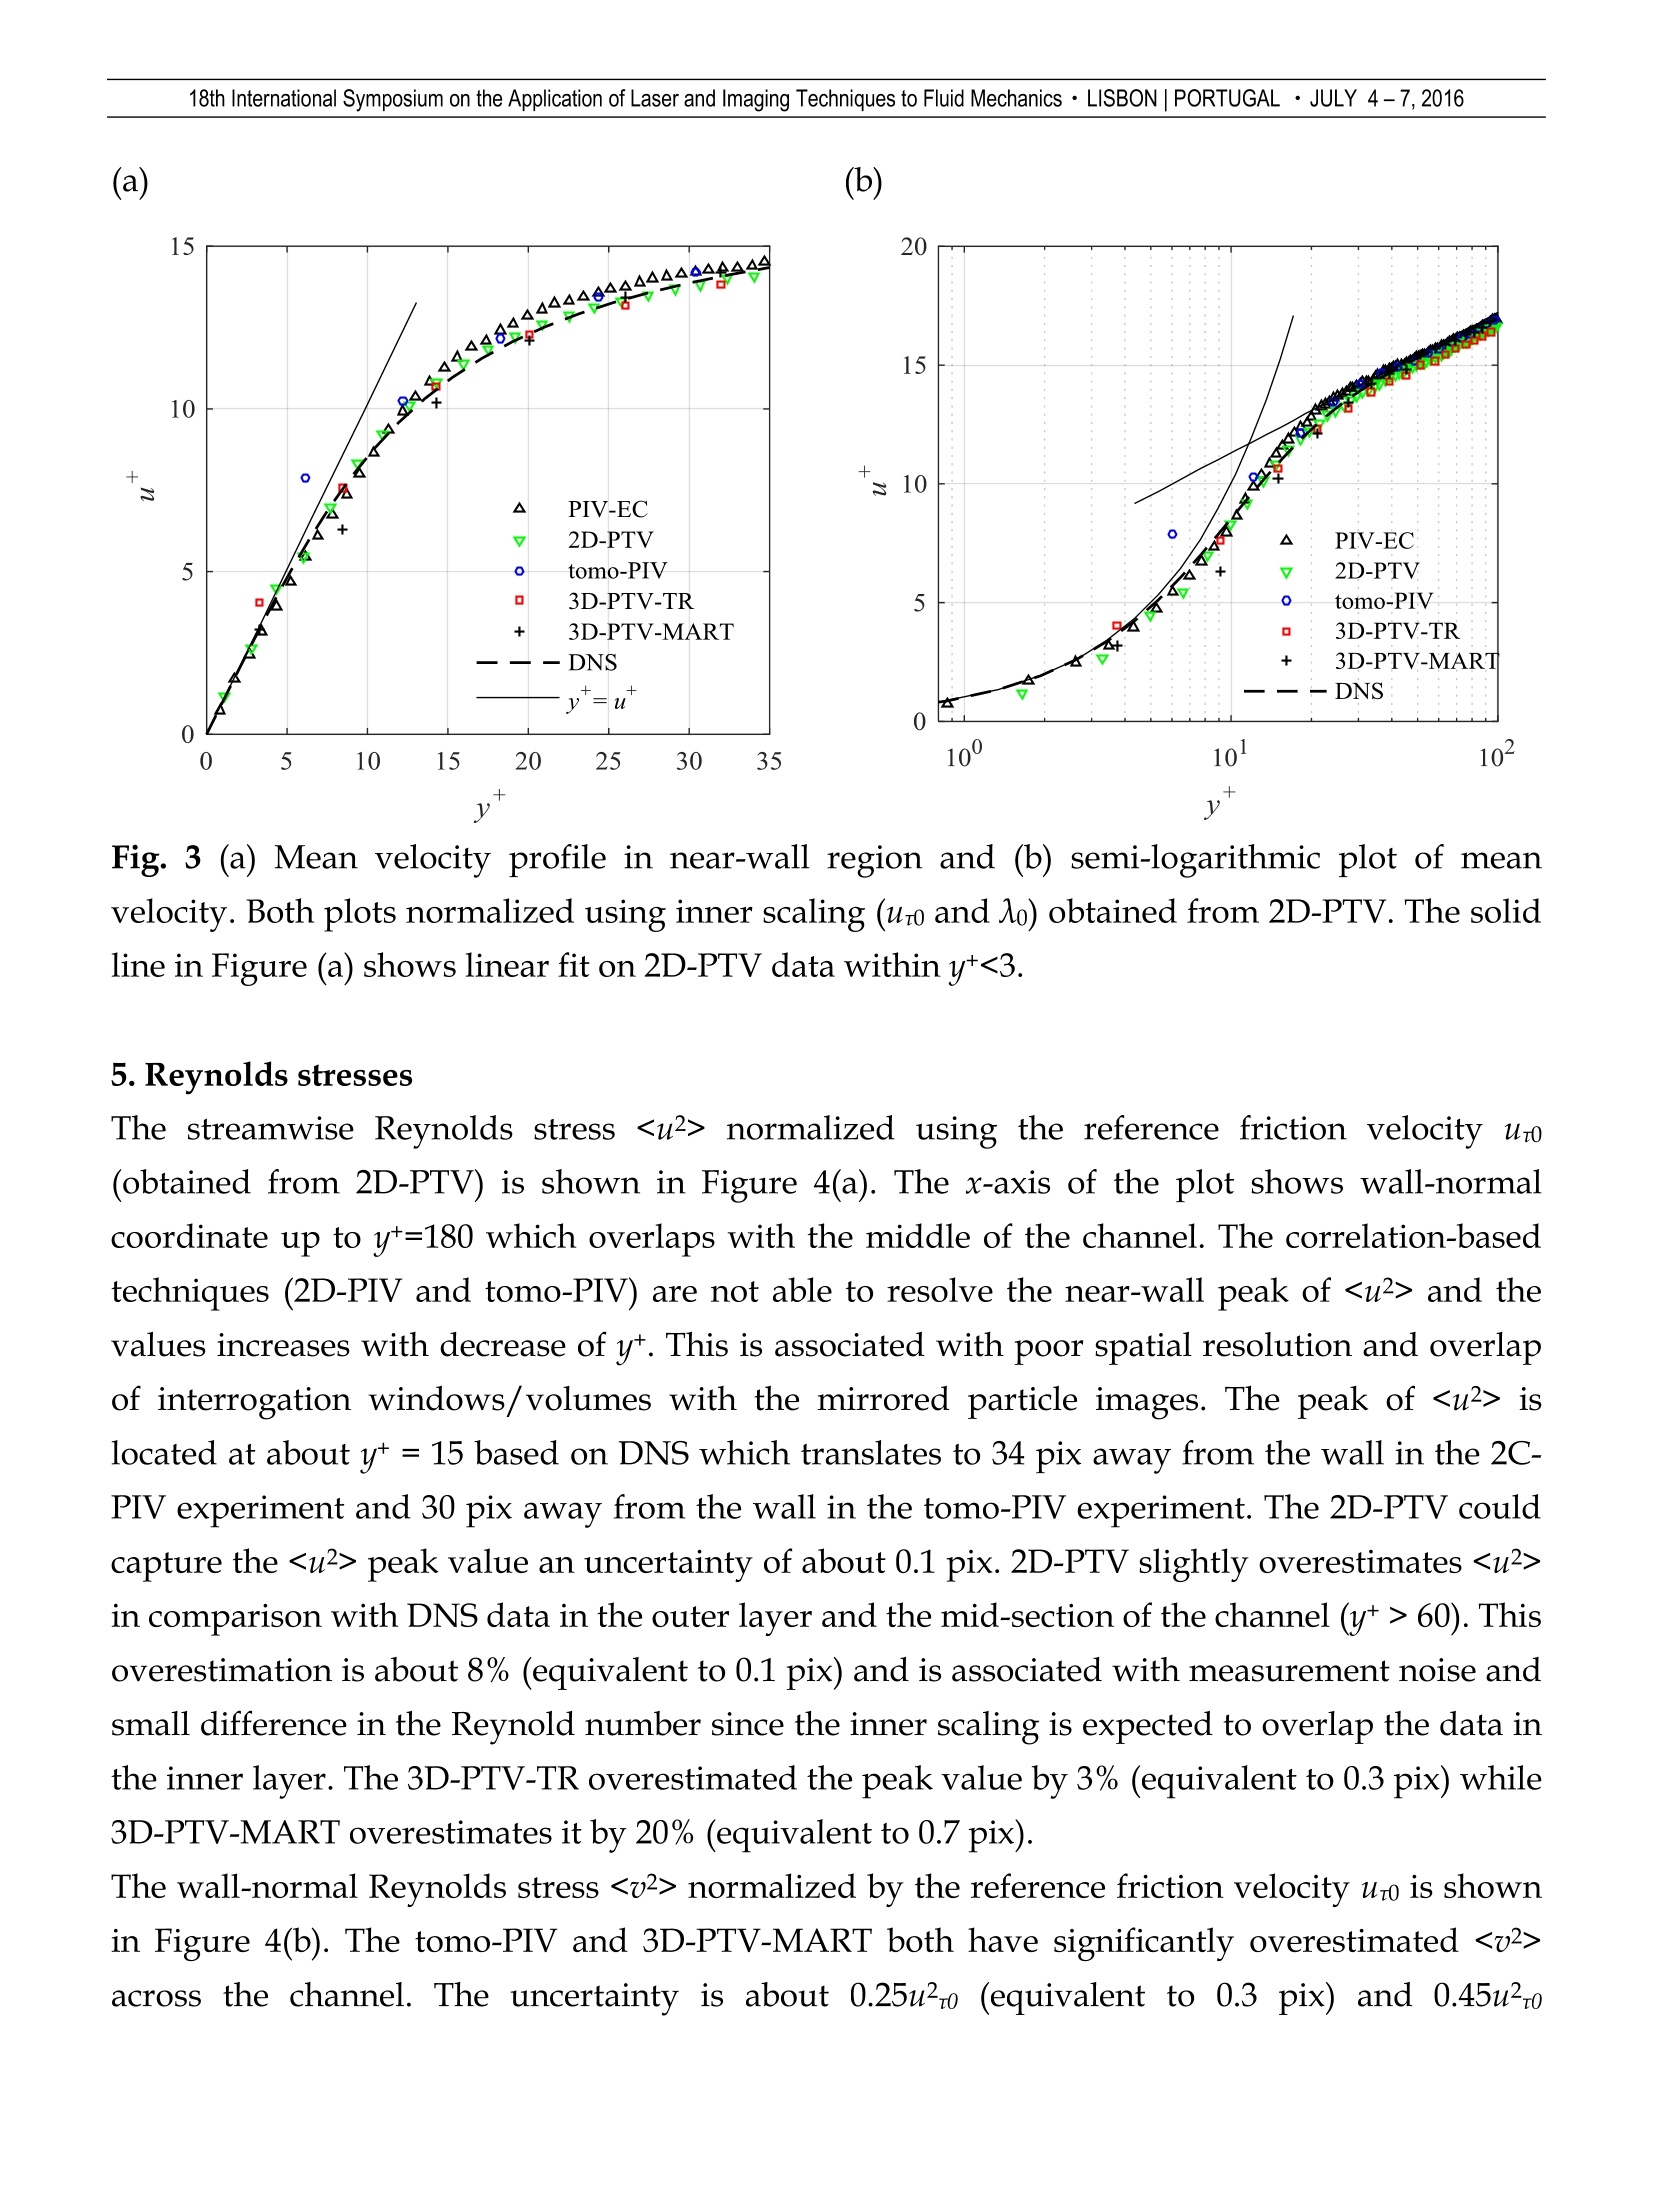
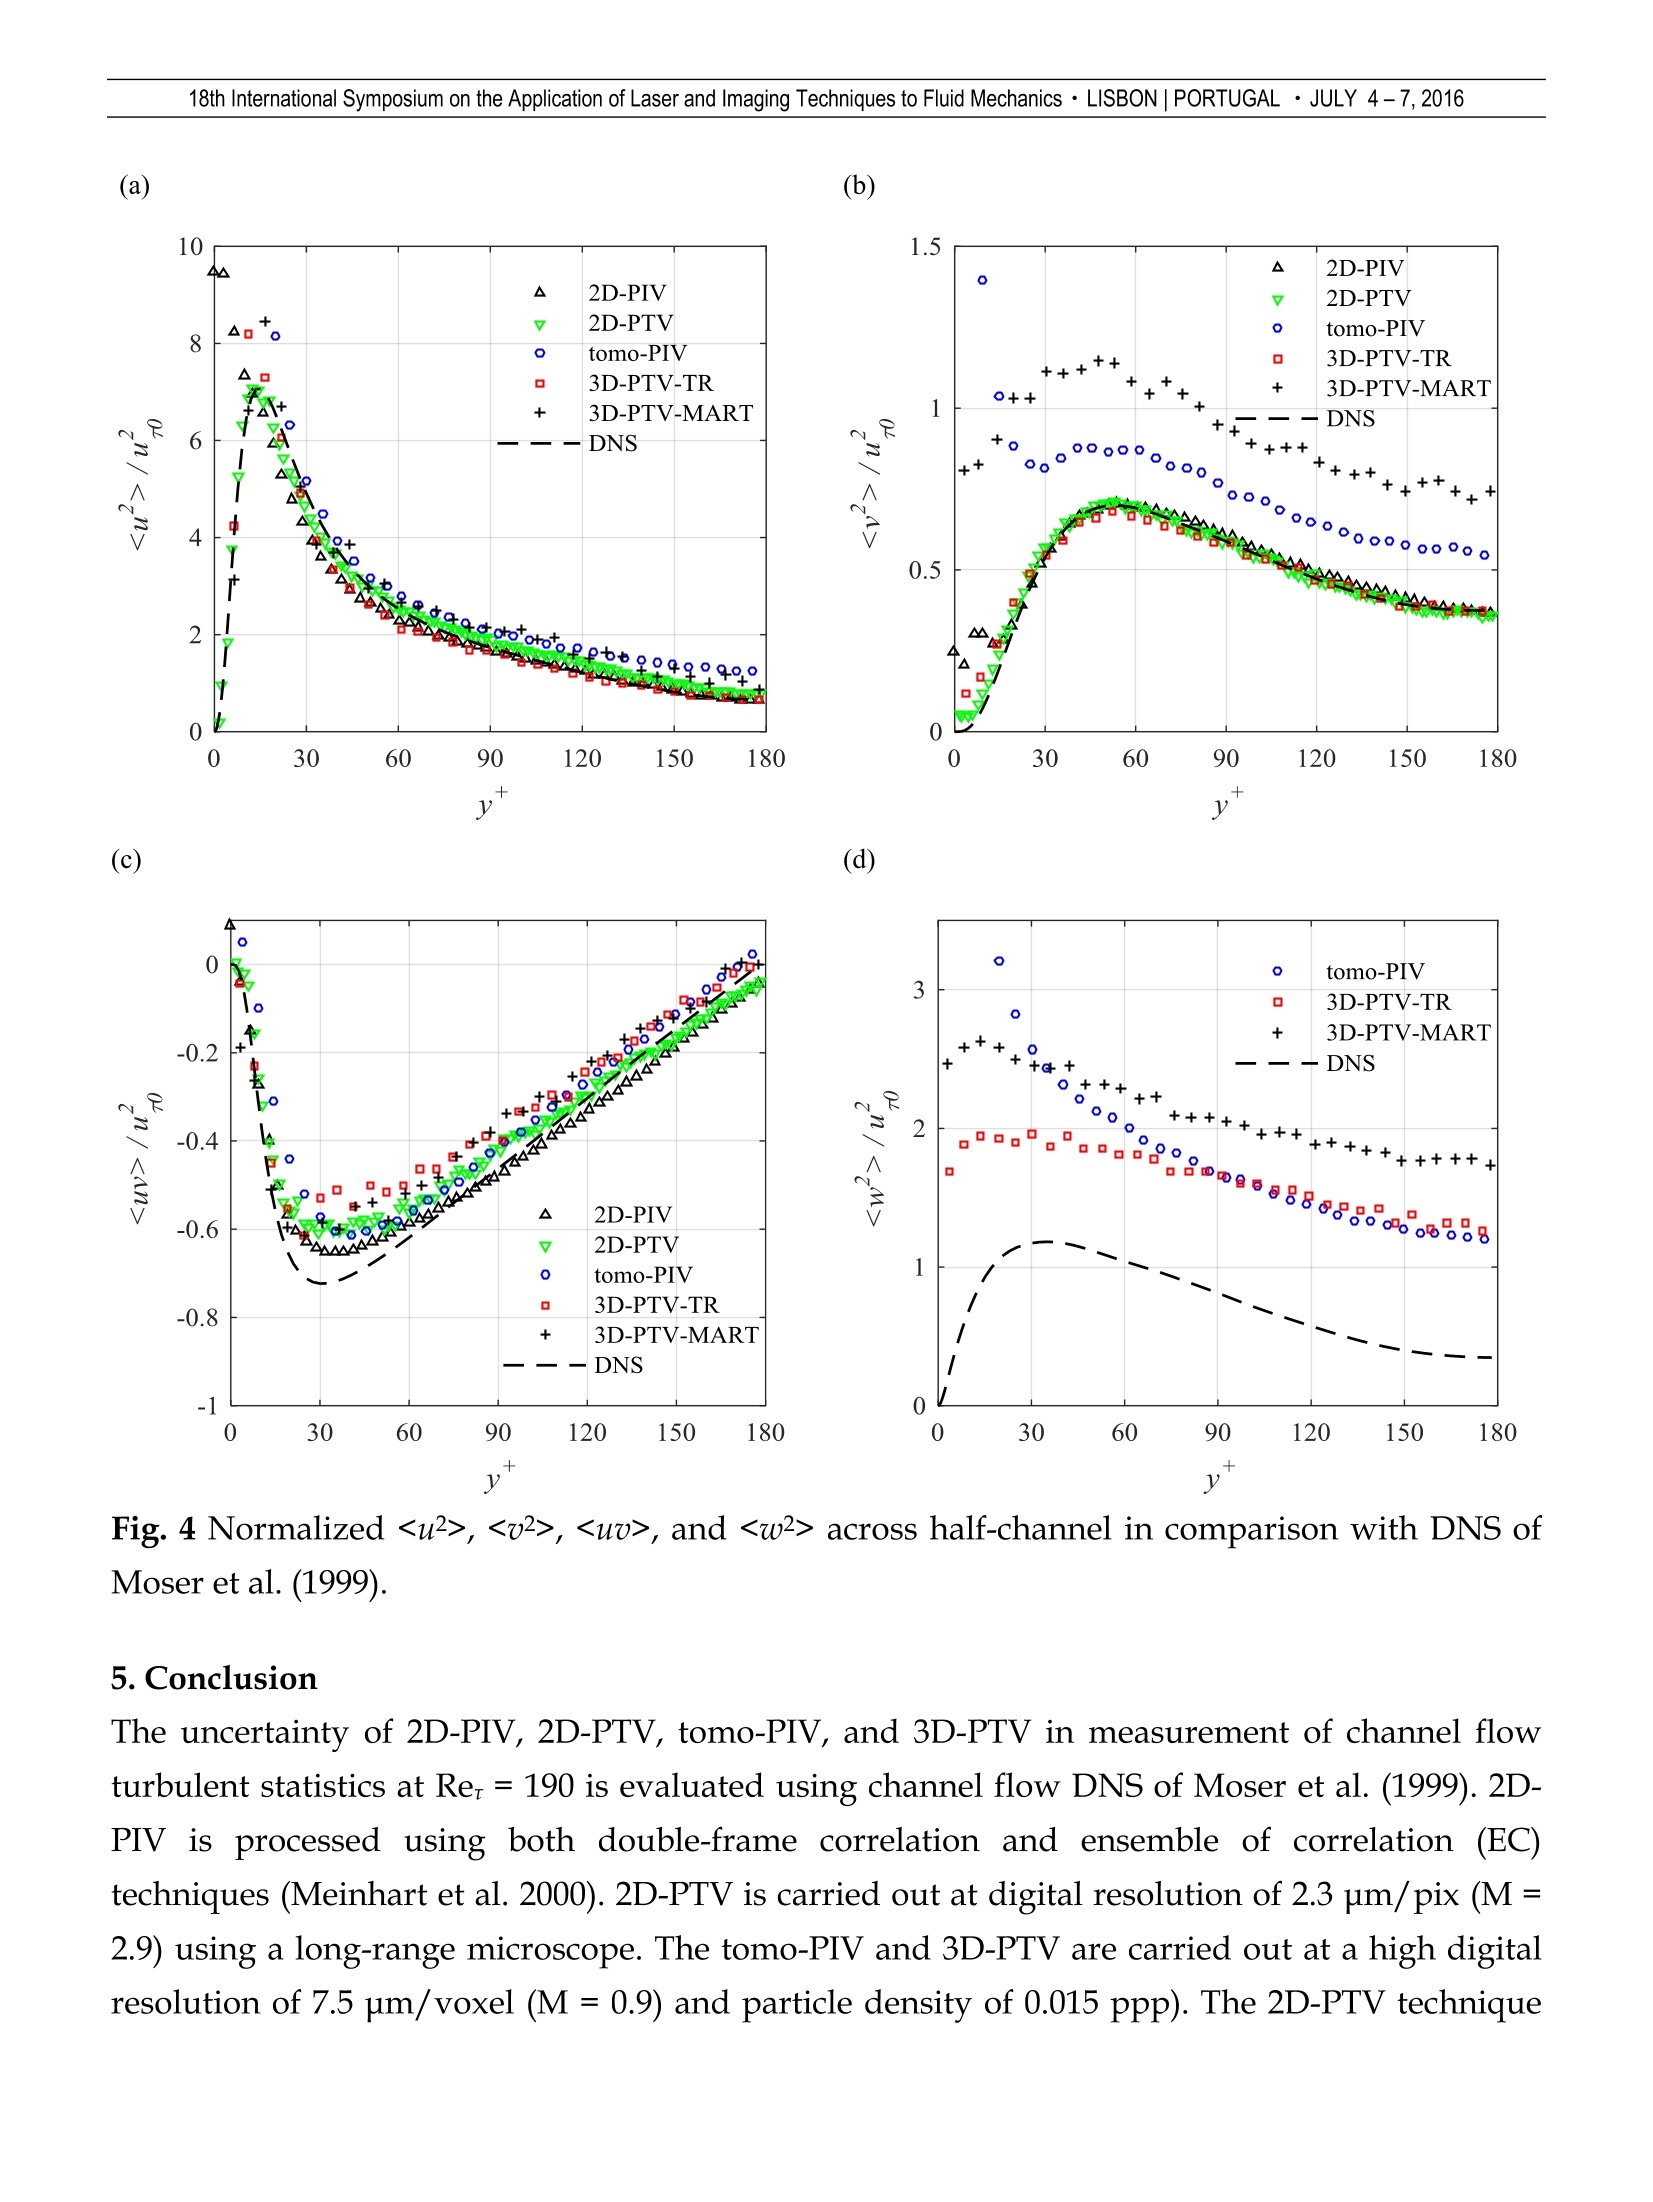
18th International Symposium on the Application of Laser and Imaging Techniques to Fluid Mechanics · LISBON |PORTUGAL · JULY 4-7, 2016 Evaluation of high magnification two and three dimensional particle imagetracking/velocimetry in near wall turbulence S. Rafati, S. Ghaemi* Department of Mechanical Engineering, University of Alberta, Canada * Correspondent author: ghaemi@ualberta.ca Keywords: Tomographic-PIV, 3D-PTV, Turbulent channel flow ABSTRACT Measurement of turbulent statistics in the inner layer of wall flows is of fundamental and appliedimportance for development of passive and active flow control systems. Accuracy of two and threedimensional particle image velocimetry (PIV) and particle tracking velocimetry (PTV) in resolving thenear-wall turbulence statistics of a channel flow is evaluated at Reynolds number of ReH=6700 (based onaverage velocity and channel height H) equivalent to Re,= 190 (based on friction velocity ur= 0.0638 m/sand the half channel height, H/2). The channel has a rectangular cross-section of WxH=40×6 mm andwall unit of 1 =16.2 um. The evaluated 2D techniques include PIV (2D-PIV) with spatial resolution of3.2*×3.2* (digital resolution of 6.25 um/pix) and long-range microscopic particle tracking velocimetry(2D-PTV) with spatial resolution of 1.7*x1.7 (digital resolution of 2.3 pum/pix). The 3D techniquesinclude tomographic particle image velocimetry (tomo-PIV) and three-dimensional PTV (3D-PTV) bothcarried out at high digital resolution of 7.5 um/voxel (M=0.9) and tracer density of 0.015 particles perpixel. The spatial resolution of the tomo-PIV is 22*×22*×22*(0.36×0.36x0.36 mm’) and wall-normalspatial resolution of 3D-PTV is 5.5* (90 um). The measurements are compared with channel flow directnumerical simulation (DNS) of Moser et al. (1999) at Rer=180. The 2D-PTV technique shows maximumuncertainty of 0.06 pix in resolving mean velocity and 0.1 pixel uncertainties in measurement of Reynoldsstresses. The high magnification tomo-PIV shows an uncertainty of 0.2 pix in resolving the mean velocitywhile an uncertainty of 0.3-0.7 pixel in measuring peak value of Reynolds stresses. 3D-PTV based ontriangulation of particles demonstrated smaller uncertainty relative to tomo-PIV and 3D-PTV using MARTreconstruction. 1. Introduction The transport of momentum and heat by turbulent motions increases skin-friction and heattransfer rate in wall flows. The near-wall turbulence is of particular importance since almost allthe production of turbulent kinetic energy occurs adjacent to the wall at yt <90 (Kim et al.,1987).Development and evaluation of experimental techniques capable of resolving the near-wall flowis vital in understanding the near wall turbulence and development of flow control strategies. This is of particular importance since DNS at high Reynolds numbers and non-canonical wallflows over textured and rough surfaces is still challenging. The accuracy of PIV in near-wall turbulence may reduce due to several issues includingreflection of the laser light from the wall, small turbulent structures, high velocity gradient, andlow tracer density. The finite spatial-resolution actsasa low-pass filter, systematicallyunderestimating the small-scale near-wall turbulence and smearing out the spatial gradients(Westerweel 1993). Several techniques incorporating window offset, grid refinement, windowdeformation, and spatially adaptive windows have been developed to improve the accuracy androbustness of near-wall PIV (Scarano & Riethmuller 2000; Theunissen et al. 2008;Novara et al.2013). However, even with modern PIV algorithms the uncertainty significantly increases withreduction of wall-normal distance as the velocity gradient increases (Herpin et al., 2008). Higherdigital resolution can reduce the uncertainties caused by spatial gradients and finite windowsize; however, it also causes smaller spatial dynamic range, low number density of tracerparticles, bias error due to non-uniform tracer density, and large particle image size (Cierpka etal.2013). As a result, other techniques such as PTV have been sought for near-wall measurement.The spatial-resolution of PTV is limited by the uncertainty in estimating the center of particleimages, which can be below 0.01 pix for particles of 3 to 15 pix in diameter (Kahler et al., 2012).The high spatial-resolution of PTV has enabled measurement of the mean velocity gradient inthe linear viscous sublayer (y*<5) and accurate estimation of wall-shear stress (e.g., Knopp et al.2013 and Huisman et al., 2013). Although PTV has been evaluated as a robust method formeasurement of near-wall mean velocity, investigation of PTV accuracy in estimation of high-order turbulence statistics is required. Tomo-PIV and 3D-PTV have been developed for measurement of 3D spatial structure and thevelocity gradient tensor in turbulent flows (Elsinga et al. 2006; Scarano, 2013). The issue of finitespatial-resolution is more pronounced in tomo-PIV relative to standard planar PIV since theminimum size of the interrogation volume (IV) is limited by maximum source density (Ns, imagearea covered by particle images) and a minimum of about 10 particles per ⅣV (De Silva et al.,2012). As a result, the previous tomo-PIVof turbulent wall flows have been limited to relativelylarge spatial-resolution as summarized in Table 1. The table also shows that the previous tomo-PIV experiments have a digital resolution smaller than 28 pix/mm. To the authors' knowledge,only Kim et al. (2013) conducted tomo-PIV at a high digital resolution of 4 um/pix atmagnification of 1.5 using four cameras viewing through a single microscope objective lens. Kimet al. (2013) measured the average velocity in a droplet on a moving substrate with nomeasurement of high order statistics, as the flow was laminar. Table 1. An overview of modern 3D measurements in turbulent wall flows (turbulent boundary layer (TBL) andchannel flow). The spatial resolution of the current tomo-PIVand 3D-PTV measurements are also presented forcomparison. Flow type Evaluation method IV size Digital resolution(pix/mm) Schroder et al. (2008) TBL double-frame correlation 2×2×2 mm3 24.0 Elsinga (2008) TBL double-frame correlation 1.88×1.88×1.88 mm3 64+×64+×64+ 27.0 TBL Schroder et al. (2011) double-frame 2.75×2.75×2.75 mm3 11.7 correlation 59.7+×59.7+×59.7+ Schafer et al. (2011) channel flow double-frame correlation 1×1×1mm3 96 Atkinson et al. (2011) TBL double-frame 3.2×3.2×3.2 mm3 20 correlation 26.4+×26.4+×26.4+ Ghaemi & Scarano, (2011) TBL with double-frame 1.47×1.47×1.47 mm3 21.9 pressure gradient correlation 48.9+×48.9+×48.9+ Elsinga & Westerweel TBL after a double-frame 1.8×1.8×1.8 mm3 15.7 (2012) tripping device correlation Ghaemi et al. (2012) TBL sliding-average over 3 1.53×1.53×1.53 mm3 18.3 image pairs 38+×38+×38+ Ghaemi & Scarano (2013) TBL sliding-average over3 1.68×0.84×1.68 mm3 19.0 image pairs 43+×22+×43+ Jodai et al. (2014) TBL double-frame 1.37×1.37×1.37 mm3 28.0 correlation 16+×16*×16+ TBL Schroder et al. (2015) 3D-PTV 3.3×3.3×3.3 um3 33.3 shake-the-box method 1/13+×1/13+×1/13+ Current experiment channel flow double-frame 0.36×0.36×0.36 mm3 132 correlation 22+×22+×22+ 3D-PTV 15.5×0.09×10 mm3 132 939+×5.5+×606+ Three-dimensional measurement with high spatial-resolution can be achieved by tracking theindividual particles (Mass et al. 1993). Kasagi & Nishino (1991), Walpot et al. (2007), and Oliveiraet al. (2013) measured wall turbulence statistics by 3D tracking of large polyamide tracers (200-250um). The PTV image sample of Kasagi & Nishino (1991) shows about 0.003 ppp while Walpotet al. (2007) have detected 150 particles per images (~0.00015 ppp). Mass et al. (1993) alsoreported a seeding density of 0.005 ppp. At higher tracer number density, the robustness of 3D-PTV algorithm is affected by the overlapping particles or crossing trajectories (Novara & Scarano2013). The seed density and number of valid vectors in 3D-PTV is typically an order ofmagnitude less than tomo-PIV (Scarano 2013; Wieneke, 2013), limiting the application of 3D-PTVin characterization of instantaneous turbulent structures. Kim et al. (2013) compared tomo-PIVand 3D-PTV based on a common set of 2D images of laminar flow inside a liquid droplet at 0.034ppp. Their results showed lower noise of tomo-PIV compared to 3D-PTV. The application ofhigh tracer density images for measurement of turbulent statistics with high spatial-resolutionusing 3D-PTV requires further evaluation of the uncertainties. The current investigation aims at evaluation of planar and volumetric double-frame PIV andPTV techniques for measurement of turbulent statistics across a channel flow and in particular inthe inner layer (y*<100) at Rer=190. The investigated measurement techniques include: 2D-PIV, at digital resolution of 6.25 um/pix, processed using both double-frame correlationand ensemble of correlation (EC) techniques (Meinhart et al. 2000). 2D-PTV at digital resolution of 2.3 um/pix (M= 2.9) carried out using long-rangemicroscope. Tomo-PIV at digital resolution of 7.5 um/voxel (M=0.9). 3D-PTV at the same digital resolution and particle density (0.015 ppp) of the tomo-PIV. All the methods are evaluated using DNS of turbulent channel flow by Moser et al. (1999) at Rer= 180. 2. Experimental setup 2.1. Flow facility Measurements are carried out in a closed-circuit water tunnel with rectangular cross-section of40x6 mm2 (WxH). The total length of the rectangular channel is 1200 mm (200H) and themeasurements were carried out 720 mm (120H) downstream of the channel entrance to ensure afully developed flow. Figure 1(a) shows the fully transparent test section and downstreamdiffuser of the facility. The working fluid is distilled water seeded with silver-coated 2 umspherical glass beads with density of 4 g/cm3 (SG02S40 Potters Industries). The Reynoldsnumber based on the channel height H and the bulk velocity across the channel is ReH =6700. The bulk velocity, the maximum velocity, friction velocity, and the wall unit are Ub=1.12 m/s,Umax=1.26 m/s, ur=0.064 m/s, and A=16.2 um based on 2D-PTV measurement, respectively. Table 2. Flow condition at the measurement location based on2D-PTV measurement. Parameter value Xo (um) 16.2 uro(m/s) 0.064 Ub(m/s) 1.121 ReH 6700 Rer 190 2.2. Planar particle image velocimetry (2D-PIV) 2D-PIV was carried out using a 12-bit CCD camera (Imager Intense, LaVision GmbH) with1040×1376 pix sensor and pixel area of 6.45x6.45 um2. The camera was equipped with a SigmaSLR objective lens with focal length of f= 105 mm at aperture size of f/11. The illumination wasprovided by a thin laser sheet of 0.5 mm thickness generated by an Nd:YAG laser (Solo III-15,New Wave Research). The laser sheet enters the test section from the bottom acrylic wall andpasses though the upper acrylic wall with negligible glare line in the images. Magnification wasset to M = 0.8 with digital resolution of 160 pix/mm and fields-of-view of 8.9×6.7 mm² in the xand y directions, respectively. The depth-of-field of the imaging system is estimated 1.3 mm. Thetwo laser pulses are synchronized with the camera frames using a programmable timing unit(PTU9, LaVision GmbH) controlled by DaVis 8.2. PIV recordings are obtained in double-framemode with laser pulse separation of 63 us. An ensemble of 10,000 image pairs was recorded. The signal-to-noise ratio of the images was improved by subtracting the minimum intensity andimage normalization using the ensemble average. The images are processed by both ensemble ofcorrelation (Meinhart et al. 2000) and double-frame cross correlation. The final window size inthe ensemble of correlation (EC) is 8x8 pix (52x52 um² equivalent to 3.2+x3.2+) with 75 percentoverlap. The turbulent intensities are obtained from cross-correlation of the double-frame imagesusing a multi-pass algorithm with final interrogation windows of 32x32 pix (0.208×0.208 mm2)with 75 percent overlap conducted in DaVis 8.2 (LaVision, GmbH). The vector fields are postprocessed using the universal outlier detection (Westerweel & Scarano,2005). 2.3. Planar particle tracking velocimetry (2D-PTV) The 2D-PTV measurement is carried out using the same CCD camera as the PIV equipped with along-range microscope (12x zoom lens, Navitar) at a working distance of 86 mm. Themagnification is set to 2.9 with digital image resolution of 440 pix/mm and fields-of-view of2.4x3.1 mm² in the x and y directions, respectively. The numerical aperture (NA) is estimatedabout 0.05 based on magnification from the Navitar zoom lens performance datasheet (Navitar,2016). The NA is equivalent to aperture number of f#=1/ (2xNA)=10. The depth-of-field (8z)at high magnification imaging is estimated as 260 um (Young et al., 1993), which is about half ofthe laser sheet thickness. This results in out-of-focus particle images in the 2D-PTV images. Theestimated diameter of in-focus particles is about 8 pix (based on diffraction and geometricimaging) while the out-of-focus particle image can be as large as 12 pix (Olsen & Adrian, 2000).An ensemble of 10,000 double-frame image pairs were acquired with a laser pulse separation of27 us. The minimum intensity of the ensemble of images was subtracted from the individual imagesfollowed by image normalization using the average of the image ensemble. In order to overcomethe peak locking effect, a 3x3 pix2 Gaussian smoothing filter was applied to the images (Kahler etal. 2012). The algorithm initially detects particles based on a preliminary intensity thresholdfollowed by detection of local maxima (Maas et al. 1993) within a kernel of 12 pixels. Thedetected particles are also band-pass filtered within 3-7 pix in diameter. Particle images smallerthan 3 pix in diameter can introduce bias error due to peak locking (Kahler et al.2012), whileparticles larger than 7 pixel are typically out-of-focus or skewed. In addition, the change in theparticle area, the ratio of the major and minor axis, and the peak intensity ratio of the two frameswere limited to 20, 30, and 50 percent, respectively. Peak detection with sub-pixel accuracy iscarried out using a Gaussian fit with kernel of 3×3 pix2. The pairs are detected by searching theneighborhood in a circle of 5 pix radius after applying an initial shift based on EC analysis(32x32 pixel window size and 75% overlap). The data is filtered by limiting the magnitude of thewall-normal velocity component to be smaller than 20% of the streamwise component. Thevectors are averaged in bins with 880x12 pix (2000×28um2, 123+x1.7+) in x and y directions,respectively. 2.4 Tomographic particle image velocimetry (tomo-PIV) The illumination source of the tomo-PIV experiment was provided by an Nd:YAG laser (Solo III-15, New Wave Research). The laser sheet was collimated and slightly focused to a thickness of 3mm in the spanwise direction (z). A knife-edge filter with 3 mm width was attached to thebottom surface of the channel.The imaging system consists of four CCD cameras (Imager ProX,LaVisison) with 2048×2048 pix sensor and pixel size of 7.4x7.4 um2. The cameras were equipped with scheimpflug adapters and f= 105 mm Sigma SLR objectives at an aperture setting of f/ 16.The magnification and digital resolution are M = 0.9 and S = 132 pix/mm, respectively. Themeasurement volume is (x, y, z)=15.5×10×3 mm3 (1971×723×394 voxel). The depth-of-field ofthe imaging system is estimated about 2.5 mm, which is slightly smaller than the laser sheetthickness. This small out-of-focus effect is negligible since the blur image is approximately 7.6um (1.03 pix) smaller than the 2 pixel limit proposed by Scarano (2013). The smaller aperture isdesirable here to reduce particle image size and consequently reduce the total area covered bythe particle images. The particle image diameter based on visual inspection of the images rangebetween 4-7 pixels. The laser and cameras were synchronized using a programmable timing unit(PTU9, LaVision, GmbH). The solid angle between the two cameras on the left-side of thechannel is 50 degrees while the solid angle of the two right-side cameras is 30 degrees as shownin Figure 1(b). An ensemble of 1,000 double-frame images with time delay of 72 us (maximumdisplacement of about 13 pix) was recorded. The initial mapping function is obtained using a pinhole model on a target with 0.3 mm dotsspaced 2 mm apart. The target is traversed in 0.5 mm steps in the depth direction (spanwisedirection of the channel, z). A relatively large image distortion with 1-2 pixel residual root-mean-square (RMS) in the disparity map was observed. Volume-self-calibration was applied to reducethe residual RMS of the disparity map to less than 0.05 pixel (Wieneke, 2008). This disparity isnegligible since it is about 1% of mean particle image diameter. The channel flow was seededwith 2um silver coated glass beads at a concentration of 90 particles/mm3 with particle numberdensity of 0.015 particles per pixel (ppp) and source density (Ns) of 0.34. The minimum of the ensemble of images is subtracted from the individual images followed byimage normalization. The SNR is further improved by subtracting local minimum and intensitynormalization using a local average with kernel of 51 pix. The 3D location of the particles wasreconstructed based on MART algorithm (Herman anc enntt1976)) knownas“precisereconstruction" in Davis 8.2. The volumetric cross-correlation is performed using multi-passalgorithm with final interrogation volume size of 48x48×48 voxel (0.36×0.36×0.36 mm3, 22+×22+×22+) with 75 percent overlap. The number of particles per IV in the reconstructed images isabout 4-7 particles. The vector fields are post processed using the universal outlier detection(Westerweel & Scarano, 2005). Davis 8.2 (LaVision, GmbH) is used for image acquisition andtomo-PIV processing. 2.5 Three-dimensional particle tracking velocimetry (3D-PTV) The 3D-PTV processing was carried out on the same images acquired for tomo-PIV followed bythe same image preprocessing with the addition of a Gaussian filter to prevent possible peaklocking (Kahler et al., 2012). Two 3D-PTV algorithms were considered. The first method detects the 3D location of particles based on triangulation (TA) of the particles in 2D images. The processis carried out in DaVis 8.2.3 (LaVision, GmbH) using the same mapping function obtained forthe tomo-PIV. An ensemble of 4,000 double-frame images was processed using 3D-PTV-TAalgorithm. The second method detects and tracks the particles in the reconstructed 3D intensitydistribution obtained based on the MATR algorithm for tomo-PIV. The 3D particle tracking ofthe MART method is conducted using an in-house PTV algorithm developed in MATLAB. Thecomparison of the two 3D-PTV methods can separate the effect of calibration and identify theerrors associated with 3D intensity reconstruction (i.e., ghost particles). The 3D-PTV-MART is carried out in MATLAB based on preliminary detection of local intensitymaxima within a kernel of 12 voxel. The location of the particle peak in x and y directions wereestimated with sub-pixel accuracy using Gaussian fitting in xy plane. The particle peak locationin the z direction is estimated as the average peaks obtained from Gaussian fits in xz and yzplanes. The average velocity field obtained from tomo-PIV is used as an initial estimation tosearch for the particle pairs within an elliptical volume with kernel of 5, 3, and 3 voxels in x, y, z,respectively. The 3D-PTV vectors are averaged in bins with wall normal size of 12 voxel (270 um,5.5+). The bins cover full streamwise (15.5 mm) and spanwise extensions (3 mm) of themeasurement volume. Fig. 1 (a) The planar PIV consists of the camera on the left side of the channel. The long-rangemicroscopic PTV is carried out using the right-side camera equipped with Navitar zoom lens.The side wall of the channel are glass while the top and bottom walls are from acrylic. The laserilluminates a wall-normal streamwise plane from the bottom of the channel.(b) The setup of thetomo-PIV showing four cameras imaging a streamwise/wall-normal field-of-view. The anglebetween the right-side cameras is 50°while the angle between the left-side cameras is 30°. 3.Optimization of 3D-PTV-TA Two input parameters of 3D-PTV-TA include an intensity threshold (I) for particle detection anda triangulation error (e). These parameters need to be optimized to maximize the accuracy ofparticle peak detection while collecting enough number of particles for statistical convergence.The accuracy of the 3D-PTV-TA is evaluated using second order turbulent statistics , ,and in comparison with the DNS data in Figure 2 (a), (b), and (c), respectively.Triangulation error smaller than e = 1 did not result in statistical convergence. The 3D-PTV-TAdata with triangulation error of e=1 pixel (at intensity threshold of I=30) has the smallest noiselevel relative to the two other cases. Increase of the intensity threshold to I = 50 results in anincrease of noise level in the outer layer and loss of the near-wall peak for . Increase oftriangulation error to e = 2 pix has a large effect on the measurement noise. The observed noise atthe channel centerline (y*=180) by increase of e from 1 to 2 pix is equivalent to 0.6, 0.3, and 1 pixfor , , and, respectively. The results show that PTV parameters of e =1 pix andI =30 counts resulted in relative overlap of and with the DNS data across the channel.However, is still overestimated by about 0.5 pix. Fig. 2 The effect of intensity threshold (I) and triangulation error (e) on the accuracy of 3D-PTV-TA in evaluation of second order turbulent statistics. The dashed lines represent the DNS data ofMoser et al. (1999) at Rer=180. 4.Mean velocity profile A comparison of the measured mean velocity using all the applied techniques within y* <35 isshown in Figure 3(a). The 2D-PIV data is obtained using the ensemble of correlation (EC)method. 2D-PIV deviates relative to DNS within 12 normalized using the reference friction velocity uro(obtained from 2D-PTV) is shown in Figure 4(a). The x-axis of the plot shows wall-normalcoordinate up to yt=180 which overlaps with the middle of the channel. The correlation-basedtechniques (2D-PIVand tomo-PIV) are not able to resolve the near-wall peak of and thevalues increases with decrease of yt. This is associated with poor spatial resolution and overlapof interrogation windows/volumes with the mirrored particle images. The peak of islocated at about y* = 15 based on DNS which translates to 34 pix away from the wall in the 2C-PIV experiment and 30 pix away from the wall in the tomo-PIV experiment. The 2D-PTV couldcapture the peak value an uncertainty of about 0.1 pix. 2D-PTV slightly overestimates in comparison with DNS data in the outer layer and the mid-section of the channel (yt>60). Thisoverestimation is about 8% (equivalent to 0.1 pix) and is associated with measurement noise andsmall difference in the Reynold number since the inner scaling is expected to overlap the data inthe inner layer. The 3D-PTV-TR overestimated the peak value by 3% (equivalent to 0.3 pix) while3D-PTV-MART overestimates it by 20% (equivalent to 0.7 pix). The wall-normal Reynolds stress normalized by the reference friction velocity uro is shownin Figure 4(b). The tomo-PIV and 3D-PTV-MART both have significantly overestimated across the channel. The uncertainty is about 0.25uro (equivalent to 0.3 pix) and 0.45uro (equivalent to 0.4 pix) at yt = 50 for tomo-PIV and 3D-PTV-MART, respectively. The noise isassociated with 3D reconstruction errors while the lower noise of tomo-PIV is due to the lowpass filtering effect of large interrogation volumes. The 3D-PTV-TR estimates the peak valuewith uncertainty of 0.08 pix. The 2D-PIV and 2D-PTV measure the peak with 1% and 2%percent error equivalent to 0.05 and 0.08 pix, respectively. Figure 4(c)shows the normalized Reynolds shear stress acrossthe channel. Allmeasurement techniques underestimate in the peak region (y*<70). The underestimation ofshear stress is due to the measurement noise which reduces the correlation of the u and vcomponents. Peak locking has been considered as a possible source of noise reducing the u and vcorrelation signal (Christensen, 2004) and also the accuracy peak detection in PTV. The out-of-plane component measured by the volumetric systems in comparison with theDNS data is shown in Figure 4(d). The tomo-PIV has not captured the peak value showing anoverestimation of about 0.7 pix at yt ~30 which reduces to 0.6 pix and stays constant till thechannel centerline. The 3D-PTV results based on MART and TR shows the same trend as theDNS profile while the values are overestimated by 0.5 and 0.7 pix, respectively. The 3D-PTV-TRhas the most accurate measurement and captures the peak location at yt = 21 with 20%discrepancy with respect to the DNS. The uncertainty of the techniques in measurement of meanvelocity and Reynolds stress is summarized in Table 3 in terms of pixels. Table 3. Unceratinty of the evaulated techniques in pixel in comaprison with DNS. NA stand for "notavailable". 2D-PIV (EC) 2D-PTV Tomo-PiV 3D-PTV-TR 3D-PTV-MART at yt=3 0.12 0.05 NA 0.5 0.04 at yt~20 0.38 0.06 0.2 0.02 0.12 peak value NA 0.1 0.6 0.4 0.7 at yt=15 peak value 0.04 0.08 0.3 0.1 0.4 at yt=50 peak value NA NA 0.7 0.5 0.7 at y*=35 peak value 0.17 0.28 0.2 0.3 0.2 at yt=30 Fig. 4 Normalized , , , and across half-channel in comparison with DNS ofMoser et al. (1999). 5. Conclusion The uncertainty of 2D-PIV, 2D-PTV, tomo-PIV, and 3D-PTV in measurement of channel flowturbulent statistics at Rer=190 is evaluated using channel flow DNS of Moser et al. (1999). 2D-PIV is processed using both double-frame correlation and ensemble of correlation (EC)techniques (Meinhart et al. 2000). 2D-PTV is carried out at digital resolution of 2.3 um/pix (M=2.9) using a long-range microscope. The tomo-PIV and 3D-PTV are carried out at a high digitalresolution of 7.5 um/voxel (M=0.9) and particle density of 0.015 ppp). The 2D-PTV technique shows maximum uncertainty of 0.06 pix in resolving mean velocity and 0.1 pixel uncertainties inmeasurement of Reynolds stresses. The high magnification tomo-PIV shows an uncertainty of 0.2pix in resolving the mean velocity while an uncertainty of 0.3-0.7 pixel in estimating peak valueof Reynolds stresses. ‘3D-PTV based on triangulation of particles demonstrated1 smalleruncertainty relative to tomo-PIV and 3D-PTV using MART reconstruction. 6. Acknowledgement This work has been supported by the Natural Sciences and Engineering Research Council ofCanada (NSERC RGPIN 1512 GHAEMI). The authors thank Dr.David Nobes for providing thetomo-PIV equipment. 7. References ( Atkinson, C., C oudert, S., Foucaut, J.-M., Stanislas, M., & Soria, J. (2 0 11). The accuracy oftomographic p article image velocimetry for measurements o f a t urbulent boundary l ayer.Exp.F l uids, 5 0(4),1031-1056. ) ( Christensen, K. T. (2004). The influence of peak-locking errors on turbulence statistics computedfrom PIV ensembles. Exp. Fluids, 36(3), 484-497. ) ( Cierpka, C., Liitke, B ., & Kahler, C. C. J. (2013). H i gher ord e r multi-frame parti c le trackingvelocimetry. Exp. Fluids, 54(5), 1 5 33. ) ( De Silva, C. M., Baidya,R., Khashehchi, M., & Marusic, I. (2012). Assessment of tomographic PIVin wall-bounded tu r bulence usi n g direct numerical simulation data. Exp. F luids, 52(2), 425-440. ) ( Elsinga, G. (2008). Tomographic p article image v elocimetry and its a pplication to turbulentboundary layers, PhD thesis, Delft University of Technology. ) ( Elsinga, G. E., Scarano, F., Wieneke, B., & van Oudheusden, B. W. (20 0 6). Tomographic particleimage velocimetry. Exp. Fluids, 41(6), 933-947. ) ( Elsinga, G. E. , & Westerweel, J . (2012 ) . Tomographic-PIV measurement of t he flow a round azigzag boundary layer trip. E xp. Fluids, 52(4), 865-876. ) ( Elsinga, G. E., Westerweel, J., Scarano, F . , & Novara, M. (20 1 0). On the velocity of ghost particlesand the bias errors in Tomographic-PIV. Exp. Fluids, 50(4), 8 2 5-838. ) ( Ghaemi, S., R agni, D., & Scarano, F. ( 2012). PIV-based pressure fluctuations in the turbulentboundary layer. Exp. Fluids, 53(6), 1 823-1840. ) ( Ghaemi, S., & Scarano, F. (2011). Counter-hairpin vortices i n the turbulent wake o f a s h arptrailing edge. J. Fluid Mech., 689, 317-356. ) Ghaemi, S., & Scarano, F. (2013). Turbulent structure of high-amplitude pressure peaks withinthe turbulent boundary layer. J. Fluid Mech., 735, 381-426. ( Herman, G. T., & Le n t, A. (1976). Iterative R e construction Algorithms. Computer BiologicalMedision, 6(3), 273-294. ) ( Herpin, S ., Wong, C. Y., S tanislas, M., & Soria, J. (2008). Stereoscopi c PIV measurements of aturbulent boundary layer with a large spatial dynamic range. Exp. Fluids, 45(4), 745-763. ) ( Huisman, S. G., Scharnowski, S., Cierpka, C., K ahler, C. J., Lohse, D., & Sun, C. ( 2 013).Logarithmic Boundary Layers in Strong Taylor-Couette Turbulence. Physical Review Letters,110(26),264501. ) ( Jodai, Y., Westerweel, J . , & Elsinga, G. (2014). Time-resolved Tomographic-PI V measurement inthe near-wall region o f a turbulent boundary layer. In I n ternational Symposium onApplication of Laser Techniques to Fluid Mechanics (Vol.17th). ) ( Kahler, C. J., Scharnowski, S. , & Cierpka, C. (2012). On the uncertainty of digital PIV an d PTVnear walls. E xp. Fluids, 52(6), 1641-1656. ) ( Kahler, C. J ., Scholz, U., & Ortmanns, J. ( 2006). Wall-shear-stress and near-wall t urbulencemeasurements up to single pixel resolution by means of long-distance micro-PIV. Exp. Fluids,41(2),327-341. ) ( Kasagi, N., & Nishino, K. ( 1 991). Probing t u rbulence with three-dimensional particle-trackingvelocimetry. E xperimental Thermal and Fluid Science, 4(5), 601-612. ) ( Kim, H ., Westerweel, J., & Elsinga , G. E. (2013 ) . Comparison of Tomo-PIV and 3 D-PTV formicrofluidic flows. Measurement Science and Technology, 24(2), 024007. ) ( Kim,J., Moin, P., & Moser, R. (1987). Turbulence statistics in fully developed channel flow at lowReynolds number. J. Fluid Mech.,177(-1), 133. ) ( Knopp, T . , Schanz, D . ,Schroder, A., Dumitra,M., Cierpka, C., Hain, R., & Kah l er , C. J. (2013).Experimental I nvestigation of the Log-Law f or a n A dverse Pressure Gradient T u rbulentBoundary L a yer Flow at Re O=10000.Flow, Turbulence and Combustion, 92(1-2), 451-471. ) ( Maas, H . G., Gruen, a, & Papantoniou, D . (1993). P article tracking velocimetry in 3-dimensionalflows. 1. Photogrammetric determination of partacle coordinates. Exp.Fluids, 15(2),133-146. ) ( Meinhart, C. D., Wereley, S. T ., & Santiago, J. G. (2000). A PIV Algorithm for Estimating Time-Averaged Velocity Fields. Journal of F luids Engineering, 122(2), 285. ) Moser, R. D., Kim, J., & Mansour, N. N. (1999). Direct numerical simulation of turbulent channelflow up to Rer=590. Phys.Fluids, 11(4),943. ( Navitar. (2016). 12X Zoom Performance Specifications, Navitar. Retrieved January 16, 2016. ) Novara, M., & Scarano, F. (2013). A particle-tracking approach for accurate material derivativemeasurements with tomographic PIV This article is part of the Topical Collection onApplication of Laser Techniques to Fluid Mechanics 2012. Exp. Fluids, 54(8). Oliveira, J. L. G., van der Geld, C. W. M., & Kuerten, J. G. M. (2013). Lagrangian and EulerianStatistics of Pipe Flows Measured with 3D-PTV at Moderate and High Reynolds Numbers.Flow, Turbulence and Combustion, 91(1), 105-137. Scarano, F. (2013). Tomographic PIV: principles and practice. Measurement Science andTechnology, 24(1), 012001. Scarano, F.,& Riethmuller, M. L. (2000). Advances in iterative multigrid PIV image processing.Exp. Fluids,29(7), S051-S060. Schafer, L., Dierksheide, U., Klaas, M., & Schroder, W. (2011). Investigation of dissipationelements in a fully developed turbulent channel flow by tomographic particle-imagevelocimetry. Phys. Fluids,23(3),035106. Scharnowski, S., Hain, R., & Kahler, C. J. (2011). Reynolds stress estimation up to single-pixelresolution using PIV-measurements. Exp.Fluids, 52(4), 985-1002. Schroder, A., Geisler, R., Elsinga, G. E., Scarano, F.,& Dierksheide, U. (2008). Investigation of aturbulent spot and a tripped turbulent boundary layer flow using time-resolved tomographicPIV. Exp. Fluids, 44(2),305-316. Schroder, A., Geisler, R., Staack, K. E. A. A., Elsinga, G. E., Scarano, F., Wieneke, B., ...&Westerweel, J. (2011). Eulerian and Lagrangian views of a turbulent boundary layer flowusing time-resolved tomographic PIV. Exp. Fluids, 50(4), 1071-1091. Schroder, A., Schanz, D., Michaelis, D., Cierpka, C., Scharnowski, S., & Kahler, C. J. (2015).Advances of PIV and 4D-PTV "Shake-The-Box" for Turbulent Flow Analysis -the Flow overPeriodic Hills. Flow, Turbulence and Combustion, 95(2-3), 193-209. Stanislas, M., Perret, L., & Foucaut, J.-M. (2008). Vortical structures in the turbulent boundarylayer: a possible route to a universal representation. J. Fluid Mech., 602, 327-382. Theunissen, R., Scarano, F., & Riethmuller, M. L. (2008). On improvement of PIV imageinterrogation near stationary interfaces. Exp.Fluids, 45(4),557-572. Walpot, R. J. E., van der Geld, C. W. M., & Kuerten, J. G. M. (2007). Determination of thecoefficients of Langevin models for inhomogeneous turbulent flows by three-dimensionalparticle tracking velocimetry and direct numerical simulation. Phys. Fluids, 19(4), 045102. Westerweel, J. (1993). Digital particle image velocimetry: theory and application. PhD thesis,Delft University of Technology. Westerweel, J., & Scarano, F. (2005). Universal outlier detection for PIV data. Experiments inFluids, 39(6), 1096-1100. Wieneke, B. (2008). Volume self-calibration for 3D particle image velocimetry. Exp.Fluids, 45(4),549-556. ( Wieneke, B. (2013). I terative reconstruction of volumetric p article distribution. MeasurementScience and Technology. ) ( Y oung, I . , Z agers, R., V liet, L. J. van, Mullikin, J. , Boddeke, F., &Netten, H. (1993). D e pth-of-focus in microscopy. In Proc. of the 8th Scandinavian Conference on Ima g e Analysis. Tromso, Norway. ) Measurement of turbulent statistics in the inner layer of wall flows is of fundamental and applied importance for development of passive and active flow control systems A ccuracy of two and three dimensional particle image velocimetry ( and particle tracking velocimetry ( in resolving the near wall turbulen ce statistics of a channel flow is evaluated at Reynolds number of Re H 6700 (based on average velocity and channel height H equivalent to Re τ 190 (based on friction velocity u τ 0.0638 m/s and the half channel height, H 2). The channel has a rectangular cross section of W × H 40×6 mm 2 and wall unit of λ 16.2 μm. The evaluated 2D techniques include PIV (2D PIV) with spatial resolution of 3.2 ××3.2 (digital resolution of 6. 2 5 μm/pix) and long range microscopic particle tracking velocimetry(2D PTV) with spatial resolution of 1.7 ××1.7 (digital resolution of 2.3 μm/pix). The 3D techniques include tomographic particle image velocimetry (tomo PIV) and three dimensional PTV (3D PTV) both carried out at high digital resolution of 7.5 μm/voxel (M 0.9) and tracer density of 0.015 particles per pixel. The spatial resolution of the t omo PIV is 22 × 22 × 22 (0.36 × 0.36 × 0.36 mm 3 and wall normal spati al resolution of 3D PTV is 5.5 (90 μm) The measurements are compared with channel flow direct numerical simulation ( of Moser et al ( at Re τ 180. The 2D PTV technique shows maximum uncertainty of 0.06 pix in resolving mean velocity and 0.1 pixel uncertainties in measurement of Reynolds stresses. The high magni fication tomo PIV shows an uncertainty of 0.2 pix in resolving the mean velocitywhile an uncertainty of 0.3 0.7 pixel in measuring peak value of Reynolds stresses. 3D PTV based on triangulation of particles demonstrated smaller uncertainty relative to tom o PIV and 3D PTV using MART reconstruction.
确定
还剩15页未读,是否继续阅读?

产品配置单


北京欧兰科技发展有限公司为您提供《近壁湍流中2维3维速度矢量场检测方案(CCD相机)》,该方案主要用于其他中2维3维速度矢量场检测,参考标准--,《近壁湍流中2维3维速度矢量场检测方案(CCD相机)》用到的仪器有德国LaVision PIV/PLIF粒子成像测速场仪、LaVision DaVis 智能成像软件平台
推荐专场


相关方案
更多
该厂商其他方案
更多