


有许多技术可用于分析亚可见颗粒 - 颗粒表征是许多工艺的关键组成部分。 在注射制剂中,流动成像粒子分析可以帮助您优化蛋白质聚集体的检测。
阅读流动成像显微镜终极指南,您将了解到:
? 分析颗粒的方法,以及每种方法的优势和缺点。
? FIM如何工作,并允许您查看样本中可能缺少的内容。
? 该技术如何帮助改善生物制剂中蛋白质,硅胶液滴和其他颗粒的表征。
方案详情

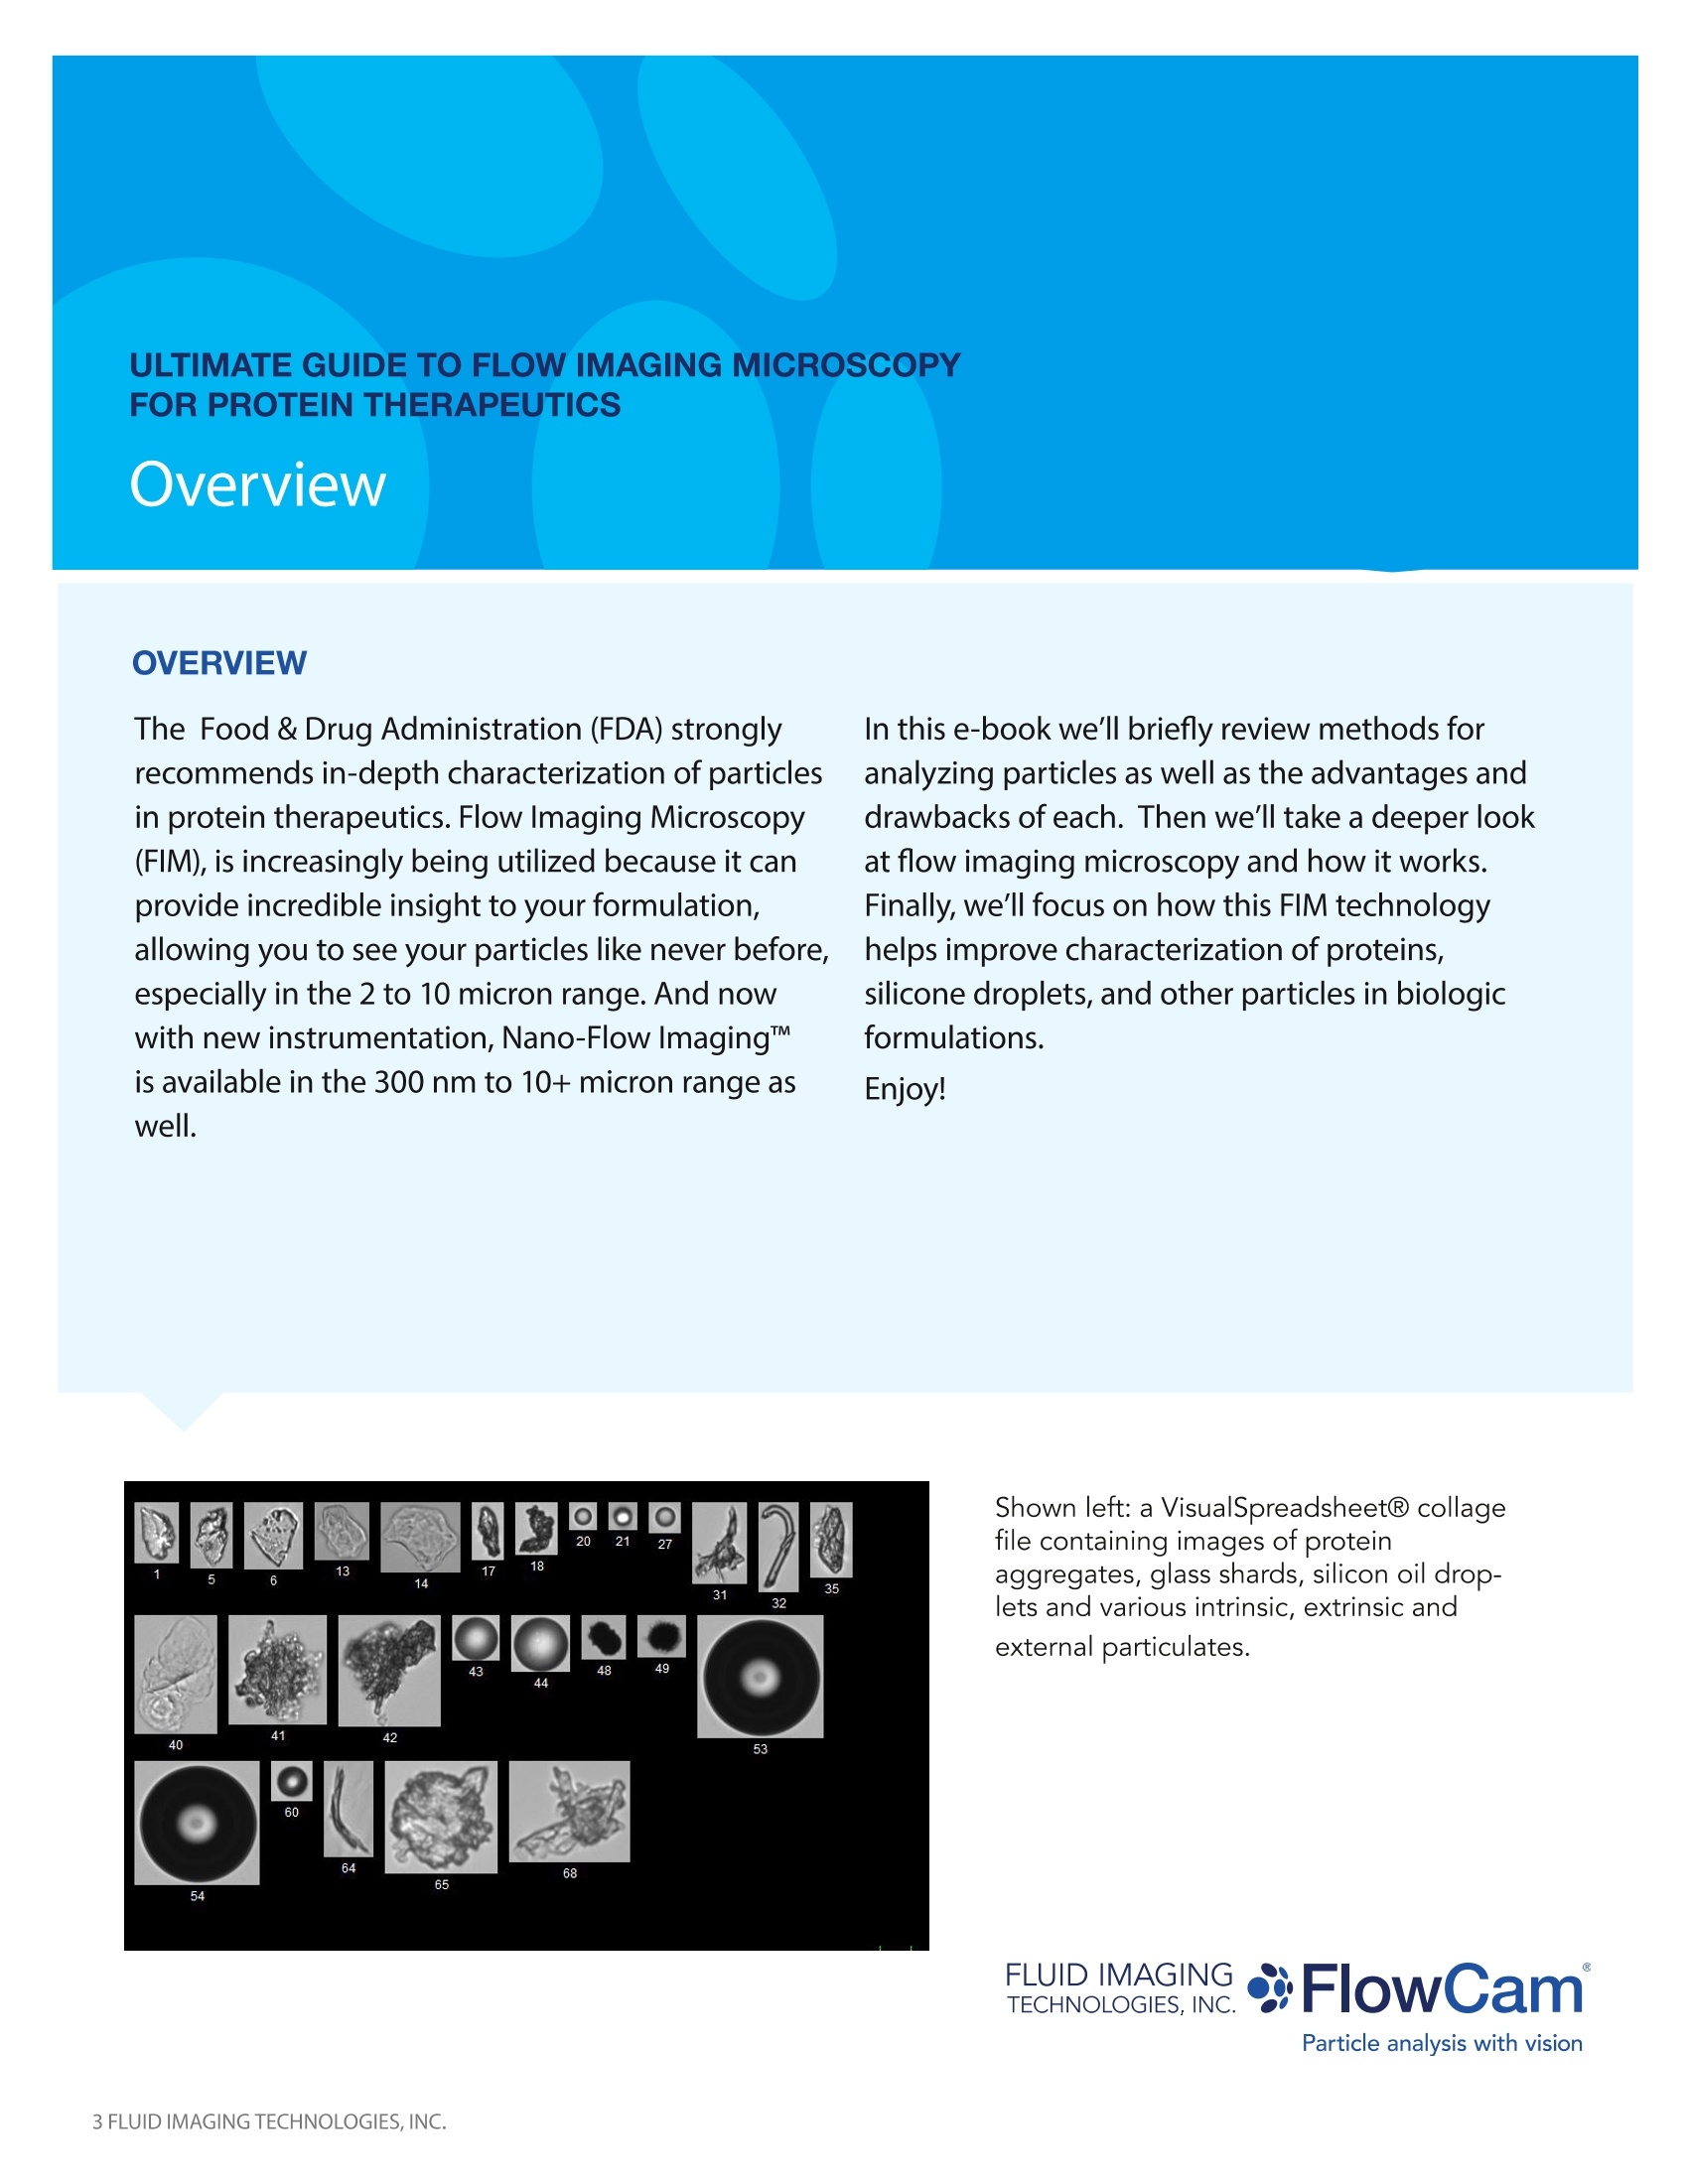
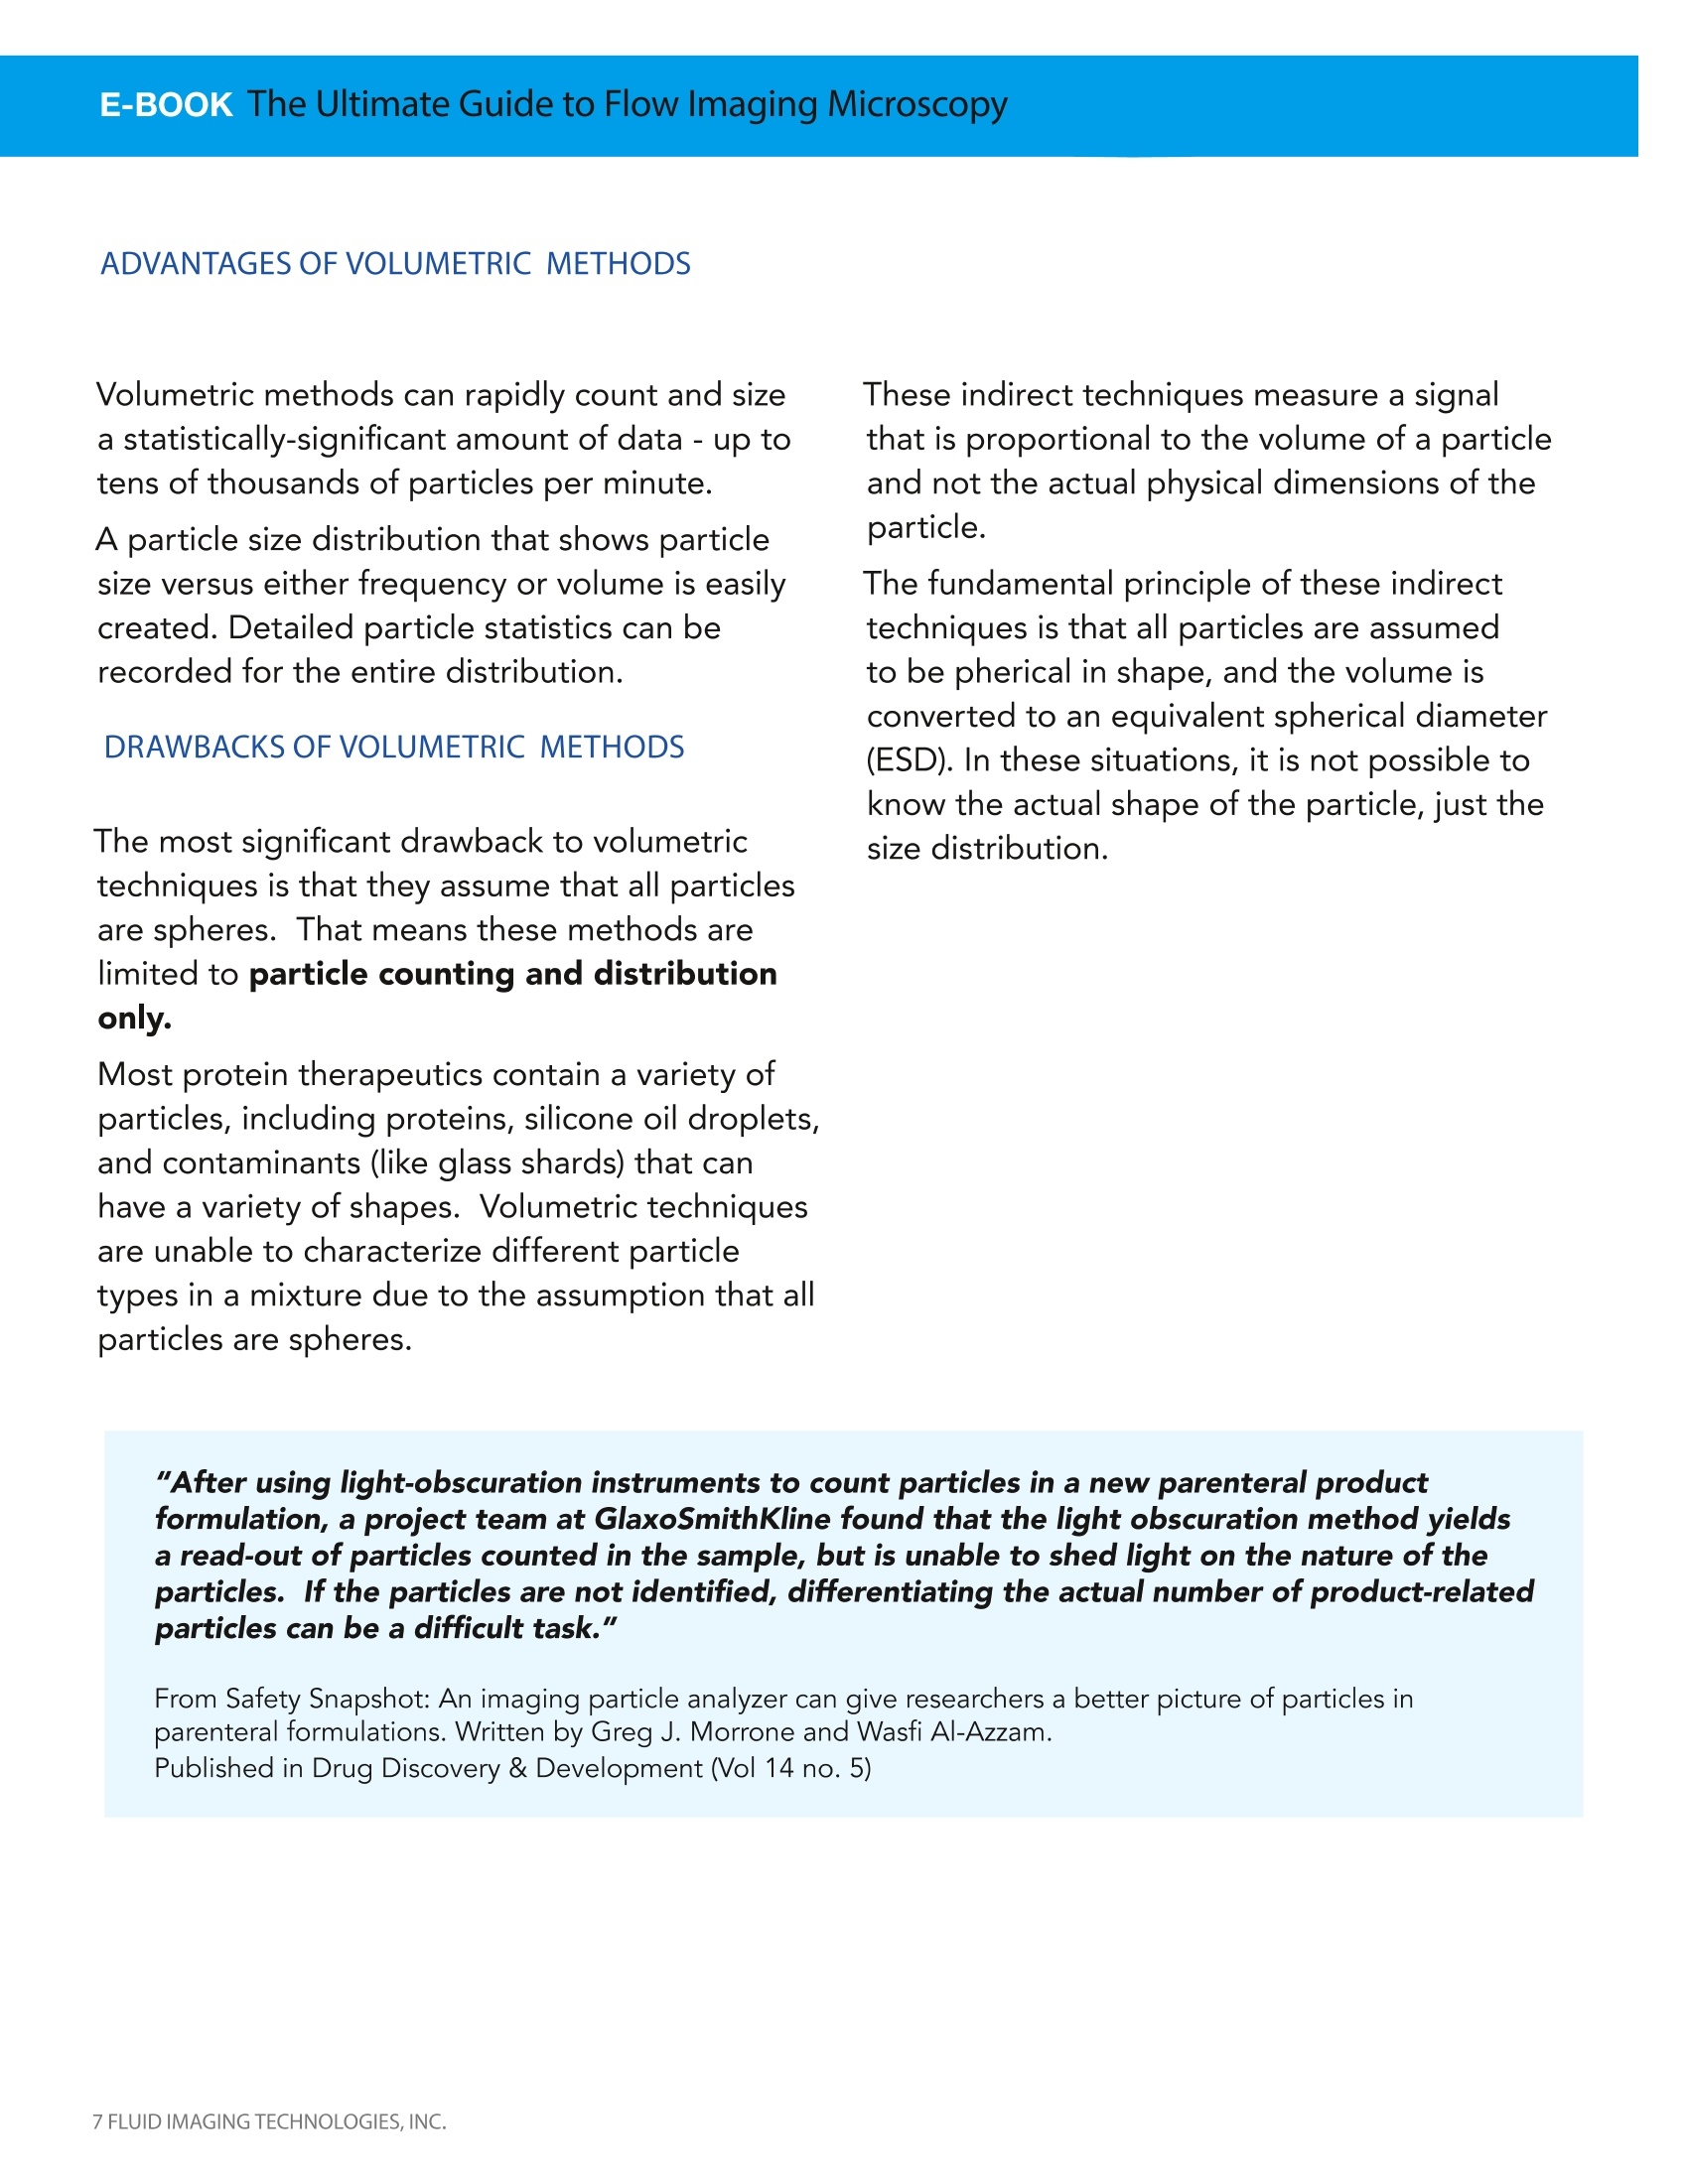
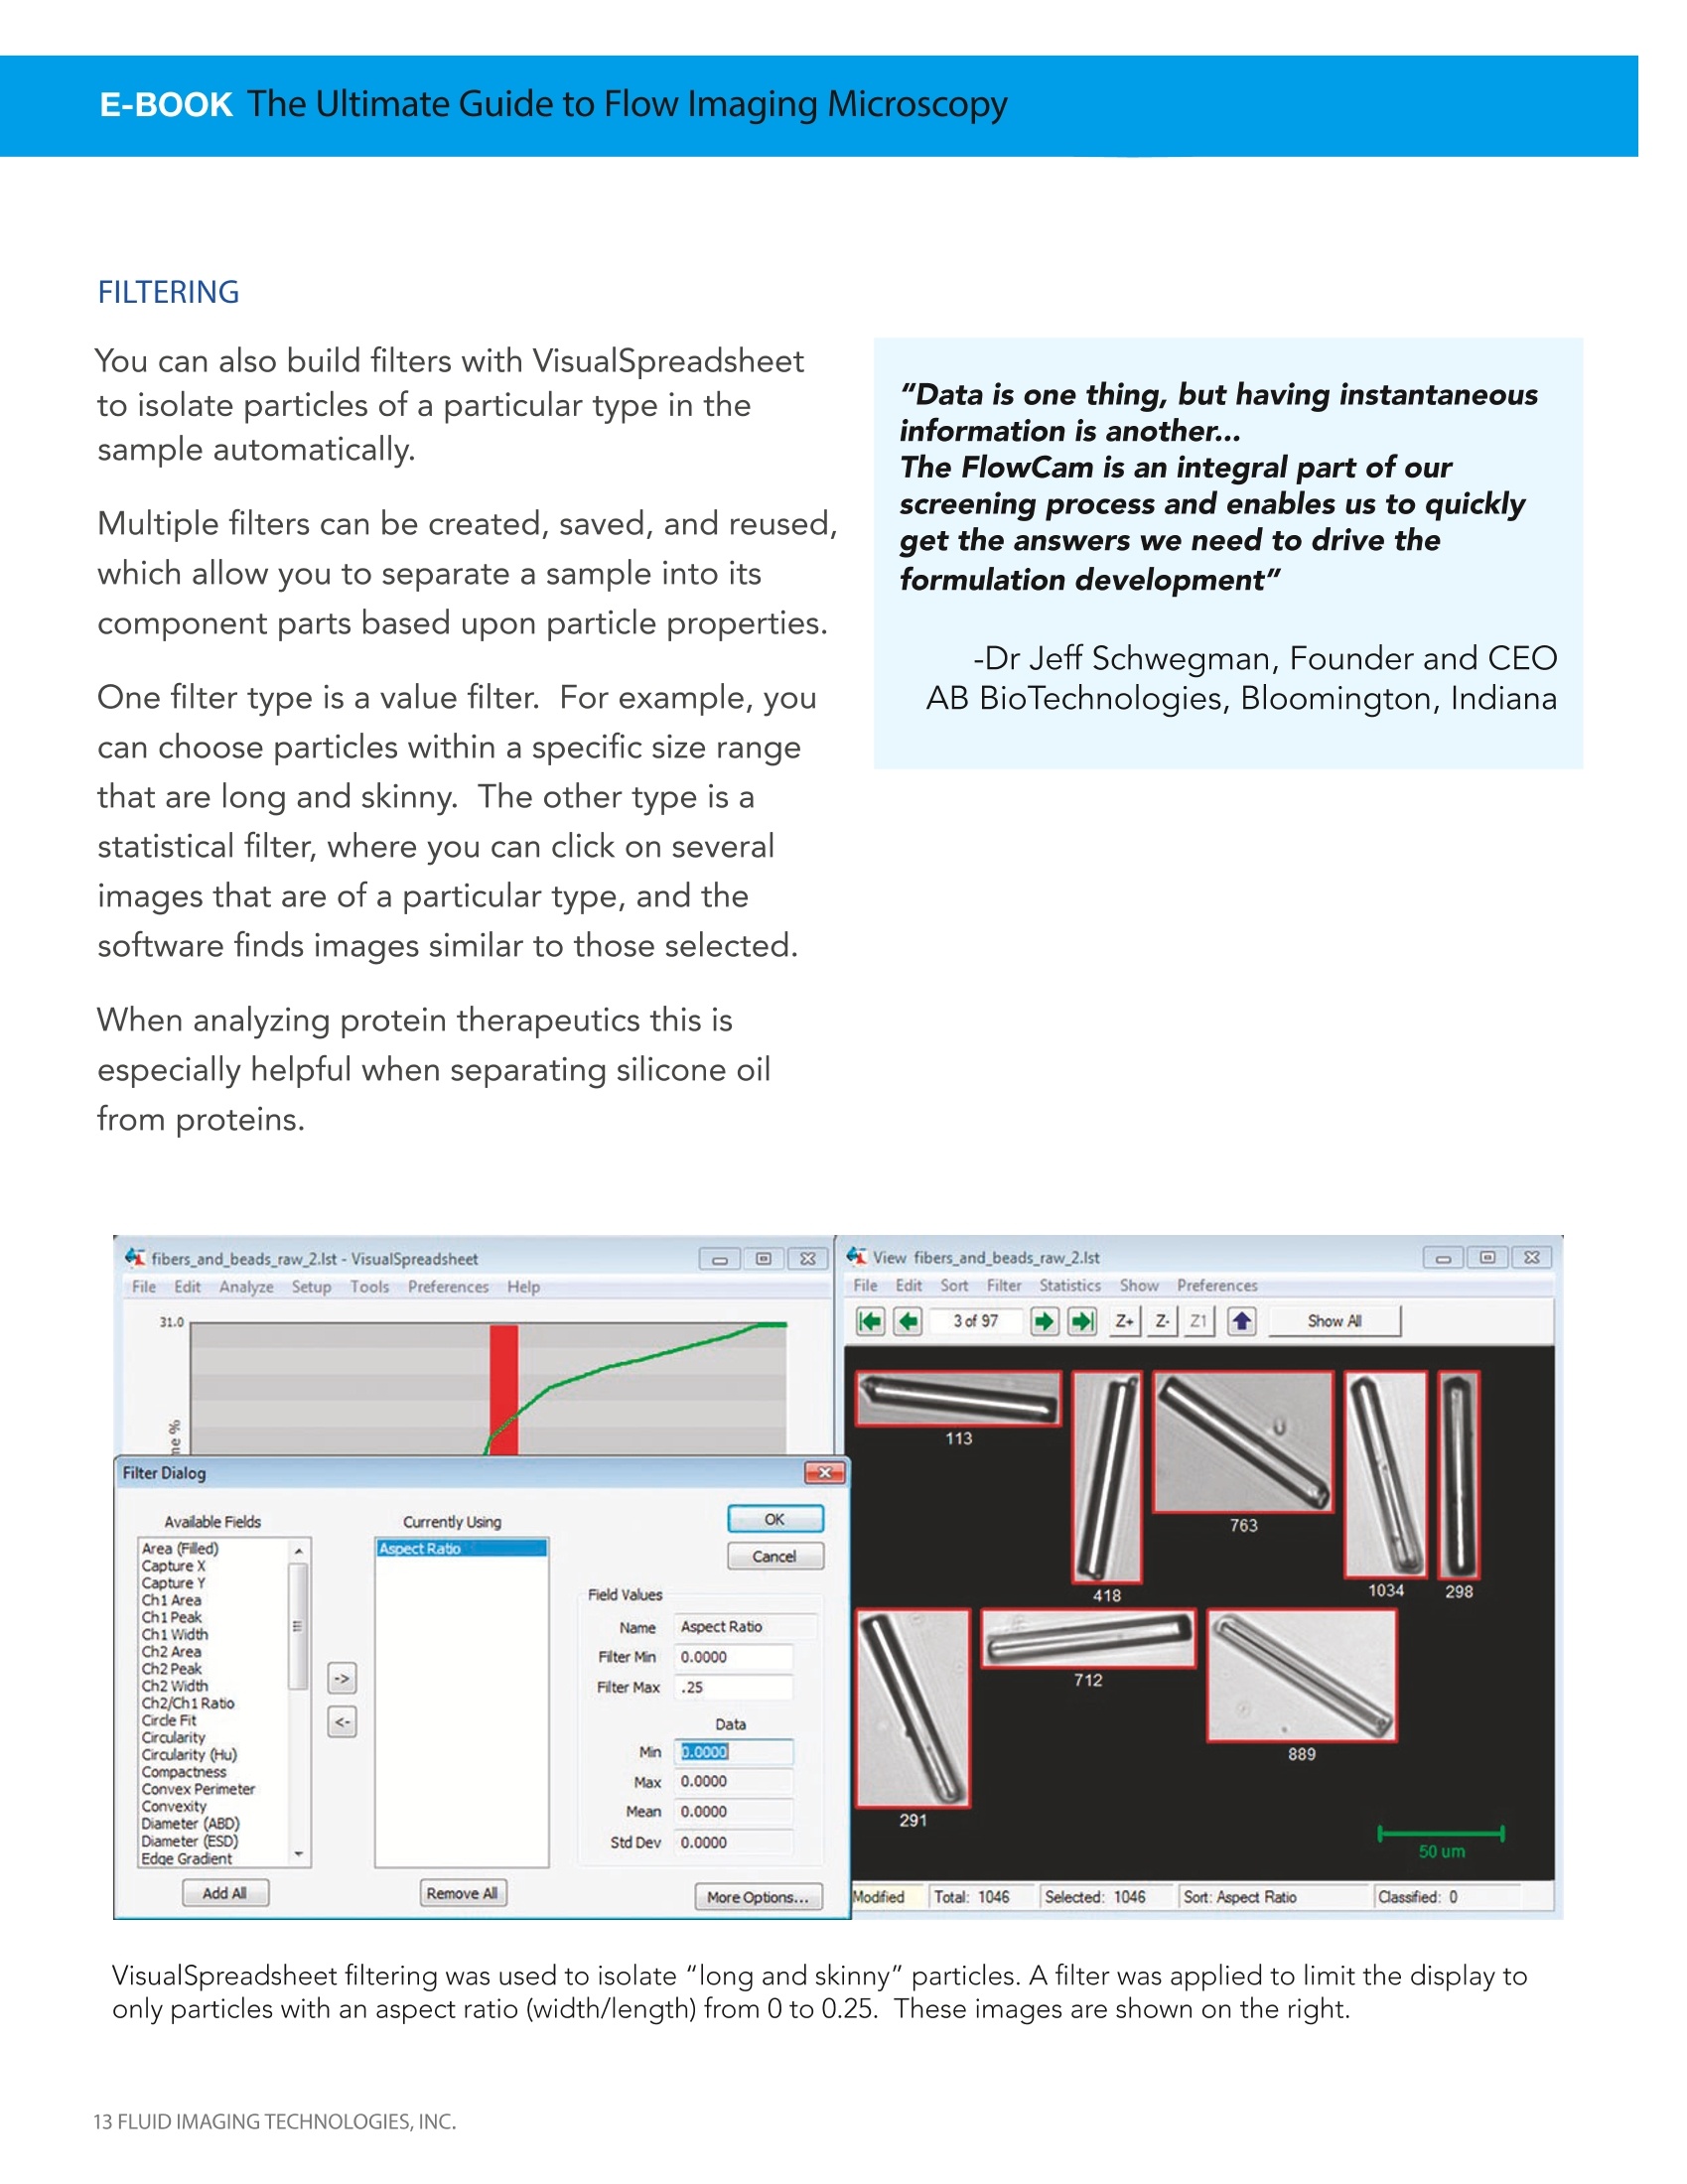
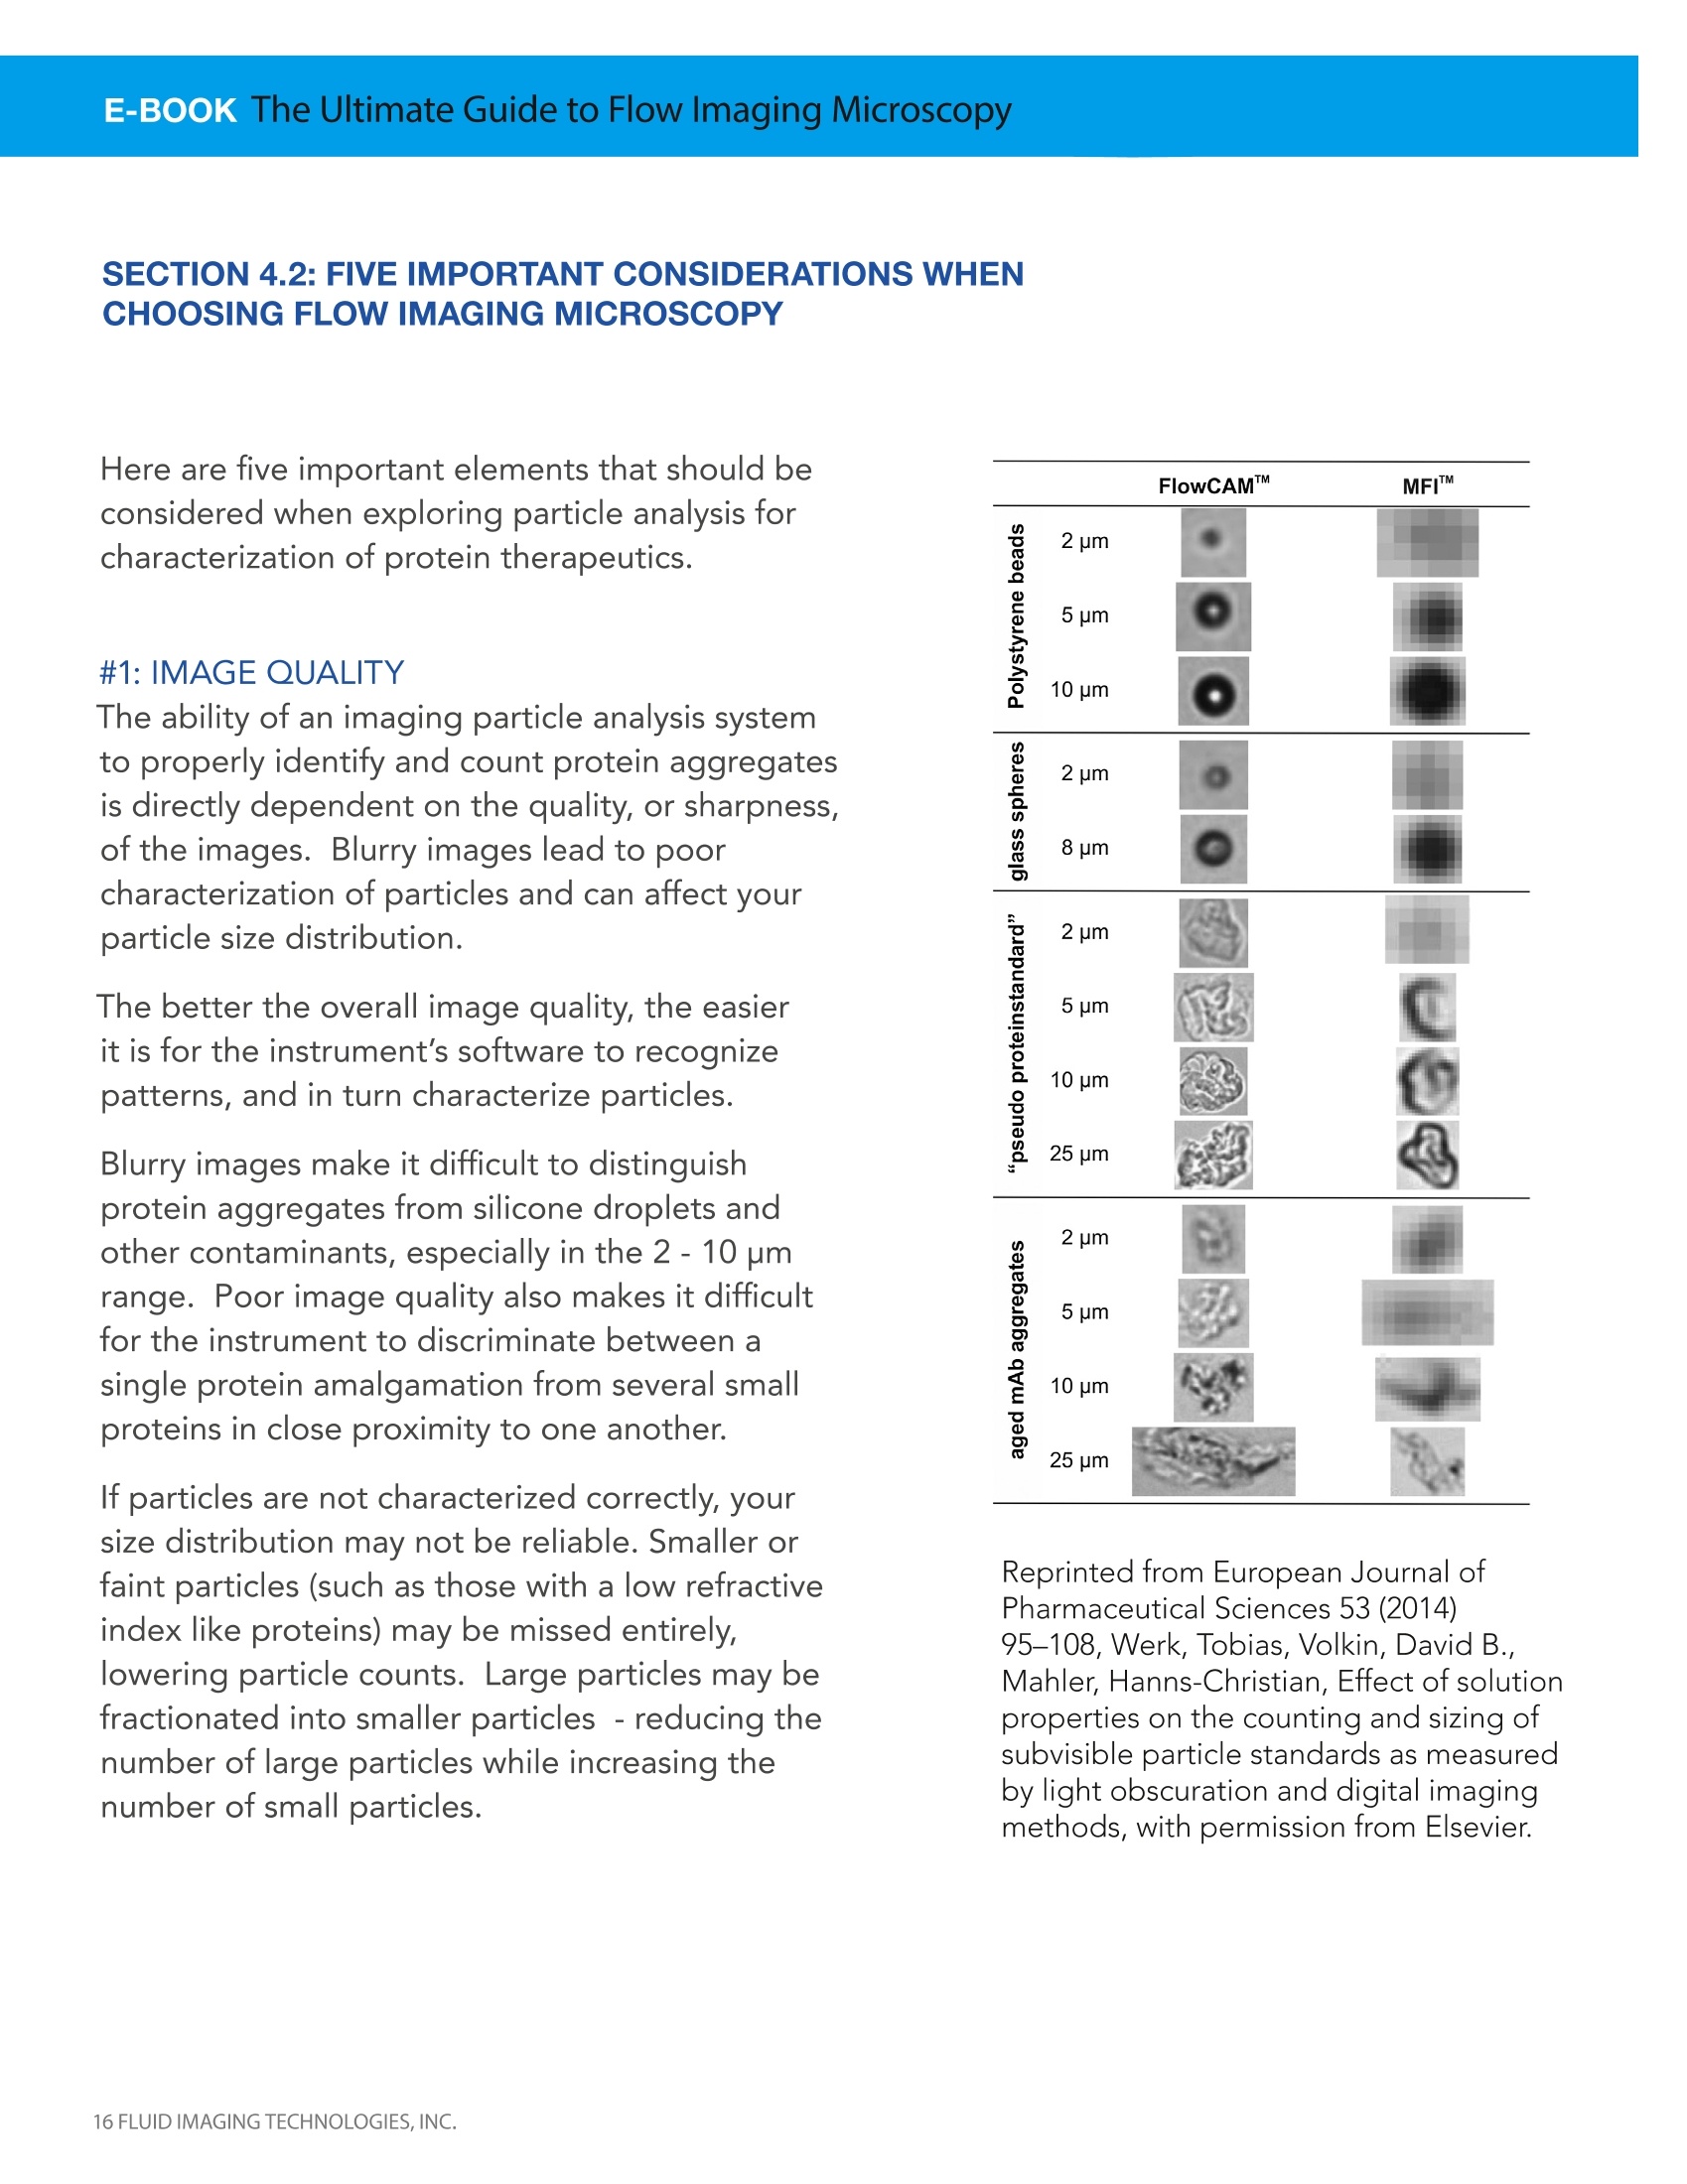
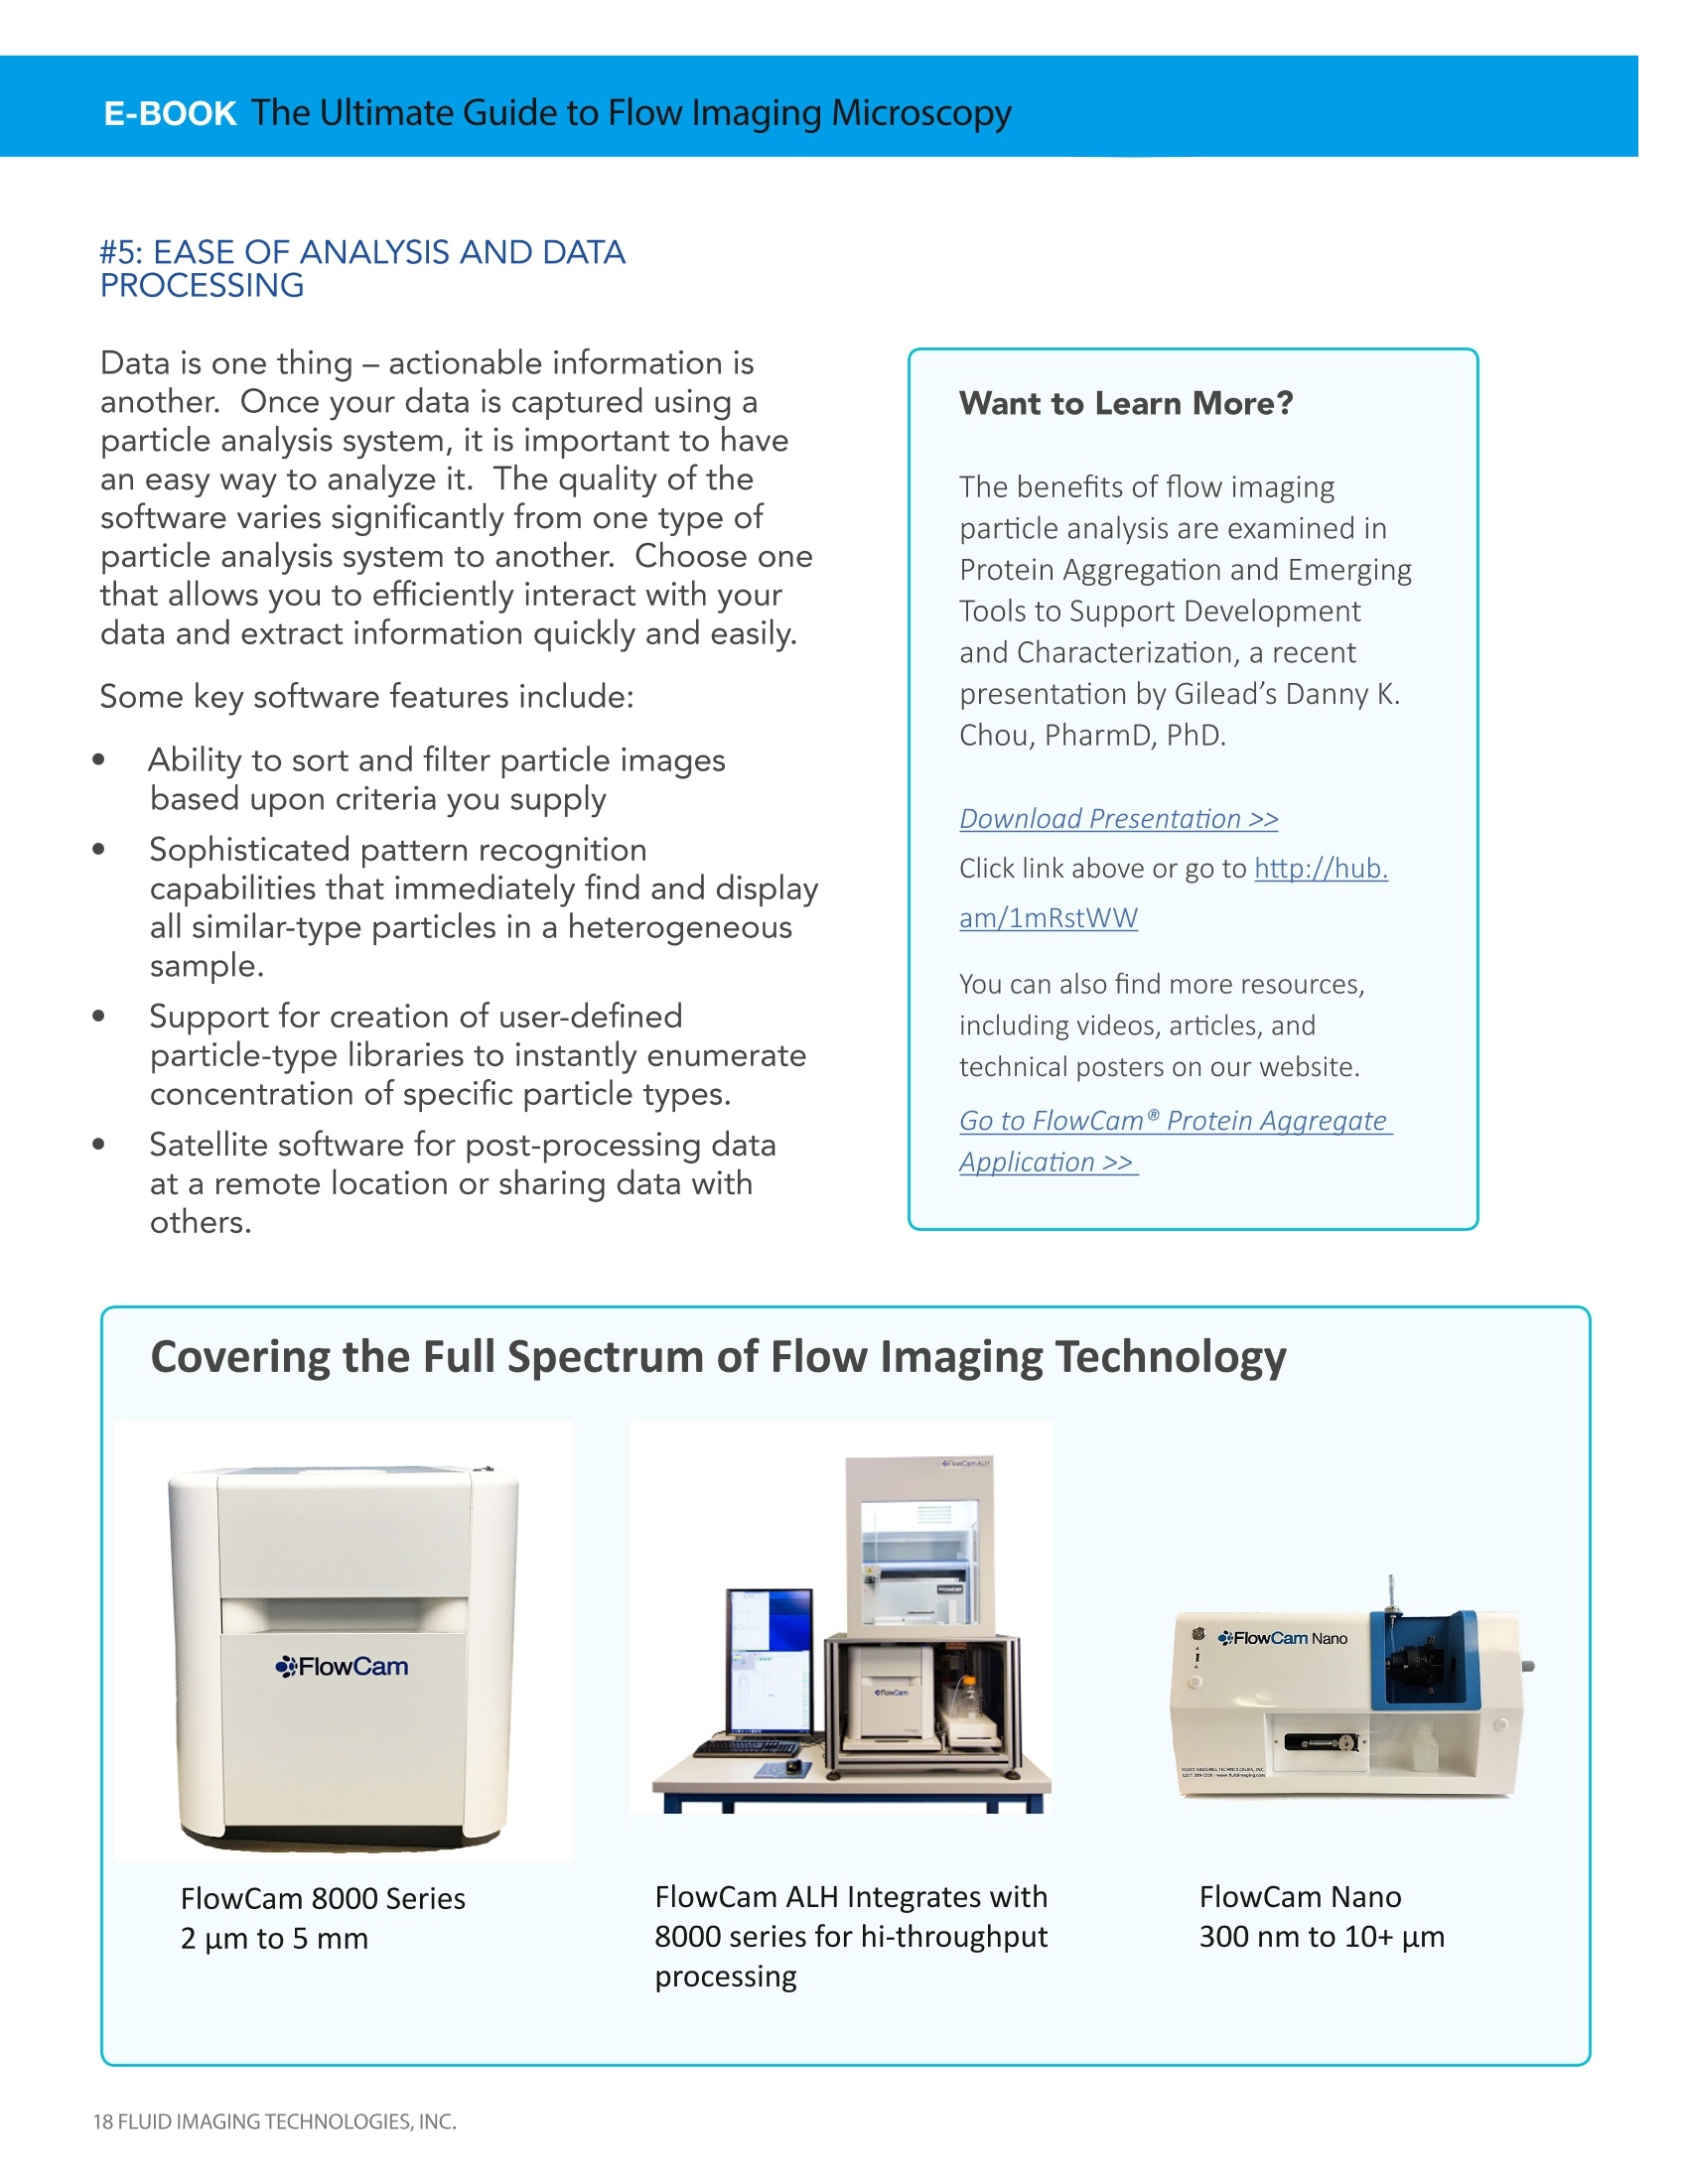
FLUID IMAGING TECHNOLOGIES E-BOOK CHAPTER ONE The Ultimate Guide toFlow Imaging Microscopyfor Protein Therapeutics FLUID IMAGINGQ :FlowTCaECHNOLOGIES,INC.m FLUID IMAGING TECHNOLOGIES Discover a Better Way to Characterize Sub-VisibleParticles in Biopharmaceuticals .CONTENTS 1. What is particle analysis?.... +e.........m i.......... 2. A History of Particle Analysis....... 5 2.1Microscopy........ .2.2 Volumetric Particle Analysis Techniques...... 2.3 Dynamic Imaging Particle Analysis (DIPA).. 8 3. A Closer Look at Dynamic Imaging Particle Analysis..... .10 3.1 How DIPA Works ........ .10 3.2 Direct Particle Measurements. .11 3.3 Data Processing: Sorting & Filtering. 12 4. Characterizing Particles in Protein Therapeutics with DIPA .14 4.1 USP <788> and New FDA Regulations .000 14 4.2 Therapeutic Protein Data Analysis . 16 4.3 Five Important Considerations When Choosing DIPA...........117 ULTIMATE GUIDE TO FLOW IMAGING MICROSCOPYFOR PROTEIN THERAPEUTICS Overview The Food & Drug Administration (FDA) stronglyrecommends in-depth characterization of particlesin protein therapeutics. Flow Imaging Microscopy(FIM), is increasingly being utilized because it canprovide incredible insight to your formulation,allowing you to see your particles like never before,especially in the 2 to 10 micron range. And nowwith new instrumentation, Nano-Flow ImagingTMis available in the 300 nm to 10+ micron range aswell. In this e-book we'll briefly review methods foranalyzing particles as well as the advantages anddrawbacks of each. Then we'll take a deeper lookat flow imaging microscopy and how it works.Finally, we'll focus on how this FIM technologyhelps improve characterization of proteins,silicone droplets, and other particles in biologicformulations. Enjoy! What is Particle Analysis? Sample analysis involves looking at arepresentative portion of a substance (particle)and separating it into its component parts(analysis). The basic goal is to determine theconstituents of a mixture. Typical measurements of particles that are ofinterest to scientists and protein formulationdevelopers include: ● Particle size distribution Particle count Particle shape Particle concentration For simplicity, results of a particle analysis aretypically reported graphically, with particle sizeplotted against some other variable. Particlesize is often stated as equivalent sphericaldiameter (ESD), which is an estimated valuebased on the volume of the particle. While seemingly straightforward for particlesize, when shape and/or morphological data isneeded, a more in-depth analysis is required totruly characterize a particle. A standard particle distribution graph is often plottedas a bell curve. In this graph, the particles are shown byestimated size (ESD) -While estimated size distribution isconsidered valuable data, it only tells part of the story. A History of Particle Analysis The introduction of the microscope in the 1600'schanged the world for scientists. For the firsttime, they could observe and record organismstoo small to see with the naked eye. To this day, microscopy remains the mostcommon method for subvisible particle analysis. Scientist Vanessa von Biela of the USGS Alaska ScienceCenter studies the ear bones or“otoliths”of near shorefish to determine their growth rates and age. Source: https://picasaweb.google. com/115190542861442884983 ADVANTAGES OF MANUAL MICROSCOPY The benefit of microscoes is simple. It allowsyou to study sub-visible particles in great detailunder a wide range of magnifications. Microscopes have improved over time allowingus to look at increasingly smaller particles, evendown to the molecular level. DRAWBACKS OF MANUAL MICROSCOPY Using microscopes for particle analysis is timeconsuming. Depending on the sample, it cantake hours to prepare the sample, set up theslides, and measure any particles found. It's difficult to get results that are statisticallysignificant using a microscope. You can onlyprocess one small sample at a time, so it'sdifficult, if not impossible, to know if whatyou're looking at is representative of the whole. Human factors must also be considered usingmicroscopy. Tired eyes, interruptions, and timeof day can all have an effect on the operator,and therefore the results. "Comparing indivudual particle shape usinga microscope is cumbersome and slow.It's difficult to see more than a handful ofparticles, and certainly not enough to get astatistically sample." -Ross Clark, Distinguished Research Fellowat CP Kelso, a leading producer of specialtyhydrocolliods SECTION 2.2: VOLUMETRIC PARTICLEANALYSIS TECHNIQUES In response to the need for rapid processing ofparticle data, a variety of volumetric techniqueshave been developed. Volumetric particleanalysis methods include: Coulter Counters Light Obscuration Laser Diffraction ● Light Scattering These indirect techniques measure a signalthat is proportional to the volume of a particleand not the actual physical dimensions of theparticle. The fundamental principle of these indirecttechniques is that all particles are assumedto be pherical in shape, and the volume isconverted to an equivalent spherical diameter(ESD). In these situations, it is not possible toknow the actual shape of the particle, just thesize distribution. The tip of the Coulter counter in a buffersolution, counting cells in solution. From cancer.gov http://visualsonline.cancer.gov/details.cfm?imageid=2714. Volumetric methods can rapidly count and sizea statistically-significant amount of data - up totens of thousands of particles per minute. A particle size distribution that shows particlesize versus either frequency or volume is easilycreated. Detailed particle statistics can berecorded for the entire distribution. DRAWBACKS OF VOLUMETRIC METHODS The most significant drawback to volumetrictechniques is that they assume that all particlesare spheres. That means these methods arelimited to particle counting and distributiononly. Most protein therapeutics contain a variety ofparticles, including proteins, silicone oil droplets,and contaminants (like glass shards) that canhave a variety of shapes. Volumetric techniquesare unable to characterize different particletypes in a mixture due to the assumption that allparticles are spheres. These indirect techniques measure a signalthat is proportional to the volume of a particleand not the actual physical dimensions of theparticle. The fundamental principle of these indirecttechniques is that all particles are assumedto be pherical in shape, and the volume isconverted to an equivalent spherical diameter(ESD). In these situations, it is not possible toknow the actual shape of the particle, just thesize distribution. "After using light-obscuration instruments to count particles in a new parenteral productformulation, a project team at GlaxoSmithKline found that the light obscuration method yieldsa read-out of particles counted in the sample,but is unable to shed light on the nature of theparticles. If the particles are not identified, differentiating the actual number of product-relatedparticles can be a difficult task." From Safety Snapshot: An imaging particle analyzer can give researchers a better picture of particles inparenteral formulations. Written by Greg J. Morrone and Wasfi Al-Azzam. Published in Drug Discovery & Development (Vol 14 no. 5) SECTION 2.3: FLOW IMAGING MICROSCOPY A flow imaging particle analyzer performs thefollowing three functions all in one instrument: ● Examines a fluid under a microscope software also provides sophisticated post-processing of data to give you a more in-depth analysis of your sample and a betterunderstanding of your data. Takes digital images of the magnifiedparticles within the fluid stream Characterizes the particles using a variety ofmeasurements ADVANTAGES OF FLOW IMAGING MICROSCOPY FIM combines the benefits of manual microscopy with those of volumetric techniques.Microscopic particle measurements are takenfrom images quickly enough to producestatistically significant results. Additionally,many different measurements are taken foreach particle, thereby providing the detailedinformation often needed for a thoroughparticle analysis. The addition of specialized “Image quality is extremely important when characterizing protein aggregates.We need to be able to differentiate them from silicone oil and other contami-nants in drug formulations early in the process. The FlowCam allows us to dothis quickly and easily." -Dr. Jeff Schwegman, Founder and CEO, AB BioTechnologies,Bloomington, IN Dan Berdovich uses the FlowCamparticle analysis system at his contractlaboratory- Micro MeasurementLaboratories, Inc. where he leads ateam that specializes in particulatematter testing, particle identification,method validation, and visualinspection standards developmentfor pharmaceutical and biotechnologycompanies worldwide. LIMITATIONS OF FLOW IMAGINGMICROSCOPY The ability of an imaging system to resolvedetails in a particle is essential for accuratemeasurement. The optical system and thesensor of the instrument affect its ability to sizeand characterize sub-visible particles. Because of this, counting should be limited toparticles having an ESD of 1 pm and greater,and particle characterization (i.e. shape) shouldbe limited to particles having an ESD of 300 nmand greater. It is important to optimize the settings on thesetypes of instruments specifically for the sampleyou are analyzing to ensure accurate results. “You can get more information from theFlowCam than from any other type ofinstrument. Going to the FlowCam with aparticle problem is just the best feeling inthe world because it turns data into usefulinformation that you can use to solve a realproblem." -Dan Berdovich,Owner ofMicromeasurement Laboratories, Inc. A Closer Look at Flow Imaging Microscopy SECTION 3.1: HOW FLOW IMAGINGMICROSCOPY WORKS Flow imaging microscopy uses digital imagesto measure the size and shape for each particle.Essentially, the operator in classical microscopyis replaced by a computer to extract theinformation from the images. The sample containing the particles streams bythe microscope optics in the flow cell (whichreplaces the microscope slide), and thousandsof particle images are captured per second. In order to freeze the moving particles in space,a strobed illumination source is combinedsynchronously with a very short shutter speed inthe camera. As each frame of the field of view is captured,the software, in real-time, extracts the particleimages from the background and stores them. In an imaging-based system, particlemeasurements are made directly from an imageof the particle. Since the system's optics arefixed and the magnification is known, distancemeasurements on the image can be directlyconverted to real distance measurements on theobject. No assumptions are made about a particle'sshape, while multiple measurements are madefor each particle. Plus,you can view the image,to ensure that the data is being properlyinterpreted. COMMON MEASUREMENTS INCLUDE: Equivalent spherical diameter (ESD) Length, width, and aspect ratio Area and volume Circularity and elongation Edge gradient Intensity, average intensity, andsigma intensity Iransparency FlowCam screen during image capture. Upper right window is full field-of-view of camera on the flowcell. Red boxes indicate particles found. Lower right window is the 'collage window’of particle imagesthat are saved and stored. Main window (left side) shows particle measurements summary graph andstatistics saved. SECTION 3.3: DATA PROCESSING-SORTINGAND FILTERING SORTING The FlowCam system includes VisualSpreadsheetsoftware, which provides the ability to sortand filter your data based on any of themeasurements (or combination of measurements)acquired for the particles. The results aredisplayed as particle images as well as in a tabulartormat. You can interact with the scattergram created toquickly select particles of interest from any of theconfigurable graphs. VisualSpreadsheet interactive scattergram feature: only the largest particles have been selected from the histogram in theleft window (red). The right window displays those particles, revealing that they are aggregates rather than large, singleparticles. You can also build filters with VisualSpreadsheetto isolate particles of a particular type in thesample automatically. "Data is one thing, but having instantaneous Multiple filters can be created, saved, and reused,which allow you to separate a sample into itscomponent parts based upon particle properties. information is another...The FlowCam is an integral part of ourscreening process and enables us to quicklyget the answers we need to drive theformulation development" -Dr Jeff Schwegman, Founder and CEOAB BioTechnologies, Bloomington, Indiana One filter type is a value filter. For example, youcan choose particles within a specific size rangethat are long and skinny. The other type is astatistical filter, where you can click on severalimages that are of a particular type, and thesoftware finds images similar to those selected. When analyzing protein therapeutics this isespecially helpful when separating silicone oiltrom proteins. VisualSpreadsheet filtering was used to isolate"long and skinny" particles. A filter was applied to limit the display toonly particles with an aspect ratio (width/length) from 0 to 0.25. These images are shown on the right. Characterizing Particles in Protein Therapeutics withFlow Imaging Microscopy SECTION 4.1: THE IMPORTANCE OF CHARACTERIZINGSUB-VISIBLE PARTICLES: USP <788> ANDNEW FDA RECOMMENDATIONS Particulates in parenteral drug development area serious issue. In biopharmaceuticals the issueis compounded by reported impacts of proteinaggregates and particles on the product'sefficacy, safety, and immunogenicity. Thereforestrengthening requirements for the in-depthcharacterization of the identity and quantityof particles in protein therapeutics is currentlybeing discussed throughout the industry andregulatory agencies. USP <788> Characterization of sub-visible particlesin parenterals was formally addressed byUSP <788> in 1975. At the time of itsimplementation, USP <788> was primarilyconcerned with foreign matter, such as rubberstopper pieces, and glass shards that might notbe distributed through the blood system easily. USP <788> states that sub-visible particlesabove 10 and 25 microns must be monitoredand reported. While the compendial methodsare light obscuration and microscopy, aspreviously mentioned in Chapter 2, both ofthese methods have limitations that may impactyour results. Using flow imaging microscopy as anorthogonal method can help you establish thevalidity of your primary method (more on this insection 2). NEW RECOMMENDATIONS FROM THE FDA Based on increasing awareness of issues thatmay arise from particles smaller than whatUSP <788> currently includes, the FDA is nowrequesting that sub-visible particles between 2- 10 microns be characterized to inform methoddevelopment and selection, risk assessment,and specification setting. This includescharacterizing the particle's shape, type (i.e.protein,silicone oil,etc), and size distribution.Providing particle images is also suggested. Flow imaging microscopy is uniquely suited toaddress these new recommendations. “With the FlowCam, the testing processis a whole lot easier, quicker, and moreinformative, in some ways, than the USP<788> testing. It's a question of taking 15minutes compared to takign the better partof a day. This provides an estimated 10-fold savings in laboratory costs for ProteinSciences." -David Rhodes, Formulation and Analytical DevGroup, Protein Sciences, Meridian CT SECTION 4.2:THERAPEUTIC PROTEIN DATAANALYSIS Since flow imaging microscopy characterizesparticles based on size and shape, you caneasily differentiate between protein aggregatesand silicone droplets. All the particles arecaptured as images and saved, so the resultscan be examined visually to ensure accuracy. In this example, a parenteral formulation sampleis analyzed by the FlowCam. Basic particlefilters are created for particles greater than 10um and greater than 25 um. The below results show particles greater than 10um - a total of 382 particles were found. Whenlooking at the images, it is apparent that manyof these particles are actually silicone droplets.Silicone droplets are introduced during thefilling process, but are not harmful, so they are allowable. Using VisualSpreadsheetQ, silicone dropletswere isolated and eliminated from the analysisto determine a realistic number of proteinaggregates. Out of 382 particles originally detected, 195were found to be silicone droplets, leaving 187protein aggregates. This significant reductionis important because it could have been thedifference between whether the batch wasaccepted or rejected in quality control. Here are five important elements that should beconsidered when exploring particle analysis forcharacterization of protein therapeutics. #1: IMAGE QUALITY The ability of an imaging particle analysis systemto properly identify and count protein aggregatesis directly dependent on the quality,or sharpness,of the images. Blurry images lead to poorcharacterization of particles and can affect yourparticle size distribution. The better the overall image quality, the easierit is for the instrument's software to recognizepatterns, and in turn characterize particles. Blurry images make it difficult to distinguishprotein aggregates from silicone droplets andother contaminants, especially in the 2 - 10 umrange. Poor image quality also makes it difficultfor the instrument to discriminate between asingle protein amalgamation from several smallproteins in close proximity to one another. If particles are not characterized correctly, yoursize distribution may not be reliable. Smaller orfaint particles (such as those with a low refractiveindex like proteins) may be missed entirely,lowering particle counts. Large particles may befractionated into smaller particles - reducing thenumber of large particles while increasing thenumber of small particles. Reprinted from European Journal ofPharmaceutical Sciences 53 (2014)95-108, Werk, Tobias, Volkin, David B.Mahler, Hanns-Christian, Effect of solutionproperties on the counting and sizing ofsubvisible particle standards as measuredby light obscuration and digital imagingmethods, with permission from Elsevier. Not all formulations are alike- particles varysignificantly from one formulation to another.Depending on the formulation, these differencesmay necessitate a modification to the imagecapture settings to ensure proper measurement.It is important to choose a system that can beconfigured to suit the specific formulation youare testing and achieve optimum results. Thisis especially true if your formulations containstabilizers, which can affect the refractive index ofthe matrix. Also, if a wide range of particles sizes is expected,an instrument may need to support multiplemagnifications. For example, the FlowCamQ8000 provides interchangeable 2X, 4X, 10X, and20X objectives, and can utilize both disposableflow cells and fixed field of view flow cells in avariety of sizes. #3: INSTRUMENT SENSITIVITY Many protein aggregates are translucent.Thiscan make them difficult to detect with any particleanalyzer because their refractive index is close tothe matrix in which they are suspended. In some systems, simple darker-only thresholdingis used, which may cause transparentaggregates to be cut into smaller particlepieces or go undetected. This results inincorrect measurements and incorrect count orconcentration calculations. Having the ability to threshold on either darkerpixels (relative to the background), lighter pixelsor both simultaneously can ensure the propercharacterization of protein aggregates, especially when working with high concentration for-mulations or those with a large amount ofstabilizer. Learn more in our poster,The Importance of Thresholding inImaging Analysis of Protein Aqgregates >>Click link above or go to http://hub.am/1oJ46Yy Protein aggregates imaged by FlowCam #4: SAMPLE VOLUME REQUIRED Since drug formulations can be expensiveand in short supply, it is crucial to knowwhat is the minimum sample volumerequired by your imaging particle analyzer.It is also important to understand howmuch sample will be needed (if any) toprime the system prior to measurement.Minimum sample volumes differ betweentypes of imaging particle analyzers from50 uL to 1 mL. Data is one thing- actionable information isanother. Once your data is captured using aparticle analysis system, it is important to havean easy way to analyze it. The quality of thesoftware varies significantly from one type ofparticle analysis system to another. Choose onethat allows you to efficiently interact with yourdata and extract information quickly and easily. Some key software features include: ● Ability to sort and filter particle imagesbased upon criteria you supply Sophisticated pattern recognitioncapabilities that immediately find and displayall similar-type particles in a heterogeneoussample. ● Support for creation of user-definedparticle-type libraries to instantly enumerateconcentration of specific particle types. ● Satellite software for post-processing dataat a remote location or sharing data withothers. Want to Learn More? The benefits of flow imagingparticle analysis are examined inProtein Aggregation and EmergingTools to Support Developmentand Characterization, a recentpresentation by Gilead's Danny K.Chou, PharmD, PhD. Download Presentation >> Click link above or go to http://hub.am/1mRstWW You can also find more resources,including videos, articles, andtechnical posters on our website. Go to FlowCam@ Protein AggregateApplication >> FlowCam 8000 Series2 um to 5 mm FlowCam Nano300 nm to 10+ um processing ABOUT FLUID IMAGING TECHNOLOGIES Fluid Imaging Technologies, Inc., manufactures industry-leading particle analysis instrumentation based ondigital imaging technology.Our flagship product, theFlowCamQ, is the first automated particle analysisinstrument to use digital imaging for measuring size andshape of microscopic particles in a fluid medium. With applications in marine & freshwater research,biopharmaceutical research & development, municipalwater, chemicals, oil & gas, biofuels, and many othermarkets, Fluid Imaging Technologies leads the way inimaging particle analysis. . FLUID IMAGING TECHNOLOGIES,INC. FLUID IMAGINGTECHNOLOGIES, INC. FlowCamParticle analysis with vision FLUID IMAGING TECHNOLOGIES,INC. 有许多技术可用于分析亚可见颗粒 在注射制剂中,流动成像粒子分析可以帮助您优化蛋白质聚集体的检测。阅读流动成像显微镜终极指南,您将了解到:分析颗粒的方法,以及每种方法的优势和缺点。FIM如何工作,并允许您查看样本中可能缺少的内容。该技术如何帮助改善生物制剂中蛋白质,硅胶液滴和其他颗粒的表征。
确定


还剩17页未读,是否继续阅读?

产品配置单
大昌华嘉科学仪器为您提供《蛋白质制剂中流式颗粒成像分析检测方案(图像粒度粒形)》,该方案主要用于其他中流式颗粒成像分析检测,参考标准--,《蛋白质制剂中流式颗粒成像分析检测方案(图像粒度粒形)》用到的仪器有流式颗粒成像分析系统FlowCam®8100、颗粒成像法+光阻法分析系统 FlowCam® + LO、纳米流式颗粒成像分析系统 FlowCam® Nano
推荐专场
相关方案
更多
该厂商其他方案
更多