


目的:动态成像粒子分析(DIPA)是一种较新的技术,已被证明可以更好地表征基于蛋白质的药物中的亚可见颗粒,而不是使用光阻法等传统技术。 这是因为在这些配方中发现的大多数亚可见颗粒实际上是蛋白质聚集体,它们是无定形的半透明颗粒,其可能被错误表征或甚至不被光阻法系统看到。 DIPA系统能够通过调整光强度阈值从背景中分割非常透明的粒子,创建用于所有粒子测量的二值图像,因此阈值技术的选择对于测量的有效性是至关重要的。 本文将表明,改变阈值方法可以极大地改变粒度分布,并包括对所用方法的建议。
方案详情

The Importance of Thresholding In Imaging Analysis of Protein AggregatesM1072FLUID IMAGINGLew Brown, William Bernt-Fluid Imaging Technologies, Inc. www.fluidimaging.com Abstract Purpose:Dynamic Imaging Particle Analysis (DIPA) is a newer technique thathas proved to yield better characterization of sub-visible particulates in protein-based therapeutics than found when using traditional techniques such as lightobscuration. This is due to the fact that the majority of sub-visible particulates foundin these formulations are actually protein aggregates, which are amorphous, semi-transparent particles which are either mischaracterized or not even seen by lightobscuration systems. DIPA systems are able to segment very transparent particlesfrom the background by adjusting an intensity threshold, creating a binary imagewhich is used for all particle measurements, so the choice of thresholding techniqueis critical to the validity of the measurements. This paper will show that varying thethresholding method can greatly change the particle size distribution, and includerecommendations on methodology to be used. Methods: A protein therapeutic sample was run through a DIPA instrument, with theactual camera “raw images” (full camera field of view gray-scale image of each framecollected) saved. These raw images were then processed as though they are "live data"bly the DIPA software, with different thresholding techniques used for each run of theddata. By using the same set of images for each thresholding process, we insure that anyvariation in results can only be caused by the thresholding process. Each run is thenplotted as a histogram of log frequency versu Equivalent Spherical Diameter (ESD,the most common particle size measurement). When the different runs are plottedon the same histogram, clear differences in the results are seen for each differentthresholding technique. Results: Significant differences are found in the particle size distributions based uponthe different thresholding technique used, as shown in Figure 2. Conclusions: The image thresholding technique used when analyzing proteinaggregates using Dynamic Imaging Particle Analysis (DIPA) will directly affect theresultant particle size distribution measured. An approach that involves both dark andlight thresholding, along with neighborhood analysis will result in optimal results. Purpose Dynamic Imaging Particle Analysis overcomesthe limitations of "volume-based”particleanalysis technologies such as light obscurationby combining the speed of these analyzers withthe particle discriminatory capability foundin microscopy. Using sophisticated patternrecognition techniques developed in the digitalimage processing domain, one can automaticallysegregate out "other allowable”particles suchas silicone droplets from the particle counts,S,yielding much higher accuracy in the analysis ofprotein aggregates in parenterals. BackgrBSIinreshoidingue in RED Rasuting Binary imag esuting Bireey Imeg Figure 1: The effect of thresholding a spherical qray-scale particle image In a dynamic imaging particle analysis system,particles are imaged in a 2-dimensional space asthey move past the cameras field of view (FOV).Since the illumination is behind the flow cell asviewed by the camera, particles typicallywill bedarker than the background due to the fact thatthey are opaque. For this reason, most imagingparticle analyzers only threshold based on the into a binary image with two different thresholdvalues. The smaller threshold value on the right produces a different binary of the same particle. Note that the right side binary would be assignec a larger Equivalent Spherical Diameter (ESD) based on area. presence of pixels that are darker than the background pixel value, as isshown in Figure 1. Figure 1 illustrates the fact that, even with a simple relatively opaqueparticle, a difference in threshold value can produce a different binaryimage, and hence different particle measurements. This issue becomesfurther compounded when a particle has transparency. With transparentparticles, in some cases the particle image pixel may actually be lighterthan the background pixel, so the simple binarization process discussedabove will not recognize those pixels that are lighter as being part ofaparticle. When simple darker only thresholding is used, as is the case with otherimaging particle analyzers, transparent particles can often be cut upinto smaller particle pieces. This results in incorrect measurements andincorrect count or concentration calculations. In order to demonstrate how improper thresholding can effect bothprotein aggregate physical measurements as well as concentrationmeasurements, a simple experiment was constructed. A sample ofbovineserum was put through a freeze/thaw cycle in order to stress it, andthen run through the FlowCAM°DIPA system. The FlowCAM has theability to collect and store“raw"images of the entire camera field ofview during acquisition, allowing those raw images to be post-processedby the VisualSpreadsheet° software as though they are the “live"videostream from the camera. Therefore, the identical set of original cameraimages can be processed using different threshold settings by theVisualSpreadsheet software, meaning that the effect of the thresholdingis isolated as the only variable that is different between the two data sets collected. In the first phase of analysis, the same raw images representing a singlesample were reprocessed multiple times using different threshold settingsso that the results could be directly compared. The results for each runwere then graphed as concentration in four different size bins:<10um,>10pm,>25pm and >50um. As the threshold settings become "moresensitive"to subtle gray-scale changes, more particles are captured andmeasured, yielding higher concentration numbers. In the second phase of analysis, the phenomenon of"fractionation",whereby single large particles are cut into many small particles due toimproper thresholding is investigated. This was done by taking twospecific large protein aggregates found in the raw files and studying howthat individual aggregate is imaged at the different threshold settings. Results I. The Effect of Varying Dark Threshold Level Only: As previously stated, almost all DIPA systems use brightfield illumination,whereby the sample is illuminated from behind ("back-lit"), andthresholding is conducted by looking at where pixels are darker than thebackground due to the light being obstructed or refracted by the particle'spresence. However, because protein aggregates are largely transparent innature, the differences between background and particle pixels becomeincreasingly smaller, necessitating adjustment of the threshold level tosmaller differences in order to properly capture the particle. This first series of reprocessed raw files used only a change in the darkthreshold value to see how it affected size and concentration. Rememberthat since we use the same camera images for each run, the only differencefor each is the threshold value, so that variable had been completelyisolated for this analysis. Table 1 shows the tabular results for this series,while Figure 2 shows the resultant graphs. D40 3095 258 0 0 D20 20977 1075 43 0 D15 43545 2235 129 0 D13 58418 4041 172 0 D12 67402 4900 172 0 D11 79395 5631 301 0 D10 92119 7909 387 0 D9 110088 9586 602 0 D8 135192 11649 1161 43 135192 11649 Table 1: Concentration (particles/ml) for different size bins for each run using different levelof dark thresholding (i.e.“D40”means threshold of 40 levels darker than background). Figure 2: Concentration (particles/ml) for different size bins for each run using different levelof dark thresholding (i.e."D40”means threshold of 40 levels darker than background). II. The Effect of Varying Dark Threshold Plus LightThreshold and Adding Neighborhood Analysis: A unique capability of FlowCAM’sVisualSpreadsheet software is theability to threshold on either darkerpixels (relative to the background),lighter pixels or both simultaneously.Because protein aggregates can beso transparent due to an index ofrefraction so close to the carrier fluid,there are instances where the aggregatewill actually be lighter than thebackground intensity. Figure 3 shows agood example of this on a large proteinaggregate. Figure 3: Large protein aggregatecaptured by FlowCAM, showing area ofaggregate where the pixels are actuallylighter than the background. After the first series of reprocessing done above, it was observed (byviewing the images) that the run where the threshold was set eleven levelsdarker than the background (“D11”) produced the best results overall.Thresholding lighter than that begins to add in "artifacts”caused by noisein the camera electronics, which gets quite severe at a threshold less thanten ("D10”). In the second series of reprocessed raw files, the dark threshold was keptconstant at eleven (“D11”), and then the raw files were also thresholdedsimultaneously by finding pixels where the intensity was at least elevenlevels lighter than the background ("L11”). Finally,VisualSpreadsheet’sunique capability to perform neighborhood analysis on the binary image,grouping particle pixels that are close together, was used to furtherimprove the results by overcoming fractionation, whereby larger particlesmight get split up into smaller ones. Table 2 shows the tabular results for this series, while Figure 4 shows theresultant graphs. Run Parameters <10um >10um >25um >50um D11 Dnn0 CSHO 79395 5631 301 0 D11_L11_Dnn0_CSH0 116063 6276 344 0 D11_L11_Dnn0_CSH2 112452 15819 2837 387 Table 2: Concentration (particles/ml) for different size bins for each run, adding simultaneouslight thresholding (i.e."L11”means threshold of 11 levels lighter than backgrounnd) andeighborhood analysis ("CSHO"indicates no extra processingwhile“CSH2”means thatneighborhood processing was done on the binary image). The first run was the"baseline"ofdark thresholding only. Figure 4: Concentration (particles/ml) for different size bins for each run using differentcombinations of thresholding parameters (see Table 2 for key).Note the significant increase in the concentration of particles in all sizebins caused by adding the lighter pixels into the thresholding! A dramaticchange occurs in the 3rd run when neighborhood analysis is added tothe thresholding: the number of the smallest (<10pm) particles actuallydecreases, while the number of larger particles in the other three size binsincreases dramatically. This is due to lessened fractionation of the largerparticles, as discussed in the next section. The graphs show exactly what the tabular data reports. The differencesin the smaller size bands do not appear as dramatic as the numbers show (with the exception of the >50um bin) due to the use of alogarithmic axis. As previously explained, the dramatic increase in particleconcentrations for the three larger size bins is due to reduced fractionationof the larger particles, as shown in more detail below. III. The Effect of Fractionation Caused by ThresholdSettings: As was seen in Section II above, the neighborhood analysis significantlyincreases the concentration in the larger particle size bins. This is becausethe neighborhood analysis helps to "group together"parts of largerparticles that would normally be split apart as separate, smaller particlesbecause they are do not physically touch in the binary image. To demonstrate this, two large protein aggregates were found on separateraw images. VisualSpreadsheet was then used to find all "particle images”which had that original raw file as their"source image", with the resultantimages displayed as shown in Figure 5. Conclusions This study shows conclusively how important threshold settings are inorder to properly capture, measure and calculate concentration for proteinaggregates found in therapeutic proteins. Three basic conclusions are made: 1. The initial level for the number of levels darker than the backgroundshould first be optimized to capture the maximum number ofparticles without adding in noise. 2.The addition of thresholding on pixels lighter than the backgroundsignificantly increases the number of aggregates captured. 3.Finally, adding neighborhood analysis to the binary images capturedprevents fractionation, thereby correctly characterizing largeraggregates. Since the index of refraction varies with protein and carrier matrix used, itis recommended that optimization using VisualSpreadsheet tools should becarried out for each different formulation prior to analysis. 目的:动态成像粒子分析(DIPA)是一种较新的技术,已被证明可以更好地表征基于蛋白质的药物中的亚可见颗粒,而不是使用光阻法等传统技术。 这是因为在这些配方中发现的大多数亚可见颗粒实际上是蛋白质聚集体,它们是无定形的半透明颗粒,其可能被错误表征或甚至不被光阻法系统看到。 DIPA系统能够通过调整光强度阈值从背景中分割非常透明的粒子,创建用于所有粒子测量的二值图像,因此阈值技术的选择对于测量的有效性是至关重要的。 本文将表明,改变阈值方法可以极大地改变粒度分布,并包括对所用方法的建议。
确定

还剩1页未读,是否继续阅读?

产品配置单
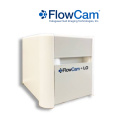

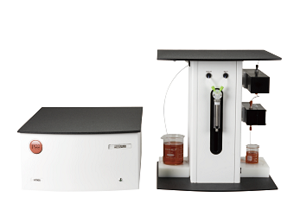
大昌华嘉科学仪器为您提供《蛋白质中明暗阈值在成像分析中的重要性检测方案(图像粒度粒形)》,该方案主要用于其他中明暗阈值在成像分析中的重要性检测,参考标准--,《蛋白质中明暗阈值在成像分析中的重要性检测方案(图像粒度粒形)》用到的仪器有流式颗粒成像分析系统FlowCam®8100、颗粒成像法+光阻法分析系统 FlowCam® + LO、纳米流式颗粒成像分析系统 FlowCam® Nano
推荐专场
相关方案
更多
该厂商其他方案
更多