


方案详情
文
采用美国Artium公司的相位多普勒粒子分析仪和德国LaVision公司的智能成像软件平台,对螺旋式喷嘴的空气辅助雾化过程中雾化液滴的粒径进行了时间分辨和空间分辨测量。
方案详情

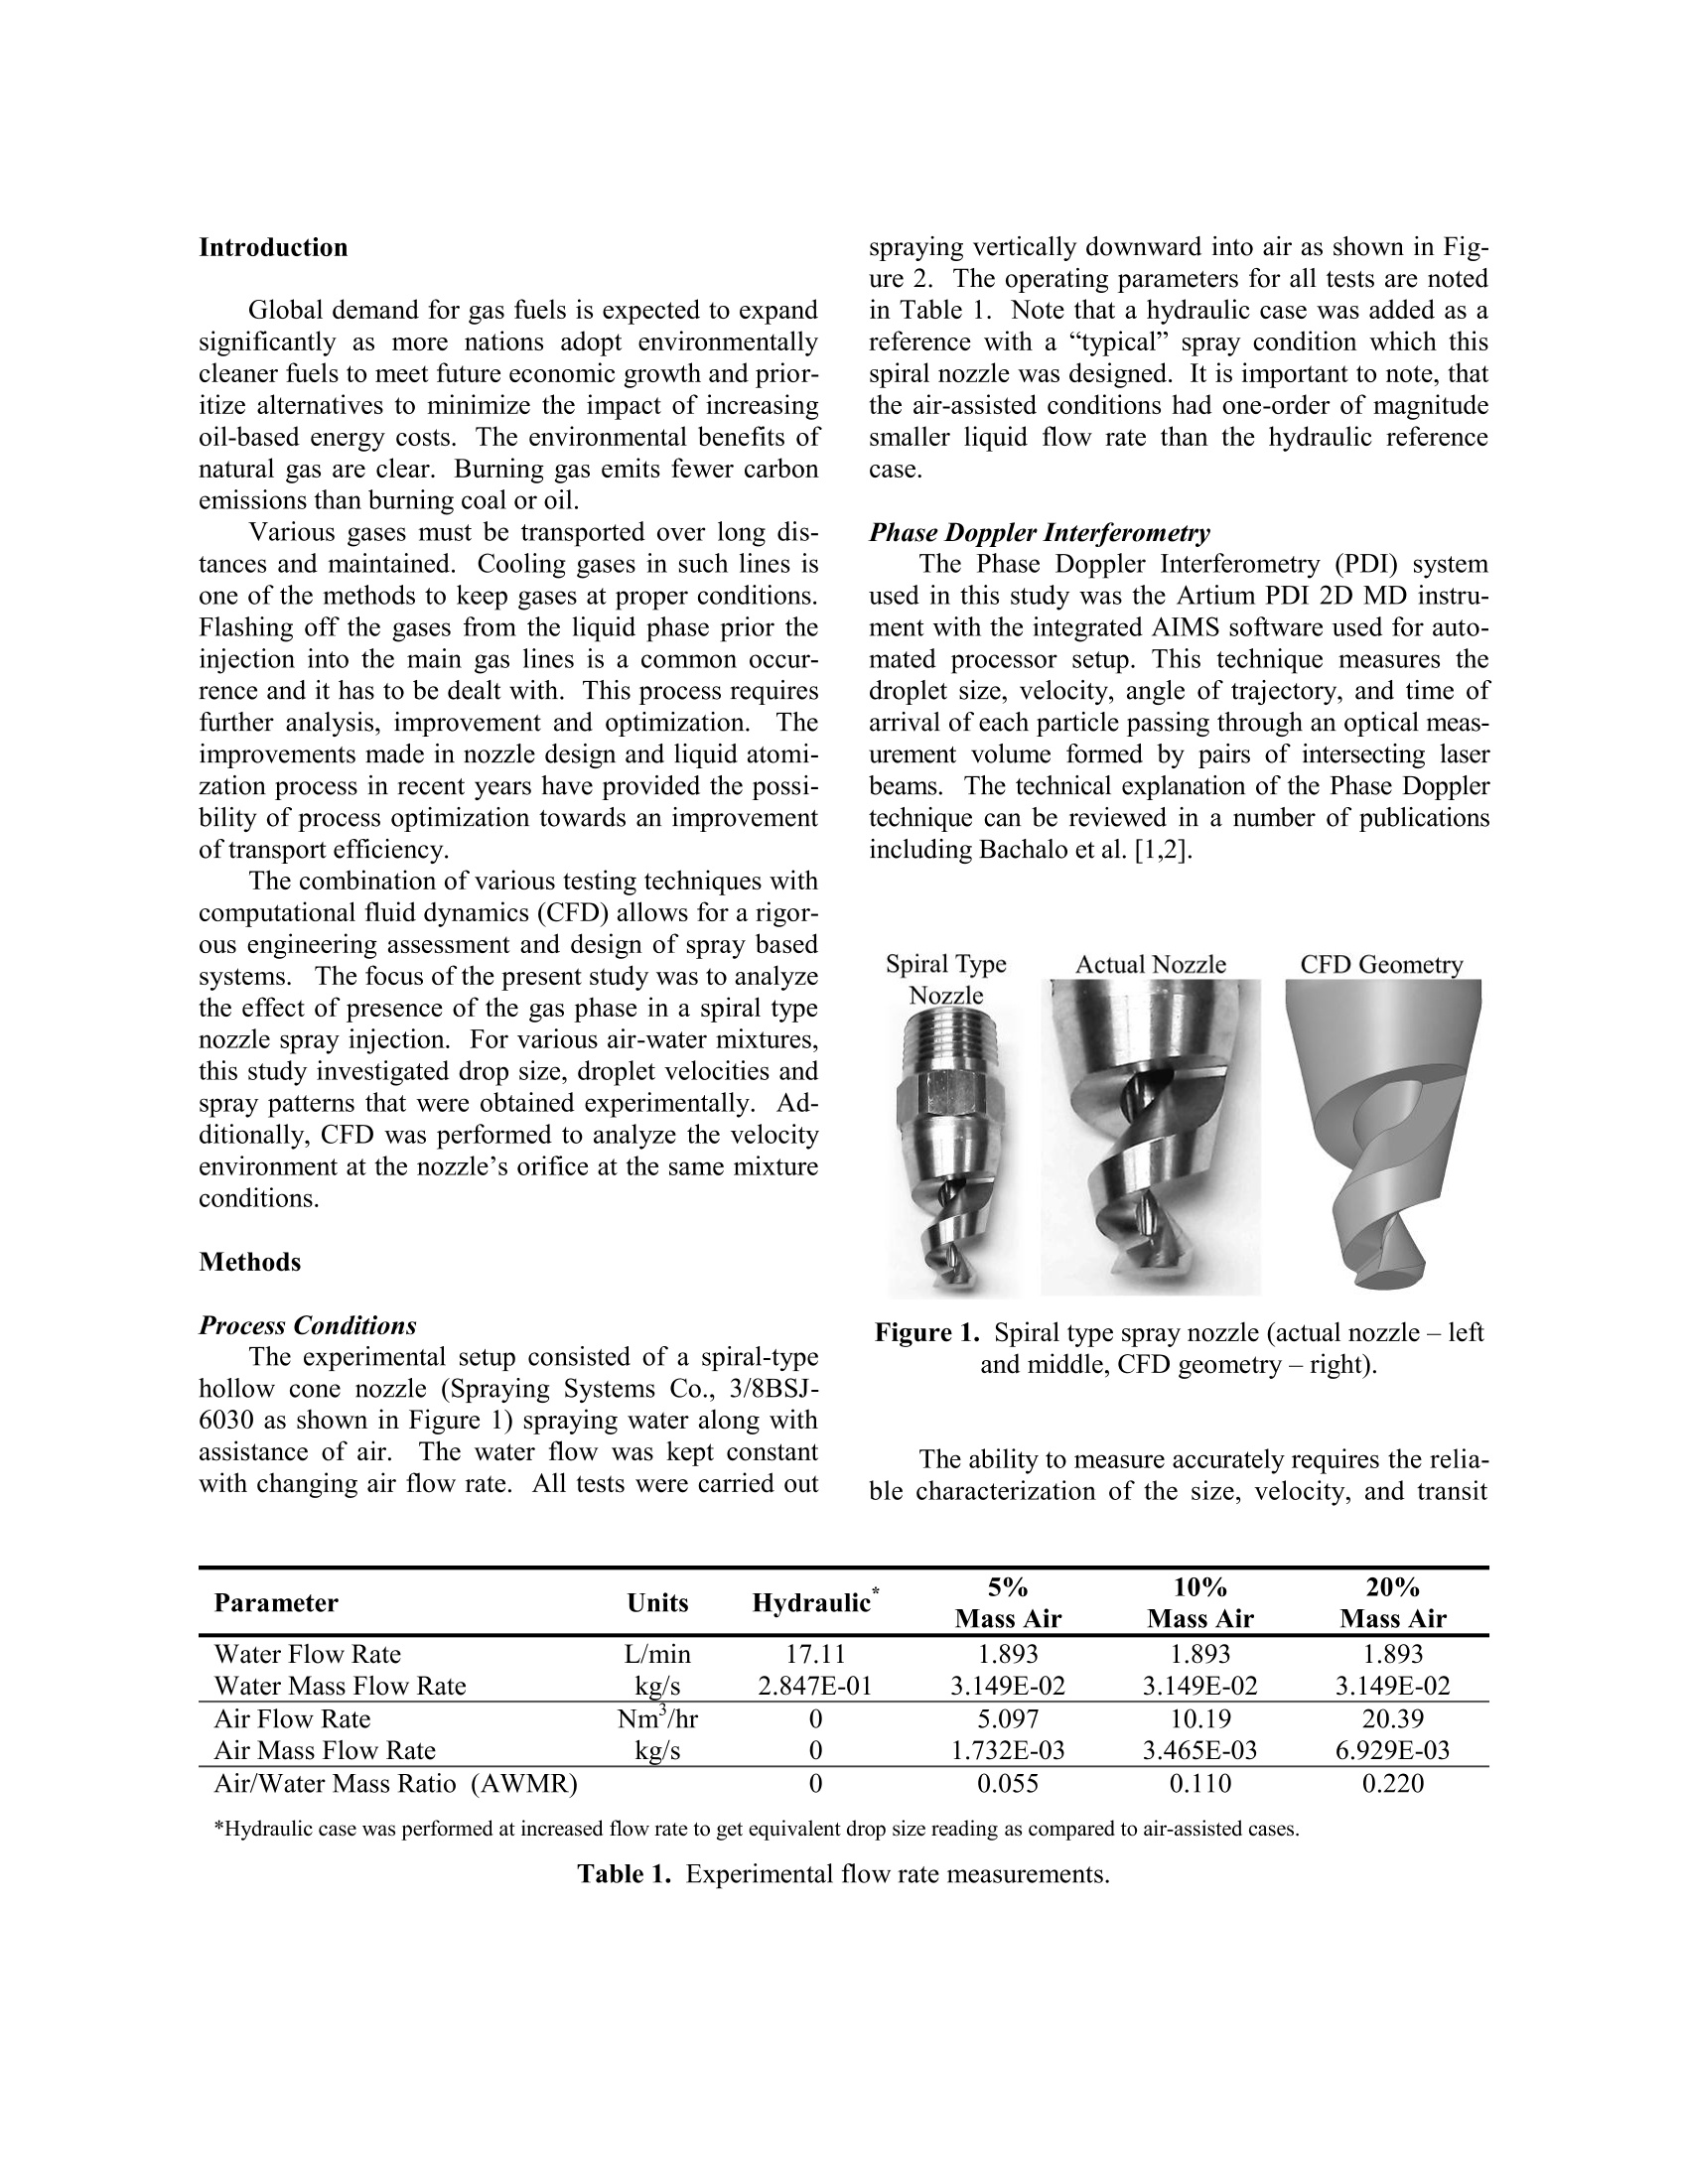
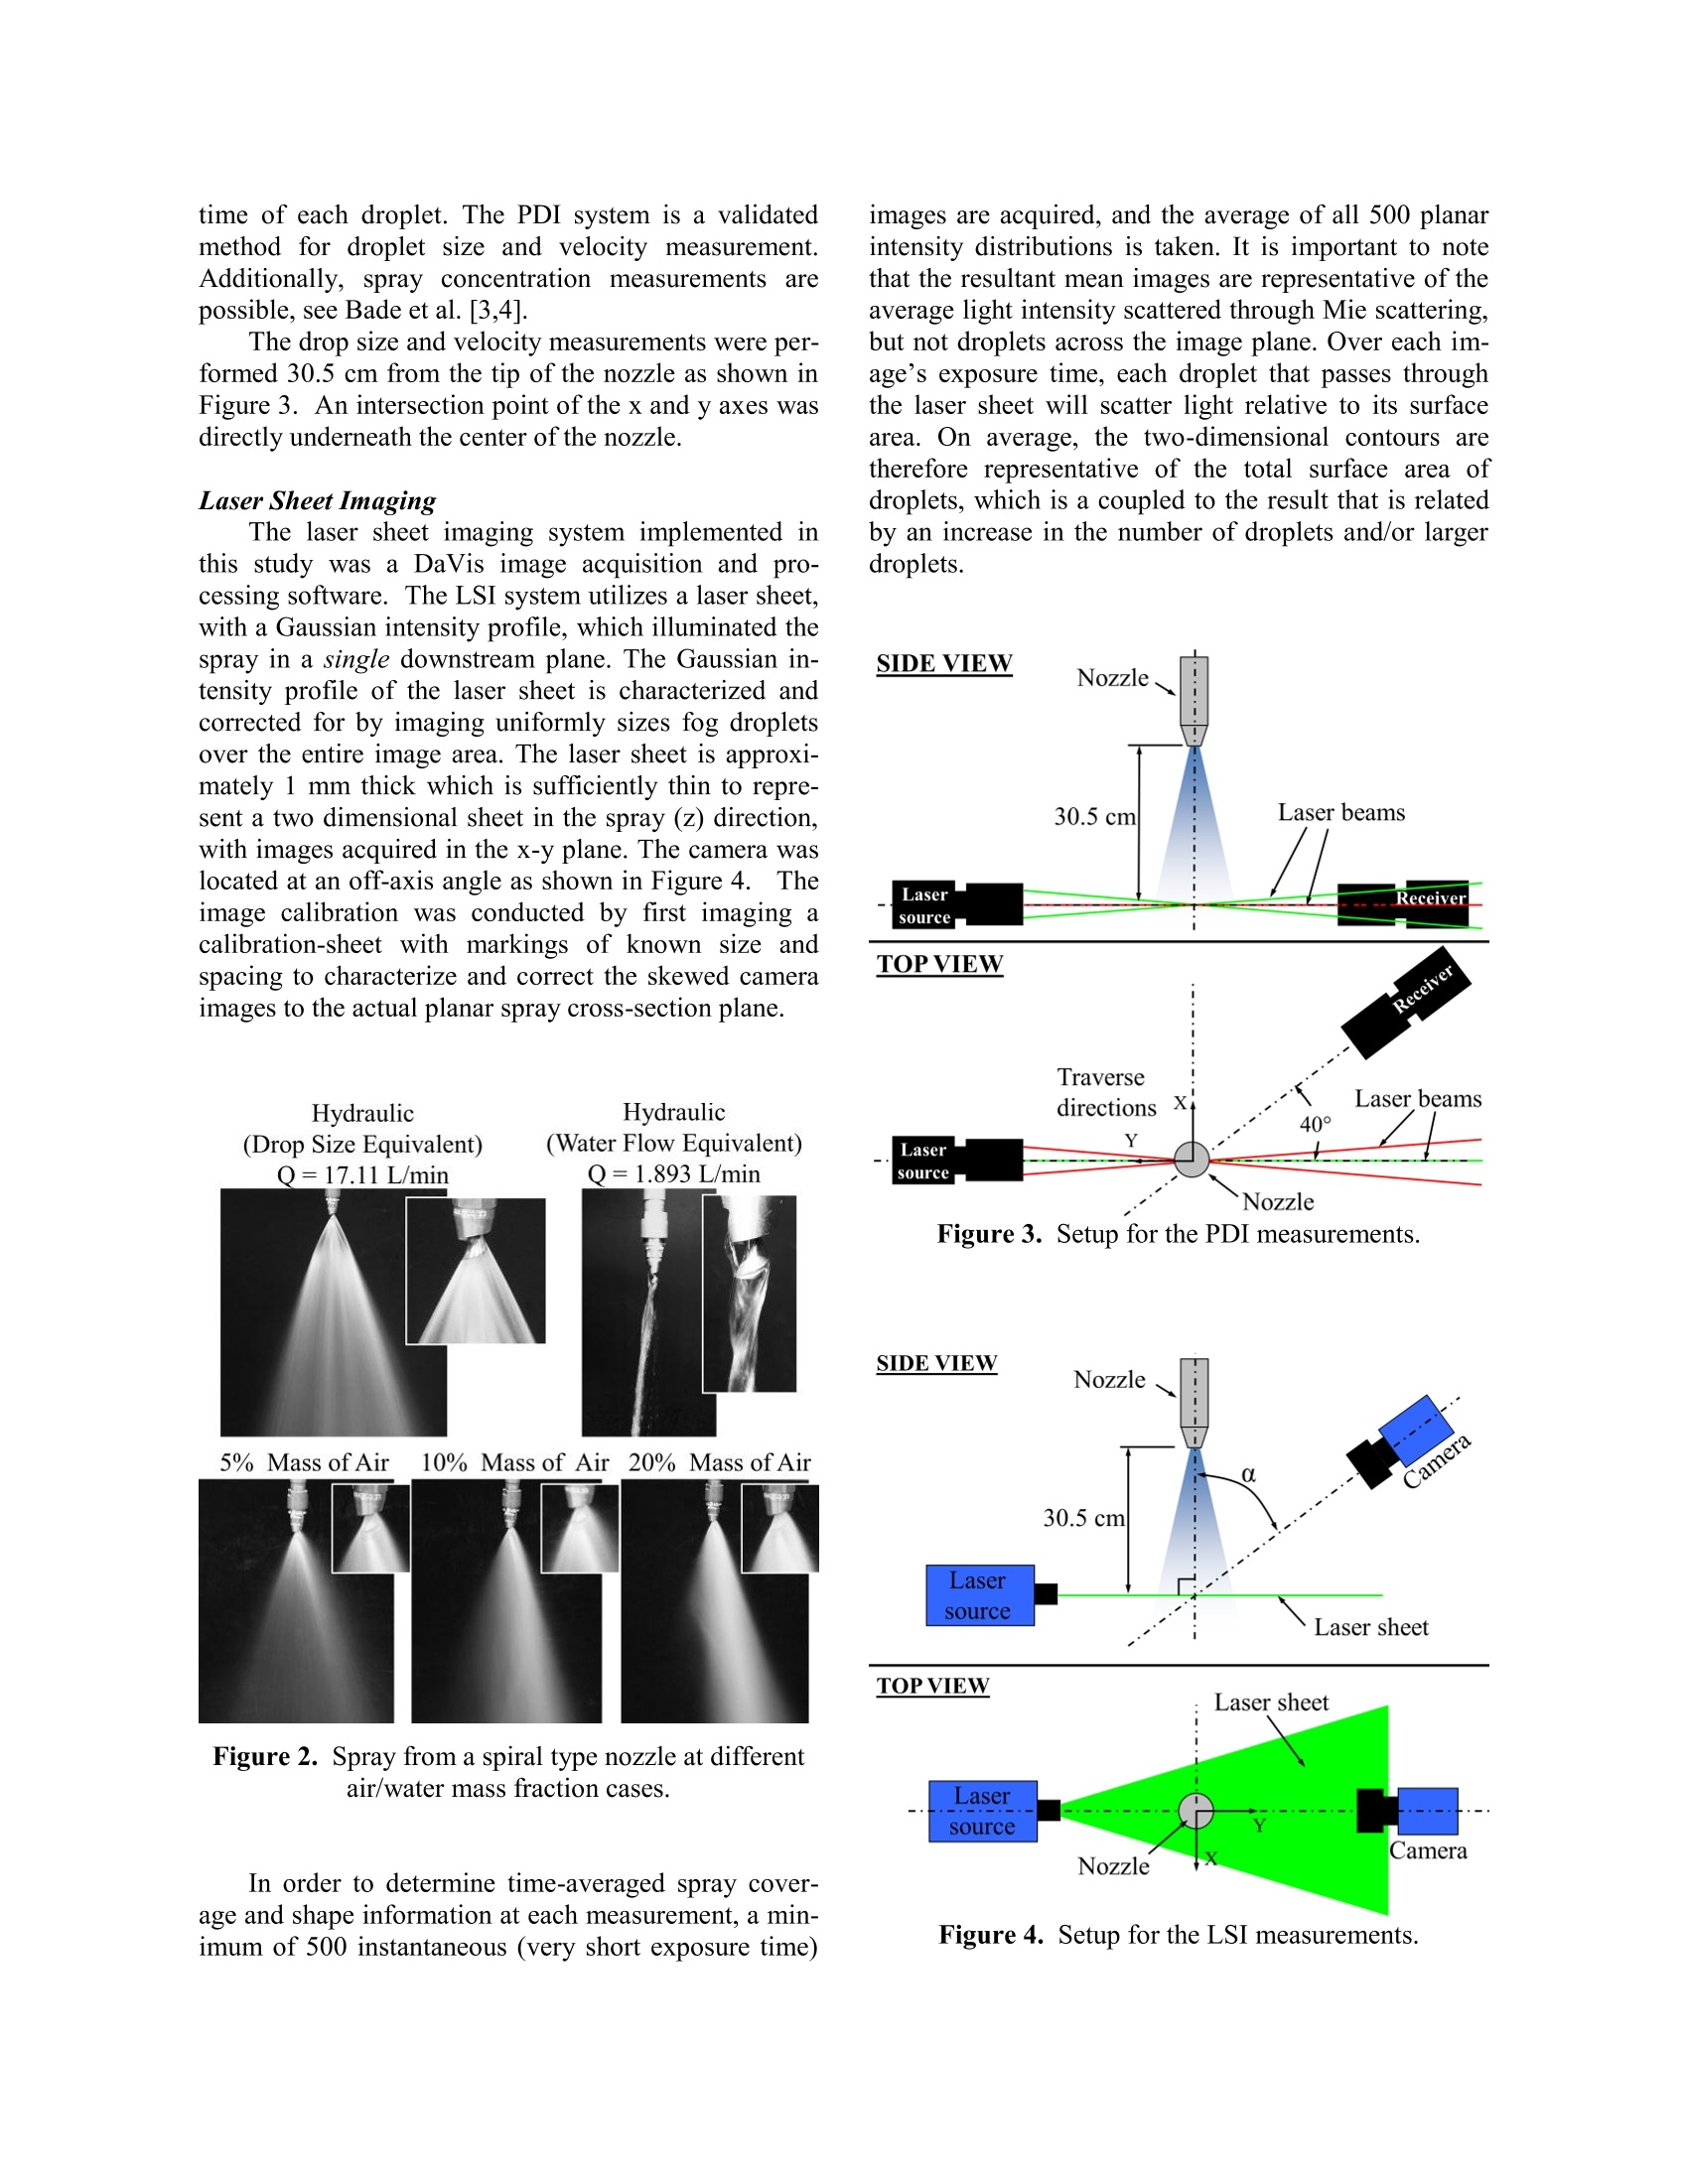
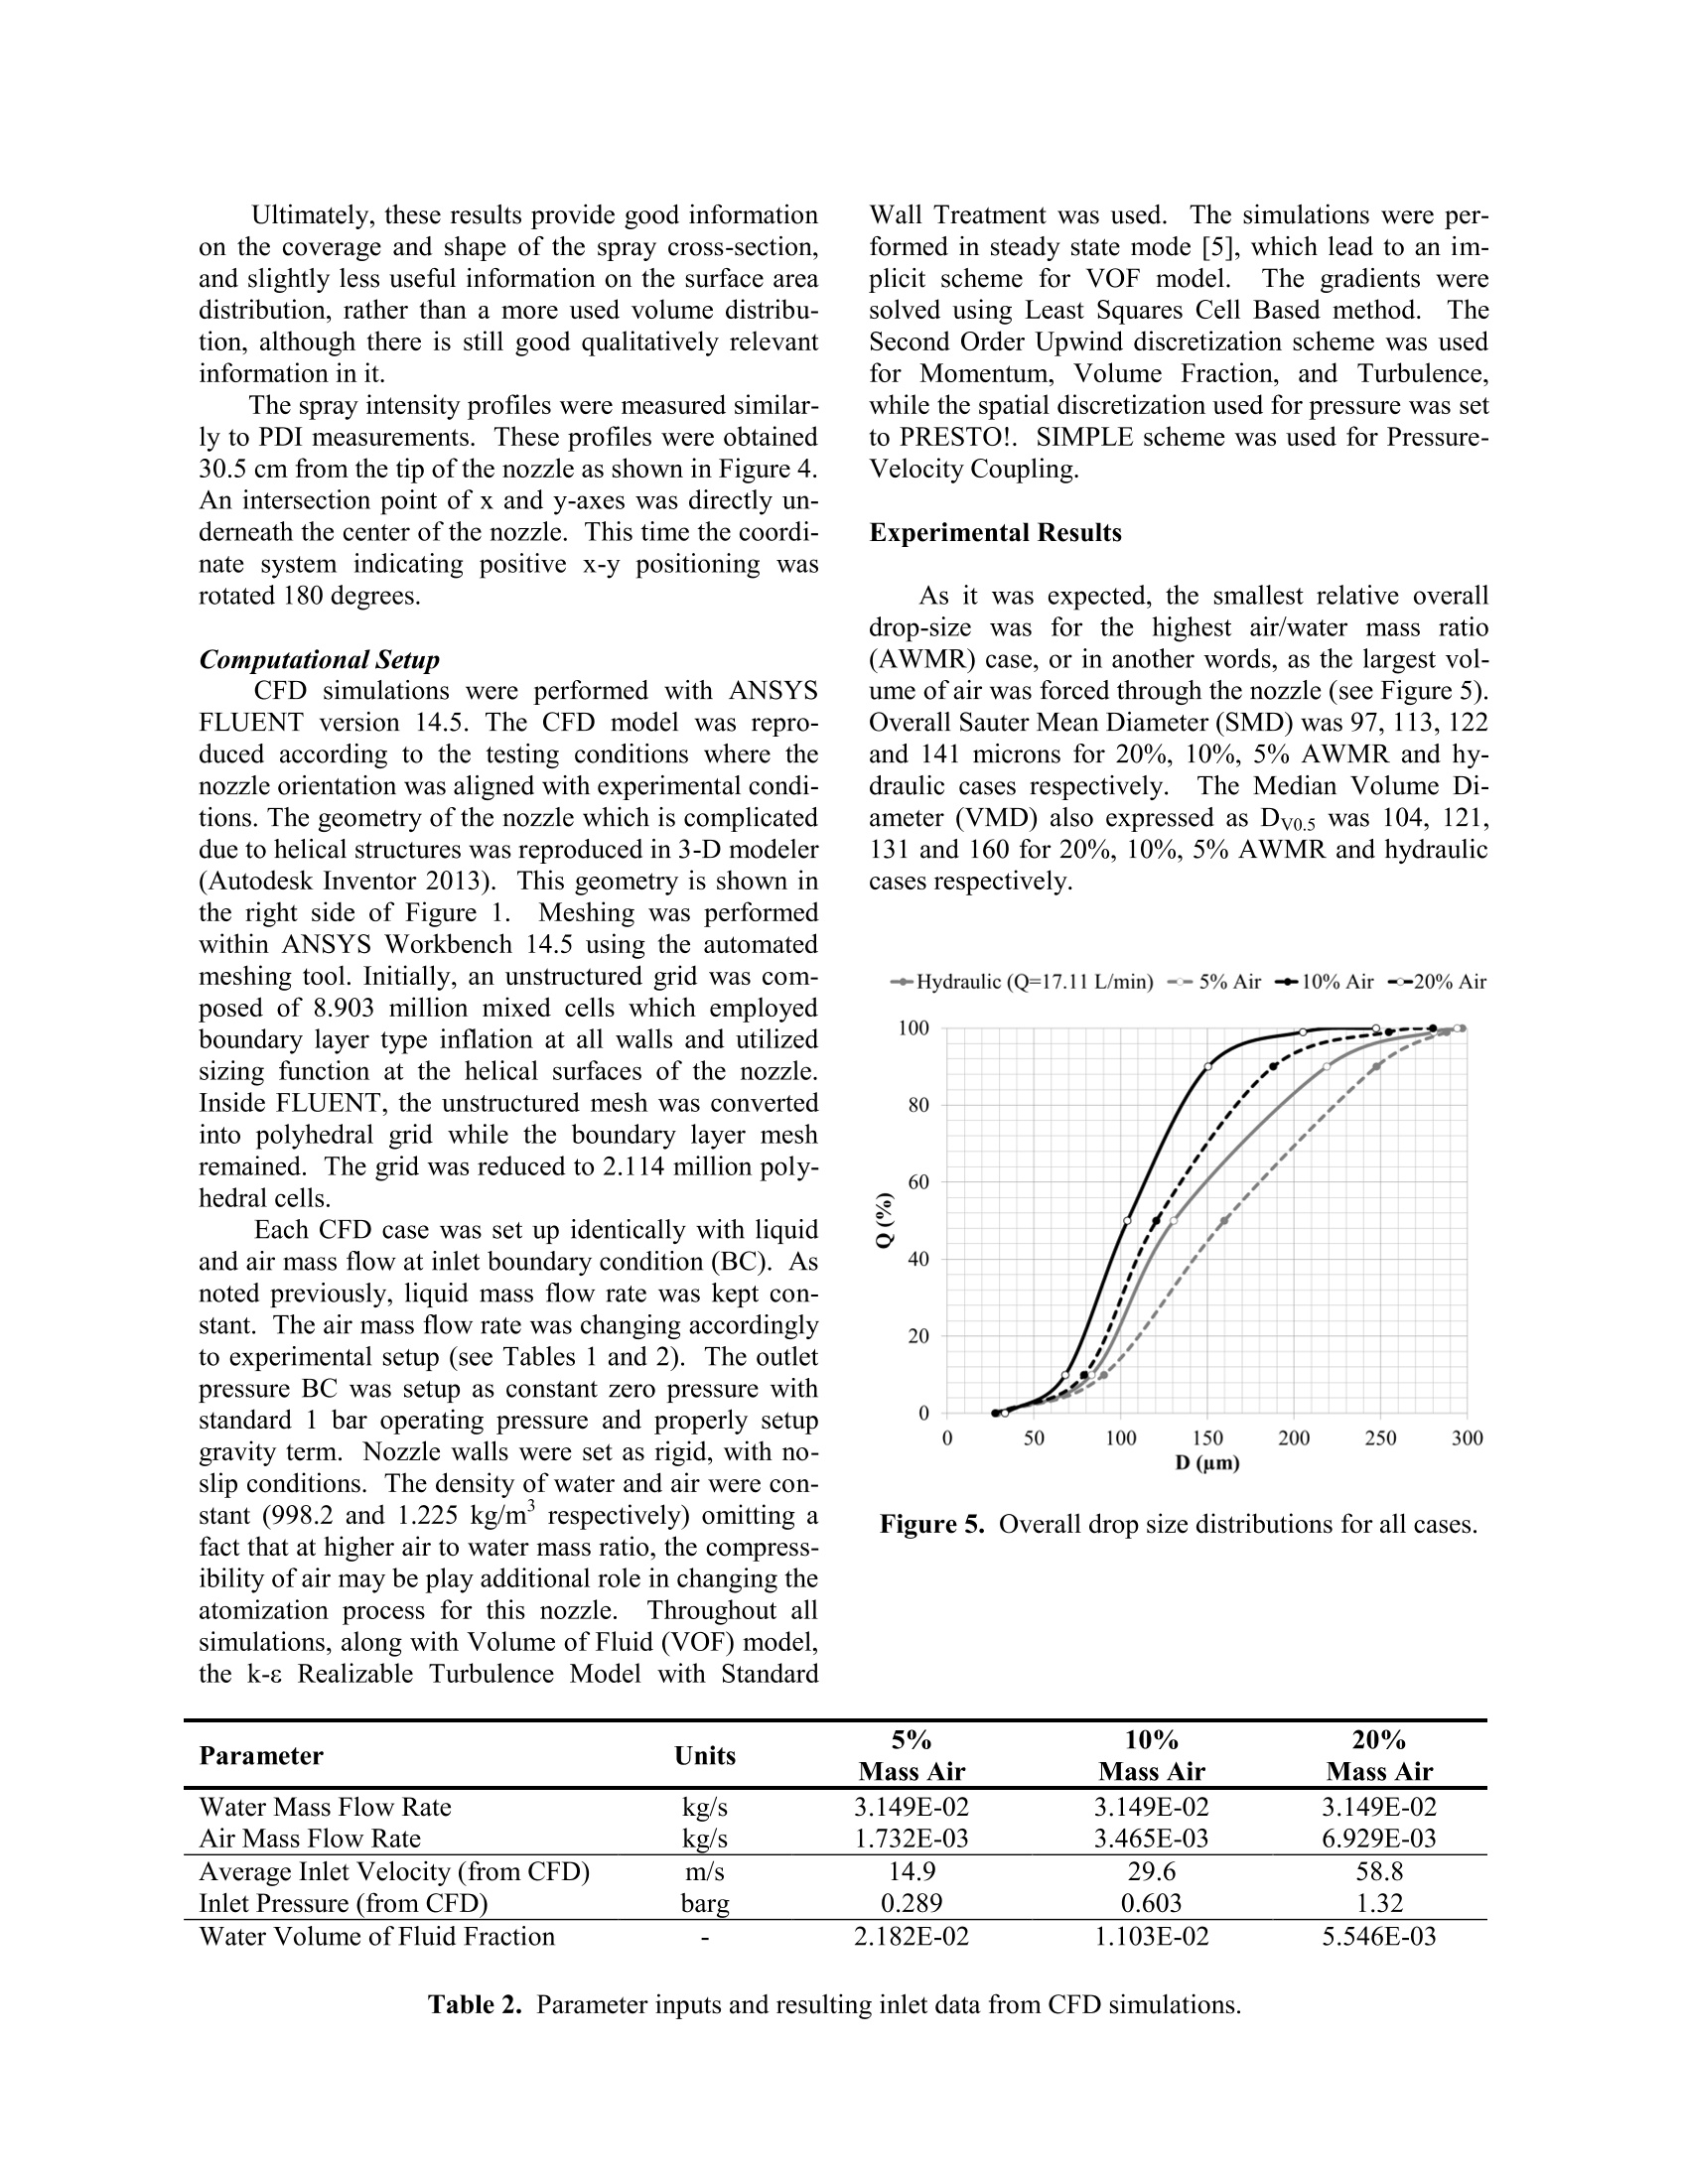
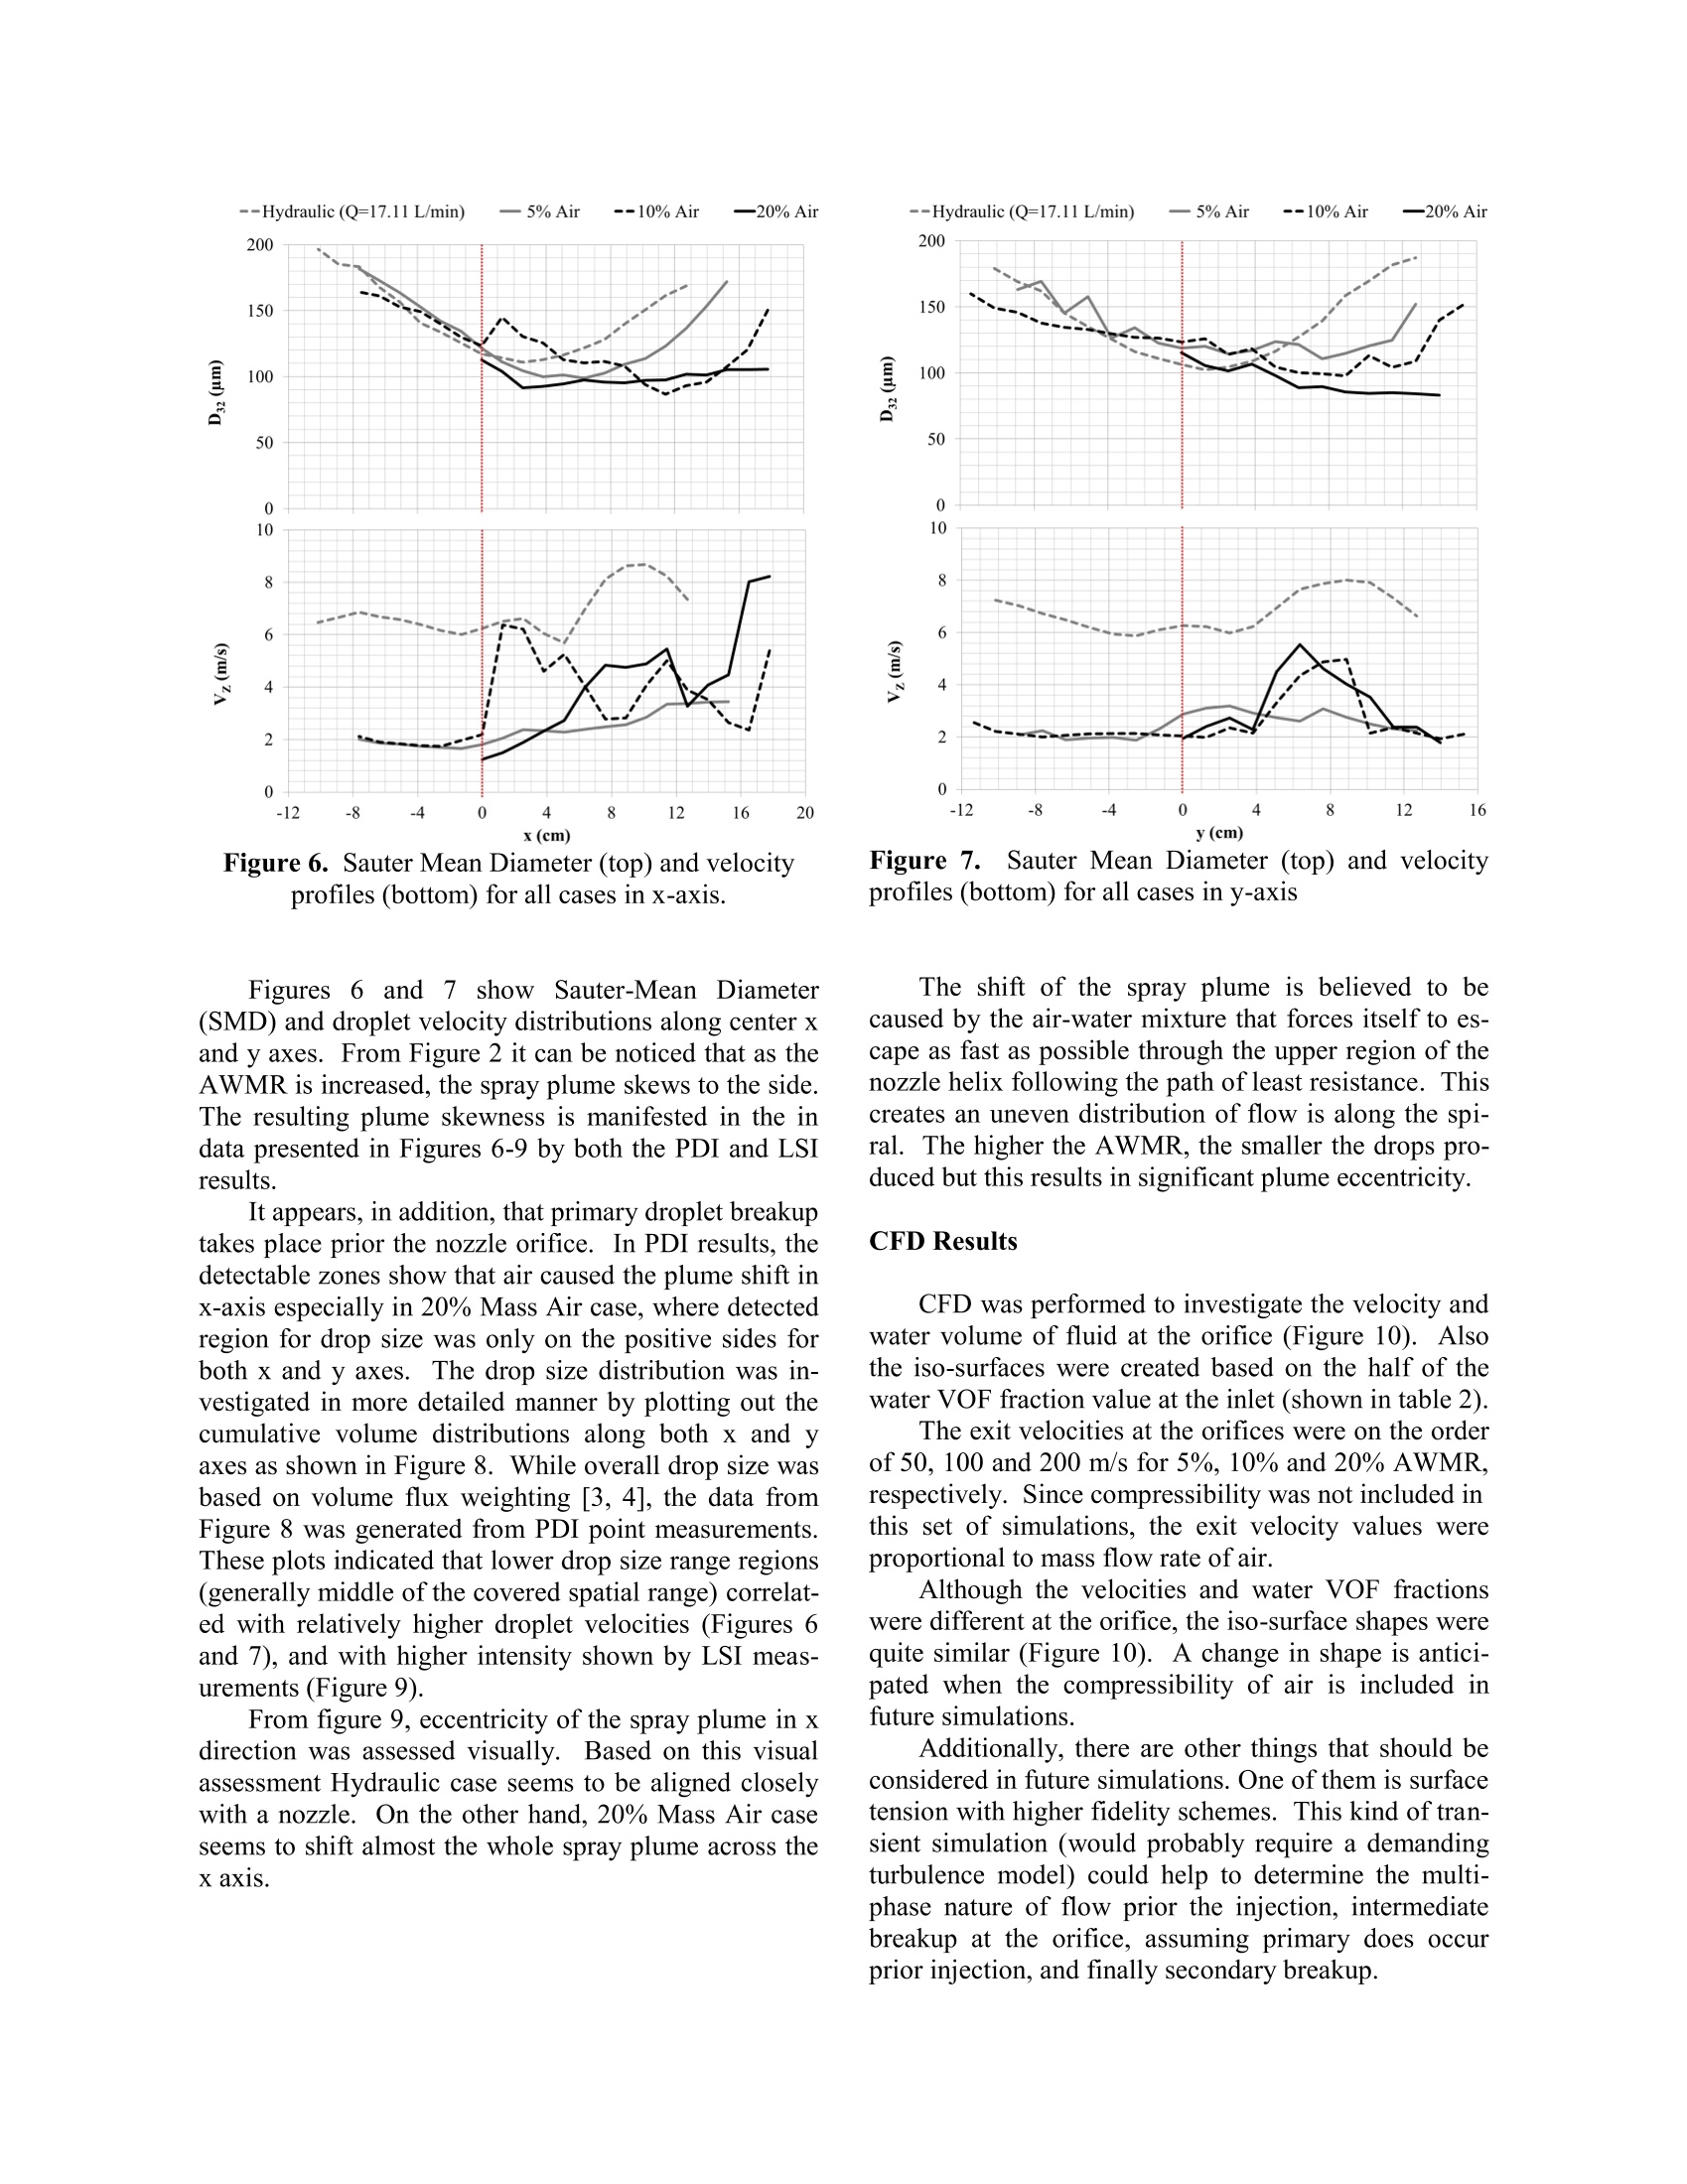
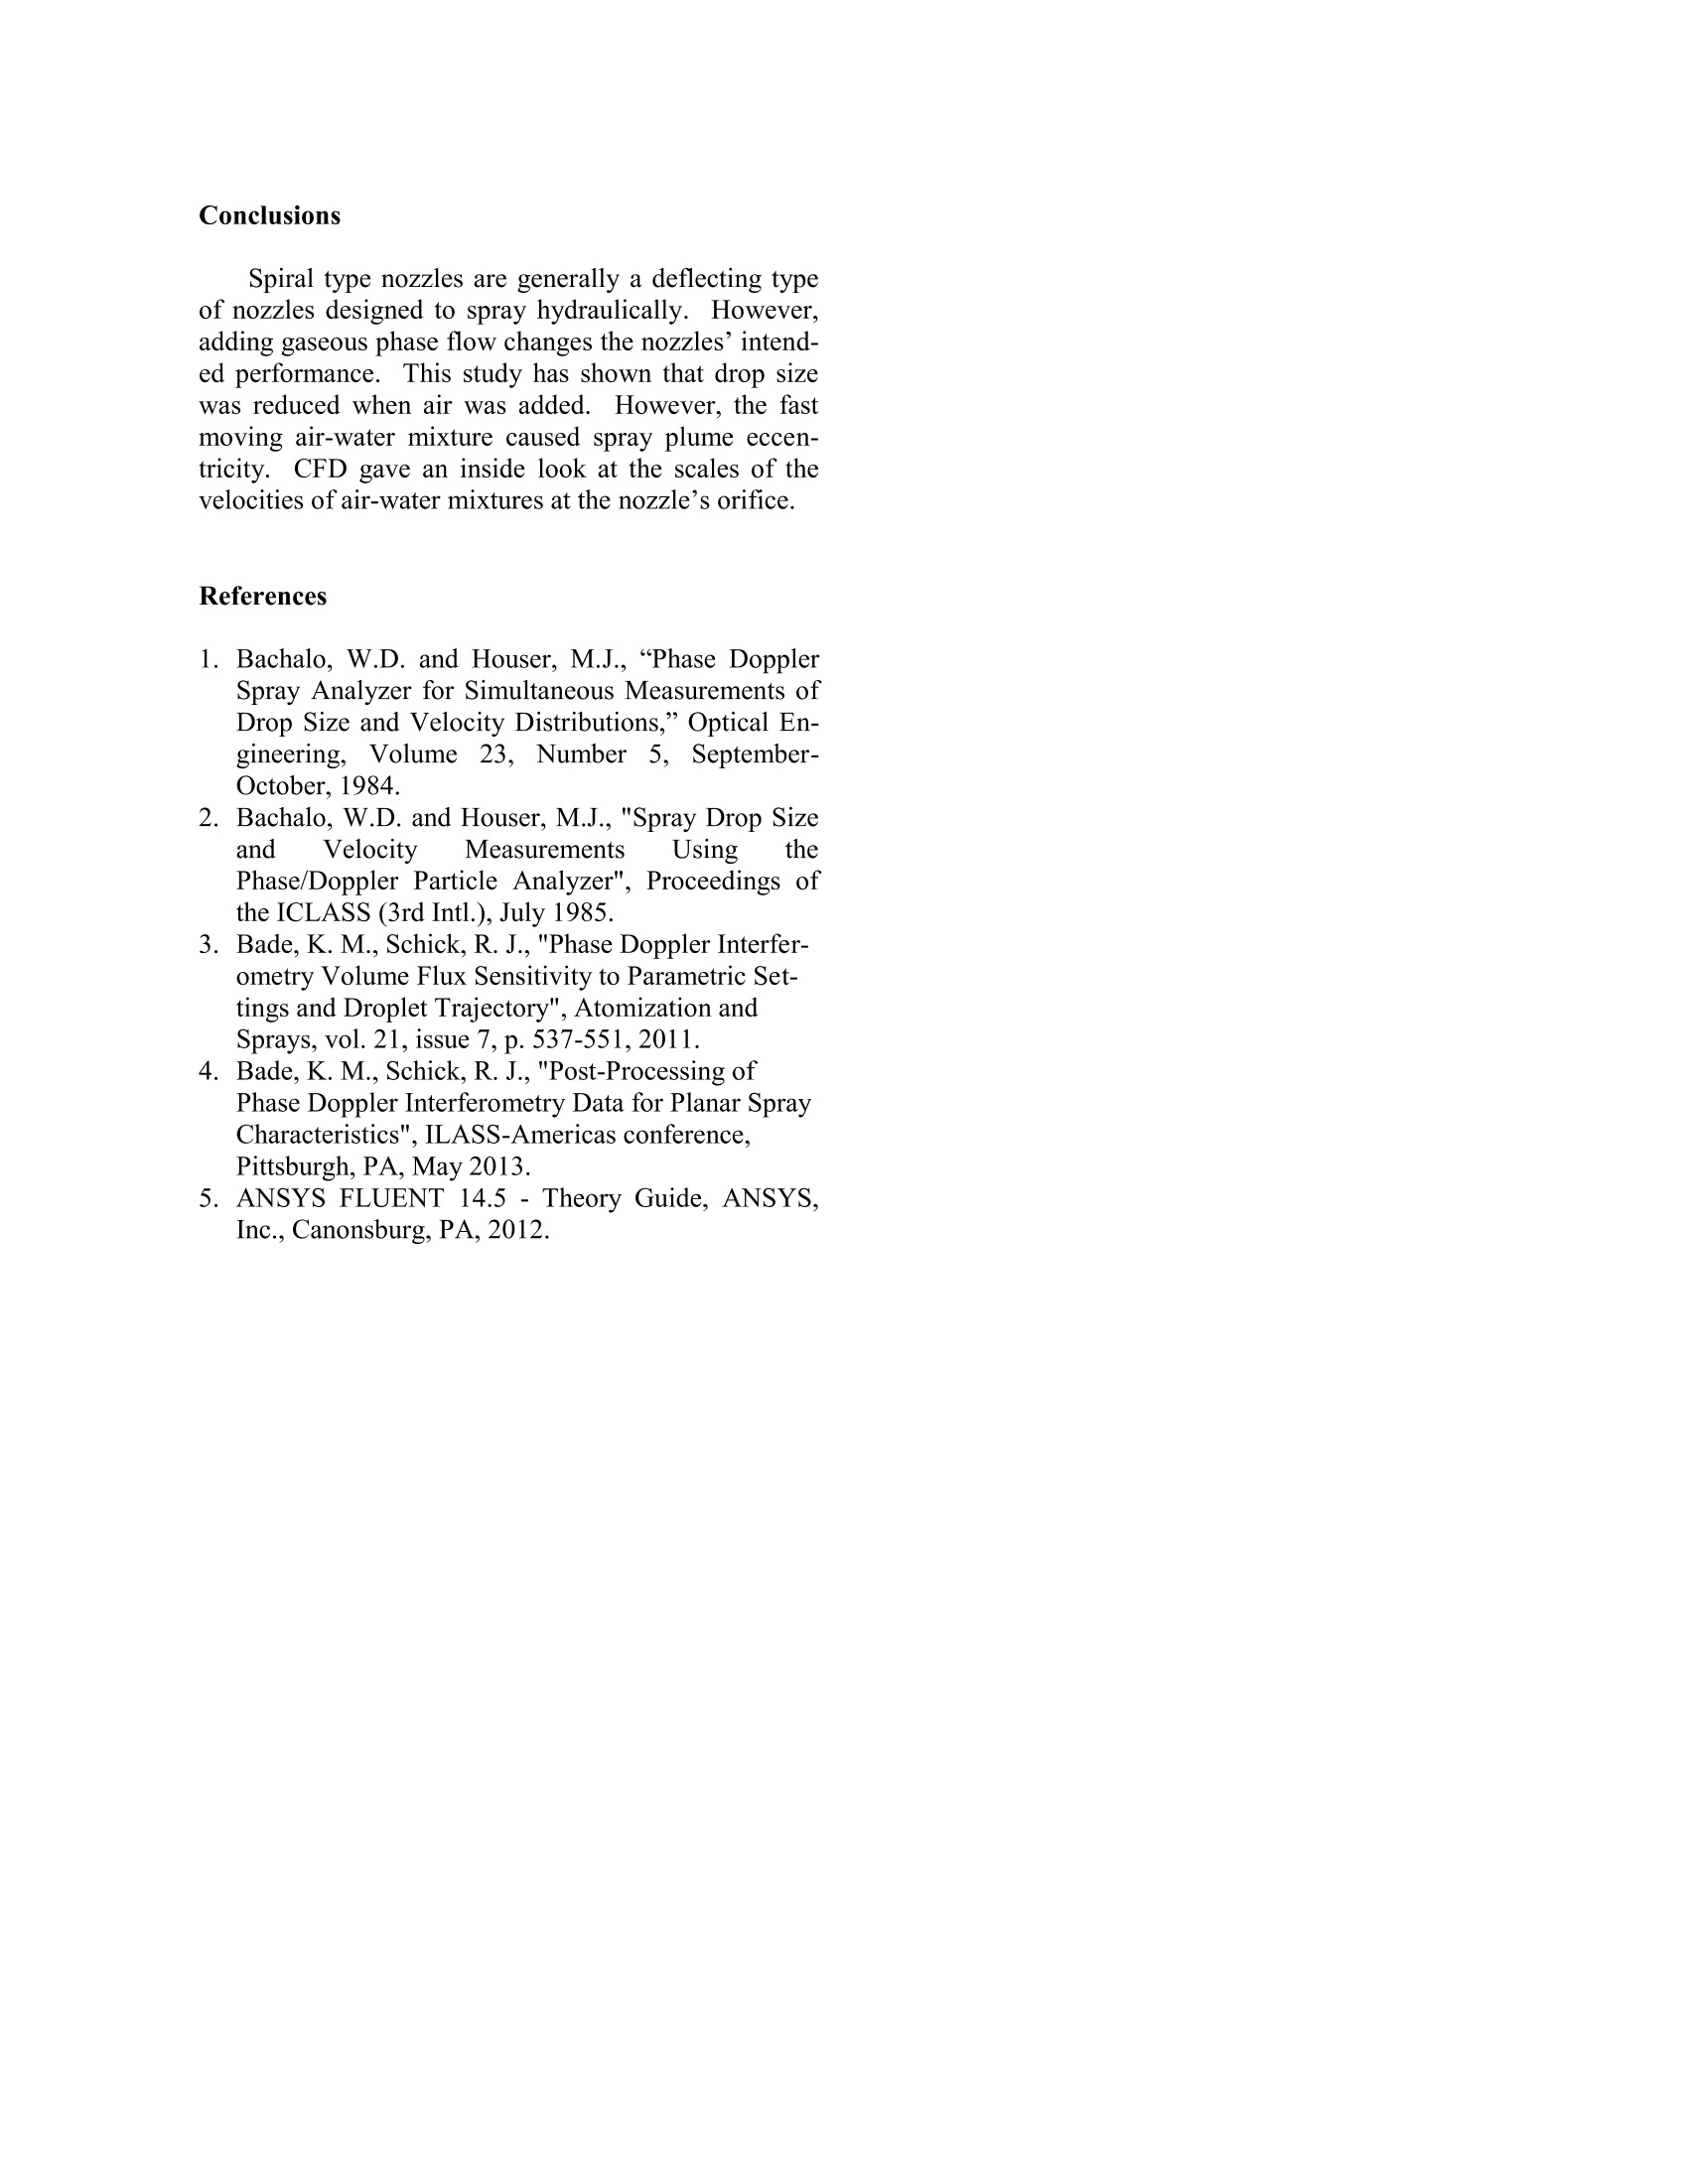
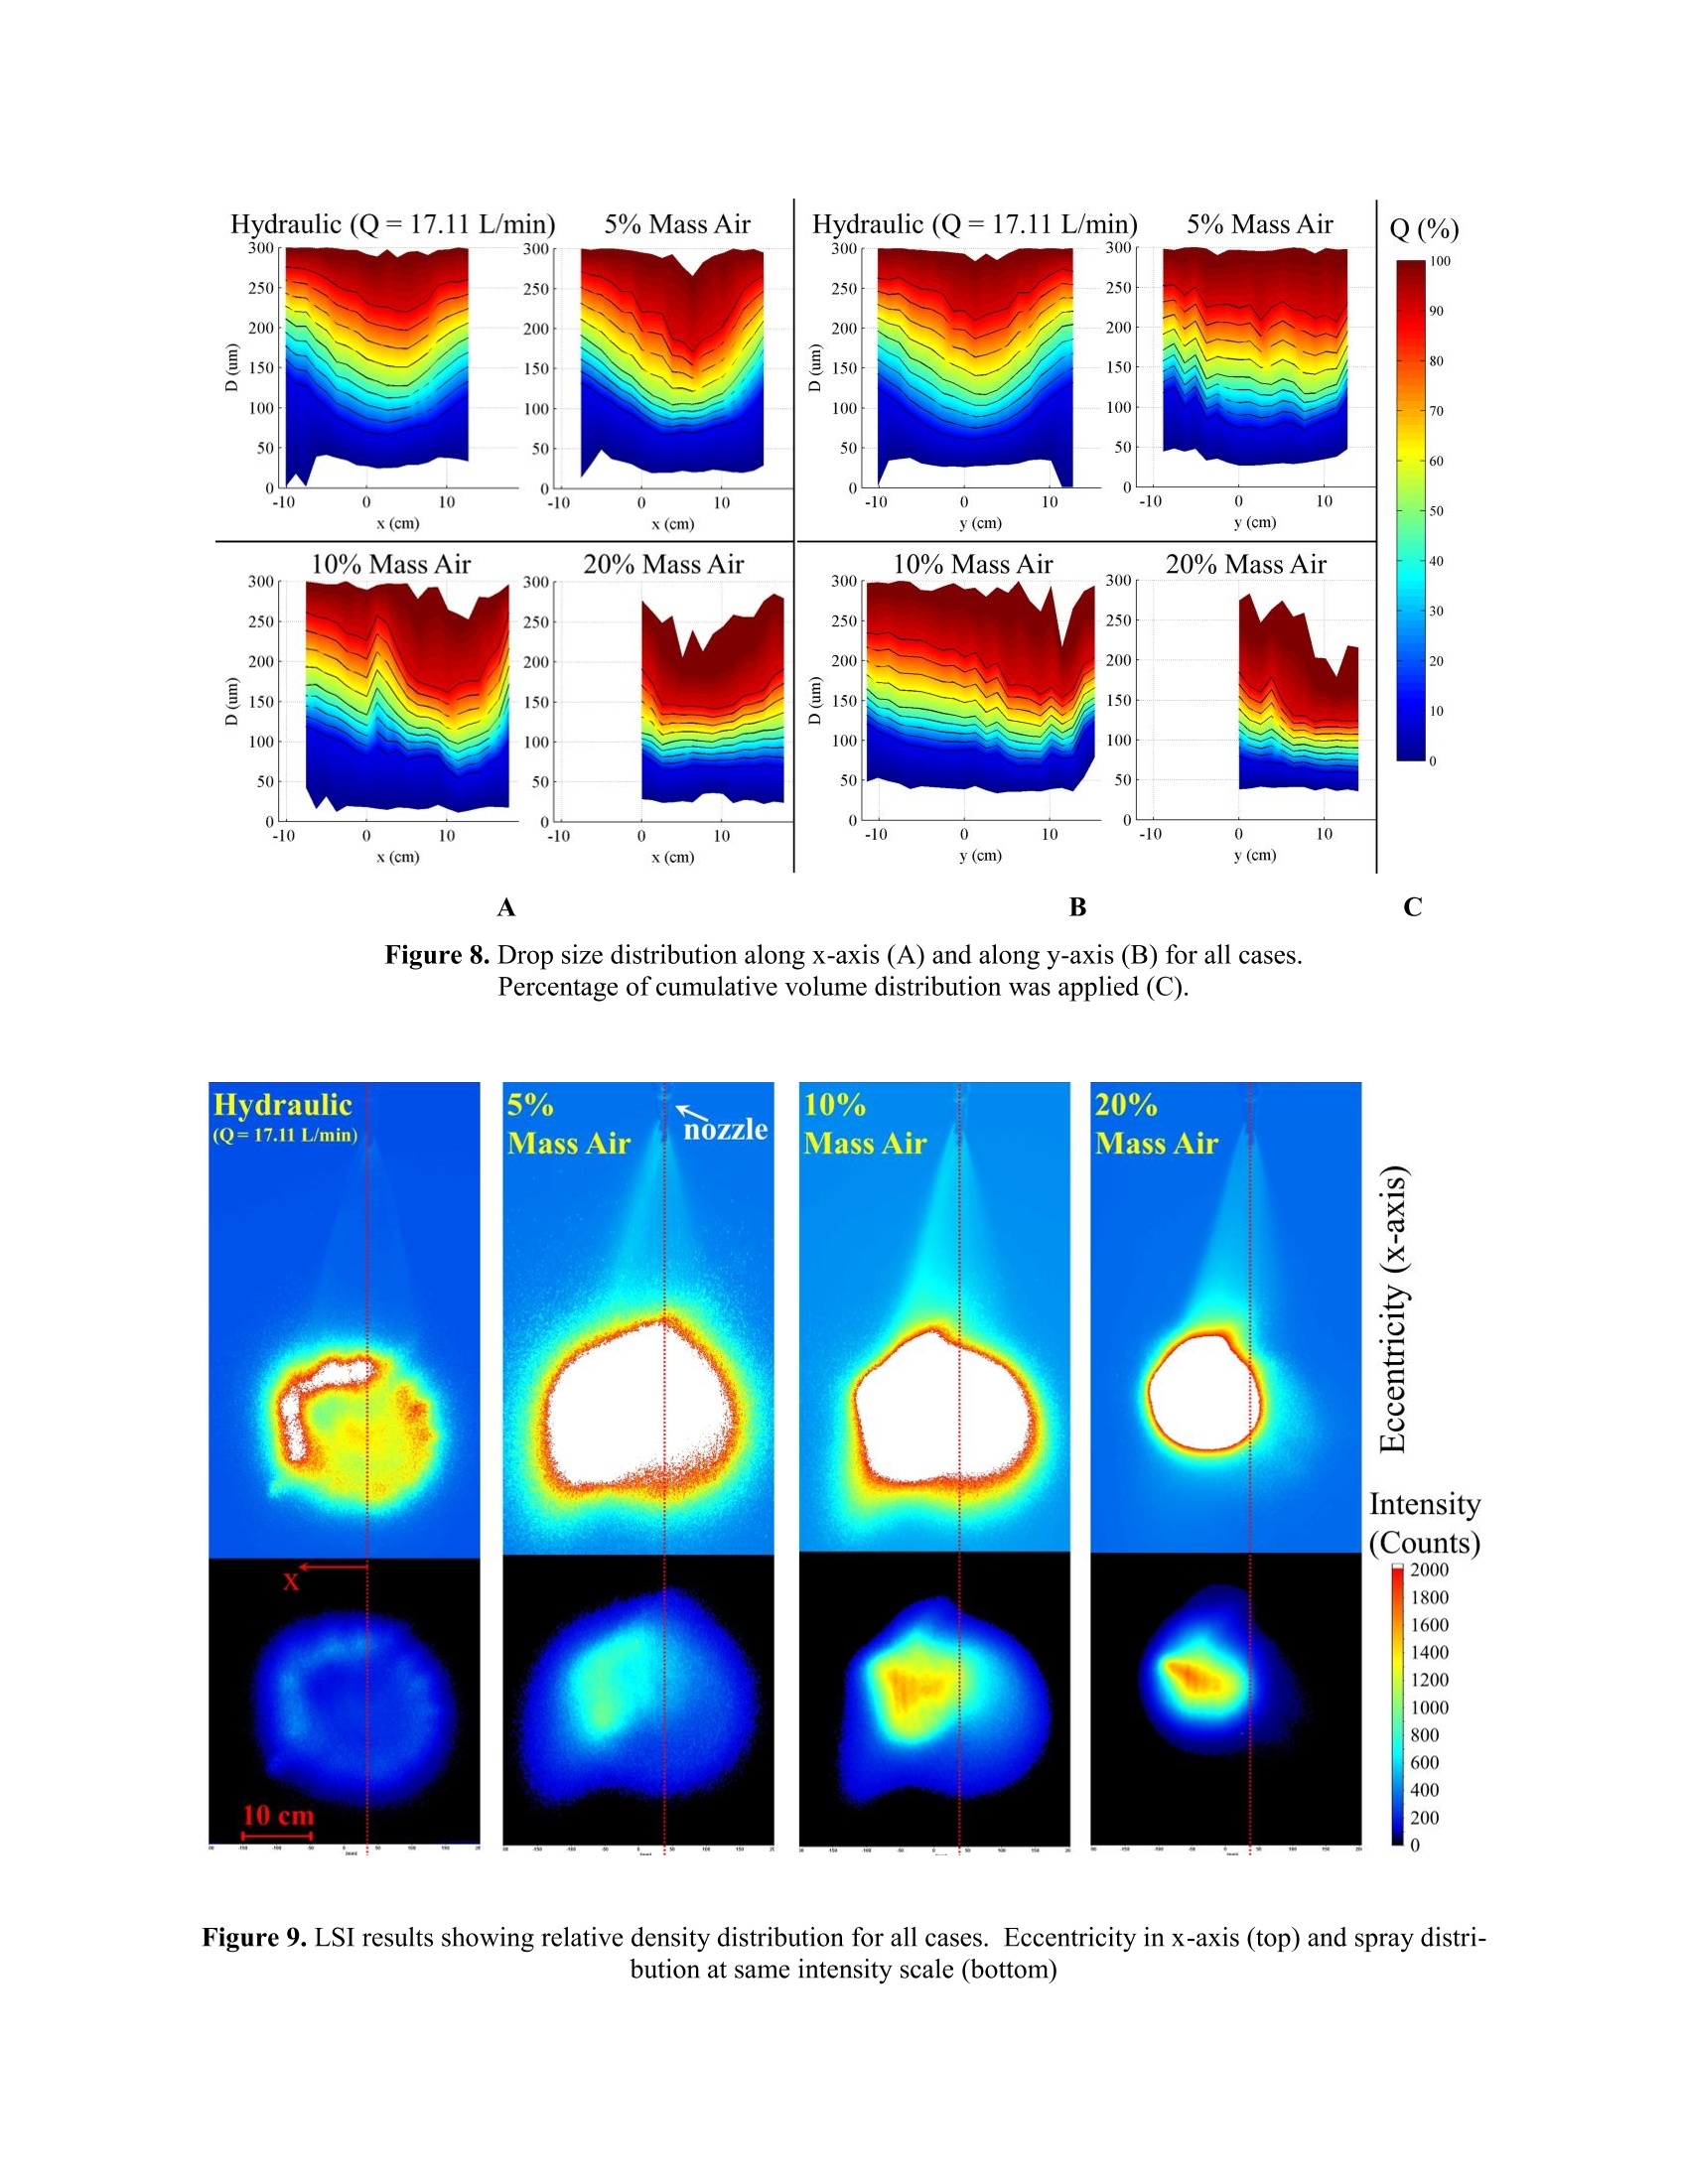
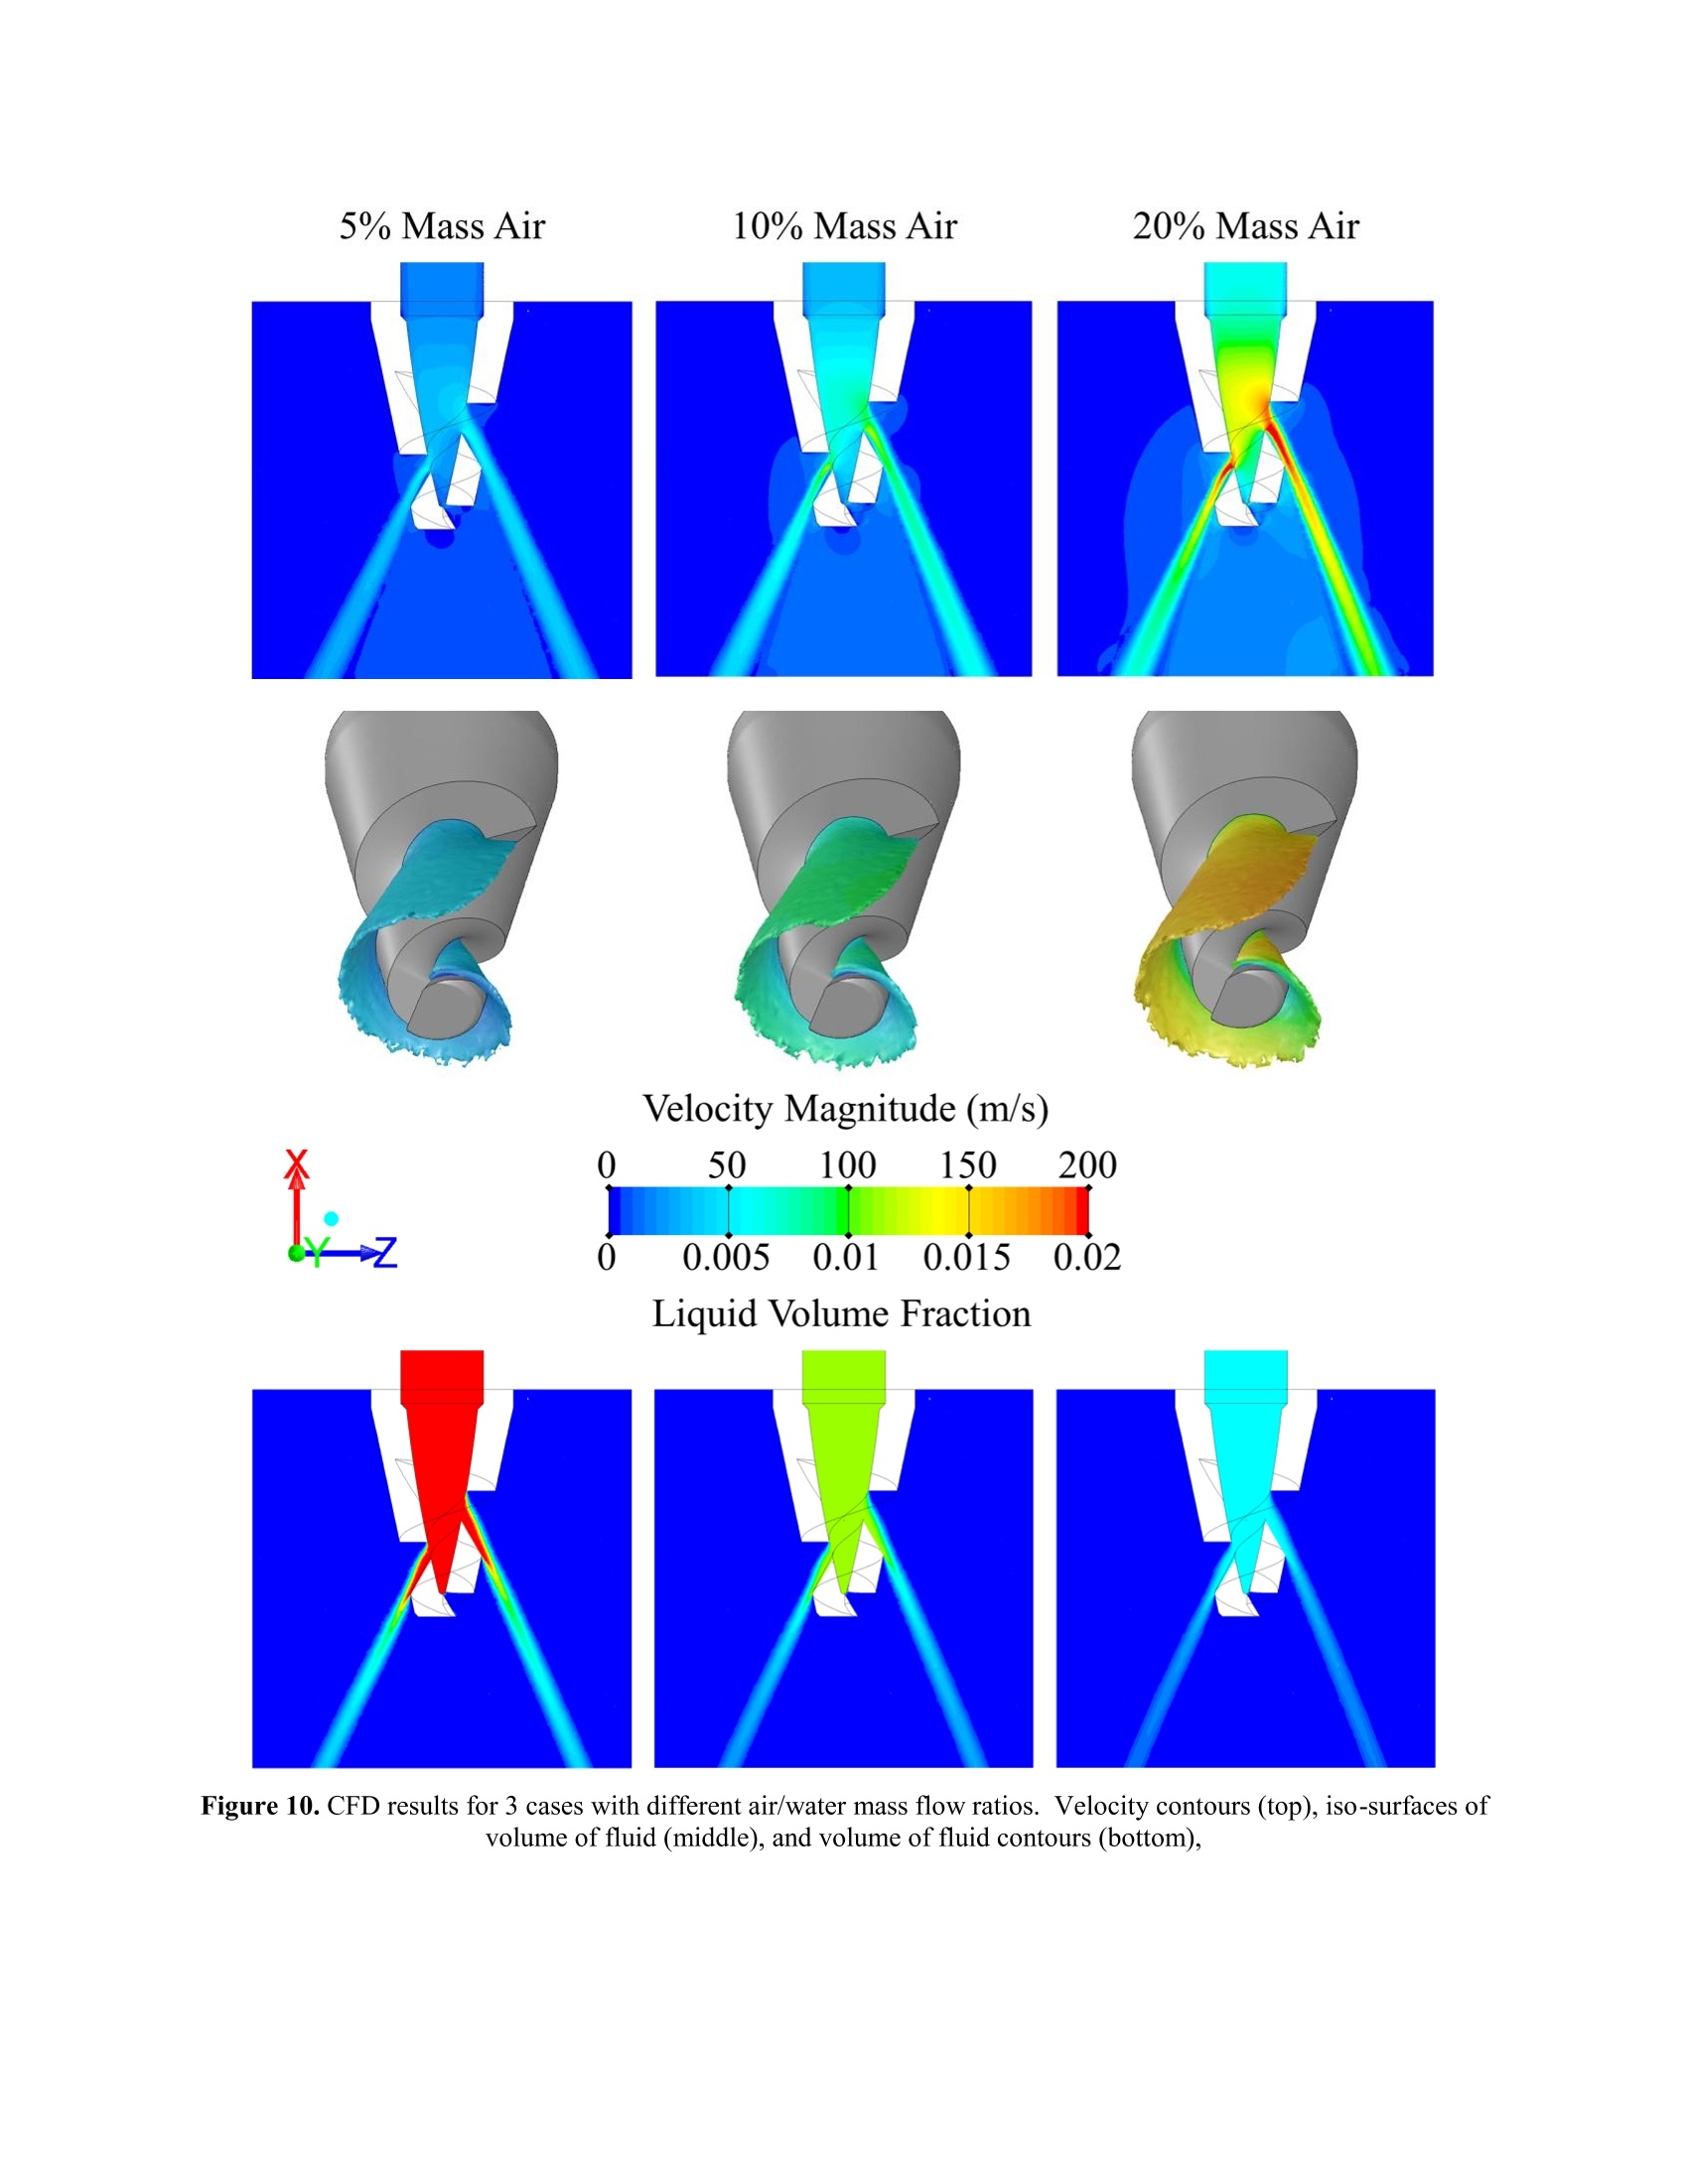
ILASS Americas, 25" Annual Conference on Liquid Atomization and Spray Systems, Pittsburgh, PA, May 2013 Air Assisted Atomization in Spiral Type Nozzles W. Kalata, K. J. Brown, and R. J. Schick Spray Analysis and Research Services Spraying System Co. Wheaton, IL 60187-7901 USA Abstract Processes utilizing various spraying cooling are widely used in many gas treatment applications. Effective spraycooling system design optimization often depends on the approach used to investigate such gas cooling problems.The mass transfer efficiency of spray cooling problems depends on the ability of the liquid to atomize and disperseinto the gas by interacting in a controlled manner. Experimental methods coupled with Computation Fluid Dynam-ics (CFD) can be used effectively in application design of a certain classes of spray evaporation processes. In this study, a spiral type nozzle was studied. Both water and air flow at different respective mass fractions (massflow rate of water over mass flow rate of air) were included while keeping the water flow the same. Phase DopplerInterferometry (PDI) and Laser Sheet Imaging (LSI) were used to measure the drop size and distribution throughoutthe range of operation conditions. The results indicated a slight reduction in drop size as air mass flow rate was in-creased. Additionally the increase in air flow caused a shift of the spray plume from predefined center axis. At the same flow conditions, an internal and external two-phase flow of the nozzle was simulated with a Volume ofFluid (VOF) model which is a Computation Fluid Dynamics (CFD) method for multiphase problems. The fluids’velocity environment at the nozzle’s orifice was investigated. As expected, the exit (from nozzle's orifice) velocitiesof the liquid increased as the mass fraction decreased due to increased total volume flow rate of both fluids. ( C orresponding author: wojciech.kalata@spray.com ) Global demand for gas fuels is expected to expandsignificantly as more nations adopt environmentallycleaner fuels to meet future economic growth and prior-itize alternatives to minimize the impact of increasingoil-based energy costs. The environmental benefits ofnatural gas are clear. Burning gas emits fewer carbonemissions than burning coal or oil. Various gases must be transported over long dis-tances and maintained. Cooling gases in such lines isone of the methods to keep gases at proper conditions.Flashing off the gases from the liquid phase prior theinjection into the main gas lines is a common occur-rence and it has to be dealt with. This process requiresfurther analysis, improvement and optimization..Theimprovements made in nozzle design and liquid atomi-zation process in recent years have provided the possi-bility of process optimization towards an improvementof transport efficiency. The combination of various testing techniques withcomputational fluid dynamics (CFD) allows for a rigor-ous engineering assessment and design of spray basedsystems. The focus of the present study was to analyzethe effect of presence of the gas phase in a spiral typenozzle spray injection. For various air-water mixtures,this study investigated drop size, droplet velocities andspray patterns that were obtained experimentally. Ad-ditionally, CFD was performed to analyze the velocityenvironment at the nozzle’'s orifice at the same mixtureconditions. Methods Process Conditions The experimental setup consisted of a spiral-typehollow cone nozzle (Spraying Systems Co., 3/8BSJ-6030 as shown in Figure 1) spraying water along withassistance of air. The water flow was kept constantwith changing air flow rate. All tests were carried out spraying vertically downward into air as shown in Fig-ure 2. The operating parameters for all tests are notedin Table 1. Note that a hydraulic case was added as areference with a “typical" spray condition which thisspiral nozzle was designed. It is important to note, thatthe air-assisted conditions had one-order of magnitudesmaller liquid flow rate than the hydraulic referencecase. Phase Doppler Interferometry The Phase Doppler Interferometry (PDI) systemused in this study was the Artium PDI 2D MD instru-ment with the integrated AIMS software used for auto-mated processor setup. This technique measures thedroplet size, velocity, angle of trajectory, and time ofarrival of each particle passing through an optical meas-urement volume formed by pairs of intersecting laserbeams. The technical explanation of the Phase Dopplertechnique can be reviewed in a number of publicationsincluding Bachalo et al. [1,2]. Figure 1. Spiral type spray nozzle (actual nozzle-leftand middle, CFD geometry-right). The ability to measure accurately requires the relia-ble characterization of the size, velocity, and transit Parameter Units Hydraulic 5% 10% 20% Mass Air Mass Air Mass Air Water Flow Rate L/min 17.11 1.893 1.893 1.893 Water Mass Flow Rate kg/s 2.847E-01 3.149E-02 3.149E-02 3.149E-02 Air Flow Rate Nm/hr 0 5.097 10.19 20.39 Air Mass Flow Rate kg/s 0 1.732E-03 3.465E-03 6.929E-03 0.055 0.110 0.220 *Hydraulic case was performed at increased flow rate to get equivalent drop size reading as compared to air-assisted cases. time of each droplet. The PDI system is a validatedmethod for droplet size and velocity measurement.Additionally, spray concentration measurementsarepossible, see Bade et al.[3,4]. The drop size and velocity measurements were per-formed 30.5 cm from the tip of the nozzle as shown inFigure 3. An intersection point of the x and y axes wasdirectly underneath the center of the nozzle. Laser Sheet Imaging The laser sheet imaging system implemented inthis study was a DaVis image acquisition and pro-cessing software. The LSI system utilizes a laser sheet,with a Gaussian intensity profile, which illuminated thespray in a single downstream plane. The Gaussian in-tensity profile of the laser sheet is characterized andcorrected for by imaging uniformly sizes fog dropletsover the entire image area. The laser sheet is approxi-mately 1 mm thick which is sufficiently thin to repre-sent a two dimensional sheet in the spray (z) direction,with images acquired in the x-y plane. The camera waslocated at an off-axis angle as shown in Figure 4.Theimage calibration was conducted by first imaging acalibration-sheet with markings of known size andspacing to characterize and correct the skewed cameraimages to the actual planar spray cross-section plane. Figure 2. Spray from a spiral type nozzle at differentair/water mass fraction cases. In order to determine time-averaged spray cover-age and shape information at each measurement,a min-imum of 500 instantaneous (very short exposure time) images are acquired, and the average of all 500 planarintensity distributions is taken. It is important to notethat the resultant mean images are representative of theaverage light intensity scattered through Mie scattering,but not droplets across the image plane. Over each im-age’s exposure time, each droplet that passes throughthe laser sheet will scatter light relative to its surfacearea. On average, the two-dimensional contours aretherefore representative of the total surface area ofdroplets, which is a coupled to the result that is relatedby an increase in the number of droplets and/or largerdroplets. Figure 3. Setup for the PDI measurements. Figure 4. Setup for the LSI measurements. Ultimately, these results provide good informationon the coverage and shape of the spray cross-section,and slightly less useful information on the surface areadistribution, rather than a more used volume distribu-tion, although there is still good qualitatively relevantinformation in it. The spray intensity profiles were measured similar-ly to PDI measurements. These profiles were obtained30.5 cm from the tip of the nozzle as shown in Figure 4.An intersection point of x and y-axes was directly un-derneath the center of the nozzle. This time the coordi-nate system indicating positive x-y positioning wasrotated 180 degrees. Computational Setup CFD simulations were performed with ANSYSFLUENT version 14.5. The CFD model was repro-duced according to the testing conditions where thenozzle orientation was aligned with experimental condi-tions. The geometry of the nozzle which is complicateddue to helical structures was reproduced in 3-Dmodeler(Autodesk Inventor 2013). This geometry is shown inthe right side of Figure 1.Meshing was performedwithin ANSYS Workbench 14.5 using the automatedmeshing tool. Initially, an unstructured grid was com-posed of 8.903 million mixed cells which employedboundary layer type inflation at all walls and utilizedsizing function at the helical surfaces of the nozzle.Inside FLUENT, the unstructured mesh was convertedinto polyhedral grid while the boundary layer meshremained. The grid was reduced to 2.114 million poly-hedral cells. Each CFD case was set up identically with liquidand air mass flow at inlet boundary condition (BC). Asnoted previously, liquid mass flow rate was kept con-stant. The air mass flow rate was changing accordinglyto experimental setup (see Tables 1 and 2). The outletpressure BC was setup as constant zero pressure withstandard 1 bar operating pressure and properly setupgravity term. Nozzle walls were set as rigid, with no-slip conditions. The density of water and air were con-stant (998.2 and 1.225 kg/m’respectively) omitting afact that at higher air to water mass ratio, the compress-ibility of air may be play additional role in changing theatomization process for this nozzle.. Throughout allsimulations, along with Volume of Fluid (VOF) model,the k-e Realizable Turbulence Model with Standard ent was used. The simulationiss were per-formed in steady state mode [5], which lead to an im-plicit scheme for VOF model. The gradients weresolved using Least Squares Cell Based method.l.TTheSecond Order Upwind discretization scheme was usedfor Momentum, Volume Fraction, and Turbulence,while the spatial discretization used for pressure was setto PRESTO!. SIMPLE scheme was used for Pressure-Velocity Coupling. Experimental Results As it was expected, the smallest relative overalldrop-size was for the highest air/water mass ratio(AWMR) case, or in another words, as the largest vol-ume of air was forced through the nozzle (see Figure 5).Overall Sauter Mean Diameter (SMD) was 97, 113, 122and 141 microns for 20%, 10%, 5% AWMR and hy-draulic cases respectively. The Median Volume Di-ameter (VMD) also expressed as Dvo.5 was 104, 121,131 and 160 for 20%,10%,5% AWMR and hydrauliccases respectively. Hydraulic (Q=17.11 L/min) --5% Air 10% Air --20% Air Figure 5. Overall drop size distributions for all cases. Units 5% 10% 20% Parameter Mass Air Mass Air Mass Air Water Mass Flow Rate kg/s 3.149E-02 3.149E-02 3.149E-02 Air Mass Flow Rate kg/s 1.732E-03 3.465E-03 6.929E-03 Average Inlet Velocity (from CFD) m/s 14.9 29.6 58.8 Inlet Pressure (from CFD) barg 0.289 0.603 1.32 Water Volume of Fluid Fraction 2.182E-02 1.103E-02 5.546E-03 Figure 6. Sauter Mean Diameter (top) and velocityprofiles (bottom) for all cases in x-axis. Figures 6 and 7 show Sauter-Mean Diameter(SMD) and droplet velocity distributions along center xand y axes. From Figure 2 it can be noticed that as theAWMR is increased, the spray plume skews to the side.The resulting plume skewness is manifested in the indata presented in Figures 6-9 by both the PDI and LSIresults. It appears, in addition, that primary droplet breakuptakes place prior the nozzle orifice. In PDI results, thedetectable zones show that air caused the plume shift inx-axis especially in 20% Mass Air case, where detectedregion for drop size was only on the positive sides forboth x and y axes.The drop size distribution was in-vestigated in more detailed manner by plotting out thecumulative volume distributions along both x and yaxes as shown in Figure 8. While overall drop size wasbased on volume flux weighting [3, 4], the data fromFigure 8 was generated from PDI point measurements.These plots indicated that lower drop size range regions(generally middle of the covered spatial range) correlat-ed with relatively higher droplet velocities (Figures 6and 7), and with higher intensity shown by LSI meas-urements (Figure 9). From figure 9, eccentricity of the spray plume in xdirection was assessed visually. Based on this visualassessment Hydraulic case seems to be aligned closelywith a nozzle. On the other hand, 20% Mass Air caseseems to shift almost the whole spray plume across thex axis. Figure 7./。SSauter Mean Diameter (top) and velocityprofiles (bottom) for all cases in y-axis The shift of the spray plume is believed to becaused by the air-water mixture that forces itself to es-cape as fast as possible through the upper region of thenozzle helix following the path of least resistance. Thiscreates an uneven distribution of flow is along the spi-ral. The higher the AWMR, the smaller the drops pro-duced but this results in significant plume eccentricity. CFD Results CFD was performed to investigate the velocity andwater volume of fluid at the orifice (Figure 10). Alsothe iso-surfaces were created based on the half of thewater VOF fraction value at the inlet (shown in table 2). The exit velocities at the orifices were on the orderof 50, 100 and 200 m/s for 5%, 10% and 20% AWMR,respectively. Since compressibility was not included inthis set of simulations, the exit velocity values wereproportional to mass flow rate ofair. Although the velocities and water VOF fractionswere different at the orifice, the iso-surface shapes werequite similar (Figure 10). A change in shape is antici-pated when the compressibility of air is included infuture simulations. Additionally, there are other things that should beconsidered in future simulations. One of them is surfacetension with higher fidelity schemes. This kind of tran-sient simulation (would probably require a demandingturbulence model) could help to determine the multi-phase nature of flow prior the injection, intermediatebreakup at the orifice, assuming primary does occurprior injection, and finally secondary breakup. Conclusions Spiral type nozzles are generally a deflecting typeof nozzles designed to spray hydraulically. However,adding gaseous phase flow changes the nozzles’intend-ed performance. This study has shown that drop sizewas reduced when air was added. However, the fastmoving air-water mixture caused spray plume eccen-tricity. CFD gave an inside look at the scales of thevelocities of air-water mixtures at the nozzle's orifice. References ( 1. Bachalo, W.D. and H ouser, M.J., “Phase Doppler Spray Analyzer f or Simultaneous Measurements o fDrop Size a nd V elocity D istributions,”Optical En- gineering, Volume 2 23, N umber 5, S e ptember-October, 1984. ) 2. Bachalo, W.D. and Houser, M.J., "Spray Drop Sizeand Velocity Measurements Using thePhase/Doppler Particle Analyzer", Proceedings ofthe ICLASS (3rd Intl.), July 1985. 3. Bade,K. M., Schick, R. J.,"Phase Doppler Interfer-ometry Volume Flux Sensitivity to Parametric Set-tings and Droplet Trajectory", Atomization andSprays, vol. 21, issue 7, p. 537-551,2011. 4. BEade, K. M., Schick, R. J., "Post-Processing ofPhase Doppler Interferometry Data for Planar SprayCharacteristics", ILASS-Americas conference,Pittsburgh, PA, May 2013. 5. ANSYS FLUENT 14.5 - Theory Guide, ANSYS,Inc., Canonsburg, PA, 2012. A B C Figure 8.Drop size distribution along x-axis (A) and along y-axis (B) for all cases.Percentage of cumulative volume distribution was applied (C). Figure 9. LSI results showing relative density distribution for all cases. Eccentricity in x-axis (top) and spray distri-bution at same intensity scale (bottom) Velocity Magnitude (m/s) YZ Liquid Volume Fraction Figure 10. CFD results for 3 cases with different air/water mass flow ratios. Velocity contours (top), iso-surfaces ofvolume of fluid (middle), and volume of fluid contours (bottom), Processes utilizing various spraying cooling are widely used in many gas treatment applications. Effective spray cooling system design optimization often depends on the approach used to investigate such gas cooling problems. The mass transfer efficiency of spray cooling problems depends on the ability of the liquid to atomize and disperse into the gas by interacting in a controlled manner. Experimental methods coupled with Computation Fluid Dynam-ics (CFD) can be used effectively in application design of a certain classes of spray evaporation processes. In this study, a spiral type nozzle was studied. Both water and air flow at different respective mass fractions (mass flow rate of water over mass flow rate of air) were included while keeping the water flow the same. Phase Doppler Interferometry (PDI) and Laser Sheet Imaging (LSI) were used to measure the drop size and distribution throughout the range of operation conditions. The results indicated a slight reduction in drop size as air mass flow rate was in-creased. Additionally the increase in air flow caused a shift of the spray plume from predefined center axis. At the same flow conditions, an internal and external two-phase flow of the nozzle was simulated with a Volume of Fluid (VOF) model which is a Computation Fluid Dynamics (CFD) method for multiphase problems. The fluids' velocity environment at the nozzle's orifice was investigated. As expected, the exit (from nozzle's orifice) velocities of the liquid increased as the mass fraction decreased due to increased total volume flow rate of both fluids.
确定
还剩6页未读,是否继续阅读?

产品配置单


北京欧兰科技发展有限公司为您提供《螺旋式喷嘴中喷雾液滴粒径分布检测方案(激光干涉仪)》,该方案主要用于其他中喷雾液滴粒径分布检测,参考标准--,《螺旋式喷嘴中喷雾液滴粒径分布检测方案(激光干涉仪)》用到的仪器有激光相位多普勒干涉仪LDV,PDI,PDPA,PDA、LaVision SprayMaster 喷雾成像测量系统、LaVision DaVis 智能成像软件平台
推荐专场


相关方案
更多
该厂商其他方案
更多