


方案详情
文
本文提出了一种利用LA-ICP-MS快速筛查血液中Pb含量的方法。血液样品被涂抹沉积在一个事先刻出微槽的聚合物板上。雕刻微槽使用的激光系统与进行分析的激光系统一样。在每一个微槽上,少量的血液样品被置于其中,这样就实现样品的分配。这些血液样品很快便干燥并利用LA-ICP-MS进行分析。外标法被用于定量,该外标法与溶液进样不同。内标元素为Fe,用于校正样品体积的变化。
获得208Pb/57Fe 定量的比率是通过使用文献的方法,该方法需要对信号进行转换。本文提出的方法成功应用于 Recipe ClinChek 血液样品的分析中,分析相对标准偏差为3%(n=6,Pb含量为442μg/L)。添加血液与没添加血液的样品也被用于分析,分析结果与传统溶液ICP-MS的分析结果吻合。本文中利用LA-ICP-MS对血液样品测定检出限为10μg/L。
方案详情

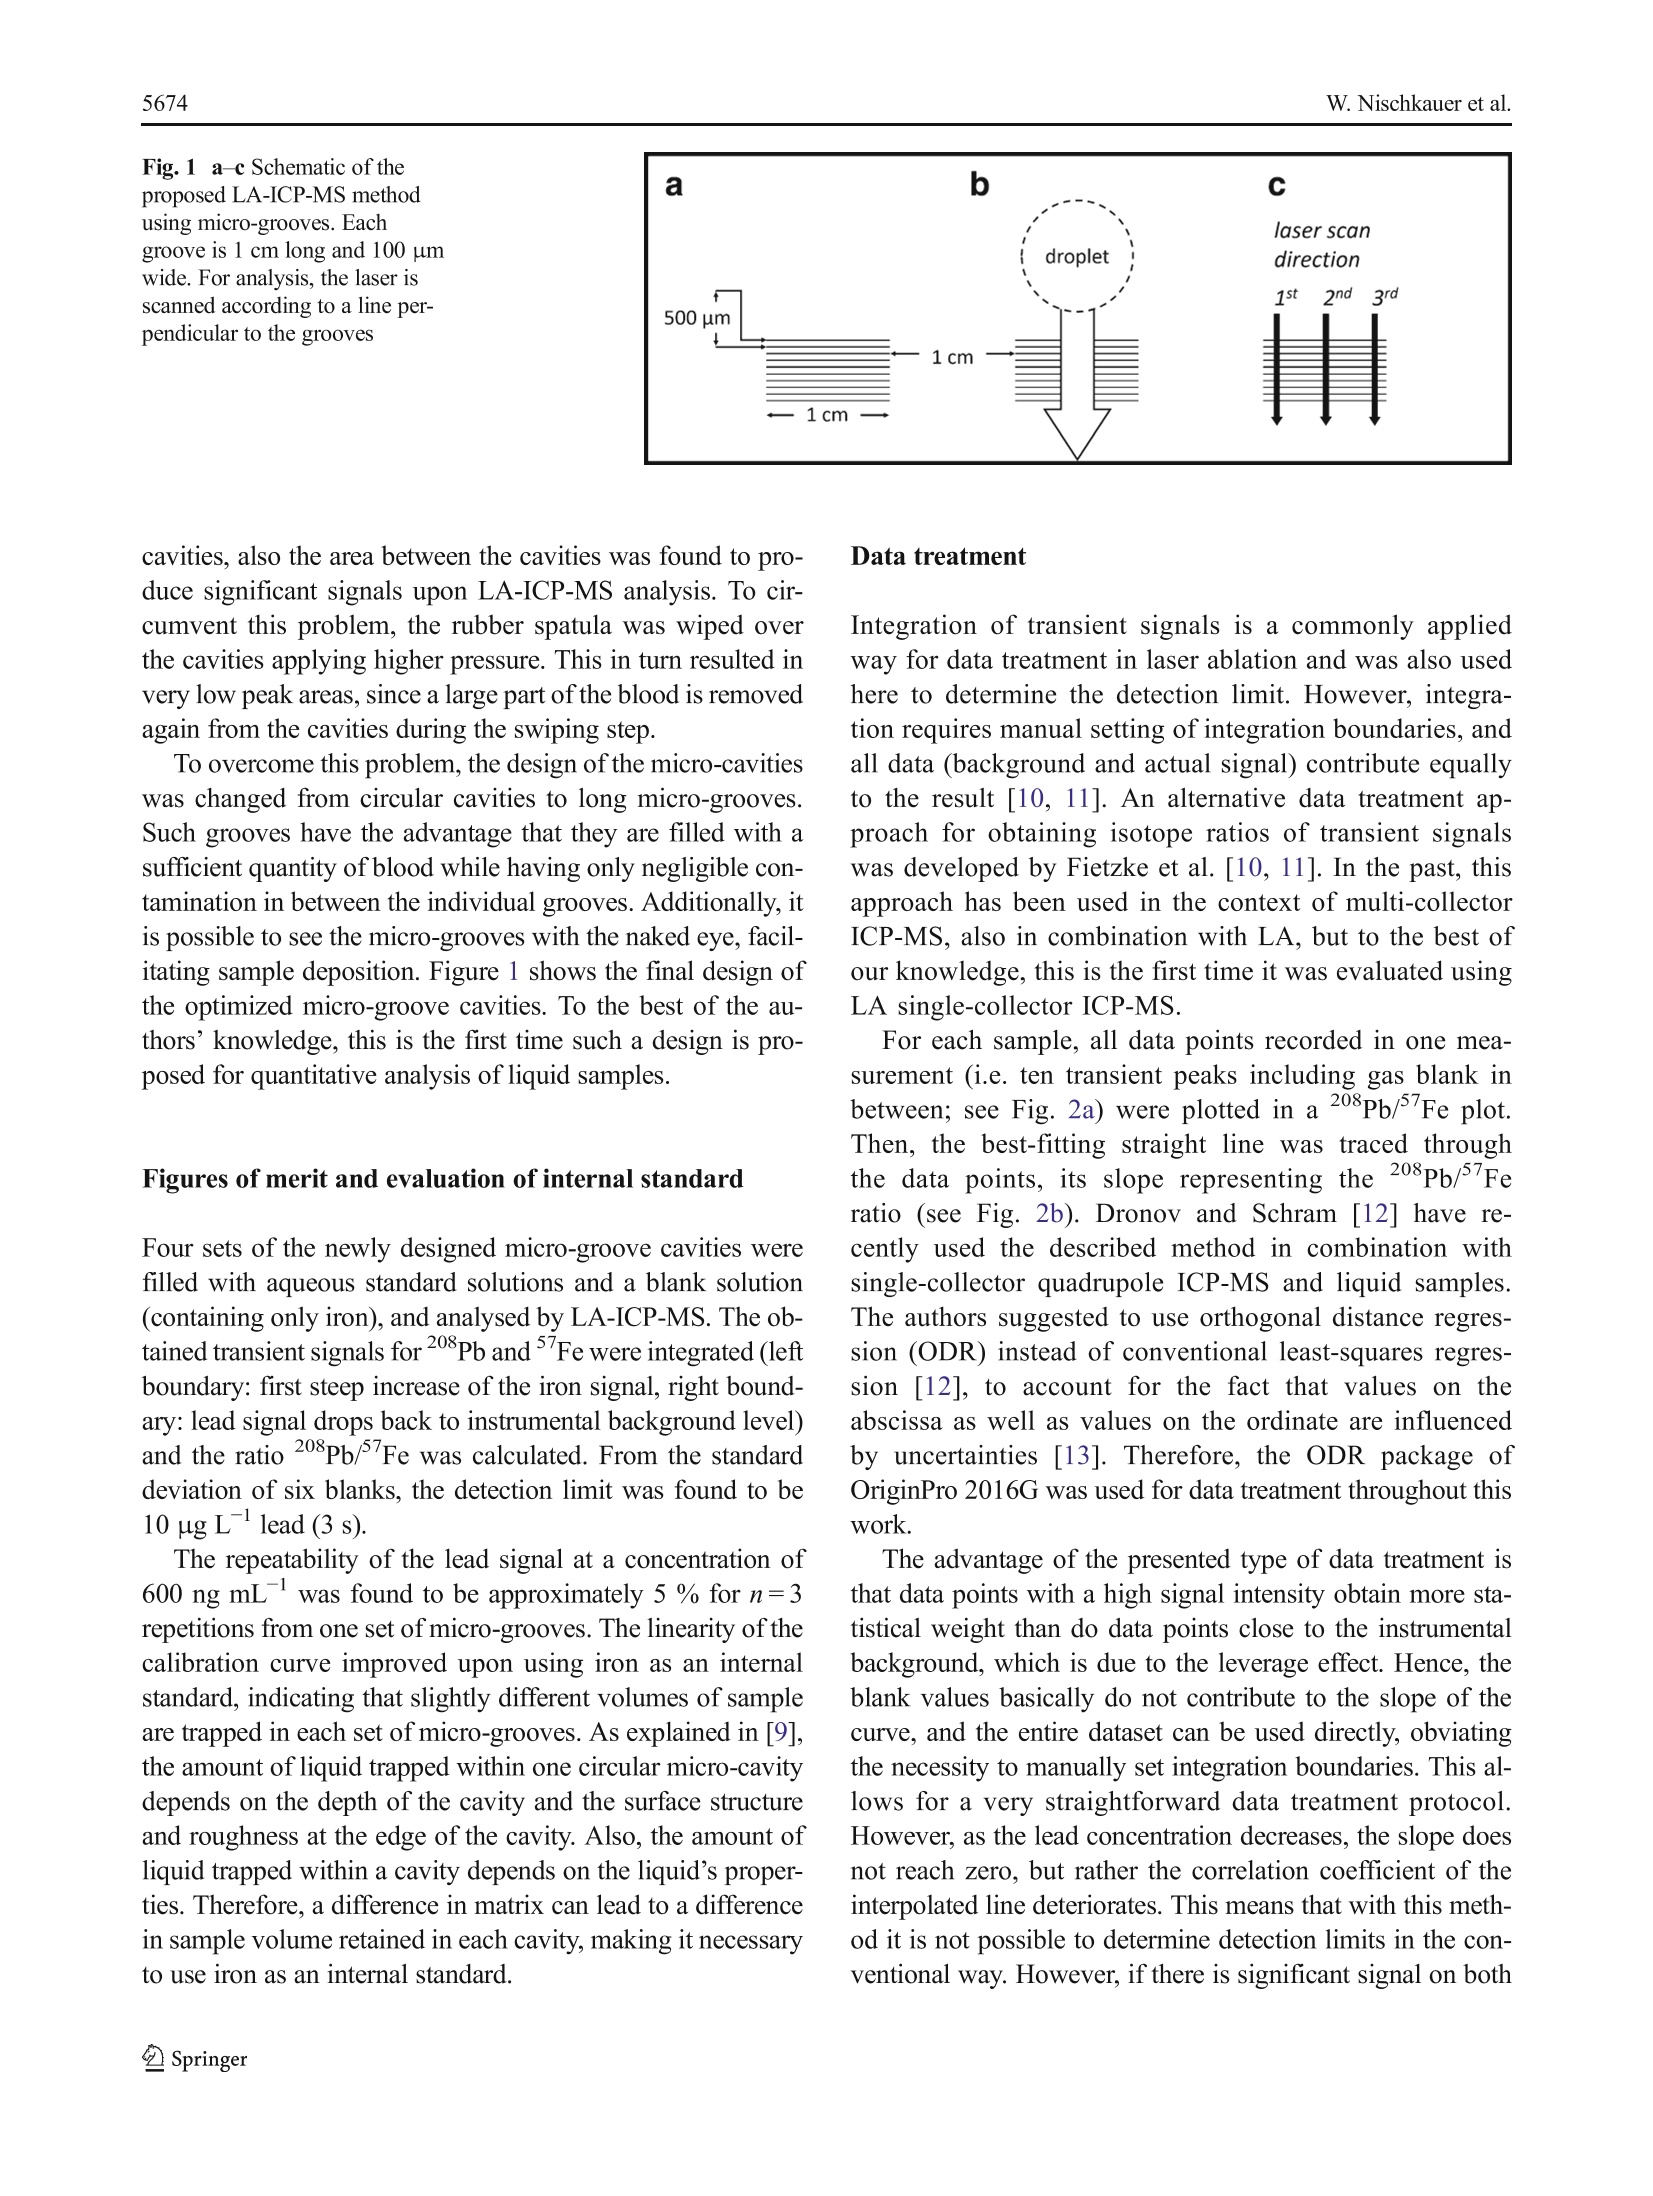
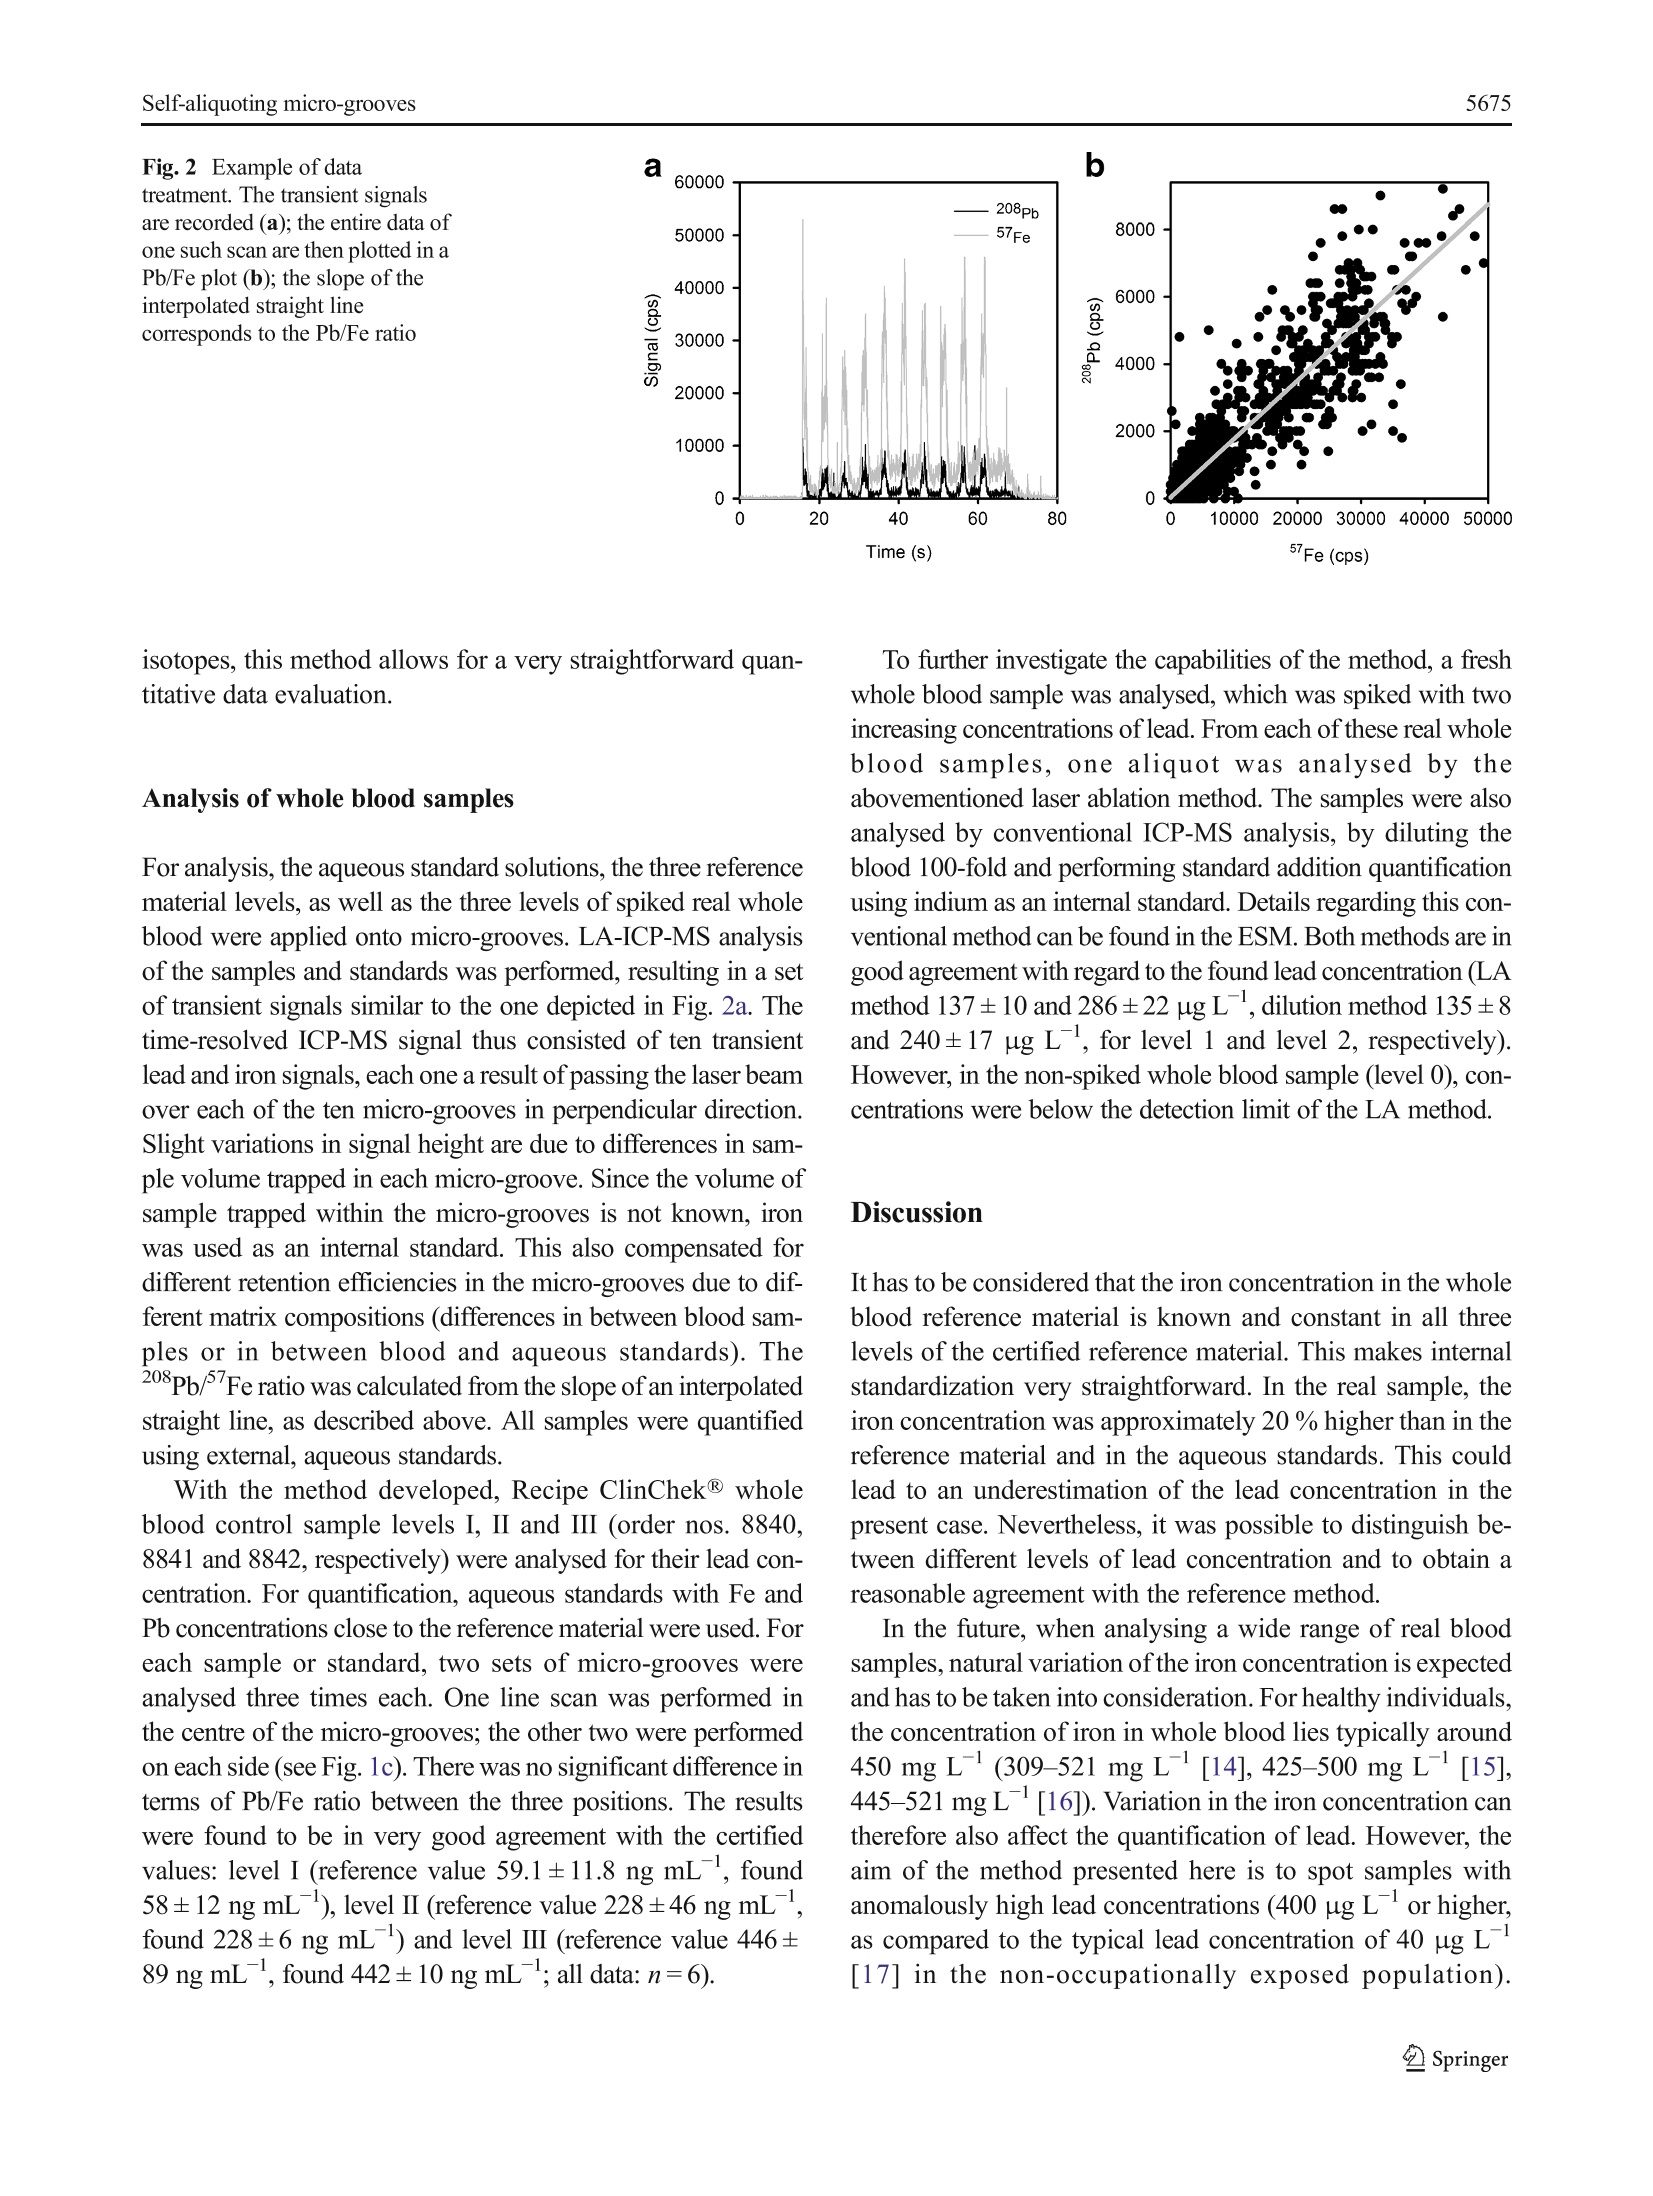
Anal Bioanal Chem (2016) 408:5671-5676DOI 10.1007/s00216-016-9717-3RAPID COMMUNICATION W.Nischkauer et al.5672 Self-aliquoting micro-grooves in combination with laserablation-ICP-mass spectrometry for the analysis of challengingliquids: quantification of lead in whole blood Winfried Nischkauer 1,2. Frank Vanhaecke. Andreas Limbeckl Abstract We present a technique for the fast screening ofthe lead concentration in whole blood samples using laserablation-inductively coupled plasma-mass spectrometry(LA-ICP-MS). The whole blood sample is deposited ona polymeric surface and wiped across a set of micro-grooves previously engraved into the surface. The engrav-ing of the micro-grooves was accomplished with the samelaser system used for LA-ICP-MS analysis. In eachgroove, a part of the liquid blood is trapped,and thus,the sample is divided into sub-aliquots. These aliquotsdry quasi instantly and are then investigated by meansof LA-ICP-MS. For quantification, external calibrationagainst aqueous standard solutions was relied on, withiron as an internal standard to account for varying vol-umes of the sample aliquots. The 208Pb/ Fe nuclide ratioused for quantification was obtained via a data treatmentprotocol so far only used in the context of isotope ratiodetermination involving transient signals. The methodpresented here was shown to provide reliable results forRecipe ClinChek@ Whole Blood Control levels I-III (nos.8840-8842), with a repeatability of typically 3 % relativestandard deviation (n=6, for Pb at 442 ug L). Spikedand non-spiked real whole blood was analysed as well, Electronic supplementary material The online version of this article(doi:10.1007/s00216-016-9717-3) contains supplementary material,which is available to authorized users. 区Andreas LimbeckAndreas.Limbeck@tuwien.ac.at Institute of Chemical Technologies and Analytics, TU Wien,Getreidemarkt 9/164-IAC, 1060 Vienna, Austria ( 2 Department o f Analytical C h emistry, Ghent University, Krijgslaan281-S12, 9000 Ghent, Belgium ) and the results were compared with those obtained viadilution and sectorfield ICP-MS. A good agreement be-tween both methods was observed. The detection limit(3s) for lead in whole blood was established to be10 ug L for the laser ablation method presented here. Keywords Laser ablation-ICP-MS·Whole blood analysis ·Lead quantification·Dried-droplet laser ablation· Transientsignals Introduction The metal lead is known for its toxicity, both acute and chronic.By substituting tetra-ethyl lead with purely organic compoundsas anti-knocking agents in petrol, by exchanging water pipesmade from lead with pipes made from polymeric material andby replacing the once widely used white pigment lead white2PbCOs·Pb(OH)2 with TiO2, the population is less exposed tothis metal than in the past. However, in certain work-relatedcontexts, exposure can still be high. According to a directiveof the council ofthe European Union [1],“medical surveillanceis carried out if [...] a blood-lead level greater than 400 ug PbLblood is measured in individual workers."To determine thelead concentration in whole blood of potentially exposedworkers, suitable analytical techniques are therefore required. Conventional approaches for analysis of lead in wholeblood usually require dilution or even digestion of the bloodmatrix prior to measurement. After digestion by means ofconcentrated mineral acids and oxidizers, the sample is alsodiluted. This clear solution is then suitable for analysis viagraphite furnace-atomic absorption spectrometry (GF-AAS)or inductively coupled plasma-mass spectrometry (ICP-MS).For digested and diluted samples, quantification can often beaccomplished via external aqueous calibration or matrix- adjusted calibration. However, chemical digestion of theblood matrix comes at the cost of low sample throughput,aswell as high reagent consumption, which in turn can lead toincreased blank values and costs. When simply diluting thesample, matrix effects have to be taken into consideration byusing standard addition. Moreover, coagulation of the bloodhas to be prevented, by diluting the blood as soon as possibleafter collection. Alternative approaches that avoid mineralization ordilution of blood can be found in the field of solid-sampling techniques. Among others, Resano et al. haveshown that it is possible to apply blood droplets ontofilter paper, to cut out the dry spot obtained and toanalyse it via GF-AAS for its lead content [2]. Insteadof AAS, which is essentially a single-element method,Cizdziel [3] proposed to use laser ablation (LA)-ICP-time-of-flight MS for analysis of blood dried on filterpaper. However, and in contrast to solid-sampling AAS, anaccurate and quantitative assessment of dried blood spotsby means of LA is a challenging task. The diameter of thelaser beam is in the micrometre range, whereas the diam-eter of a dried blood spot is typically in the millimetrerange. Therefore, only a part of the sample is consumedduring single-shot or spot-drilling analysis. For obtainingcorrect quantitative results, this small part of the sampleused for analysis has to be representative of the liquidblood sample before deposition. When depositing liquidson filter paper, chromatographic splitting into differentsample fractions is possible and thus might compromisethe sample’s homogeneity. As such effects can vary fromsample to sample, or between samples and standards, cor-rect quantification is severely hampered. An extended dis-cussion of the problems related with dried-droplet LA canbe found elsewhere [4]. One way to solve the problem of chromatographic sep-aration is to ablate the entire dried blood spot. Any lateralinhomogeneity is thus obviated. However, with commer-cial LA systems operating with repetition rates in thehertz range, ablation of such large areas can take a verylong time. There are femtosecond LA systems with repe-tition rates in the kilohertz range and with scan speeds ofseveral millimetres per second. Such systems can ablateone entire dried blood spot within reasonable time [5], yetthey are to date not available as routine instruments. Also,recently available ultra-fast cells allow higher laser repe-tition rates (up to several hundred Hz) using the moretraditional nanosecond LA systems [6]. Another possibility to solve the problem of non-representative sub-samples is to apply a radial scanningapproach. In a recent publication, we discussed this inmore detail [7]. The idea behind this concept is that anychromatographic separation of a deposited sample droplet should always be symmetrical to the centre ofthe dried spot. If the laser is scanned from one side tothe other across the dried spot, passing through the cen-tre of the spot, all possible chromatographic variationsare recorded. However, it is necessary to produce strict-ly circular droplets, and the shortcoming of this ap-proach is that sample application requires a skilledOperator. To compensate for chromatographic effects by ablating theentire droplet, while maintaining reasonable sample through-put and straightforward sample preparation, the size of theblood spot has therefore to be reduced [8]. However, pipettingvolumes in the nanolitre range using pipettes or syringes is achallenging task, and localizing such small dried droplets withthe microscope of the LA system is difficult. Therefore, astraightforward way for producing nanolitre sub-samples ofa liquid blood sample was developed in this work. Splitting a sample droplet into many identical sub-samplesin the nanolitre range can be achieved by means of self-aliquoting micro-array plates, as proposed by Pabst et al. inthe context of matrix-assisted laser desorption ionization massspectrometry (MALDI-MS) [9]. Such self-aliquoting arraysconsist of a smooth polymeric slide, which contains smallcavities of several micrometres in diameter. Such cavitiescan be readily produced with a LA system. If a liquid dropletis swiped over such cavities, small amounts of the liquid aretrapped in each cavity. In this contribution, the initial concept described in Pabst etal. [9] was successfully transferred from MALDI-MS to LA-ICP-MS and further optimized to allow for more straightfor-ward sample application and analysis. This approach wascombined with a data treatment scheme so far only used inthe context of isotope ratio determination with transient sig-nals. The method developed was applied to the determinationoflead in Recipe ClinChek@ whole blood reference materialand a freshly collected and spiked whole blood sample.External calibration against aqueous standard solutions andiron as an internal standard was possible. Materials and methods Reagents and standard solutions For standard dilution, water with a resistivity of 18 MQ cmobtained from an Easypure system (Thermo, Germany) wasused throughout. Single-element standard solutions at1000 mg Lwere obtained from Merck, Germany. Four stan-dard solutions were prepared from those stock solutions, withfinal lead concentrations of 26, 76, 316, and 614 ng mL.Each of these solutions contained iron at a concentration of376 ug mL. Recipe ClinChek@ Whole Blood Control levels I-III (nos.8840,8841 and 8842, containing 59.1, 228 and 446 ng mLlead as well as 379, 380 and 377 ug mLiron, respectively)were reconstituted using Easypure water according to themanufacturer’s instructions. Reconstituted blood referencematerial was used immediately for analysis and not storedlonger than 24 h. A fresh whole blood sample was investigated as well. Asthe concentration of lead in the sample was relatively low, twolevels of lead were spiked to the sample. First, the sample wassplit into three aliquots of 1 mL, and to each aliquot, 0.1 mL of1 % HNO3 containing adequate concentrations of lead wasadded. The concentrations of the spike were chosen such thatthe resulting whole blood contained spiked concentrations of0, 150, and 250 ng mL. The spiked volume was equal to10 % of the initial sample volume, and should result only inminimal changes of sample matrix, compared to the original,non-spiked blood. Instrumental The LA system used for production of the micro-array platesand the micro-grooves was a New Wave Research frequency-quintupled Nd: YAG solid-state laser operating at 213 nm. Thesame system was used for sample analysis via LA-ICP-MS.Ablation was carried out under helium atmosphere(0.8L min). After the ablation chamber, argon was admixedto the helium stream as make-up gas at a flow rate of0.8L min . The dry aerosol produced upon laser ablation wastransported into a Thermo iCAP Qc quadrupole ICP-MS unitoperating under standard conditions (1550 W plasma power,nickel cones, cool gas at 14 L min , auxiliary gas at0.8 L min, 5 ms dwell time, monitoring of the Fe and208Pb ion signals, total cycle time 13 ms). Data collectionwas accomplished using the instrument software (QTegra )in time-resolved mode. For comparing the laser approach presented here with atraditional nebulizer-based method, spiked and non-spiked re-al whole blood samples were diluted and analysed using stan-dard addition and a Thermo Element XR sectorfield instru-ment. Details on this method can be found in the ElectronicSupplementary Material (ESM). Micro-array plates and linear grooves Two different types of arrays were investigated for blooddeposition. First, micro-cavity arrays as described in Pabstet al. [9] were prepared by ablating circular craters intopoly (methyl methacrylate) (PMMA) microscope slides(2.5×7.2 cm, Betzold, Austria) using the NWR 213 LAsystem. The laser parameters used for production ofmicro-array plates were 7.5 J cmlaser fluence, 20 Hz repetition rate, 4 s dwell time and 100 um beam diameter.The distance between craters was 300 um and the craterswere arranged in a 4×4 pattern. The second, newly developed design consists of three setsof ten parallel grooves. Each of the grooves was 100 um wideand 1 cm long (see Fig. 1a). The laser parameters used forproduction of the micro-grooves were 10 J cmlaser fluence,20 Hz repetition rate, 100 um spot diameter and 100 um sscan speed. To fabricate one set of ten micro grooves, roughly15 min is required. This, and the fact that the slides are notexpensive, allows for single use of the slides. Deposition of blood and analysis of dry residues One small droplet (approximately 5 uL)of blood, referencematerial or aqueous standard solution was deposited on thepolymeric slide, just next to one set of linear micro-grooves.The liquid was then spread across the slide using a rubberspatula. After passing the micro-grooves, the remaining solu-tion was removed from the microscopic slide in one continu-ous motion (see Fig. 1b). Due to the small liquid volumetrapped in each groove or micro-array, the samples dried quasiinstantly. This approach was used for both types of slidescontaining micro-cavities following the design of Pabst et al.[9] as well as for the newly developed design using micro-grooves. The dried samples were analysed by means of LA-ICP-MS. Laser parameters used were 3.1 J cmlaser fluence,20 Hz repetition rate, 200 um spot diameter and 100 um sscan speed. In the case of the micro-cavities following thedesign by Pabst et al.[9], the laser traces used for analysiswere adjusted such that each cavity was consecutively ablated.In the case of the newly designed micro-grooves, the LA pat-tern was arranged in a way that each line scan crosses thegrooves perpendicularly (see Fig. 1c). Results Optimizing the design of the cavities In a first approach, micro-array plates with circular cavitieswere prepared and filled with aqueous standard solutionswhich were dried and analysed by LA-ICP-MS.The designof the cavities corresponds to the one described in [9] withminor variations. When analysing an aqueous standard with400 ng mLlead, typical values for the relative standarddeviation were around 5 % (n=16, 16 individual integratedpeak areas, one for each cavity, using iron as an internal stan-dard to compensate for varying filling of individual cavities). However, when filling the circular micro-cavities withwhole blood reference material, the results obtained were notsatisfying. Firstly, when wiping the blood swiftly over the Fig. 1 a-c Schematic of the cavities, also the area between the cavities was found to pro-duce significant signals upon LA-ICP-MS analysis. To cir-cumvent this problem, the rubber spatula was wiped overthe cavities applying higher pressure. This in turn resulted invery low peak areas, since a large part of the blood is removedagain from the cavities during the swiping step. To overcome this problem, the design of the micro-cavitieswas changed from circular cavities to long micro-grooves.Such grooves have the advantage that they are filled with asufficient quantity of blood while having only negligible con-tamination in between the individual grooves. Additionally, itis possible to see the micro-grooves with the naked eye, facil-itating sample deposition. Figure 1 shows the final design ofthe optimized micro-groove cavities. To the best of the au-thors’knowledge, this is the first time such a design is pro-posed for quantitative analysis of liquid samples. Figures of merit and evaluation of internal standard Four sets of the newly designed micro-groove cavities werefilled with aqueous standard solutions and a blank solution(containing only iron), and analysed by LA-ICP-MS. The ob-tained transient signals for 208Pb andFe were integrated (leftboundary: first steep increase of the iron signal, right bound-ary:lead signal drops back to instrumental background level)and the ratio 208Pb/ Fe was calculated. From the standarddeviation of six blanks, the detection limit was found to be10 ug Llead(3 s). The repeatability of the lead signal at a concentration of600 ng mLwas found to be approximately 5% for n=3repetitions from one set of micro-grooves. The linearity of thecalibration curve improved upon using iron as an internalstandard, indicating that slightly different volumes of sampleare trapped in each set of micro-grooves. As explained in [9],the amount of liquid trapped within one circular micro-cavitydepends on the depth of the cavity and the surface structureand roughness at the edge of the cavity. Also, the amount ofliquid trapped within a cavity depends on the liquid’s proper-ties. Therefore, a difference in matrix can lead to a differencein sample volume retained in each cavity, making it necessaryto use iron as an internal standard. Integration of transient signals is a commonly appliedway for data treatment in laser ablation and was also usedhere to determine the detection limit. However, integra-tion requires manual setting of integration boundaries, andall data (background and actual signal) contribute equallyto the result [10, 11]. An alternative data treatment ap-proach for obtaining isotope ratios of transient signalswas developed by Fietzke et al.[10, 11]. In the past, thisapproach has been used in the context of multi-collectorICP-MS, also in combination with LA, but to the best ofour knowledge, this is the first time it was evaluated usingLA single-collector ICP-MS. For each sample, all data points recorded in one mea-surement (i.e. ten transient peaks including gas blank inbetween; see Fig. 2a) were plotted in a 208pb/Fe plot.Then, the best-fitting straight line was traced throughthe data points, its slope representing the 208Pb/Feratio (see Fig. 2b). Dronov and Schram [12] have re-cently used the described method in combination withsingle-collector quadrupole ICP-MS and liquid samples.The authors suggested to use orthogonal distance regres-sion (ODR) instead of conventional least-squares regres-sion [12], to account for the fact that values on theabscissa as well as values on the ordinate are influencedby uncertainties [13]. Therefore, the ODR package ofOriginPro 2016G was used for data treatment throughout thiswork. The advantage of the presented type of data treatment isthat data points with a high signal intensity obtain more sta-tistical weight than do data points close to the instrumentalbackground, which is due to the leverage effect. Hence, theblank values basically do not contribute to the slope of thecurve, and the entire dataset can be used directly,obviatingthe necessity to manually set integration boundaries. This al-lows for a very straightforward data treatment protocol.However, as the lead concentration decreases, the slope doesnot reach zero, but rather the correlation coefficient of theinterpolated line deteriorates. This means that with this meth-od it is not possible to determine detection limits in the con-ventional way. However, if there is significant signal on both isotopes, this method allows for a very straightforward quan-titative data evaluation. Analysis of whole blood samples For analysis, the aqueous standard solutions, the three referencematerial levels, as well as the three levels of spiked real wholeblood were applied onto micro-grooves. LA-ICP-MS analysisof the samples and standards was performed, resulting in a setof transient signals similar to the one depicted in Fig. 2a. Thetime-resolved ICP-MS signal thus consisted of ten transientlead and iron signals, each one a result of passing the laser beamover each of the ten micro-grooves in perpendicular direction.Slight variations in signal height are due to differences in sam-ple volume trapped in each micro-groove. Since the volume ofsample trapped within the micro-grooves is not known, ironwas used as an internal standard. This also compensated fordifferent retention efficiencies in the micro-grooves due to dif-ferent matrix compositions (differences in between blood sam-ples or in between blood and aqueous standards). The208pb/’Fe ratio was calculated from the slope of an interpolatedstraight line, as described above. All samples were quantifiedusing external, aqueous standards. With the method developed, Recipe ClinChek@ wholeblood control sample levels I, II and III (order nos. 8840,8841 and 8842, respectively) were analysed for their lead con-centration. For quantification, aqueous standards with Fe andPb concentrations close to the reference material were used. Foreach sample or standard, two sets of micro-grooves wereanalysed three times each. One line scan was performed inthe centre of the micro-grooves; the other two were performedon each side (see Fig. 1c). There was no significant difference interms of Pb/Fe ratio between the three positions. The resultswere found to be in very good agreement with the certifiedvalues: level I (reference value 59.1±11.8 ng mL, found58±12 ng mL), level I (reference value 228±46 ng mL,found 228±6 ng mL) and level ⅢI (reference value 446±89 ng mL, found 442±10 ng mL; all data:n=6). To further investigate the capabilities of the method, a freshwhole blood sample was analysed, which was spiked with twoincreasing concentrations of lead. From each of these real wholeblood samples, one aliquot was analysed by theabovementioned laser ablation method. The samples were alsoanalysed by conventional ICP-MS analysis, by diluting theblood 100-fold and performing standard addition quantificationusing indium as an internal standard. Details regarding this con-ventional method can be found in the ESM. Both methods are ingood agreement with regard to the found lead concentration (LAmethod 137±10 and 286±22 ug L, dilution method 135±8and 240±17 ug L, for level 1 and level 2, respectively).However, in the non-spiked whole blood sample (level 0), con-centrations were below the detection limit of the LA method. Discussion It has to be considered that the iron concentration in the wholeblood reference material is known and constant in all threelevels of the certified reference material. This makes internalstandardization very straightforward. In the real sample, theiron concentration was approximately 20 % higher than in thereference material and in the aqueous standards. This couldlead to an underestimation of the lead concentration in thepresent case. Nevertheless, it was possible to distinguish be-tween different levels of lead concentration and to obtain areasonable agreement with the reference method. In the future, when analysing a wide range of real bloodsamples, natural variation of the iron concentration is expectedand has to be taken into consideration. For healthy individuals,the concentration of iron in whole blood lies typically around450 mg L(309-521 mg L[14], 425-500 mg L[15],445-521 mg L[16]). Variation in the iron concentration cantherefore also affect the quantification of lead. However, theaim of the method presented here is to spot samples withanomalously high lead concentrations (400 ug L-or higher,as compared to the typical lead concentration of 40 ug L[17] in the non-occupationally exposed population). Variations in iron concentration should therefore not lead tofalse-negative results for the lead concentration. In otherwords, even with natural variations in the iron concentration,anomalously high lead concentrations will still be detected.Samples thus identified can then be investigated with moreaccurate but more time-consuming conventional methods.However, monitoring the iron level in whole blood wouldimprove the accuracy of the analysis if needed in a differentcontext. Along the same lines, accuracy can also be furtherimproved by monitoring all four, or at least the three mostabundant, isotopes of lead to take into account natural varia-tion in the isotopic composition of the element. AcknowledgmentstsCOpen access funding provided by TU Wien(TUW). The work presented in this article was financially supported bythe Austrian Science Fund FWF under project number P25030-N28.W.N. would like to thank H. Lohninger for fruitful discussions aboutorthogonal distance regression, E. Bolea Fernandez and M. Bonta for helpduring the analysis of real whole blood samples, and M. Costas-Rodriguezfor providing literature on element concentrations in whole blood. Compliance with ethical standards The authors declare that they haveno conflict of interest. Human whole blood was used for method validation. Ethical approvalwas obtained for using these samples by an independent commissionconnected to the Ghent University Hospital. Blood donors signed an informed consent. Open Access This article is distributed under the terms of the CreativeCommons Attribution 4.0 International License (http://creativecommons.org/licenses/by/4.0/), which permits unrestricted use,distribution, and reproduction in any medium, provided you giveappropriate credit to the original author(s) and the source, provide a linkto the Creative Commons license, and indicate if changes were made. References 1. The Council of the European Union (1998) COUNCILDIRECTIVE 98/24/EC of 7 April 1998 on the protection of thehealth and safety ofworkers from the risks related to chemicalagents at work (fourteenth individual Directive within the meaningof Article 16(1) of Directive 89/391/EEC), L 131, 11-23, Annex II 2. Resano M, Rello L, Garcia-Ruiz E,Belarra MA. Minimally-invasive filter paper test in combination with solid sampling-graphite furnace atomic absorption spectrometry for Pb determina-tion in whole blood.J Anal At Spectrom. 2007;22(10):1250. 3. Cizdziel JV. Determination of lead in blood by laser ablationICP-TOF-MS analysis of blood spotted and dried on filterpaper. A feasibility study. Anal Bioanal Chem. 2007;388(3):603-11. 4. Limbeck A, Galler P, Bonta M, Bauer G,Nischkauer W, VanhaeckeF. Recent advances in quantitative LA-ICP-MS analysis.Challenges and solutions in the life sciences and environmentalchemistry. Anal Bioanal Chem. 2015;407(22):6593-617. 5. Aramendia M, Rello L, Berail S, Donnard A, Pecheyran C,Resano M. Direct analysis of dried blood spots byfemtosecond-laser ablation-inductively coupled plasma-massspectrometry. Feasibility of split-flow laser ablation for si-multaneous trace element and isotopic analysis. J Anal AtSpectrom. 2015;30(1):296-309. 6. Van Malderen SJM, Managh AJ, Sharp BL, Vanhaecke F. Recentdevelopments in the design of rapid response cells for laser abla-tion-inductively coupled plasma-mass spectrometry and their im-pact on bioimaging applications. J Anal At Spectrom. 2016;31:423-39. .7. Nischkauer W, Vanhaecke F, Bernacchi S, Herwig C, Limbeck A.1g(Radial line-scans as representative sampling strategy in dried-droplet laser ablation of liquid samples deposited on pre-cut filterpaper disks. Spectrochim Acta B. 2014;101:123-9. 8. Fotynova P, Bednarik A, Kanicky V, Preisler J. Diode laser thermalvaporization ICP MS with a simple tubular cell for determination oflead and cadmium in whole blood. J Anal At Spectrom. 2014;29(9):1585. 9 Pabst M, Fagerer SR, Kohling R, Kuster SK, Steinhoff R,Badertscher M, et al. Self-aliquoting microarray plates for accuratequantitative matrix-assisted laser desorption/ionization mass spec-trometry. Anal Chem. 2013;85(20):9771-6. 10.).Fietzke J et al. An alternative data acquisition and evaluation strat-egy for improved isotope ratio precision using LA-MC-ICP-MSapplied to stable and radiogenic strontium isotopes in carbonates.J Anal At Spectrom. 2008;23:955-61. 11...Fietzke J, Frische M, Hansteen TH, Eisenhauer A. A simplifiedprocedure for the determination of stable chlorine isotope ratios(d37Cl) using LA-MC-ICP-MS. J Anal At Spectrom. 2008;23:769-72. 12. Dronov M, Schram J. A method for increasing the precision ofisotope ratio analysis on a quadrupole ICP-MS based on measure-ments of lead and strontium. J Anal At Spectrom. 2013;28(11):1796. 13. Boggs PT, Rogers JE Orthogonal distance regression, NISTIR 89-4197, National Institute of Standards and Technology, Center forComputing and Applied Mathematics. 14 Iyengar V, Wolttiez J. Trace elements in human clinical specimens:evaluation of literature data to identify reference values.Clin Chem.1988;34(3):474-81. 15. Iyengar V. Reevaluation of the trace element content in referenceman. Radiat Phys Chem. 1998;51(4-6):545-60. 16. Harrington JM, Young DJ, Essader AS, Sumner SJ, Levine KE.Analysis of human serum and whole blood for mineral content byICP-MS and ICP-OES. Development of a mineralomics method.Biol Trace Elem Res. 2014;160(1):132-42. 17. Kosnet MJ et al. Recommendations for medical managementof adult lead exposure. Environ Health Perspect. 2007;115:463-71. pringer 本文提出了一种利用LA-ICP-MS快速筛查血液中Pb含量的方法。血液样品被涂抹沉积在一个事先刻出微槽的聚合物板上。雕刻微槽使用的激光系统与进行分析的激光系统一样。在每一个微槽上,少量的血液样品被置于其中,这样就实现样品的分配。这些血液样品很快便干燥并利用LA-ICP-MS进行分析。外标法被用于定量,该外标法与溶液进样不同。内标元素为Fe,用于校正样品体积的变化。获得208Pb/57Fe 定量的比率是通过使用文献的方法,该方法需要对信号进行转换。本文提出的方法成功应用于 Recipe ClinChek 血液样品的分析中,分析相对标准偏差为3%(n=6,Pb含量为442μg/L)。添加血液与没添加血液的样品也被用于分析,分析结果与传统溶液ICP-MS的分析结果吻合。本文中利用LA-ICP-MS对血液样品测定检出限为10μg/L。
确定
还剩4页未读,是否继续阅读?

产品配置单
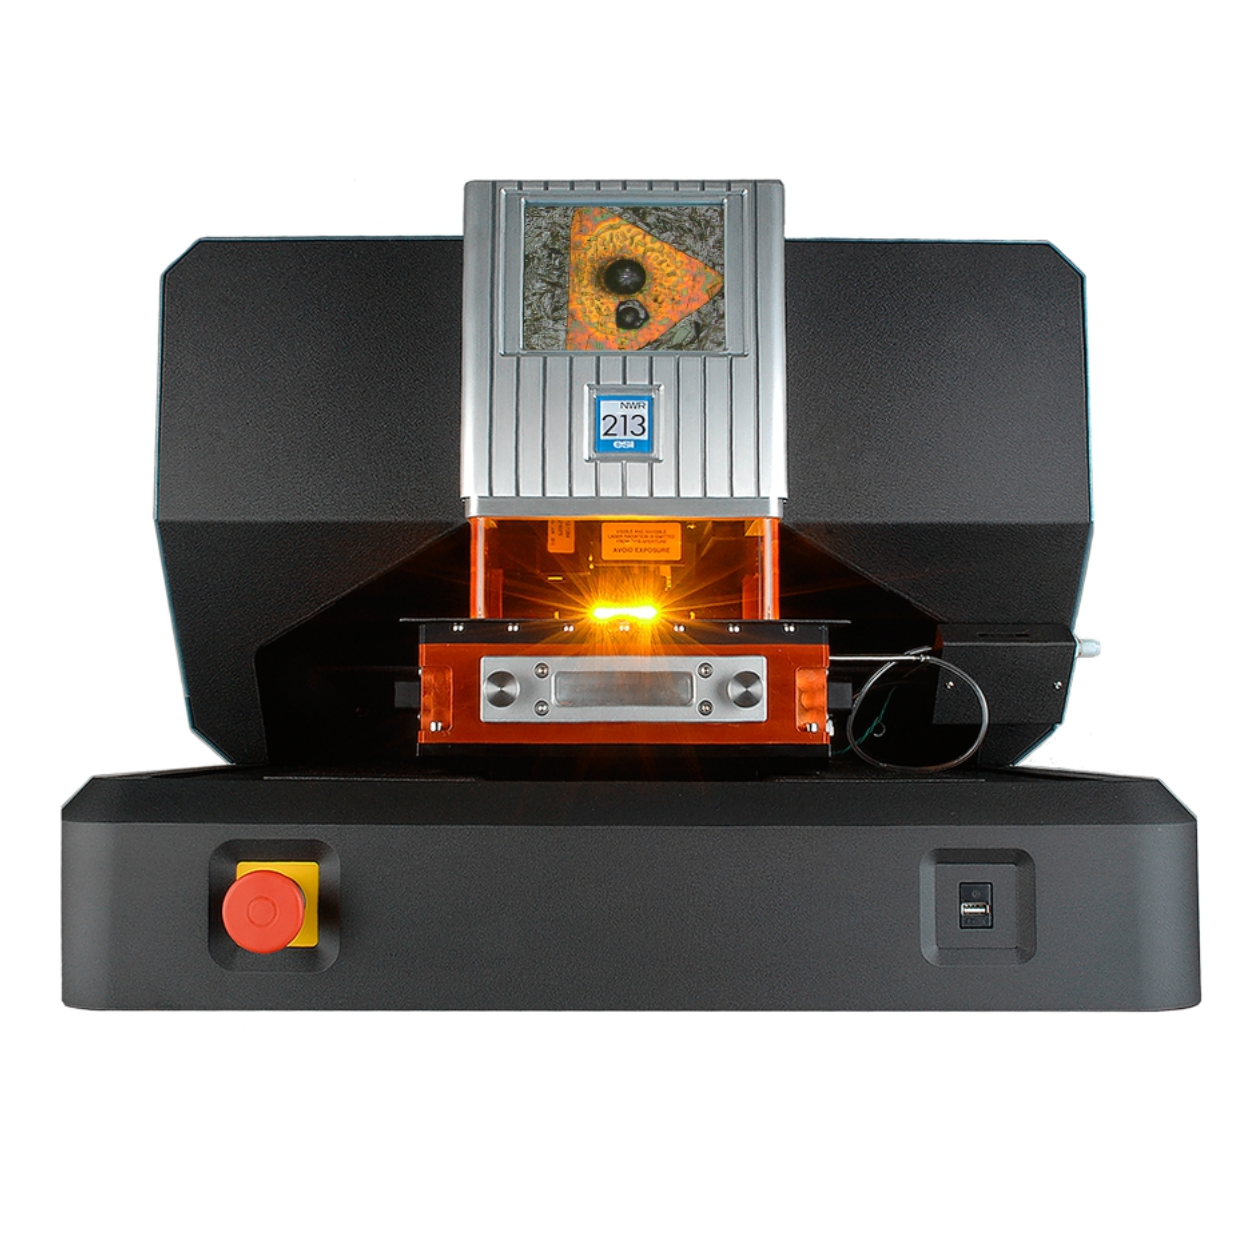
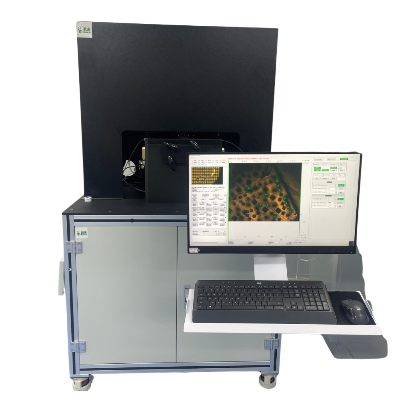
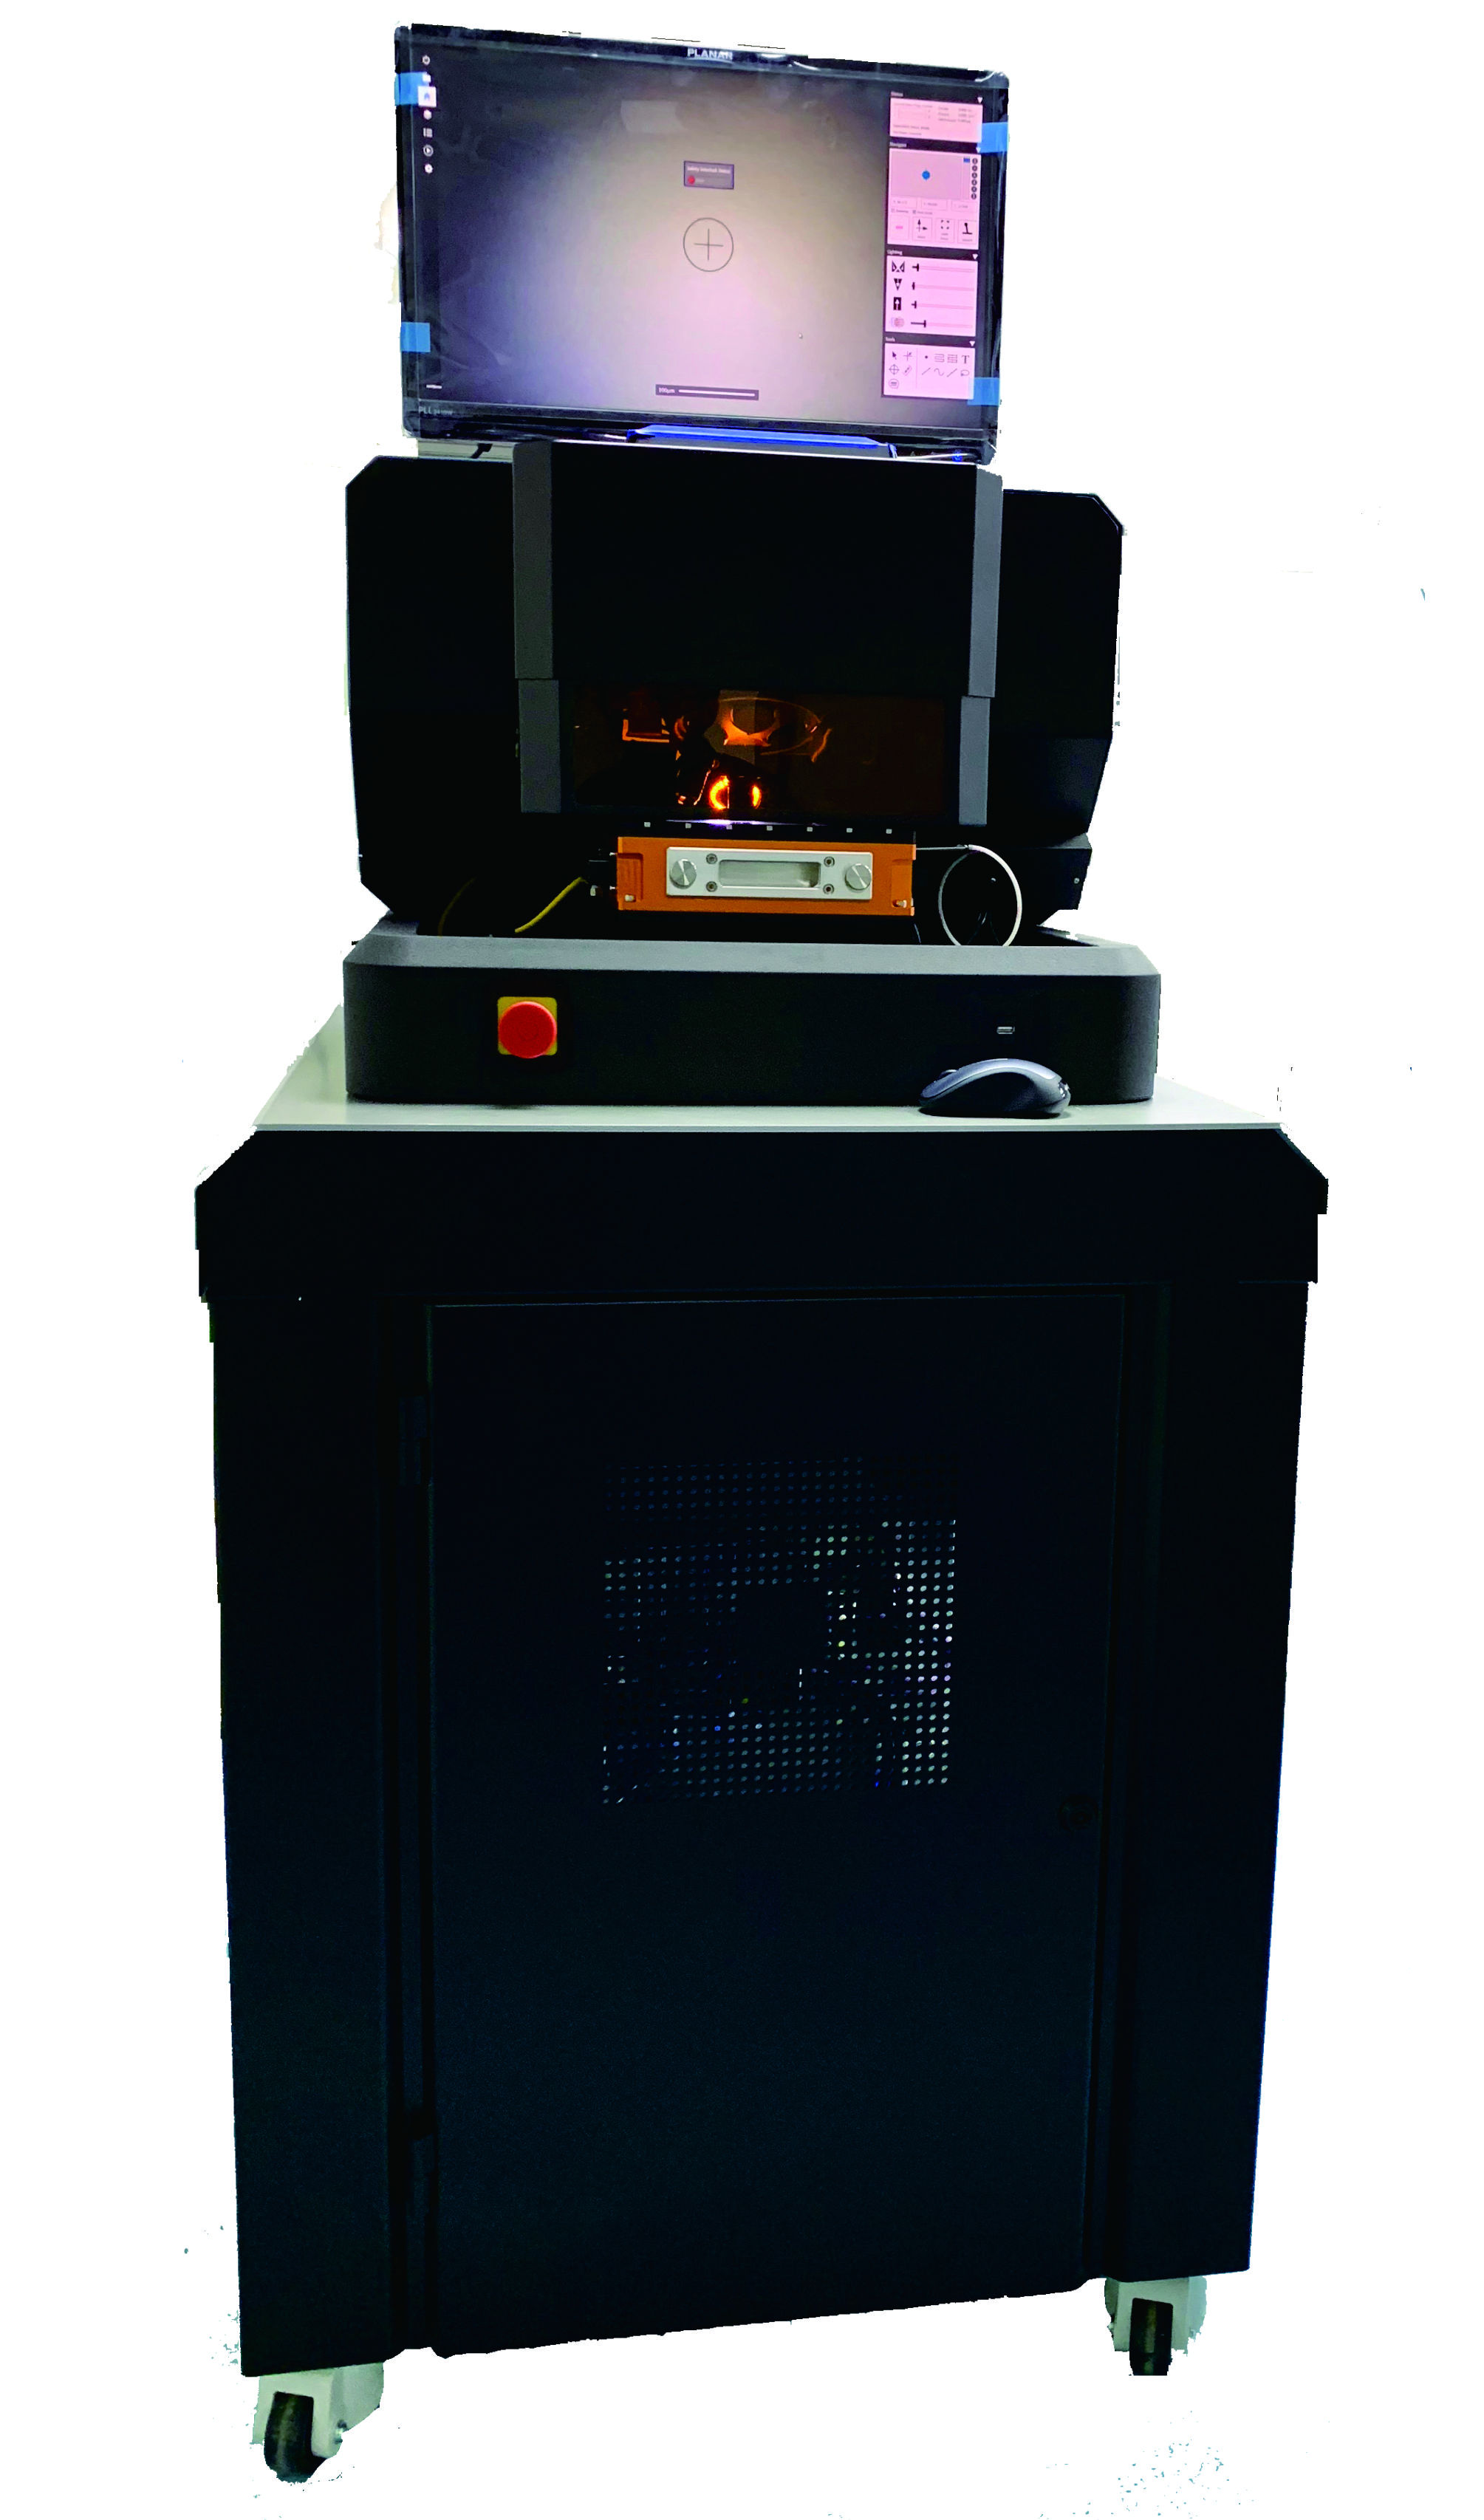
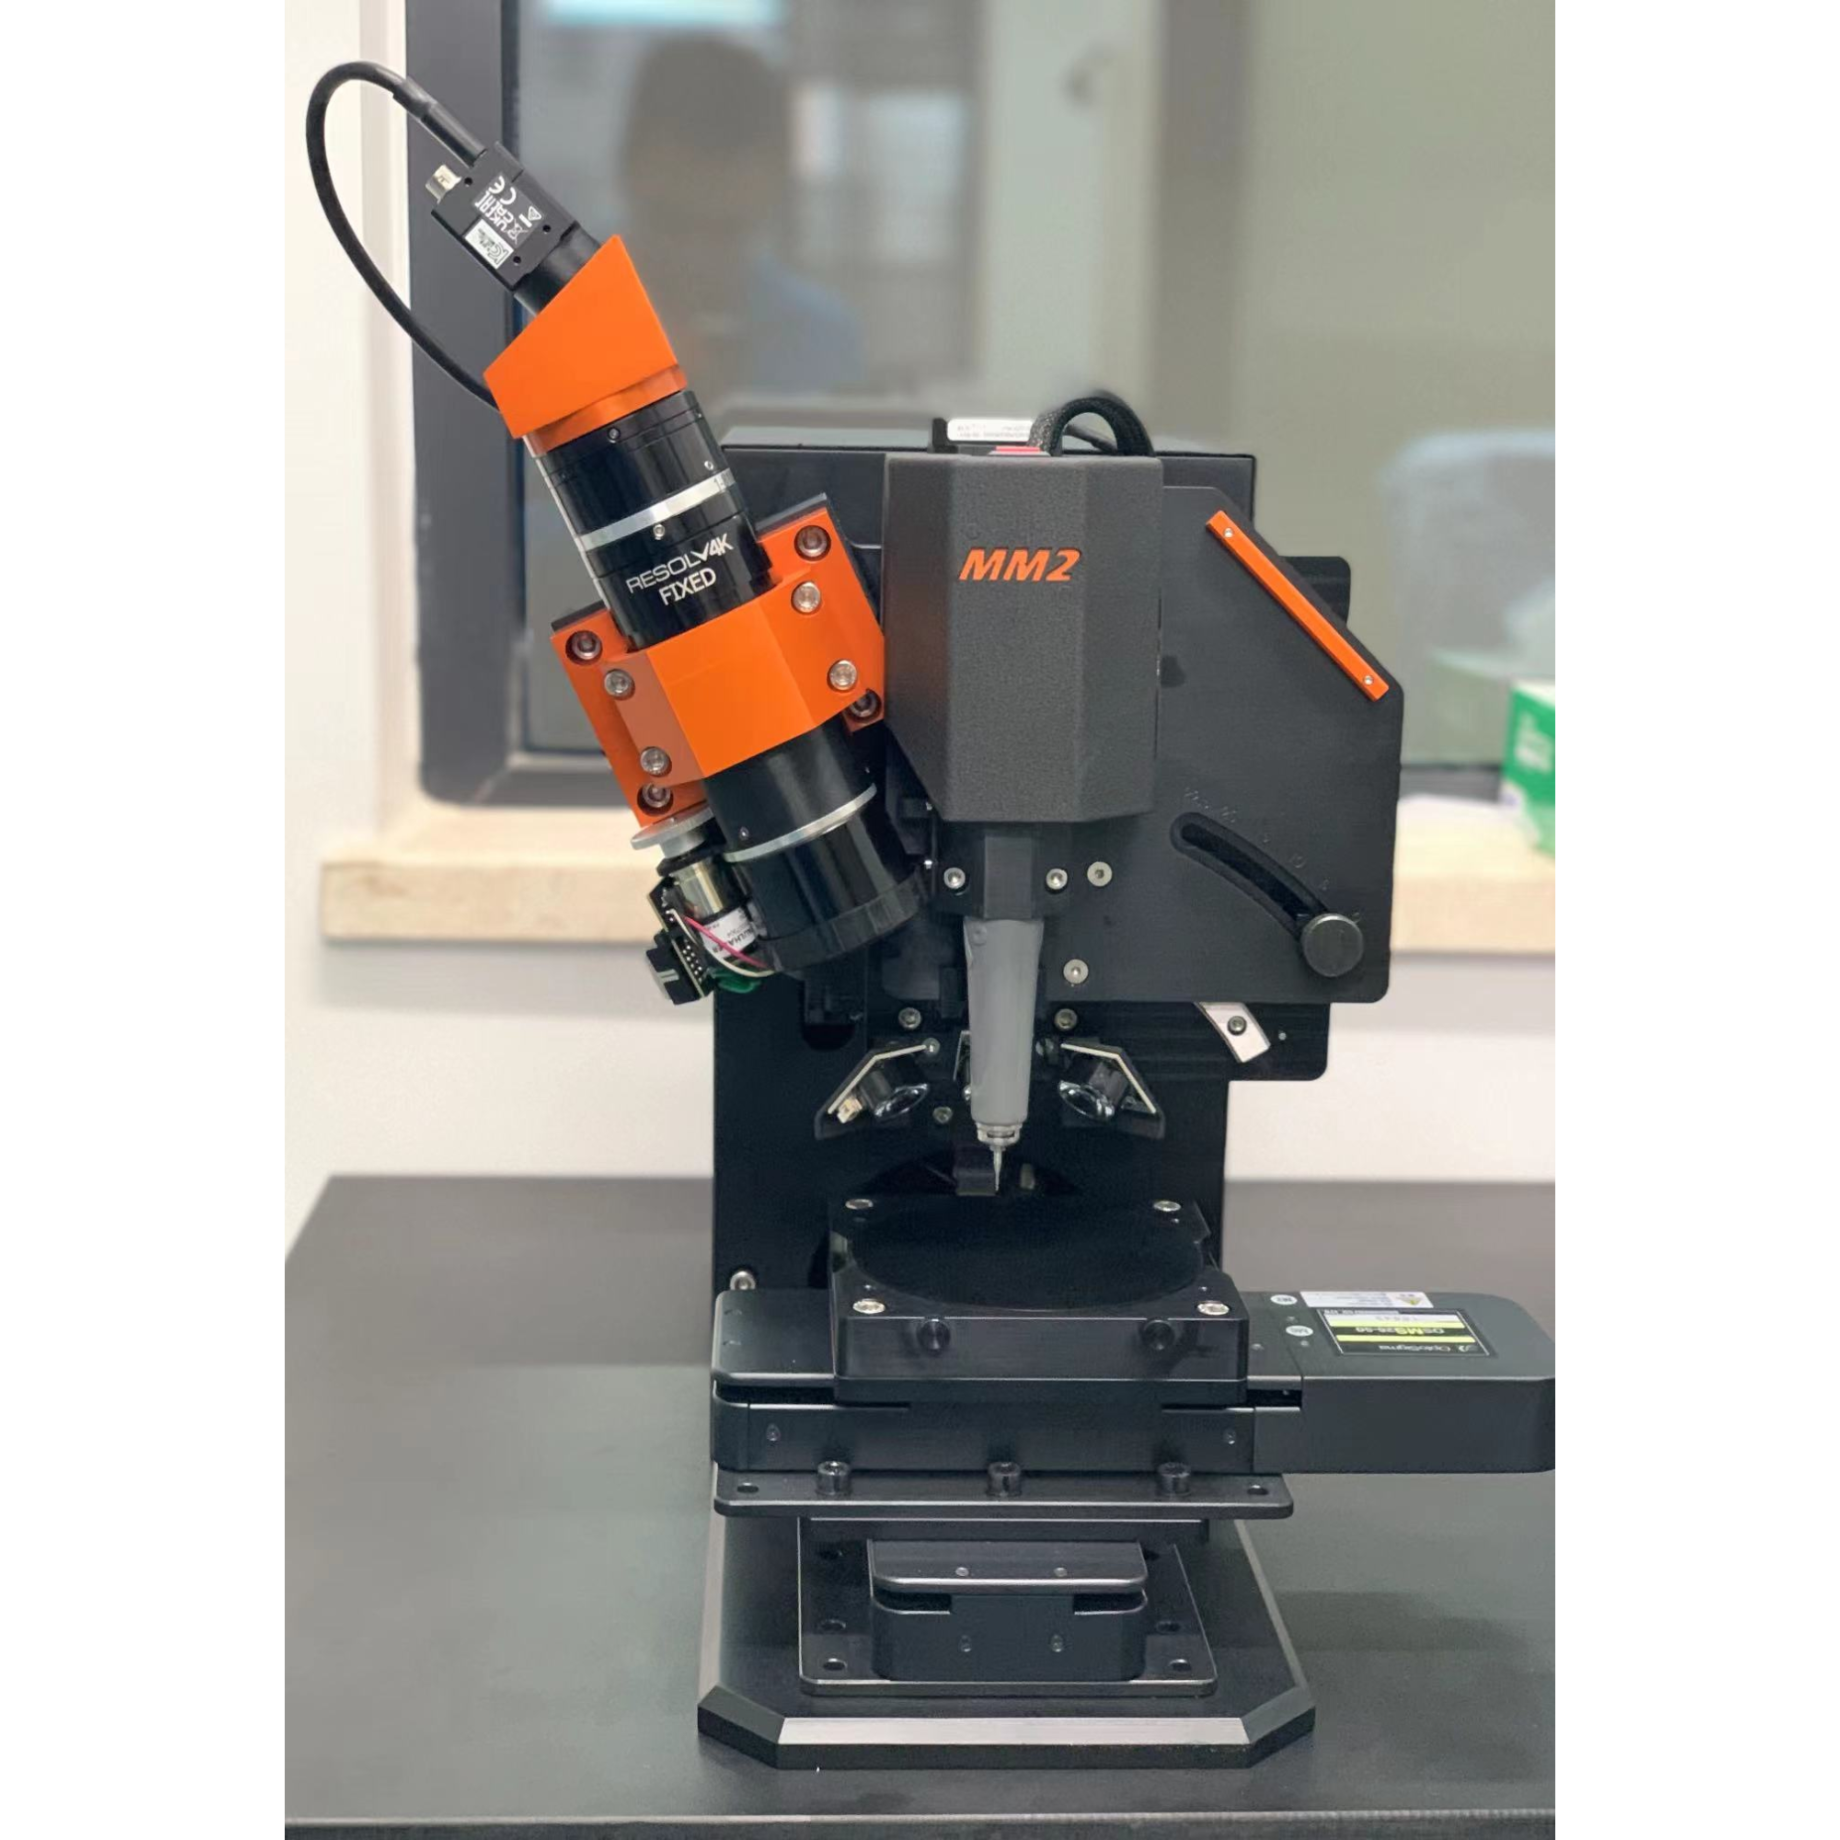
上海凯来仪器有限公司为您提供《液体样品:全血中铅检测方案(激光剥蚀进样)》,该方案主要用于全血/血清/血浆中铅检测,参考标准--,《液体样品:全血中铅检测方案(激光剥蚀进样)》用到的仪器有ESL213 灵活的激光剥蚀系统
推荐专场
相关方案
更多
该厂商其他方案
更多