


方案详情
文
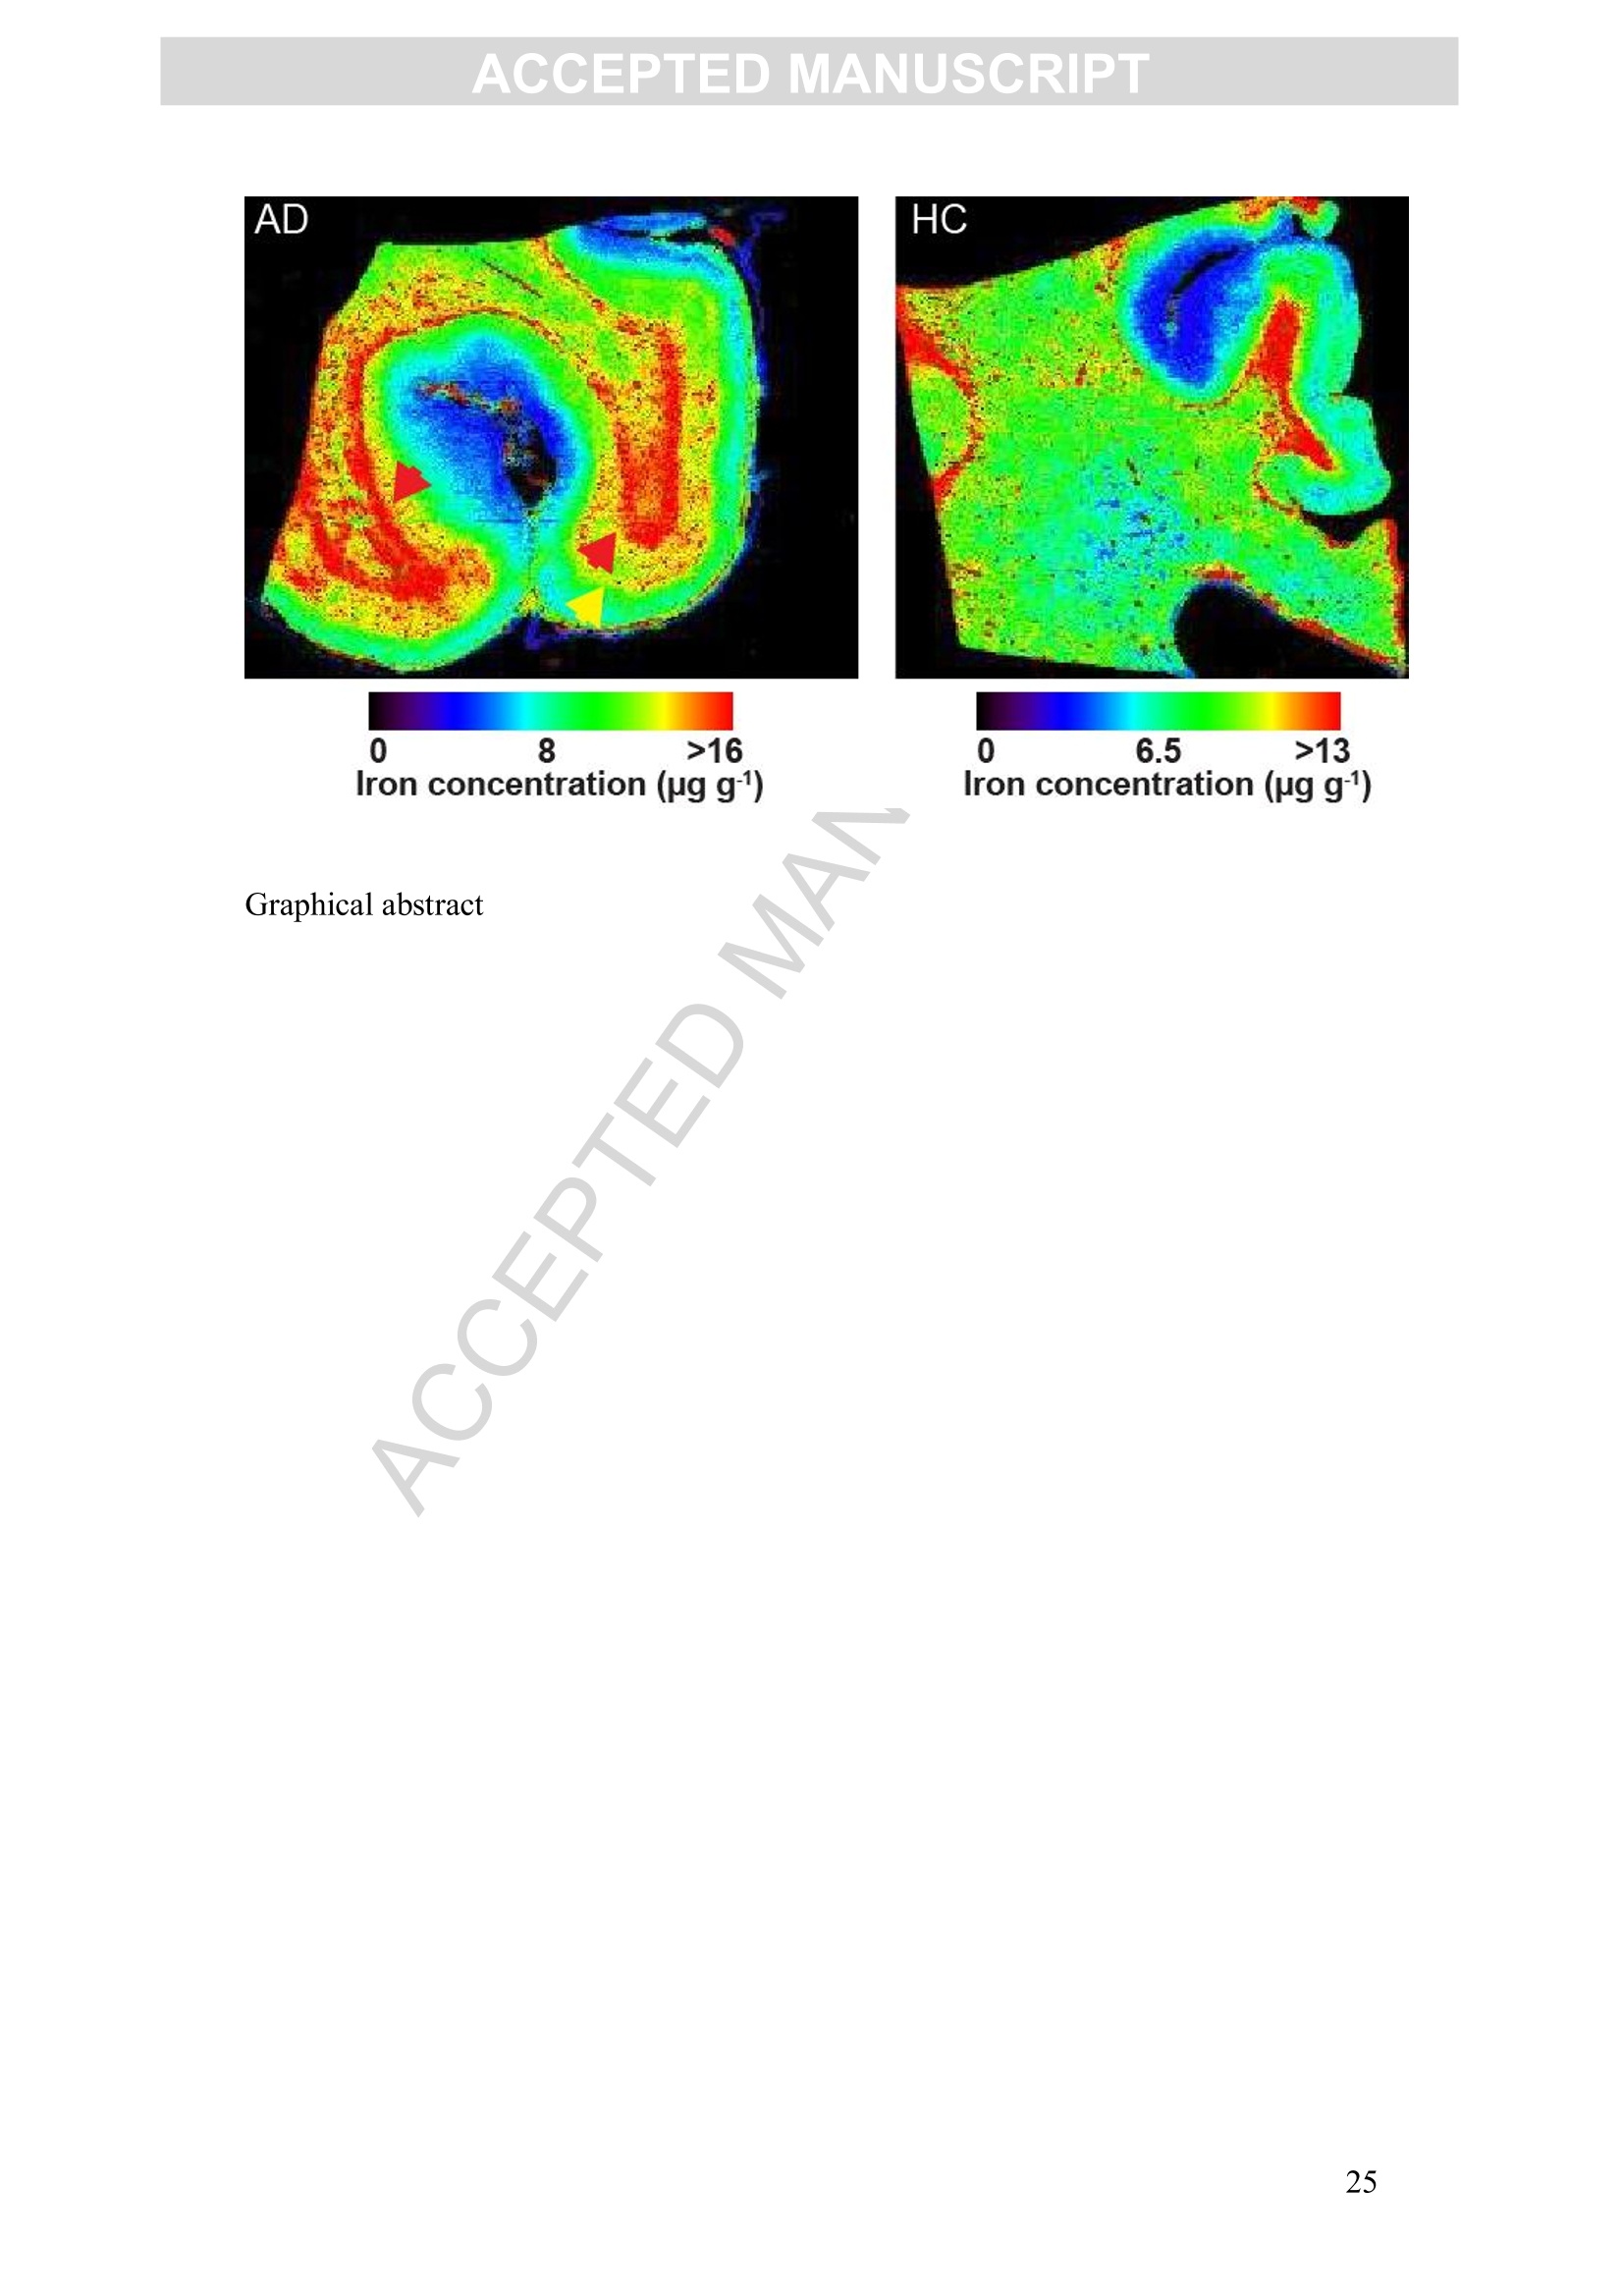
大脑中的铁沉积是正常衰老的一个特征,尽管在包括阿尔茨海默氏症在内的几种神经退行性疾病中,铁沉积的速度比年龄匹配的对照组要快。利用激光剥蚀电感耦合等离子体质谱成像技术,我们在此提出了一项初步研究,定量评估了阿尔茨海默病和对照组额叶皮层石蜡包埋切片中白质和灰质铁的含量。使用磷成像指示白色/灰色边界问题,我们发现,在阿尔茨海默氏症的大脑灰质中铁的含量明显比控制变量组的大,这可能是指示在这个脆弱的大脑区域铁的稳定性较差,或为应对慢性神经退化增加炎症提供了证据。我们还观察到额叶皮层白质内铁含量增加的趋势,这可能表明在髓鞘完整性丧失之前铁代谢紊乱。考虑到大脑中过量铁的潜在毒性,我们的结果为不断发展新的磁共振成像方法提供了有力的支持证据,以评估阿尔茨海默病中白质和灰质铁积聚。
方案详情

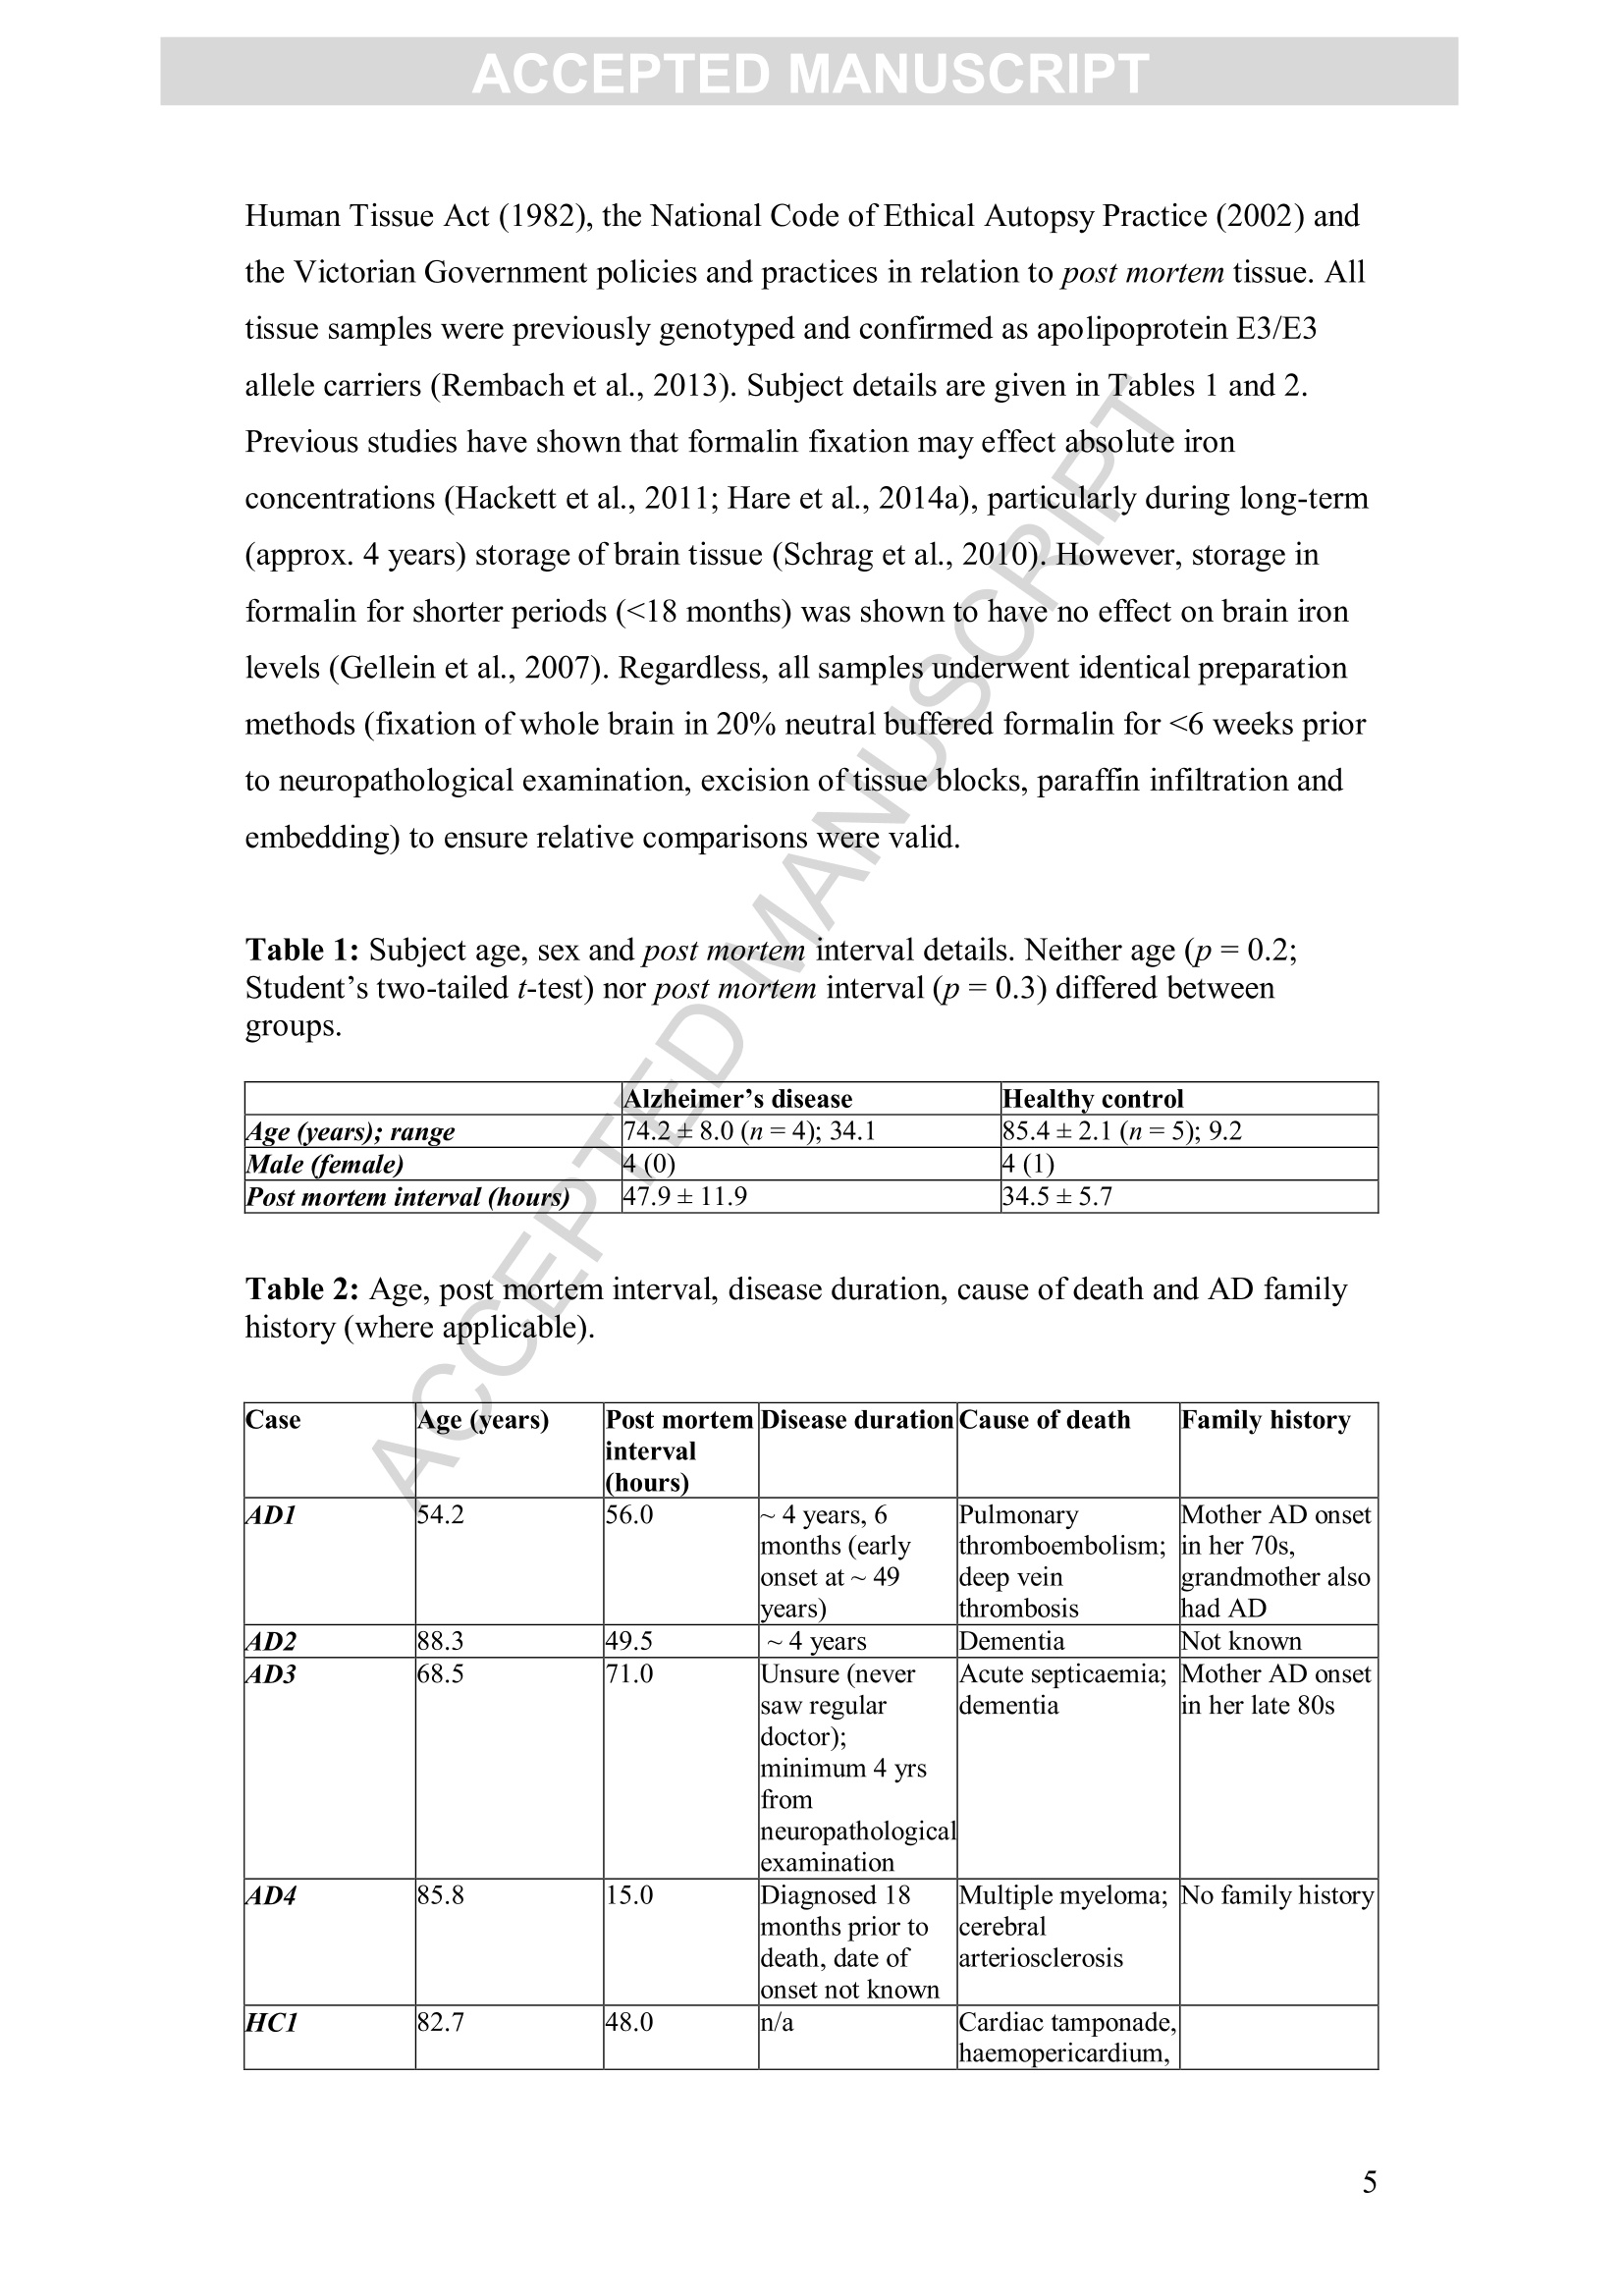
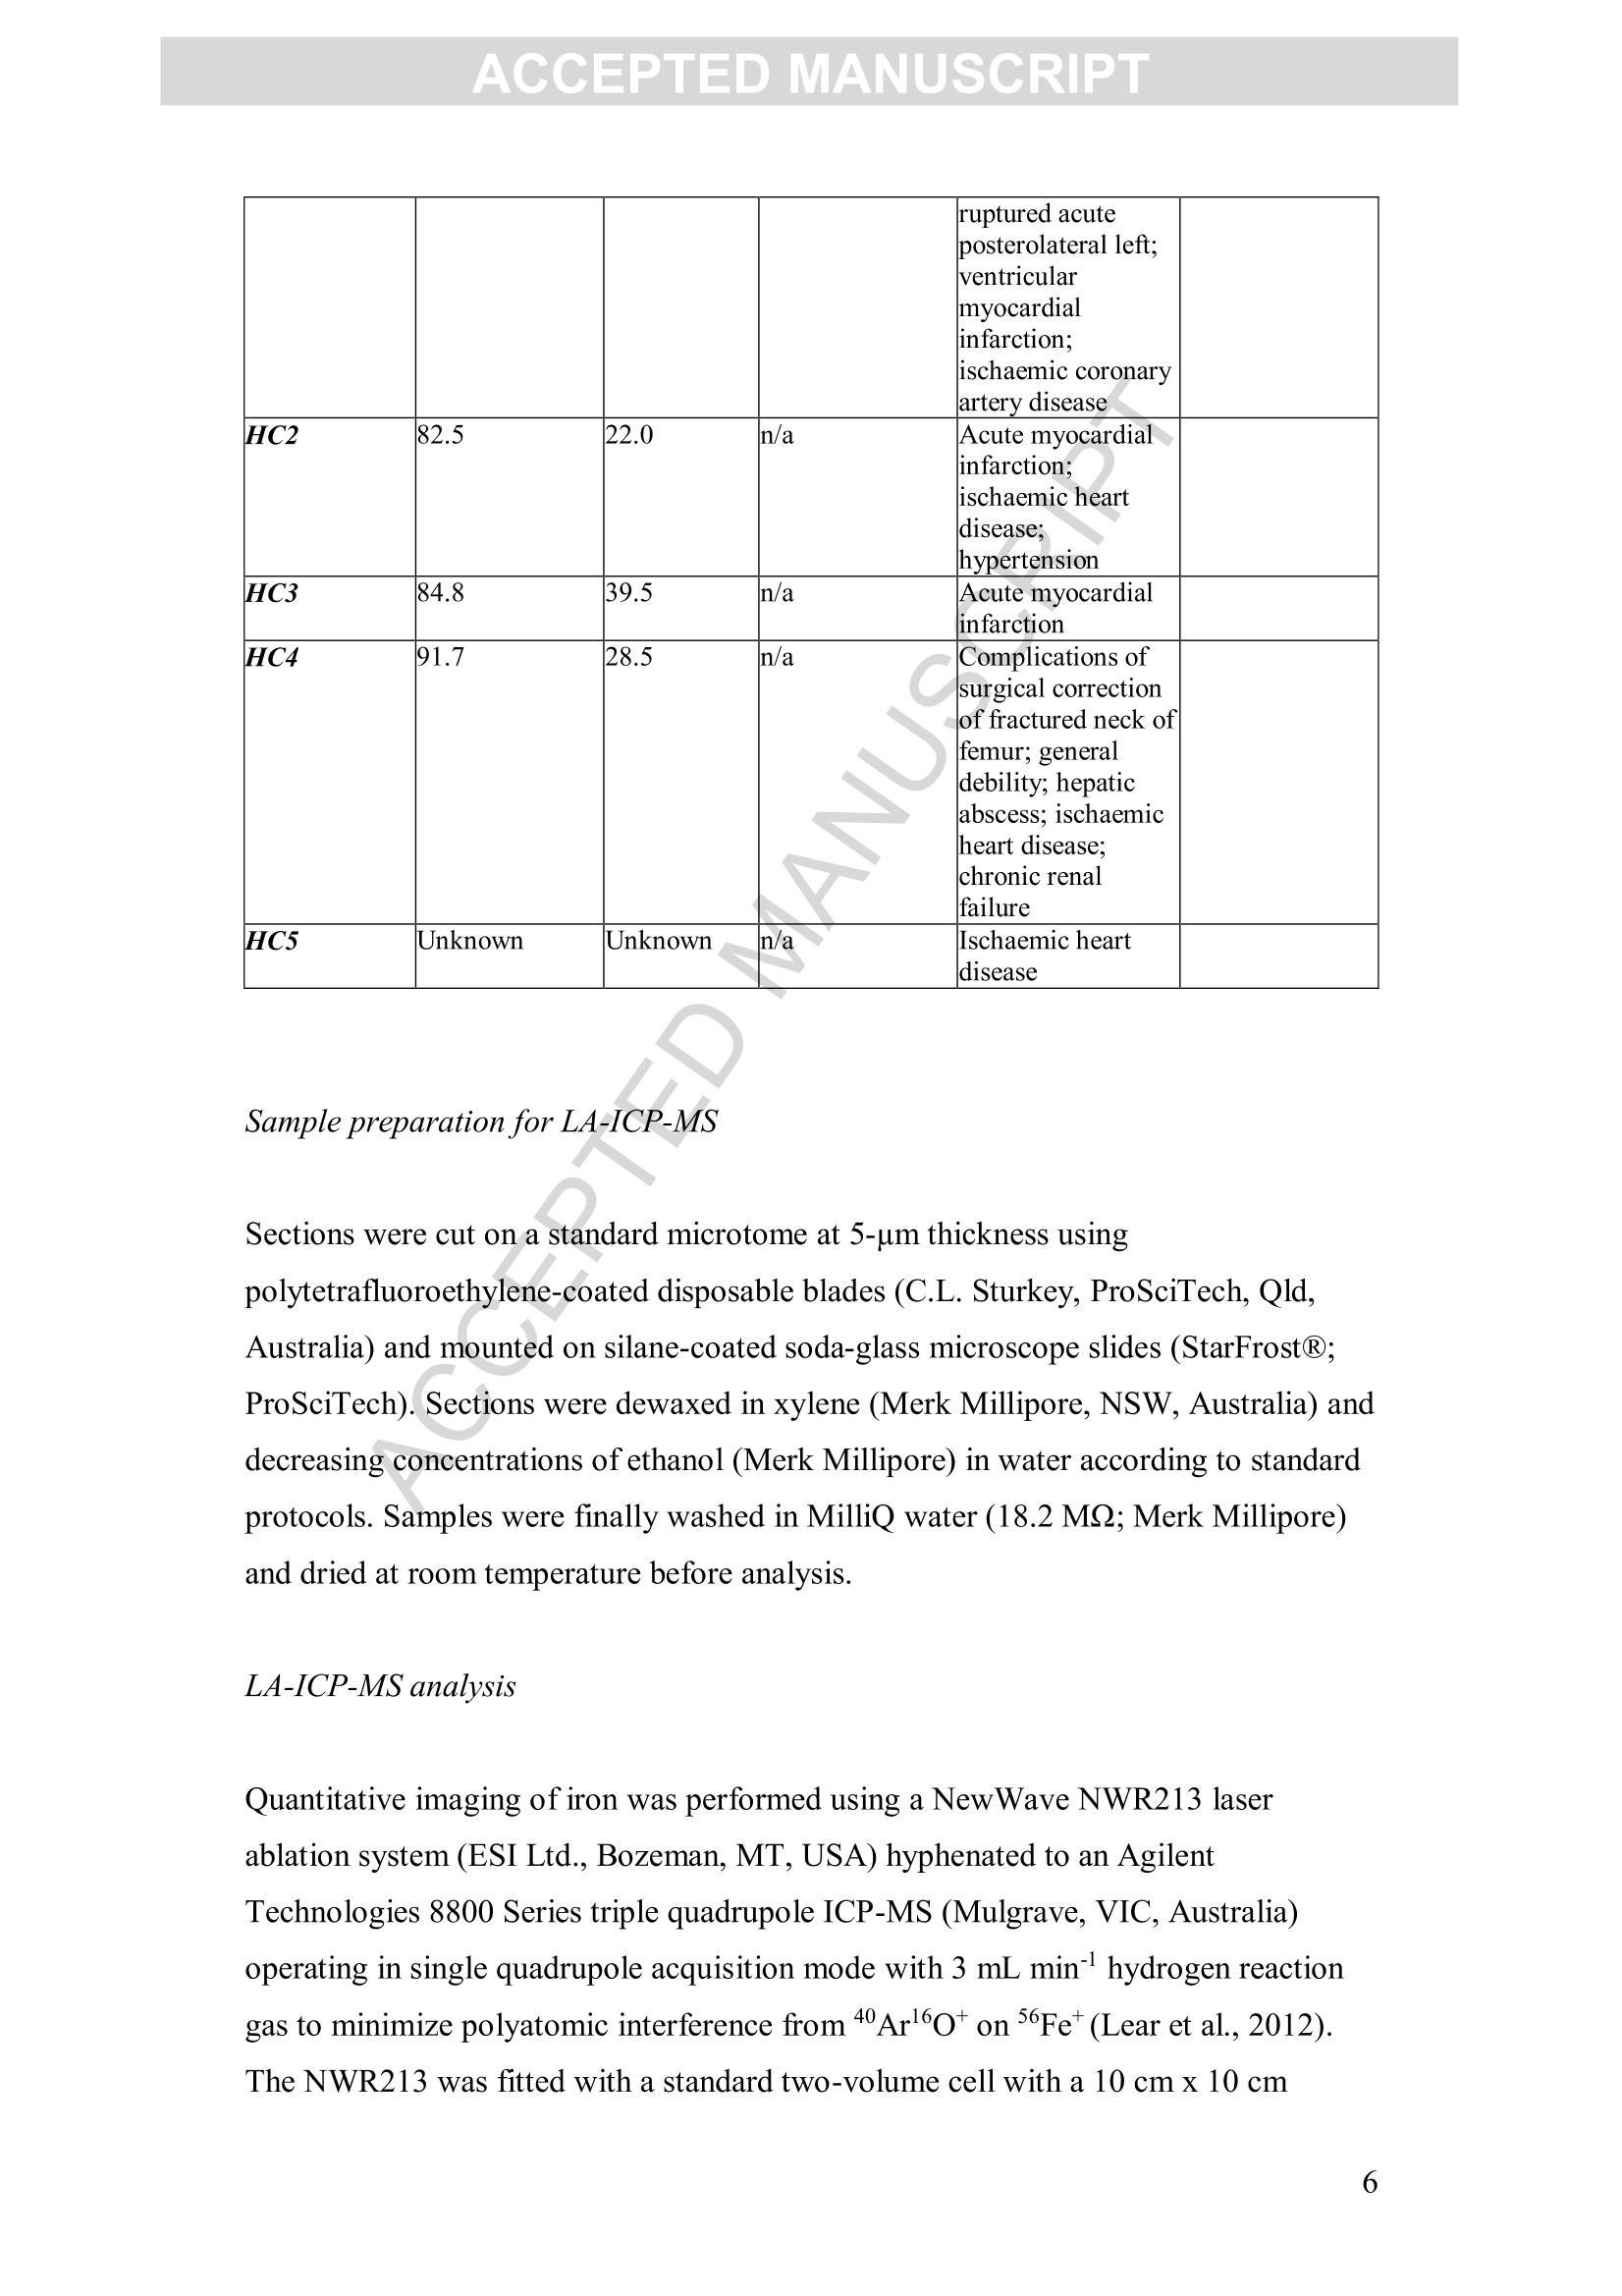
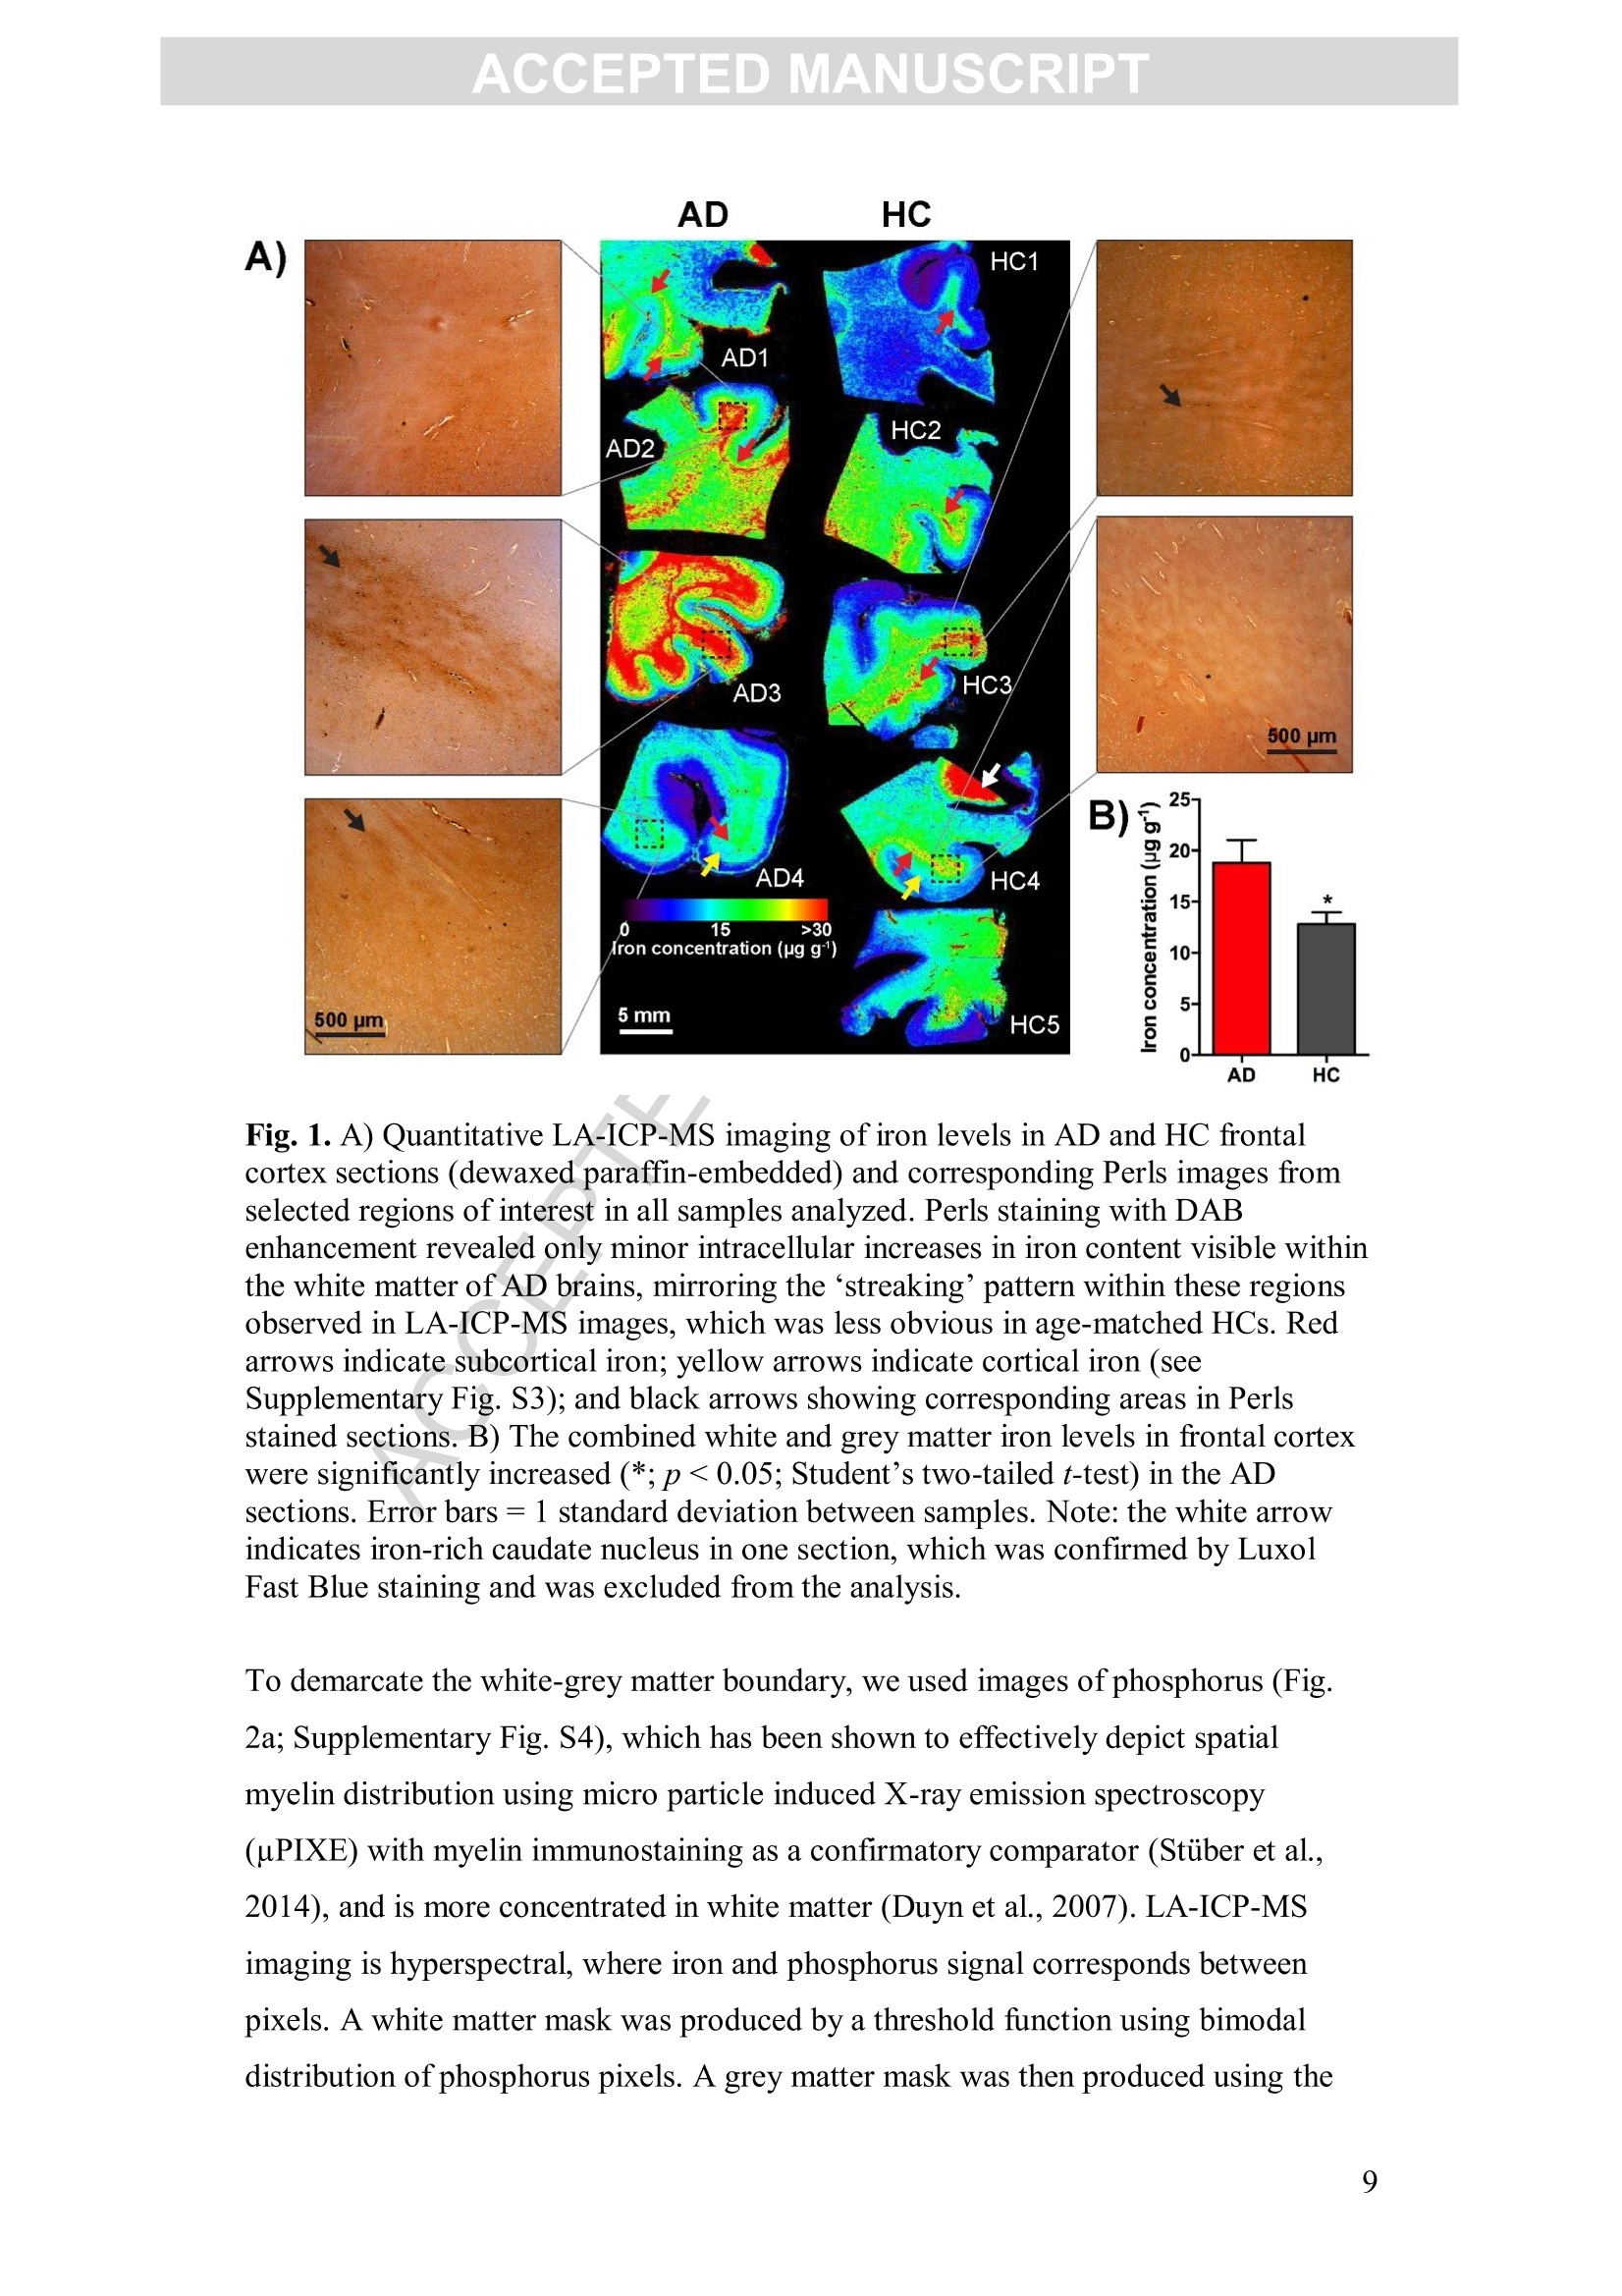
Accepted Manuscript ACCEPTED MANUSCRIPT Laser ablation-inductively coupled plasma-mass spectrometry imaging ofwhite and grey matter iron distribution in Alzheimer’s disease frontal cortex Dominic J. Hare, Erika P. Raven, Blaine R. Roberts, Mirjana Bogeski,Stuart D. Portbury, Catriona A. McLean, Colin L.Masters, James R. Connor,Ashley I. Bush, Peter J. Crouch, Philip A. Doble PII: S1053-8119(16)30177-XDOI: doi: 10.1016/j.neuroimage.2016.05.057 Reference: YNIMG 13215 To appear in: Neurolmage Received date: 14February 2016 Revised date: 20 May 2016 Accepted date: 23 May 2016 Please cite this article as:Hare, Dominic J., Raven, Erika P., Roberts, BlaineR., Bogeski, Mirjana, Portbury, Stuart D., McLean, Catriona A., Masters, ColinL., Connor, James R., Bush, Ashley I., Crouch, Peter J., Doble, Philip A., Laserablation-inductively coupled plasma-mass spectrometry imaging of white and grey mat-ter iron distribution in Alzheimer’s disease frontal cortex, NeuroImage (2016), doi:10.1016/j.neuroimage.2016.05.057 This is a PDF file of an unedited manuscript that has been accepted for publication.As a service to our customers we are providing this early version of the manuscript.The manuscript will undergo copyediting, typesetting, and review of the resulting proofbefore it is published in its final form. Please note that during the production processerrors may be discovered which could affect the content, and all legal disclaimers thatapply to the journal pertain. Laser ablation-inductively coupled plasma-mass spectrometry imaging of whiteand grey matter iron distribution in Alzheimer’s disease frontal cortex Dominic J. Hareab*, Erika P. Ravendt, Blaine R. Roberts , Mirjana Bogeski', StuartD. Portbury, Catriona A. McLean, Colin L. Masters, James R. Connoreh, Ashley I.Bush', Peter J. Crouch, and Philip A. Doblea** ◆ " Elemental Bio-imaging Facility, University of Technology Sydney, Australia. The Florey Institute of Neuroscience and Mental Health, The University ofMelbourne, Australia. Center for Functional and Molecular Imaging, Georgetown University MedicalCenter, United States of America “ Advanced Magnetic Resonance Imaging Section, Laboratory of Functional andMolecular Imaging, National Institute ofNeurological Disorders and Stroke, National Institutes ofHealth, United States of AmericaeDepartment ofAnatomical Pathology, Alfred Hospital, Australia Department ofMedicine, Central Clinical School, Monash University, Australia 8 Department of Neural and Behavioral Sciences, Penn State Hershey MedicalCenter, United States of America h Department ofNeurosurgery, Penn State Hershey Medical Center, United States ofAmerica ' Department of Pathology, School of Biomedical Sciences, University of Melbourne,Australia * Correspondence to: Dominic J. Hare, University of Technology Sydney, PO Box 123, Broadway, New South Wales, 2007, Australia. Email. dominic.hare@uts.edu.au;Ph. +61 3 9035 9549 ** Correspondence to: Philip A. Doble, University of Technology Sydney, PO Box123, Broadway, New South Wales, 2007, Australia. Email. philip.doble@uts.edu.au;Ph. +61 2 9514 1792 TThese authors contributed equally. Abstract Iron deposition in the brain is a feature of normal aging, though in severalneurodegenerative disorders, including Alzheimer’s disease, the rate of ironaccumulation is more advanced than in age-matched controls. Using laser ablation-inductively coupled plasma-mass spectrometry imaging we present here a pilot studythat quantitatively assessed the iron content of white and grey matter in paraffin-embedded sections from the frontal cortex of Alzheimer’s and control subjects. Usingthe phosphorus image as a confirmed proxy for the white/grey matter boundary, wefound that increased intrusion of iron into grey matter occurs in the Alzheimer’s braincompared to controls, which may be indicative of either a loss of iron homeostasis inthis vulnerable brain region, or provide evidence of increased inflammatory processesas a response to chronic neurodegeneration. We also observed a trend of increasingiron within the white matter of the frontal cortex, potentially indicative of disruptediron metabolism preceding loss of myelin integrity. Considering the known potentialtoxicity ofexcessive iron in the brain, our results provide supporting evidence for thecontinuous development of novel magnetic resonance imaging approaches forassessing white and grey matter iron accumulation in Alzheimer’s disease. FECCA Introduction Disrupted iron metabolism appears to be a pathological hallmark in the Alzheimer’sdisease brain (Roberts et al., 2011). Numerous studies have identified abnormalincreases in the iron concentration within a range of affected brain regions (Belaidiand Bush, 2015), including accumulation on the B-amyloid senile plaques that arecharacteristic of AD (Lovell et al., 1998). While a 2011 meta-analysis suggested apossible citation bias has overstated the significance of iron elevation (Schrag et al.,2011), it should not be ignored that disrupted iron homeostasis without a measurableincrease still has the potential to promote oxidative stress through improper redox-silencing of this highly reactive species. Changes in chemical properties of brain ironhave been observed dating back over half a century (Hallgren and Sourander, 1960),and contemporary biotechnology has identified a range of genetic and metabolicfactor that support iron dyshomeostasis as playing an important role in AD pathology(Crespo et al.,2014). Important iron regulatory proteins, including ferritin and transferrin appear to be bothdysfunctional and abnormally distributed in the AD brain (Connor et al., 1992a;Connor et al., 1995; Connor et al., 1992b), potentially contributing to the reactive‘labile iron pool’through mismanagement of normal metabolic pathways.Neuroinflammation, where glial cells promote the deposition of iron, contributes toelevated oxidative stress and mitochondrial dysfunction, and may also promote theaggregation of the p-amyloid peptide and tau protein, forming the plaques and tanglescharacteristic of the disease (Ong and Farooqui, 2005). Combined with the naturalaccumulation of iron in the aging brain, endogenous response to elevated cortical iron(such as heme oxygenase-1, which degrades heme and can release free, reactiveferrous [Fet]iron) may represent an important biochemical mechanism precedingneuronal damage in AD (Ward et al.,2014). In vivo imaging of the AD brain using magnetic resonance imaging (MRI) hasprovided useful insight into both structural changes (Bartzokis et al., 2003) and irondeposition (Bartzokis et al., 2000; Langkammer et al., 2014), using techniques such asR2 and R2*relaxometery (Langkammer et al., 2010) and phase imaging (Zhu et al.,2009). However, differentiation between white and grey matter iron distribution in the neocortex using MRI is challenging, as typical MRI approaches are not absolutelyquantitative, there are multiple contributions to tissue contrast (including myelin, ironand CSF), and have a spatial resolution that precludes fine detail definition of brainiron distribution at micrometer scales. Because of these many limitations, MRimaging of brain iron has been largely constrained to deep brain nuclei, such as thebasal ganglia, which contain the highest iron content throughout the brain. In this study we employed quantitative iron imaging by laser ablation-inductivelycoupled plasma-mass spectrometry (LA-ICP-MS) to compare the distribution of ironin white and grey matter regions of post mortem AD and healthy control (HC) frontalcortex tissue which are primarily affected by AD pathology. LA-ICP-MS employs afocused beam (typically in the ultra-violet range) that ablates particles from the tissuesample surface, which are then carried to the ICP-MS and measured on the basis ofmass-to-charge (m/z) ratio (Hare et al., 2015). LA-ICP-MS is highly specific andsensitive to iron, with detection limits well below the typical biological concentrationsfound in neurological tissue (O'Reilly et al., 2014). With appropriate signalnormalization and periodic sampling of standards with comparable matrixcomposition, LA-ICP-MS can provide absolute quantitative information at the lowmicrometer scale (1-100+um) (Hare et al.,2012a;Miliszkiewicz et al., 2015). As anelement-specific detector, LA-ICP-MS also permits simultaneous detection ofmultiple analytes and generation of hyperspectral images. We exploited this capabilityhere by using phosphorus distribution as a proxy for white and grey matter,whichwas then applied to differentiating iron distribution in the two regions of frontalcortex tissue from both AD and HC brains. Materials and methods: Human brain samples Formalin fixed and paraffin embedded AD (n=4) and HC (n=5) cortical tissue fromthe superior frontal gyrus was obtained from the Victorian Brain Bank Network at theFlorey Institute of Neuroscience and Mental Health. All procedures were conducted inaccordance with the Australian National Health and Medical Research Council’sNational Statement on Ethical Conduct in Human Research (2007), the Victorian Human Tissue Act (1982), the National Code of Ethical Autopsy Practice (2002) andthe Victorian Government policies and practices in relation to post mortem tissue. Alltissue samples were previously genotyped and confirmed as apolipoprotein E3/E3allele carriers (Rembach et al., 2013). Subject details are given in Tables 1 and 2.Previous studies have shown that formalin fixation may effect absolute ironconcentrations (Hackett et al., 2011; Hare et al., 2014a), particularly during long-term(approx. 4 years) storage of brain tissue (Schrag et al., 2010). However, storage informalin for shorter periods (<18 months) was shown to have no effect on brain ironlevels (Gellein et al., 2007). Regardless, all samples underwent identical preparationmethods (fixation of whole brain in 20% neutral buffered formalin for <6 weeks priorto neuropathological examination, excision of tissue blocks, paraffin infiltration andembedding) to ensure relative comparisons were valid. Table 1: Subject age, sex and post mortem interval details. Neither age (p=0.2;Student’s two-tailed t-test) nor post mortem interval (p=0.3) differed betweengroups. Alzheimer’s disease Healthy control 4ge (years); range 74.2±8.0(n=4);34.1 85.4±2.1(n=5); 9.2 Male (female) 4 (0) 4 (1) Post mortem interval (hours) 47.9±11.9 34.5±5.7 Case Age (years) Post mortem interval (hours) Disease duration Cause of death Family history 4D1 54.2 56.0 ~ 4 years, 6months (earlyonset at ~49years) Pulmonary thromboembolism:deep vein thrombosis Mother AD onset in her 70s.grandmother alsohad AD AD2 88.3 49.5 ~ 4 years Dementia Not known 4D3 68.5 71.0 Unsure (neversaw regulardoctor); minimum 4 yrsfrom neuropathologicalexamination Acute septicaemia;dementia Mother AD onsetin her late 80s 4D4 85.8 15.0 Diagnosed 18months prior todeath, date of onset not known Multiple myeloma;cerebral arteriosclerosis No family history HCI 82.7 48.0 n/a Cardiac tamponade,haemopericardium, ruptured acuteposterolateral left:ventricular myocardial infarction: ischaemic coronaryartery disease HC2 82.5 22.0 n/a Acute myocardialinfarction: ischaemic heartdisease: hypertension HC3 84.8 39.5 n/a Acute myocardialinfarction HC4 91.7 28.5 n/a Complications of surgical correction lof fractured neck of femur; generaldebility; hepaticabscess; ischaemicheart disease: chronic renalfailure HC5 Unknown Unknown n/a Ischaemic heartdisease Sample preparation for LA-ICP-MS Sections were cut on a standard microtome at 5-um thickness using polytetrafluoroethylene-coated disposable blades (C.L. Sturkey, ProSciTech, Qld,Australia) and mounted on silane-coated soda-glass microscope slides (StarFrost@;ProSciTech). Sections were dewaxed in xylene (Merk Millipore, NSW, Australia) anddecreasing concentrations ofethanol (Merk Millipore) in water according to standardprotocols. Samples were finally washed in MilliQ water (18.2 MQ; Merk Millipore)and dried at room temperature before analysis. LA-ICP-MS analysis Quantitative imaging of iron was performed using a New Wave NWR213 laserablation system (ESI Ltd., Bozeman, MT, USA) hyphenated to an AgilentTechnologies 8800 Series triple quadrupole ICP-MS (Mulgrave, VIC, Australia)operating in single quadrupole acquisition mode with 3 mL minhydrogen reactiongas to minimize polyatomic interference from 40Arl60* on 56Fe* (Lear et al., 2012).The NWR213 was fitted with a standard two-volume cell with a 10 cmx 10 cm scanning area. Standard operating parameters for this system were used as previouslyreported (Bishop et al.,2015). Mass-to-charge (m/z) ratios for carbon (13),phosphorus (31) and iron (56) were acquired. Samples were ablated using a square 80x 80 um laser beam, producing pixels representing a total area of 6.4 mm² with a laserenergy fluence of approximately 1 J cm, which was sufficient to ablate tissue but notthe underlying slide matrix. Signal noise accounted for approximately 0.3% of themean signal intensity for each section, and was thus considered negligible.Phosphorus and iron data was normalized to the corresponding carbon-13 signal (seeSupplementary Fig. S1 for individual carbon-13 maps) recorded to compensate forvariation in laser power and sample transport effects (Austin et al.,2011). Iron imageswere quantitated against representative ablation (carbon-13 normalized) of matrix-matched tissue standards produced using metal-spiked homogenates of sheep corticalbrain tissue cut to an equivalent thickness on a cryostat (Hare et al, 2013b). Wetweight concentrations are derived from the independent analysis of metalconcentrations in the standard reference materials and use the assumption that brainwater content is around 80% (Keep et al., 2012) for both the standards and sampletissue sections. Four repeated five-point calibrations were recorded during theexperiment, with good linearity (r=0.9485) and reproducibility (p=0.4677; F=0.909; Supplementary Fig. S2).Images were produced using ENVI 5.3 (Exelis,Boulder,CO, USA), background (scanned areas not containing tissue) pixels wereexcluded using a carbon-13 mask, and regions of interest (ROIs) were extracted usingboth ENVI 5.3 and Fiji (http://fiji.sc/Fiji, (Schindelin et al., 2012)). Statistical analysisofextracted ROIs was performed using Prism 6.0e (GraphPad, La Jolla, CA, USA).All comparisons were unpaired Student’s two-tailed t-tests, with statisticalsignificance defined as p<0.05. All data is reported as ± standard deviation. Perls staining Adjacent 5-um thick sections mounted on microscope slides were dewaxed as above,and then extensively rinsed in running water. Hydrated sections were incubated at 37℃ for 1 hour in potassium ferrocyanide (7% w/v) in hydrochloric acid (3% v/v) andthen enhanced using a solution of 3.5 puM 3,3'-diaminobenzidine (DAB) in hydrogenperoxide (0.015%v/v) for 5 minutes. After quenching the reaction by immersing inrunning water, samples were counterstained with hemotoxylin for 2 minutes and washed in water before dehydration in increasing ethanol concentration, xylene andcoverslipping. Micrographs were recorded using a Leica DM2500 optical microscopewith a 2.5x/0.50 NA lens and Leica DFC310FX digital camera. Myelin staining Myelin was histologically stained on additional adjacent 5-um thick sections using theLuxol Fast Blue method. Sections were dewaxed and stained in 0.1% (w/v) LuxolFast Blue in methanol with 0.05%(v/v) acetic acid for 1 hour. White and grey matterwas differentiated in 0.05% (w/v) lithium carbonate for approximately 4 minutes.Sections were then counterstained with Cresyl Violet for 1 hour, dehydrated, clearedin xylene and coverslipped. Micrographs were recorded using the same equipment asdescribed above. Results: Quantitative images of iron in the AD and HC sections are presented in Fig. 1a(shown here on the same scale, see Supplementary Fig. S3 for individually scaledimages). In AD tissue, mean iron concentration in the entire scanned section waselevated compared to controls (mean iron concentration AD=18.80±2.23 pgg;HC=12.80±1.17ugg;p<0.05, Student’s two-tailed t-test; Fig. 1b). Perls stainingwith DAB enhancement (Fig. 1a) revealed only minor non-heme iron depositionwithin white matter. Iron could be associated with three specific distribution patternsin both AD and HC tissue in each LA-ICP-MS image related to both grey and whitematter myelin content: i) cortical ‘bands’of tangentially oriented, myelinated fibertracts (e.g. Bands ofBaillarger), consistent with layer-specific MR contrast variationsattributed to the co-localization of these myelin bands with iron (Fukunaga et al.,2010); ii) subcortical U-fibers found directly adjacent to the white-grey matterboundary (Drayer et al., 1986); and iii) non-homogenous pattern in subcortical whitematter in the form of a diffuse, patchwork distribution previously reported usingimmunohistochemistry by Connor and Menzies (Connor and Menzies, 1995) and insubsequent mouse studies using LA-ICP-MS (Hare et al., 2014b). A) AD HC Fig. 1. A) Quantitative LA-ICP-MS imaging of iron levels in AD and HC frontalcortex sections (dewaxed paraffin-embedded) and corresponding Perls images fromselected regions of interest in all samples analyzed. Perls staining with DABenhancement revealed only minor intracellular increases in iron content visible withinthe white matter of AD brains, mirroring the ‘streaking’pattern within these regionsobserved in LA-ICP-MS images, which was less obvious in age-matched HCs. Redarrows indicate subcortic31a·la iron; yellow arrows indicate cortical iron (seeSupplementary Fig. S3); and black arrows showing corresponding areas in Perlsstained sections. B) The combined white and grey matter iron levels in frontal cortexwere significantly increased (*; p<0.05; Student’s two-tailed t-test) in the ADsections. Error bars=1 standard deviation between samples. Note: the white arrowindicates iron-rich caudate nucleus in one section, which was confirmed by LuxolFast Blue staining and was excluded from the analysis. To demarcate the white-grey matter boundary, we used images of phosphorus (Fig.2a; Supplementary Fig. S4), which has been shown to effectively depict spatialmyelin distribution using micro particle induced X-ray emission spectroscopy(uPIXE) with myelin immunostaining as a confirmatory comparator (Stuiber et al.,2014), and is more concentrated in white matter (Duyn et al., 2007). LA-ICP-MSimaging is hyperspectral, where iron and phosphorus signal corresponds betweenpixels. A white matter mask was produced by a threshold function using bimodaldistribution of phosphorus pixels. A grey matter mask was then produced using the remaining pixels with the white matter values excluded. This mask was then appliedto iron images (Fig. 3). We confirmed that phosphorus imaging by LA-ICP-MS alsodelineated white and grey matter with Luxol Fast Blue staining of myelin (Fig. 2a).There was no apparent difference in relative phosphorus distribution between AD andHC groups (WMAD=2.53±0.49, WMHc=2.53±0.10,p=1.0; GMAD=1.50±0.27,GMHc=1.55±0.13;p=0.7; all units carbon-13 normalized phosphorus signalintensity; Supplementary Fig. S5); and the ratio of white to grey matter volumemeasured from the entire tissue section did not significantly differ according todiagnostic group (AD=1.28±0.86,HC=1.58±0.95; p=0.63; Supplementary Fig.S6). Iron was present at a lower concentration in grey matter of the HC frontal cortex(WMHc=15.1±3.9 ugg;GMHc=10.5±2.5 ugg;p<0.05; iron concentrationsfor each section are shown in Table 3), though in corresponding AD sections thedelineation of iron distribution within white and grey matter was lost (WMAD=18.7±7.3 ugg;GMAD=15.7±4.4 pgg ;p=0.7), which may be due to high variabilityand the small sample size. Comparing white and grey matter between AD and HCtissue, we found that iron was significantly elevated in the grey matter of AD brains(+49%; p<0.05), and showed a generalized, non-significant increasing trend in whitematter (+25%; p=0.4;Fig. 2b). There was no significant difference in the grey mattervolume (determined as total area scanned from the phosphorus masks) between ADand HC (AD=85.2±22.6mm²,HC=89.4±32.24 mm²;p=0.83; SupplementaryFig. S7). It is unclear as to why errors associated with iron in AD tissue weregenerally larger than HC samples, though we have observed that cellular irondyshomeostasis, such as is thought to be involved in AD pathology, demonstrates amore variable concentration of iron, indicative of a system in crisis (James et al.,2016). A) Fig. 2. A) Myelin staining of sections from the same tissue block using the Luxol FastBlue method confirms phosphorus imaging by LA-ICP-MS differentiates white (redarrows) and grey matter (blue arrows). B) Using the phosphorus images to delineatethe white/grey matter boundary and simultaneously obtained iron LA-ICP-MSimages, iron levels were quantified according to white/grey matter distribution. Ironlevels in white matter did not differ significantly between experimental groups,though iron was significantly increased in the grey matter of the AD frontal cortex (*;p <0.05; Student’s two-tailed t-test). Also, the significant difference between whiteand grey matter in healthy controls (^; p <0.05) was not observed in AD tissuesections (p=0.5). Fig. 3: Masks were generated using high (white matter; red line) and low phosphorussignal intensity values, which were then applied to quantitative iron images to extractwhite and grey matter regions of interest. Note excluded areas correspond tomicroscopic tears in the tissue section. Table 3: Individual iron concentrations (±1 standard deviation) and total measuredarea in the white matter, grey matter and the entire section (white and grey mattercombined) for AD and HC sections analysed. White matter Grey matter Combined white andgrey matter Case Iron(ugg) Area(mm²) Iron (ugg) Area (mm) Iron (ugg) Area (mm) AD1 13.8±5.2 44.3 15.6±7.2 105.9 15.0±13.2 150.2 AD2 19.5±4.7 69.3 17.1±6.3 101.9 19.1±12.1 171.2 AD3 28.9±10.8 94.2 20.2±8.7 74.3 23.5±18.9 168.5 AD4 12.8±2.8 129.8 9.8±3.6 58.6 10.6±4.4 188.4 HC1 9.0±3.0 55.2 7.2±4.1 124.9 8.4±4.9 180.1 HC2 16.4±4.8 41.6 13.4±7.9 114.1 15.3±6.8 155.7 HC3 19.5±5.1 130.3 12.0±5.0 43.0 13.8±7.0 173.3 HC4 14.3±3.8 67.8 11.0±4.0 78.2 13.0±4.1 146.1 HC5 16.1±9.3 61.6 9.0±10.0 86.7 13.3±10.3 148.3 Age is factor that is known to influence brain iron levels, particularly in the deep brainstructures of the basal ganglia (Ward et al., 2014; Zecca et al., 2004), though there issome contention as to whether age-related changes occur in the frontal cortex. Ramaset al. (Ramos et al., 2014) and Bilgic et al. (Bilgic et al., 2012) found no evidence ofelevated frontal cortex iron with respect to age, and that observed by Hebbrecht et al.(Hebbrecht et al., 1999) was comparatively very small versus the basal ganglia. Usinga standard power calculation for type I error (Snedecor and Cochran, 1986), oursample size can detect a difference of 5.3 pg g,which is less than the observeddifference in means of combined GM and WM in iron in HC and AD groups of 6.0±2.4 ug g(a=0.05; power=0.8). Discussion Considerations for post mortem artefact Previously reported iron levels in digests of formalin-fixed frontal white matter,measured using solution nebulization ICP-MS, were markedly higher than our results;iron concentrations were ~50% of those reported in fixed frontal lobe tissue reportedby others (Hallgren and Sourander, 1960; Langkammer et al., 2012a; Langkammer etal.,2012b). However, leaching did not appear to be specific to cortical tissue; the ironconcentration in the caudate nucleus excluded from our analysis (33.0±10.9 ug g) showed a similar degree of iron loss compared to fixed but non-embedded tissue(Langkammer et al., 2012b). To our knowledge, the effects of paraffin embedding anddeparaffinization on brain iron levels has not been reported, though a study comparingfresh liver tissue to paraffin infiltrated and dewaxed samples showed a linearrelationship between iron concentrations in lieu of absolute quantitativereproducibility (Beilby et al.,1999). Regardless, and as stated in the Materials andMethods, all samples underwent identical preparation steps to ensure validcomparisons. While it is possible that an altered chemical environment with respect toiron in AD tissue is more susceptible to post mortem artefact, such as leaching duringthe fixation and embedding process, the hypothesis that neurotoxicity in AD is relatedto an increased labile iron pool (i.e. Fet) (Peters et al., 2015) is supported by ourdata, which shows elevated iron levels are preserved in AD tissue even after extensivechemical treatment. However, direct assessment of iron oxidation state is not practicalfor archived tissue sections nor this analytical approach; fresh unfixed tissue andspecies-specific imaging such as X-ray absorption near-edge structure (XANES)spectroscopy would be required for this task (James et al., 2016). This pilot study isjustification for a similar validation experiment to those performed by Langkammerand colleagues to categorically confirm association between QSM and post mortemiron levels (Langkammer et al., 2010; Langkammer et al., 2012b), where in this casethe effects of paraffin embedding, which clearly results in a uniform loss of iron fromneurological tissue, are characterized and defined. Doing so would make availabledecades’worth of archived samples for metal analysis. White/grey matter iron ratios Subcortical white matter contains some of the lowest concentration of iron within thebrain (Krebs et al., 2014; Riederer et al., 1989), particularly compared to the basalganglia (Hare et al.,2012b; Zecca et al., 1994). Corresponding cortical grey matteralso contains comparatively less non-heme iron (Hallgren and Sourander, 1960). Ourresults from age-matched healthy controls show that cortical grey matter contains lesstotal iron than adjacent white matter. These data are in agreement with historicalvalues; (Hallgren and Sourander, 1958) reported that the ratio of iron in frontal whitematter to prefrontal cortex was 1.45, and we observed a similar ratio of 1.43 inhealthy controls. Relevance to MRI imaging of brain iron Myelin is known to introduce significant bias in magnetic susceptibility MRI(Lodygensky et al., 2012), with this bias strongest in myelin-rich white matter. Fielddependent relaxation rate increase (FDRI) MRI is more robust to ferritin iron content,although is susceptible to registration error between scanning sessions (Daugherty andRaz, 2015). Thus, in vivo assessment of iron accumulation is often most suited todiseases affecting areas of natively high iron and low myelin content, such as thebasal ganglia in Parkinson’s disease (Rossi et al., 2013). In this study, the use ofphosphorus as a proxy for myelin, which has previously been described usingalternative microchemical imaging methods (Stuber et al., 2014), was furtherconfirmed as a suitable means for differentiating myelin from iron using hyperspectralimaging and defining the white/grey matter boundary. Though it is only of practicaluse in post mortem studies, it may assist in the further development of new MRIapproaches for discerning between these two interfering factors. Iron reactivity, aging and Alzheimer 's disease pathology Although iron concentrations in cerebral white matter are difficult to quantitativelyassess by MRI due to both interferences from myelin and heterogeneous irondistributions, the latter point should not be taken as it having an insignificant role inbrain aging and age-related disorders like AD. Numerous histological and MRIstudies have identified significant age-related changes first appearing in the cerebralwhite matter (Gunning-Dixon et al., 2009). For example, Ri with diffusion MRI ofwhite matter measured over a large cohort spanning 80 years identified a slow declinebeginning at 40+ years of age (Yeatman et al., 2014). More sensitive techniques suchas LA-ICP-MS, which are capable of measuring small changes in iron levels at a highspatial resolution are therefore an important tool in understanding the role of iron indisease pathogenesis. Central to the brain iron deposition and free radical theory ofaging is that a loss of iron homeostasis results in the accumulation ofreactive iron(II),which mediates the generation of harmful reactive oxygen species (ROS) (Schipper,2004). This occurrence may not necessarily result in a measure of accumulation ofiron. Rather, the redistribution of iron from safe storage in proteins like ferritin to the cytoplasm may be sufficient to initiate a cascading Fenton reaction, where ironrepeatedly cycles through the ferrous and ferric oxidation states to produce a constantsource of free radicals that eventually overwhelm endogenous antioxidantmechanisms (Hare et al.,2013a). Therefore, lower iron levels in white mattercompared to the deep brain structures of the basal ganglia should not be viewed as aninsignificant contributor to either normal brain aging, or age-relatedneurodegeneration, such as AD. White matter is particularly lipid-rich, and thushighly susceptible to peroxidation and loss ofcellular and structural integrity in AD(Bartzokis et al., 2003) via iron-catalyzed free radical generation. Although a causal relationship between increased iron reactivity and AD has not beencategorically confirmed, there is mounting evidence that it plays an importantupstream role in cell death. For instance, the recently-described non-apoptotic form ofcell death termed ‘ferroptosis’(Dixon et al., 2012) induces necrosis via iron-mediatedproduction ofROS and has been implicated in motor neuron degeneration (Chen etal., 2015). The generalized increase in cortical grey matter iron observed in our pilotstudy lends further support to iron playing a critical role in neurodegeneration withinthe AD brain. Disrupted iron metabolism, such as impaired activity of the amyloidprecursor protein (Duce et al., 2010), which is essential to the stabilization of themembrane-bound iron export protein ferroportin (Wong et al., 2014), can lead to anincrease in the labile iron pool within neurons, facilitating increased ROS generation.When combined with R2 relaxometry, FDRI MRI has shown a relationship betweeniron accumulation in ferritin and loss oftissue integrity in the hippocampus of ADpatients (Raven et al., 2013). Iron has also been associated with accumulation aroundextracellular amyloid plaques in humans (Connor et al., 1992a; Lovell et al., 1998).Our LA-ICP-MS technique likely lacks the resolution to discern these microscopicstructures (Lovell et al.’s study used micro-particle induced X-ray emissionspectroscopy with a per-pixel resolution of 50 um²), though a study using X-rayfluorescence microscopy with a similar resolving power (60 u.m) found elevatedextracellular iron in the PSAPP mouse model of AD that displays similar plaquepathology was not associated with the B-amyloid inclusions (Leskovjan et al., 2011). Increased iron in the grey matter may indicate either a loss of iron homeostasis, or abrain region at higher risk of iron-mediated neurodegeneration. Previous studies of iron regulatory proteins in cortical tissue found a generalized decrease in transferrinlevels in grey matter and consistent distribution of ferritin (Connor et al., 1992b). Thismay be indicative of a higher degree of ferritin saturation as a compensatorymechanism for increased grey matter iron, though Perls staining did not reveal anobservable amount of increased non-heme iron within this region. Another possiblescenario reflective of increased grey matter iron is the inflammatory processunderway within the degenerating region. In vitro studies of astrocytes and microgliacultured from post mortem AD white and grey matter has shown grey matter-sourcedcells proliferate more rapidly than white matter counterparts (Blasko et al., 2004). Ourhypothesis is supported by a recent study using high field 7 Tesla MRI andhistological assessment (via the same Perls-DAB method employed here) of postmortem AD tissue, which showed correlation between grey matter iron and activatedmicroglia in AD, as well as a similar staining within white matter (Zeineh et al.,2015). This pattern of non-heme iron is consistent with elevated levels of ferritinwithin white matter (Fukunaga et al.,2010; van Duijn et al., 2013), and the moreprominent Perls staining in AD tissue may also be reflective of the pathologicalaccumulation of this iron storage protein previously observed in the hippocampus(Raven et al., 2013), preceding a loss of structural integrity in the frontal cortex whitematter occurring later in the disease. Chronic inflammation is a cardinal feature of AD(Gomez-Nicola and Boche, 2015) and neurodegeneration in general (De Lucia et al.,2015), and targeting inflammatory pathways and microglial activation is a promisingavenue for therapeutic development (Olmos-Alonso et al., 2016).Our observedincrease in iron levels within the degenerating grey matter supports that this region isunder duress and initiates a response mechanism highly dependent on iron-mediatedenzymatic processes, which in turn has a follow-on effect on oligodendrocyte healthand myelin integrity in white matter. Further, hypometabolism (which is associatedwith iron deposition and white matter damage in the aceruloplasmenic brain(Miyajima et al., 2002)) occurs prior to atrophy in AD white matter (Chetelat et al.,2008), with the frontal cortex displaying loss of integrity comparatively later in thedisease than more posterior regions (Medina et al., 2006). Conclusions We have demonstrated that post mortem analysis of frontal cortex tissue from AD andHC subjects displays a marked change in cortical grey matter iron distribution in thisdegenerating region of the brain. Although this method is only possible using postmortem tissue, we present important supporting evidence for existing MRI studies thathave focused on discerning white and grey matter iron distributions in vivo using ahighly sensitive and quantitative imaging approach. Results from this study highlighta further need to understand the mechanisms by which iron may impart neurotoxicityin AD. Acknowledgements The authors would like to thank Dr Ian Birchall and Dr Jeff Duyn for their helpfuladvice, and Ms Fairlie Hilton of the Victorian Brain Bank Network for her assistancewith case notes. D.J.H. and P.A.D. are supported by funds from Australian ResearchCouncil Linkage Project (LP120200081) in conjunction with ESI Ltd and AgilentTechnologies. D.J.H. and B.R.R. are additionally supported through AustralianResearch Council Linkage Project (LP140100095) with Agilent Technologies. E.P.R.is supported by the National Science Foundation Graduate Research Fellowship underGrant No. DGE-1444316. P.J.C. is supported by funds from the National Health andMedical Research Council (1005651 and 1061550). We gratefully acknowledge thesupport of the Victorian Government's Operational Infrastructure Support Programand the Victorian Brain Bank Network. References: Austin, C., Fryer, F., Lear, J., Bishop, D., Hare, D.J., Rawling, T., Doble, P., 2011.Factors affecting internal standard selection for quantitative elemental bio-imaging ofsoft tissues by LA-ICP-MS. Journal of Analytical Atomic Spectrometry 26, 1494-1501. Bartzokis, G., Cummings,J.L.,Sultzer, D., Henderson, V.W., Nuechterlein, K.H.,Mintz, J., 2003. White Matter Structural Integrity in Healthy Aging Adults andPatients With Alzheimer Disease: AMagnetic Resonance Imaging Study. Archives ofNeurology 60, 393-398. Bartzokis, G., Sultzer, D., Cummings, J.,Holt, L.E., Hance, D.B., Henderson, V.W.,Mintz, J., 2000. In vivo evaluation of brain iron in Alzheimer disease using magneticresonance imaging. Archives of General Psychiatry 57, 47-53. Beilby, J.P., Prins, A. W., Swanson, N.R., 1999. Determination of hepatic ironconcentration in fresh and paraffin-embedded tissue. Clinical Chemistry 45, 573-574. Belaidi, A.A., Bush, A.I., 2015. Iron neurochemistry in Alzheimer's disease andParkinson' disease: targets for therapeutics. Journal of Neurochemistry. Bilgic, B., Pfefferbaum, A., Rohlfing, T., Sullivan, E.V., Adalsteinsson, E., 2012.MRI estimates of brain iron concentration in normal aging using quantitativesusceptibility mapping. NeuroImage 59, 2625-2635. Bishop, D.P., Clases, D., Fryer, F., Williams, E., Wilkins, S., Hare, D.J., Cole, N.,Karst, U., Doble, P.A., 2015. Elemental bio-imaging using laser ablation-triplequadrupole-ICP-MS. Journal of Analytical Atomic Spectrometry. Blasko, I., Stampfer Kountchev, M.,Robatscher, P., Veerhuis, R., Eikelenboom, P..Grubeck Loebenstein, B.,2004.How chronic inflammation can affect the brain andsupport the development of Alzheimer’s disease in old age: the role of microglia andastrocytes.Aging Cell 3, 169-176. Chen, L., Hambright, W.S., Na, R., Ran,Q., 2015. Ablation of the FerroptosisInhibitor Glutathione Peroxidase 4 in Neurons Results in Rapid Motor NeuronDegeneration and Paralysis. Journal of Biological Chemistry 290, 28097-28106. Chetelat, G., Desgranges, B., Landeau, B., Mezenge, F., Poline, J.B., de la Sayette,V., Viader, F., Eustache, F., Baron, J.C., 2008. Direct voxel-based comparisonbetween grey matter hypometabolism and atrophy in Alzheimer's disease. Brain 131,60-71. Connor, J.R., Menzies, S.L., 1995. Cellular management of iron in the brain. Journalof the Neurological Sciences 134 Suppl, 33-44. Connor, J.R., Menzies, S.L., St Martin, S.M.,Mufson, E.J.,1992a. A histochemicalstudy of iron, transferrin, and ferritin in Alzheimer's diseased brains. Journal ofNeuroscience Research 31,75-83. Connor, J.R., Snyder, B.S., Arosio, P., Loeffler, D.A., LeWitt, P., 1995. AQuantitative Analysis of Isoferritins in Select Regions ofAged, Parkinsonian, andAlzheimer's Diseased Brains. Journal ofNeurochemistry 65, 717-724. Connor, J.R., Snyder, B.S., Beard, J.L., Fine, R.E., Mufson, E.J., 1992b.Regionaldistribution of iron and iron-regulatory proteins in the brain in aging and Alzheimer'sdisease. Journal of Neuroscience Research 31,327-335. Crespo,A.C., Silva, B., Marques, L.,Marcelino, E., Maruta, C., Costa, S., Timoteo,A.,Vilares, A., Couto, F.S., Faustino, P., Correia, A.P., Verdelho, A., Porto, G.,Guerreiro, M., Herrero, A., Costa, C., de Mendonca, A., Costa, L., Martins, M., 2014.Genetic and biochemical markers in patients with Alzheimer’s disease support aconcerted systemic iron homeostasis dysregulation. Neurobiology of Aging 35, 777-785. Daugherty,A.M., Raz, N., 2015. Appraising the Role of Iron in Brain Aging andCognition: Promises and Limitations of MRI Methods. Neuropsychology Review 25,272-287. De Lucia, C., Rinchon, A.,Olmos-Alonso,A., Riecken, K., Fehse, B., Boche, D.,Perry, V.H., Gomez-Nicola, D., 2015. Microglia regulate hippocampal neurogenesisduring chronic neurodegeneration. Brain, Behavior, and Immunity. Dixon, S.J., Lemberg, K.M., Lamprecht, M.R., Skouta, R., Zaitsev, E.M., Gleason,C.E., Patel, D.N., Bauer, A.J., Cantley, A.M., Yang, W.S., Morrison III, B.,Stockwell, B.R., 2012. Ferroptosis: An Iron-Dependent Form of Nonapoptotic CellDeath. Cell 149, 1060-1072. Drayer, B., Burger, P., Darwin, R., Riederer, S., Herfkens, R., Johnson, G.A., 1986.MRI of brain iron. American Journal of Roentgenology 147, 103-110. Duce, J.A., Tsatsanis, A., Cater, M.A., James, S.A., Robb, E., Wikhe, K., Leong, S.L.,Perez, K.,Johanssen, T., Greenough, M.A., Cho, H.-H., Galatis, D., Moir, R.D.,Masters, C.L.,McLean, C., Tanzi, R.E., Cappai, R., Barnham, K.J.,Ciccotosto, G.D.,Rogers, J.T., Bush, A.I., 2010. Iron-Export Ferroxidase Activity ofβ-AmyloidPrecursor Protein Is Inhibited by Zinc in Alzheimer's Disease. Cell 142,857-867. Duyn, J.H., van Gelderen,P., Li,T.-Q., de Zwart, J.A., Koretsky, A.P., Fukunaga, M.,2007. High-field MRI of brain cortical substructure based on signal phase.Proceedings of the National Academy of Sciences of the United States of America104.11796-11801. Fukunaga, M., Li, T.-Q., van Gelderen, P., de Zwart, J.A., Shmueli, K., Yao, B., Lee,J.,Maric, D., Aronova, M.A., Zhang, G., Leapman, R.D.,Schenck, J.F.,Merkle, H.,Duyn,J.H., 2010. Layer-specific variation of iron content in cerebral cortex as asource of MRI contrast. Proceedings of the National Academy of Sciences of theUnited States of America 107,3834-3839. Gellein, K., Flaten, T.P., Erikson, K.M., Aschner, M., Syversen, T., 2007. Leaching ofTrace Elements from Biological Tissue by Formalin Fixation. Biological TraceElement Research 121.221-225. Gomez-Nicola, D., Boche, D.,2015. Post-mortem analysis of neuroinflammatorychanges in human Alzheimer’s disease. Alzheimer’s Research and Therapy 7, 1. Gunning-Dixon, F.M., Brickman, A.M., Cheng, J.C.,Alexopoulos, G.S., 2009. Agingof Cerebral White Matter: A Review of MRI Findings. International Journal ofGeriatric Psychiatry 24, 109-117. Hackett, M.J.,McQuillan, J.A.,El-Assaad, F., Aitken, J.B., Levina, A., Cohen, D.D.,Siegele, R., Carter, E.A., Grau, G.E., Hunt, N.H., Lay, P.A., 2011. Chemicalalterations to murine brain tissue induced by formalin fixation: implications forbiospectroscopic imaging and mapping studies of disease pathogenesis. The Analyst136,2941. Hallgren, B., Sourander, P.,1958. The effect of age on the non-haemin iron in thehuman brain. Journal ofNeurochemistry 3, 41-51. Hallgren, B., Sourander, P., 1960. The non-haemin iron in the cerebral cortex inAlzheimer’s disease. Journal of Neurochemistry 5, 307-310. Hare, D.J., Austin, C., Doble, P., 2012a. Quantification strategies for elementalimaging of biological samples using laser ablation-inductively coupled plasma-massspectrometry. The Analyst 137, 1527-1537. Hare, D.J.,Ayton, S., Bush, A., Lei, P., 2013a. A delicate balance: Iron metabolismand diseases of the brain. Frontiers in Aging Neuroscience 5. Hare, D.J., George, J.L., Bray, L., Volitakis, I., Vais, A., Ryan, T.M., Cherny, R.A.,Bush, A.I., Masters, C.L., Adlard, P.A., 2014a. The effect of paraformaldehydefixation and sucrose cryoprotection on metal concentration in murine neurologicaltissue. Journal of Analytical Atomic Spectrometry. Hare, D.J.,Gerlach, M., Riederer, P., 2012b.Considerations for measuring iron inpost-mortem tissue of Parkinson's disease patients. Journal of Neural Transmission119,1515-1521. Hare, D.J., Lear, J., Bishop, D., Beavis, A., Doble, P.A., 2013b. Protocol forproduction of matrix-matched brain tissue standards for imaging by laser ablation-inductively coupled plasma-mass spectrometry. Analytical Methods 5, 1915-1921. Hare, D.J., Lei, P., Ayton, S.,Roberts, B.R., Grimm, R., George,J.L., Bishop,D.P.,Beavis, A.D., Donovan, S.J., McColl, G., Volitakis, ., Masters, C.L., Adlard, P.A.,Cherny, R.A., Bush, A.I., Finkelstein, D.I., Doble, P.A., 2014b. An iron-dopamineindex predicts risk of parkinsonian neurodegeneration in the substantia nigra parscompacta. Chemical Science 5, 2160-2169. Hare, D.J., New, E.J., de Jonge, M.D., McColl, G., 2015. Imaging metals in biology:balancing sensitivity, selectivity and spatial resolution. Chemical Society Reviews 44,5941-5958. Hebbrecht, G., Maenhaut, W.,Reuck, J.D., 1999. Brain trace elements and aging.Nuclear Instruments and Methods in Physics Research Section B: Beam Interactionswith Materials and Atoms 150, 208-213. James, S.A., Hare, D.J., Jenkins, N.L., de Jonge, M.D., Bush, A.I., McColl, G., 2016.(XANES: In vivo imaging of metal-protein coordination environments. ScientificReports 6,20350. Keep, R.F., Hua, Y., Xi, G., 2012. Brain Water Content: a MisunderstoodMeasurement? Translational Stroke Research 3, 263-265. Krebs, N., Langkammer, C., Goessler, W., Ropele,S., Fazekas, F., Yen, K., Scheurer,E., 2014. Assessment of trace elements in human brain using inductively coupledplasma mass spectrometry.-PubMed-NCBI. Journal of Trace Elements in Medicineand Biology 28, 1-7. Langkammer, C., Krebs, N., Goessler, W., Scheurer, E., Ebner, F., Yen, K., Fazekas,F., Ropele, S., 2010. Quantitative MR Imaging of Brain Iron: A PostmortemValidation Study. Radiology 257, 455-462. Langkammer, C., Krebs, N., Goessler, W.,Scheurer, E., Yen, K., Fazekas,F., Ropele,S., 2012a. Susceptibility induced gray-white matter MRI contrast in the human brain.NeuroImage 59, 1413-1419. Langkammer, C.,Ropele, S., Pirpamer, L.,Fazekas,F., Schmidt, R., 2014.MRI foriron mapping in Alzheimer's disease. Neurodegenerative Diseases 13, 189-191. Langkammer, C., Schweser, F., Krebs, N.,Deistung, A., Goessler, W., Scheurer, E.,Sommer, K., Reishofer,G., Yen, K., Fazekas, F., Ropele, S., Reichenbach, J.R.,2012b. Quantitative susceptibility mapping (QSM) as a means to measure brain iron?A post mortem validation study. NeuroImage 62, 1593-1599. Lear, J., Hare, D.J.,Fryer, F., Adlard, P.A., Finkelstein, D.I., Doble, P.A., 2012. High-resolution elemental bioimaging of Ca, Mn, Fe, Co, Cu, and Zn employing LA-ICP-MS and hydrogen reaction gas. Analytical Chemistry 84, 6707-6714. Leskovjan, A.C., Kretlow, A., Lanzirotti, A., Barrea, R., Vogt, S., Miller, L.M., 2011.Increased brain iron coincides with early plaque formation in a mouse model ofAlzheimer's disease. NeuroImage 55, 32-38. Lodygensky, G.A., Marques, J.P., Maddage, R., Perroud, E., Sizonenko, S.V., Hiippi,P.S., Gruetter, R., 2012. In vivo assessment of myelination by phase imaging at highmagnetic field. NeuroImage 59, 1979-1987. Lovell, M.A., Robertson, J.D., Teesdale, W.J., Campbell, J.L., Markesbery, W.R.,1998.Copper, iron and zinc in Alzheimer's disease senile plaques. Journal of theNeurological Sciences 158, 47-52. Medina, D., deToledo-Morrell, L., Urresta, F., Gabrieli, J.D.E., Moseley, M.,Fleischman,D., Bennett, D.A., Leurgans, S., Turner, D.A., Stebbins, G.T., 2006.White matter changes in mild cognitive impairment and AD: A diffusion tensorimaging study. Neurobiology of Aging 27,663-672. Miliszkiewicz, N., Walas, S.,Tobiasz, A., 2015. Current approaches to calibration ofLA-ICP-MS analysis. Journal of Analytical Atomic Spectrometry 30, 327-338. Miyajima, H., Takahashi, Y., Kono, S., Sugimoto, M., Suzuki, Y., Hishida, A.,Sakamoto, M., Oucm, Y., 2002. Glucose and Oxygen Hypometabolism inAceruloplasminemia Brains. Internal Medicine 41,186-190. O'Reilly, J., Douglas,D., Braybrook, J., So, P.W., Vergucht, E., Garrevoet, J.,Vekemans, B.,Vincze, L., Goenaga-Infante, H., 2014. A novel calibration strategy forthe quantitative imaging of iron in biological tissues by LA-ICP-MS using matrix-matched standards and internal standardisation. Journal of Analytical AtomicSpectrometry 29. Olmos-Alonso, A., Schetters, S.T.T., Sri, S., Askew, K., Mancuso,R., Vargas-Caballero, M., Holscher, C., Perry,V.H., Gomez-Nicola, D.,2016. Pharmacologicaltargeting of CSF1R inhibits microglial proliferation and prevents the progression ofAlzheimer's-like pathology. Brain, awv379. Ong, W.-Y., Farooqui, A.A., 2005. Iron, neuroinflammation, and Alzheimer’s disease.Journal of Alzheimer's Disease 8, 183-200. Peters,D.G., Connor, J.R., Meadowcroft, M.D., 2015. The relationship between irondyshomeostasis and amyloidogenesis in Alzheimer’s disease: Two sides of the samecoin. Neurobiology of Disease 81, 49-65. Ramos, P., Santos, A., Pinto, N.R., Mendes, R.,Magalhaes, T., Almeida, A., 2014.Iron levels in the human brain: a post-mortem study of anatomical region differencesand age-related changes. Journal of Trace Elements in Medicine and Biology 28, 13-17. Raven, E.P., Lu, P.H., Tishler, T.A., Heydari, P., Bartzokis, G., 2013. Increased ironlevels and decreased tissue integrity in hippocampus of Alzheimer's disease detectedin vivo with magnetic resonance imaging. Journal of Alzheimer’s Disease 37, 127-136. Rembach, A., Hare, D.J.,Lind, M., Fowler, C.J., Cherny, R.A., McLean, C., Bush,A.I., Masters, C.L., Roberts, B.R., 2013.Decreased Copper in Alzheimer’s DiseaseBrain Is Predominantly in the Soluble Extractable Fraction. International Journal ofAlzheimer's Disease 2013, 1-7. Riederer, P., Sofic, E.,Rausch, W.-D., Schmidt, B., Reynolds, G.P., Jellinger, K.,Youdim,M.B.H., 1989. Transition Metals, Ferritin, Glutathione, and Ascorbic Acidin Parkinsonian Brains. Journal of Neurochemistry 52, 515-520. Roberts, B.R., Ryan, T.M., Bush, A.I.,Masters, C.L., Duce, J.A., 2011. The role ofmetallobiology and amyloid-β peptides in Alzheimer’s disease. Journal ofNeurochemistry 120, 149-166, Rossi, M., Ruottinen, H., Soimakallio, S., Elovaara, I., Dastidar, P., 2013. ClinicalMRI for iron detection in Parkinson's disease. Clinical Imaging 37, 631-636. Schindelin, J., Arganda-Carreras, I., Frise, E., Kaynig, V., Longair, M., Pietzsch, T.,Preibisch, S.,Rueden, C., Saalfeld, S., Schmid, B., Tinevez, J.-Y., White, D.J.,Hartenstein,V., Eliceiri, K.,Tomancak, P., Cardona, A., 2012. Fiji: an open-sourceplatform for biological-image analysis. Nature Methods 9, 676-682. Schipper, H.M., 2004. Brain iron deposition and the free radical-mitochondrial theoryofageing. Ageing Research Reviews 3, 265-301. Schrag,M., Dickson, A., Jiffry, A., Kirsch, D., Vinters, H.V., Kirsch, W., 2010. Theeffect of formalin fixation on the levels of brain transition metals in archived samples.BioMetals 23, 1123-1127. Schrag, M., Mueller, C., Oyoyo, U.,Smith, M.A., Kirsch, W.M., 2011. Iron, zinc andcopper in the Alzheimer’s disease brain: A quantitative meta-analysis. Some insighton the influence of citation bias on scientific opinion. Progress in Neurobiology 94,296-306. Snedecor, G., Cochran, W., 1986.Statistical Methods, 8th ed. Iowa State UniversityPress. Stiiber,C.,Morawski,M., Schafer, A., Labadie, C., Wahnert, M., Leuze, C.,Streicher, M., Barapatre, N., Reimann, K., Geyer,S., Spemann, D., Turner, R., 2014.Myelin and iron concentration in the human brain: A quantitative study ofMRIcontrast. NeuroImage 93, 95-106. van Duijn, S., Nabuurs,R.J.A., van Duinen, S.G., Natte,R., 2013. Comparison ofHistological Techniques to Visualize Iron in Paraffin-embedded Brain Tissue ofPatients with Alzheimer's Disease. Journal of Histochemistry and Cytochemistry 61,785-792. Ward, R.R., Zucca, F.A., Duyn, J.H.,Crichton, R.R., Zecca, L., 2014. The role of ironin brain ageing and neurodegenerativedisorders. Lancet Neurology 13, 1045-1060. Wong, B.X., Tsatsanis, A., Lim, L.Q., Adlard, P.A., Bush, A.I., Duce, J.A., 2014. B-Amyloid Precursor Protein Does Not Possess Ferroxidase Activity but Does Stabilizethe Cell Surface Ferrous Iron Exporter Ferroportin. PLoS One 9, e114174. Yeatman,J.D.,Wandell, B.A., Mezer, A.A., 2014. Lifespan maturation anddegeneration of human brain white matter. Nature Communications 5, 4932. Zecca, L., Pietra, R., Goj, C., Mecacci, C.,Radice, D., Sabbioni, E., 1994. Iron andother metals in neuromelanin, substantia nigra, and putamen of human brain. Journalof Neurochemistry 62, 1097-1101. Zecca, L., Stroppolo, A., Gatti, A., Tampellini, D., Toscani, M., Gallorini, M.,Giaveri, G., Arosio, P., Santambrogio, P., Fariello, R.G., 2004. The role of iron andcopper molecules in the neuronal vulnerability of locus coeruleus and substantia nigraduring aging. Proceedings of the National Academy of Sciences of the United Statesof America 101,9843. Zeineh,M.M., Chen, Y., Kitzler, H.H., Hammond,R., Vogel, H., Rutt, B.K., 2015.Activated iron-containing microglia in the human hippocampus identified bymagnetic resonance imaging in Alzheimer disease. Neurobiology of Aging 36, 2483-2500. Zhu, W.-z., Zhong, W.-d., Wang, W., Zhan, C.-j., Wang, C.-y., Qi, J.-p., Wang, J.-z.,Lei, T., 2009. Quantitative MR Phase-corrected Imaging to Investigate IncreasedBrain Iron Deposition of Patients with Alzheimer Disease. Radiology 253, 497-504. TPIRCSUNAM ) AM DETPECCA ACCEPTED MANUSCRIPT Graphical abstractIAM DETPECCA 大脑中的铁沉积是正常衰老的一个特征,尽管在包括阿尔茨海默氏症在内的几种神经退行性疾病中,铁沉积的速度比年龄匹配的对照组要快。利用激光剥蚀电感耦合等离子体质谱成像技术,我们在此提出了一项初步研究,定量评估了阿尔茨海默病和对照组额叶皮层石蜡包埋切片中白质和灰质铁的含量。使用磷成像指示白色/灰色边界问题,我们发现,在阿尔茨海默氏症的大脑灰质中铁的含量明显比控制变量组的大,这可能是指示在这个脆弱的大脑区域铁的稳定性较差,或为应对慢性神经退化增加炎症提供了证据。我们还观察到额叶皮层白质内铁含量增加的趋势,这可能表明在髓鞘完整性丧失之前铁代谢紊乱。考虑到大脑中过量铁的潜在毒性,我们的结果为不断发展新的磁共振成像方法提供了有力的支持证据,以评估阿尔茨海默病中白质和灰质铁积聚。
确定
还剩24页未读,是否继续阅读?

产品配置单
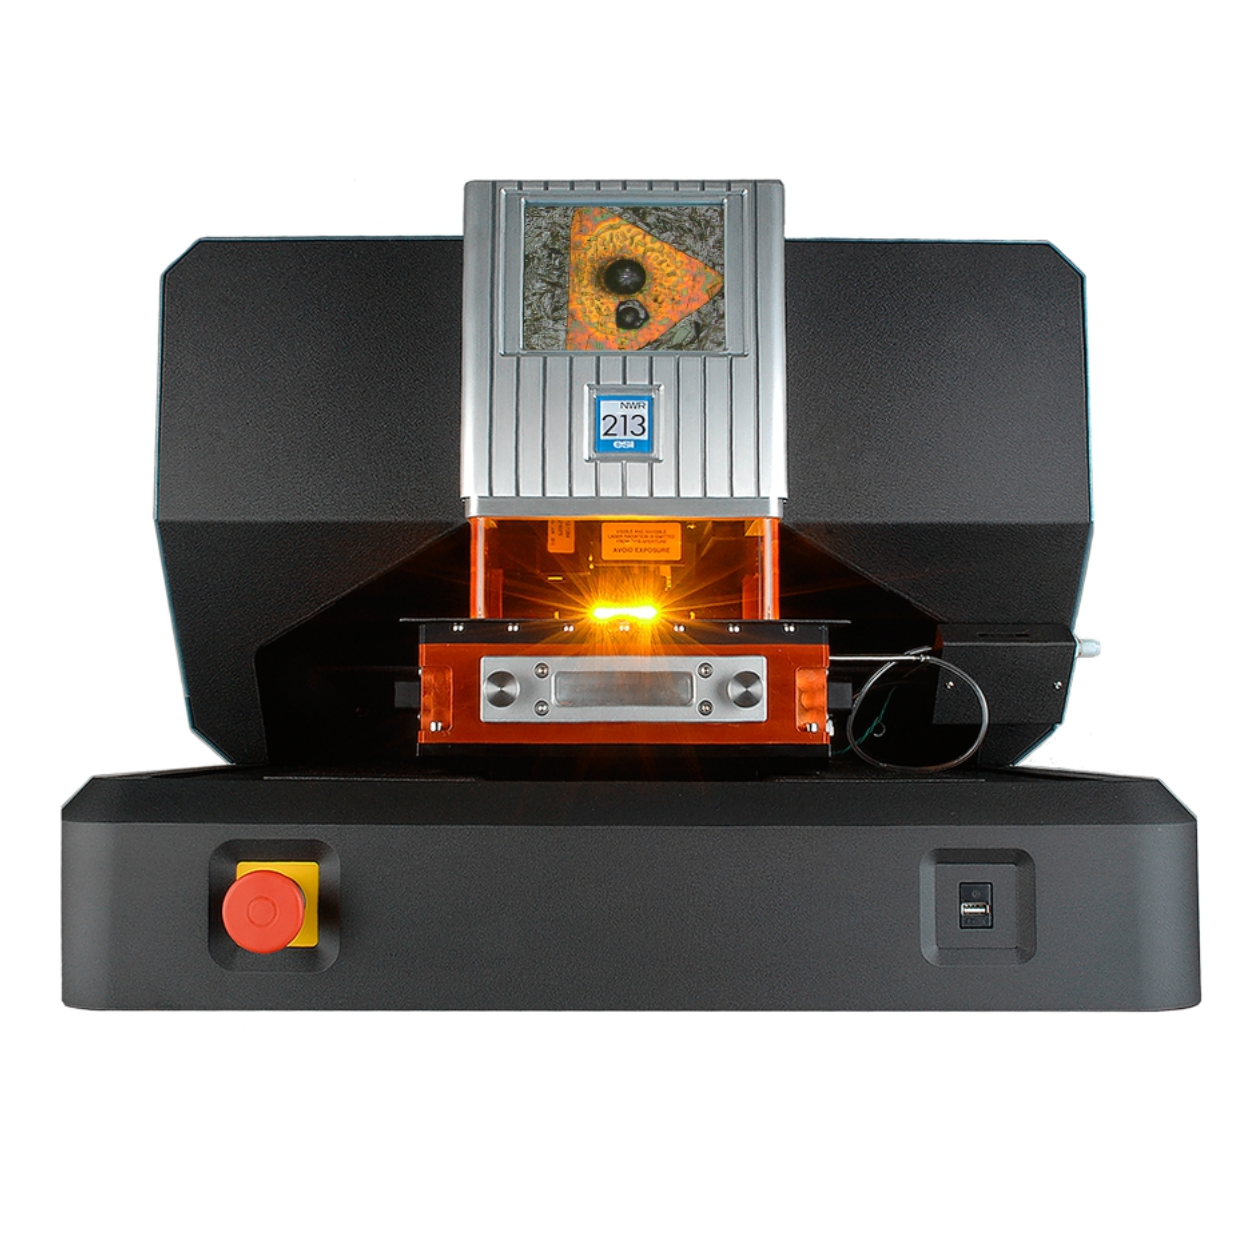
上海凯来仪器有限公司为您提供《阿尔茨海默病中额叶皮层白质和灰质铁分布检测方案(激光剥蚀进样)》,该方案主要用于其他中额叶皮层白质和灰质铁分布检测,参考标准--,《阿尔茨海默病中额叶皮层白质和灰质铁分布检测方案(激光剥蚀进样)》用到的仪器有ESL213 灵活的激光剥蚀系统
推荐专场
相关方案
更多
该厂商其他方案
更多