


方案详情
文
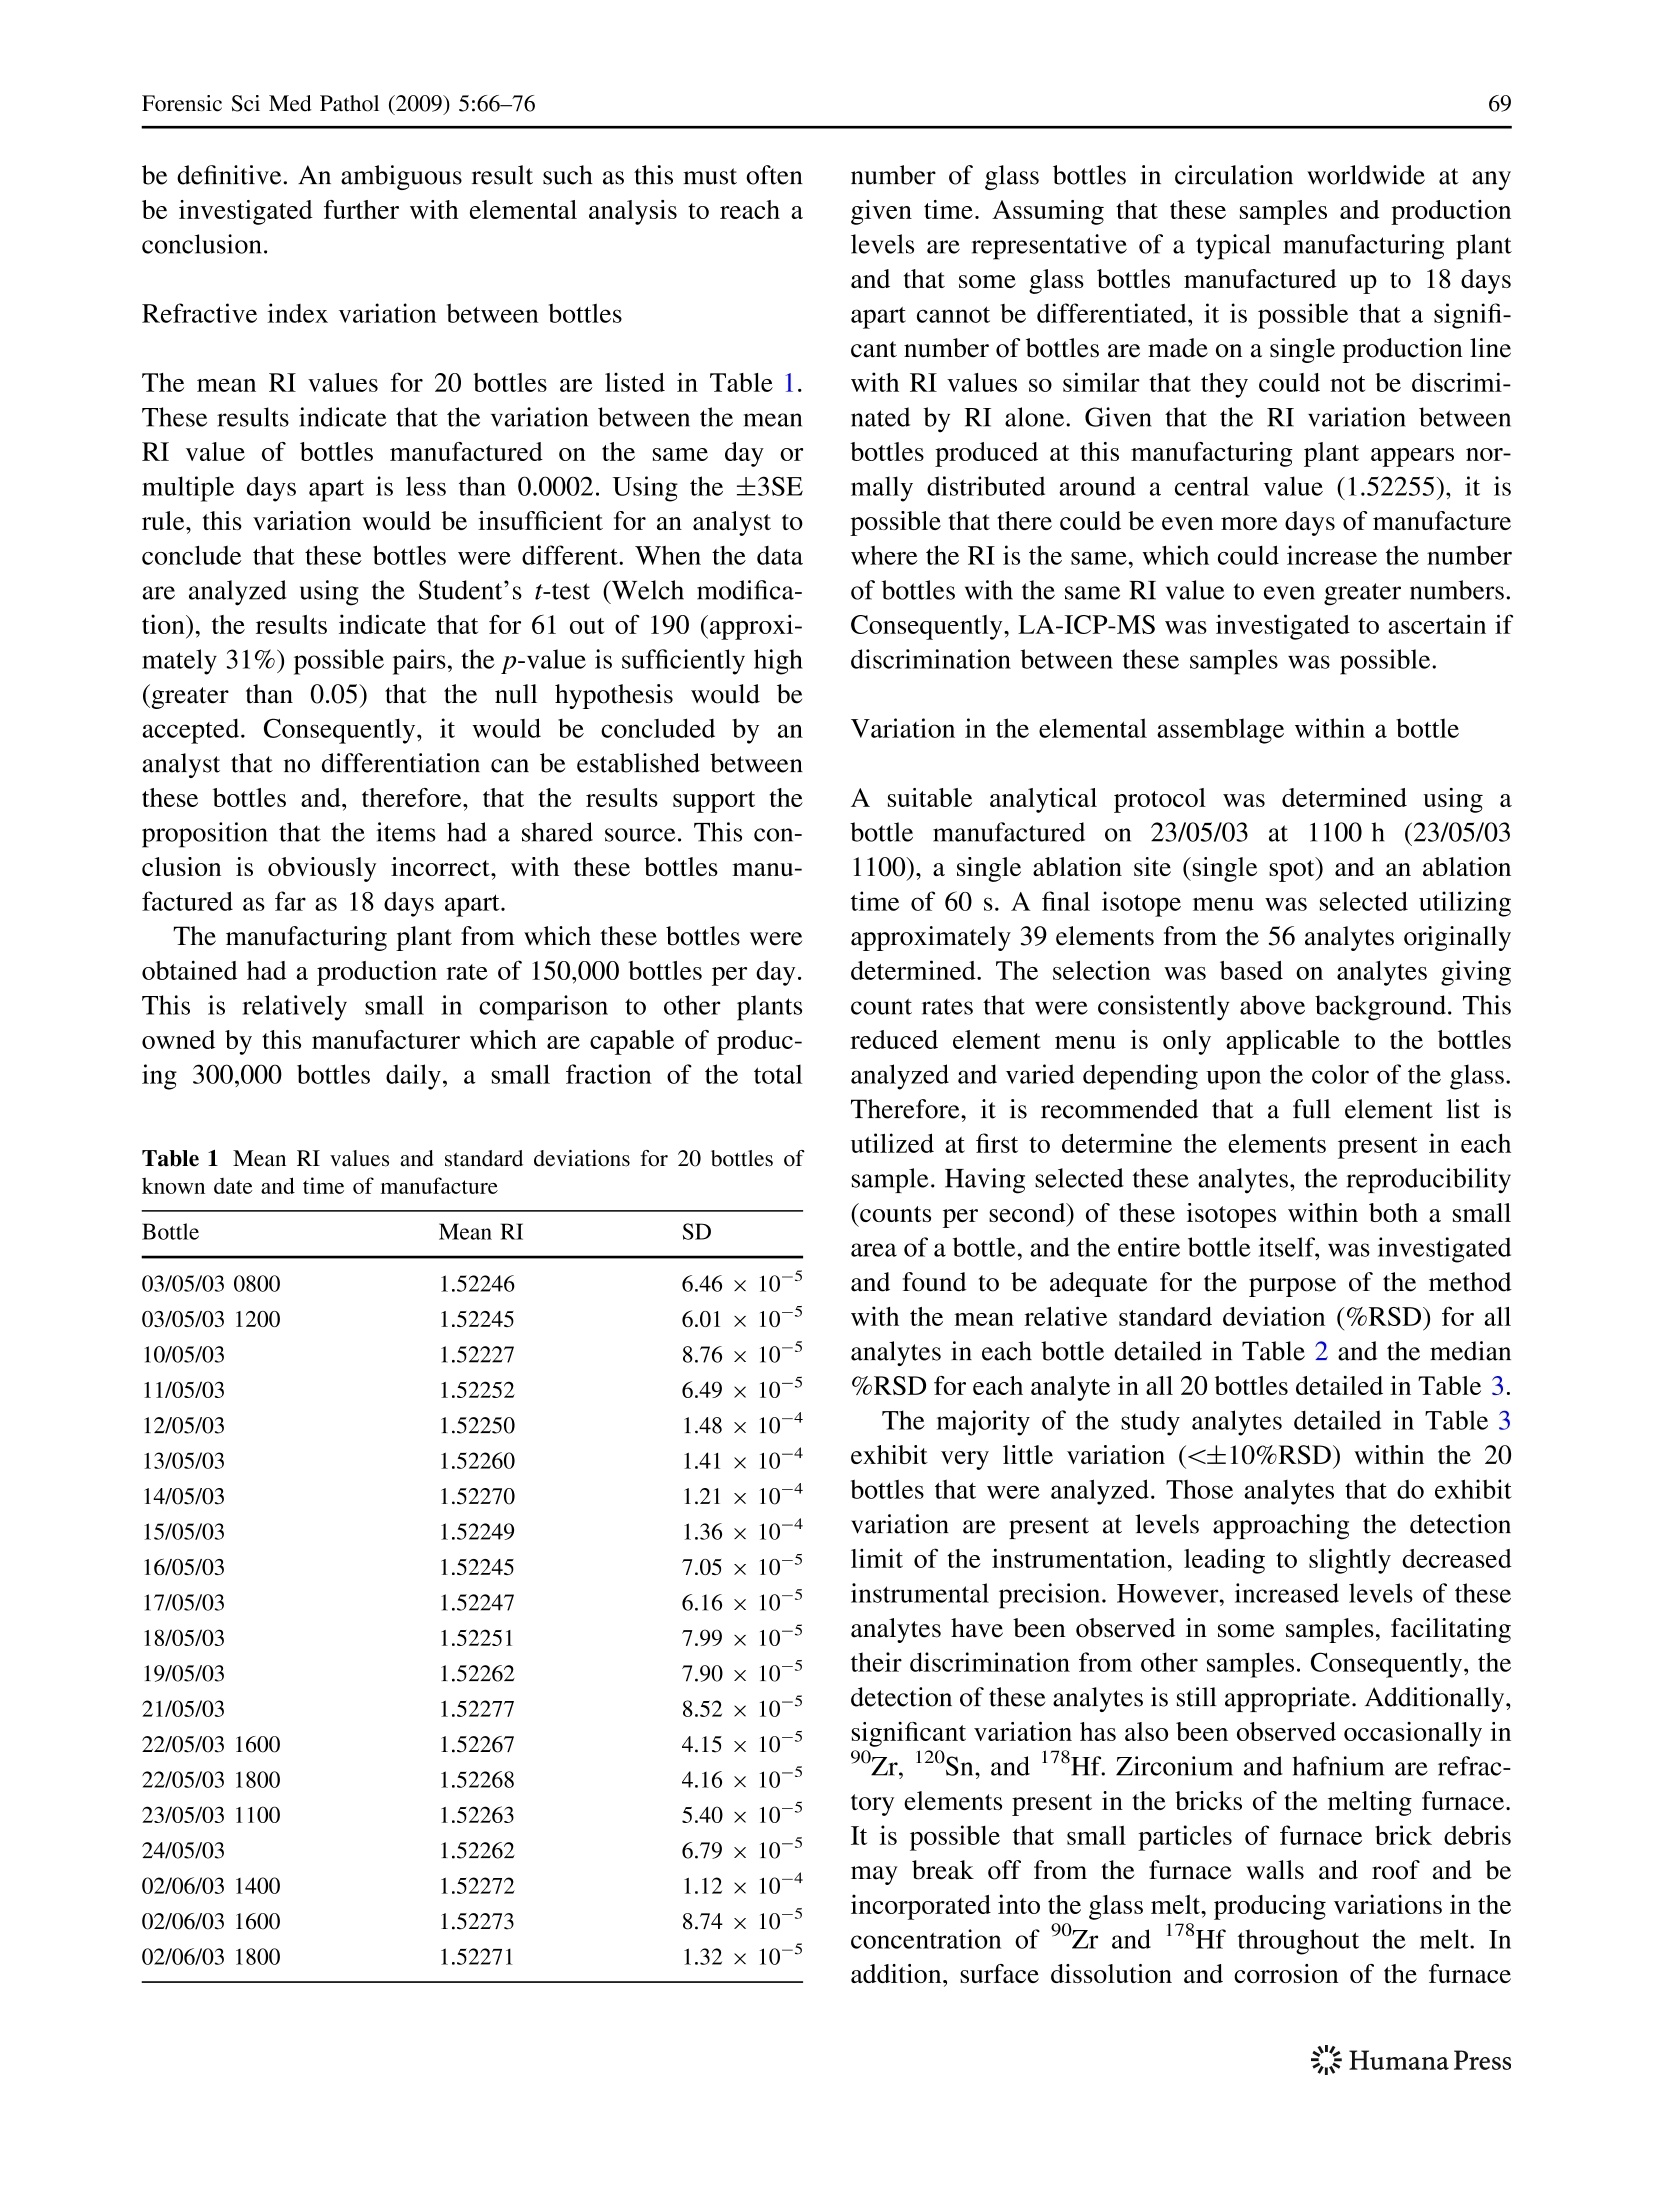
采用激光烧蚀电感耦合等离子体质谱(LA-ICP-MS)与传统的折射率(RI)测定方法进行了比较,确定了玻璃瓶的来源。单独使用RI方法,是不可能区分某些生产超过18天的玻璃瓶的,除非是同一个制造工厂制造的。此外,单瓶酒中RI的差异可能大到足以使仅使用这种技术的共种源建立无效。经过1个月收集的瓶中微量元素组成的测定证实,在此期间生产的单个瓶中微量金属分布变化极小。因此,从破碎的瓶子中提取的任何玻璃碎片的微量元素组成可以被认为是整个瓶子的元素组成的代表。此外,对56种分析物中大约38种的分布情况进行统计比较后确定,在同一工厂生产的两瓶玻璃瓶之间相隔两小时测量所得量是有区别的。利用这种方法,有可能开发出一种分析协议,以显著提高法医玻璃证据的准确性并确定来源。
方案详情

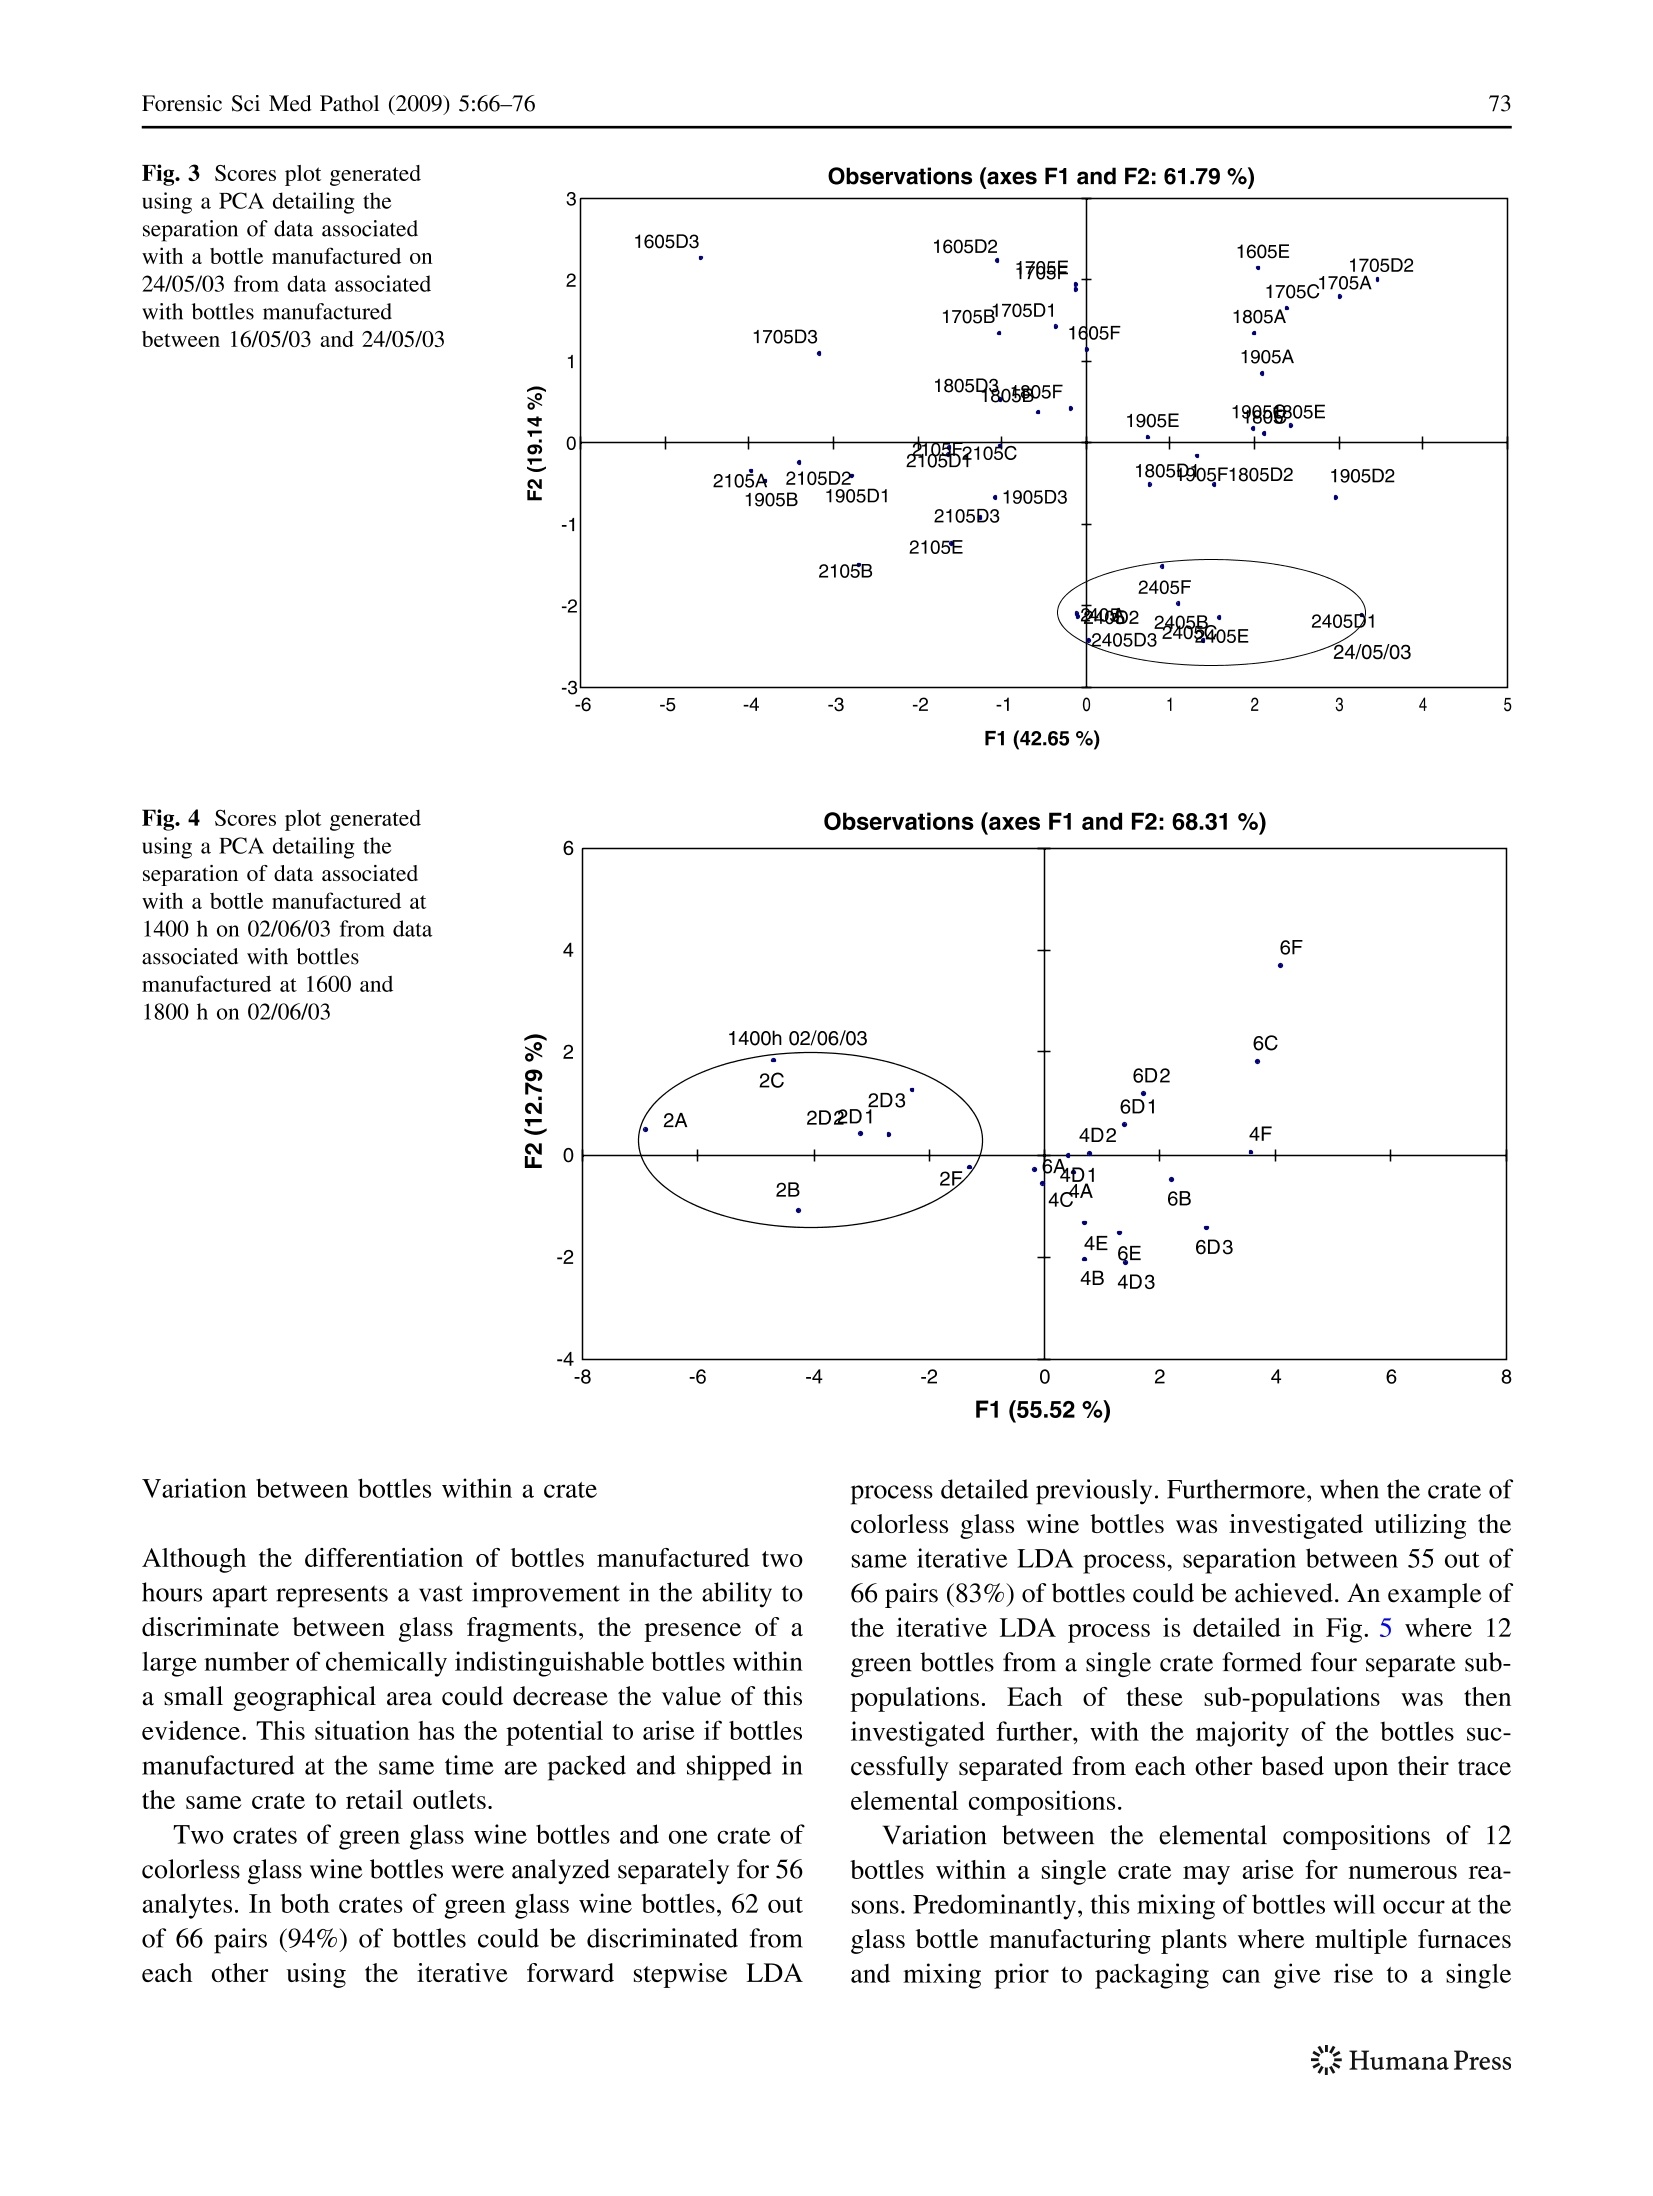
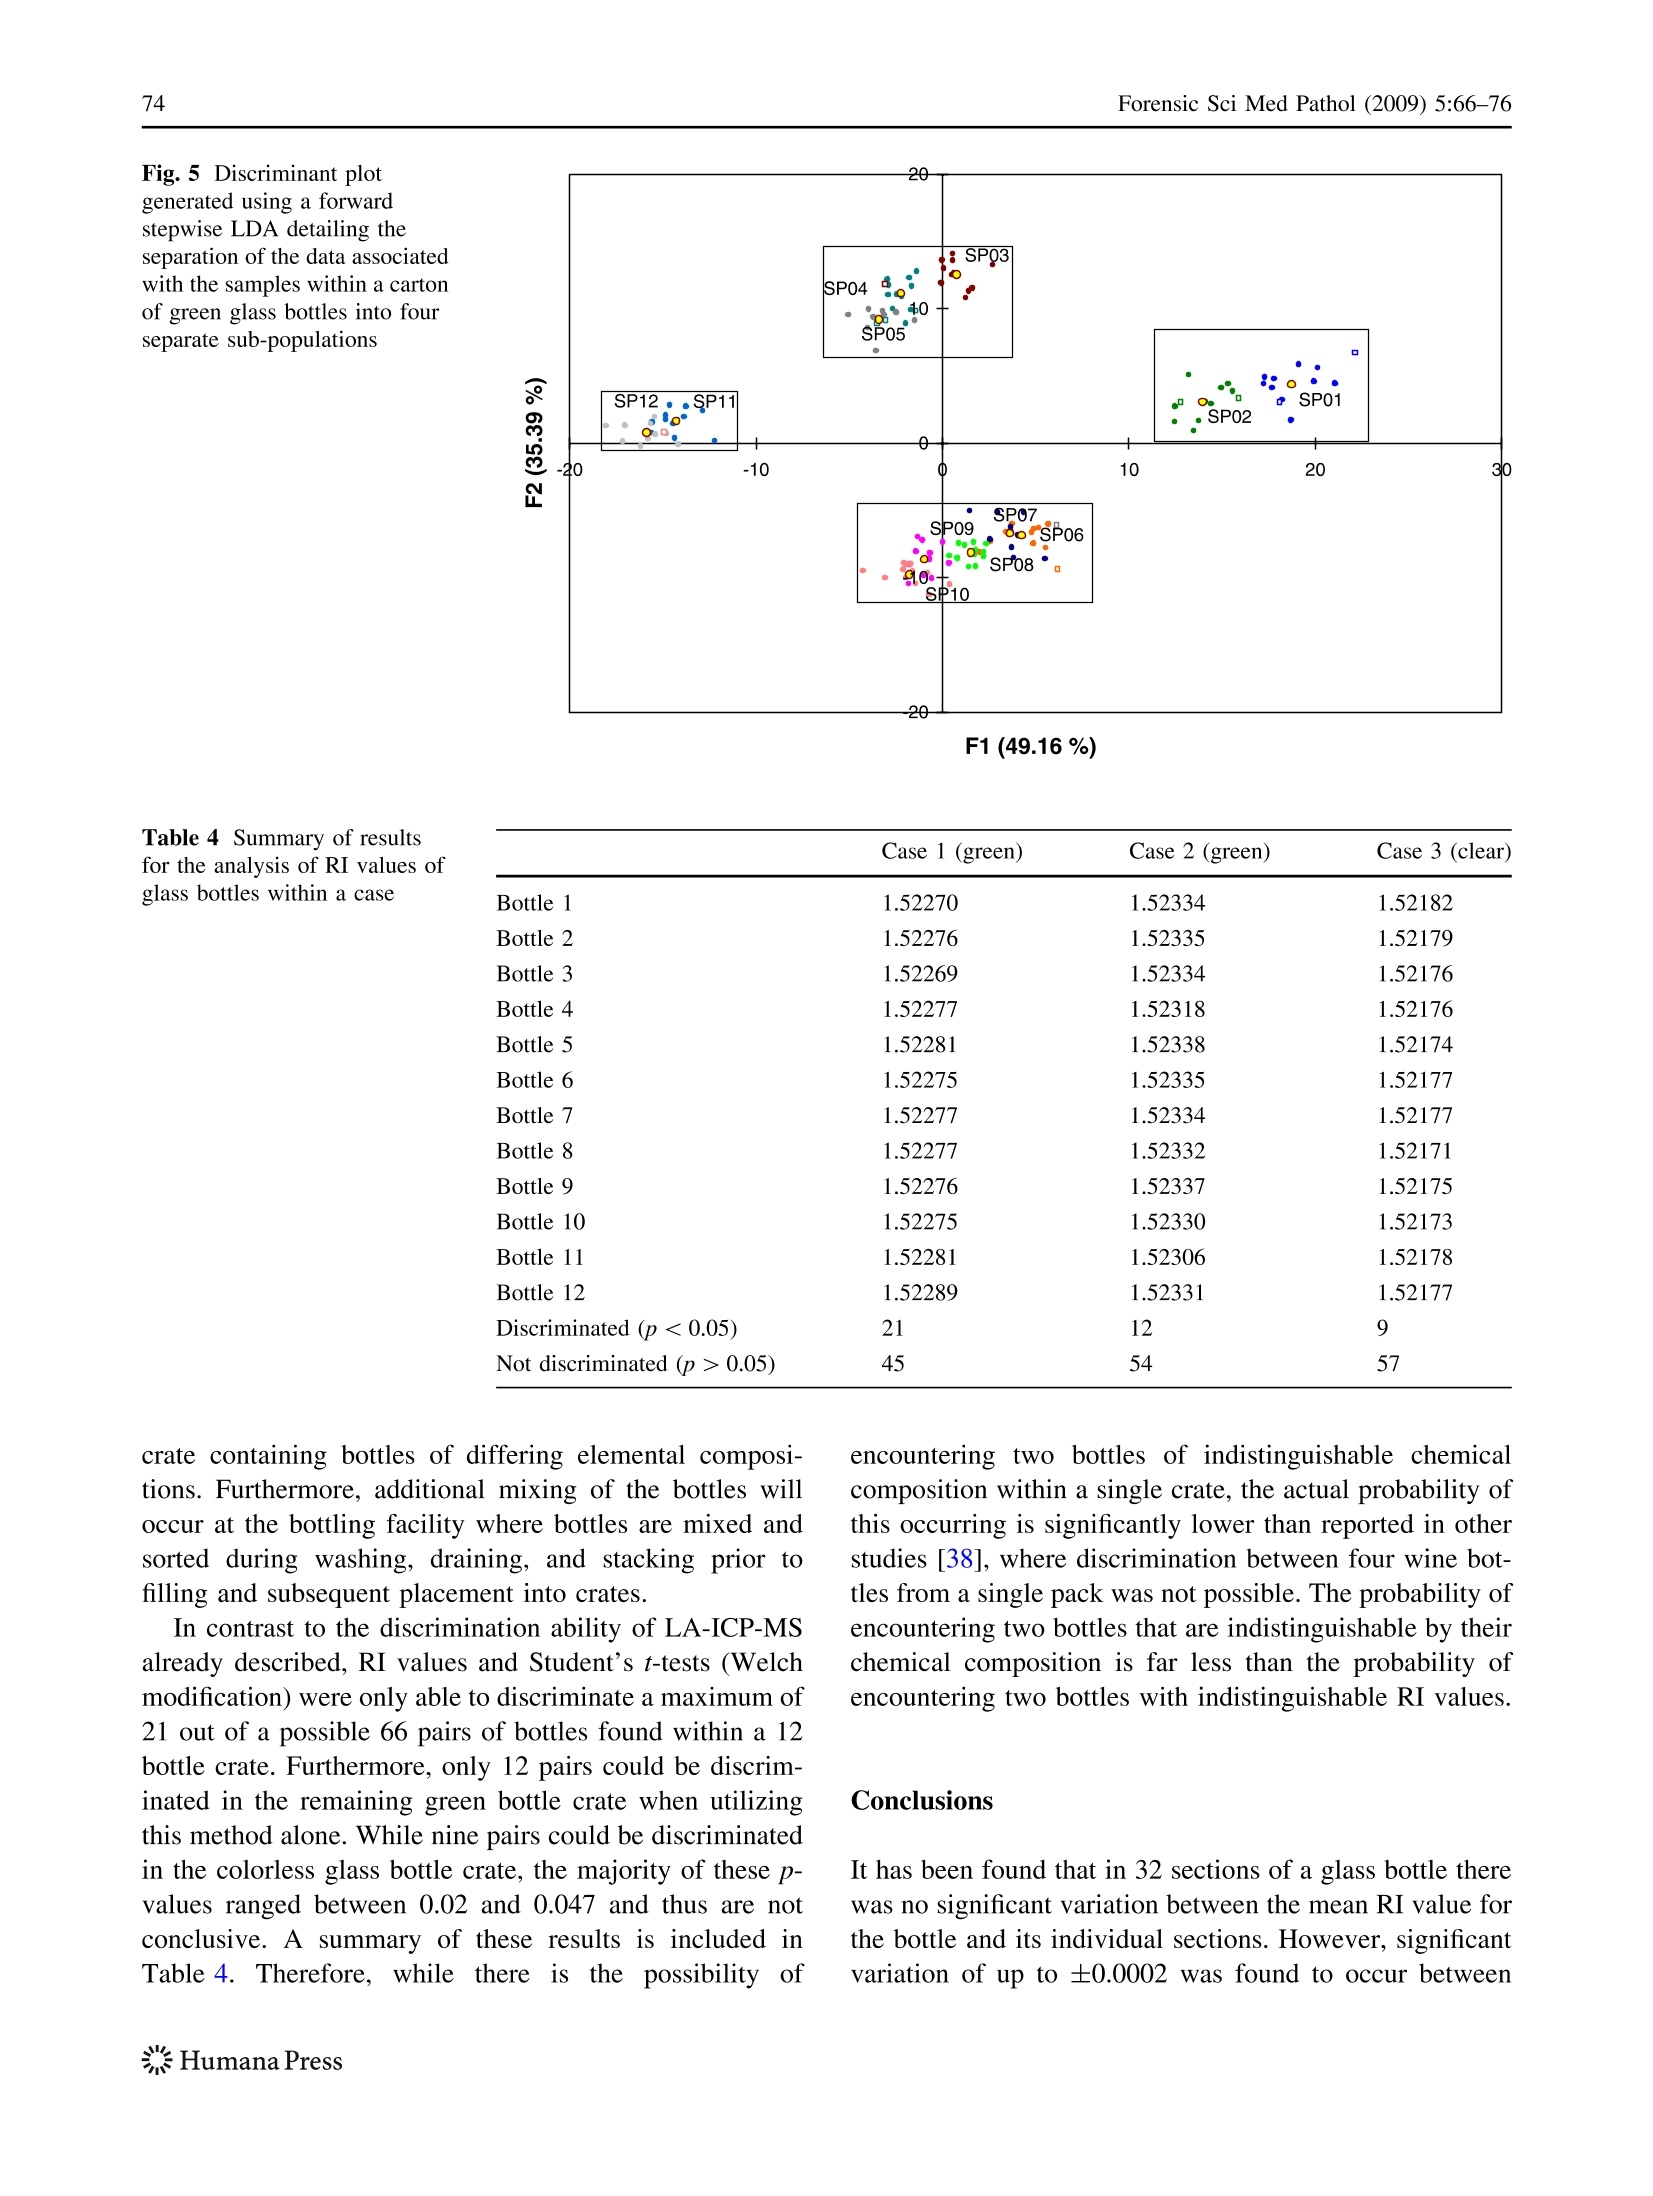
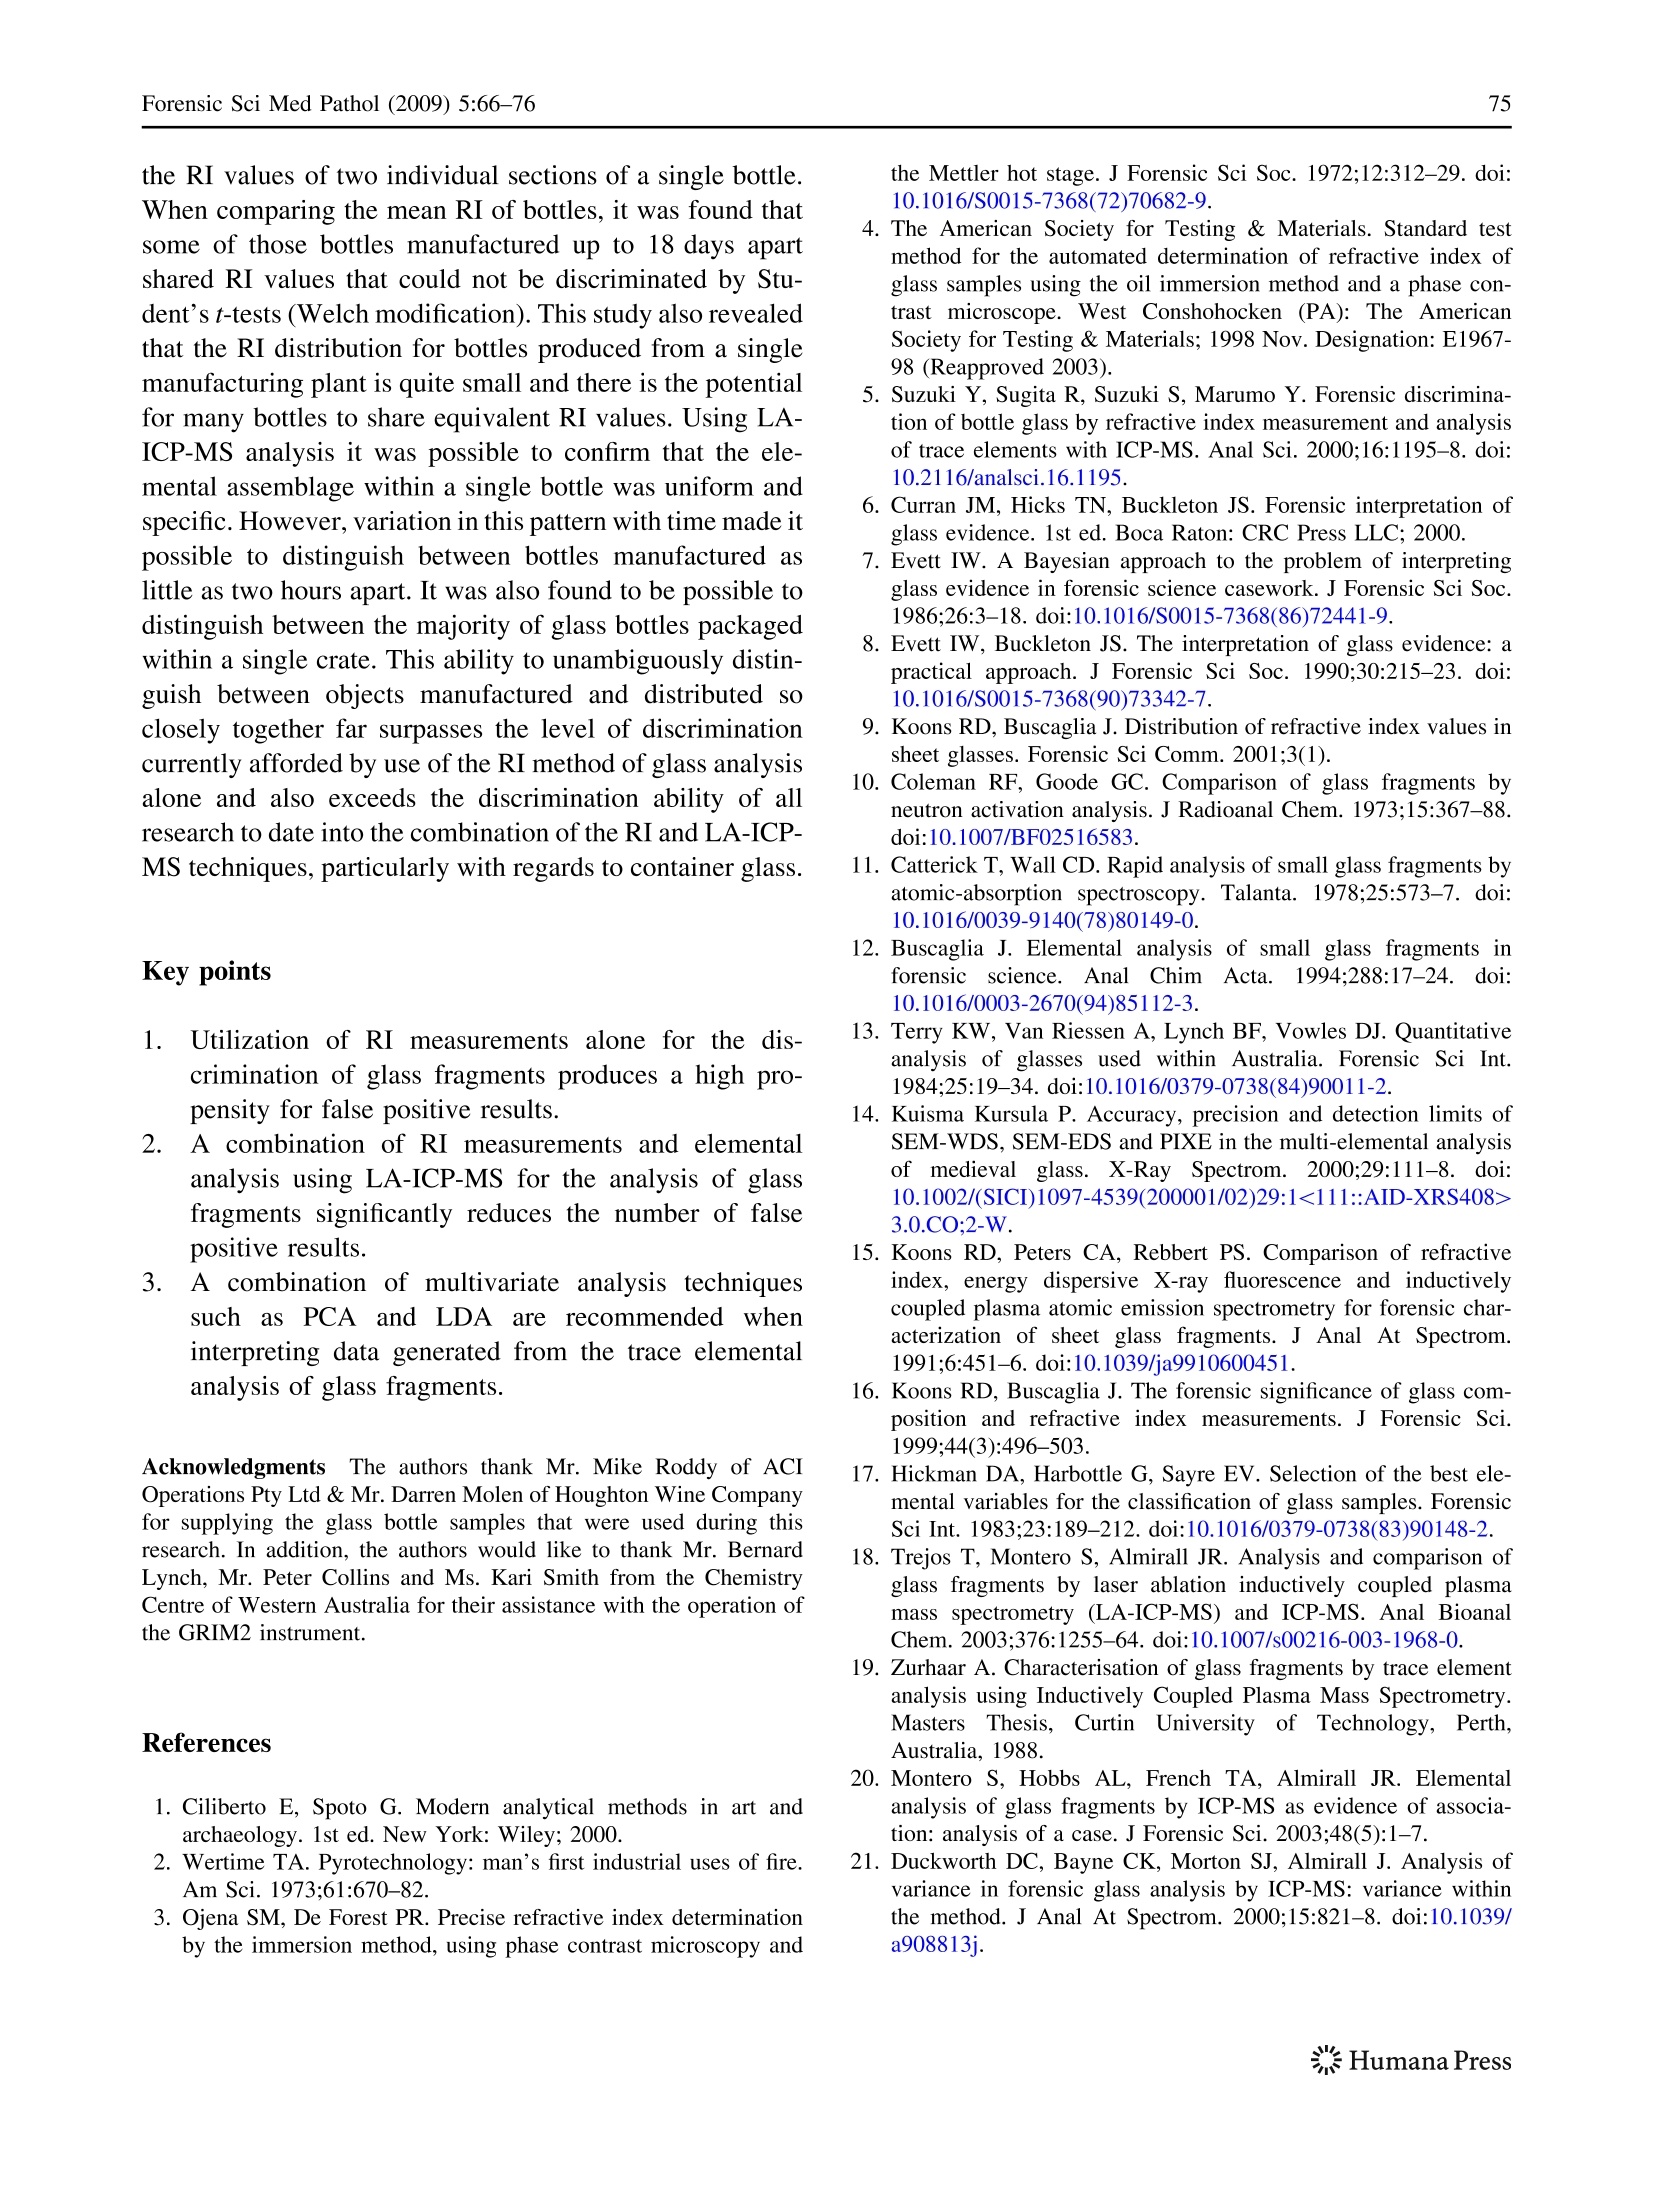
Forensic Sci Med Pathol (2009) 5:66-76DOI 10.1007/s12024-009-9087-7ORIGINAL ARTICLE 67Forensic Sci Med Pathol (2009)5:66-76 A comparison of the use of refractive index (RI) and laser ablationinductively coupled plasma mass spectrometry (LA-ICP-MS) forthe provenance establishment of glass bottles Christopher D. May · R. John Watling Abstract The use of laser ablation inductively coupledplasma mass spectrometry (LA-ICP-MS) has been com-pared with the traditional method of refractive index (RI)measurement for the establishment of the provenance ofglass bottles. Using the RI method alone, it is not possibleto discriminate between certain glass bottles produced upto 18 days apart from a single manufacturing plant. Fur-thermore, variations in RI within a single bottle can belarge enough to invalidate co-provenance establishmentusing this technique alone. Determination of the traceelemental composition of bottles collected over a 1-monthperiod confirmed that minimal variation of trace metaldistribution occurred within individual bottles made duringthis period.Therefore, the trace element composition ofany fragment of glass from a broken bottle may be con-sidered representative of the elemental composition of theentire bottle. In addition, statistical comparison of thedistribution of approximately 38 of the 56 analytes thatwere determined established that it was possible to dis-criminate between two glass bottles manufactured in thesame plant two hours apart. Using this methodology it hasbeen possible to develop an analytical protocol to signifi-cantly improve the accurate comparison and provenanceestablishment of forensic glass evidence. Keywords Forensic science.Glass comparison·Container glass · Refractive index· Elemental analysis ·Laser ablation inductively coupled plasma massspectrometry· Chemometrics ( C. D. May(区)·R. J. Watling ) ( Centre for F orensic Science ( M420), U n iversity of Western Australia, 35 Stirling Highway , Crawley, WA 6 009, A ustralia e-mail: christopher.may@uwa.edu.au ) The manufacture of glass dates back to approximately2000BCE innMesopotamiaaandiebecameai filourishingindustry in Egypt around1500BCE under the XVIIIDynasty [1, 2]. Glass material is ubiquitous in modernsociety and is commonly used in buildings, containers,vehicles, light fittings, and ornamental articles within thehome. As a result of this, glass can become evidentiarymaterial following a variety of criminal offences and willbe recovered at a large number of crime scenes. Conse-quently, glass holds great forensic significance and thus itsaccurate analysis for provenanceeestablishment isis oofimmense criminalistic importance. Currently, refractive index (RI) is the primary tool usedfor the analysis of glass fragments. The RI of glass is theratio of the velocity of light in a vacuum to the velocity oflight in the glass fragment and is measured using theimmersion method, detailed by Ojena and De Forest [3]and recently updated by ASTM E1967-98 [4]. Historically,this technique was used to determine if two glass fragmentsshared a common origin, though in recent times, RI hascommonly been utilized as a screening technique prior toelemental analysis. There are several different methods forthe statistical analysis of the RI values that are obtained.The statistical method selected is dependent upon how thetest is to be used (i.e., solely as a screening technique or todiscriminate between fragments) and the appropriate type Iand type II error levels for that purpose. One study [5]suggested that a variation of ±0.0002 was sufficient toindicate that the two fragments did not share a commonsource, with this value being roughly equivalent to threestandard deviations from the mean value of the RI mea-sured for the control glass object (the ±3SE rule)[6]. Inour laboratory, a Student’s t-test (Welch modification) has been used where a p-value of greater than 0.05 may indi-cate common origin. Bayesian analysis has also beenwidely utilized in forensic glass analysis [7, 8]; however,this technique will not be discussed further as the appli-cation of Bayes Theorem often requires case-specificinformation that is not available in this study. One of the most common forms of glass debris found atcrime scenes is float glass, typically found in windows, andhere, “evidence of narrowing of RI distributions about acentral value”[9] is making it increasingly difficult tosimply use RI measurements to discriminate between glasssamples. The narrowing of the RI range is likely caused bysignificant improvements in quality control of the fabrica-tion process itself. However, because glass is produced bya continuous process, slight variations in the origin and mixof starting materials and degradation of the furnace itselfwill lead to variations in the trace and ultra-trace elementprofile of the glass produced over time. Consequently, it isthen theoretically possible to use these potential variationsin trace element profiles to discriminate between glassfragments that have been made a certain time apart. Additionally, variations in the source of starting mate-rials also helps to distinguish between different manufac-turers as the trace element composition of these materialswill vary because of variations in the natural elementalcomposition of the starting products from different sites.Furthermore, interactions between the glass melt and theequipment used in its production such as the kiln, stirringpaddles, and the transport rollers all result in a transfer ofelements that will alter the trace elemental composition ofthe final glass product. For glass bottles, the melt is produced by mixingingredients in a furnace before moving into a forehearthwhere the glass is conditioned at a consistent temperatureof 1200°℃. The glass is then cut by shears into gobs whichare then inserted into a blank mould and formed into aparison using either compressed air or a metal alloy plun-ger. This parison is then placed in a final blow mouldwhere compressed air blows the glass into shape. Thecontainers are then taken through an annealing lehr beforebeing sprayed with a coating that assists handling prior tobeing packed and shipped. Under these manufacturingprocedures, even small bottle producing plants producemany thousands of bottles a day and it is just as difficult todiscriminate between these, using RI, as it is between thefloat glass panes referred to in the Koons and Buscagliastudy [9]. Many analytical techniques are suitable for the ele-mental analysis of glass including neutron activationanalysis (NAA) [10], flame atomic absorption spectroscopy(FAAS) [11, 12] and scanning electron microscopy (cou-pled with energy dispersive spectroscopy (SEM-EDS) [12,13] and wavelength dispersive spectroscopy (SEM-WDS) While it is possible to easily distinguish between bottlesmade by different manufacturers, distinguishing betweenbottles made in the same manufacturing plant is a signifi-cantly more difficult task. In the present study, containerglass of specific known manufacture dates has been ana-lyzed using LA-ICP-MS. A range of production dates waschosen to establish the discrimination ability of the finalanalytical and interpretational protocols. Data processingmethods, including linear discriminant analysis (LDA) andprincipal component analysis (PCA), were utilized to assistin the interpretation of the results. The data have then beencompared to RI values, obtained from analysis of the samematerial using GRIM2, utilizing both the ±3SE rule andthe Student’s t-test (Welch modification). Methods Sample preparation Five “French Green” glass bottles from a local manufac-turer (ACI Glass Packaging Australia) of various knownmanufacturing dates and times were divided into 32 sepa-rate sections (eight vertical sections and four horizontalsections) using a permanent marker before being cut usinga circular diamond saw. The individual glass pieces werepackaged separately in 100 ml plastic tubs before beingremoved, wrapped in paper towel, and hit with a malletwrapped in a polyethylene film to break the glass pieces upfurther. Small pieces of glass were placed in 15 ml cen-trifuge tubes while the larger pieces were returned to the100 ml plastic tubs. Samples were identified with their dateand time of manufacture, for example 03/05/03 0800 sig-nifying that the sample was taken on 3rd May 2003 at0800 h. A further 15“French Green” glass bottles obtainedfrom ACI Glass Packaging Australia of various knownmanufacturing dates and times and a total of three crates(36 bottles) of three different varieties of glass bottles wereobtained from Houghton’s Wine Company. These threecrates of bottles had all been manufactured by ACI Glass Packaging Australia and had been shipped to Houghton’sWine Company for filling. The crates were collected forsampling prior to filling and the bottles within each cratewere assigned arbitrary sample numbers from 1 to 12. All51 of these glass bottles were then wrapped individually inpolyethylene film and paper towel prior to being hit with amallet wrapped in polyethylene film. Small pieces of glasswere placed in 15 ml centrifuge tubes while the remainingpieces were stored in 100 ml plastic tubs. Refractive index RI was determined for all 32 pieces of 03/05/03 0800 bottleand eight pieces from each of the remaining four bottles.RIwas also determined for three pieces of the other 51 glassbottles. All RI measurements were conducted using theGRIM2 (Foster & Freeman, Worcestershire, UK) follow-ing the method specified in ASTM E1967-98[4]. Elemental analysis Thirty-two interior samples from each of the first five glassbottles were washed in a 5% HNO3 solution prior to rinsingwith MilliQTM ultra high purity (18 MQ) water and thenmounted on Blu-tackTM on Perspex disks and analyzedusing LA-ICP-MS. Eight interior samples from each of theremaining 51 bottles were also washed and mounted in asimilar fashion. An UP213 laser ablation unit (New WaveResearch, Fremont, CA) and a 7500CS ICP-MS (AgilentTechnologies, Santa Clara, CA) were used for all experi-ments. Each sample was analyzed for 56 analytes using anacquisition time of 60 s, undertaking triplicate single spotablations with a 30 s dwell time, an energy level of 75%,fluence of 17 J/cm , pulse rate of 10 Hz, and a spot size of55 um. The raw data resulting from these analyses wereprocessed using GlitterM (GEOMAC, Macquarie Univer-sity) data reduction software to generate counts per seconddata. Following processing of the raw data, the elementisotope menu was refined to include only those isotopesgiving a response sensitivity greater than 100 counts persecond. Due to variations in the day-to-day set-up characteristicsof the laser ablation and ICP-MS systems and the occur-rence of some degree of system drift with time, it wasnecessary to run the NIST 610 Certified Reference GlassStandard throughout all analytical protocols. Triplicateanalyses were undertaken on the NIST 610 Glass Standardfollowing every 15 analyses that were performed on glasssamples. Drift correction of the data associated with eachday of analysis was then undertaken for each isotope withreference to the NIST 610 Glass Standard. Furthermore, theanalytical data for all samples and standards were crossnormalized with reference to the NIST 610 Glass Standard so that it was possible to compare unbiased data fromdifferent days and establish if true isotopic variationsexisted between different bottles. Finally, normalization toan isotope (Al) was undertaken to reduce the effect ofvariationsin laser couplingefficiencybetween theanalyses. Results and discussion Refractive index variation within a bottle The RI of 32 sections from a single bottle was analyzedusing the GRIM2. The variation in the averaged results forthe eight vertical sections of a single bottle was found to beless than 0.0002. Using the ±3SE rule, the variation thatexists between the RI of the individual areas of the bottleand the mean RI (1.52246) was found to be insignificant.However, when the refractive indices of all 32 sectionsfrom a single bottle were compared to each other, it wasfound that up to 0.0002 variation existed between twosections (due to a lower RI value at the bottom of thebottle). Therefore, depending upon the availability ofcontrol samples for analysis, it is possible that wheninterpreting these results using the ±3SE rule, it would beconcluded that these sections do not share a common ori-gin, even though this is clearly not the case. Variations such as this are found in container glass asthe conditions for manufacture are not as controlled asother glass manufacturing processes. As a result of this,variations due to strain, different cooling rates, the positionof the melt that the container is made from in the kiln, andother sources of contamination arise and lead to non-uni-form RI values. Literature has revealed that this variationwithin a bottle is expected to be up to ±0.0004 [29,30]. For the other four bottles analyzed it was determinedthat the RI values for the sections of the bottle did not showsignificant variation from the mean RI value for the bottle.However, with bottle 23/05/03 1100,0.0002 variation wasagain found between two of its averaged sections (againdue to a lower RI value at the bottom edge of the bottle).Given that it is highly unlikely to locate a complete bottleat a crime scene, within-object variability cannot beaccurately determined. Therefore, in this situation, 0.0002variation in RI value may again lead to the erroneousconclusion of different origin for the two sections. When atwo-tailed Student’s t-test (Welch modification) was used,probabilities of 0.039 were obtained. Given that a 95%confidence limit is utilized, this p-value is not high enoughto accept the null hypothesis that the RI values are the same(which would have inferred that the sections originatedfrom the same source). However, rejection of the nullhypothesis given this relatively high p-value would hardly be definitive. An ambiguous result such as this must oftenbe investigated further with elemental analysis to reach aconclusion. Refractive index variation between bottles The mean RI values for 20 bottles are listed in Table 1.These results indicate that the variation between the meanRI value of bottles manufactured on the same day ormultiple days apart is less than 0.0002. Using the ±3SErule, this variation would be insufficient for an analyst toconclude that these bottles were different. When the dataare analyzed using the Student’s t-test (Welch modifica-tion), the results indicate that for 61 out of 190 (approxi-mately 31%) possible pairs, the p-value is sufficiently high(greater than 0.05) that the null hypothesis would beaccepted. Consequently, it would be concluded by ananalyst that no differentiation can be established betweenthese bottles and, therefore, that the results support theproposition that the items had a shared source. This con-clusion is obviously incorrect, with these bottles manu-factured as far as 18 days apart. The manufacturing plant from which these bottles wereobtained had a production rate of 150,000 bottles per day.This is relatively small in comparison to other plantsowned by this manufacturer which are capable of produc-ing 300,000 bottles daily, a small fraction of the total Table 1 Mean RI values and standard deviations for 20 bottles ofknown date and time of manufacture Bottle Mean RI SD 03/05/030800 1.52246 6.46×10- 03/05/031200 1.52245 6.01×10 10/05/03 1.52227 8.76×10- 11/05/03 1.52252 6.49×10-> 12/05/03 1.52250 1.48×10⁻⁴ 13/05/03 1.52260 1.41×10⁻⁴ 14/05/03 1.52270 1.21×10⁻⁴ 15/05/03 1.52249 1.36×10⁻⁴ 16/05/03 1.52245 7.05×10- 17/05/03 1.52247 6.16×10- 18/05/03 1.52251 7.99×10- 19/05/03 1.52262 7.90×10-> 21/05/03 1.52277 8.52×10- 22/05/03 1600 1.52267 4.15×10- 22/05/03 1800 1.52268 4.16×10- 23/05/03 1100 1.52263 5.40×10- 24/05/03 1.52262 6.79×10 02/06/031400 1.52272 1.12×10-+ 02/06/031600 1.52273 8.74×10- 02/06/031800 1.52271 1.32×10- number of glass bottles in circulation worldwide at anygiven time. Assuming that these samples and productionlevels are representative of a typical manufacturing plantand that some glass bottles manufactured up to 18 daysapart cannot be differentiated, it is possible that a signifi-cant number of bottles are made on a single production linewith RI values so similar that they could not be discrimi-nated by RI alone. Given that the RI variation betweenbottles produced at this manufacturing plant appears nor-mally distributed around a central value (1.52255), it ispossible that there could be even more days of manufacturewhere the RI is the same, which could increase the numberof bottles with the same RI value to even greater numbers.Consequently, LA-ICP-MS was investigated to ascertain ifdiscrimination between these samples was possible. Variation in the elemental assemblage within a bottle A suitable analytical protocol was determined using abottle manufactured on 23/05/03att1100 h (23/05/031100), a single ablation site (single spot) and an ablationtime of 60 s. A final isotope menu was selected utilizingapproximately 39 elements from the 56 analytes originallydetermined. The selection was based on analytes givingcount rates that were consistently above background. Thisreduced element menu is only applicable to the bottlesanalyzed and varied depending upon the color of the glass.Therefore, it is recommended that a full element list isutilized at first to determine the elements present in eachsample. Having selected these analytes, the reproducibility(counts per second) of these isotopes within both a smallarea of a bottle, and the entire bottle itself, was investigatedand found to be adequate for the purpose of the methodwith the mean relative standard deviation (%RSD) for allanalytes in each bottle detailed in Table 2 and the median%RSD for each analyte in all 20 bottles detailed in Table 3. The majority of the study analytes detailed in Table 3exhibit very little variation (<±10%RSD) within the 20bottles that were analyzed. Those analytes that do exhibitvariation are present at levels approaching the detectionlimit of the instrumentation, leading to slightly decreasedinstrumental precision. However, increased levels of theseanalytes have been observed in some samples, facilitatingtheir discrimination from other samples. Consequently, thedetection of these analytes is still appropriate. Additionally,significant variation has also been observed occasionally in90zr, 120Sn, and 178Hf. Zirconium and hafnium are refrac-tory elements present in the bricks of the melting furnace.It is possible that small particles of furnace brick debrismay break off from the furnace walls and roof and beincorporated into the glass melt, producing variations in theconcentration of 9zr and 178Hf throughout the melt. Inaddition, surface dissolution and corrosion of the furnace Table 2 Summary of the mean %RSD values for all analytes fromeach of the 20 bottles of known date and time of manufacture Date of manufacture Mean %RSD 03/05/030800 5.83 03/05/03 1200 6.78 10/05/03 10.83 11/05/03 7.18 12/05/03 7.67 13/05/03 7.98 14/05/03 6.95 15/05/03 11.13 16/05/03 9.33 17/05/03 8.14 18/05/03 6.03 19/05/03 6.59 21/05/03 11.02 22/05/03 1600 4.92 22/05/03 1800 6.42 23/05/031100 4.86 24/05/03 6.15 02/06/03 1400 6.36 02/06/031600 7.00 02/06/031800 6.59 Complete data set 20.07 Variation in the elemental assemblage between bottles Previous studies by other authors have identified thatanalysis of glass fragments utilizing LA-ICP-MS offers asubstantial improvement in discrimination ability betweensamples over the use of RI measurements alone [18, 33].However, these studies investigated samples from a varietyof sources that do not offer the challenge to the analyticalprotocols that a single manufacturing plant scenario pro-vides. While a single glass manufacturing plant study hasbeen undertaken in the past [34], the study was based upon Table 3 Summary of the med- Analyte %RSD the use of solution ICP-MS.Consequently, the LA-ICP-MSanalytical protocols have previously not been taken to theirlimits, which was the purpose of this study. Recent developments by researchers in the field have ledto the generation of quantitative data from the analysis ofglass by LA-ICP-MS [28, 35]. However, these studies arebased on the analysis of large samples with an essentiallyinfinite thermal sink and analytical mass. In real forensicsituations, there is a considerable variation in sample massand in the ability to ablate the samples for uniform times, therefore quantification of the data is not always appro-priate. Consequently, unambiguous and robust discrimi-nation between glass fragments must be made using datathat are relative rather than quantitative. This can beachieved using the original counts per second (qualitative,data and this data can be used easily and effectively withall chemometrical and statistical interpretation techniquesto achieve conclusions that will withstand cross examina-tion in a court of law. Interpretation is, in this case, basedon comparison of elemental ratios within a spectral profile.The relative abundance of elements in this profile does notvary in relation to ablation time but absolute masses ofanalytes do and consequently quantification is not appro-priate. Therefore, although quantitative results have notbeen presented in this current study, the use of statisticalmethods such as LDA and PCA makes it possible to dis-criminate between the majority of the bottles analyzed. Linear discriminant analysis The utilization of LDA for the differentiation of glass typesbased upon LA-ICP-MS trace element data has previouslybeen documented by Schmidt et al. [36]. In this currentstudy, LDAs have been used to differentiate between glassbottles manufactured over a 1-month period. It has beenobserved that, utilizing an iterative process, discriminationbetween 99.5% of the glass bottles analyzed was possible This iterative process involves conducting a forwardstepwise LDA on the entire data set. This data set consistsof 24 replicate analyses per bottle, with each bottle labeledas a separate group. An LDA model is generated, facili-tating the identification of potential sub-populations as theyseparate out from the main population. Random cross validation is utilized whereby a user-specified number( 0.05) 45 54 57 crate containing bottles of differing elemental composi-tions. Furthermore, additional mixing of the bottles willoccur at the bottling facility where bottles are mixed andsorted during washing, draining, and stacking prior tofilling and subsequent placement into crates. In contrast to the discrimination ability of LA-ICP-MSalready described,RI values and Student’s t-tests (Welchmodification) were only able to discriminate a maximum of21 out of a possible 66 pairs of bottles found within a 12bottle crate. Furthermore, only 12 pairs could be discrim-inated in the remaining green bottle crate when utilizingthis method alone. While nine pairs could be discriminatedin the colorless glass bottle crate, the majority of these p-values ranged between 0.02 and 0.047 and thus are notconclusive. A summary of these results is included inTable 4. Therefore, while there isthe possibility of encountering two bottles of indistinguishable chemicalcomposition within a single crate, the actual probability ofthis occurring is significantly lower than reported in otherstudies [38], where discrimination between four wine bot-tles from a single pack was not possible. The probability ofencountering two bottles that are indistinguishable by theirchemical composition is far less than the probability ofencountering two bottles with indistinguishable RI values. Conclusions It has been found that in 32 sections of a glass bottle therewas no significant variation between the mean RI value forthe bottle and its individual sections. However, significantvariation of up to ±0.0002 was found to occur between the RI values of two individual sections of a single bottleWhen comparing the mean RI of bottles, it was found thatsome of those bottles manufactured up to 18 days apartshared RI values that could not be discriminated by Stu-dent’s t-tests (Welch modification). This study also revealedthat the RI distribution for bottles produced from a singlemanufacturing plant is quite small and there is the potentialfor many bottles to share equivalent RI values. Using LA-ICP-MS analysis it was possible to confirm that the ele-mental assemblage within a single bottle was uniform andspecific. However, variation in this pattern with time made itpossible to distinguish between bottles manufactured aslittle as two hours apart. It was also found to be possible todistinguish between the majority of glass bottles packagedwithin a single crate. This ability to unambiguously distin-guish between objects manufactured and distributed soclosely together far surpasses the level of discriminationcurrently afforded by use of the RI method of glass analysisalone and also exceeds the discrimination ability of allresearch to date into the combination of the RI and LA-ICP-MS techniques, particularly with regards to container glass. Key points 1. Utilization of RI measurements alone for the dis.crimination of glass fragments produces a high pro-pensity for false positive results. 2. A combination of RI measurements and elementalanalysis using LA-ICP-MS for the analysis of glassfragments significantly reduces the number of falsepositive results. 3. A combination of multivariate analysis techniquessuch as PCAand LDAaare recommended wheninterpreting data generated from the trace elementalanalysis of glass fragments. Acknowledgments The authors thank Mr. Mike Roddy of ACIOperations Pty Ltd & Mr. Darren Molen of Houghton Wine Companyfor supplying the glass bottle samples that were used during thisresearch. In addition, the authors would like to thank Mr. BernardLynch, Mr. Peter Collins and Ms. Kari Smith from the ChemistryCentre of Western Australia for their assistance with the operation ofthe GRIM2 instrument. References 1. Ciliberto E, Spoto G. Modern analytical methods in art andarchaeology. 1st ed. New York: Wiley; 2000. 2. Wertime TA. Pyrotechnology: man’s first industrial uses of fire.Am Sci. 1973;61:670-82. ( 3. Ojena SM, De Forest P R . Precise r e fractive index d etermination by t he immersion method, using phase contrast microscopy and ) the Mettler hot stage. J Forensic Sci Soc. 1972;12:312-29. doi:10.1016/S0015-7368(72)70682-9. ( 4. The American Society for Testing & Materials. St a ndard te s t method for the a utomated determination of r efractive index of glass samples using the oi l immersion method and a phase con-tras t microscope. West Conshohocken ( PA): T he A merican Society for Testing & Materials; 1998 Nov. Designation: E 1967- 98 (Reapproved 2003). ) 5. Suzuki Y, Sugita R, Suzuki S, Marumo Y. Forensic discrimina-tion of bottle glass by refractive index measurement and analysisof trace elements with ICP-MS. Anal Sci. 2000:16:1195-8. doi:10.2116/analsci.16.1195. ( 6. Curran JM, H i cks TN, Buckleton JS. For e nsic interpretation of glass evidence. 1s t ed. Boca Raton: CRC Press LLC; 2000. ) ( 7 . Evett I W. A B a yesian ap p roach to t he pro b lem of inte r preting g lass evidence i n forensic science casework. J F orensic Sci Soc. 1986;26:3-18. doi: 10.10 1 6/S0015-7368(86)72441-9. ) ( 8 . E vett I W, Buckleton JS. T h e in t erpretation o f g l ass evidence: a practical approach. J F orensic S ci S oc. 1 9 90;30:215-23. doi: 1 0.1016/S0015-7368(90) 7 3342-7 . ) 9. Koons RD, Buscaglia J. Distribution of refractive index values insheet glasses. Forensic Sci Comm. 2001;3(1). 10. Coleman RF, Goode GC. Comparison of glass fragments byneutron activation analysis. J Radioanal Chem. 1973;15:367-88.doi:10.1007/BF02516583. 11. Catterick T, Wall CD. Rapid analysis of small glass fragments byatomic-absorption spectroscopy. Talanta. 1978;25:573-7. doi:10.1016/0039-9140(78)80149-0. 12. Buscaglia J. Elemental analysis of small glass fragments inforensiccscience.Anal ChimActa. 1994;288:17-24. doi:10.1016/0003-2670(94)85112-3. ( 13. Terry KW, Van R i essen A, Lynch B F , V o wles DJ. Quantitative analysis o f glasses used wi t hin Au s tralia. Forensic Sci Int. 1984;25:19-34. doi: 10 . 1016/0379-0738(8 4 )90011-2. ) ( 14. Kuisma K u rsula P. Accuracy, pr e cision an d detection limits ofSEM-WDS, SEM-EDS and PIXE in the multi-elemental ana l ysisof m edieval g lass. X -Ray Spectrom. 2 0 00;29:111-8. doi: 10.1002/(SICI)1097 - 4539(200001/02)29:1<111 : :AID-XRS408> 3.0.CO;2-W. ) ( 15. Koons R D, P e ters CA, Rebbert PS . Co m parison of r ef r activeindex, e nergy d i spersive X-ray f l u orescence an d in d uctivelycoupled plasma atomic emission spectrometry for forensic c h ar-acterizatio n of sheet glass fragments. J Anal A t S pectrom.1991;6:451-6. doi: 10.1039/ja9910600 4 51. ) 16. Koons RD, Buscaglia J. The forensic significance of glass com-position and refractive index measurements. J Forensic Sci.1999;44(3):496-503. 17. Hickman DA, Harbottle G, Sayre EV. Selection of the best ele-mental variables for the classification of glass samples. ForensicSci Int. 1983;23:189-212.doi:10.1016/0379-0738(83)90148-2. 18. Trejos T, Montero S, Almirall JR. Analysis and comparison ofglass fragments by laser ablation inductively coupled plasmamass spectrometry (LA-ICP-MS) and ICP-MS. Anal BioanalChem. 2003;376:1255-64. doi:10.1007/s00216-003-1968-0. 19. Zurhaar A. Characterisation of glass fragments by trace elementanalysis using Inductively Coupled Plasma Mass Spectrometry.MastersThesis.s,CurtinUniversityof Technology, Perth,Australia, 1988. 20. Montero S, Hobbs AL, French TA, Almirall JR. Elementalanalysis of glass fragments by ICP-MS as evidence of associa-tion: analysis of a case. J Forensic Sci. 2003;48(5):1-7. 21. Duckworth DC, Bayne CK, Morton SJ, Almirall J. Analysis ofvariance in forensic glass analysis by ICP-MS: variance withinthe method. J Anal At Spectrom. 2000;15:821-8. doi:10.1039/a908813j. 22. Duckworth DC, Morton SJ, Bayne CK, Koons RD, Montero S,Almirall JR. Forensic glass analysis by ICP-MS: a multi-elementassessment of discriminating power via analysis of variance andpairwise comparisons. J Anal At Spectrom. 2002;17:662-8. doi:10.1039/b201575g. 23. Bridge CM, Powell J, Steele KL, Williams M, MacInnis JM,Sigman ME. Characterizationn orbfautomobile loat glasswith laser-induced breakdown spectroscopy and laser abla-tion inductively coupled plasma mass spectrometry. ApplSpectrosc. 2006;60(10):1181-7. doi:10.1366/000370206778664572. 24. Bridge CM, Powell J, Steele KL, Sigman ME. Forensic com-parative glass analysis by laser-induced breakdown spectroscopy.Spectrochim Acta B. 2007;62(12):1419-25. doi:10.1016/j.sab.2007.10.015. 25. Watling RJ, Lynch BF, Herring D. Use of laser ablation induc-tively coupled plasma mass spectrometry for fingerprinting sceneof crime evidence.J Anal At Spectrom. 1997;12:195-203. doi:10.1039/a605143j. ( 26. Watling R J. Novel ap p lication of la s er ab l ation inductively coupled plasma m ass spectrometry i n f orensic science andforensic archaeology. Spectroscopy. 1 999;14(6):16-34. ) 27. Trejos T, Almirall J. Effect of fractionation on the forensic ele-mental analysis of glass using laser ablation inductively coupledplasma mass spectrometry. Anal Chem. 2004;76:1236-42. doi:10.1021/ac0349330. 28. Latkoczy C, Becker S, Diicking M, Ginther D, Hoogewerff JA,Almirall JR, et al. Development and evaluation of a standardmethod for the quantitative determination of elements in floatglass samples by LA-ICP-MS. J Forensic Sci. 2005;50(6):1-15.doi:10.1520/JFS2005091. 29. Miller ET. Forensic glass comparisons. In: Saferstein R, editor.Forensic science handbook. New Jersey: Prentice Hall Regents;1982. p.139-81. ( 30. Locke J, H ayes C A . Re f ractive in d ex variations ac r oss gl a ss objects and the influence o f a n nealing. Forensic Sc i Int. 19 8 4;26:147-57. doi: 10 . 1016/0379-0738(84)90071-9. ) ( 31. V elez M, Smith J, Moore RE. Refractory degradation in glass tankmelters. A s urvey o f t e sting methods. Ceramica. 19 9 7;43(283-284):178-82.doi:1 0. 1 590/S0366- 6 9131997000400006. ) ( 32. Bhargava A, Wang F,Wood B, Hi g ginbotham G, Gentle I . Studies o f polyethylene-coated tin o x ide films on gl a ss bo t tles.Surf Interface Anal. 2 000;29:663-70. d oi :10. 1002/1096-99 1 8(200010)29:10<66 3 ::AID-SIA919>3. 0 .CO;2-A. ) 33. Bajic SJ, Aeschliman DB, Saetveit NJ, Baldwin DP, Houk RS.Analysis of glass fragments by laser ablation-inductively coupledplasma-mass spectrometry and principal component analysis. JForensic Sci. 2005;50(5):1123-7. doi:10.1520/JFS2005088. 34. Montero S. Trace elemental analysis of glass by inductivelycoupled plasma-mass spectrometry (ICP-MS) and laser ablation-inductively coupled plasma-mass spectrometry (LA-ICP-MS).PhD, Florida International University,Miami, 2002. 35. Smith K, Trejos T, Watling RJ, Almirall J. A guide for thequantitative elemental analysis of glass using Laser AblationInductively Coupled Plasma Mass Spectrometry. Atom Spec-trosc. 2006;27(3):69-75. 36. Schmidt T, Vogt T, Surmann JP, Kossler W. Glass classificationby linear discriminant analysis of LA-ICP-MS data. Pharmazie.2002;57(6):396-8. 37. Aeschliman DB, Bajic SJ, Baldwin DP, Houk RS. Multivariatepattern matching of trace elements in solids by laser ablationinductively coupled plasma-mass spectrometry: source attributionand preliminary diagnosis of fractionation. Anal Chem. 2004;76:3119-25.doi:10.1021/ac0345042. ( 38. T r e jos T, Almirall JR. Sampling strategies for the analysis of glassfragments by LA-ICP-MS P a rt I . M icro-homogeneity study o fglass and its application to the interpretation of forensic evidence.Talanta.2005;67:396-401. doi:10 . 1016/j.t al anta.2 0 05.0 1 .033 . ) Humana Press 采用激光烧蚀电感耦合等离子体质谱(LA-ICP-MS)与传统的折射率(RI)测定方法进行了比较,确定了玻璃瓶的来源。单独使用RI方法,是不可能区分某些生产超过18天的玻璃瓶的,除非是同一个制造工厂制造的。此外,单瓶酒中RI的差异可能大到足以使仅使用这种技术的共种源建立无效。经过1个月收集的瓶中微量元素组成的测定证实,在此期间生产的单个瓶中微量金属分布变化极小。因此,从破碎的瓶子中提取的任何玻璃碎片的微量元素组成可以被认为是整个瓶子的元素组成的代表。此外,对56种分析物中大约38种的分布情况进行统计比较后确定,在同一工厂生产的两瓶玻璃瓶之间相隔两小时测量所得量是有区别的。利用这种方法,有可能开发出一种分析协议,以显著提高法医玻璃证据的准确性并确定来源。
确定
还剩9页未读,是否继续阅读?

产品配置单
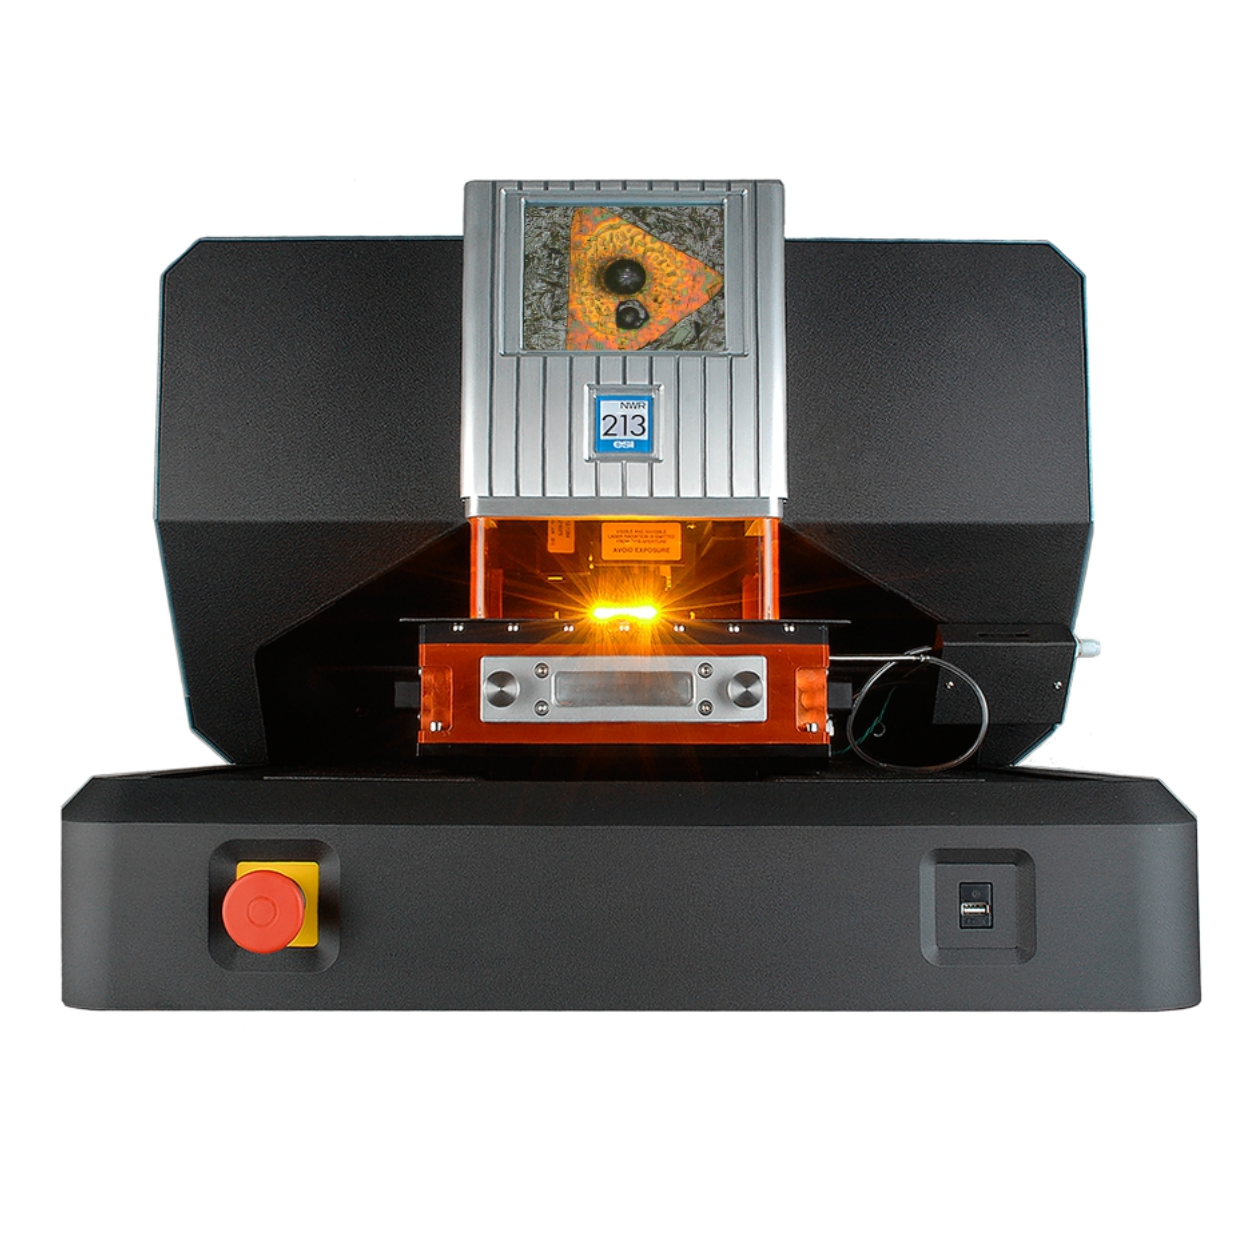
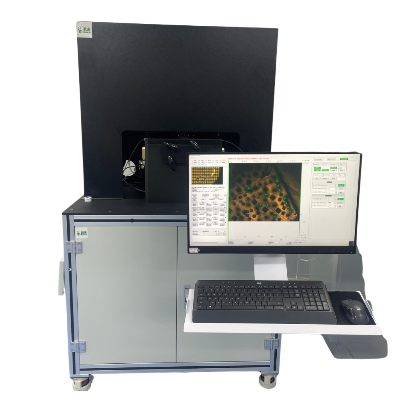
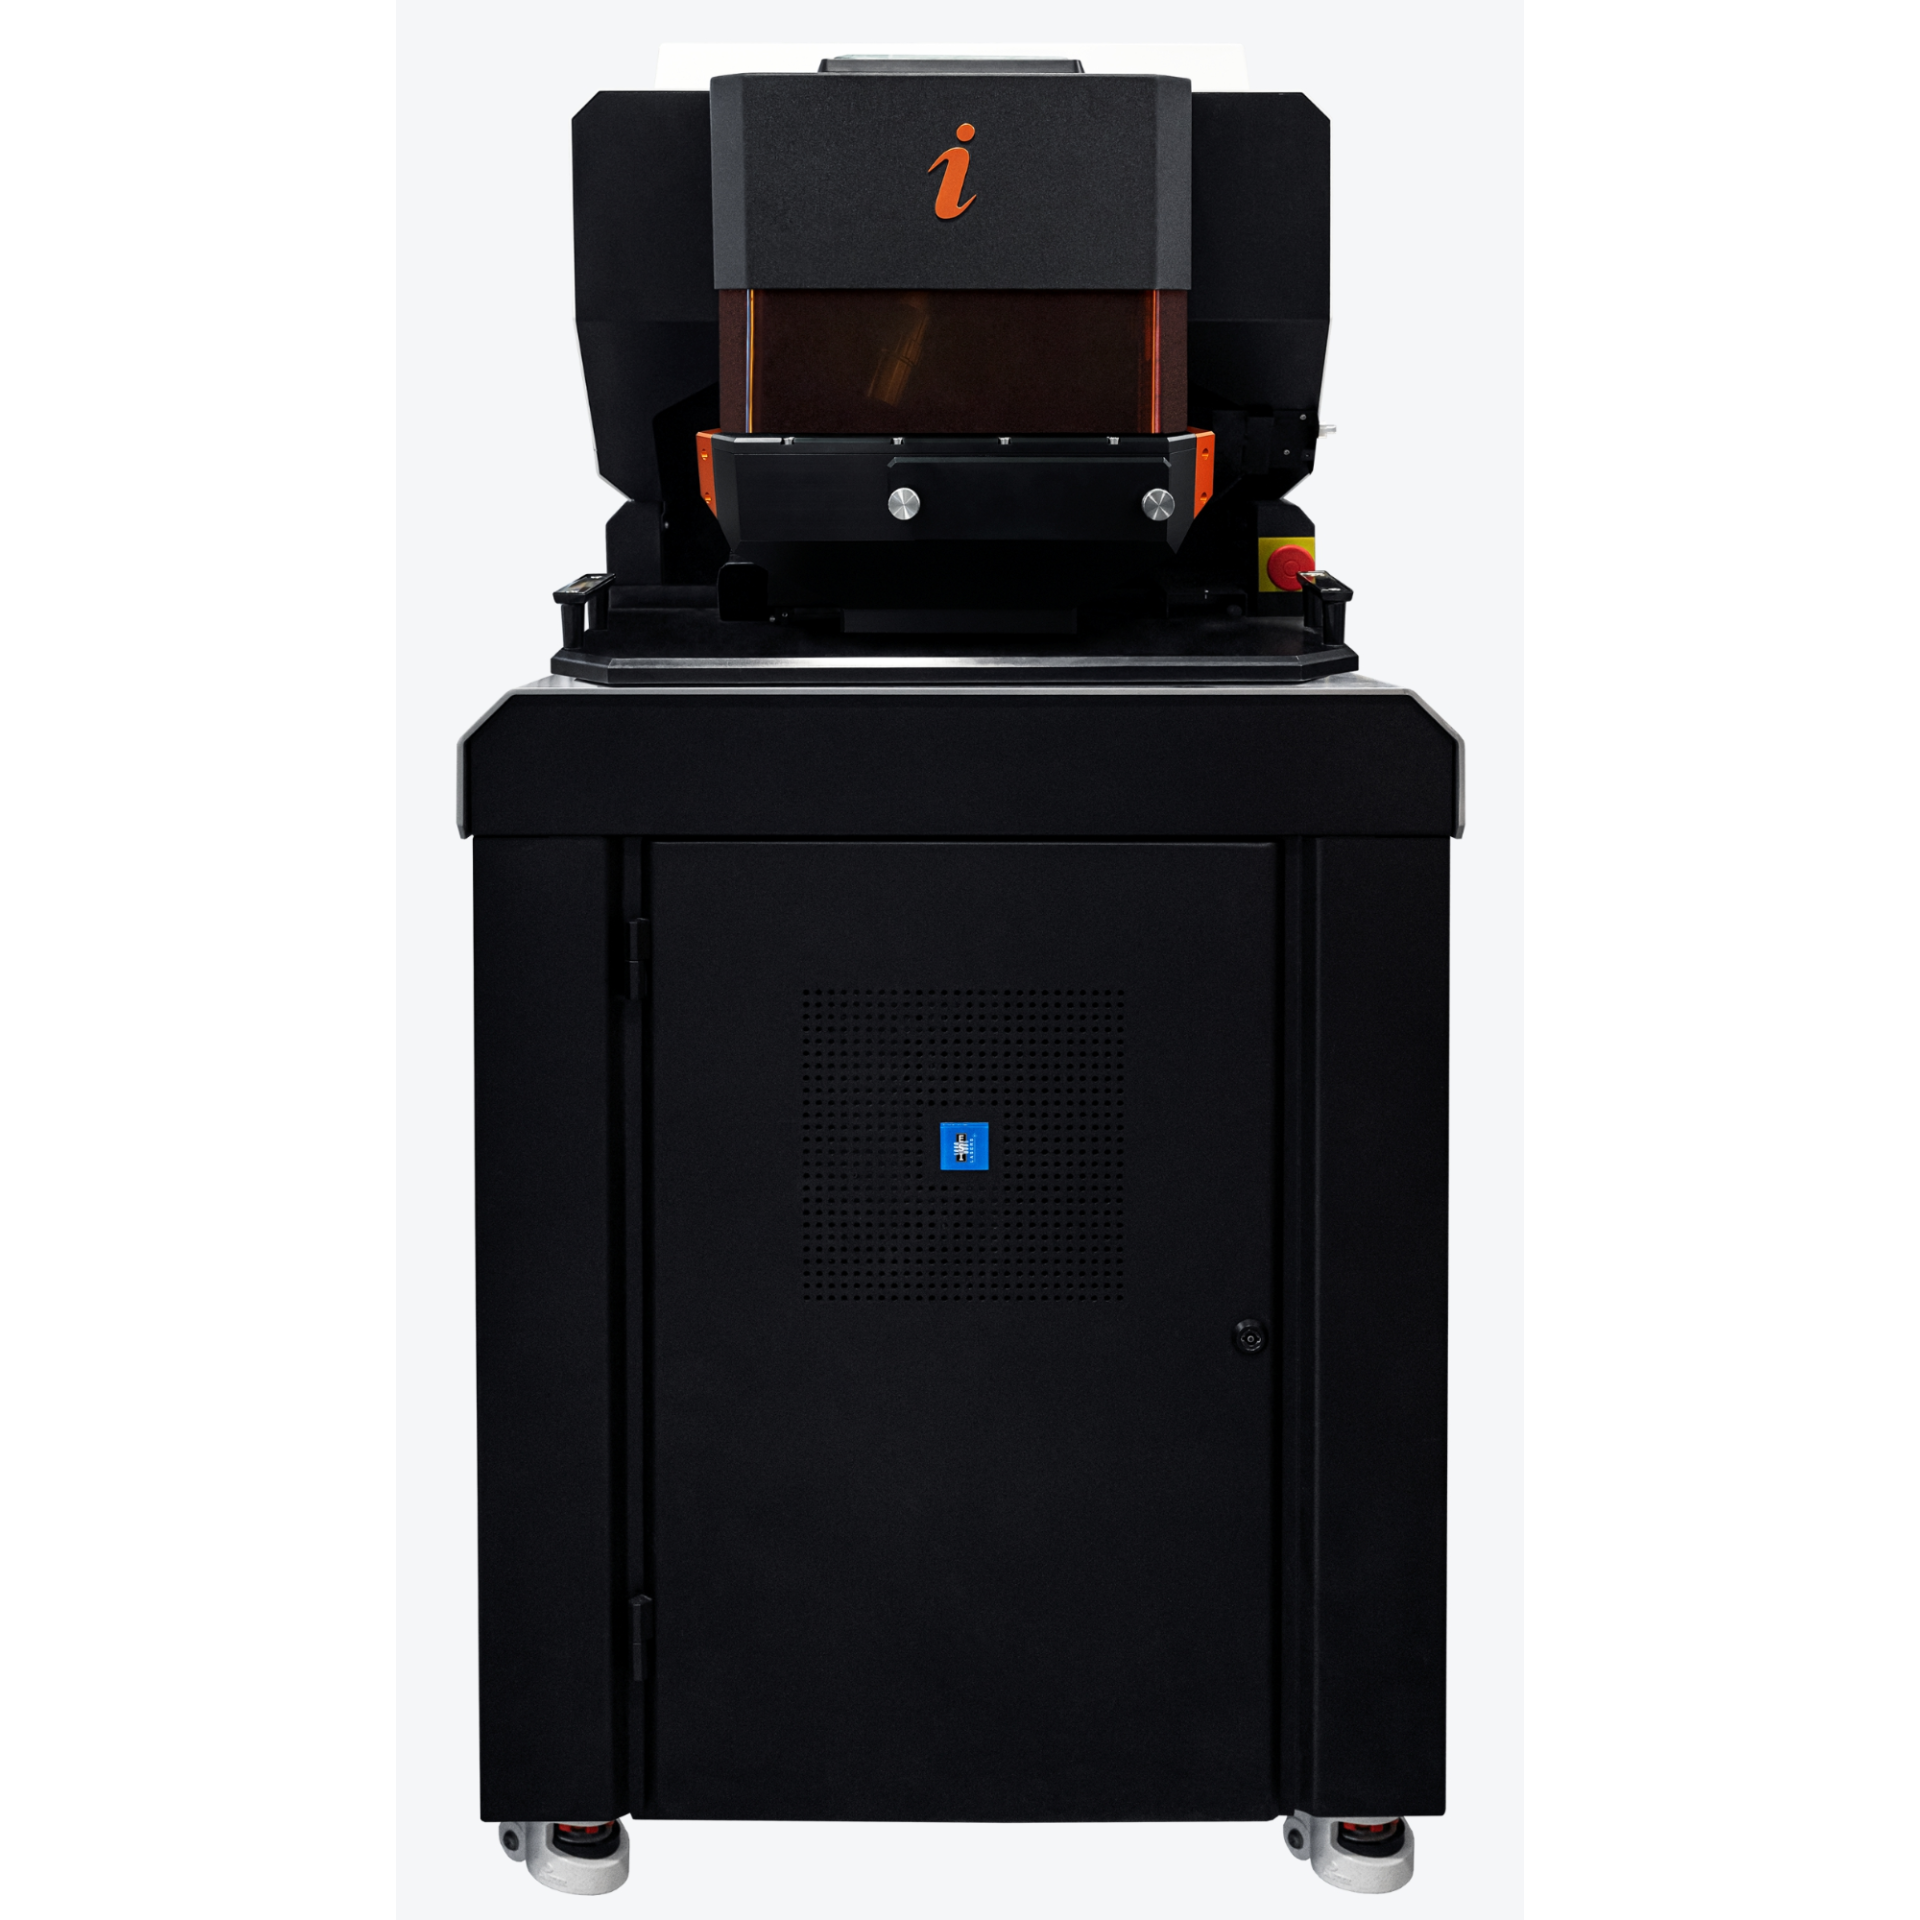
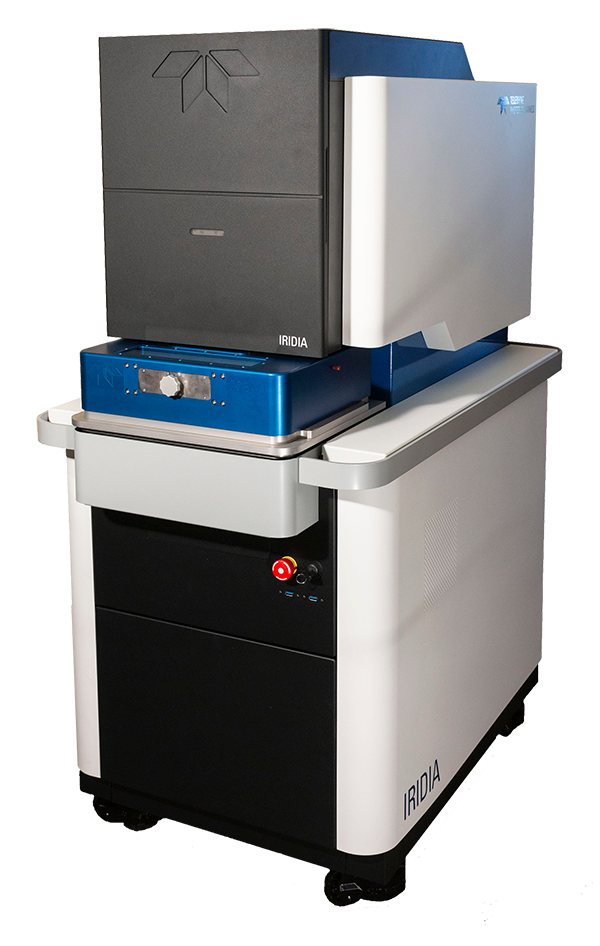
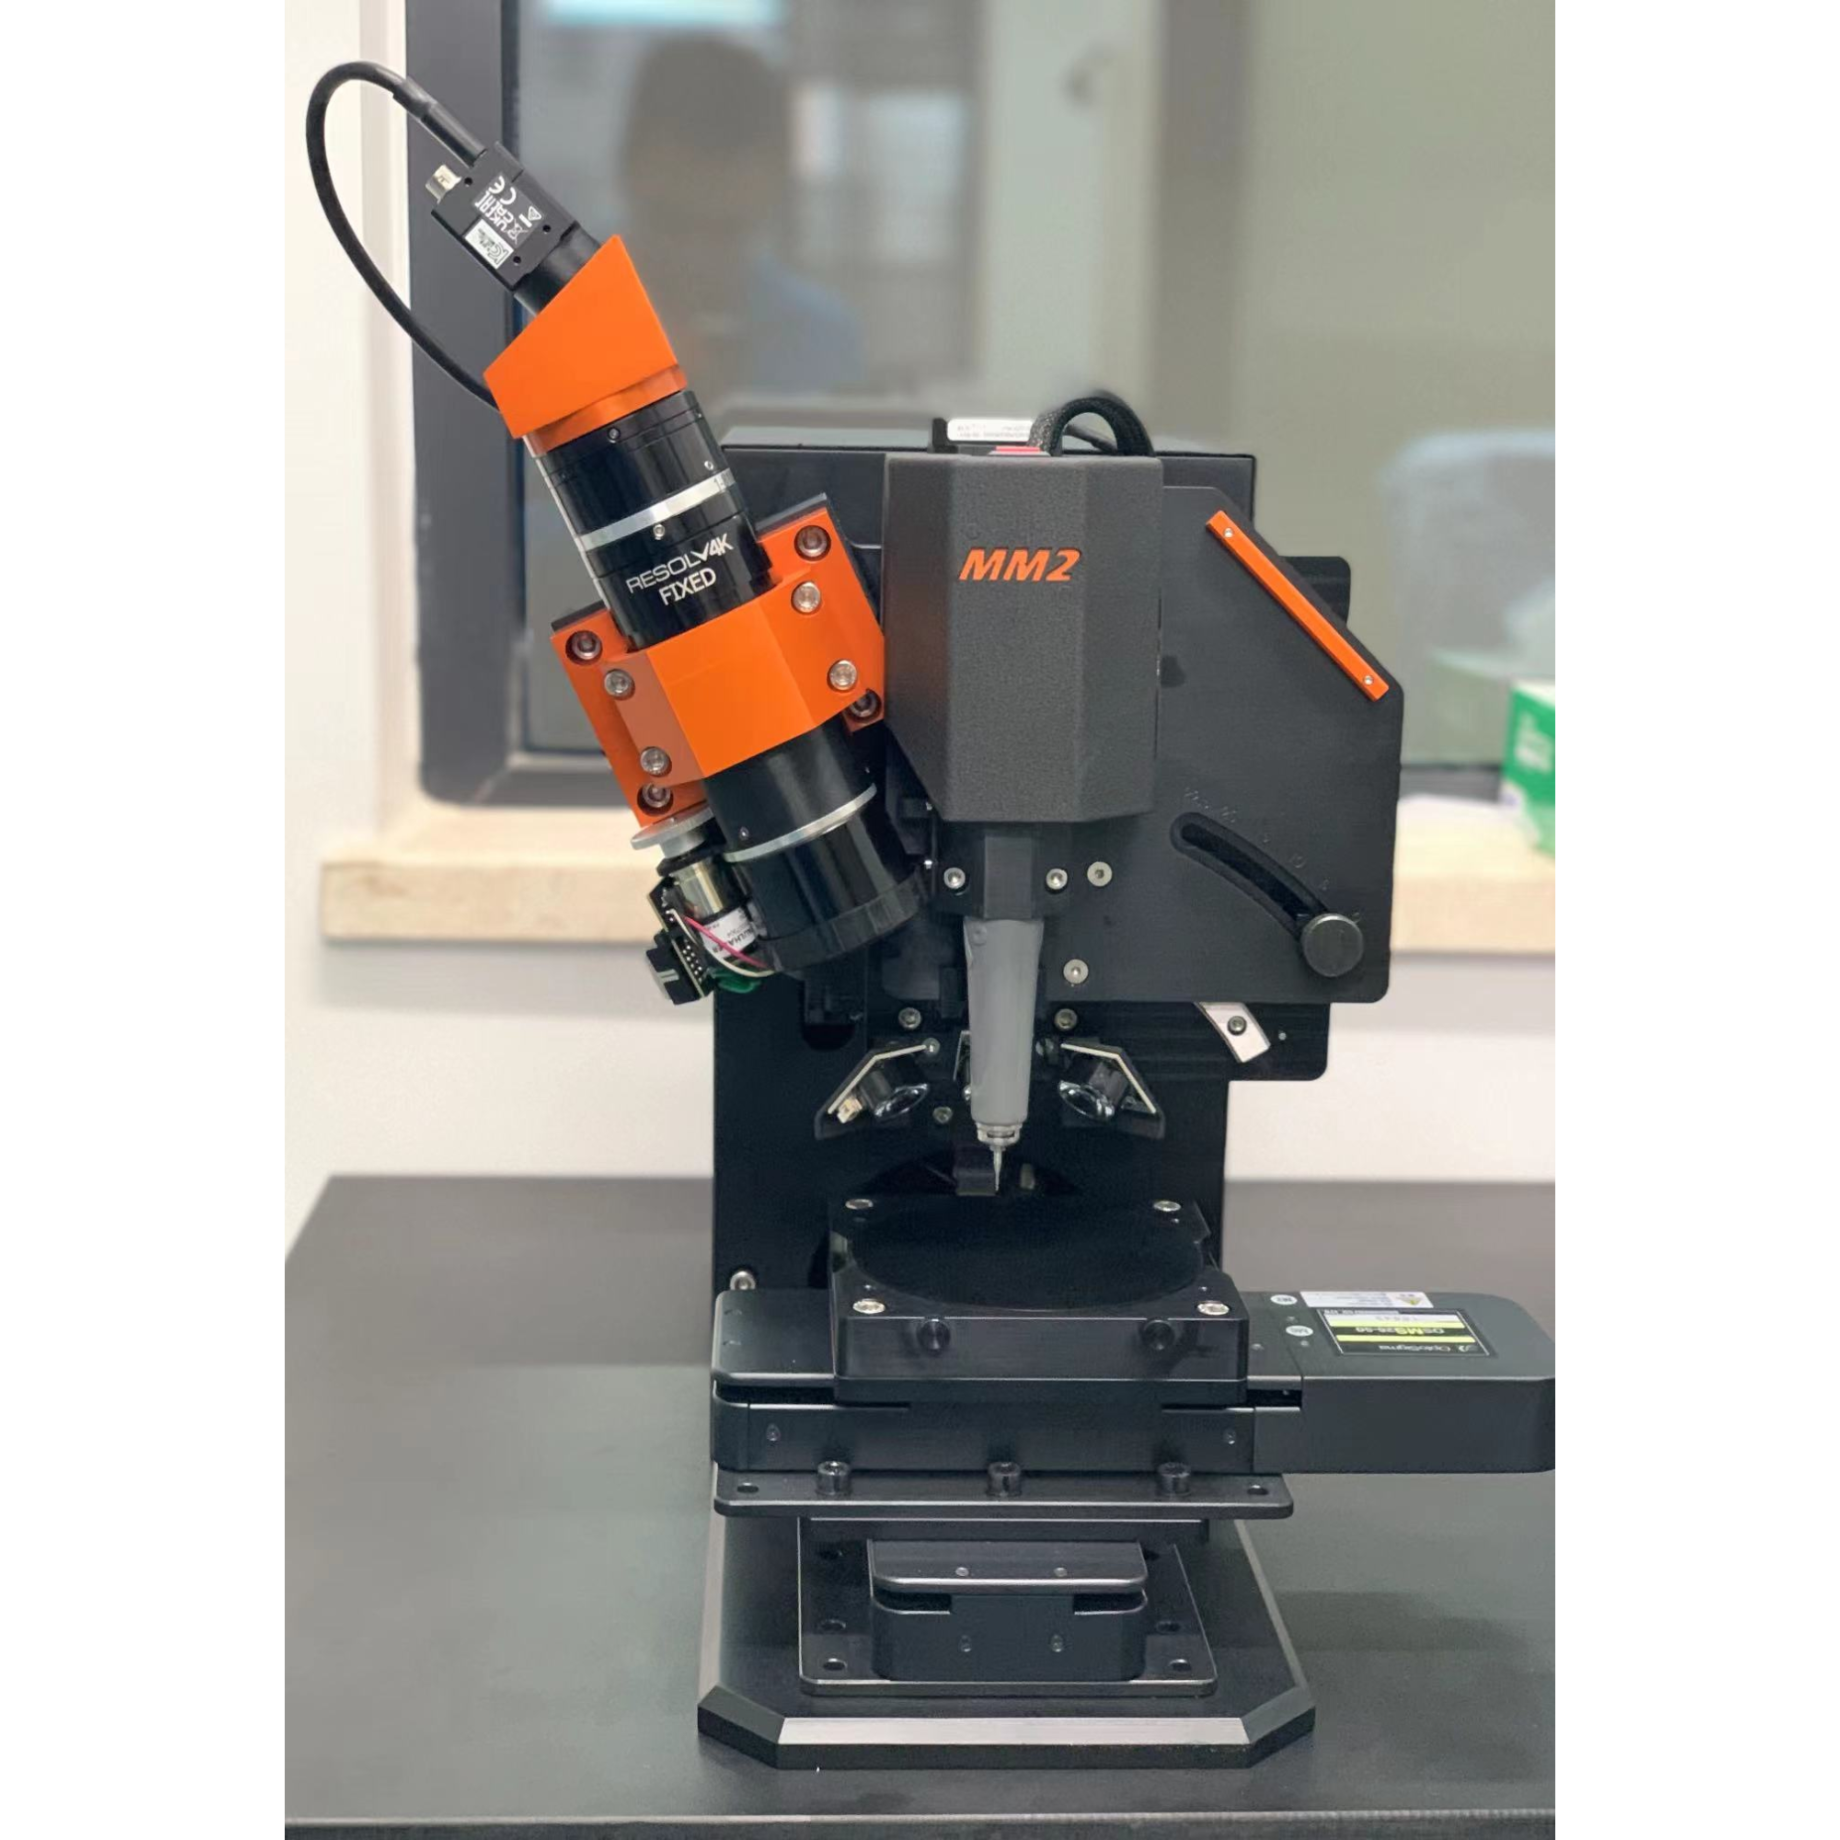
上海凯来仪器有限公司为您提供《玻璃瓶中种源验证检测方案(激光剥蚀进样)》,该方案主要用于司法鉴定中种源验证检测,参考标准--,《玻璃瓶中种源验证检测方案(激光剥蚀进样)》用到的仪器有ESL213 灵活的激光剥蚀系统
推荐专场
相关方案
更多