


方案详情
文
提出了一种基于LA-ICP-MS方法的蓝色圆珠笔墨水的鉴别方法。在没有任何样品准备的情况下,从21支已知来源的蓝色钢笔中切割并测量了含有墨迹的普通办公用纸的一小部分。*步,将Mg、Ca和Sr作为内部标准(ISs),用于元素强度的归一化和背景信号的消去。然后,设计具体的标准,并采用识别目标元素(Li, V, Mn, Co, Ni, Cu, Zn, Zr, Sn, W, Pb),结果独立于目标元素,在98%的案例中被选择,并允许对样本进行定性聚类。第二步,利用基于先前识别目标的元素相关比(墨水比),通过多元统计分析(MANOVA、Tukey’s HSD、T2 Hotelling)获得质量独立强度,并进行两两比较。这种处理提高了辨别能力(DP),提供了客观的结果,实现了不同品牌之间的完全区别,笔墨与相同品牌之间的部分区别。设计的数据处理,加上多元统计工具的使用,代表了一种容易和有用的工具,以区分蓝色圆珠笔墨水,几乎没有样品破坏和不需要方法校准,因为它的使用可能有利于法医实践的立场。为了检验这一程序,它被用来分析真实的手写的有问题合同,这些合同以前是由西班牙民警刑事主义服务处法医文件考试司研究的。结果表明,所有被质疑的墨水条目都聚集在同一组中,与文档中剩余的墨水不同。
方案详情

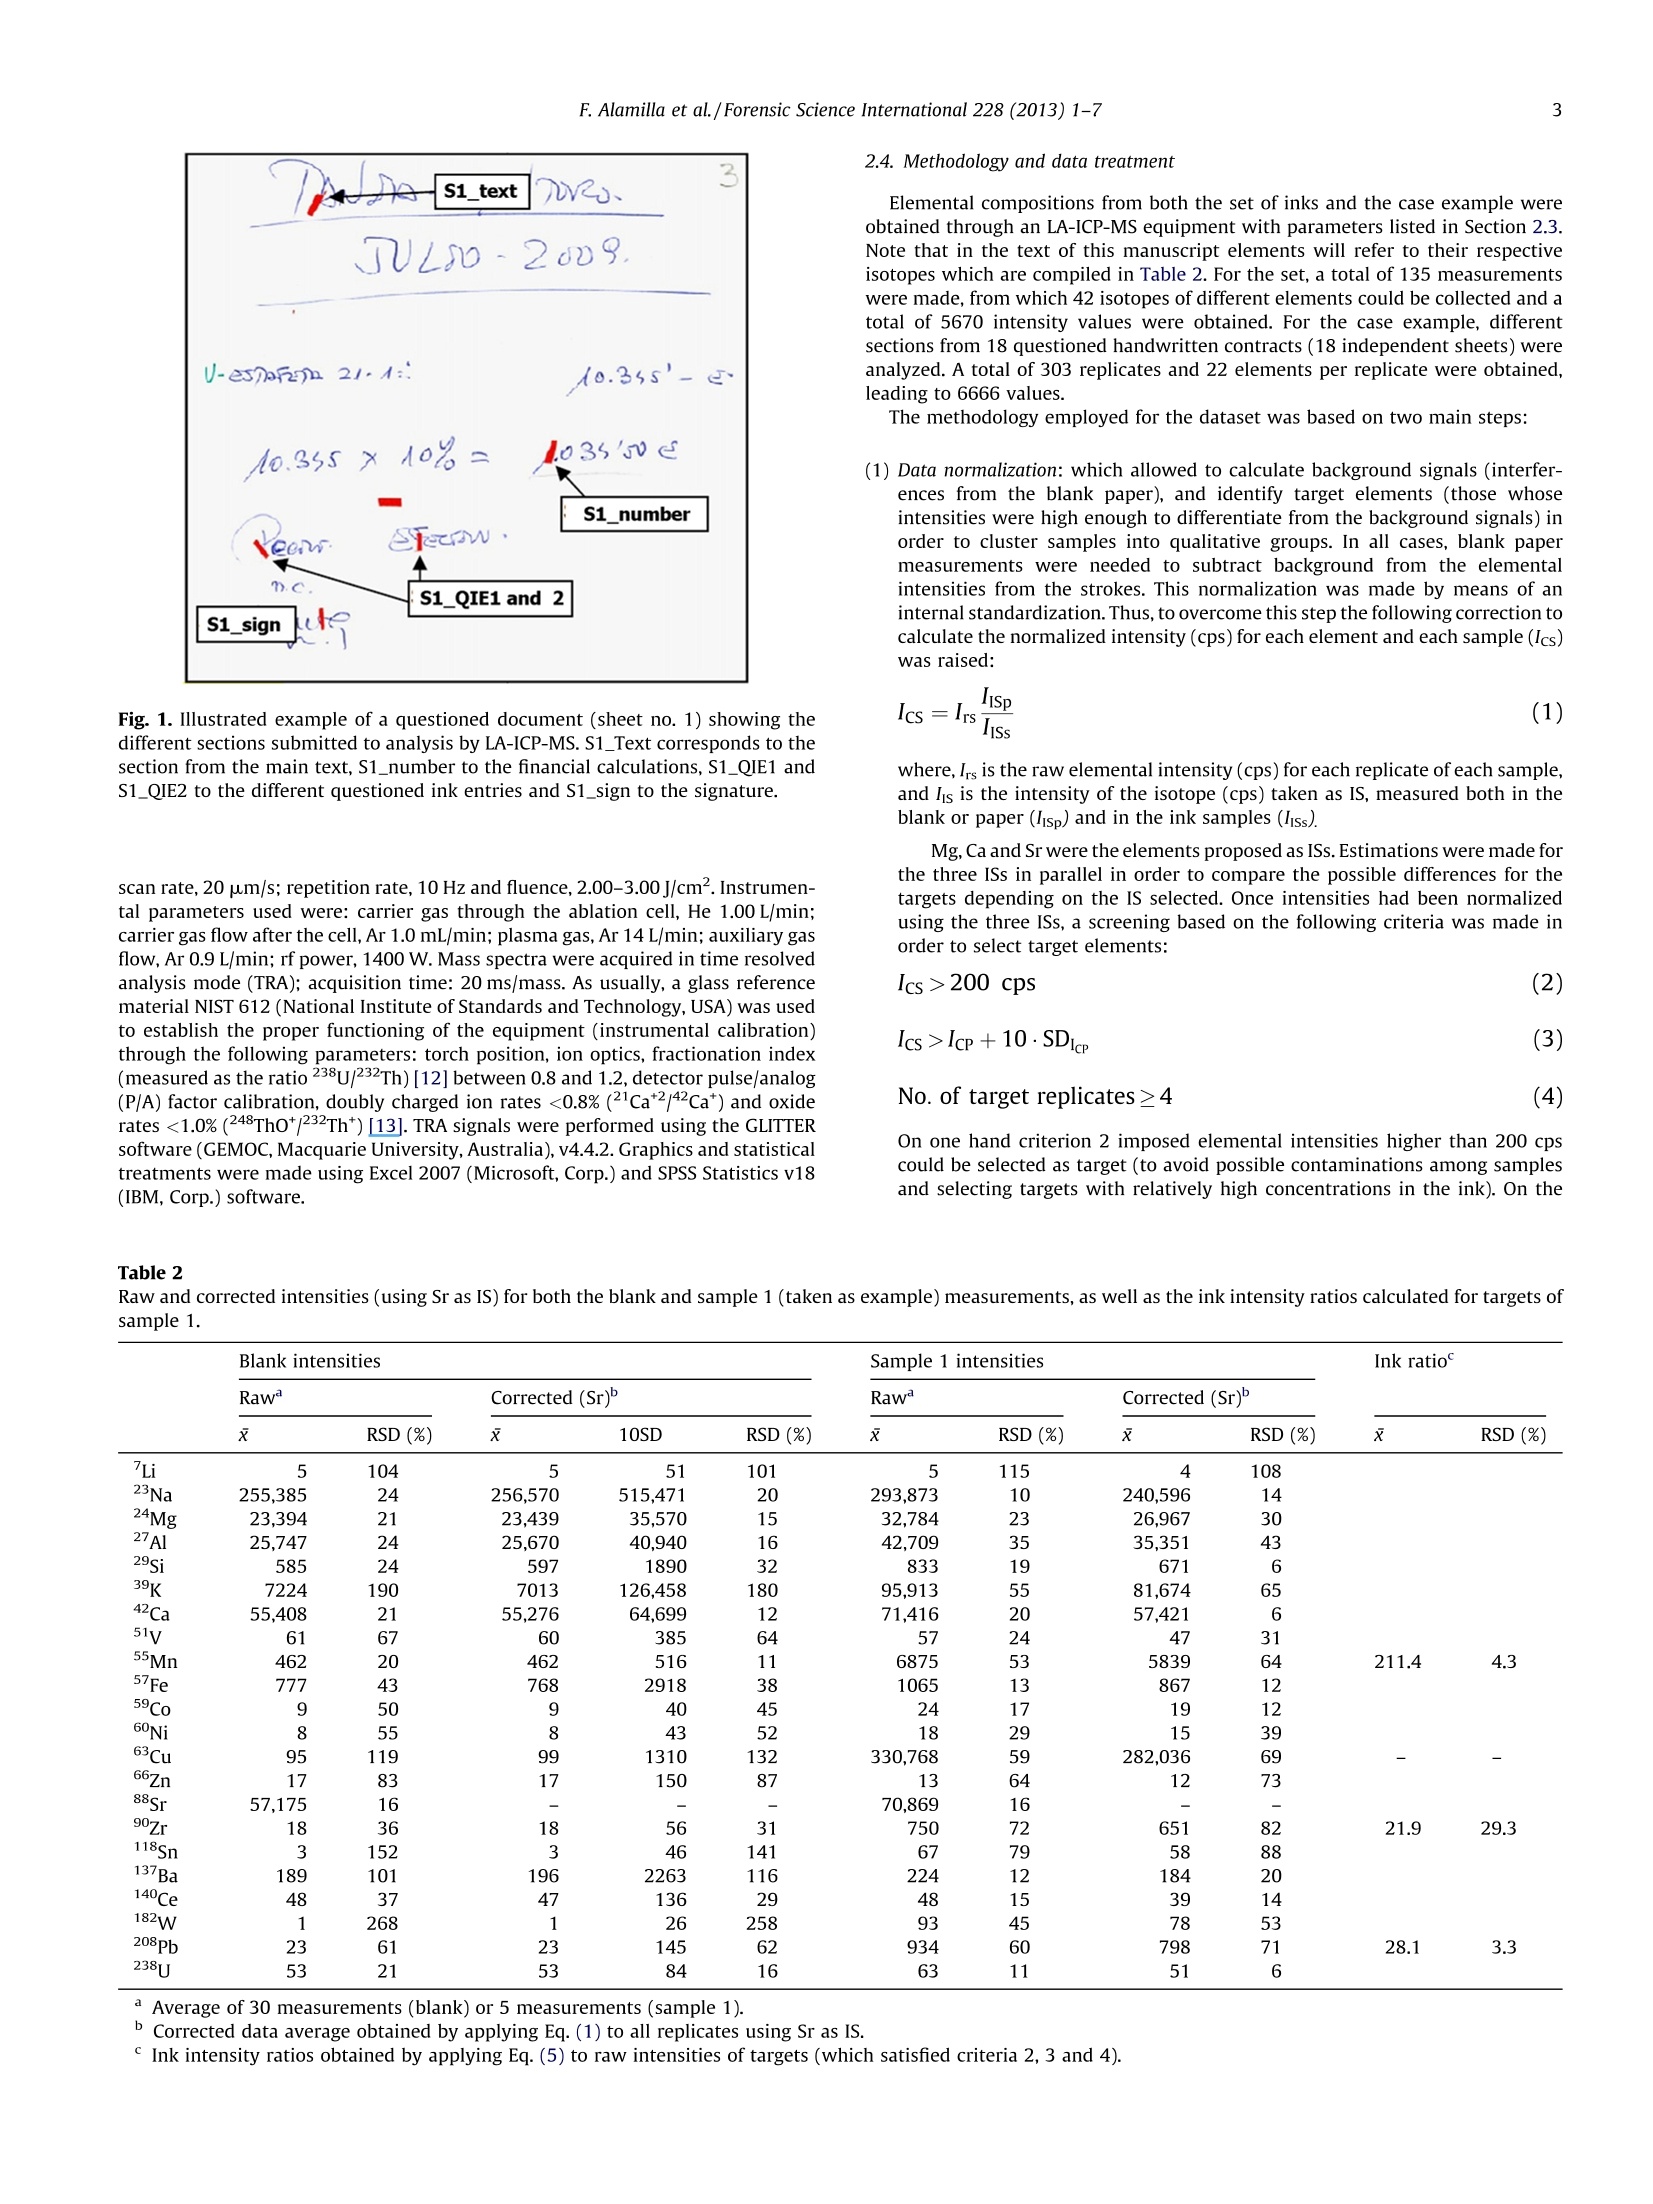
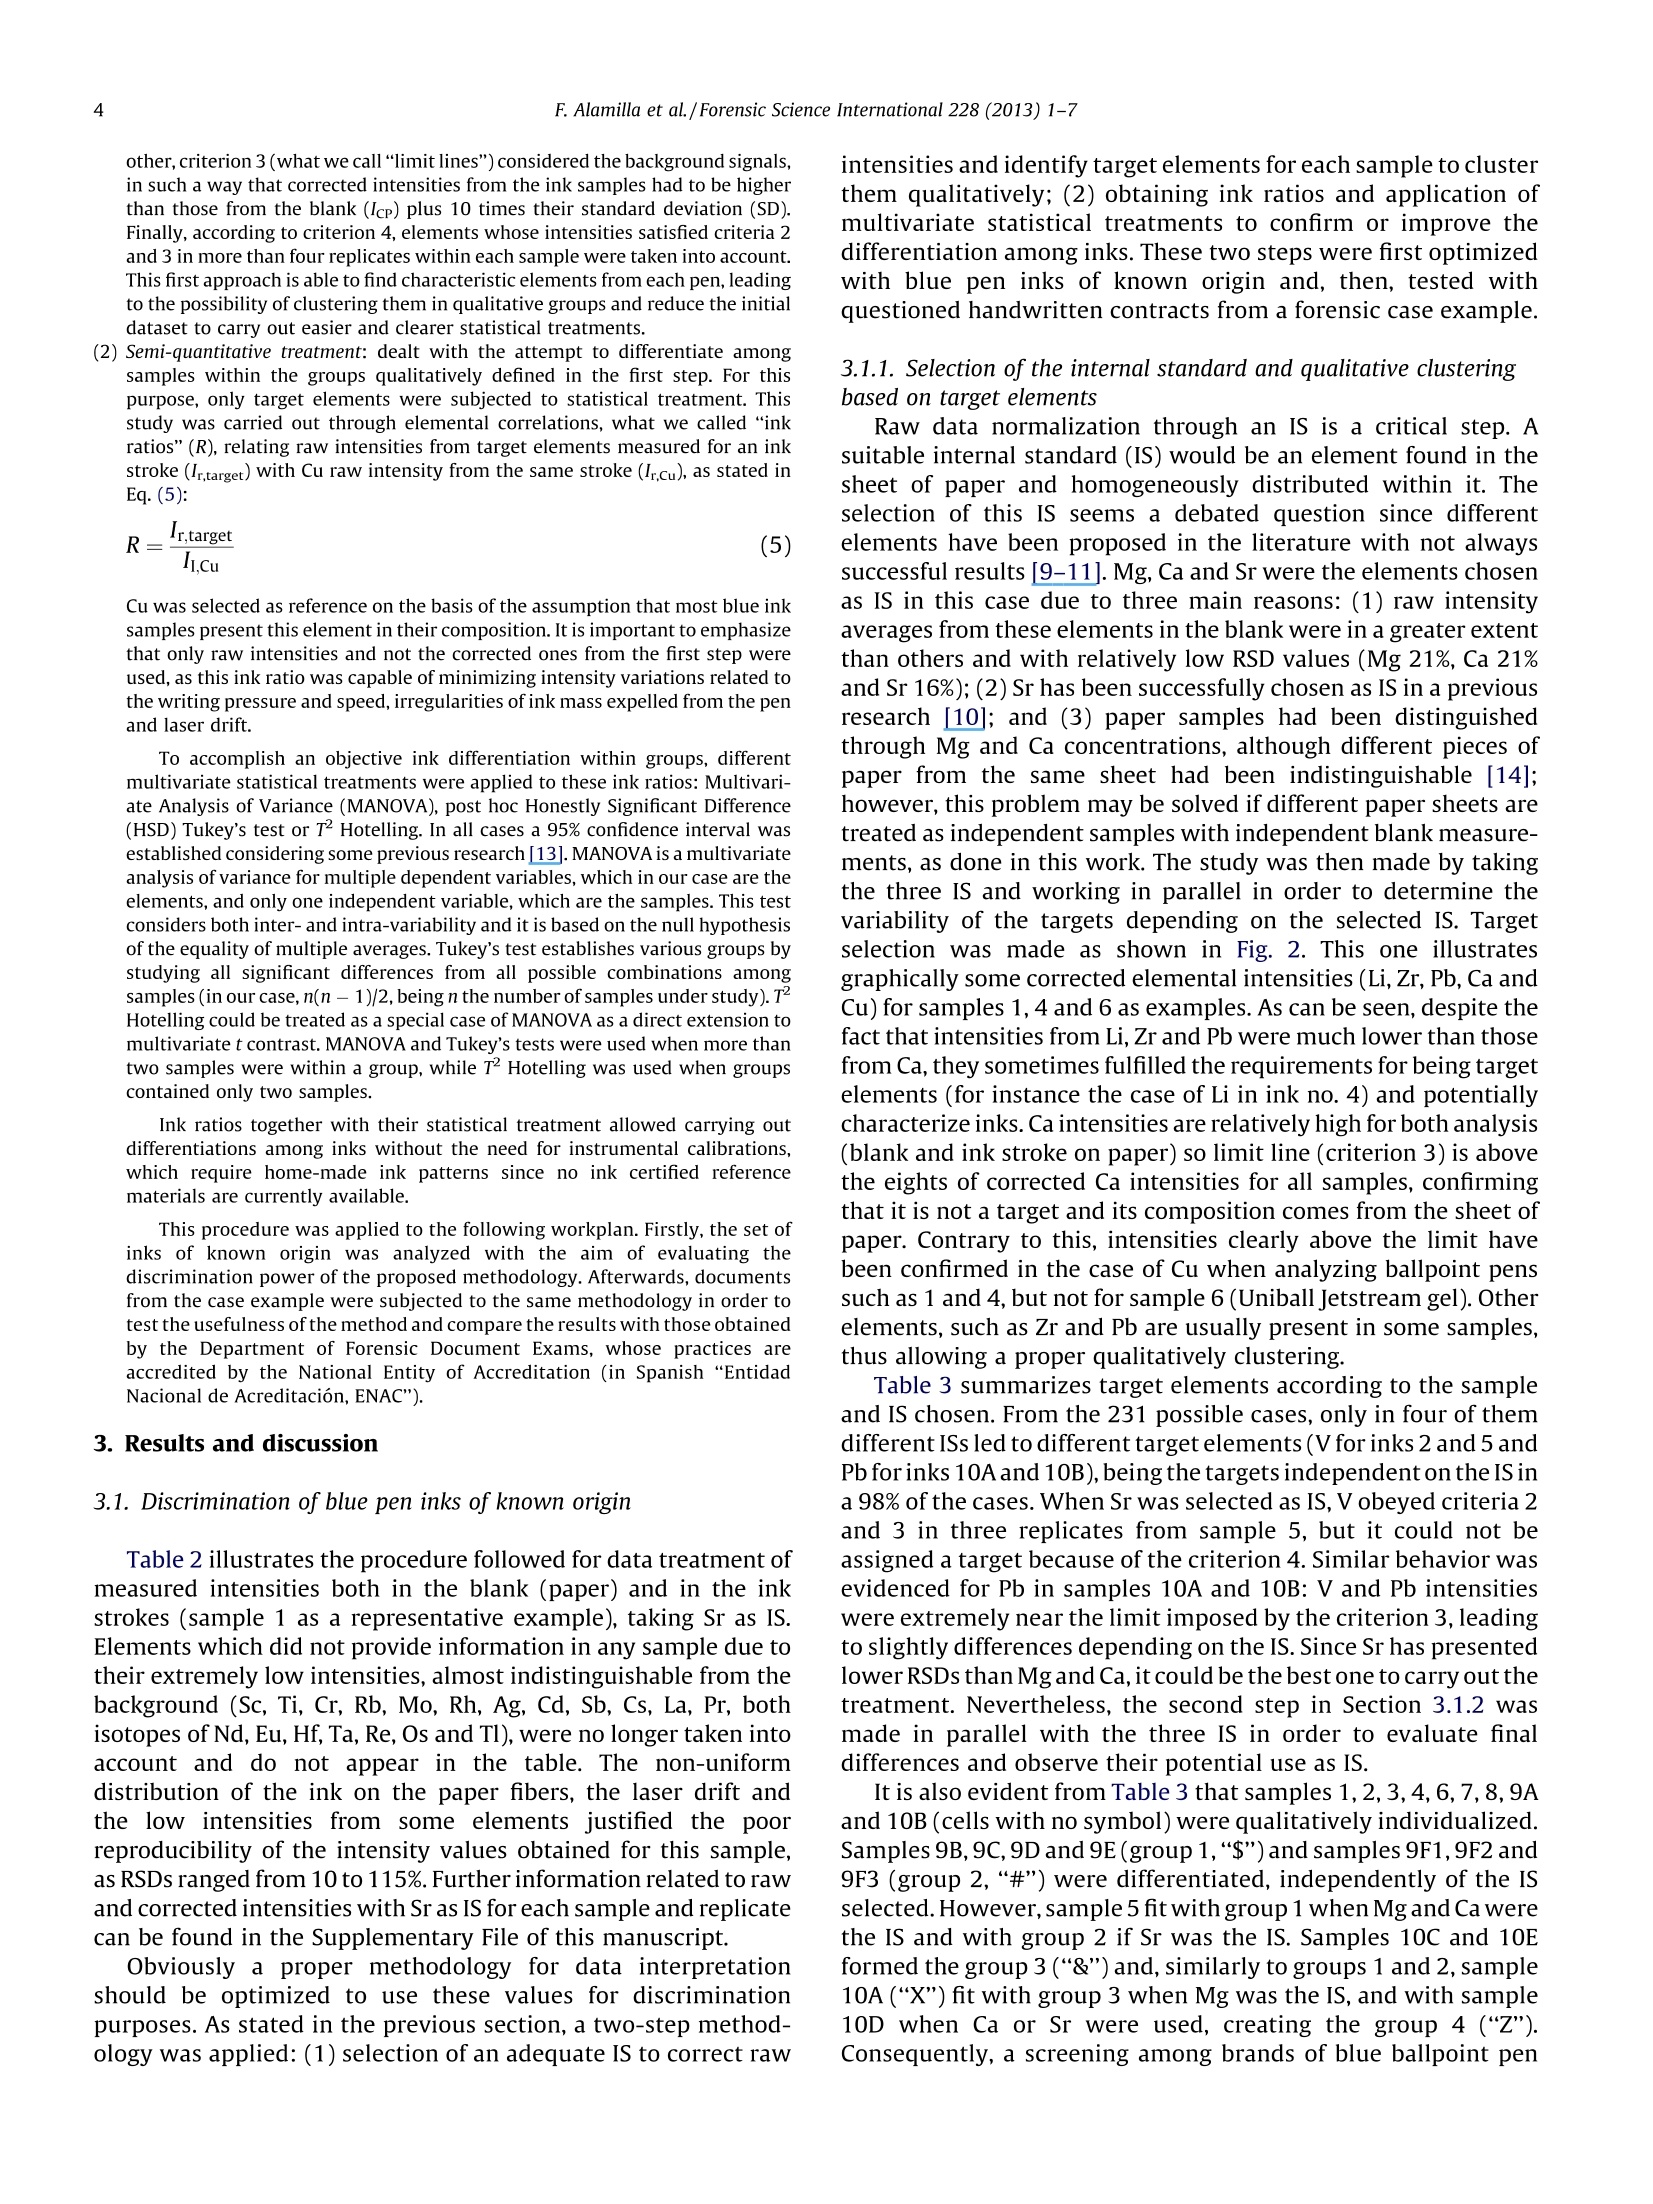
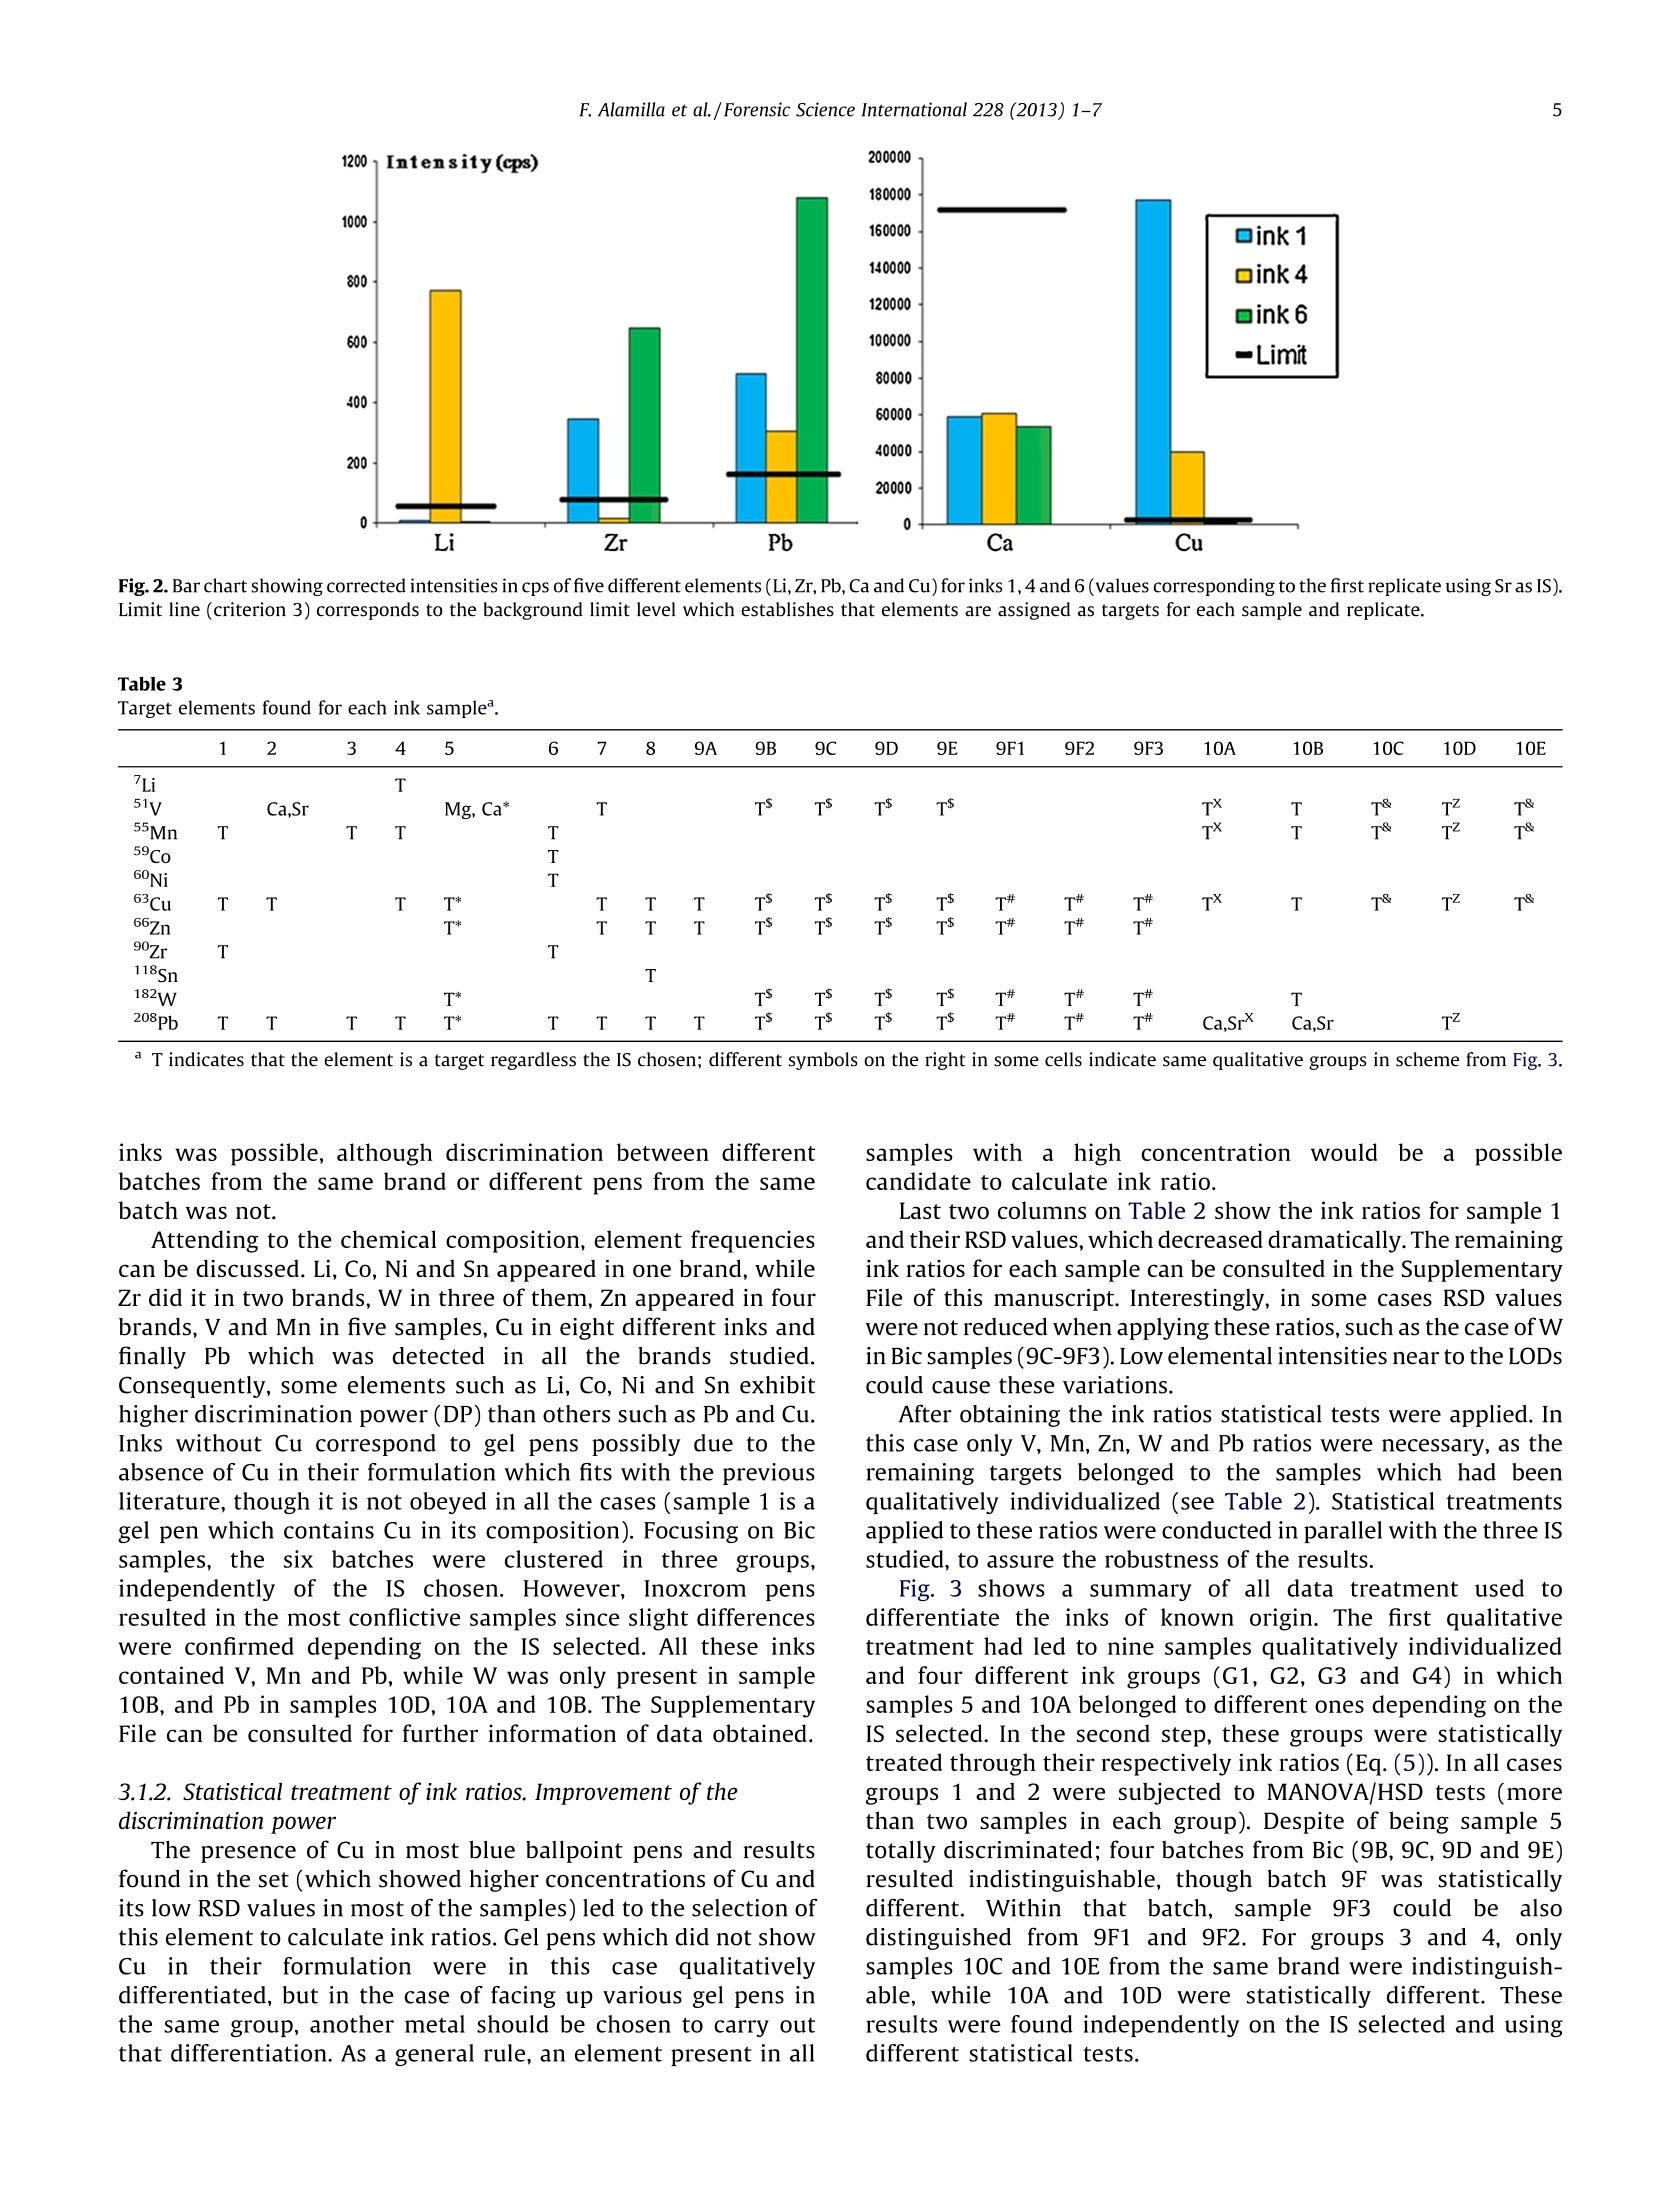
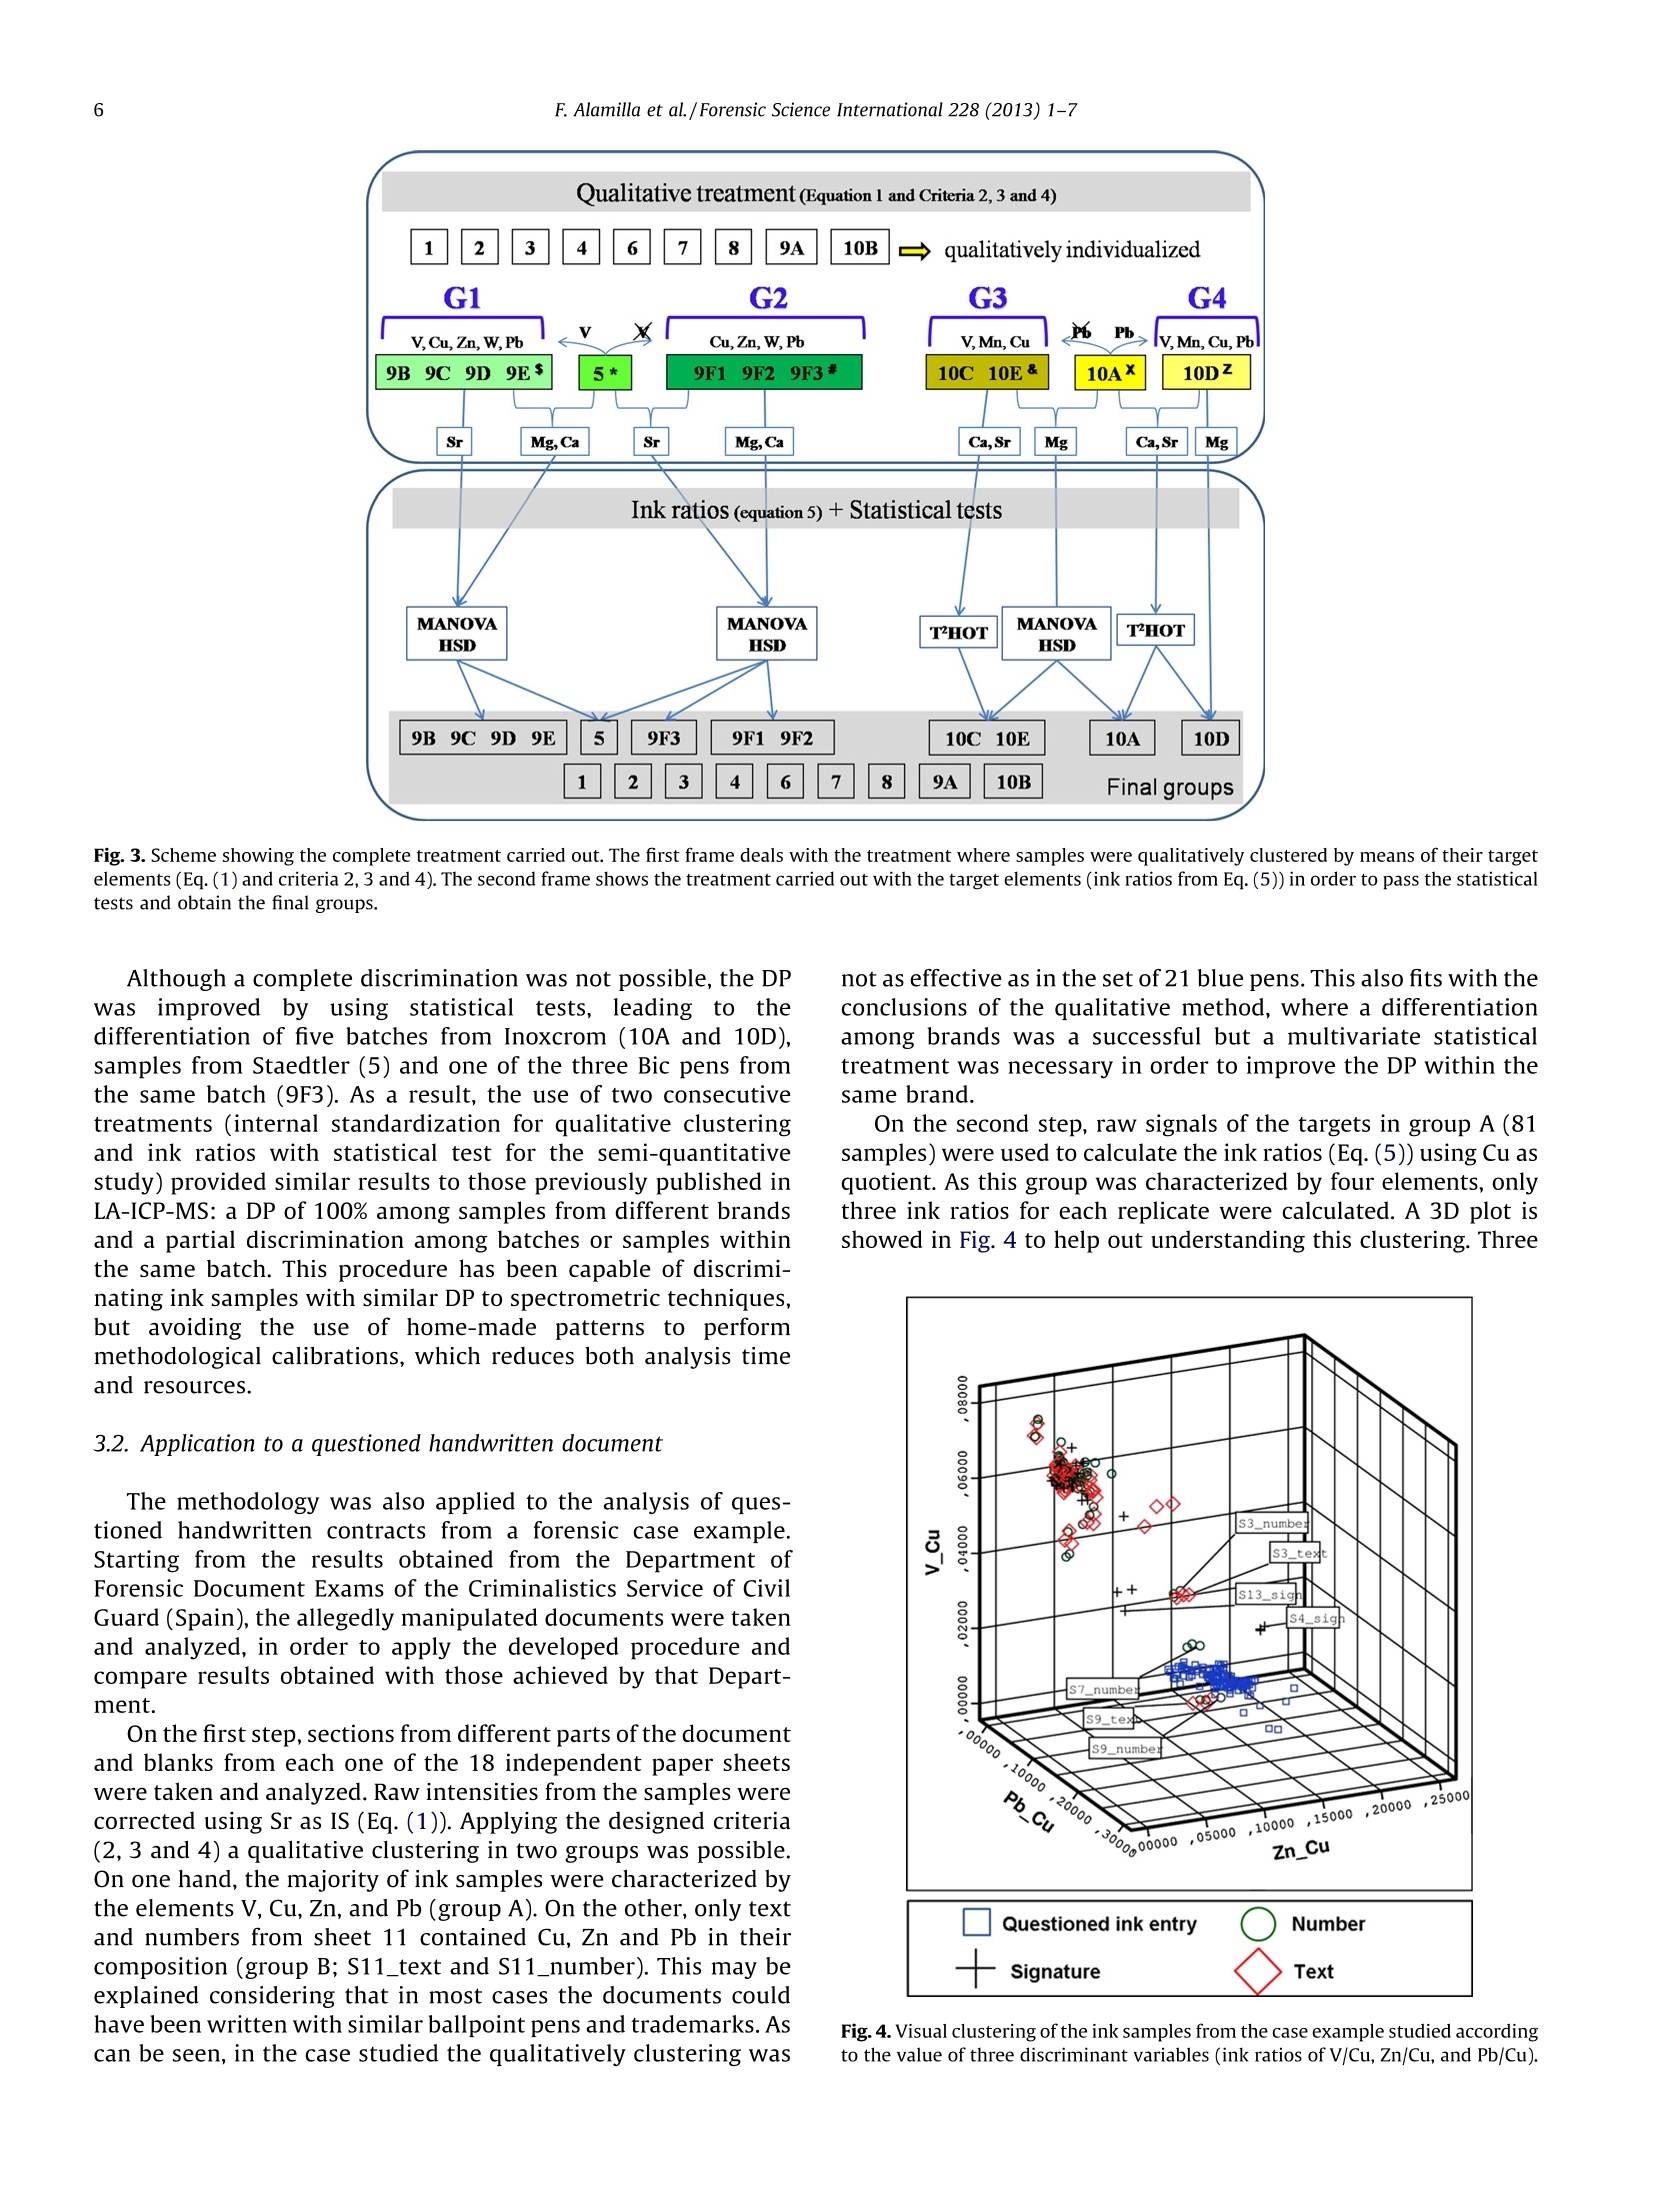
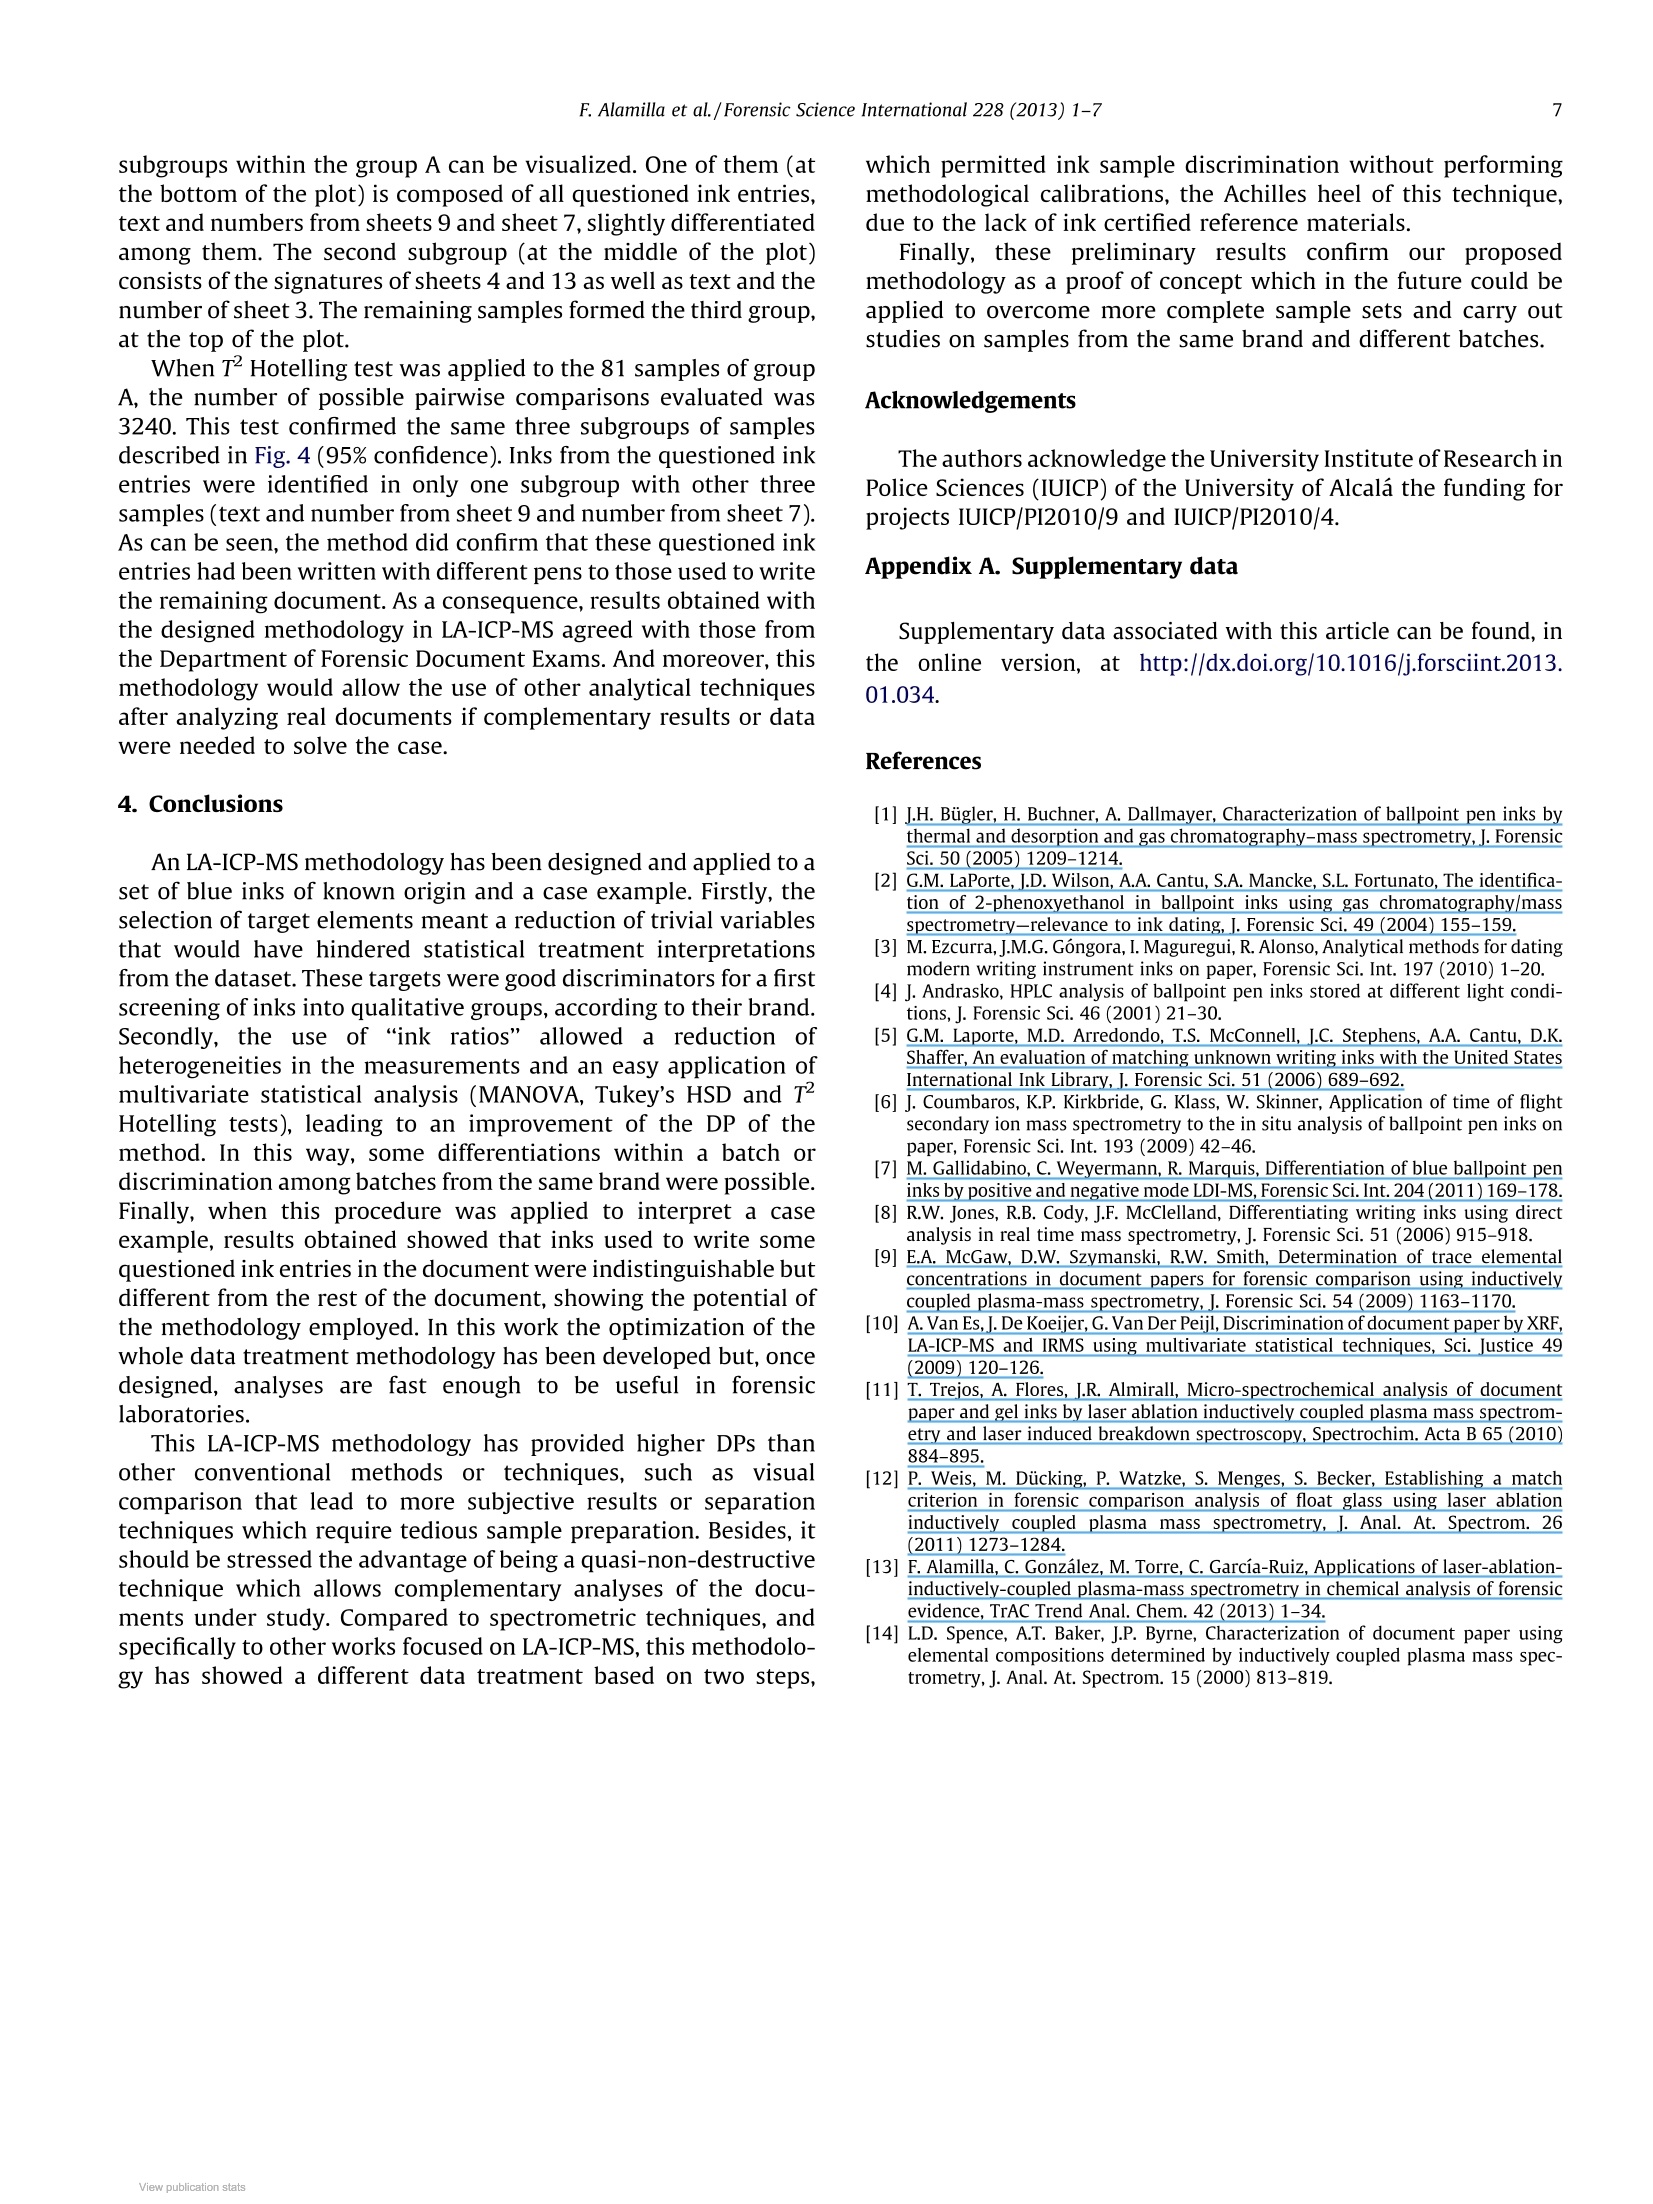
ResearchGateSee discussions, stats, and author profiles for this publication at: https://www.researchgate.net/publication/236226941 Forensic Science International 228 (2013) 1-7Contents lists available at SciVerse ScienceDirect Forensic discrimination of blue ballpoint penson documents by laser ablation inductivelycoupled plasma mass spectrometry and... Article in Forensic science international · May 2013 DOI: 10.1016/j.forsciint.2013.01.034·Source: PubMed CITATIONS9 READS31 4 authors,including: Francisco AlamillaUniversity of Alcala Carmen Garcia-Ruiz University of Alcala 4 PUBLICATIONS 26 CITATIONS 107 PUBLICATIONS 1,246 CITATIONS SEE PROFILE SEE PROFILE Forensic Science International journal homepage: www.elsevier.com/locate/forsciint Forensic discrimination of blue ballpoint pens on documents by laser ablationinductively coupled plasma mass spectrometry and multivariate analysis Francisco Alamillab, Matias Calcerrada, Carmen Garcia-Ruiz b.c, Mercedes Torreb,c,* Department of Chemistry and Environmental Sciences, Criminalistics Service, General Direction of Civil Guard, C|Guzman el Bueno, 110 Madrid, Spain "University Institute of Research in Police Sciences (IUICP), University of Alcald, Ctra. Madrid-Barcelona km. 33.600, 28871 Alcald de Henares, Madrid, Spain ‘Department of Analytical Chemistry, Multipurpose Building of Chemistry, University of Alcala, Ctra.Madrid-Barcelona km. 33.600, 28871 Alcald de Henares, Madrid, Spain 1. Introduction Conventional substances such as inks become evidence inforensic laboratories because of the criminal activity associated todocuments, such as threatening letters, fraudulent documents,authentication of signatures, insurance frauds, etc. Despite theincreased use of printers and copiers, most of the documents underforensic examination are written with pen inks, more specificallywith ballpoint pen inks [1]. Inks from writing instruments are mainly composed of color-ants, a vehicle and additives. Colorants make up about a 20%(m/m)and can be divided into dyes and pigments. Carriers or vehicles ( * C o rresponding author a t : Department of Analytical Chemistry, Mu l tipurpose Building o f C hemistry, U n iversity o f A l cala, Ctra. Madrid-Barcelona km . 33.600, 28871 A lcalá d e Henares, M adrid, S pain. Tel. : +34 91 885 4 907; fax: +34 91 885 4971. ) ( E -mail address: m erced e s . to r re @ uah . es ( M. T o rre). ) ( 0379-0738/$ - see front matter o 2013 El s evier Ireland Ltd. All rights reserved. http://dx.doi.org/ 10 .1016/j.f o rsci i nt.2013.01.0 3 4 ) make up approximately a 50% (m/m) and are usually organicsolvents or water. Additives provide specific properties, being theirnature quite varied (resins, viscosity adjusters, antioxidants,surfactants, softeners, corrosion inhibitors, lubricants, even tagsas rare earth chelates). In this way, traditional ballpoint pens areusually oil-based and dyes are their principal colorants, while gelpens contain water and pigments remain dispersed in it. As aresult, the number and chemical nature of all these componentsmay be very different [1-3]. Some practices in the forensic analysis of ink evidence are: (1)pairwise comparisons of ink strokes related to specific writinginstruments; (2) comparison and differentiation among strokes;(3) gathering information from the ink source such as themanufacturers, country, etc.; and (4) dating different documentsof forensic interest [3]. In order to carry out these practices,forensic protocols suggest firstly the use of non-destructiveanalytical techniques such as scanning microscopy, infraredreflectance and exposure to ultraviolet or X-ray radiations. Ifclassical methods do not solve the problem, destructive techniques may be used. Among them, thin layer chromatography, highperformance liquid chromatography, microspectrophotometryand capillary electrophoresis have been used [1,2,4,5]. However,these procedures imply sample extraction with organic solventsbefore characterizing or identifying the organic colorants and donot provide precise comparisons among inks. Contrary toseparation techniques, spectrometric ones have demonstratedquantitative and more concrete results. Coumbaros et al. [6]demonstrated that Time of Flight Secondary Ion Mass Spectrome-try (TOF-SIMS) is a useful technique to characterize dyes andinorganic substances of inks on documents without extraction orcomplicated sample preparations. Gallidabino et al. used LaserDesorption Ionization-TOF-MS (LDI-TOF-MS) in both positive andnegative mode to classify and compare inks from 33 blue ballpointpens analyzed directly on paper, achieving a discrimination powerof 99.6% when considering unidentified compounds and relativepeak areas [7]. In addition, Jones et al. [8] developed a non-destructive in situ method to differentiate writing inks on paperusing Direct Analysis in Real Time (DART) for which 41 of 43 blackand blue ballpoint, black fluid, and black gel inks were differenti-ated thanks to this relatively new ion source for MS. More specifically, the use of laser-based elemental analyticaltechniques such as Laser Ablation Inductively Coupled PlasmaMass Spectrometry (LA-ICP-MS) or Laser Induced BreakdownSpectroscopy (LIBS) have been proposed as good discriminatorytechniques for ink analysis. Recently,McGaw et al.[9] and Van Eset al.[10]applied them to study the distribution of ink elements onpaper, from a qualitative point of view. Also, Trejos et al. [11]applied LA-ICP-MS and LIBS to analyze gel inks and paper,achieving a discrimination power of ~96-99% for three blackink sets and more than 98% between different paper sources.As canbe seen in the literature, quantitative analyses can be made, butcomplex methodologies are needed for this purpose, as not onlyink compounds age and degrade due to environmental factors, butno certified reference materials exist for ink analysis. Consideringalso that sample history is usually unknown, this elementalquantification may be subjected to different source errors. Then, a question remains unanswered: would a halfwaybetween qualitative and quantitative method be more appropriatefor this kind of application? In a forensic laboratory, simpleprocedures have the advantage of providing fast conclusions, beingrelatively easy their use. Taking into account that a solid and well-established comparison of strokes is one of the most usually tasks in forensic cases,this research paper proposes a two-step methodusing a quasi-non-destructive technique (LA-ICP-MS) for thediscrimination of blue inks with no need for methodologicalcalibrations. Firstly, the procedure was optimized with blueballpoint pens of known origin by using instrumental parametersreported in the literature [11]. Then, specific criteria were designedin order to obtain objective and robust results without the need formethodological calibrations. This method was applied to a caseexample arrived to the Criminalistics Service of Civil Guard (Spain). 2. Materials and methods 2.1. Inks of known origin A set of 21 blue ballpoint pens of 10 known trademarks was studied with the aimof optimizing the method. A number code was assigned for each brand, whilesamples within the same brand or the same batch were codified with subscripts, ascan be seen in Table 1. About 4.5 cm length parallel lines were drawn (one line foreach pen) on a sheet of common office paper (white, A4 80g kgdensity). Each1eSsample was analyzed five times. Besides, a blank (paper without ink) was measured10 times lengthways the sheet of paper (top, middle and bottom) resulting in 30different measurements. 2.2. Questioned handwritten documents Different documents (18 paper sheets) from a real case arrived to theCriminalistics Service of Civil Guard were subjected to LA-ICP-MS analysis inorder to test the designed methodology. In all handwritten sheets there was asuspicion that some words (paid, effective and salary, in Spanish"recibi",“efectivo”and “nomina” respectively) had been intentionally included for fraudulentpurposes. Elemental analyses through LA-ICP-MS were carried out in order toidentify possible differences in composition between the allegedly manipulatedword and the remaining document. Taking into consideration the previous opticalanalyses carried out by the Department of Forensic Document Exams (differentlight contrast analyses and graphology studies), which concluded that these wordshad been allegedly counterfeited, six sections (0.5 cm x0.3 cm size) containing0.5 cm length ink stroke and one blank (paper without ink) with the samedimensions were removed from each sheet and each one of these sectionscorresponded to different parts of the document: main text, financial calculations,the three questioned ink entries, and the signature. In some cases (sheets numbers5,7,8, 12, 17 and 18) only five sections were collected since signatures belonging tothese sheets were written with black ink and were directly discriminated. Areference number was allocated in all samples, according to the different parts ofthese documents. As a representative example, Fig. 1 shows a picture of sheet no.1. 2.3. Instrumentation LA-ICP-MS analyses were conducted using an LA system from New WaveResearch UP 213 (Freemont, CA, USA) with a 213 nm fifth harmonic Nd-YAG solidstate laser, coupled to a quadrupole ICP-MS system 7500cx (Agilent,Japan). Laseroperational parameters optimized were: ablation mode,line; spot size, 100 um; Table1Manufacturing data and type of blue pens studied in the set. Sample Brand Model Ink type Manufacturing data 1 PAPER MATE Gel 2020 Gel 2 Pentel BK77 Oil-based 2008 November France 3 PILOT G1-0.5 Gel 2011 February Japan 4 Stabilo pointVisco Oil-based 一 5 Staedtler Stick 430 Oil-based 2011 February Germany 6 Uniball letstream Gel 2009 August Japan 7 Unipapel Unipen Oil-based 8 Pelikan Stick Liquid 9A BIC Crystal Oil-based 2008 November China 9B 2007 July China 9C 2007 August China 9D 2008 July China 9E 2008 August China 9F_1 2010 August China 9F 2 2010 August China 9F_3 2010 August China 10A Inoxcrom MEDIUM Oil-based 2010 Spain 10B 2011 Spain 10C 2011 Spain 10D 2011 Spain 10E 2011 Spain Fig. 1.Illustrated example of a questioned document (sheet no. 1) showing thedifferent sections submitted to analysis by LA-ICP-MS. S1_Text corresponds to thesection from the main text, S1_number to the financial calculations, S1_QIE1 andS1_QIE2 to the different questioned ink entries and S1_sign to the signature. scan rate, 20 um/s; repetition rate, 10 Hz and fluence, 2.00-3.00 J/cm². Instrumen- tal parameters used were: carrier gas through the ablation cell, He 1.00 L/min;carrier gas flow after the cell, Ar 1.0 mL/min; plasma gas, Ar 14 L/min; auxiliary gasflow, Ar 0.9 L/min; rf power, 1400 W. Mass spectra were acquired in time resolvedanalysis mode (TRA); acquisition time: 20 ms/mass. As usually, a glass referencematerial NIST 612 (National Institute of Standards and Technology, USA) was usedto establish the proper functioning of the equipment (instrumental calibration)through the following parameters: torch position, ion optics, fractionation index(measured as the ratio 238U/232Th)[12] between 0.8 and 1.2, detector pulse/analog(P/A) factor calibration, doubly charged ion rates <0.8% (21Ca*2/42Ca*) and oxiderates <1.0%(248ThO*/232Th*)[13]. TRA signals were performed using the GLITTERsoftware (GEMOC, Macquarie University, Australia), v4.4.2. Graphics and statisticaltreatments were made using Excel 2007 (Microsoft, Corp.) and SPSS Statistics v18(IBM, Corp.) software. 2.4. Methodology and data treatment Elemental compositions from both the set of inks and the case example wereobtained through an LA-ICP-MS equipment with parameters listed in Section 2.3.Note that in the text of this manuscript elements will refer to their respectiveisotopes which are compiled in Table 2. For the set, a total of 135 measurementswere made, from which 42 isotopes of different elements could be collected and atotal of 5670 intensity values were obtained. For the case example, differentsections from 18 questioned handwritten contracts (18 independent sheets) wereanalyzed. A total of 303 replicates and 22 elements per replicate were obtained,leading to 6666 values. The methodology employed for the dataset was based on two main steps: (1) Data normalization: which allowed to calculate background signals (interfer-ences from the blank paper), and identify target elements (those whoseintensities were high enough to differentiate from the background signals) inorder to cluster samples into qualitative groups. In all cases, blank papermeasurements were needed to subtract background from the elementalintensities from the strokes. This normalization was made by means of aninternal standardization. Thus, to overcome this step the following correction tocalculate the normalized intensity (cps) for each element and each sample (Ics)was raised: where, Irs is the raw elemental intensity (cps) for each replicate of each sample,and Iis is the intensity of the isotope (cps) taken as IS, measured both in theblank or paper (lisp) and in the ink samples (liss) Mg, Ca and Sr were the elements proposed as ISs. Estimations were made forthe three ISs in parallel in order to compare the possible differences for thetargets depending on the IS selected. Once intensities had been normalizedusing the three ISs, a screening based on the following criteria was made inorder to select target elements: On one hand criterion 2 imposed elemental intensities higher than 200 cpscould be selected as target (to avoid possible contaminations among samplesand selecting targets with relatively high concentrations in the ink). On the Raw and corrected intensities (using Sr as IS) for both the blank and sample 1 (taken as example) measurements, as well as the ink intensity ratios calculated for targets ofsample 1. Blank intensities Sample 1 intensities Ink ratio° Raw Corrected(Sr) Raw Corrected (Sr) RSD (%) 1OSD RSD (%) RSD (%) RSD (%) RSD (%) 7Li 5 104 5 51 101 5 115 4 108 23Na 255,385 256,570 515,471 293,873 10 240,596 14 24Mg 23,394 23,439 35,570 32,784 23 26,967 30 27A 25,747 25,670 40,940 42,709 35 35,351 43 29Si 585 597 1890 833 19 671 6 39K 7224 190 7013 126,458 180 95.913 55 81,674 65 42Ca 55,408 55.276 64,699 71,416 20 57,421 6 4.3 51v 61 60 385 57 24 47 31 55Mn 462 462 516 6875 53 5839 64 211.4 517Fe 777 768 2918 1065 13 867 12 59Co 9 4 17 19 12 60Ni 8 8 29 15 39 63Cu 119 1310 132 330,768 59 282,036 69 66Zn 150 87 13 64 12 73 88Sr 57,175 - 70,869 16 - 90Zr 18 31 750 72 651 82 21.9 29.3 118Sn 152 56 141 67 79 58 88 137Ba 189 101 196 2263 116 224 12 184 20 140Ce 37 136 29 15 39 14 182W 268 258 45 78 53 208pb 934 60 798 71 28. 3.3 2381U 63 11 51 6 Average of 30 measurements (blank) or 5 measurements (sample 1). " Corrected data average obtained by applying Eq. (1) to all replicates using Sr as IS. other,criterion 3 (what we call "limit lines") considered the background signals,in such a way that corrected intensities from the ink samples had to be higherthan those from the blank (Icp) plus 10 times their standard deviation (SD).Finally, according to criterion 4, elements whose intensities satisfied criteria 2and 3 in more than four replicates within each sample were taken into account.This first approach is able to find characteristic elements from each pen, leadingto the possibility of clustering them in qualitative groups and reduce the initialdataset to carry out easier and clearer statistical treatments. (2) Semi-quantitative treatment: dealt with the attempt to differentiate amongsamples within the groups qualitatively defined in the first step. For thispurpose, only target elements were subjected to statistical treatment. Thisstudy was carried out through elemental correlations, what we called “inkratios”(R), relating raw intensities from target elements measured for an inkstroke (Ir,target) with Cu raw intensity from the same stroke (Ir,cu), as stated inEq.(5): Cu was selected as reference on the basis of the assumption that most blue inksamples present this element in their composition. It is important to emphasizethat only raw intensities and not the corrected ones from the first step wereused, as this ink ratio was capable of minimizing intensity variations related tothe writing pressure and speed,irregularities of ink mass expelled from the penand laser drift. To accomplish an objective ink differentiation within groups, differentmultivariate statistical treatments were applied to these ink ratios: Multivari-ate Analysis of Variance (MANOVA), post hoc Honestly Significant Difference(HSD) Tukey’s test or T Hotelling. In all cases a 95% confidence interval wasestablished considering some previous research [13].MANOVA is a multivariateanalysis of variance for multiple dependent variables, which in our case are theelements, and only one independent variable, which are the samples. This testconsiders both inter- and intra-variability and it is based on the null hypothesisof the equality of multiple averages. Tukey's test establishes various groups bystudying all significant differences from all possible combinations amongsamples (in our case,n(n -1)/2, being n the number of samples under study).THotelling could be treated as a special case of MANOVA as a direct extension tomultivariate t contrast. MANOVA and Tukey's tests were used when more thantwo samples were within a group, while THotelling was used when groupscontained only two samples. Ink ratios together with their statistical treatment allowed carrying outdifferentiations among inks without the need for instrumental calibrations,which require home-made ink patterns since no ink certified referencematerials are currently available. This procedure was applied to the following workplan. Firstly, the set ofinks of known origin was analyzed with the aim of evaluating thediscrimination power of the proposed methodology. Afterwards, documentsfrom the case example were subjected to the same methodology in order totest the usefulness of the method and compare the results with those obtainedby the Department of Forensic Document Exams, whose practices areaccredited by the National Entity of Accreditation (in Spanish “EntidadNacional de Acreditacion,ENAC"). 3. Results and discussion 3.1. Discrimination of blue pen inks of known origin Table 2 illustrates the procedure followed for data treatment ofmeasured intensities both in the blank (paper) and in the inkstrokes (sample 1 as a representative example), taking Sr as IS.Elements which did not provide information in any sample due totheir extremely low intensities, almost indistinguishable from thebackground (Sc, Ti, Cr, Rb, Mo, Rh, Ag, Cd, Sb, Cs, La, Pr, bothisotopes of Nd, Eu, Hf, Ta,Re,Os and Tl), were no longer taken intoaccount and do not appear in the table. The non-uniformdistribution of the ink on the paper fibers, the laser drift andthe low intensities from some elements justified the poorreproducibility of the intensity values obtained for this sample,as RSDs ranged from 10 to 115%.Further information related to rawand corrected intensities with Sr as IS for each sample and replicatecan be found in the Supplementary File of this manuscript. Obviously a proper methodology for data interpretationshould be optimized to use these values for discriminationpurposes. As stated in the previous section, a two-step method-ology was applied: (1) selection of an adequate IS to correct raw intensities and identify target elements for each sample to clusterthem qualitatively; (2) obtaining ink ratios and application ofmultivariate statistical treatments to confirm or improve thedifferentiation among inks. These two steps were first optimizedwith blue pen inks of known origin and, then, tested withquestioned handwritten contracts from a forensic case example. 3.1.1. Selection of the internal standard and qualitative clusteringbased on target elements Raw data normalization through an IS is a critical step. Asuitable internal standard (IS) would be an element found in thesheet of paper and homogeneously distributed within it. Theselection of this IS seems a debated question since differentelements have been proposed in the literature with not alwayssuccessful results 9-11].Mg, Ca and Sr were the elements chosenas IS in this case due to three main reasons: (1) raw intensityaverages from these elements in the blank were in a greater extentthan others and with relatively low RSD values (Mg 21%, Ca 21%and Sr 16%); (2) Sr has been successfully chosen as IS in a previousresearch [10]; and (3) paper samples had been distinguishedthrough Mg and Ca concentrations, although different pieces ofpaper from the same sheet had been indistinguishable [14];however,this problem may be solved if different paper sheets aretreated as independent samples with independent blank measure-ments, as done in this work. The study was then made by takingthe three IS and working in parallel in order to determine thevariability of the targets depending on the selected IS. Targetselection was made as shown in Fig. 2. This one illustratesgraphically some corrected elemental intensities (Li, Zr, Pb, Ca andCu) for samples 1, 4 and 6 as examples. As can be seen, despite thefact that intensities from Li, Zr and Pb were much lower than thosefrom Ca, they sometimes fulfilled the requirements for being targetelements (for instance the case of Li in ink no. 4) and potentiallycharacterize inks. Ca intensities are relatively high for both analysis(blank and ink stroke on paper) so limit line (criterion 3) is abovethe eights of corrected Ca intensities for all samples, confirmingthat it is not a target and its composition comes from the sheet ofpaper. Contrary to this, intensities clearly above the limit havebeen confirmed in the case of Cu when analyzing ballpoint penssuch as 1 and 4, but not for sample 6 (Uniball Jetstream gel).Otherelements,such as Zr and Pb are usually present in some samples,thus allowing a proper qualitatively clustering. Table 3 summarizes target elements according to the sampleand IS chosen.From the 231 possible cases, only in four of themdifferent ISs led to different target elements (V for inks 2 and 5 andPb for inks 10A and 10B),being the targets independent on the IS ina 98% of the cases. When Sr was selected as IS, V obeyed criteria 2and 3 in three replicates from sample 5, but it could not beassigned a target because of the criterion 4. Similar behavior wasevidenced for Pb in samples 10A and 10B: V and Pb intensitieswere extremely near the limit imposed by the criterion 3, leadingto slightly differences depending on the IS. Since Sr has presentedlower RSDs than Mg and Ca, it could be the best one to carry out thetreatment. Nevertheless, the second step in Section 3.1.2 wasmade in parallel with the three IS in order to evaluate finaldifferences and observe their potential use as IS. It is also evident from Table 3 that samples 1,2, 3,4, 6,7,8,9Aand 10B (cells with no symbol) were qualitatively individualized.Samples 9B,9C,9D and 9E (group 1,“$") and samples 9F1,9F2 and9F3 (group 2,“#”) were differentiated, independently of the ISselected. However,sample5 fit with group 1 when Mg and Ca werethe IS and with group 2 if Sr was the IS. Samples 10C and 10Eformed the group3 (“&”) and,similarly to groups 1 and 2, sample10A (“X") fit with group 3 when Mg was the IS, and with sample10D when Ca or Sr were used, creating the group 4 (“Z").Consequently, a screening among brands of blue ballpoint pen Fig. 2. Bar chart showing corrected intensities in cps of five different elements (Li, Zr, Pb, Ca and Cu) for inks 1, 4 and 6 (values corresponding to the first replicate using Sr as IS).Limit line (criterion 3) corresponds to the background limit level which establishes that elements are assigned as targets for each sample and replicate. Table 3Target elements found for each ink sample. 2 3 4 5 6 7 8 9A 9B 9C 9D 9E 9F1 9F2 9F3 10A 10B 10C 10D 10E 7Li 51v 55Mn T Ca.Sr T T T Mg, Ca T T TS TS TS TS TX T T T& 59Co T 60Ni T 63 Cu 66Zn T T T T* T* T T T T T T TX T T& TZ T& 90Zr 118Sn T T 182W 208Pb T T T T T* T* T T T T TS TS TS T$ T# T# Ca.SrX T Ca,Sr TZ Tindicates that the element is a target regardless the IS chosen; different symbols on the right in some cells indicate same qualitative groups in scheme from Fig. 3. inks was possible, although discrimination between differentbatches from the same brand or different pens from the samebatch was not. Attending to the chemical composition, element frequenciescan be discussed. Li, Co,Ni and Sn appeared in one brand, whileZr did it in two brands, W in three of them, Zn appeared in fourbrands, V and Mn in five samples, Cu in eight different inks andfinally Pb which was detected in all the brands studied.Consequently, some elements such as Li, Co, Ni and Sn exhibithigher discrimination power(DP) than others such as Pb and Cu.Inks without Cu correspond to gel pens possibly due to theabsence of Cu in their formulation which fits with the previousliterature, though it is not obeyed in all the cases (sample 1 is agel pen which contains Cu in its composition). Focusing on Bicsamples, the six batches were clustered in three groups,independently of the IS chosen. However, Inoxcrom pensresulted in the most conflictive samples since slight differenceswere confirmed dependingon the IS selected. All these inkscontained V, Mn and Pb, while W was only present in sample10B, and Pb in samples 10D,10A and 10B.The SupplementaryFile can be consulted for further information of data obtained. 3.1.2. Statistical treatment of ink ratios. Improvement of thediscrimination power The presence of Cu in most blue ballpoint pens and resultsfound in the set (which showed higher concentrations of Cu andits low RSD values in most of the samples) led to the selection ofthis element to calculate ink ratios. Gel pens which did not showCu intheir formulationwere in tthiscase qualitativelydifferentiated, but in the case of facing up various gel pens inthe same group, another metal should be chosen to carry outthat differentiation. As a general rule, an element present in all samples with a high concentration wouldbe aa possiblecandidate to calculate ink ratio. Last two columns on Table 2 show the ink ratios for sample 1and their RSD values, which decreased dramatically.The remainingink ratios for each sample can be consulted in the SupplementaryFile of this manuscript. Interestingly, in some cases RSD valueswere not reduced when applying these ratios, such as the case of Win Bic samples (9C-9F3). Low elemental intensities near to the LODscould cause these variations. After obtaining the ink ratios statistical tests were applied. Inthis case only V, Mn, Zn, W and Pb ratios were necessary, as theremaining targets belonged to the samples which had beenqualitatively individualized (see Table 2). Statistical treatmentsapplied to these ratios were conducted in parallel with the three ISstudied, to assure the robustness of the results. Fig. 3 shows a summary of all data treatment used todifferentiate the inks of known origin. The first qualitativetreatment had led to nine samples qualitatively individualizedand four different ink groups (G1, G2, G3 and G4) in whichsamples 5 and 10A belonged to different ones depending on theIS selected. In the second step, these groups were statisticallytreated through their respectively ink ratios (Eq.(5)). In all casesgroups 1 and 2 were subjected to MANOVA/HSD tests (morethan two samples in each group). Despite of being sample 5totally discriminated; four batches from Bic (9B, 9C, 9D and 9E)resulted indistinguishable, though batch 9F was statisticallydifferent. Within that batch, sample 9F3 could beealsodistinguished from 9F1 and 9F2. For groups 3 and 4, onlysamples 10C and 10E from the same brand were indistinguish-able, while 10A and 10D were statistically different. Theseresults were found independently on the IS selected and usingdifferent statistical tests. Although a complete discrimination was not possible, the DPwas improved by using statisticall tests, leading to thedifferentiation of five batches from Inoxcrom (10A and 10D),samples from Staedtler (5) and one of the three Bic pens fromthe same batch (9F3). As a result, the use of two consecutivetreatments (internal standardization for qualitative clusteringand ink ratios with statistical test for the semi-quantitativestudy) provided similar results to those previously published inLA-ICP-MS: a DP of 100% among samples from different brandsand a partial discrimination among batches or samples withinthe same batch. This procedure has been capable of discrimi-nating ink samples with similar DP to spectrometric techniques,but avoiding the use of home-made patterns to performmethodological calibrations, which reduces both analysis timeand resources. 3.2. Application to a questioned handwritten document The methodology was also applied to the analysis of ques-tioned handwritten contracts from a forensic case example.Starting from the results obtained from the Department ofForensic Document Exams of the Criminalistics Service of CivilGuard (Spain), the allegedly manipulated documents were takenand analyzed, in order to apply the developed procedure andcompare results obtained with those achieved by that Depart-ment. On the first step, sections from different parts of the documentand blanks from each one of the 18 independent paper sheetswere taken and analyzed. Raw intensities from the samples werecorrected using Sr as IS (Eq.(1)). Applying the designed criteria(2,3 and 4) a qualitative clustering in two groups was possible.On one hand, the majority of ink samples were characterized bythe elements V, Cu, Zn, and Pb (group A). On the other, only textand numbers from sheet 11 contained Cu, Zn and Pb in theircomposition (group B; S11_text and S11_number). This may beexplained considering that in most cases the documents couldhave been written with similar ballpoint pens and trademarks. Ascan be seen, in the case studied the qualitatively clustering was not as effective as in the set of 21 blue pens. This also fits with theconclusions of the qualitative method, where a differentiationamong brands was a successful but a multivariate statisticaltreatment was necessary in order to improve the DP within thesame brand. On the second step, raw signals of the targets in group A (81samples) were used to calculate the ink ratios (Eq. (5)) using Cu asquotient. As this group was characterized by four elements, onlythree ink ratios for each replicate were calculated. A 3D plot isshowed in Fig. 4 to help out understanding this clustering.Three Fig.4. Visual clustering of the ink samples from the case example studied accordingto the value of three discriminant variables (ink ratios of V/Cu, Zn/Cu, and Pb/Cu). subgroups within the group A can be visualized. One of them (atthe bottom of the plot) is composed of all questioned ink entries,text and numbers from sheets 9 and sheet 7, slightly differentiatedamong them. The second subgroup (at the middle of the plot)consists of the signatures of sheets 4 and 13 as well as text and thenumber of sheet 3. The remaining samples formed the third group,at the top of the plot. When THotelling test was applied to the 81 samples of groupA, the number of possible pairwise comparisons evaluated was3240. This test confirmed the same three subgroups of samplesdescribed in Fig. 4 (95% confidence). Inks from the questioned inkentries were identified in only one subgroup with other threesamples (text and number from sheet 9 and number from sheet 7).As can be seen, the method did confirm that these questioned inkentries had been written with different pens to those used to writethe remaining document. As a consequence, results obtained withthe designed methodology in LA-ICP-MS agreed with those fromthe Department of Forensic Document Exams. And moreover,thismethodology would allow the use of other analytical techniquesafter analyzing real documents if complementary results or datawere needed to solve the case. 4. Conclusions An LA-ICP-MS methodology has been designed and applied to aset of blue inks of known origin and a case example. Firstly, theselection of target elements meant a reduction of trivial variablesthat would have hindered statistical treatment interpretationsfrom the dataset.These targets were good discriminators for a firstscreening of inks into qualitative groups, according to their brand.Secondly, the use of “ink ratios” allowed a1reduction ofheterogeneities in the measurements and an easy application ofmultivariate statistical analysis (MANOVA, Tukey’s HSD and THotelling tests), leading to an improvement of the DP of themethod. In this way, some differentiations within a batch ordiscrimination among batches from the same brand were possible.Finally, when this procedure was applied to interpret a caseexample, results obtained showed that inks used to write somequestioned ink entries in the document were indistinguishable butdifferent from the rest of the document, showing the potential ofthe methodology employed. In this work the optimization of thewhole data treatment methodology has been developed but, oncedesigned, analyses are fast enough to be useful in forensiclaboratories. This LA-ICP-MS methodology has provided higher DPs thanother conventional methods or techniques, such as visualcomparison that lead to more subjective results or separationtechniques which require tedious sample preparation. Besides, itshould be stressed the advantage of being a quasi-non-destructivetechnique which allows complementary analyses of the docu-ments under study. Compared to spectrometric techniques, andspecifically to other works focused on LA-ICP-MS, this methodolo-gy has showed a different data treatment based on two steps, which permitted ink sample discrimination without performingmethodological calibrations, the Achilles heel of this technique,due to the lack of ink certified reference materials. Finally, these preliminary results confirm our rproposedmethodology as a proof of concept which in the future could beapplied to overcome more complete sample sets and carry outstudies on samples from the same brand and different batches. Acknowledgements The authors acknowledge the University Institute of Research inPolice Sciences (IUICP) of the University of Alcala the funding forprojects IUICP/PI2010/9 and IUICP/PI2010/4. Appendix A. Supplementary data Supplementary data associated with this article can be found, inthe online version, at hlttp://dx.doi.org/10.1016/j.forsciint.2013.01.034. References [1] J.H. Bugler, H. Buchner, A. Dallmayer, Characterization of ballpoint pen inks bythermal and desorption and gas chromatography-mass spectrometry,I. ForensicSci. 50 (2005)1209-1214. [2]G.M. LaPorte, J.D. Wilson, A.A. Cantu, S.A. Mancke, S.L. Fortunato, The identifica-tion of 2-phenoxyethanol in ballpoint inks using gas chromatography/massspectrometry-relevance to ink dating, J. Forensic Sci.49 (2004) 155-159. [3] M. Ezcurra,J.M.G. Gongora, I.Maguregui,R. Alonso, Analytical methods for dating modern writing instrument inks on paper, Forensic Sci. Int.197 (2010)1-20.[4] J.Andrasko, HPLC analysis of ballpoint pen inks stored at different light condi-tions,J. Forensic Sci. 46 (2001)21-30. [5]G.M. Laporte, M.D. Arredondo, T.S.McConnell, J.C. Stephens, A.A. Cantu, D.K.Shaffer, An evaluation of matching unknown writing inks with the United StatesInternational Ink Library, J. Forensic Sci. 51(2006) 689-692. [6] J. Coumbaros, K.P. Kirkbride, G. Klass, W.Skinner, Application of time of flightsecondary ion mass spectrometry to the in situ analysis of ballpoint pen inks onpaper, Forensic Sci. Int. 193 (2009) 42-46. [7]M. Gallidabino, C. Weyermann, R. Marquis,Differentiation of blue ballpoint peninks by positive and negative mode LDI-MS,Forensic Sci. Int. 204 (2011)169-178. [8] R.W. Jones, R.B. Cody, J.F. McClelland, Differentiating writing inks using directanalysis in real time mass spectrometry,J. Forensic Sci. 51 (2006) 915-918. [9]E.A. McGaw, D.W. Szymanski, R.W. Smith, Determination of trace elementalconcentrations in document papers for forensic comparison using inductivelycoupled plasma-mass spectrometry, J. Forensic Sci. 54 (2009)1163-1170. [10]A. Van Es,J. De Koeijer,G. Van Der Peijl, Discrimination of document paper by XRF,LA-ICP-MS and IRMS using multivariate statistical techniques, Sci. Justice 49(2009)120-126. [11]:T. Trejos, A. Flores, J.R. Almirall, Micro-spectrochemical analysis of documentpaper and gel inks by laser ablation inductively coupled plasma mass spectrom-etry and laser induced breakdown spectroscopy, Spectrochim. Acta B 65 (2010)884-895. [12]P. Weis, M. Diicking, P. Watzke, S. Menges, S. Becker, Establishing a matchcriterion in forensic comparison analysis of float glass using laser ablationinductively coupled plasma mass spectrometry,I. Anal. At. Spectrom. 26(2011)1273-1284. [13]F. Alamilla, C. Gonzalez, M. Torre, C. Garcia-Ruiz, Applications of laser-ablation-inductively-coupled plasma-mass spectrometry in chemical analysis of forensicevidence, TrAC Trend Anal. Chem. 42(2013) 1-34. [14]L.D. Spence, A.T. Baker, J.P. Byrne, Characterization of document paper usingelemental compositions determined by inductively coupled plasma mass spec-trometry,J. Anal. At. Spectrom. 15 (2000)813-819. All content following this page was uploaded by Francisco Alamilla on January The user has requested enhancement of the downloaded file. All in-text references underlined in blue are added to the original documentand are linked to publications on ResearchGate, letting you access and read them immediately. View publication stats 提出了一种基于LA-ICP-MS方法的蓝色圆珠笔墨水的鉴别方法。在没有任何样品准备的情况下,从21支已知来源的蓝色钢笔中切割并测量了含有墨迹的普通办公用纸的一小部分。第一步,将Mg、Ca和Sr作为内部标准(ISs),用于元素强度的归一化和背景信号的消去。然后,设计具体的标准,并采用识别目标元素(Li, V, Mn, Co, Ni, Cu, Zn, Zr, Sn, W, Pb),结果独立于目标元素,在98%的案例中被选择,并允许对样本进行定性聚类。第二步,利用基于先前识别目标的元素相关比(墨水比),通过多元统计分析(MANOVA、Tukey’s HSD、T2 Hotelling)获得质量独立强度,并进行两两比较。这种处理提高了辨别能力(DP),提供了客观的结果,实现了不同品牌之间的完全区别,笔墨与相同品牌之间的部分区别。设计的数据处理,加上多元统计工具的使用,代表了一种容易和有用的工具,以区分蓝色圆珠笔墨水,几乎没有样品破坏和不需要方法校准,因为它的使用可能有利于法医实践的立场。为了检验这一程序,它被用来分析真实的手写的有问题合同,这些合同以前是由西班牙民警刑事主义服务处法医文件考试司研究的。结果表明,所有被质疑的墨水条目都聚集在同一组中,与文档中剩余的墨水不同。
确定


还剩6页未读,是否继续阅读?

产品配置单
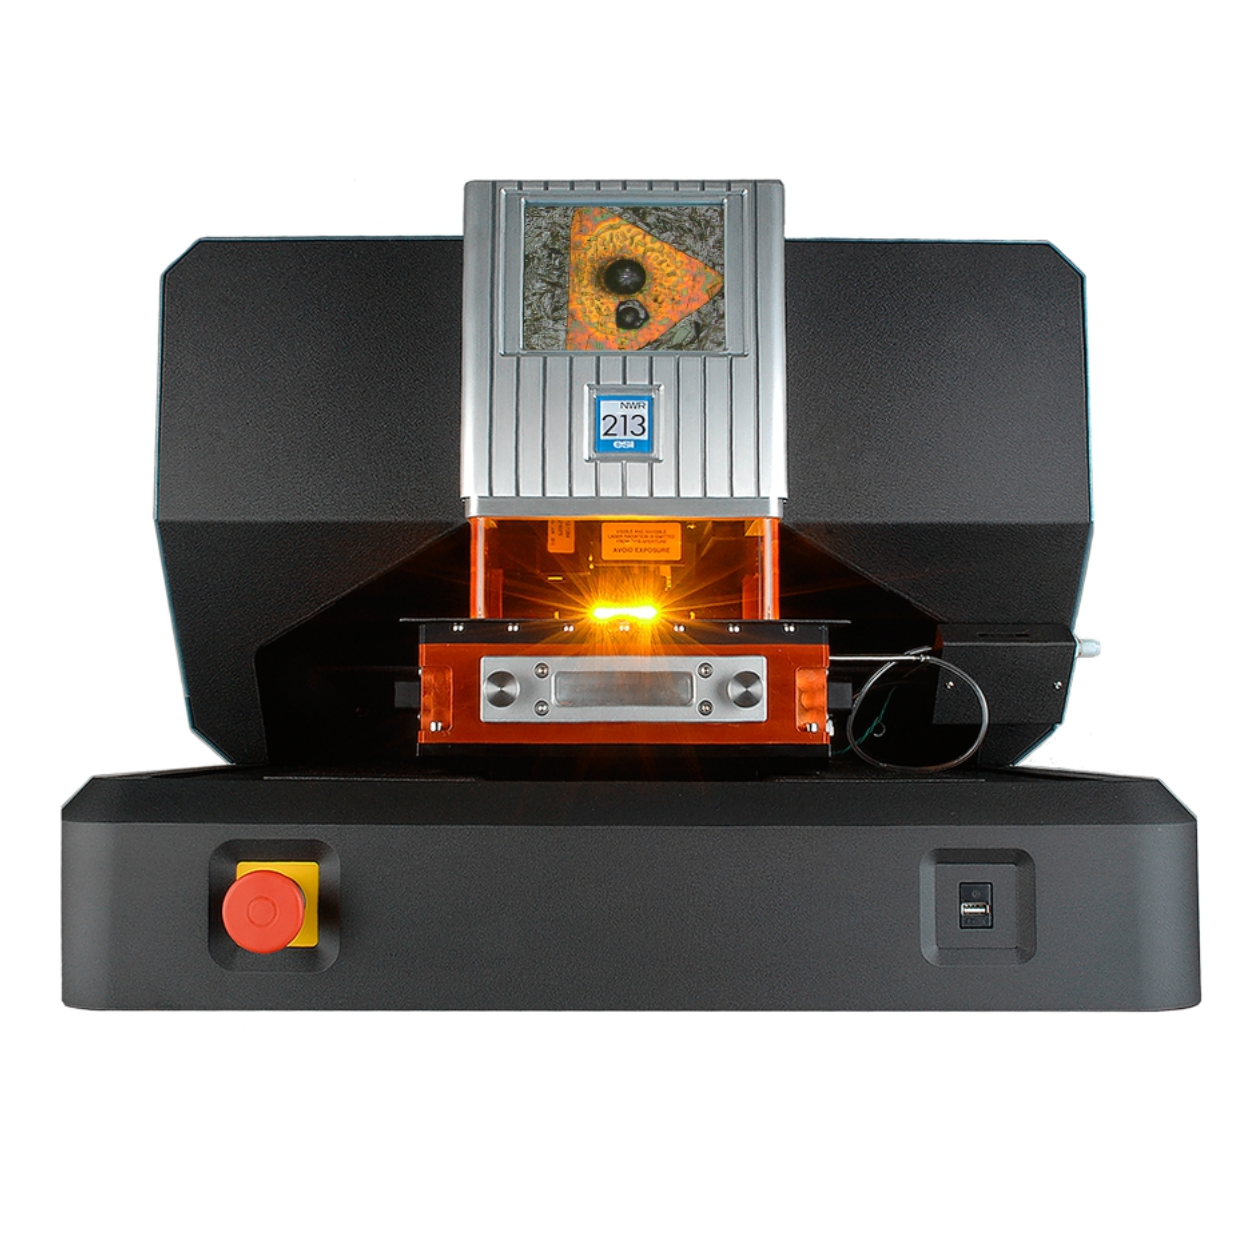
上海凯来仪器有限公司为您提供《蓝色圆珠笔文件中多元统计工具应用检测方案(激光剥蚀进样)》,该方案主要用于文教办公品中多元统计工具应用检测,参考标准--,《蓝色圆珠笔文件中多元统计工具应用检测方案(激光剥蚀进样)》用到的仪器有ESL213 灵活的激光剥蚀系统
推荐专场


相关方案
更多