


电子舌在红酒年份鉴定、检测中的应用;电子舌在红酒年份鉴定、检测中的应用;电子舌在红酒年份鉴定、检测中的应用;电子舌在红酒年份鉴定、检测中的应用;
方案详情

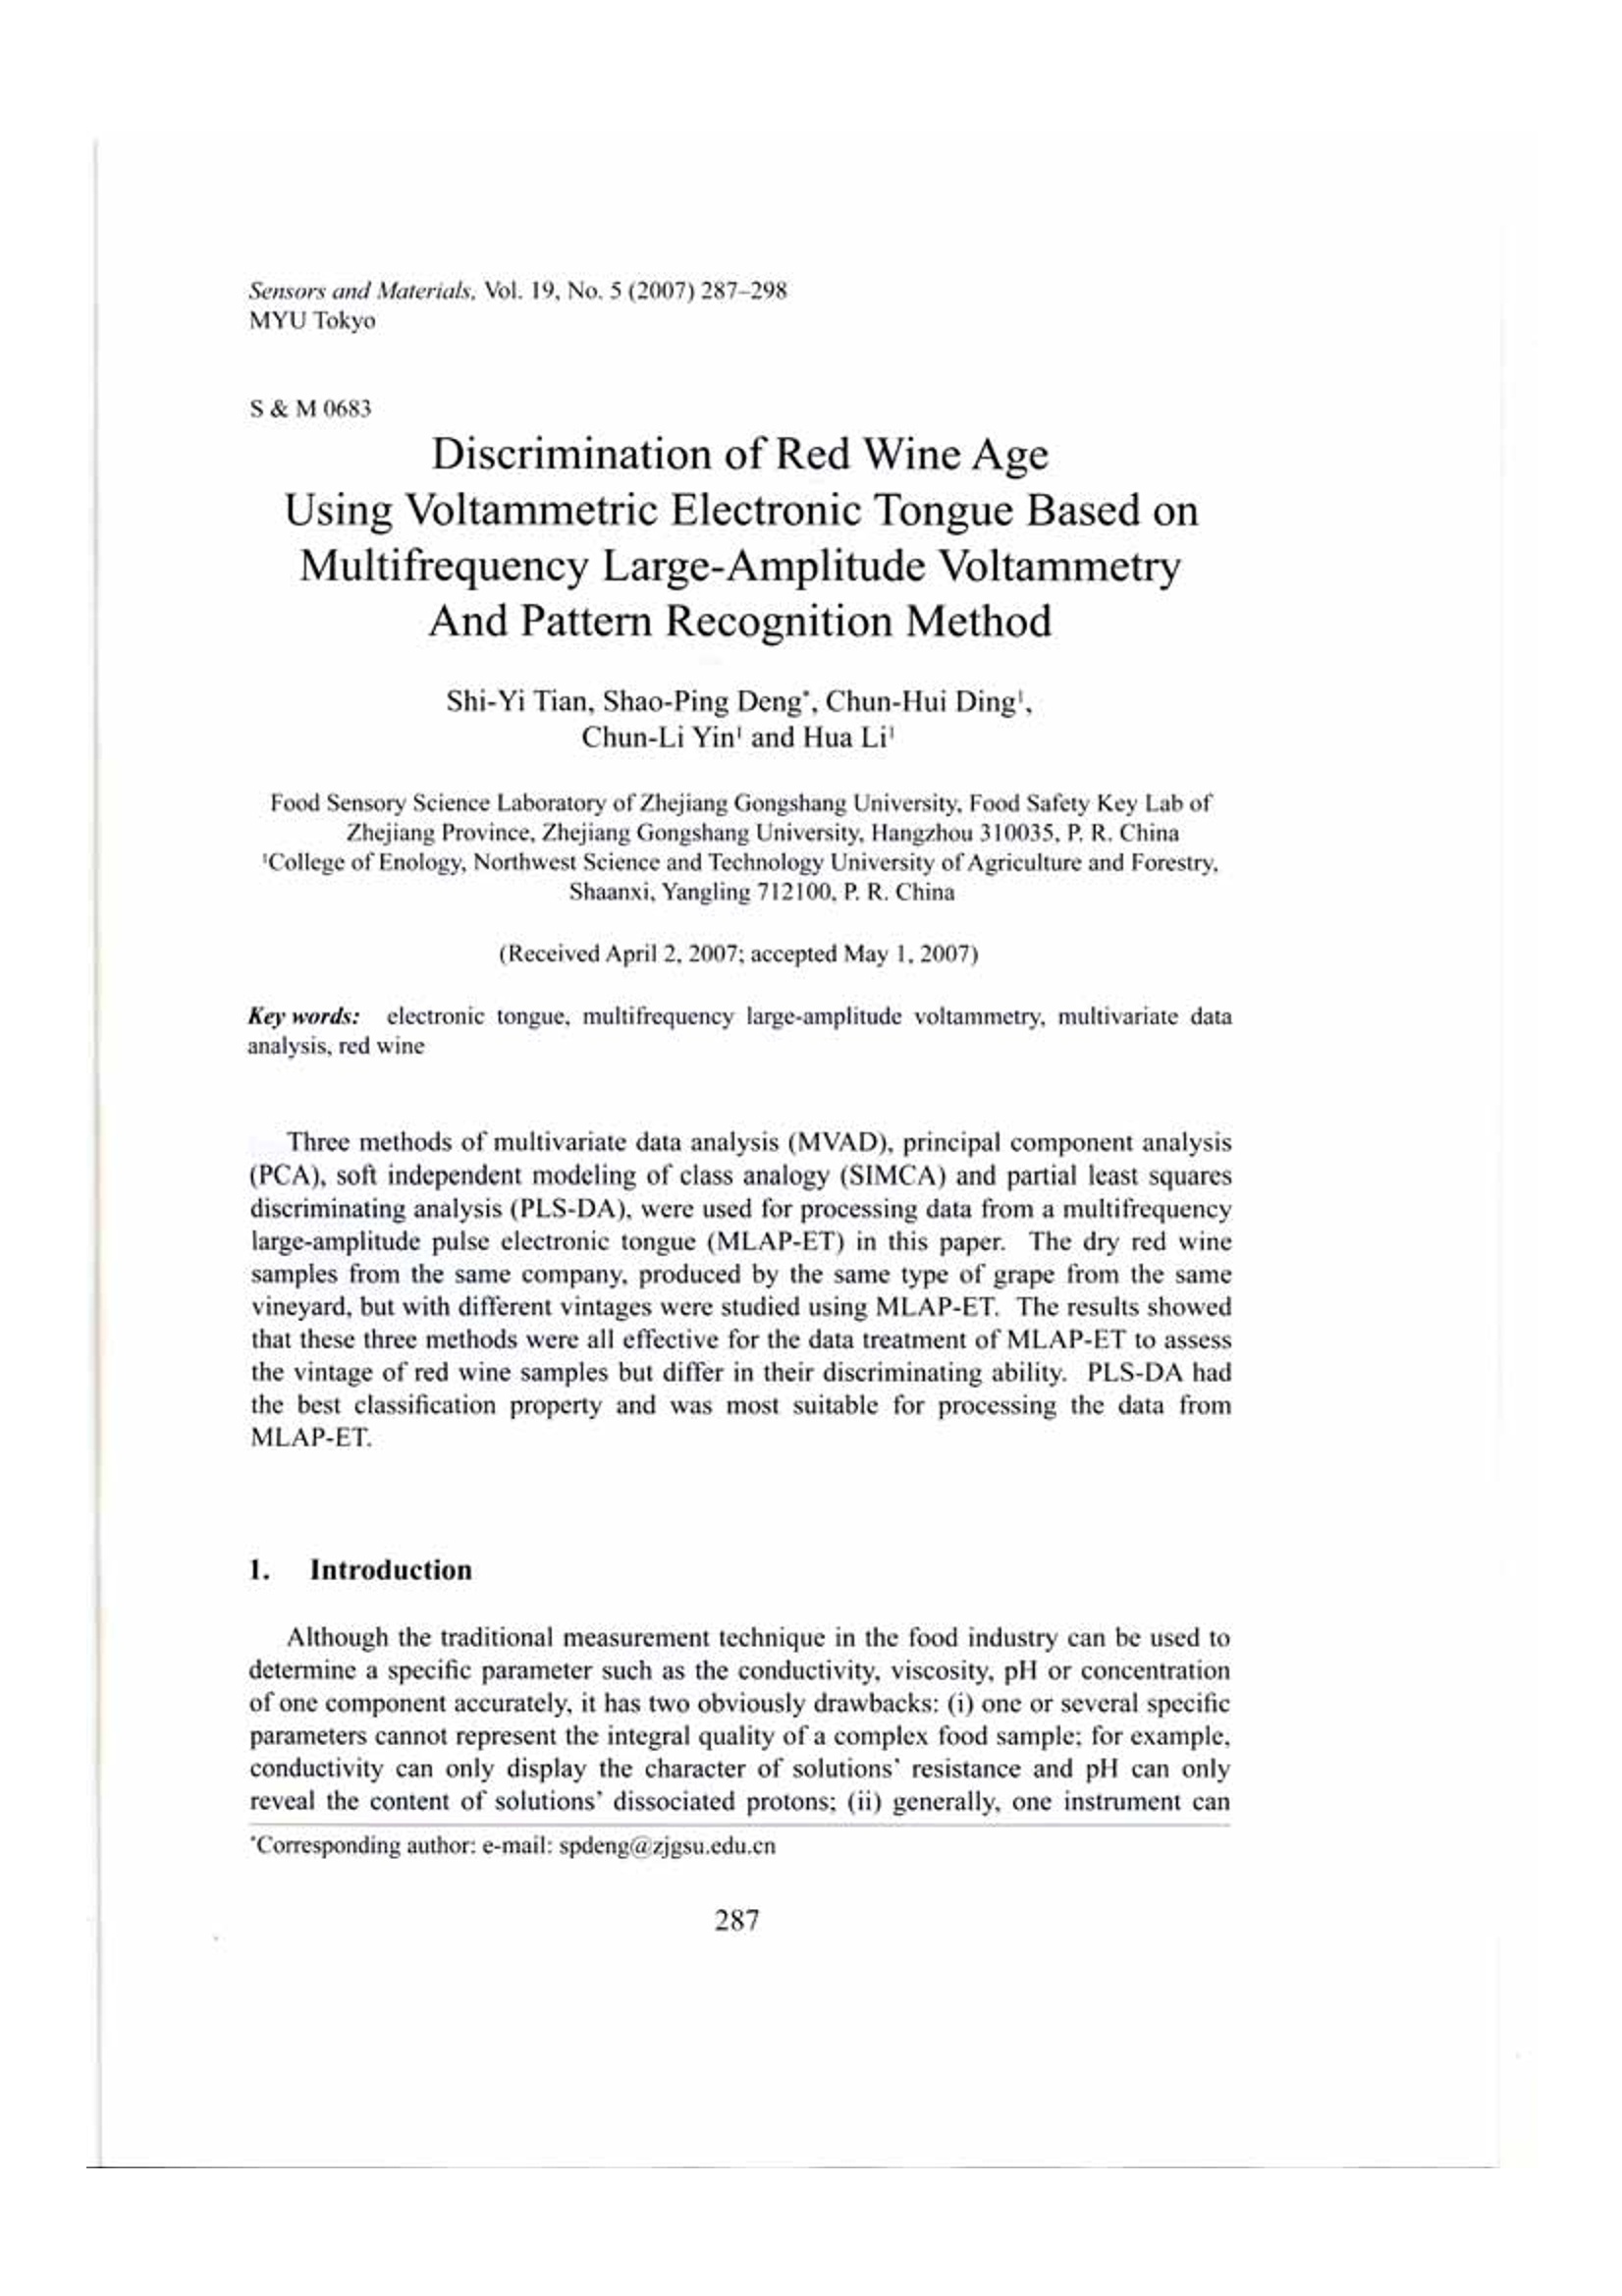
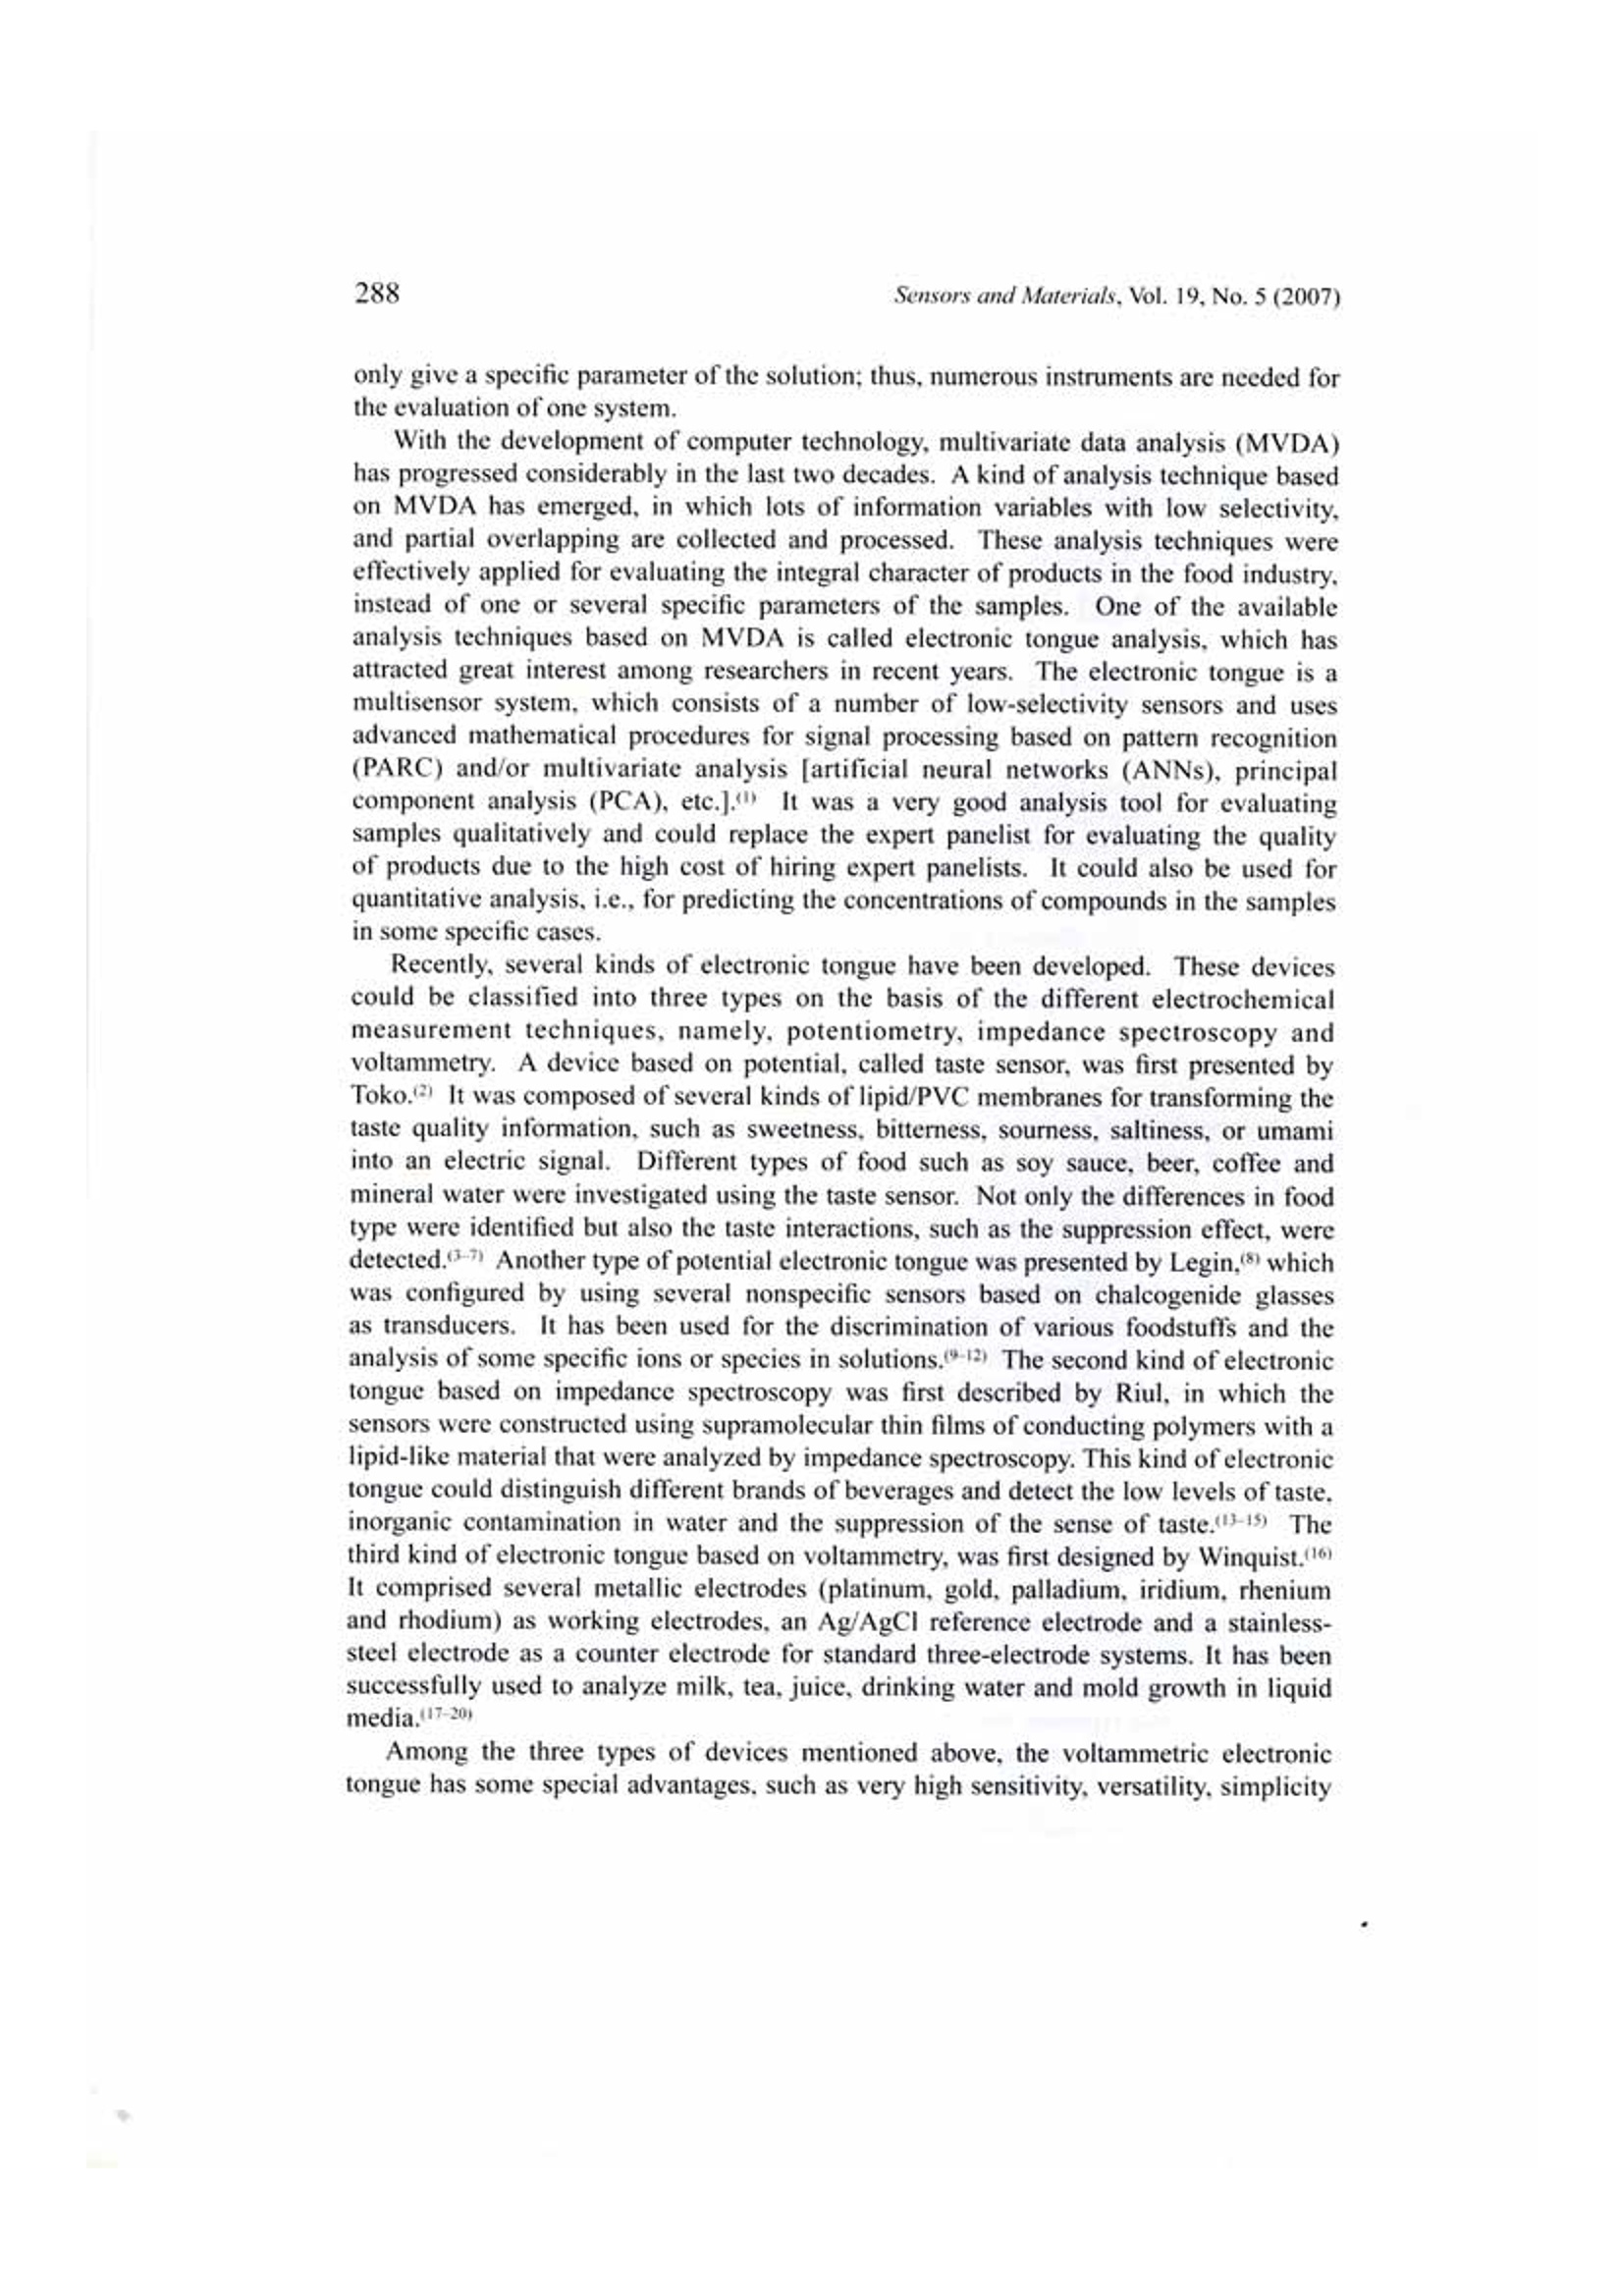
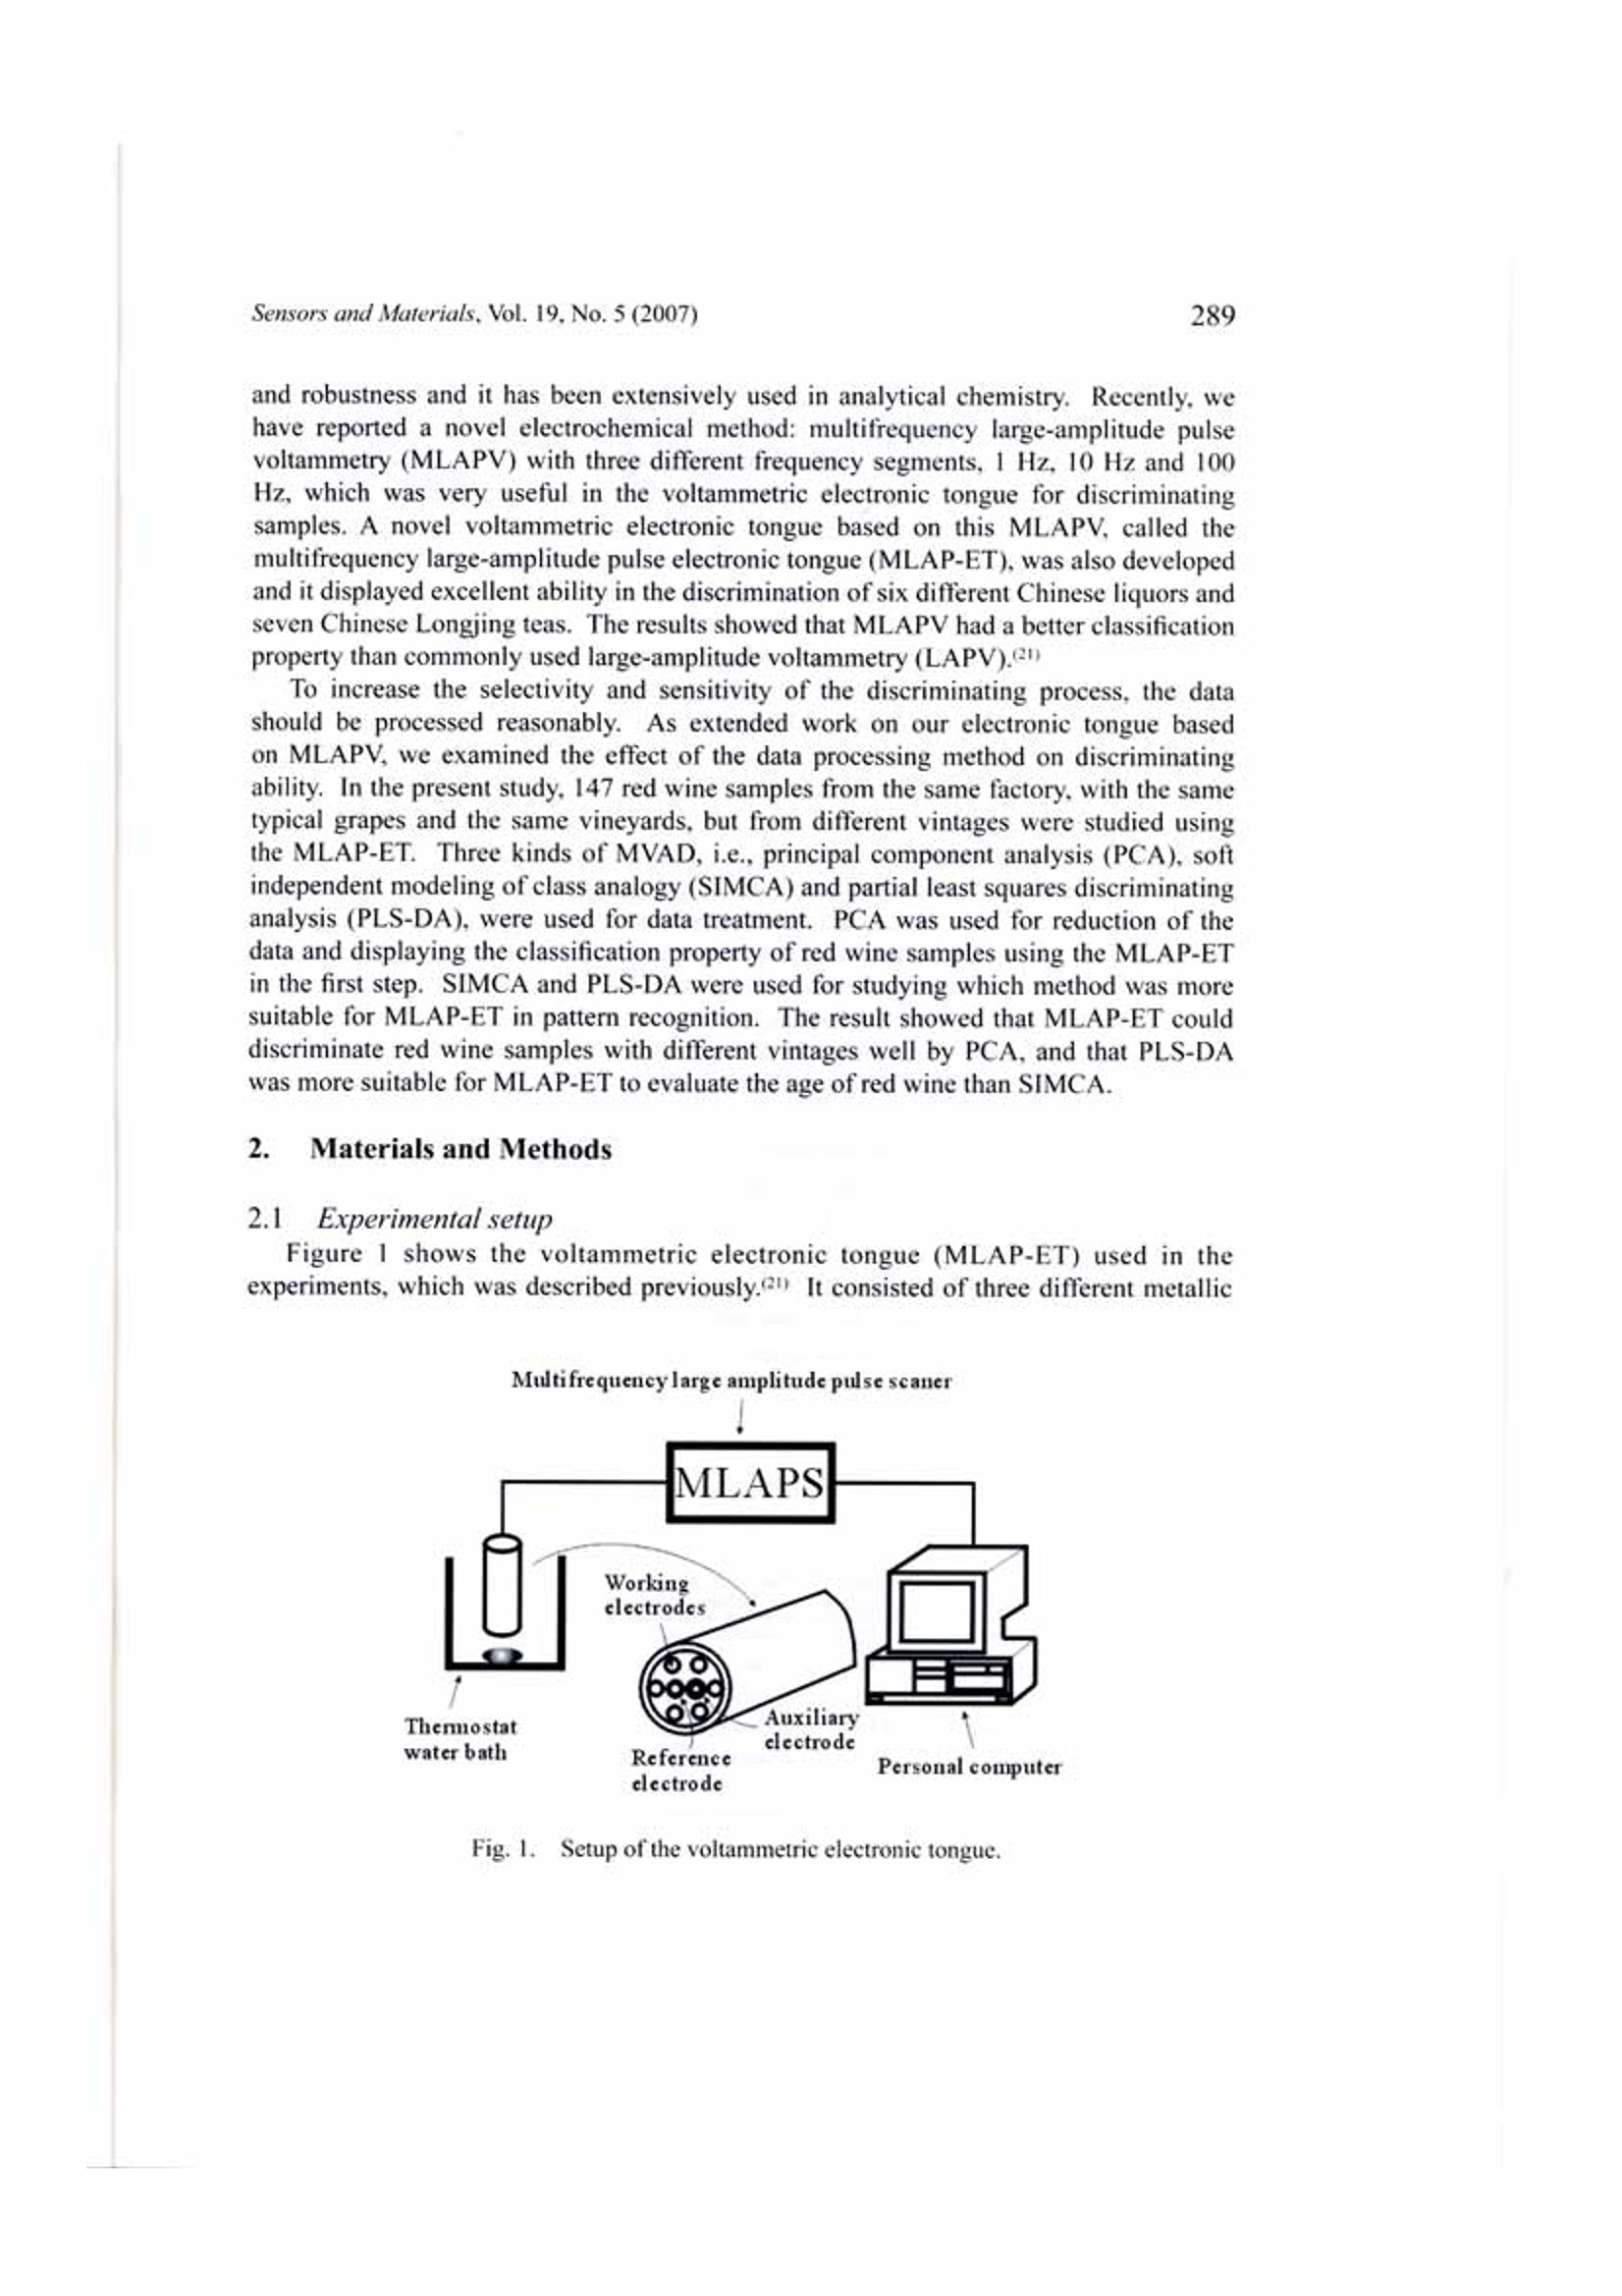
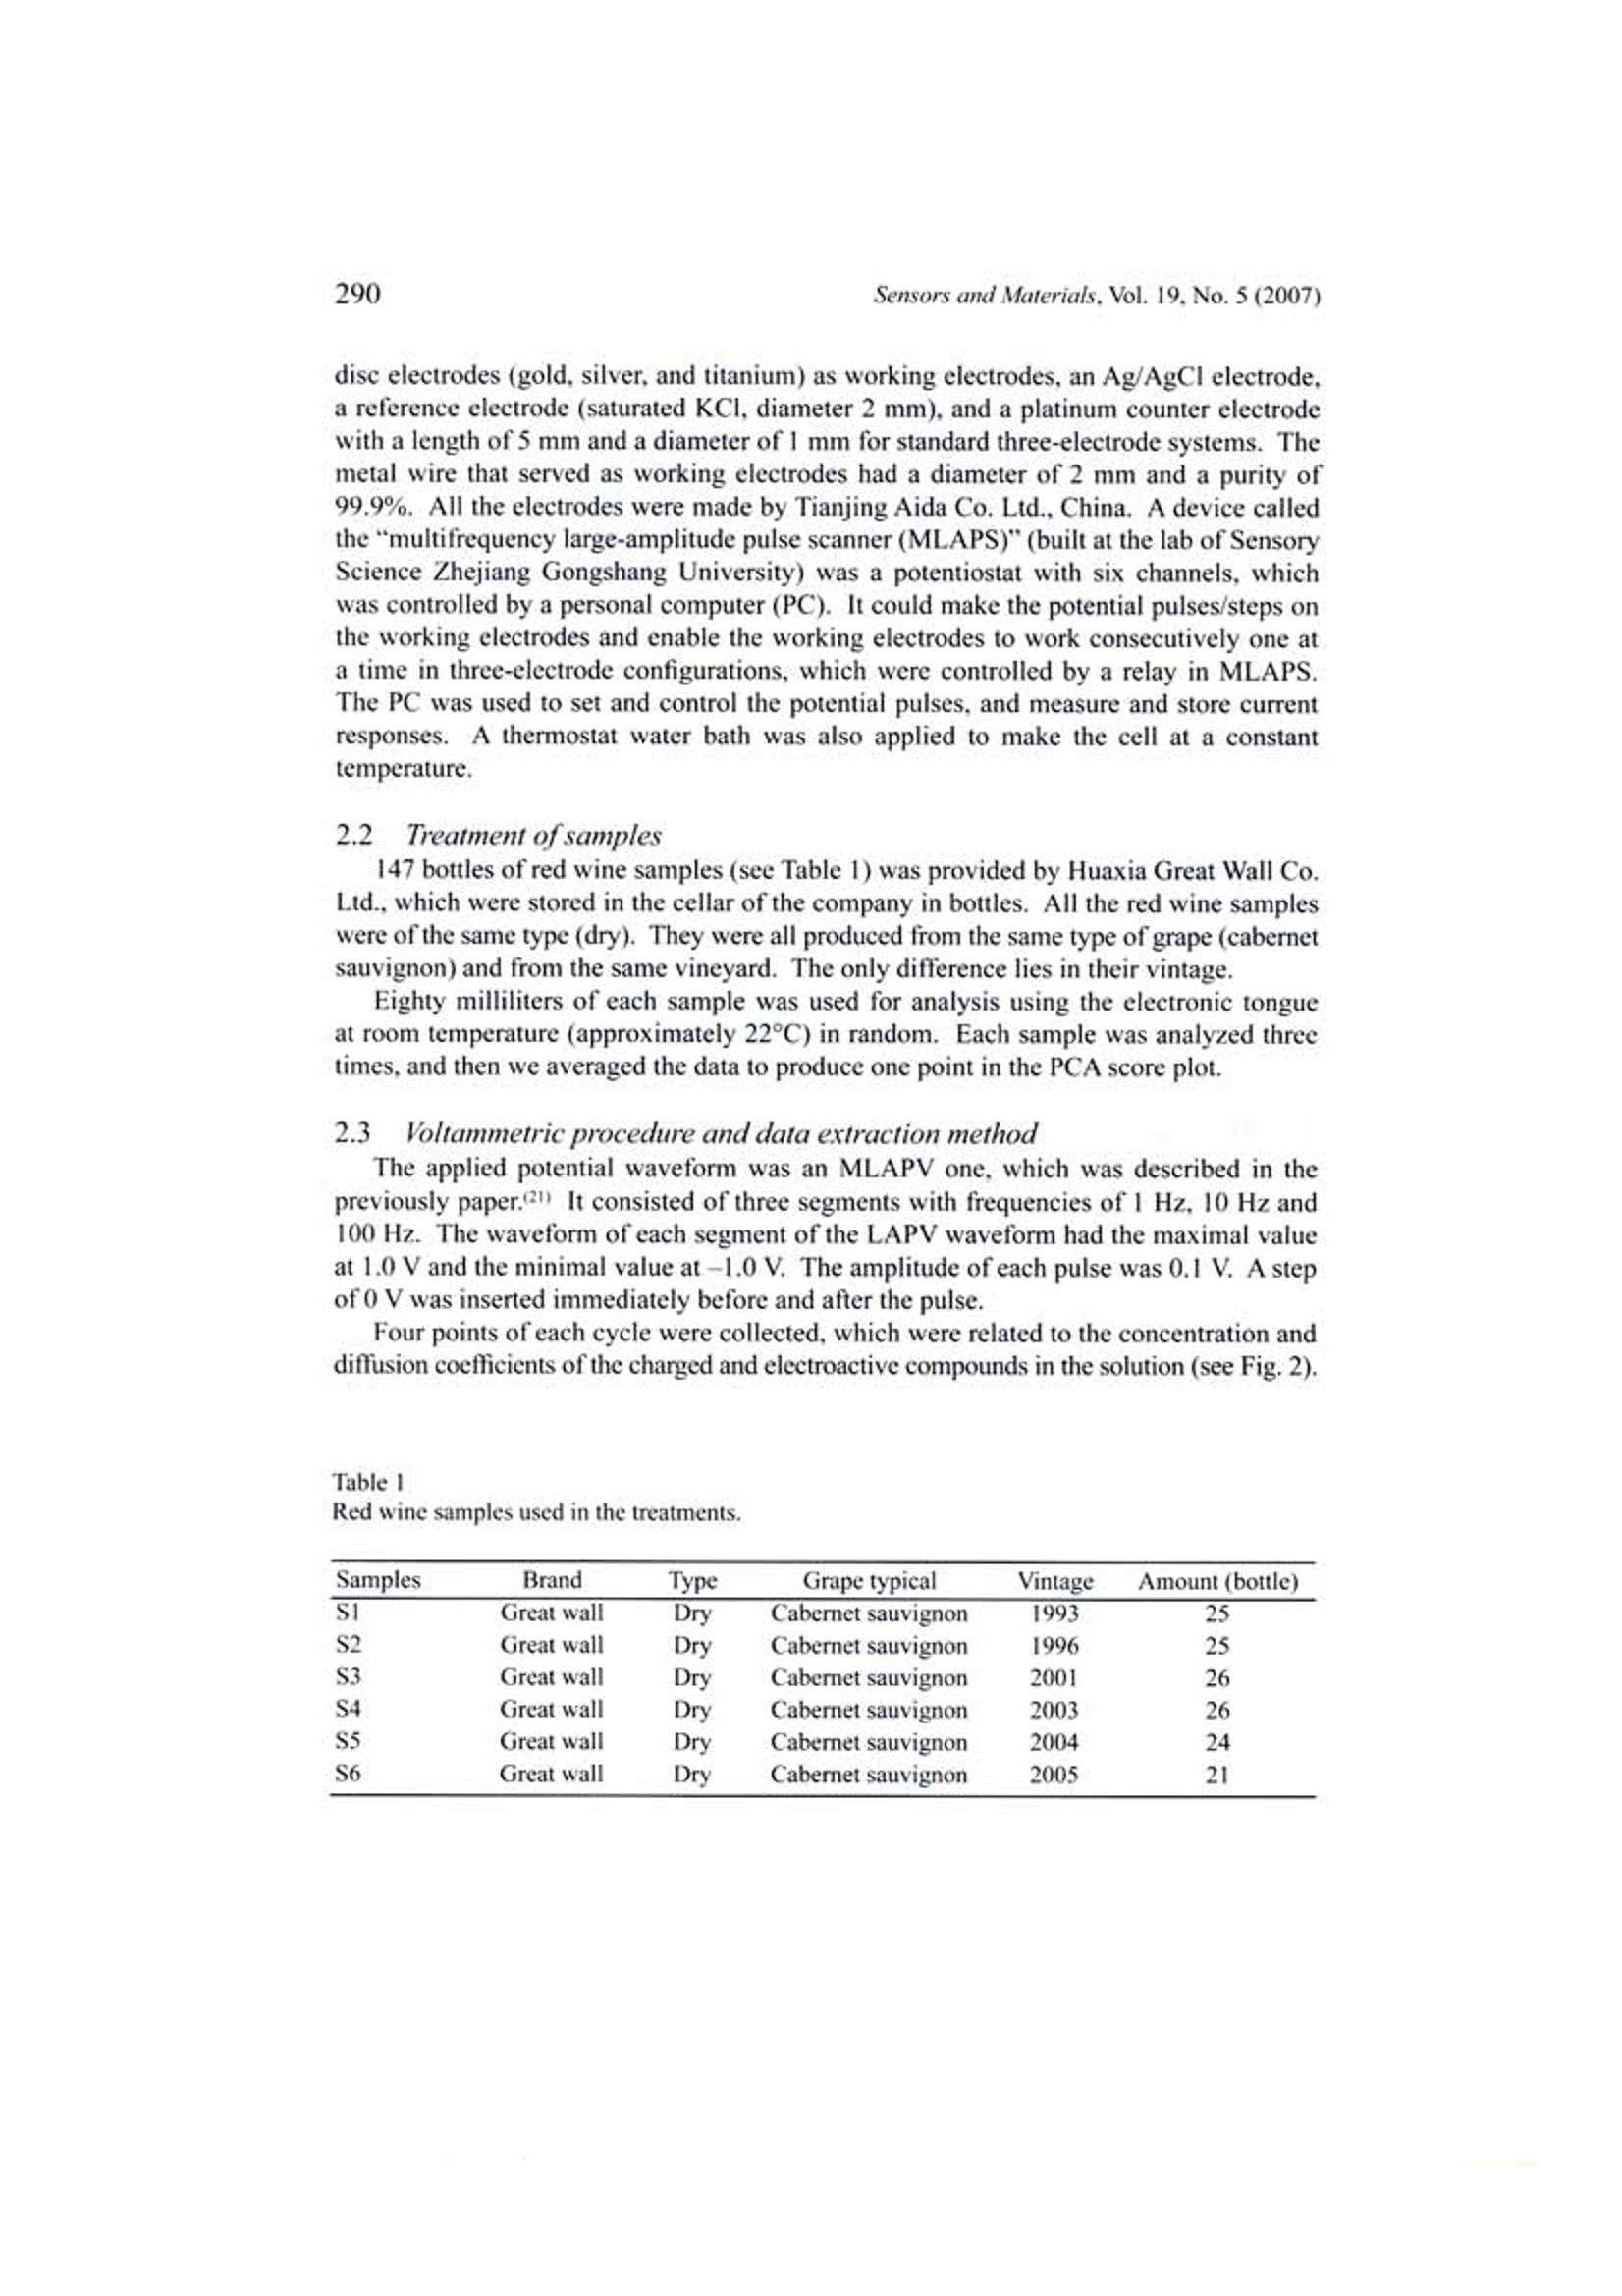
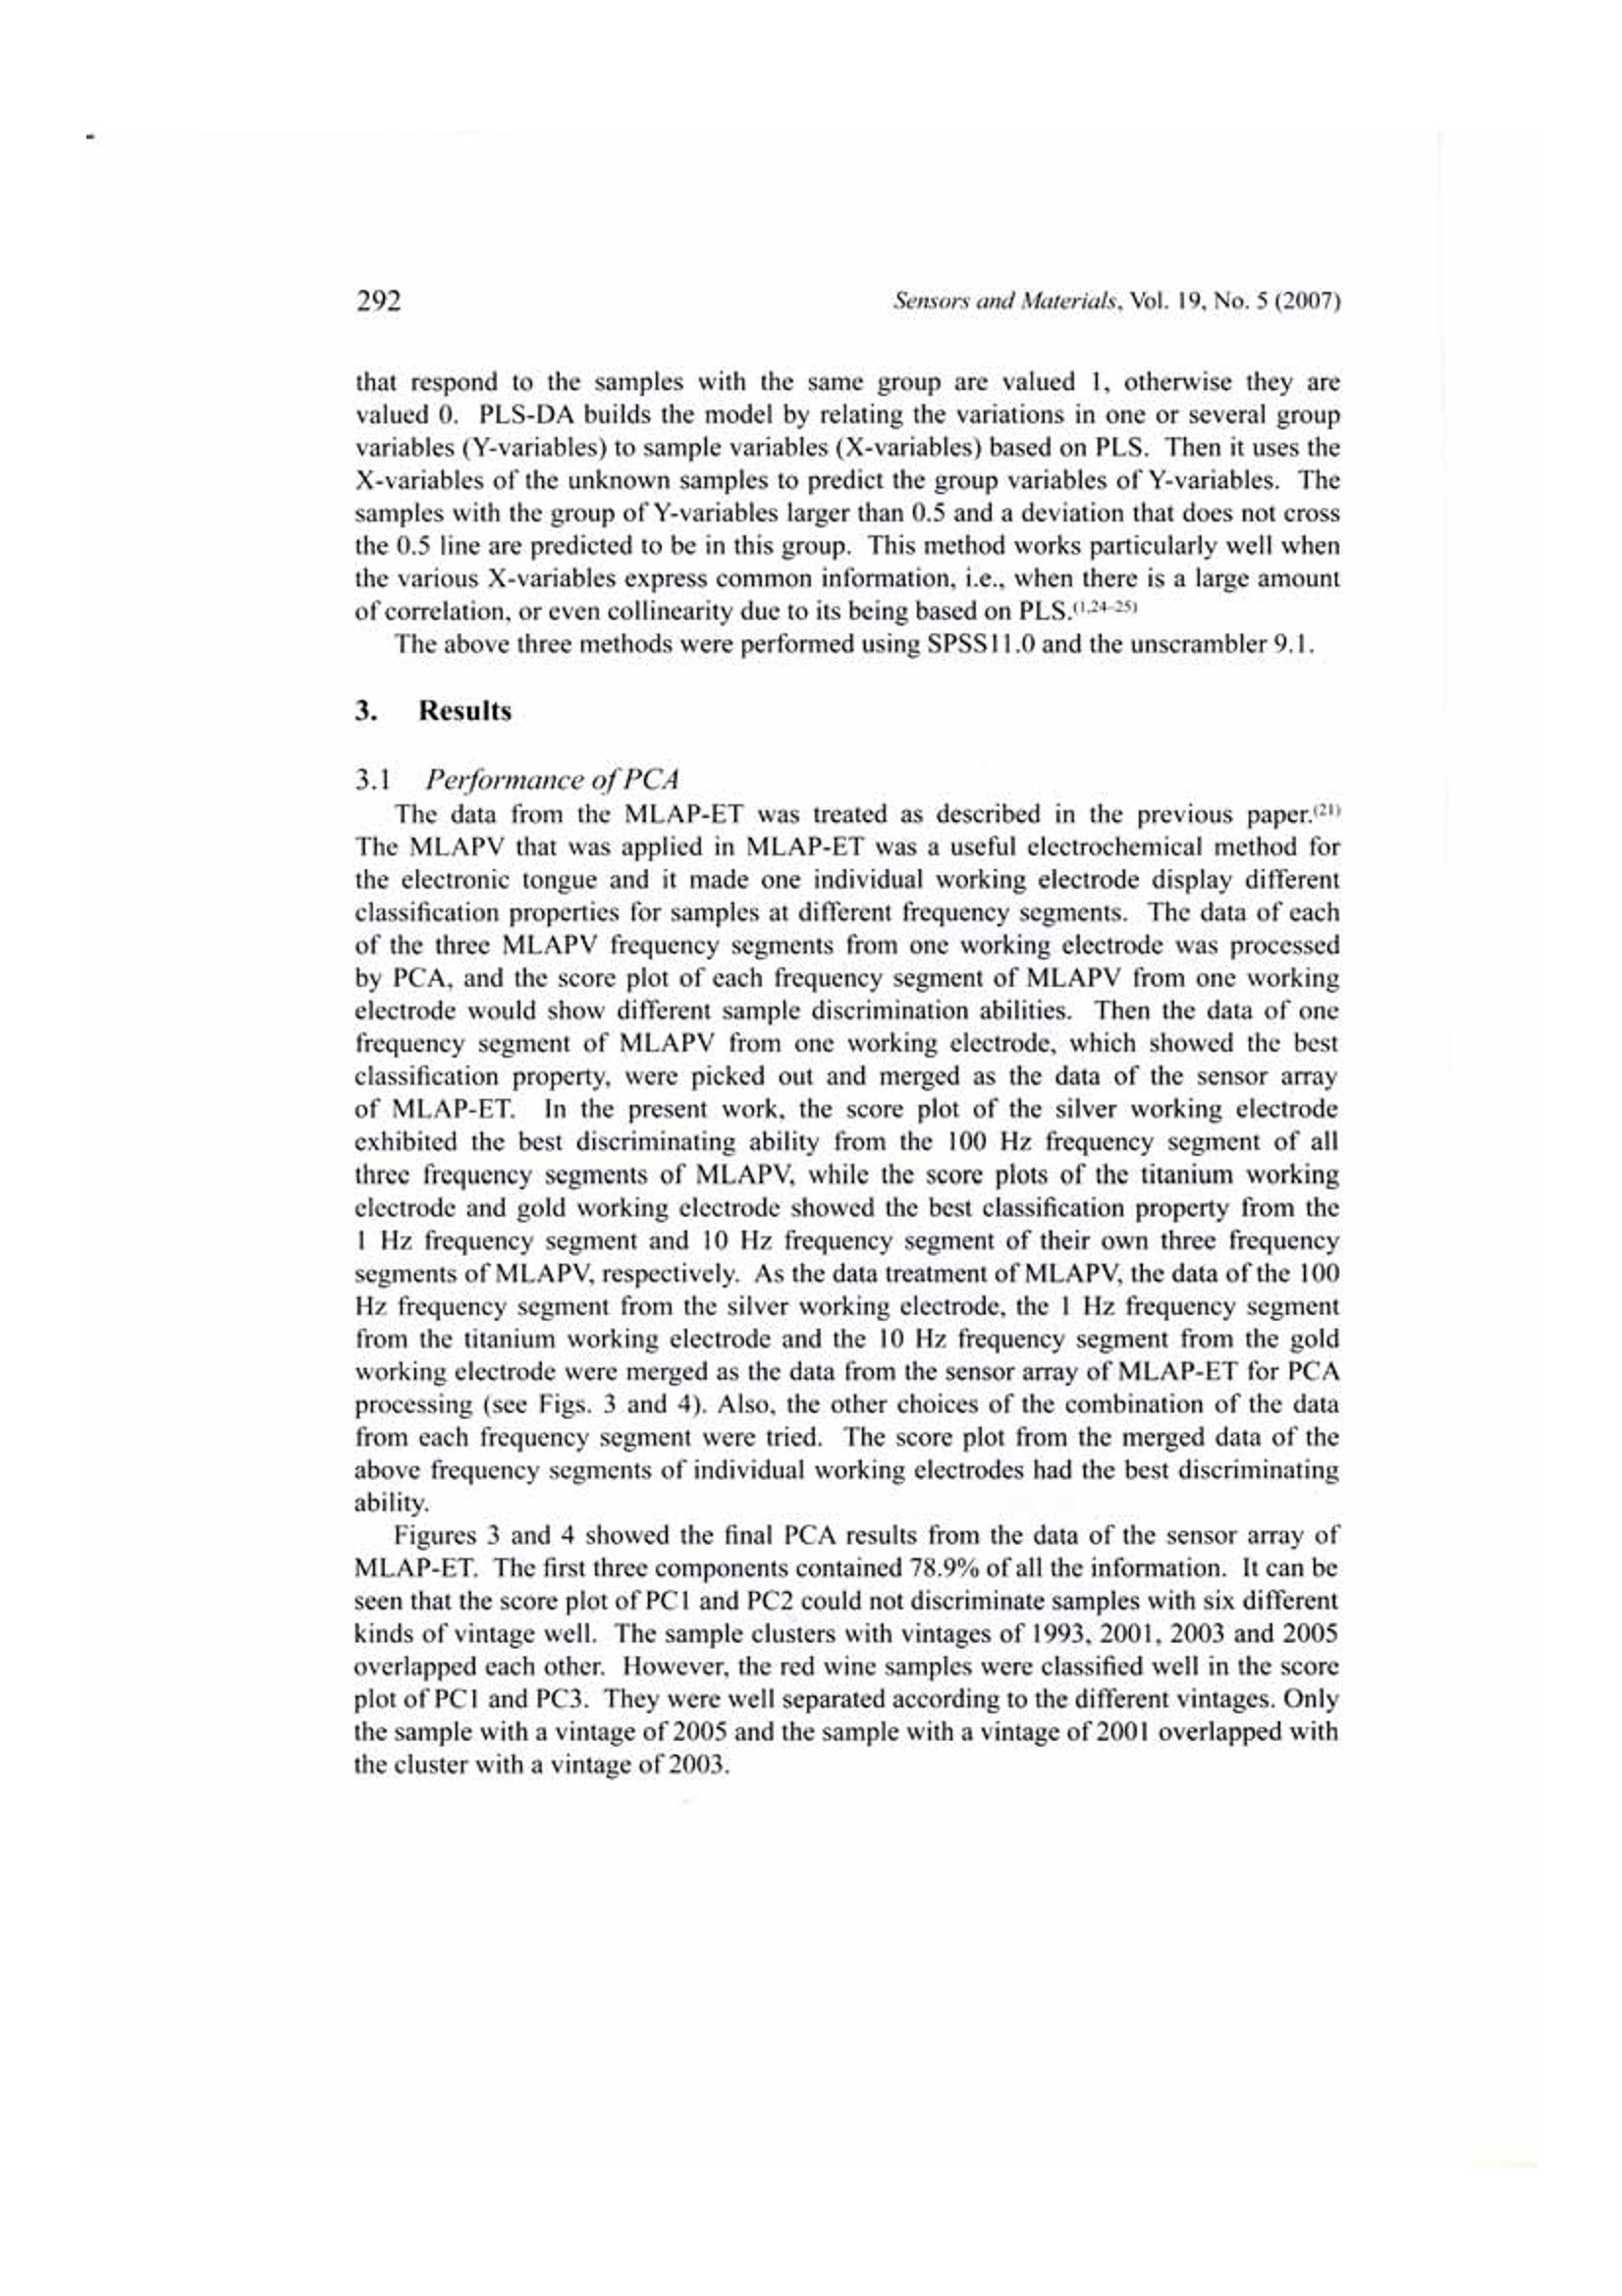
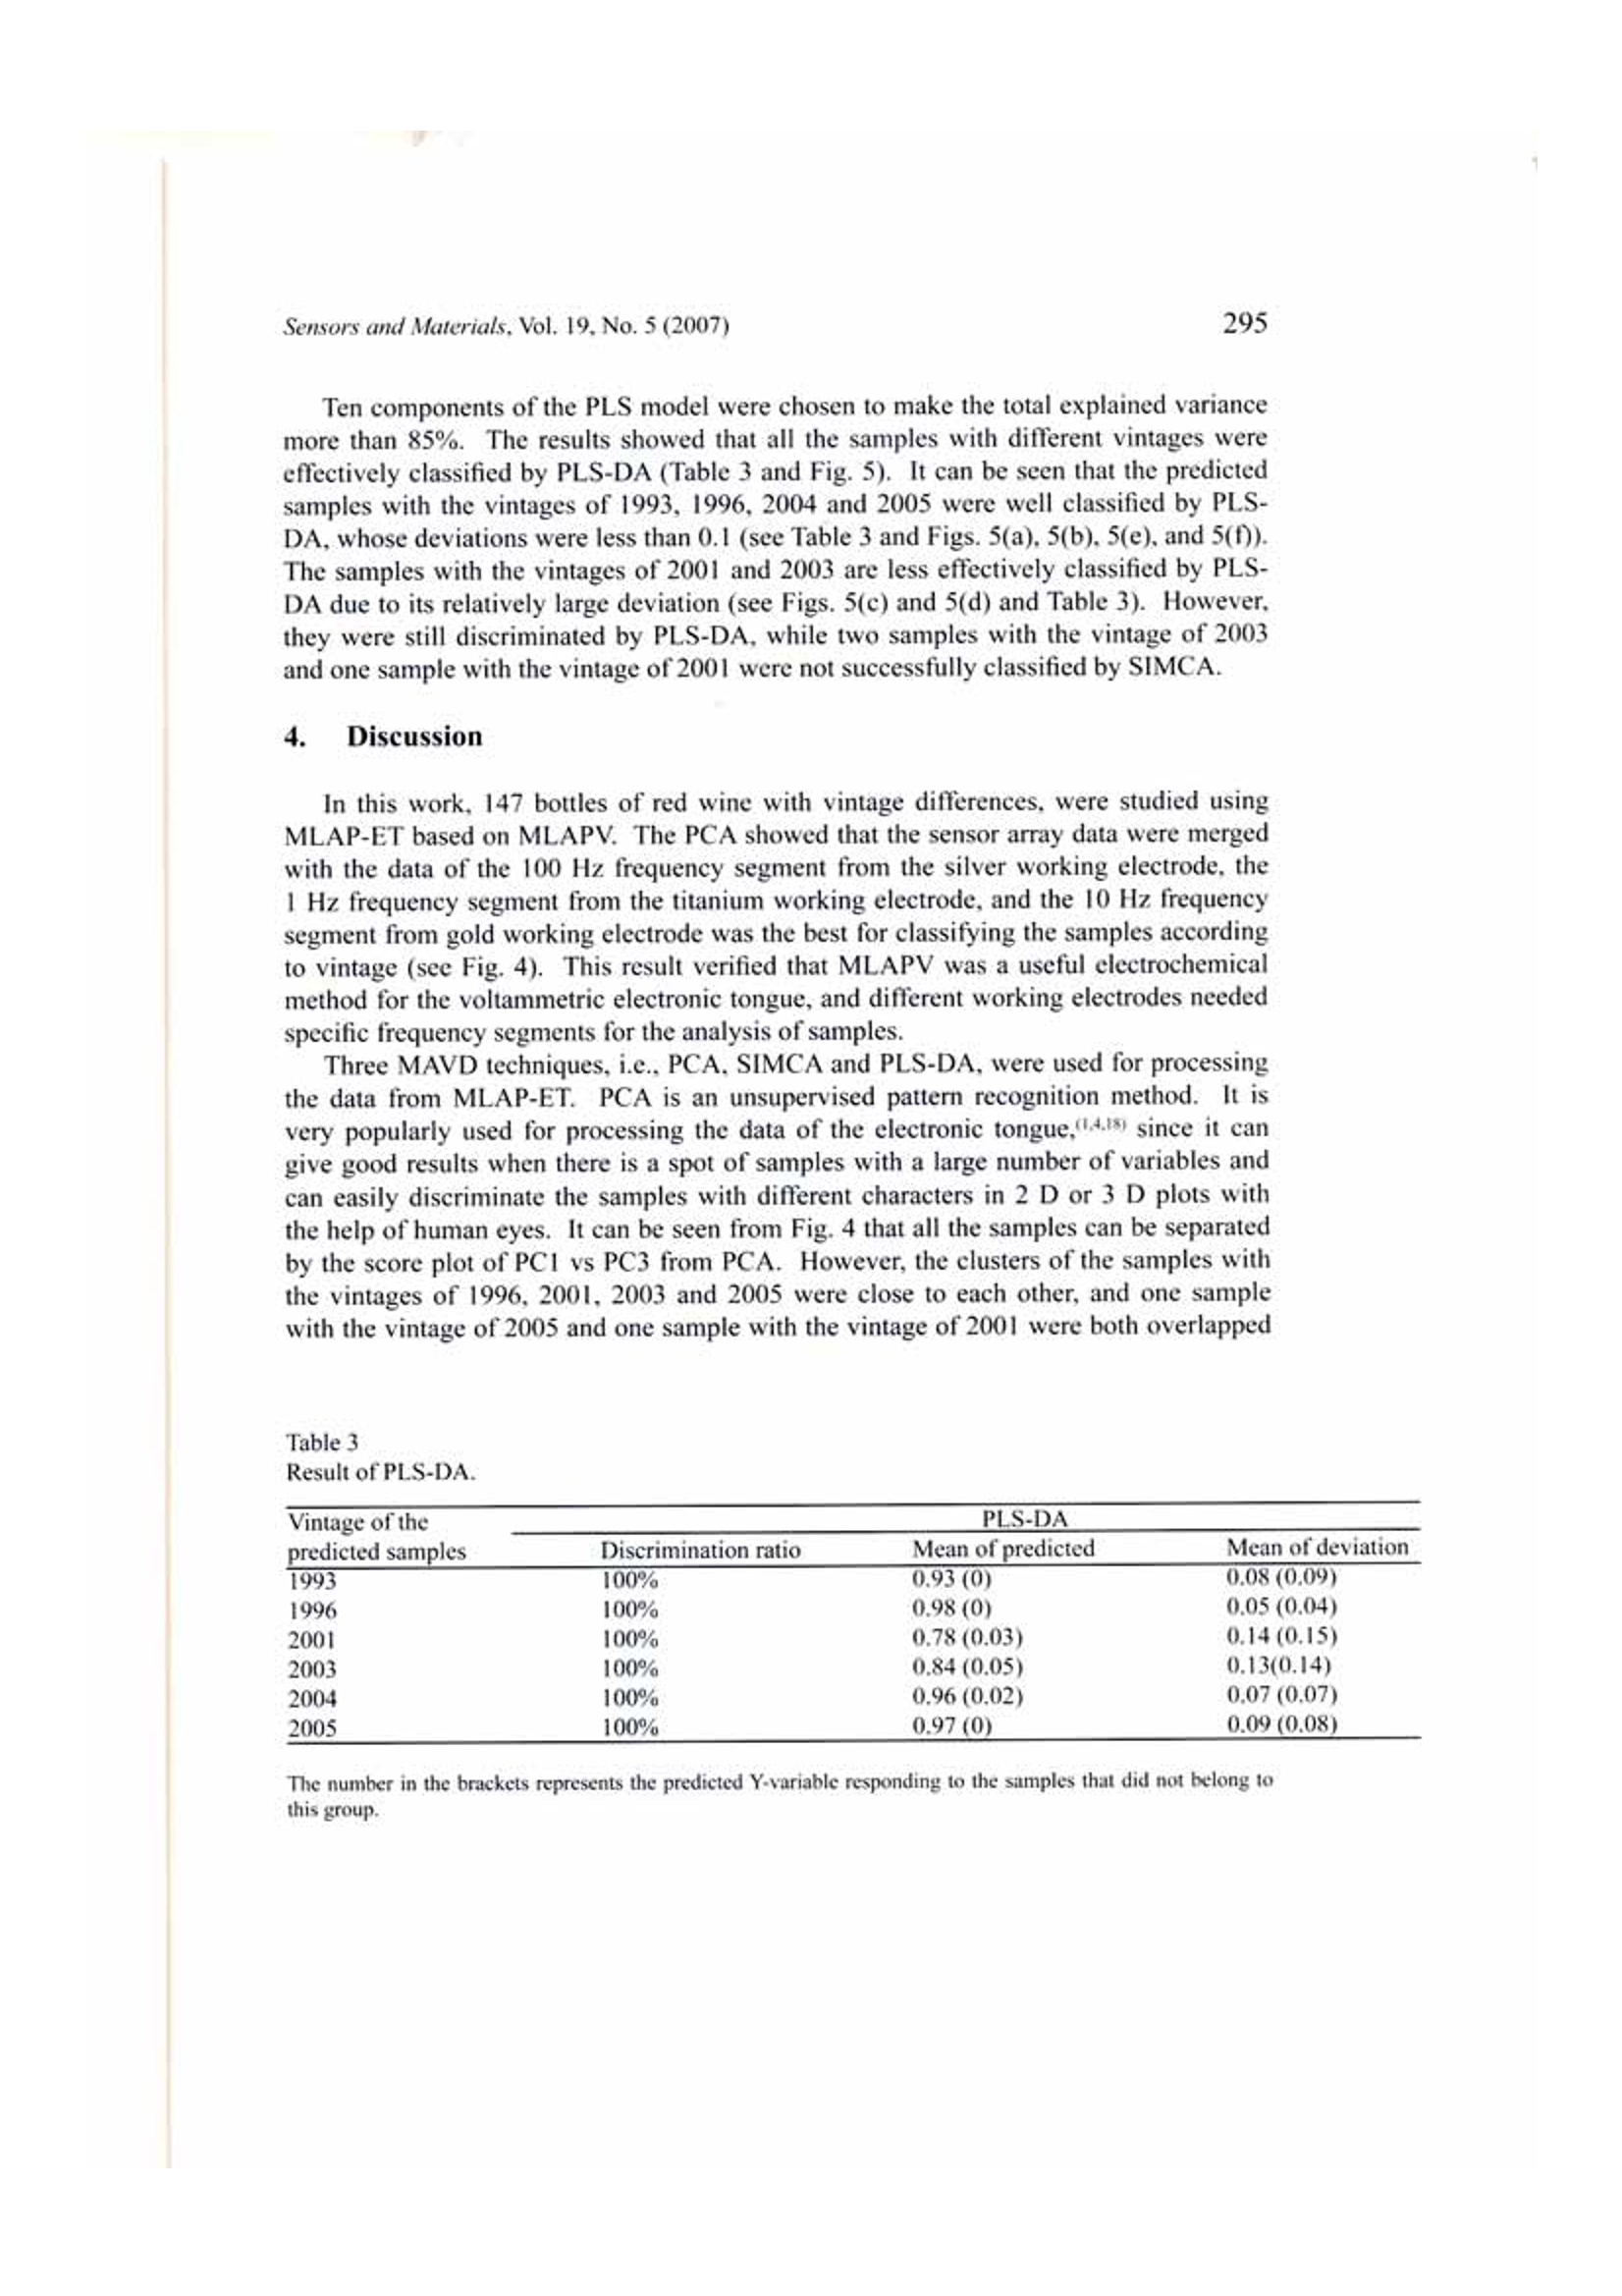
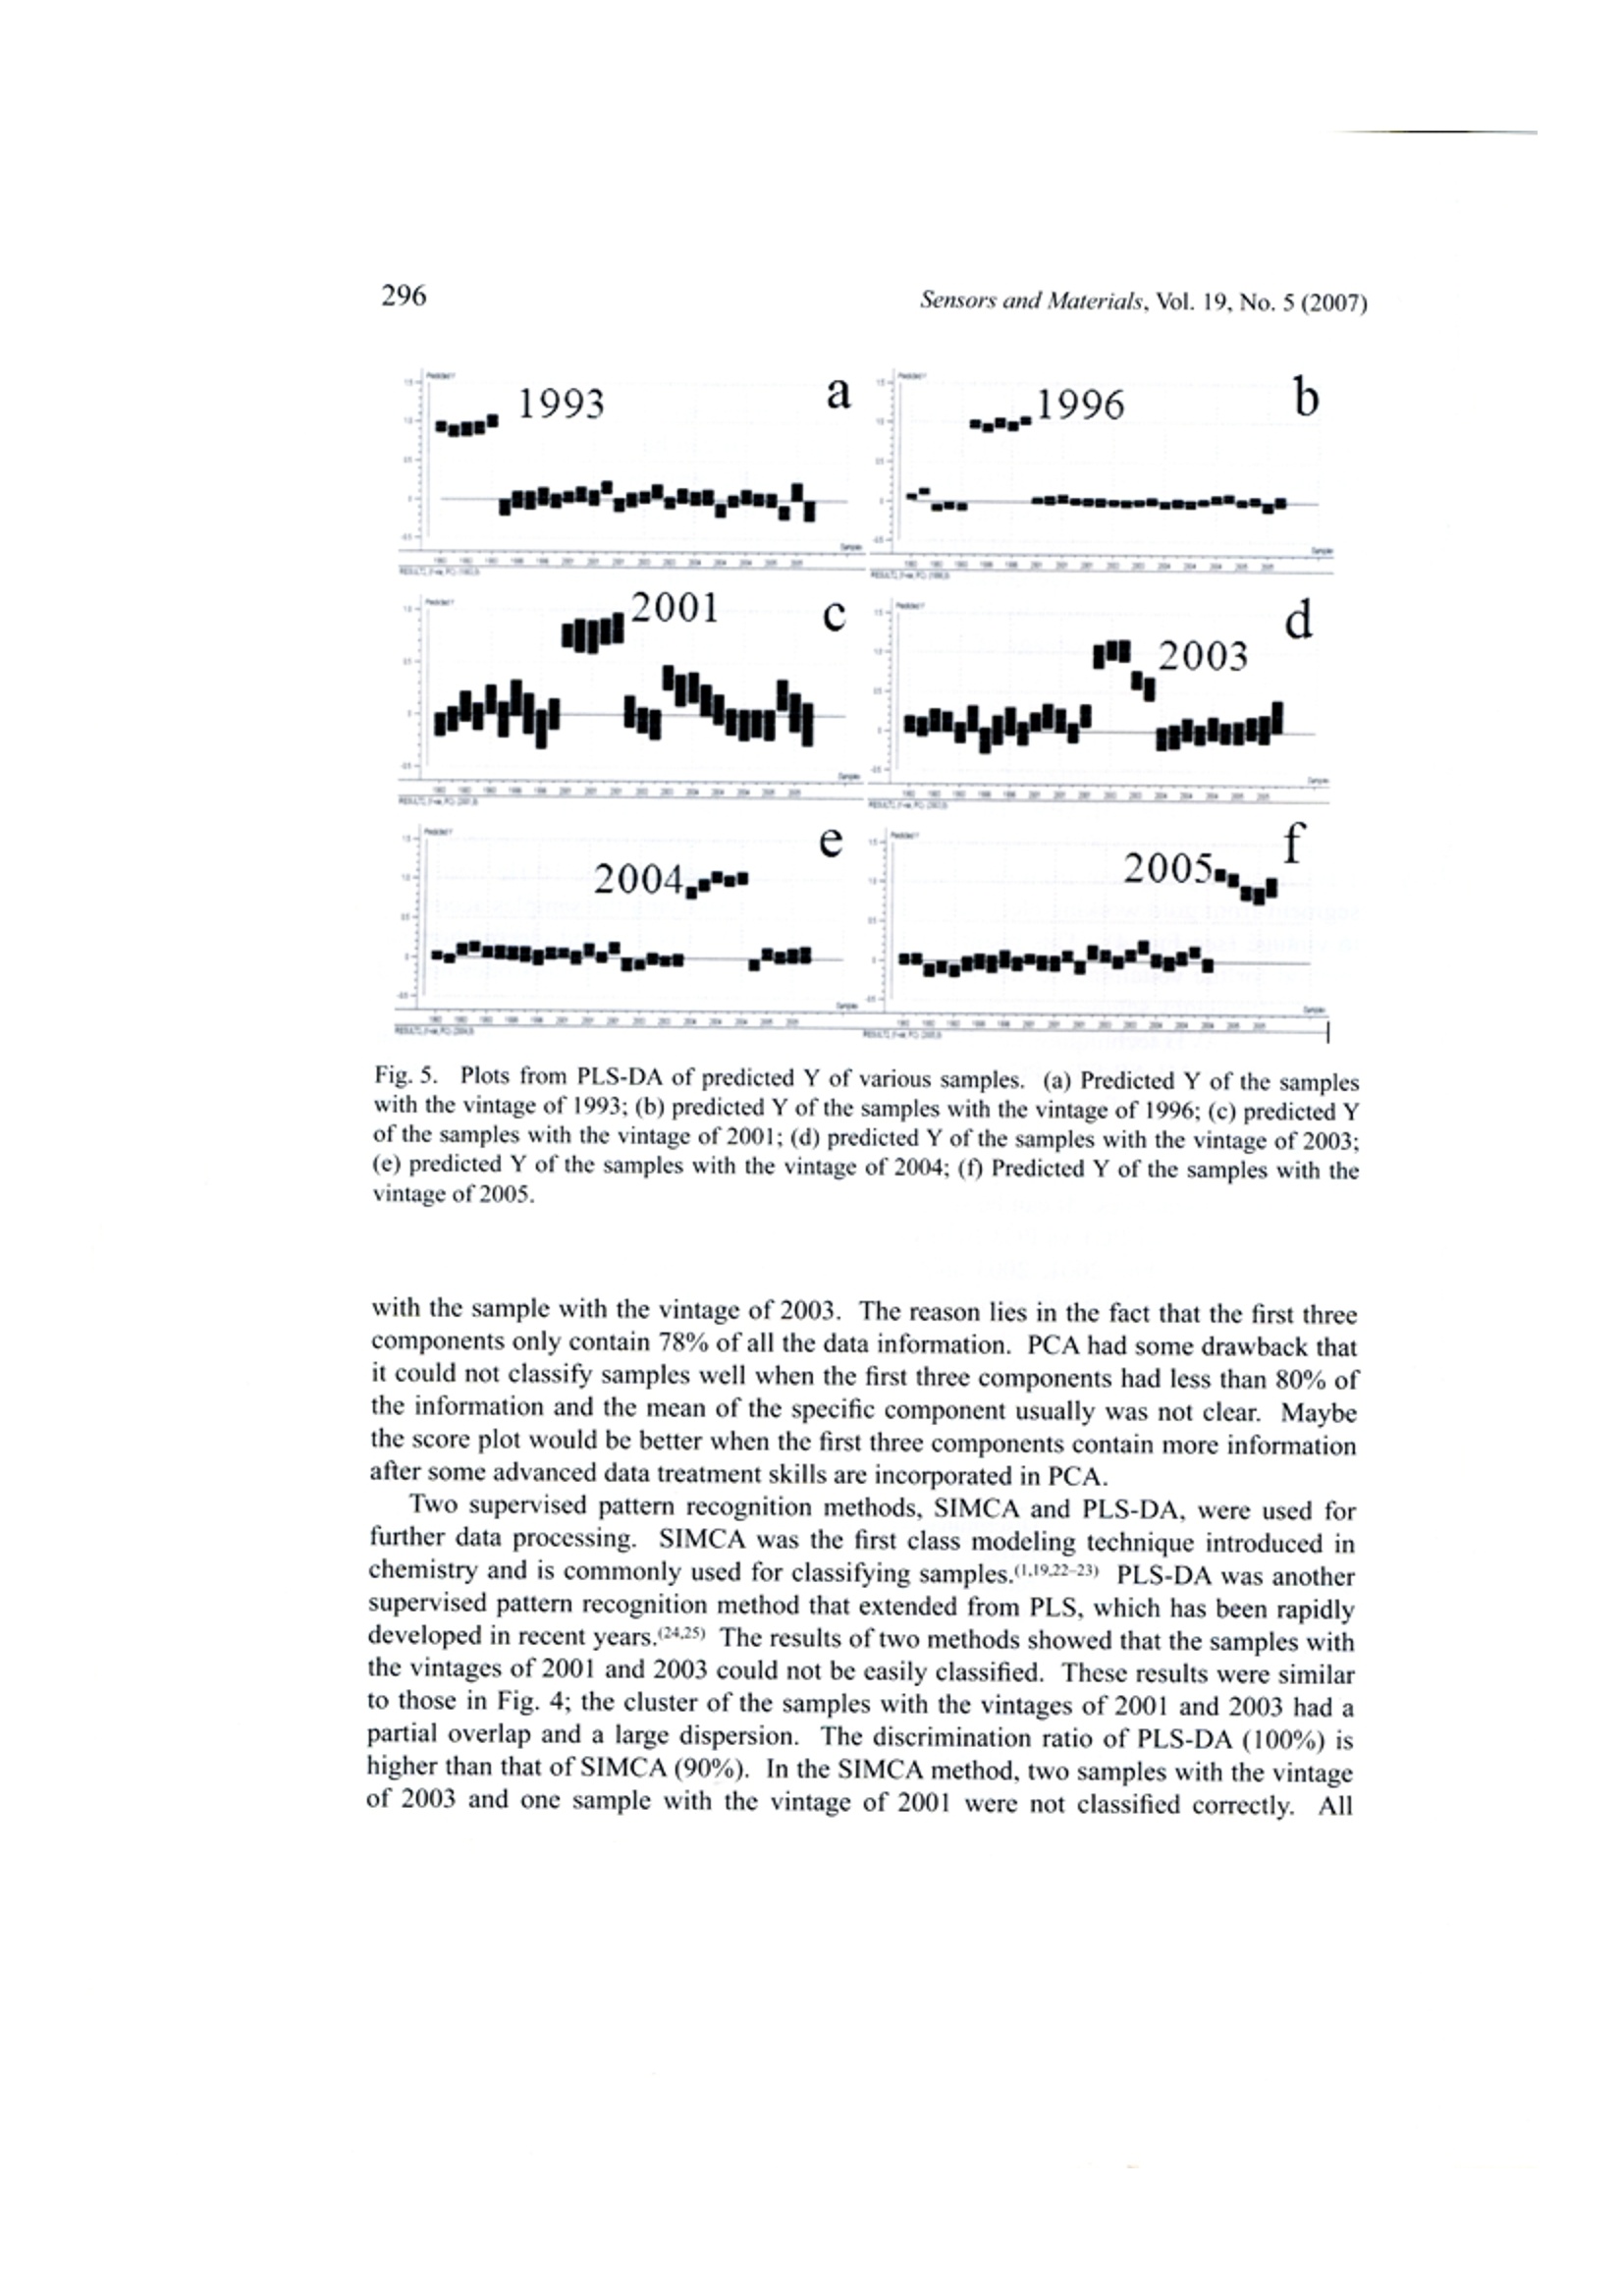
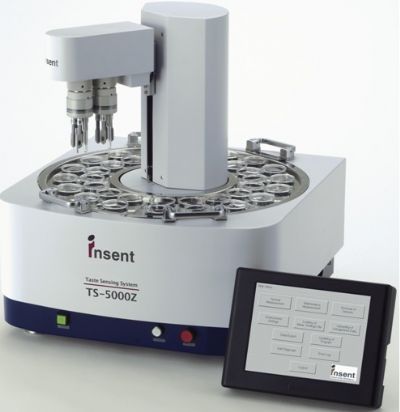
Sensors and Materials Vol.19.No. 5(2007) 287-298MYU TokyoS& M 0683 Sensors and Materials, Vol. 19, No.5(2007) 287-298MYU Tokyo Discrimination of Red Wine AgeUsing Voltammetric Electronic Tongue Based onMultifrequency Large-Amplitude VoltammetryAnd Pattern Recognition Method Shi-Yi Tian, Shao-Ping Deng, Chun-Hui Ding,Chun-Li Yin and Hua Li Food Sensory Science Labortory of Zhejiang Gongshang University, Food Safety Key Lab ofZhejiang Province, Zhejiang Gongshang University, Hangzhou 310035, P R. ChinaCollege of Enology. Northwest Science and Technology University of Agriculture and Forestry. Shaanxi, Yangling 712100, P R. China S & M 0683 Discrimination of Red Wine AgeUsing Voltammetric Electronic Tongue Based onMultifrequency Large-Amplitude VoltammetryAnd Pattern Recognition Method Shi-Yi Tian, Shao-Ping Deng,Chun-Hui Ding',Chun-Li Yinl and Hua Lil Food Sensory Science Laboratory of Zhejiang Gongshang University,Food Safety Key Lab ofZhejiang Province, Zhejiang Gongshang University, Hangzhou 310035, P. R. ChinaCollege of Enology, Northwest Science and Technology University of Agriculture and Forestry,Shaanxi, Yangling 712100. P. R. China (Received April 2, 2007; accepted May 1,2007) Key words:: electronic tongue, multifrequency large-amplitude voltammetry, multivariate dataanalysis, red wine Three methods of multivariate data analysis (MVAD), principal component analysis(PCA), soft independent modeling of class analogy (SIMCA) and partial least squaresdiscriminating analysis (PLS-DA), were used for processing data from a multifrequencylarge-amplitude pulse electronic tongue (MLAP-ET) in this paper. The dry red winesamples from the same company, produced by the same type of grape from the samevineyard, but with different vintages were studied using MLAP-ET. The results showedthat these three methods were all effective for the data treatment of MLAP-ET to assessthe vintage of red wine samples but differ in their discriminating ability. PLS-DA hadthe best classification property and was most suitable for processing the data fromMLAP-ET. 1. Introduction Although the traditional measurement technique in the food industry can be used todetermine a specific parameter such as the conductivity, viscosity, pH or concentrationof one component accurately, it has two obviously drawbacks;(i) one or several specificparameters cannot represent the integral quality of a complex food sample; for example,conductivity can only display the character of solutions’ resistance and pH can onlyreveal the content of solutions’ dissociated protons; (ii) generally, one instrument can ( C or resp o n di n g au th or : e-mail : spd en g @ zjg s u .e du. c n ) only give a specific parameter of the solution; thus, numerous instruments are needed forthe evaluation of one system. With the development of computer technology, multivariate data analysis (MVDA)has progressed considerably in the last two decades. A kind of analysis technique basedon MVDA has emerged, in which lots of information variables with low selectivity,and partial overlapping are collected and processed. These analysis techniques wereeffectively applied for evaluating the integral character of products in the food industry,instead of one or several specific parameters of the samples. One of the availableanalysis techniques based on MVDA is called electronic tongue analysis, which hasattracted great interest among researchers in recent years. The electronic tongue is amultisensor system, which consists of a number of low-selectivity sensors and usesadvanced mathematical procedures for signal processing based on pattern recognition(PARC) and/or multivariate analysis [artificial neural networks (ANNs), principalcomponent analysis (PCA), etc.]. It was a very good analysis tool for evaluatingsamples qualitatively and could replace the expert panelist for evaluating the qualityof products due to the high cost of hiring expert panelists. It could also be used forquantitative analysis, i.e., for predicting the concentrations of compounds in the samplesin some specific cases. Recently, several kinds of electronic tongue have been developed. These devicescould be classified into three types on the basis of the different electrochemicalmeasurement techniques, namely, potentiometry, impedance spectroscopy andvoltammetry. A device based on potential, called taste sensor, was first presented byToko. It was composed of several kinds of lipid/PVC membranes for transforming thetaste quality information, such as sweetness, bitterness, sourness, saltiness, or umamiinto an electric signal. Different types of food such as soy sauce, beer, coffee andmineral water were investigated using the taste sensor. Not only the differences in foodtype were identified but also the taste interactions, such as the suppression effect, weredetected.( ) Another type of potential electronic tongue was presented by Legin, whichwas configured by using several nonspecific sensors based on chalcogenide glassesas transducers. It has been used for the discrimination of various foodstuffs and theanalysis of some specific ions or species in solutions.(12) The second kind of electronictongue based on impedance spectroscopy was first described by Riul, in which thesensors were constructed using supramolecular thin films of conducting polymers with alipid-like material that were analyzed by impedance spectroscopy. This kind of electronictongue could distinguish different brands of beverages and detect the low levels of taste,inorganic contamination in water and the suppression of the sense of taste.(3-15) Thethird kind of electronic tongue based on voltammetry, was first designed by Winquist.(16)It comprised several metallic electrodes (platinum, gold, palladium, iridium, rheniumand rhodium) as working electrodes, an Ag/AgCl reference electrode and a stainless-steel electrode as a counter electrode for standard three-electrode systems. It has beensuccessfully used to analyze milk, tea, juice, drinking water and mold growth in liquidmedia.(17-20) Among the three types of devices mentioned above, the voltammetric electronictongue has some special advantages, such as very high sensitivity, versatility, simplicity and robustness and it has been extensively used in analytical chemistry. Recently. wehave reported a novel electrochemical method: multifrequency large-amplitude pulsevoltammetry (MLAPV) with three different frequency segments, 1 Hz, 10 Hz and 100Hz, which was very useful in the voltammetric electronic tongue for discriminatingsamples. A novel voltammetric electronic tongue based on this MLAPV, called themultifrequency large-amplitude pulse electronic tongue (MLAP-ET), was also developedand it displayed excellent ability in the discrimination of six different Chinese liquors andseven Chinese Longjing teas. The results showed that MLAPV had a better classificationproperty than commonly used large-amplitude voltammetry (LAPV).eD To increase the selectivity and sensitivity of the discriminating process, the datashould be processed reasonably. As extended work on our electronic tongue basedon MLAPV, we examined the effect of the data processing method on discriminatingability. In the present study, 147 red wine samples from the same factory, with the sametypical grapes and the same vineyards, but from different vintages were studied usingthe MLAP-ET. Three kinds of MVAD, i.e., principal component analysis (PCA), softindependent modeling of class analogy (SIMCA) and partial least squares discriminatinganalysis (PLS-DA), were used for data treatment. PCA was used for reduction of thedata and displaying the classification property of red wine samples using the MLAP-ETin the first step. SIMCA and PLS-DA were used for studying which method was moresuitable for MLAP-ET in pattern recognition. The result showed that MLAP-ET coulddiscriminate red wine samples with different vintages well by PCA, and that PLS-DAwas more suitable for MLAP-ET to evaluate the age of red wine than SIMCA. 2. Materials and Methods 2.1Experimental setup Figure 1 shows the voltammetric electronic tongue (MLAP-ET) used in theexperiments, which was described previously.D It consisted of three different metallic Fig. 1.Setup of the voltammetric electronic tongue. disc electrodes (gold, silver, and titanium) as working electrodes, an Ag/AgCl electrode,a reference electrode (saturated KCI, diameter 2 mm), and a platinum counter electrodewith a length of5 mm and a diameter of I mm for standard three-electrode systems. Themetal wire that served as working electrodes had a diameter of 2 mm and a purity of99.9%. All the electrodes were made by Tianjing Aida Co. Ltd., China. A device calledthe“multifrequency large-amplitude pulse scanner (MLAPS)" (built at the lab of SensoryScience Zhejiang Gongshang University) was a potentiostat with six channels, whichwas controlled by a personal computer (PC). It could make the potential pulses/steps onthe working electrodes and enable the working electrodes to work consecutively one ata time in three-electrode configurations, which were controlled by a relay in MLAPS.The PC was used to set and control the potential pulses, and measure and store currentresponses. A thermostat water bath was also applied to make the cell at a constanttemperature. 2.2 Treatment ofsamples 147 bottles of red wine samples (see Table 1) was provided by Huaxia Great Wall Co.Ltd., which were stored in the cellar of the company in bottles. All the red wine sampleswere of the same type (dry). They were all produced from the same type of grape (cabernetsauvignon) and from the same vineyard. The only difference lies in their vintage. Eighty milliliters of each sample was used for analysis using the electronic tongueat room temperature (approximately 22C) in random. Each sample was analyzed threetimes, and then we averaged the data to produce one point in the PCA score plot. 2.3 Voltammetric procedure and data extraction method The applied potential waveform was an MLAPV one, which was described in thepreviously paper. It consisted of three segments with frequencies of 1 Hz, 10 Hz and100 Hz. The waveform of each segment of the LAPV waveform had the maximal valueat 1.0 V and the minimal value at -1.0 V. The amplitude of each pulse was 0.1 V. A stepof 0V was inserted immediately before and after the pulse. Four points of each cycle were collected, which were related to the concentration anddiffusion coefficients of the charged and electroactive compounds in the solution (see Fig.2). Table 1Red wine samples used in the treatments. Samples Brand Type Grape typical Vintage Amount (bottle) S1 Great wall Dry Cabernet sauvignon 1993 25 S2 Great wall Dry Cabernet sauvignon 1996 25 S3 Great wall Dry Cabernet sauvignon 2001 26 S4 Great wall Dry Cabernet sauvignon 2003 26 S5 Great wall Dry Cabernet sauvignon 2004 24 S6 Great wall Dry Cabernet sauvignon 2005 21 Fig. 2. Method of extracting data from the original data of one segment of one working electrode. 2.4 Data processing method 2.4.1 Principal component analysis Principal component analysis (PCA) is a popular and useful MVDA method for theanalysis of experimental data.(48) It can decompose the experimental data matrix intolatent variables and explain the variables in data using the loading plot from the loadingvectors and the score plot from the score vectors. The loading plot could elucidate therelationships between the original variables and their influence on the system. The scoreplot displays the relationships between the samples of the experiments, and could beused for grouping and classifying the observations. 2.4.2 Soft independent modeling of class analogy Soft independent modeling of class analogy (SIMCA) is another kind of MAVD,which is popularly applied in pattern recognition.(1,1922-23) It builds a class model on thebasis of the principal component analysis of each separated category. Some parameterswould be obtained from the model of separated class samples, i.e., the number ofsignificant components “A", the mean standard deviation of each class “Se" and thedegree of freedom of each class, among others. These parameters are then used toclassify external samples (the prediction set) on the basis of the same variables. Ifappropriate, the model can then be used to classify unknown samples. 2.4.3 Partial least squares discriminating analysis Partial least squares discriminating analysis (PLS-DA) is a supervised patternrecognition method based on partial least squares (PLS). Y-variables could be set fordifferent groups. How many groups respond to how many Y-variables. The Y-variables that respond to the samples with the same group are valued 1, otherwise they arevalued 0. PLS-DA builds the model by relating the variations in one or several groupvariables (Y-variables) to sample variables (X-variables) based on PLS. Then it uses theX-variables of the unknown samples to predict the group variables of Y-variables. Thesamples with the group of Y-variables larger than 0.5 and a deviation that does not crossthe 0.5 line are predicted to be in this group. This method works particularly well whenthe various X-variables express common information, i.e., when there is a large amountof correlation, or even collinearity due to its being based on PLS.(.2425 The above three methods were performed using SPSS11.0 and the unscrambler 9.1. 3. Results 3.1 Performance ofPCA The data from the MLAP-ET was treated as described in the previous paper.?)The MLAPV that was applied in MLAP-ET was a useful electrochemical method forthe electronic tongue and it made one individual working electrode display differentclassification properties for samples at different frequency segments. The data of eachof the three MLAPV frequency segments from one working electrode was processedby PCA, and the score plot of each frequency segment of MLAPV from one workingelectrode would show different sample discrimination abilities. Then the data of onefrequency segment of MLAPV from one working electrode, which showed the bestclassification property, were picked out and merged as the data of the sensor arrayof MLAP-ET. In the present work, the score plot of the silver working electrodeexhibited the best discriminating ability from the 100 Hz frequency segment of allthree frequency segments of MLAPV, while the score plots of the titanium workingelectrode and gold working electrode showed the best classification property from the1 Hz frequency segment and 10 Hz frequency segment of their own three frequencysegments ofMLAPV,respectively. As the data treatment of MLAPV, the data of the 100Hz frequency segment from the silver working electrode, the 1 Hz frequency segmentfrom the titanium working electrode and the 10 Hz frequency segment from the goldworking electrode were merged as the data from the sensor array of MLAP-ET for PCAprocessing (see Figs. 3 and 4). Also, the other choices of the combination of the datafrom each frequency segment were tried. The score plot from the merged data of theabove frequency segments of individual working electrodes had the best discriminatingability. Figures 3 and 4 showed the final PCA results from the data of the sensor array ofMLAP-ET. The first three components contained 78.9% of all the information. It can beseen that the score plot of PC1 and PC2 could not discriminate samples with six differentkinds of vintage well. The sample clusters with vintages of 1993, 2001, 2003 and 2005overlapped each other. However, the red wine samples were classified well in the scoreplot of PCI and PC3. They were well separated according to the different vintages. Onlythe sample with a vintage of 2005 and the sample with a vintage of 2001 overlapped withthe cluster with a vintage of 2003. Fig. 3.3.5Scope plot from MLAP-ETby PCI vs PC2. Fig. 4. Score plot from MLAP-ET by PC1 vs PC3. Sensors and Materials, Vol. 19. No.5 (2007) 3.2 Performance of SIMCA The PCA results showed that MLAP-ET can classify red wine samples accordingto their vintage. PCA was a simple unsupervised pattern recognition method and it ispopularly used because it can be used when samples are few. However, supervisedpattern recognition methods were needed when the electronic tongue was applied inindustry. SIMCA as a supervised recognition method was used. Also, the data of eachsample obtained using MLAP-ET was the same as that obtained by PCA. In the SIMCA procedure, the data of five samples of every vintage were selected atrandom as the test samples for classification. Thus, 20 samples with vintages of 1993and 1996.21 samples with vintages of 2001 and 2003,19 samples with a vintage of2004 and 16 samples with a vintage of 2005 remained for building the SIMCA models.Seven components for the model of the samples with the vintages of 1993 and 1996,5 components for the model of the samples with the vintages of 2001 and 2005, 4components for the model of the samples with the vintages of 2003 and 6 componentsfor the model of the samples with the vintage of 2004 were chosen, to make the totalexplained variance more than 85%. The results of the classification of test samplesare shown in Table 2. Two samples with the vintage of 2003 and one sample with thevintage of 2001 were incorrectly classified to be the model of the samples of 2001 andthe model of the samples of 2003, respectively. Compared with those in Fig. 4, thesamples with the vintage of 2001 overlapped with the samples of the vintage of 2003.However. the SIMCA method discriminated the samples with the vintage of 2005 well,while one sample with the vintage of 2005 was overlapped with the cluster with thevintage of 2003. 3.3 Performance ofPLS-DA PLS-DA as another supervised pattern recognition method was also used for theclassification of samples with different vintages. The x-variables of the samplesfor building models and predicting groups were the same as those for SIMCA. Sixy-variables were created for the presented six groups with different vintages, which werelabeled 1993.1996.2001.2003.2004 and 2005, respectively. The y-variables of thesamples with the same vintage were assigned 1, otherwise they were assigned 0. Table 2Results of SIMCA in the significance limited of 5%. Name Vintage of the predicted samples of models 1993 1996 2001 2003 2004 1993 凉 1996 2001 东 水 2003 2004 Ten components of the PLS model were chosen to make the total explained variancemore than 85%. The results showed that all the samples with different vintages wereeffectively classified by PLS-DA (Table 3 and Fig.5). It can be seen that the predictedsamples with the vintages of 1993, 1996, 2004 and 2005 were well classified by PLS-DA, whose deviations were less than 0.1 (see Table 3 and Figs.5(a).5(b). 5(e),and 5(1)).The samples with the vintages of 2001 and 2003 are less effectively classified by PLS-DA due to its relatively large deviation (see Figs. 5(c) and 5(d) and Table 3). However.they were still discriminated by PLS-DA, while two samples with the vintage of 2003and one sample with the vintage of 2001 were not successfully classified by SIMCA. 4. Discussion In this work. 147 bottles of red wine with vintage differences, were studied usingMLAP-ET based on MLAPV. The PCA showed that the sensor array data were mergedwith the data of the 100 Hz frequency segment from the silver working electrode, the1 Hz frequency segment from the titanium working electrode, and the 10 Hz frequencysegment from gold working electrode was the best for classifying the samples accordingto vintage (see Fig. 4). This result verified that MLAPV was a useful electrochemicalmethod for the voltammetric electronic tongue, and different working electrodes neededspecific frequency segments for the analysis of samples. Three MAVD techniques, i.e.. PCA, SIMCA and PLS-DA, were used for processingthe data from MLAP-ET. PCA is an unsupervised pattern recognition method. It isvery popularly used for processing the data of the electronic tongue,4since it cangive good results when there is a spot of samples with a large number of variables andcan easily discriminate the samples with different characters in 2 D or 3 D plots withthe help of human eyes. It can be seen from Fig. 4 that all the samples can be separatedby the score plot of PC1 vs PC3 from PCA. However, the clusters of the samples withthe vintages of 1996,2001, 2003 and 2005 were close to each other, and one samplewith the vintage of 2005 and one sample with the vintage of 2001 were both overlapped Table 3 Result of PLS-DA. Vintage of the PLS-DA predicted samples Discrimination ratio Mean of predicted Mean of deviation 1993 100% 0.93 (0) 0.08(0.09) 1996 100% 0.98(0) 0.05(0.04) 2001 100% 0.78(0.03) 0.14(0.15) 2003 100% 0.84(0.05) 0.13(0.14) 2004 100% 0.96(0.02) 0.07(0.07) 2005 100% 0.97(0) 0.09(0.08) ( The n umbe r i n th e bracke t s r ep r es e n t s the p r e dict e d Y- v ariable res p onding t o th e s a m p les t h at d i d not belong to thi s gro up . ) Fig.5.Plots from PLS-DA of predicted Y of various samples. (a) Predicted Y of the sampleswith the vintage of 1993;(b) predicted Y of the samples with the vintage of 1996; (c) predicted Yof the samples with the vintage of 2001;(d) predicted Y of the samples with the vintage of 2003;(e) predicted Y of the samples with the vintage of 2004;(f) Predicted Y of the samples with thevintage of2005. with the sample with the vintage of 2003. The reason lies in the fact that the first threecomponents only contain 78% of all the data information. PCA had some drawback thatit could not classify samples well when the first three components had less than 80% ofthe information and the mean of the specific component usually was not clear. Maybethe score plot would be better when the first three components contain more informationafter some advanced data treatment skills are incorporated in PCA. Two supervised pattern recognition methods, SIMCA and PLS-DA, were used forfurther data processing. SIMCA was the first class modeling technique introduced inchemistry and is commonly used for classifying samples.(1.19.22-23) PLS-DA was anothersupervised pattern recognition method that extended from PLS, which has been rapidlydeveloped in recent years.(24.25) The results of two methods showed that the samples withthe vintages of 2001 and 2003 could not be easily classified. These results were similarto those in Fig. 4; the cluster of the samples with the vintages of 2001 and 2003 had apartial overlap and a large dispersion. The discrimination ratio of PLS-DA (100%) ishigher than that of SIMCA(90%). In the SIMCA method, two samples with the vintageof 2003 and one sample with the vintage of 2001 were not classified correctly. All the results showed that PLS-DA was more effective here. The reason may be that theapplied waveform MLAPV was designed to promote the interaction of potential pulseswith each other to produce new information, and the data derived from MLAPV whichchanged the length of the large-amplitude pulse voltammetry (LAPV) signal contain a lotof nonlinear information. It is well known that PLS is more effective for nonlinear dataprocessing than PCA;0425)thus, PLS-DA pattern recognition based on PLS shows a betterdiscriminating ability than SIMCA, which is based on PCA. The analysis of the vintageof red wine herein showed that PLS-DA was more suitable than SIMCA for MLAP-ETdata processing. Further work is needed to extend this method to the evaluation of moresamples, and investigate other nonlinear data processing methods for MLAP-ET. Acknowledgement The project was supported by the Science and Technology Department of ZhejiangProvince (Grant No.2006c23082). The authors gratefully acknowledge Hua Xia GreatWall Co., Ltd. for providing the red wine samples for the experiment, Xiao-Ping Wang(Zhejiang University) for the technical support for hardware fabrication and adjustmentsand Zhong-Xiu Chen (Zhejiang Gongshang University) for lots of useful advice. References ( 1 Y u . V l as ov , A. L e gin, A. R udn i t s k a y a , C. D i n at a l e an d A. D ' am ic o: Pur e A p pl . C h em . 7 7 ( 2 0 0 5) 1 9 6 5 . ) 2S. liyama, S. Ezaki, K. Toko, T. Matsuno and K. Yamafuji: Sens. Actuators B 24 (1995) 75.345679 K. Toko: Sens. Actuators B 64(2000) 205. ( H . Y a m ad a , Y . Mi zot a . K . T o ko an d T . D oi : M at e r . S ci . E n g. C 5( 19 97) 41 . ) ( S . l i y a ma, M . Y a h i ro an d K. T o k o : S e ns. Ac t u a to r s B 66 (2 0 0 0 )2 0 5 . ) ( H. S aka i , S. li ya ma a nd K. T o k o : Sens. A c t u a to r s B 66( 20 0 0 ) 2 5 1. ) ( M . H ab a ra. H . I k ezak i a n d K. T o k o: Bio se n s. Bi o c lec tron. 19 (2 0 04 )15 5 9 . ) ( Y. V la s ov, A . L e gi n a n d A . R u dn i ts k a y a : Sen s. Ac tuato r s B 4 4 ( 1 9 97) 5 32 . ) A. Legin, A. Rudnitskaya, Y. Vlasov, C. D. Natale, F. Davide and A. D'Amico: Sens.Actuators B 44 (1997) 291. 10C. D. Natale. A. Macagnano, F. Davide,A.D’Amico, A. Legin, Y. Vlasov,A. Rudnitskaya and B.Selezenev: Sens. Actuators B 44 (1997)423. 11 A. Legin, A. Rudnitskaya, Y. Vlasov, C. D. Natale, E. Mazzone and A. D'Amico: Sens.Actuators B 65(2000) 232. 122A. Legin, A. Rudnitskaya,L. Lvova, Y. Vlasov, C. D. Natale and A. D'Amico: Anal. Chim.Acta.484 (2003) 33. 13 A. Riul Jr.. R.R. Malmegrim, F. J. Fonseca and L. H. C. Mattoso: Biosens. Bioelectron. 18 (2003)1365. 14 A. Riul Jr.. A. M. Gallardo. S. V. Mello, S. Bone, D. M. Taylor and L. H. C. Mattoso:Synthetic Met. 132 (2003)109. 15 A. Riul Jr.. H. C. D. Sousa, R. R. Malmegrim, D. S. D. Santos Jr., A. C. P. L. F. Carvalho,F. J.Fonseca.O.N. Oliveira Jr. and L. H. C. Mattoso: Sens.Actuators B 98 (2004) 77. F. Winquist, P. Wide and I. Lundstrom: Anal. Chim. Acta 357 (1997) 21. F. Winquist, S. Holmin, C. Krantz-Rulcker, P. Wide and 1. Lundstrom: Anal. Chim. Acta 406(2000) 147. 18 P. Ivarsson. S. Holmin. N. E. Hojer, C. Krantz-Rulcker and F. Winquist: Sens. Actuators B 76(2001) 449. C. Soderstrom, F. Winquist and C. Krantz-Rulcker: Sens. Actuators B 89 (2003)248. F. Winquist, R. Bjorklund, C. Krantz-Rulcker, I. Lundstrom, K. Ostergren and T. Skoglund:Sens. Actuators B 111 (2005)299. S. Y. Tian, S. P. Deng and Z. X. Chen: Sens. Actuators B: Chem. 123 (2007)1049. 22V. Parra. A. A. Arrieta. J. A. Fernandez-Escudero, M. Iniguez, J. A. Saja and M. L.Rodriguez-Mendez: Anal. Chim. Acta 563 (2006) 229. 2M. Casale, C. Armanino, C. Casolino and M. Forina: Anal. Chim. Acta (2006) in press. S. Wold, M. Sjostrom and L. Eriksson: Chemometr. Intell. Lab.58 (2001) 109. P. Ciosek. Z. Brzozka. W. Wroblewski, E. Martinelli, C. Di Natale and A. D'Amico: Talanta67(2005)590. *represents the number of samples that the model discriminated. 电子舌在红酒年份鉴定、检测中的应用;电子舌在红酒年份鉴定、检测中的应用;电子舌在红酒年份鉴定、检测中的应用;电子舌在红酒年份鉴定、检测中的应用;
确定

还剩11页未读,是否继续阅读?

产品配置单
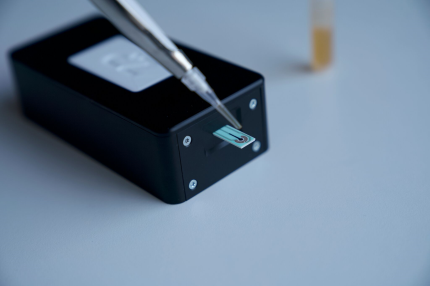
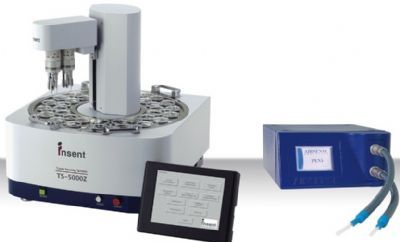
上海保圣实业发展有限公司为您提供《红酒中滋味检测方案(感官智能分析)》,该方案主要用于葡萄酒及果酒中理化分析检测,参考标准--,《红酒中滋味检测方案(感官智能分析)》用到的仪器有上海保圣 Bosin+cTongue+电子舌
推荐专场
感官智能分析系统(电子鼻/电子舌)
相关方案
更多
该厂商其他方案
更多