


方案详情
文
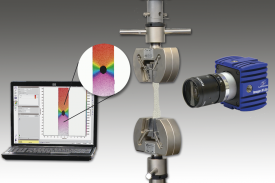
非介入式全场应变形变测量,可用于各种材料压缩和拉伸形变试验中,也可用于冶金,地质,矿产研究和工业领域。
方案详情

AIAA 2011-187652nd AIAA/ASME/ASCE/AHS/ASC Structures, Structural Dynamics and Materials Conference
19th4-7 April 2011, Denver, Colorado Measurement of Deformation of Rotating Blades UsingDigital Image Correlation Michael S. Lawson and Jayant Sirohi’ Department of Aerospace Engineering and Engineering Mechanics, The University of Texas at Austin, Austin TX 78712 Submitted for the 52nd AIAA/ASME/ASCE/AHS/ASC Structures, Structural Dynamics and Materials Conference April 2011, Denver, Colorado. March 21, 201 l An experimental study on the application of Digital Image Correlation (DIC) to measurethe deformation of rotating blades is described. Commercial DIC software was used toobtain measurements on three different types of rotors with diameter from 24" to 3" andwith varying flexibility to explore applicability of the technique over a range of scales. Theimage acquisition was synchronized with the frequency of rotation such that images could beobtained at the same phase and the consistency of measurements was observed. Bendingand twist distributions were extracted from the data with deformation as high as 0.4"measured with an accuracy of 0.0038". The technique was demonstrated to have manyadvantages including full-field high resolution results, non-intrusive measurement, and goodaccuracy over a range of scales. Measurement of blade deformation that would not havebeen possible with other techniques demonstrated the utility of the DIC method. Nomenclature I.Introduction THIS paper describes the use of the stereoscopic three-dimensional digital image correlation (DIC) technique tomeasure deformation on rotor blades under static and dynamic loads. Optical full-field measurement techniqueshave, over the course of the past few decades, grown increasingly useful in engineering research and development tofacilitate design, materials production, and inspection. Holographic Interferometry (HI), Electronic Speckle PatternInterferometry (ESPI),Moire techniques, and Digital Image Correlation (DIC) have been thoroughly explored fromthe theoreticaland engineering applicationviewpoints. Graduate Research Assistant. ‘Assistant Professor. Two-dimensional DIC is commonly used in materials testing to obtain in-plane deflection measurements. In theDIC technique, the surface of the model is first prepared with a random dot or“speckle” pattern such that points onthe surface are easily distinguished. Although various methods exist for creating such patterns, the most reliablemethod is to spray high-contrast paint on the surface. A high resolution camera captures images of the surfacebefore and after deformation. Cross-correlation of these images yields a two-dimensional, or in-plane, displacementmap of the surface. The application of photogrammetric principles to two-dimensional DIC allows for the determination of three-dimensional contours, non-planar displacements and strain of more complex structures : this is known as three-dimensional DIC. In this technique, two high resolution cameras are oriented with a line of sight normal to theobject surface, separated by a specific amount such that their respective views overlap. The surface height of aparticular point on the object’s surface can be determined from the stereoscopic disparity, or parallax between thetwo camera images. This is defined by the offset of the image between the image-sensing planes of the twocameras, and is calibrated using a target of known geometry. Cross-correlation of images captured by the pair ofcameras before and after deformation yields a three-dimensional displacement map of the surface. Previous studies have provided a solid foundation for the advancement of DIC technology since the early 1980's.The technology has been extensively used to measure deformations in material sciences and biomedical engineeringfor a variety of systems such as artificial muscles and ligaments, high speed fracture flywheel'specimens, tensiletest of a knee tendon , dynamic tissue deforma10tion measurements of a frog heart’and high-speed ballistic impact .Kahn-Jetter and Chu° presented an overview of DIC theory with experimental verification on a cantilever beam, aswell as a brief discussion on methods of random speckle pattern and photogrammetric principles. They concludedthat the technique is viable for determining 3D displacements, the effect of camera tilt is negligible and increasingthe camera magnification improves the results. McNeill et al. discussed the differences between several DICapproaches and calibration methods. Several studies have addressed the advantages of using DIC over single-pointconventional strain gages. Siebert et al.’ measured the strain at three points on a vibrating cantilever beam usingconventional strain gages and compared the results to the strain measured using DIC. They found that the resultsmatched very closely with the exception that the DIC had a greater range of possible deviation due to propagatederror. They also explored the sources of error and the propagation of errors in the DIC measurements and found thatcalibration of the imaging system is one of the largest sources oferror. It has been shown that in the right conditionsthe total error can be reduced to within 0.05%. A major advantage of optical techniques is that they are non-contact and do not require extensiveinstrumentation of the structure. This makes them extremely attractive for the measurement of deformation inrotating systems such as helicopter rotor blades. Currently, measurements of strain on helicopter rotor blades arelimited by localized strain gages mounted at discrete span-wise locations. The lack of deformation data over theentire blade span has led to the use of assumed deformations and interpolated data for the validation of aerodynamicanalyses13.14.There are several benefits to using full-field optical measurement techniques such as DIC, mostimportant is the fact that single-point strain gauges are incapable of showing strain gradients and could potentiallymiss high strain hot spots. The final results of measurements are comparable to, and can be used to quickly verify,finite element models; this results in a reduction in the number of prototypes required, improving design at lowercost. Additionally, DIC does not require involved sample preparation or the installation of electric slip rings. DICcan also be applied to small or complex geometry inaccessible to conventional strain gages; and it is more robustthan conventional strain gages which often fail during testing. There has been some limited investigation of optical measurement techniques for rotor blade deformation. Anoptical method known as Projection Moire Interferometry (PMI) has been used to obtain 3D deformationmeasurements of rotor blades and has demonstrated superior attributes to conventional approaches. However,while PMI has almost no sensitivity for in-plane deformation, and moderate sensitivity for out-of plane deformation,DIC has a 3-D sensitivity that can be 1/30,000 of the field of view. Additionally DIC is not affected by rigid bodymotions and can measure large deformations as long as the test object remains within focus of the cameras.Asimilar experiment has been performed recently using photogrammetry to measure the deformation of full-scale UH-60 helicopter blades at various advance ratios, thrust coefficients, and drive shaft angles. The experiment used 2"reflective circular targets attached at specific locations on the blade and produced results that closely matched thedesign parameters.While this experiment was comprehensive in its testing of a single rotor and demonstrated the accuracy of photogrammetry applied to rotating helicopter blades, it is limited in its resolution and range ofapplicable scale. DIC has also been used to measure membrane deformation of rapidly actuated flapping wingmicro air vehicles (MAVs). The present paper explores the application of stereoscopic DIC to measure deformation on rotor blades understatic and dynamic loads. The technique is validated by measurements from a laser displacement sensor (LDS) on asimplified vibrating cantilever beam experiment. The goal is to offer a 3D, full-field non-contact alternative forstrain measurement of rotor blades that offers superior resolution compared to traditional strain gages, is costeffective, and simple to implement. II. Present Approach The present study explores the application of DIC technology to the measurement of rotor blade deformation.The DIC software used in these experiments is Lavision DaVis 7.2-StrainMaster 3D18. The cameras are ImagerProX 2M which have 1600x1200 pixel resolution, 29.5Hz operation speed, color CCD image sensors, internalcamera memory, and 16384 (14-bit) gray levels. The exposure time is adjustable within the range of 500ns to 1000sand the cameras are capable of accepting an auxiliary TTL triggering signal. The cameras were equipped withNikon 50mm AF NIKKOR f/1.8D lenses; these lenses do not have any zoom control and a minimum focal distanceof 1.5ft(0.45m), though they have a variable aperture from f1.8 to f22. Experiments were conducted in four phases. A.Phase f The first phase of the study validated the DIC system on a simple dynamic model; a vibrating aluminum beamwith a stochastic speckle pattern (see Fig. 1-2); a white speckle pattern on a black coat was used. A piezoelectricactuator attached near the base of the beam excited the beam’s second natural frequency (at around 36 Hz). TheDIC was used in conjunction with a Laser Displacement Sensor (LDS) to verify the displacement measurements.The cameras were synchronized with the vibration of the beam such that they were triggered at the frequency ofvibration of the beam. The entire period of motion was recorded by incorporating a delay between the trigger signaland the image capture. The cameras used have a fixed zoom factor and the field of view could not be adjustedexcept by moving closer to or further away from the target. As the entire beam does not fit inside the camera fieldof view it was necessary to combine multiple data sets in order to get the full view; this was accomplished by usinga particular speckle which is overlapped in two views as a reference point and shifting the data along the span suchthat the curves overlap at that point. This can be done whenever there are no changes to the DIC calibration; if theDIC calibration is changed it will change the spatial resolution in the horizontal and vertical axes and create largediscontinuities in the measurements. The main goal of this experiment was to quantify the errors of the system andunderstand the limitations of the technique with respect to dynamic displacement measurement. Figure 1. Experimental setup for measuringthe deflection of a vibrating cantilever beamusing DIC. Figure 2. Schematic for vibrating cantileverbeam experiment. B.PPhase 2 After the DIC measurement methodology was validated on a cantilevered beam setup, the study progressed tomeasurements of deflection on a helicopter rotor blade. A 24" diameter, two-bladed helicopter rotor using rigidblades and a rigid hub was tested in hover (see Fig. 3-4). A stochastic speckle pattern was applied to the rotor bladesand a 1/rev trigger on the rotating frame was used to synchronize the rotor with the DIC system. Phase delays wereintroduced to capture images at the appropriate azimuth angles. The full-field deformation was calculated at tworotational speeds (1500 and 1800 rpm) and five pre-set collective pitch angles (3.6°,6.1°,8.5°,12.3°, and 14.8°)deformations were calculated from a 0° collective baseline for each rotor speed. Figure 3. Experimental setupof the measurement on rotorblades using DIC Figure 4. Rigid rotor blades on the hover test stand. C. Phase 3 This same procedure was used to measure the deformation for 3 separate sets of 18" diameter flexible MAVblades20.21. The setup was nearly identical to the previous experiment; the same test stand and equipment were used,with the only changes being that since the flexible blades were shorter the cameras were moved such that the entireblade could fit inside the field of view. As with the previous experiment, the blades were painted white with a blackspeckle pattern. The tests were performed at 1500rpm, 100 images per set, and five different collective pitch angles(4.8°,9.8°,14.8°,19.7°, and 25.9°) compared to a 0° collective baseline. The flexible blades were fabricated using carbon fiber and an elastomeric matrix with a wet layup process. Theblades are so flexible that centrifugal stiffening dominates blade dynamics; the blades cannot support their ownweight in non-rotating condition. For more detailed description of the construction of the flexible blades see Sicardand Sirohi20.21. Three types of flexible blades were tested with subtle differences between them. Blade CF involvesthe use of trailing edge flaps in order to produce pitching moment changes. Blade C4 uses an uncoupled compositelaminate and represents the baseline. Blade BP introduces an index angle between the chord of the blade and theprinciple axis of the tip body in order to make use of a restoring propeller moment". The close up of the mountedblades can be seen in figure 5 and the blades used in this experiment can be seen in figure 6. Figure 5. Flexible rotor blades on the hovertest stand (blade C4 pictured). Figure 6. IRotor blades usedl inexperiments. 4 D. Phase 4 The DIC technique was also applied to measuring the deformation of a small 3.25" diameter rigid propeller (Fig.7-8). Once again, the propeller was painted white with a black speckle pattern. For this experiment the collectivepitch was fixed, so deformation measurements were compared to a static position of the propeller blade. Figure 7. Propeller experiment setup. Figure 8. Close up ofpropeller and load cell Table 1. List of experiments. Experiment 1) Vibrating beam 17.8" 2) Rigid rotor blades 24" 3) Flexible rotor blades 18" 4) Propeller 3.25" III. Experiment Procedure The procedure to measure deformation using DIC consists of the following steps: 1.Sample Preparation A. Sample Preparation The first step in each experiment is to ensure that a trigger can synchronize the cameras to the motion. In thecase of the vibrating beam this trigger was generated by the excitation signal, for the other experiments a magnetic1/rev pickup was used. Image frames can then be captured at the same point in the cycle of motion. If an image of afast-moving sample lacks definition then the exposure time on the cameras would need to be reduced in order toenhance pattern distinction; however, this often means that more light is required. The most important characteristics of quality images are proper lighting and a high contrast random pattern onthe sample surface. Any digital camera is capable of recording a certain range of light intensity and each pixel in theimage will have an intensity rating measured in counts. The experiments presented in this paper used 14 bit CCDcameras which are capable of intensity in the range 0 to 16383 counts.. An ideal image will have high enoughlighting and contrast that the average counts on the sample surface will be high while the average counts in thebackground will be low. If the maximum count number on the sample surface is low then it is necessary to providemore light without saturation of the camera.For the experiments presented in this paper all illumination wasprovided by a halogen lamp or strobe; however, experiments involving faster moving objects may require evenhigher intensity short-duration pulses (i.e. a laser). With proper lighting it should be possible to achieve an averagecount value of more than 80 counts which is the minimum value to obtain useful correlation results. Some otherissues to be aware of are reflections and dust particles on the camera chip, these create bright and dark spotsrespectively that stay relatively fixed while the sample moves and leads to problems separating the motion of the sample and the fixed pattern. IBoth of these issues are easily handled through painting the sample with non-reflective paint and proper camera care and maintenance respectively. Figure 9. Close-up of vibrating beam speckle pattern. The high contrast random pattern applied to the sample surface is meant to assist the correlation algorithm withfinding patterns in consecutive images. As mentioned previously, the most reliable method to apply a stochasticspeckle pattern to the surface is by spraying it with a high-contrast, non-reflective paint. For the experimentspresented in this paper a flat black or white coat was applied to the sample surface followed by a speckle pattern ofopposite color (see Fig. 9); the speckle pattern could be applied either by using a toothbrush dipped in the paint andflicking it over the sample or by spraying a light coat from a distance. The former is more appropriate for largersamples while the latter produced finer speckles better suited to small samples. It was observed that using blackspeckles on a white flat coat was easier to work with as the sample would have greater average intensity and bettercontrast with the background. B. DIC Calibration Calibration defines an internal representation for the position and orientation of the cameras relative to thesample. This ultimately allows for results to be18 shown in scaled units which represent the true (world) dimensions,that is, it is necessary to determine a pixel/mm image scale. Stereo measurements require a calibration in multipleplanes; so a polynomial calibration which uses either a 3D calibration plate or multiple coplanar views of a 2D plateis required. For our experiments a 3D calibration plate was used. For each view of the calibration target, eachcamera must obtain images simultaneously. Although one view is typically sufficient to correct for all distortions,providing several views can make the result more accurate. The calibration process implies that the sample islocated at the 0 mm position. With all views obtained, the marks on the calibration target must be defined, that is allof the distinct marks must be identified. The software then calculates the calculated mapping function to the marksfound in each image. An average deviation of 1 pixel or lower between the calculated mark positions to the idealgrid is considered a good calibration. C.Mask Definition To perform the image processing it is often necessary to define a mask that will exclude pixels that are not a partof the sample; the surface height will be calculated only for parts of the sample seen by both cameras and definedvalid by the mask. The mask can be geometrically fixed for all images, a moving mask fixed to structures, oralgorithmically determined based on intensity counts for all images in the set. A geometrically fixed mask is thesimplest option in which a geometric shape is manually drawn around the sample and excludes all pixels that areoutside of that shape from calculations; however, if the sample moves outside of that shape then data will be lost. Amoving mask will determine how the sample has deformed based on the location of identifying marks on the samplesurface and adjust the shape of the mask accordingly before calculating the new surface height. However, whendeformations are large enough, this approach can lead to significant loss of data. The algorithmic mask excludespixels that are not within a specified intensity count range, and it can be combined with a geometric mask as well.Ideally the sample should have much greater intensity counts than the background, so using an algorithmic maskwill automatically mask out all pixels that are not a part of the sample surface regardless of its shape. Furthermore, the algorithmic mask can be recreated for every image in the set based on the same options which eliminates thepossibility of the mask deforming. D. Surface Height Calculation Given a pair of camera images (one for each camera), the surface height can be calculated from the x and ycoordinates of groups of pixels in both images and the mapping functions that were defined during the cameracalibration process. At this point it is necessary to define an interrogation window which will determine the distancebetween neighboring points at which deformation is calculated, defining the spatial resolution of the technique. Thecorresponding points (x1, yi) and (x2, y2) in the images from camera 1 and 2 respectively are found by a correlationprocess which identifies the same random pattern inside both images. Then by passing the x and y coordinatesthrough the mapping functions the elevation of that group of pixels can be determined as illustrated in figure 10. Figure 10. Schematic of initial surface height calculation adapted from (18). This is sufficient if the surface is smooth and the height is nearly constant; however, as this usually is not thecase, an iterative process becomes necessary.y.That is, the surface height obtained in the aforementioned waybecomes an initial guess. The camera images are recalculated under the assumption that the initial guess is correctand sent through a process which calculates residual pixel shifts between the new images. This residual pixel shift istranslated into height correction vectors which alter the shape of the initial surface which is then used as a newinitial guess for the next iteration. This process is repeated multiple times, reducing the residual pixel shift eachpiteration, in order to further enhance the accuracy of the surface height calculation This process is repeated for every pair of images in a set of recorded images. This has to be done very carefullyfor the first image in the set; however, subsequent images can use the result of the first (or preceding) image as theinitial guess. This implies that the deformation is small enough that consecutive surfaces do not changesubstantially, though it is possible to calculate each surface from generalized settings, this takes much more time tocompute. E..Deformation Vector Field Computation Once the surface height is calculated for all images in a set, the vector deformation calculation is performed bycomparing each surface height to the surface height of the first (or preceding) image. The image is divided intointerrogation windows in which a single deformation vector is computed for each window. The 2D vector shifts uand v are found for each camera, which are then passed through the mapping functions along with the surface heightdistribution to obtain the 3D vector (u,v,w) of each point. A variety of postprocessing options are possible including: eliminating vectors that are not consistent or differfrom their neighboring vectors by a specified factor, inserting vectors in empty spots in the vector field, orsmoothing. During the smoothing process, errors introduced by outlier vectors are distributed to the 8 neighboringvectors, resulting distributed error is only 1/9" the original deviation and makes the iteration process more stable. F.。 Error of DIC measurements In addition to the small error introduced by smoothing the vector deformation field as mentioned in the previoussection, errors are also introduced by other factors in the process.During the surface height calculation aninterrogation window was defined which determines the distance between neighboring vectors. The accuracy of the vectors depends on the size of this interrogation window and the amount by which each window overlaps. Thedistance between two neighboring vectors, or the vector grid, is determined by For example, all experiments in this paper use an interrogation window size of 32x32 pixels with 50%overlapwhich will have a vector grid of 16 pixels and a corresponding 3D vector precision of 0.05 pixels. The accuracydepends largely on the interrogation window size, but also on the zoom factor of the cameras, the type of lens used,and the distance to the sample.Larger vector grids are more accurate; however, they reduce the spatial resolutionand may not resolve local discontinuities.S.So, it is important to choose a window size that offers the bestcompromise between required spatial resolution and accuracy. The calibration factor, spatial resolution andaccuracy of each of the set of experiments are tabulated in table 2. Table 2. Accuracy estimation of experiments. Experiment calibration factor(pixel/in) (in) (%R) (in) (%R) Vibrating beam 243.4 0.066 0.369 2.05E-04 0.0012 Rigid rotor blades 198.7 0.081 0.822 2.52E-04 0.0026 Flexible rotor blades 200.8 0.080 1.265 2.49E-04 0.0040 Propeller 429.4 0.037 1.164 1.16E-04 0.0036 IV. Results & Discussion A.Vibrating Beam The light source for this experiment was ambient room light as it was sufficient to capture the motion, and sincemotion was predominantly in the z-axis a moving geometric mask was used. A 32x32 pixel Interrogation windowwith 50% overlap was used in the surface height calculation. As mentioned before, the entire beam could not fitinside the field of view of the cameras and was split into multiple segments. The results in figure 11 were obtainedusing two separate segments of DIC data and compare the results to the LDS measurements. The experiment wasrepeated with four separate segments of the beam and the bending mode shape was extracted from the data andreconstructed as a continuous curve. The deformed shape of the beam was assumed to take the shape Where B is a constant determined by structural properties, C; and Bo are constants to be solved for based on theavailable data. The reconstructed curve in figure 12 is derived by fitting equation (2) to the data obtained from DIC. Figure 11. Sample deflection measurements fromDIC and the LDS. Figure 12. Deflection vs. span, comparisonhetween raw data and recanstrieted cnrve It was concluded that the DIC measurements are accurate (within the error bounds of the LDS) andreproducible. Even if the data cannot be obtained in a continuous sample the segments can be easily adjoined andreconstructed into a continuous curve provided that there are no changes to the calibration. Good correlationbetween the DIC and theoretical deformation was obtained. B. Rigid 24"Diameter Rotor Blades For this experiment the blades were painted white with a black speckle pattern, this offered very good contrastto the background as well as much better intensity counts than the previous experiment. Since the motion near theblade tip was faster than in the previous experiment a lower exposure time was required from the cameras, a 1000Whalogen lamp was focused on the surface of the blade. The entire blade could not fit inside the field of view of thecameras and so the results for this experiment are offset by approximately 3.5" from the root of the blade. In orderto get the blade at the proper azimuth position a time shift (At) was implemented that would offset from the inputtrigger before capturing an image frame; however, since the rotor frequency fluctuated slightly over time the blade’sazimuth position relative to the camera would appear to fluctuate as well, this fluctuation was greater with largertime shifts. This fluctuation made it so that a standard mask as used previously could not be applied; instead analgorithmic mask was utilized that masked out pixels that did not have a minimum intensity count. A set consistedof a starting 0°collective baseline image at the specified frequency followed by 100 images at the same frequencyand a specified collective pitch angle. For example a set might be one image of 0° collective at 1500rpm, followedby 100 images at 5° and 1500 rpm. The DIC vector deformation field was extracted for analysis. The principal goal was to extract the bending andtorsion deformation from the DIC data. The quarter-chord line was examined for the bending mode shape while theslope of the chord line was used to find the twist angle at each point along the span. The results were fairlyconsistent with negligible variation, though outliers did exist. The mean lines were calculated while excluding theupper and lower 10% of outliers; this produced a smoother mean curve than if all the data were included in thecalculation. Figure 13.Raw deflection data for all imagesin set; 1500rpm rigid blades, 3.6 degreecollective pitch. Figure 14. Mean deflection curve with errorbars for 1500rpm rigid blades, 3.6 degreecollective pitch. Figure 15. Raw pitch distributionfor all images in set; 1500rpm rigidblades. 3.6 degree collective pitch. Figure 16. Mean pitch distribution witherror bars for 1500rpm rigid blades, 3.6degree collective pitch. As expected from the rigid blades, the span-wise variation in pitch was small and the mean curve was roughlyconstant; however, the pitch was always measured at slightly different values than the input collective.Additionally, the slight scattering of pitch values at each radial position was also observed by Olson et.al.1 in theircalculation of pitch on a full-scale UH-60A rotor blade, it was concluded that this variation was possibly due toimperfections in the airfoil lower surface geometry. The error associated with twist is further propagated becausetwist is a derived quantity from multiple displacements. The deflection curve was also expected with a clear rigidflap angle and very subtle bending primarily closer to the root. The estimated error from earlier in the deflection coordinate should be about 0.00257%R; however, the meanstandard deviation observed was approximately 0.0387%R or 0.0038". The mean error in the theta calculation washigher at approximately 0.1055 degrees. This indicates that there is some other factor that is reducing therepeatability of the results. In fact, each of the curves seem to have approximately the same shape with some linearshift in the y-axis data, this implies that there is some minor inconsistency in the rotor hub from one revolution toanother. The most probable explanation is that the support structure is vibrating. Figure:17.Meandeflectiond curves for1500rpm at various collective pitch angles. Figure 18. Mean pitch distribution curvesfor 1500rpm at various collective pitch At 1800rpm the results were similar to those from 1500rpm with the exception that the magnitude of thedeflection was greater. Also, at both speeds, the mean pitch curves appeared to have a small negative slopeparticularly at higher collective pitch angles, indicating some minor negative elastic twist. e. [degrees] Figure 19. Mean deflection curves for 1500and 1800 rpm at 6.07° and 14.76° collectivepitch angles. Figure 20. Rigid flap angle vs. collectivepitch angle for 1500 and 1800 rpm. As expected, the magnitude of deflection and the rigid flap angle are greater with both rotor speed and collectivepitch angle. C. Flexible 18" Diameter Rotor Blades COnce again as can be seen in the following figures, the pitch angles calculated were slightly underestimated,though the results get better with larger data sets. Also, in a number of cases the vector deformation field was notcalculated correctly and went to zero, these lower the mean deflection and pitch angle curves, though in thefollowing results those outliers were eliminated prior to calculation. Figure 21. Thrust vs. collective pitch anglefor each of the flexible blades. Figure 21 shows that of the 3 flexible blades, blades C4 and BP produce noticeably more thrust than bladeCF, with blade BP being the most effective. Blade BP would be more effective if it were not for the weight of thetip mass, and blade CF actually produces some negative lift at the location of the flap, reducing the net thrust overthe blade. The following figures and discussion will further explain this trend. Figure22. Mean deflection curves for bladeC4 at various collective pitch angles. Figure 23. Mean twist distribution curvesfor blade C4 at various collective pitch From figure 22 it is seen that the bending (flap-wise) deflection of the blades is significantly larger than in thecase of the rigid blades. At low thrust levels (low collective) the bending is distributed over the blade span, while athigher thrust levels most of the bending is localized near the blade root forming a virtual flap hinge. Figure 23shows the twist distribution along the blade span. The y-intercept of the curves gives the collective pitch angle, andit is seen that these are lower than the input (actual) values.. The discrepancy between measured and actualcollective pitch increases with increasing collective pitch, the reason for this discrepancy is currently underinvestigation. The span-wise distributions of twist and bending yield enormous insight into the physics of the flexible blades.Note that these measurements would have been extremely difficult with conventional techniques. From figure 23 itis also seen that the flexible blades C4 have a high negative twist, such that at low collective pitch the blade tipshave a negative incidence. This negative twist is induced by the propeller moments on the blade tip and isresponsible for the poor figure of merit of this rotor (see Sicard and Sirohi). The blade designs CF and BP weredeveloped to alleviate this negative induced twist. Figure 23 also shows a decrease in the span-wise rate of twist near the blade tips. This is due to a local increase in torsional rigidity caused by a thicker layup as well as the tipmass. Figure 24. Mean deflection curves for bladeCF at various collective pitch angles. Figure 25.Mean twist distribution curvesfor blade CF at various collective pitch Figures 24 and 25 show the span-wise deflection and twist respectively of the blades CF.. These bladesincorporate a trailing edge flap at the blade tip designed to alleviate the nose-down passive twist by creating apitching moment. From figure 25 it is seen that the flap (deflected up) decreases the span-wise nose-down twistcompared to the baseline flexible blade C4 case (Fig. 21). The decrease in twist results in increased thrust at thesame collective angle; this appears as an increase in bending deflection as seen in Fig. 22, compared to the baselineC4 case. In addition, the increase in twist near the blade tip indicates that the pitching moment created by the flap resultsin a large local change in incidence that is not entirely transferred along the blade span due to the extremely lowtorsional stiffness of the blade. This increase in twist near the blade tip results in a downward force that isresponsible for the decrease in bending slope near the blade tips. In general, these measurements validate the designand operation of the trailing edge flap and also indicate that the downward force near the blade tips is responsible forits reduced figure of merit (see Sicard and Sirohi). Figure 26. Mean deflection curves for bladeBP at various collective pitch angles. Figure 27. Mean twist distribution curvesfor blade BP at various collective pitch Blade BP is the most effective of the 3 flexible blades presented, as shown in figure 21 it produces the mostthrust, and figure 27 shows that the pitch is nearly constant at lower angles of attack. The deflection curves have aconcave down shape, opposite from blade C4. The tip mass on blade BP is mounted at an angle of -22° relative tothe horizontal, the effect of which is a restoring moment that will attempt to adjust the pitch angle at the blade tip to22°.As shown in figure 27, when the collective pitch angle is less than 22° the blade has little to no twist and thatwhich it has is positive; but, when the collective pitch exceeds 22° the blade has a negative twist down to a tip pitchangle of 22°. This agrees with what was predicted by Sicard and Sirohi. Figure 28. Mean deflection curves for allblades at 14.76° collective pitch. Figure 29. Mean twist distribution curvesfor all blades at 14.76°collective pitch. Figures 28 and 29 compare all three of the flexible blades and the rigid blades. The x-axis in this case is span/Lwhere L is the length of the respective blade. The rigid blade does not extend to the root because it could not fitinside the field of view, though this could be fixed by taking a second set of measurements for a section closer to theroot of the blade and merging the results as was done previously with the vibrating beam experiment. D. Propeller Blade Figure 30. Propeller surface height at 7200 RPM Figure 31. Thrust vs. propeller speed. Due to the high rotational speed of the propeller, images of sufficient intensity could not be obtained using theillumination technique of the previous experiment.A strobe light was used to illuminate the blade at everyrevolution and the camera shutter was opened for 0.5 sec. As a result, the cameras effectively recorded multiplerevolutions per exposure. FHowever, due to the high rigidity of the propeller variation between revolutions wasnegligible. The results showed negligible deformation (Fig. 30) of the propeller across the range of speeds tested (3600-7200 RPM), due to the high rigidity of the propeller and the low thrust produced (Fig. 31). Measurements at higherrotational speed were not possible due to a noticeable blur of the images. Testing at higher speeds will be performedusing a laser strobe. Note that the surface height is shifted by approximately 20.70 mm. While the deformation wasnot discernable by the DIC process, the software was able to determine the shape of the surface. The best precisionof deformation vectors that can be achieved is with a 128x128 pixel interrogation window at an accuracy of 0.0 1pixels, which with a calibration parameter of 16.906 pixels per mm the spatial precision is 0.592 um. Thedeformation could not be measured with suitable accuracy because the noise level approaches the order ofmagnitude of the deflection to be measured. V. Concluding Remarks The digital image correlation technique has proven to be a viable method for measuring the deformation of rotorblades. Flapping and pitching mode shapes are fairly easily extracted from the vector deformation field. Thedeflection itself has proven to be accurate as shown by the vibrating beam experiment comparison to LDS results;however, the pitch angle was typically slightly under-predicted in the listed experiments. The longitudinal strain canthen be calculated from the curvature of the blade. The accuracy and spatial resolution of the technique enabledmeasurements of the flexible rotor blades which would otherwise be very difficult. Future work will expand the study to explore the application of DIC to larger diameter rotor blades and calculatethe expected thrust based on the bending and torsion curves to compare against measured thrust from a load cell.Also, a comparison between the strain measured by the DIC technique and conventional foil strain gages will bemade. Once the strain has been verified a full-field strain analysis will be performed for rigid helicopter blades. VI. IReferences Schmidt, T., Tyson, J., Galanulis, K.,“Full-Field Dynamic Displacement and Strain Measurement Using Advanced 3DImage Correlation Photogrammetry: Part 1”, Experimental Techniques, 27(3),47-50,2003. Rajpal S. Sirohi, Optical Methods of Measurement: Whole-field Techniques, Second edition, Francis and Taylor/CRCPress.2009. Cloud, G. Optical Methods ofEngineering Analysis, Cambridge University Press, 1995.x11 ( "Williams, D. C. Optical Methods in Engineering Metrology, Chapman and Hall, 1 9 93. ) ( Tyson, J.,“Noncontact Full-Field Strai n Measurement With 3D ESPI", Sensors, 5, 62-70 , 2000. ) Kahn-Jetter, Z. L., and Chu, T. C.,“Three-Dimensional Displacement Measurements Using Digital Image Correlation andPhotogrammic Analysis”, Experimenta Mechanics, 30, 10-16, 1990. 'Schmidt, T., Tyson, J., Galanulis, K.,“Full-Field Dynamic Displacement and Strain Measurement - Specific ExamplesUsing Advanced 3D Image Correlation Photogrammetry: Part 2”, Experimental Techniques, 27(4), 22-26,2003. Schmidt, T., Tyson, J.,Galanulis, K.,“Advanced Photogrammetry for Robust Deformation and Strain Measurement”, SEM2002 Annual Conference, SEM, Milwaukee, WI, June 2002. Schmidt, T., Tyson, J., Galanulis, K., “Optical Deformation & Strain Measurements in Biomechanics”, Biophotonics, 1-7,September 2003. Schmidt, T.,Tyson, J., Revilock, D.M. Jr., Padula, S. II, Pereira, J.M., Melis, M., Lyle, K.,“Performance Verification of3D Image Correlation Using High-Speed Cameras”, SEM 2005 Annual Conference and Exposition, SEM, Portland, OR, 2005. McNeill, S.R., Sutton, M.A., Miao, Z., Ma, J.,“Measurement of Surface Profile Using Digital Image Correlation andPhotogrammic Analysis”,Experimental Mechanics,30(3), 13-20,1990. 12Siebert, T., Becker, T., Spiltthof, K., Neumann, I., Krupka,R.,“High-Speed Digital Image Correlation: Error Estimationsand Applications”, Optical Engineering, 46, May 2007. 1D3atta, A. and Chopra, I.,“Validation of Structural and Aerodynamic Modeling Using UH-60A Airloads Program Data”,Journal of the American Helicopter Society,51(1), 43-58,2006. “Steijl, R., Barakos, G. N., and Badcock, K. J.,“Computational Study of the Advancing-Side Lift-Phase Problem”,Journalof Aircraft, 45(1), 246-257,2008. 1F5leming, G. A., Gorton, S., “Measurement of Rotorcraft Blade Deformation Using Projection Moire Interferometry",Proceedings of the Third International Conference on Vibration Measurements by Laser Techniques: Advances and Applications, SPIE--the International Society for Optical Engineering, Ancona, Italy, June 16-19,1998, pp. 514-527. Olson, L., Abrego, A., Barrows, D., and Burner, A.,“Blade Deflection Measurements ofa Full-Scale UH-60A RotorSystem”, American Helicopter Society Aeromechanics Specialist’Conference, San Francisco, California, January 20-22, 2010. Wu, P., Stanford, B., Ifju., P., Bowman, W., and Schwartz, A.,“Digital Image Correlation Techniques for Full-Field Displacement Measurements of Micro Air Vehicle Flapping Wings”, Experimental Techniques, November, 2009. LaVision, DaVis StrainMaster 3D, Software Package, Ver 7.2, Gottingen, Germany, January 2010. 19Mikhail, E., Bethel, J., McGlone, J., Introduction to Modern Photogrammetry, John Wiley and Sons, Inc., Neew(ork.2001. Sicard, J., Sirohi, J., “Behavior of Extremely Flexible Rotor in Hover and Forward Flight”, 66th AHS meeting, Phoenix,AZ, USA,2010. Sicard, J., Sirohi, J.,“Twist Control of an Extremely Flexible Rotor Blade for Micro-Aerial Vehicles”,67th AHS meeting,Tempe, AZ,USA, 2011. American Institute of Aeronautics and AstronauticsCopyright@ by the American Institute of Aeronautics and Astronautics, Inc. All rights reserved. merican Institute of Aeronautics and Astronautics An experimental study on the application of Digital Image Correlation (DIC) to measure the deformation of rotating blades is described. Commercial DIC software was used to obtain measurements on three different types of rotors with diameter from 24 to 3 and with varying flexibility to explore applicability of the technique over a range of scales. The image acquisition was synchronized with the frequency of rotation such that images could be obtained at the same phase and the consistency of measurements was observed. Bending and twist distributions were extracted from the data with deformation as high as 0.4 measured with an accuracy of 0.0038. The technique was demonstrated to have many advantages including full-field high resolution results, non-intrusive measurement, and good accuracy over a range of scales. Measurement of blade deformation that would not have been possible with other techniques demonstrated the utility of the DIC method.
19th4-7 April 2011, Denver, Colorado Measurement of Deformation of Rotating Blades UsingDigital Image Correlation Michael S. Lawson and Jayant Sirohi’ Department of Aerospace Engineering and Engineering Mechanics, The University of Texas at Austin, Austin TX 78712 Submitted for the 52nd AIAA/ASME/ASCE/AHS/ASC Structures, Structural Dynamics and Materials Conference April 2011, Denver, Colorado. March 21, 201 l An experimental study on the application of Digital Image Correlation (DIC) to measurethe deformation of rotating blades is described. Commercial DIC software was used toobtain measurements on three different types of rotors with diameter from 24" to 3" andwith varying flexibility to explore applicability of the technique over a range of scales. Theimage acquisition was synchronized with the frequency of rotation such that images could beobtained at the same phase and the consistency of measurements was observed. Bendingand twist distributions were extracted from the data with deformation as high as 0.4"measured with an accuracy of 0.0038". The technique was demonstrated to have manyadvantages including full-field high resolution results, non-intrusive measurement, and goodaccuracy over a range of scales. Measurement of blade deformation that would not havebeen possible with other techniques demonstrated the utility of the DIC method. Nomenclature I.Introduction THIS paper describes the use of the stereoscopic three-dimensional digital image correlation (DIC) technique tomeasure deformation on rotor blades under static and dynamic loads. Optical full-field measurement techniqueshave, over the course of the past few decades, grown increasingly useful in engineering research and development tofacilitate design, materials production, and inspection. Holographic Interferometry (HI), Electronic Speckle PatternInterferometry (ESPI),Moire techniques, and Digital Image Correlation (DIC) have been thoroughly explored fromthe theoreticaland engineering applicationviewpoints. Graduate Research Assistant. ‘Assistant Professor. Two-dimensional DIC is commonly used in materials testing to obtain in-plane deflection measurements. In theDIC technique, the surface of the model is first prepared with a random dot or“speckle” pattern such that points onthe surface are easily distinguished. Although various methods exist for creating such patterns, the most reliablemethod is to spray high-contrast paint on the surface. A high resolution camera captures images of the surfacebefore and after deformation. Cross-correlation of these images yields a two-dimensional, or in-plane, displacementmap of the surface. The application of photogrammetric principles to two-dimensional DIC allows for the determination of three-dimensional contours, non-planar displacements and strain of more complex structures : this is known as three-dimensional DIC. In this technique, two high resolution cameras are oriented with a line of sight normal to theobject surface, separated by a specific amount such that their respective views overlap. The surface height of aparticular point on the object’s surface can be determined from the stereoscopic disparity, or parallax between thetwo camera images. This is defined by the offset of the image between the image-sensing planes of the twocameras, and is calibrated using a target of known geometry. Cross-correlation of images captured by the pair ofcameras before and after deformation yields a three-dimensional displacement map of the surface. Previous studies have provided a solid foundation for the advancement of DIC technology since the early 1980's.The technology has been extensively used to measure deformations in material sciences and biomedical engineeringfor a variety of systems such as artificial muscles and ligaments, high speed fracture flywheel'specimens, tensiletest of a knee tendon , dynamic tissue deforma10tion measurements of a frog heart’and high-speed ballistic impact .Kahn-Jetter and Chu° presented an overview of DIC theory with experimental verification on a cantilever beam, aswell as a brief discussion on methods of random speckle pattern and photogrammetric principles. They concludedthat the technique is viable for determining 3D displacements, the effect of camera tilt is negligible and increasingthe camera magnification improves the results. McNeill et al. discussed the differences between several DICapproaches and calibration methods. Several studies have addressed the advantages of using DIC over single-pointconventional strain gages. Siebert et al.’ measured the strain at three points on a vibrating cantilever beam usingconventional strain gages and compared the results to the strain measured using DIC. They found that the resultsmatched very closely with the exception that the DIC had a greater range of possible deviation due to propagatederror. They also explored the sources of error and the propagation of errors in the DIC measurements and found thatcalibration of the imaging system is one of the largest sources oferror. It has been shown that in the right conditionsthe total error can be reduced to within 0.05%. A major advantage of optical techniques is that they are non-contact and do not require extensiveinstrumentation of the structure. This makes them extremely attractive for the measurement of deformation inrotating systems such as helicopter rotor blades. Currently, measurements of strain on helicopter rotor blades arelimited by localized strain gages mounted at discrete span-wise locations. The lack of deformation data over theentire blade span has led to the use of assumed deformations and interpolated data for the validation of aerodynamicanalyses13.14.There are several benefits to using full-field optical measurement techniques such as DIC, mostimportant is the fact that single-point strain gauges are incapable of showing strain gradients and could potentiallymiss high strain hot spots. The final results of measurements are comparable to, and can be used to quickly verify,finite element models; this results in a reduction in the number of prototypes required, improving design at lowercost. Additionally, DIC does not require involved sample preparation or the installation of electric slip rings. DICcan also be applied to small or complex geometry inaccessible to conventional strain gages; and it is more robustthan conventional strain gages which often fail during testing. There has been some limited investigation of optical measurement techniques for rotor blade deformation. Anoptical method known as Projection Moire Interferometry (PMI) has been used to obtain 3D deformationmeasurements of rotor blades and has demonstrated superior attributes to conventional approaches. However,while PMI has almost no sensitivity for in-plane deformation, and moderate sensitivity for out-of plane deformation,DIC has a 3-D sensitivity that can be 1/30,000 of the field of view. Additionally DIC is not affected by rigid bodymotions and can measure large deformations as long as the test object remains within focus of the cameras.Asimilar experiment has been performed recently using photogrammetry to measure the deformation of full-scale UH-60 helicopter blades at various advance ratios, thrust coefficients, and drive shaft angles. The experiment used 2"reflective circular targets attached at specific locations on the blade and produced results that closely matched thedesign parameters.While this experiment was comprehensive in its testing of a single rotor and demonstrated the accuracy of photogrammetry applied to rotating helicopter blades, it is limited in its resolution and range ofapplicable scale. DIC has also been used to measure membrane deformation of rapidly actuated flapping wingmicro air vehicles (MAVs). The present paper explores the application of stereoscopic DIC to measure deformation on rotor blades understatic and dynamic loads. The technique is validated by measurements from a laser displacement sensor (LDS) on asimplified vibrating cantilever beam experiment. The goal is to offer a 3D, full-field non-contact alternative forstrain measurement of rotor blades that offers superior resolution compared to traditional strain gages, is costeffective, and simple to implement. II. Present Approach The present study explores the application of DIC technology to the measurement of rotor blade deformation.The DIC software used in these experiments is Lavision DaVis 7.2-StrainMaster 3D18. The cameras are ImagerProX 2M which have 1600x1200 pixel resolution, 29.5Hz operation speed, color CCD image sensors, internalcamera memory, and 16384 (14-bit) gray levels. The exposure time is adjustable within the range of 500ns to 1000sand the cameras are capable of accepting an auxiliary TTL triggering signal. The cameras were equipped withNikon 50mm AF NIKKOR f/1.8D lenses; these lenses do not have any zoom control and a minimum focal distanceof 1.5ft(0.45m), though they have a variable aperture from f1.8 to f22. Experiments were conducted in four phases. A.Phase f The first phase of the study validated the DIC system on a simple dynamic model; a vibrating aluminum beamwith a stochastic speckle pattern (see Fig. 1-2); a white speckle pattern on a black coat was used. A piezoelectricactuator attached near the base of the beam excited the beam’s second natural frequency (at around 36 Hz). TheDIC was used in conjunction with a Laser Displacement Sensor (LDS) to verify the displacement measurements.The cameras were synchronized with the vibration of the beam such that they were triggered at the frequency ofvibration of the beam. The entire period of motion was recorded by incorporating a delay between the trigger signaland the image capture. The cameras used have a fixed zoom factor and the field of view could not be adjustedexcept by moving closer to or further away from the target. As the entire beam does not fit inside the camera fieldof view it was necessary to combine multiple data sets in order to get the full view; this was accomplished by usinga particular speckle which is overlapped in two views as a reference point and shifting the data along the span suchthat the curves overlap at that point. This can be done whenever there are no changes to the DIC calibration; if theDIC calibration is changed it will change the spatial resolution in the horizontal and vertical axes and create largediscontinuities in the measurements. The main goal of this experiment was to quantify the errors of the system andunderstand the limitations of the technique with respect to dynamic displacement measurement. Figure 1. Experimental setup for measuringthe deflection of a vibrating cantilever beamusing DIC. Figure 2. Schematic for vibrating cantileverbeam experiment. B.PPhase 2 After the DIC measurement methodology was validated on a cantilevered beam setup, the study progressed tomeasurements of deflection on a helicopter rotor blade. A 24" diameter, two-bladed helicopter rotor using rigidblades and a rigid hub was tested in hover (see Fig. 3-4). A stochastic speckle pattern was applied to the rotor bladesand a 1/rev trigger on the rotating frame was used to synchronize the rotor with the DIC system. Phase delays wereintroduced to capture images at the appropriate azimuth angles. The full-field deformation was calculated at tworotational speeds (1500 and 1800 rpm) and five pre-set collective pitch angles (3.6°,6.1°,8.5°,12.3°, and 14.8°)deformations were calculated from a 0° collective baseline for each rotor speed. Figure 3. Experimental setupof the measurement on rotorblades using DIC Figure 4. Rigid rotor blades on the hover test stand. C. Phase 3 This same procedure was used to measure the deformation for 3 separate sets of 18" diameter flexible MAVblades20.21. The setup was nearly identical to the previous experiment; the same test stand and equipment were used,with the only changes being that since the flexible blades were shorter the cameras were moved such that the entireblade could fit inside the field of view. As with the previous experiment, the blades were painted white with a blackspeckle pattern. The tests were performed at 1500rpm, 100 images per set, and five different collective pitch angles(4.8°,9.8°,14.8°,19.7°, and 25.9°) compared to a 0° collective baseline. The flexible blades were fabricated using carbon fiber and an elastomeric matrix with a wet layup process. Theblades are so flexible that centrifugal stiffening dominates blade dynamics; the blades cannot support their ownweight in non-rotating condition. For more detailed description of the construction of the flexible blades see Sicardand Sirohi20.21. Three types of flexible blades were tested with subtle differences between them. Blade CF involvesthe use of trailing edge flaps in order to produce pitching moment changes. Blade C4 uses an uncoupled compositelaminate and represents the baseline. Blade BP introduces an index angle between the chord of the blade and theprinciple axis of the tip body in order to make use of a restoring propeller moment". The close up of the mountedblades can be seen in figure 5 and the blades used in this experiment can be seen in figure 6. Figure 5. Flexible rotor blades on the hovertest stand (blade C4 pictured). Figure 6. IRotor blades usedl inexperiments. 4 D. Phase 4 The DIC technique was also applied to measuring the deformation of a small 3.25" diameter rigid propeller (Fig.7-8). Once again, the propeller was painted white with a black speckle pattern. For this experiment the collectivepitch was fixed, so deformation measurements were compared to a static position of the propeller blade. Figure 7. Propeller experiment setup. Figure 8. Close up ofpropeller and load cell Table 1. List of experiments. Experiment 1) Vibrating beam 17.8" 2) Rigid rotor blades 24" 3) Flexible rotor blades 18" 4) Propeller 3.25" III. Experiment Procedure The procedure to measure deformation using DIC consists of the following steps: 1.Sample Preparation A. Sample Preparation The first step in each experiment is to ensure that a trigger can synchronize the cameras to the motion. In thecase of the vibrating beam this trigger was generated by the excitation signal, for the other experiments a magnetic1/rev pickup was used. Image frames can then be captured at the same point in the cycle of motion. If an image of afast-moving sample lacks definition then the exposure time on the cameras would need to be reduced in order toenhance pattern distinction; however, this often means that more light is required. The most important characteristics of quality images are proper lighting and a high contrast random pattern onthe sample surface. Any digital camera is capable of recording a certain range of light intensity and each pixel in theimage will have an intensity rating measured in counts. The experiments presented in this paper used 14 bit CCDcameras which are capable of intensity in the range 0 to 16383 counts.. An ideal image will have high enoughlighting and contrast that the average counts on the sample surface will be high while the average counts in thebackground will be low. If the maximum count number on the sample surface is low then it is necessary to providemore light without saturation of the camera.For the experiments presented in this paper all illumination wasprovided by a halogen lamp or strobe; however, experiments involving faster moving objects may require evenhigher intensity short-duration pulses (i.e. a laser). With proper lighting it should be possible to achieve an averagecount value of more than 80 counts which is the minimum value to obtain useful correlation results. Some otherissues to be aware of are reflections and dust particles on the camera chip, these create bright and dark spotsrespectively that stay relatively fixed while the sample moves and leads to problems separating the motion of the sample and the fixed pattern. IBoth of these issues are easily handled through painting the sample with non-reflective paint and proper camera care and maintenance respectively. Figure 9. Close-up of vibrating beam speckle pattern. The high contrast random pattern applied to the sample surface is meant to assist the correlation algorithm withfinding patterns in consecutive images. As mentioned previously, the most reliable method to apply a stochasticspeckle pattern to the surface is by spraying it with a high-contrast, non-reflective paint. For the experimentspresented in this paper a flat black or white coat was applied to the sample surface followed by a speckle pattern ofopposite color (see Fig. 9); the speckle pattern could be applied either by using a toothbrush dipped in the paint andflicking it over the sample or by spraying a light coat from a distance. The former is more appropriate for largersamples while the latter produced finer speckles better suited to small samples. It was observed that using blackspeckles on a white flat coat was easier to work with as the sample would have greater average intensity and bettercontrast with the background. B. DIC Calibration Calibration defines an internal representation for the position and orientation of the cameras relative to thesample. This ultimately allows for results to be18 shown in scaled units which represent the true (world) dimensions,that is, it is necessary to determine a pixel/mm image scale. Stereo measurements require a calibration in multipleplanes; so a polynomial calibration which uses either a 3D calibration plate or multiple coplanar views of a 2D plateis required. For our experiments a 3D calibration plate was used. For each view of the calibration target, eachcamera must obtain images simultaneously. Although one view is typically sufficient to correct for all distortions,providing several views can make the result more accurate. The calibration process implies that the sample islocated at the 0 mm position. With all views obtained, the marks on the calibration target must be defined, that is allof the distinct marks must be identified. The software then calculates the calculated mapping function to the marksfound in each image. An average deviation of 1 pixel or lower between the calculated mark positions to the idealgrid is considered a good calibration. C.Mask Definition To perform the image processing it is often necessary to define a mask that will exclude pixels that are not a partof the sample; the surface height will be calculated only for parts of the sample seen by both cameras and definedvalid by the mask. The mask can be geometrically fixed for all images, a moving mask fixed to structures, oralgorithmically determined based on intensity counts for all images in the set. A geometrically fixed mask is thesimplest option in which a geometric shape is manually drawn around the sample and excludes all pixels that areoutside of that shape from calculations; however, if the sample moves outside of that shape then data will be lost. Amoving mask will determine how the sample has deformed based on the location of identifying marks on the samplesurface and adjust the shape of the mask accordingly before calculating the new surface height. However, whendeformations are large enough, this approach can lead to significant loss of data. The algorithmic mask excludespixels that are not within a specified intensity count range, and it can be combined with a geometric mask as well.Ideally the sample should have much greater intensity counts than the background, so using an algorithmic maskwill automatically mask out all pixels that are not a part of the sample surface regardless of its shape. Furthermore, the algorithmic mask can be recreated for every image in the set based on the same options which eliminates thepossibility of the mask deforming. D. Surface Height Calculation Given a pair of camera images (one for each camera), the surface height can be calculated from the x and ycoordinates of groups of pixels in both images and the mapping functions that were defined during the cameracalibration process. At this point it is necessary to define an interrogation window which will determine the distancebetween neighboring points at which deformation is calculated, defining the spatial resolution of the technique. Thecorresponding points (x1, yi) and (x2, y2) in the images from camera 1 and 2 respectively are found by a correlationprocess which identifies the same random pattern inside both images. Then by passing the x and y coordinatesthrough the mapping functions the elevation of that group of pixels can be determined as illustrated in figure 10. Figure 10. Schematic of initial surface height calculation adapted from (18). This is sufficient if the surface is smooth and the height is nearly constant; however, as this usually is not thecase, an iterative process becomes necessary.y.That is, the surface height obtained in the aforementioned waybecomes an initial guess. The camera images are recalculated under the assumption that the initial guess is correctand sent through a process which calculates residual pixel shifts between the new images. This residual pixel shift istranslated into height correction vectors which alter the shape of the initial surface which is then used as a newinitial guess for the next iteration. This process is repeated multiple times, reducing the residual pixel shift eachpiteration, in order to further enhance the accuracy of the surface height calculation This process is repeated for every pair of images in a set of recorded images. This has to be done very carefullyfor the first image in the set; however, subsequent images can use the result of the first (or preceding) image as theinitial guess. This implies that the deformation is small enough that consecutive surfaces do not changesubstantially, though it is possible to calculate each surface from generalized settings, this takes much more time tocompute. E..Deformation Vector Field Computation Once the surface height is calculated for all images in a set, the vector deformation calculation is performed bycomparing each surface height to the surface height of the first (or preceding) image. The image is divided intointerrogation windows in which a single deformation vector is computed for each window. The 2D vector shifts uand v are found for each camera, which are then passed through the mapping functions along with the surface heightdistribution to obtain the 3D vector (u,v,w) of each point. A variety of postprocessing options are possible including: eliminating vectors that are not consistent or differfrom their neighboring vectors by a specified factor, inserting vectors in empty spots in the vector field, orsmoothing. During the smoothing process, errors introduced by outlier vectors are distributed to the 8 neighboringvectors, resulting distributed error is only 1/9" the original deviation and makes the iteration process more stable. F.。 Error of DIC measurements In addition to the small error introduced by smoothing the vector deformation field as mentioned in the previoussection, errors are also introduced by other factors in the process.During the surface height calculation aninterrogation window was defined which determines the distance between neighboring vectors. The accuracy of the vectors depends on the size of this interrogation window and the amount by which each window overlaps. Thedistance between two neighboring vectors, or the vector grid, is determined by For example, all experiments in this paper use an interrogation window size of 32x32 pixels with 50%overlapwhich will have a vector grid of 16 pixels and a corresponding 3D vector precision of 0.05 pixels. The accuracydepends largely on the interrogation window size, but also on the zoom factor of the cameras, the type of lens used,and the distance to the sample.Larger vector grids are more accurate; however, they reduce the spatial resolutionand may not resolve local discontinuities.S.So, it is important to choose a window size that offers the bestcompromise between required spatial resolution and accuracy. The calibration factor, spatial resolution andaccuracy of each of the set of experiments are tabulated in table 2. Table 2. Accuracy estimation of experiments. Experiment calibration factor(pixel/in) (in) (%R) (in) (%R) Vibrating beam 243.4 0.066 0.369 2.05E-04 0.0012 Rigid rotor blades 198.7 0.081 0.822 2.52E-04 0.0026 Flexible rotor blades 200.8 0.080 1.265 2.49E-04 0.0040 Propeller 429.4 0.037 1.164 1.16E-04 0.0036 IV. Results & Discussion A.Vibrating Beam The light source for this experiment was ambient room light as it was sufficient to capture the motion, and sincemotion was predominantly in the z-axis a moving geometric mask was used. A 32x32 pixel Interrogation windowwith 50% overlap was used in the surface height calculation. As mentioned before, the entire beam could not fitinside the field of view of the cameras and was split into multiple segments. The results in figure 11 were obtainedusing two separate segments of DIC data and compare the results to the LDS measurements. The experiment wasrepeated with four separate segments of the beam and the bending mode shape was extracted from the data andreconstructed as a continuous curve. The deformed shape of the beam was assumed to take the shape Where B is a constant determined by structural properties, C; and Bo are constants to be solved for based on theavailable data. The reconstructed curve in figure 12 is derived by fitting equation (2) to the data obtained from DIC. Figure 11. Sample deflection measurements fromDIC and the LDS. Figure 12. Deflection vs. span, comparisonhetween raw data and recanstrieted cnrve It was concluded that the DIC measurements are accurate (within the error bounds of the LDS) andreproducible. Even if the data cannot be obtained in a continuous sample the segments can be easily adjoined andreconstructed into a continuous curve provided that there are no changes to the calibration. Good correlationbetween the DIC and theoretical deformation was obtained. B. Rigid 24"Diameter Rotor Blades For this experiment the blades were painted white with a black speckle pattern, this offered very good contrastto the background as well as much better intensity counts than the previous experiment. Since the motion near theblade tip was faster than in the previous experiment a lower exposure time was required from the cameras, a 1000Whalogen lamp was focused on the surface of the blade. The entire blade could not fit inside the field of view of thecameras and so the results for this experiment are offset by approximately 3.5" from the root of the blade. In orderto get the blade at the proper azimuth position a time shift (At) was implemented that would offset from the inputtrigger before capturing an image frame; however, since the rotor frequency fluctuated slightly over time the blade’sazimuth position relative to the camera would appear to fluctuate as well, this fluctuation was greater with largertime shifts. This fluctuation made it so that a standard mask as used previously could not be applied; instead analgorithmic mask was utilized that masked out pixels that did not have a minimum intensity count. A set consistedof a starting 0°collective baseline image at the specified frequency followed by 100 images at the same frequencyand a specified collective pitch angle. For example a set might be one image of 0° collective at 1500rpm, followedby 100 images at 5° and 1500 rpm. The DIC vector deformation field was extracted for analysis. The principal goal was to extract the bending andtorsion deformation from the DIC data. The quarter-chord line was examined for the bending mode shape while theslope of the chord line was used to find the twist angle at each point along the span. The results were fairlyconsistent with negligible variation, though outliers did exist. The mean lines were calculated while excluding theupper and lower 10% of outliers; this produced a smoother mean curve than if all the data were included in thecalculation. Figure 13.Raw deflection data for all imagesin set; 1500rpm rigid blades, 3.6 degreecollective pitch. Figure 14. Mean deflection curve with errorbars for 1500rpm rigid blades, 3.6 degreecollective pitch. Figure 15. Raw pitch distributionfor all images in set; 1500rpm rigidblades. 3.6 degree collective pitch. Figure 16. Mean pitch distribution witherror bars for 1500rpm rigid blades, 3.6degree collective pitch. As expected from the rigid blades, the span-wise variation in pitch was small and the mean curve was roughlyconstant; however, the pitch was always measured at slightly different values than the input collective.Additionally, the slight scattering of pitch values at each radial position was also observed by Olson et.al.1 in theircalculation of pitch on a full-scale UH-60A rotor blade, it was concluded that this variation was possibly due toimperfections in the airfoil lower surface geometry. The error associated with twist is further propagated becausetwist is a derived quantity from multiple displacements. The deflection curve was also expected with a clear rigidflap angle and very subtle bending primarily closer to the root. The estimated error from earlier in the deflection coordinate should be about 0.00257%R; however, the meanstandard deviation observed was approximately 0.0387%R or 0.0038". The mean error in the theta calculation washigher at approximately 0.1055 degrees. This indicates that there is some other factor that is reducing therepeatability of the results. In fact, each of the curves seem to have approximately the same shape with some linearshift in the y-axis data, this implies that there is some minor inconsistency in the rotor hub from one revolution toanother. The most probable explanation is that the support structure is vibrating. Figure:17.Meandeflectiond curves for1500rpm at various collective pitch angles. Figure 18. Mean pitch distribution curvesfor 1500rpm at various collective pitch At 1800rpm the results were similar to those from 1500rpm with the exception that the magnitude of thedeflection was greater. Also, at both speeds, the mean pitch curves appeared to have a small negative slopeparticularly at higher collective pitch angles, indicating some minor negative elastic twist. e. [degrees] Figure 19. Mean deflection curves for 1500and 1800 rpm at 6.07° and 14.76° collectivepitch angles. Figure 20. Rigid flap angle vs. collectivepitch angle for 1500 and 1800 rpm. As expected, the magnitude of deflection and the rigid flap angle are greater with both rotor speed and collectivepitch angle. C. Flexible 18" Diameter Rotor Blades COnce again as can be seen in the following figures, the pitch angles calculated were slightly underestimated,though the results get better with larger data sets. Also, in a number of cases the vector deformation field was notcalculated correctly and went to zero, these lower the mean deflection and pitch angle curves, though in thefollowing results those outliers were eliminated prior to calculation. Figure 21. Thrust vs. collective pitch anglefor each of the flexible blades. Figure 21 shows that of the 3 flexible blades, blades C4 and BP produce noticeably more thrust than bladeCF, with blade BP being the most effective. Blade BP would be more effective if it were not for the weight of thetip mass, and blade CF actually produces some negative lift at the location of the flap, reducing the net thrust overthe blade. The following figures and discussion will further explain this trend. Figure22. Mean deflection curves for bladeC4 at various collective pitch angles. Figure 23. Mean twist distribution curvesfor blade C4 at various collective pitch From figure 22 it is seen that the bending (flap-wise) deflection of the blades is significantly larger than in thecase of the rigid blades. At low thrust levels (low collective) the bending is distributed over the blade span, while athigher thrust levels most of the bending is localized near the blade root forming a virtual flap hinge. Figure 23shows the twist distribution along the blade span. The y-intercept of the curves gives the collective pitch angle, andit is seen that these are lower than the input (actual) values.. The discrepancy between measured and actualcollective pitch increases with increasing collective pitch, the reason for this discrepancy is currently underinvestigation. The span-wise distributions of twist and bending yield enormous insight into the physics of the flexible blades.Note that these measurements would have been extremely difficult with conventional techniques. From figure 23 itis also seen that the flexible blades C4 have a high negative twist, such that at low collective pitch the blade tipshave a negative incidence. This negative twist is induced by the propeller moments on the blade tip and isresponsible for the poor figure of merit of this rotor (see Sicard and Sirohi). The blade designs CF and BP weredeveloped to alleviate this negative induced twist. Figure 23 also shows a decrease in the span-wise rate of twist near the blade tips. This is due to a local increase in torsional rigidity caused by a thicker layup as well as the tipmass. Figure 24. Mean deflection curves for bladeCF at various collective pitch angles. Figure 25.Mean twist distribution curvesfor blade CF at various collective pitch Figures 24 and 25 show the span-wise deflection and twist respectively of the blades CF.. These bladesincorporate a trailing edge flap at the blade tip designed to alleviate the nose-down passive twist by creating apitching moment. From figure 25 it is seen that the flap (deflected up) decreases the span-wise nose-down twistcompared to the baseline flexible blade C4 case (Fig. 21). The decrease in twist results in increased thrust at thesame collective angle; this appears as an increase in bending deflection as seen in Fig. 22, compared to the baselineC4 case. In addition, the increase in twist near the blade tip indicates that the pitching moment created by the flap resultsin a large local change in incidence that is not entirely transferred along the blade span due to the extremely lowtorsional stiffness of the blade. This increase in twist near the blade tip results in a downward force that isresponsible for the decrease in bending slope near the blade tips. In general, these measurements validate the designand operation of the trailing edge flap and also indicate that the downward force near the blade tips is responsible forits reduced figure of merit (see Sicard and Sirohi). Figure 26. Mean deflection curves for bladeBP at various collective pitch angles. Figure 27. Mean twist distribution curvesfor blade BP at various collective pitch Blade BP is the most effective of the 3 flexible blades presented, as shown in figure 21 it produces the mostthrust, and figure 27 shows that the pitch is nearly constant at lower angles of attack. The deflection curves have aconcave down shape, opposite from blade C4. The tip mass on blade BP is mounted at an angle of -22° relative tothe horizontal, the effect of which is a restoring moment that will attempt to adjust the pitch angle at the blade tip to22°.As shown in figure 27, when the collective pitch angle is less than 22° the blade has little to no twist and thatwhich it has is positive; but, when the collective pitch exceeds 22° the blade has a negative twist down to a tip pitchangle of 22°. This agrees with what was predicted by Sicard and Sirohi. Figure 28. Mean deflection curves for allblades at 14.76° collective pitch. Figure 29. Mean twist distribution curvesfor all blades at 14.76°collective pitch. Figures 28 and 29 compare all three of the flexible blades and the rigid blades. The x-axis in this case is span/Lwhere L is the length of the respective blade. The rigid blade does not extend to the root because it could not fitinside the field of view, though this could be fixed by taking a second set of measurements for a section closer to theroot of the blade and merging the results as was done previously with the vibrating beam experiment. D. Propeller Blade Figure 30. Propeller surface height at 7200 RPM Figure 31. Thrust vs. propeller speed. Due to the high rotational speed of the propeller, images of sufficient intensity could not be obtained using theillumination technique of the previous experiment.A strobe light was used to illuminate the blade at everyrevolution and the camera shutter was opened for 0.5 sec. As a result, the cameras effectively recorded multiplerevolutions per exposure. FHowever, due to the high rigidity of the propeller variation between revolutions wasnegligible. The results showed negligible deformation (Fig. 30) of the propeller across the range of speeds tested (3600-7200 RPM), due to the high rigidity of the propeller and the low thrust produced (Fig. 31). Measurements at higherrotational speed were not possible due to a noticeable blur of the images. Testing at higher speeds will be performedusing a laser strobe. Note that the surface height is shifted by approximately 20.70 mm. While the deformation wasnot discernable by the DIC process, the software was able to determine the shape of the surface. The best precisionof deformation vectors that can be achieved is with a 128x128 pixel interrogation window at an accuracy of 0.0 1pixels, which with a calibration parameter of 16.906 pixels per mm the spatial precision is 0.592 um. Thedeformation could not be measured with suitable accuracy because the noise level approaches the order ofmagnitude of the deflection to be measured. V. Concluding Remarks The digital image correlation technique has proven to be a viable method for measuring the deformation of rotorblades. Flapping and pitching mode shapes are fairly easily extracted from the vector deformation field. Thedeflection itself has proven to be accurate as shown by the vibrating beam experiment comparison to LDS results;however, the pitch angle was typically slightly under-predicted in the listed experiments. The longitudinal strain canthen be calculated from the curvature of the blade. The accuracy and spatial resolution of the technique enabledmeasurements of the flexible rotor blades which would otherwise be very difficult. Future work will expand the study to explore the application of DIC to larger diameter rotor blades and calculatethe expected thrust based on the bending and torsion curves to compare against measured thrust from a load cell.Also, a comparison between the strain measured by the DIC technique and conventional foil strain gages will bemade. Once the strain has been verified a full-field strain analysis will be performed for rigid helicopter blades. VI. IReferences Schmidt, T., Tyson, J., Galanulis, K.,“Full-Field Dynamic Displacement and Strain Measurement Using Advanced 3DImage Correlation Photogrammetry: Part 1”, Experimental Techniques, 27(3),47-50,2003. Rajpal S. Sirohi, Optical Methods of Measurement: Whole-field Techniques, Second edition, Francis and Taylor/CRCPress.2009. Cloud, G. Optical Methods ofEngineering Analysis, Cambridge University Press, 1995.x11 ( "Williams, D. C. Optical Methods in Engineering Metrology, Chapman and Hall, 1 9 93. ) ( Tyson, J.,“Noncontact Full-Field Strai n Measurement With 3D ESPI", Sensors, 5, 62-70 , 2000. ) Kahn-Jetter, Z. L., and Chu, T. C.,“Three-Dimensional Displacement Measurements Using Digital Image Correlation andPhotogrammic Analysis”, Experimenta Mechanics, 30, 10-16, 1990. 'Schmidt, T., Tyson, J., Galanulis, K.,“Full-Field Dynamic Displacement and Strain Measurement - Specific ExamplesUsing Advanced 3D Image Correlation Photogrammetry: Part 2”, Experimental Techniques, 27(4), 22-26,2003. Schmidt, T., Tyson, J.,Galanulis, K.,“Advanced Photogrammetry for Robust Deformation and Strain Measurement”, SEM2002 Annual Conference, SEM, Milwaukee, WI, June 2002. Schmidt, T., Tyson, J., Galanulis, K., “Optical Deformation & Strain Measurements in Biomechanics”, Biophotonics, 1-7,September 2003. Schmidt, T.,Tyson, J., Revilock, D.M. Jr., Padula, S. II, Pereira, J.M., Melis, M., Lyle, K.,“Performance Verification of3D Image Correlation Using High-Speed Cameras”, SEM 2005 Annual Conference and Exposition, SEM, Portland, OR, 2005. McNeill, S.R., Sutton, M.A., Miao, Z., Ma, J.,“Measurement of Surface Profile Using Digital Image Correlation andPhotogrammic Analysis”,Experimental Mechanics,30(3), 13-20,1990. 12Siebert, T., Becker, T., Spiltthof, K., Neumann, I., Krupka,R.,“High-Speed Digital Image Correlation: Error Estimationsand Applications”, Optical Engineering, 46, May 2007. 1D3atta, A. and Chopra, I.,“Validation of Structural and Aerodynamic Modeling Using UH-60A Airloads Program Data”,Journal of the American Helicopter Society,51(1), 43-58,2006. “Steijl, R., Barakos, G. N., and Badcock, K. J.,“Computational Study of the Advancing-Side Lift-Phase Problem”,Journalof Aircraft, 45(1), 246-257,2008. 1F5leming, G. A., Gorton, S., “Measurement of Rotorcraft Blade Deformation Using Projection Moire Interferometry",Proceedings of the Third International Conference on Vibration Measurements by Laser Techniques: Advances and Applications, SPIE--the International Society for Optical Engineering, Ancona, Italy, June 16-19,1998, pp. 514-527. Olson, L., Abrego, A., Barrows, D., and Burner, A.,“Blade Deflection Measurements ofa Full-Scale UH-60A RotorSystem”, American Helicopter Society Aeromechanics Specialist’Conference, San Francisco, California, January 20-22, 2010. Wu, P., Stanford, B., Ifju., P., Bowman, W., and Schwartz, A.,“Digital Image Correlation Techniques for Full-Field Displacement Measurements of Micro Air Vehicle Flapping Wings”, Experimental Techniques, November, 2009. LaVision, DaVis StrainMaster 3D, Software Package, Ver 7.2, Gottingen, Germany, January 2010. 19Mikhail, E., Bethel, J., McGlone, J., Introduction to Modern Photogrammetry, John Wiley and Sons, Inc., Neew(ork.2001. Sicard, J., Sirohi, J., “Behavior of Extremely Flexible Rotor in Hover and Forward Flight”, 66th AHS meeting, Phoenix,AZ, USA,2010. Sicard, J., Sirohi, J.,“Twist Control of an Extremely Flexible Rotor Blade for Micro-Aerial Vehicles”,67th AHS meeting,Tempe, AZ,USA, 2011. American Institute of Aeronautics and AstronauticsCopyright@ by the American Institute of Aeronautics and Astronautics, Inc. All rights reserved. merican Institute of Aeronautics and Astronautics An experimental study on the application of Digital Image Correlation (DIC) to measure the deformation of rotating blades is described. Commercial DIC software was used to obtain measurements on three different types of rotors with diameter from 24 to 3 and with varying flexibility to explore applicability of the technique over a range of scales. The image acquisition was synchronized with the frequency of rotation such that images could be obtained at the same phase and the consistency of measurements was observed. Bending and twist distributions were extracted from the data with deformation as high as 0.4 measured with an accuracy of 0.0038. The technique was demonstrated to have many advantages including full-field high resolution results, non-intrusive measurement, and good accuracy over a range of scales. Measurement of blade deformation that would not have been possible with other techniques demonstrated the utility of the DIC method.
确定


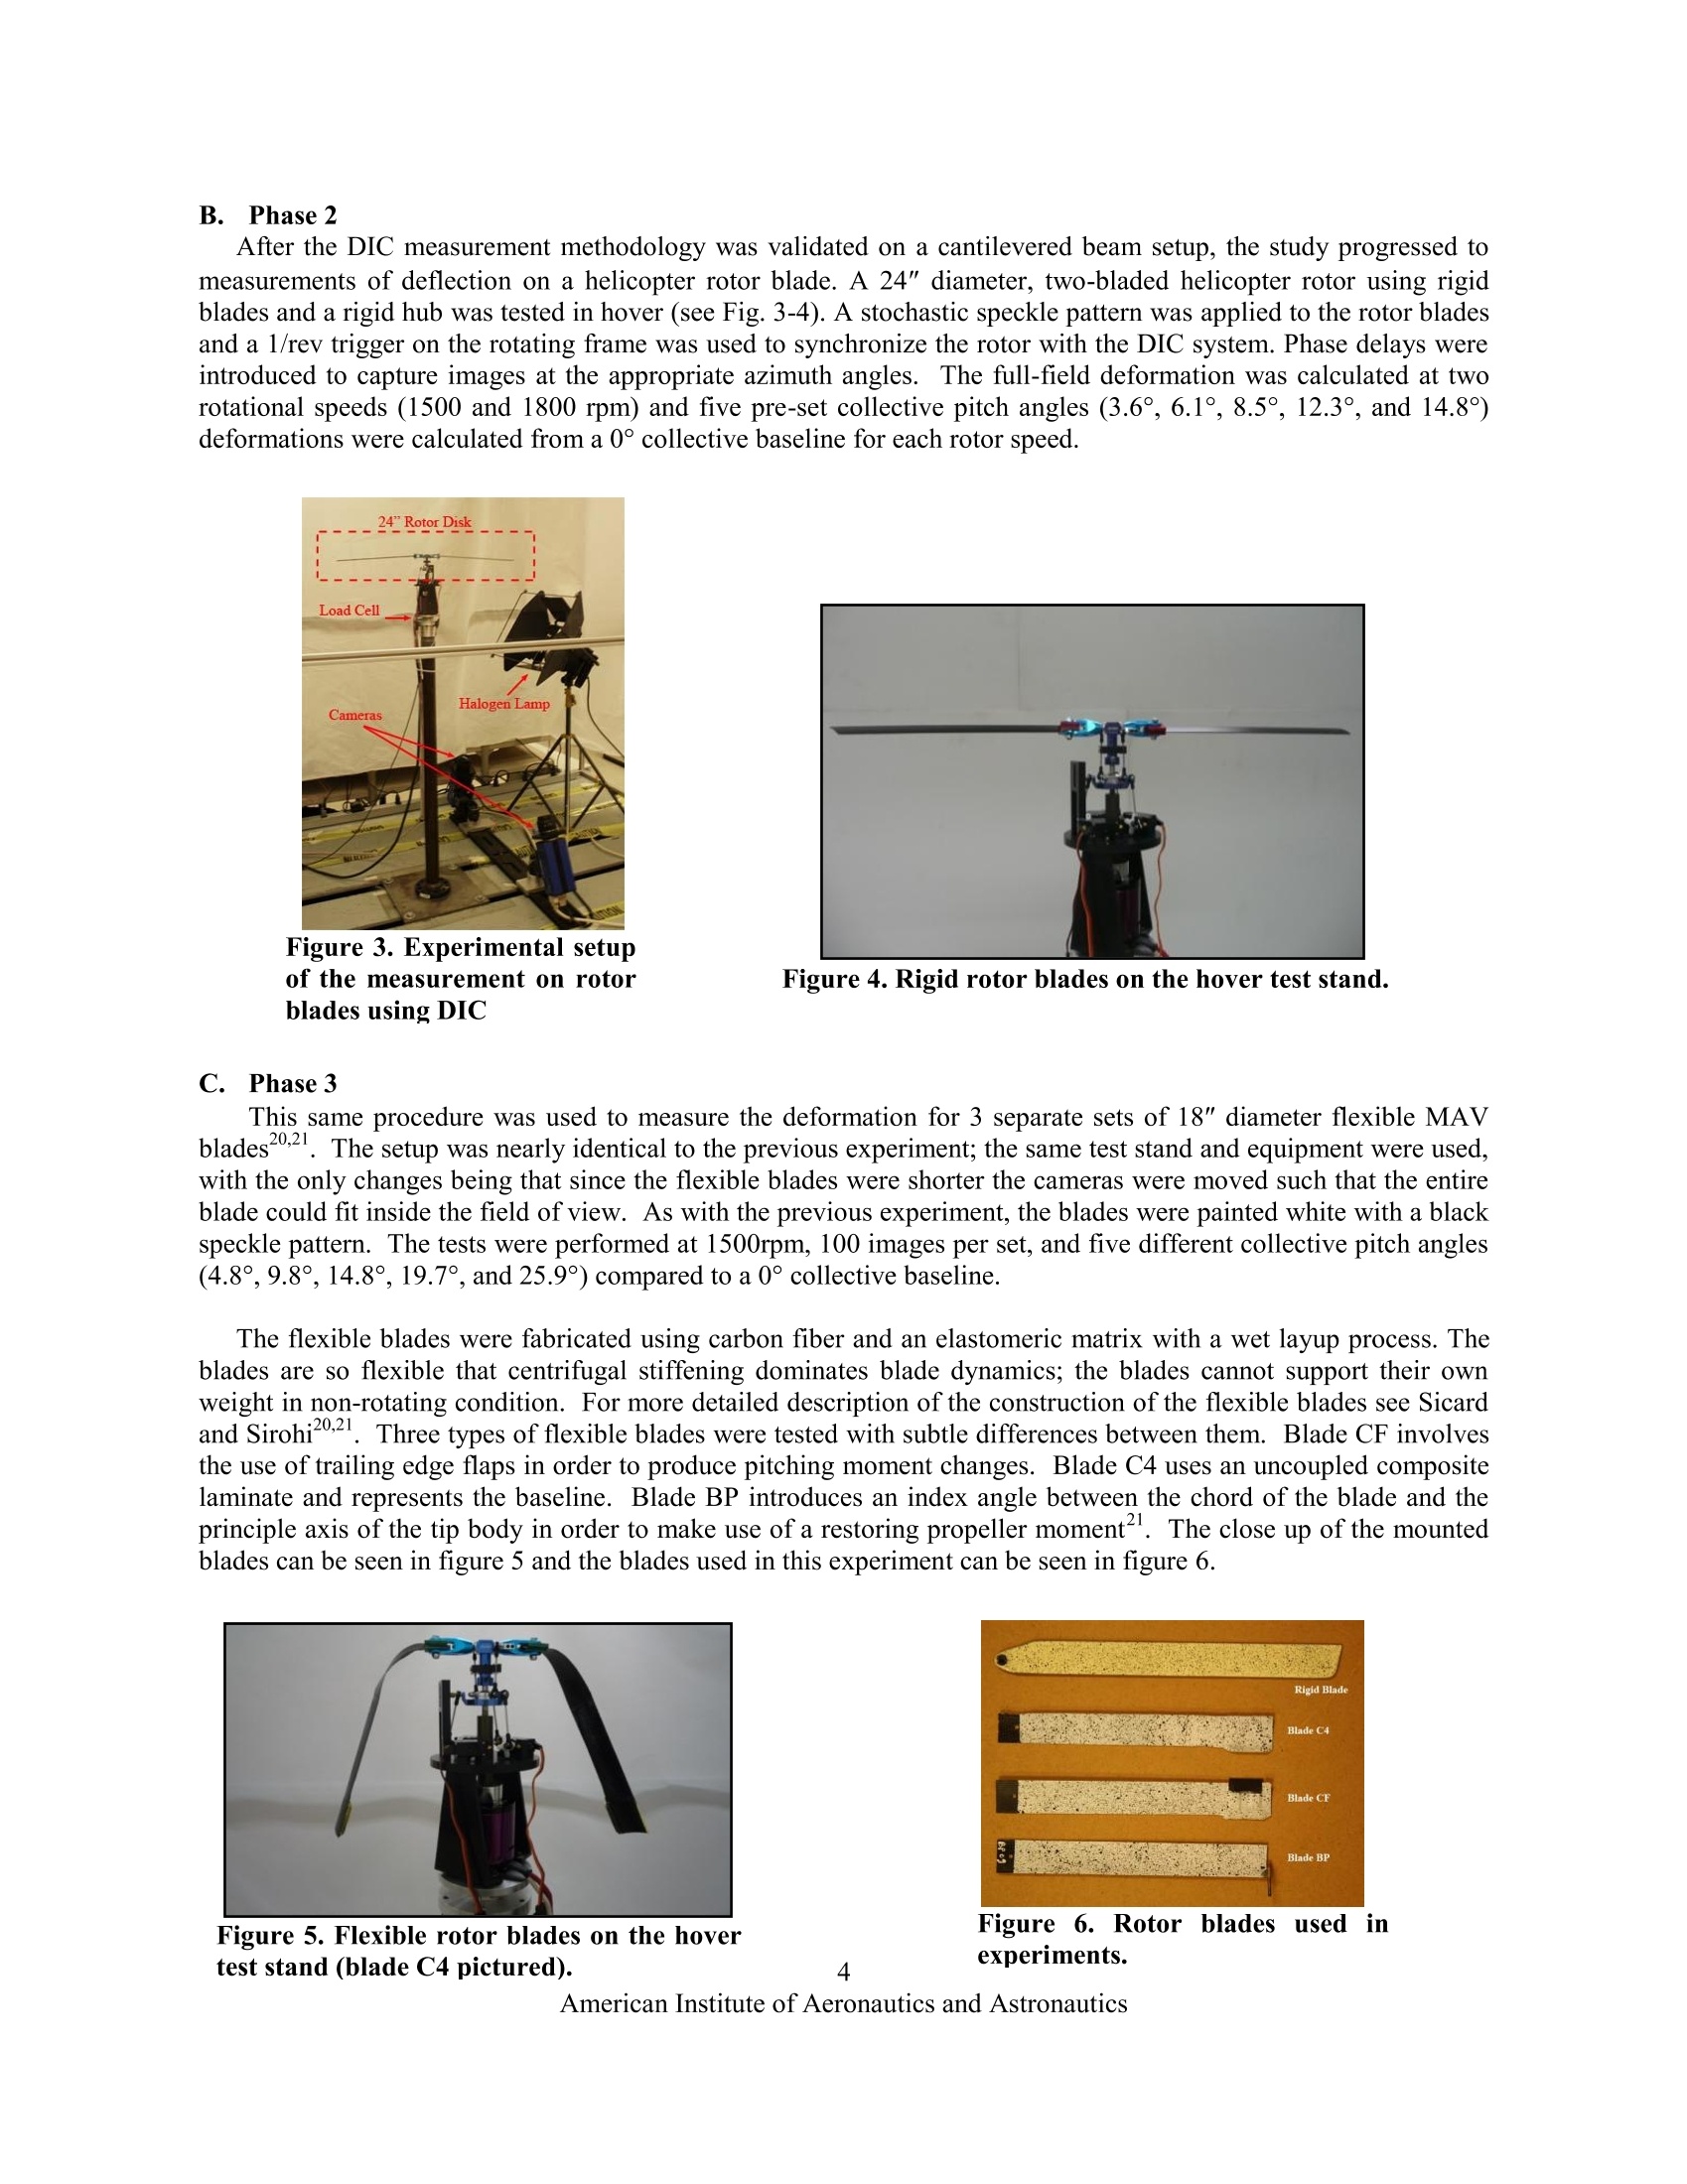
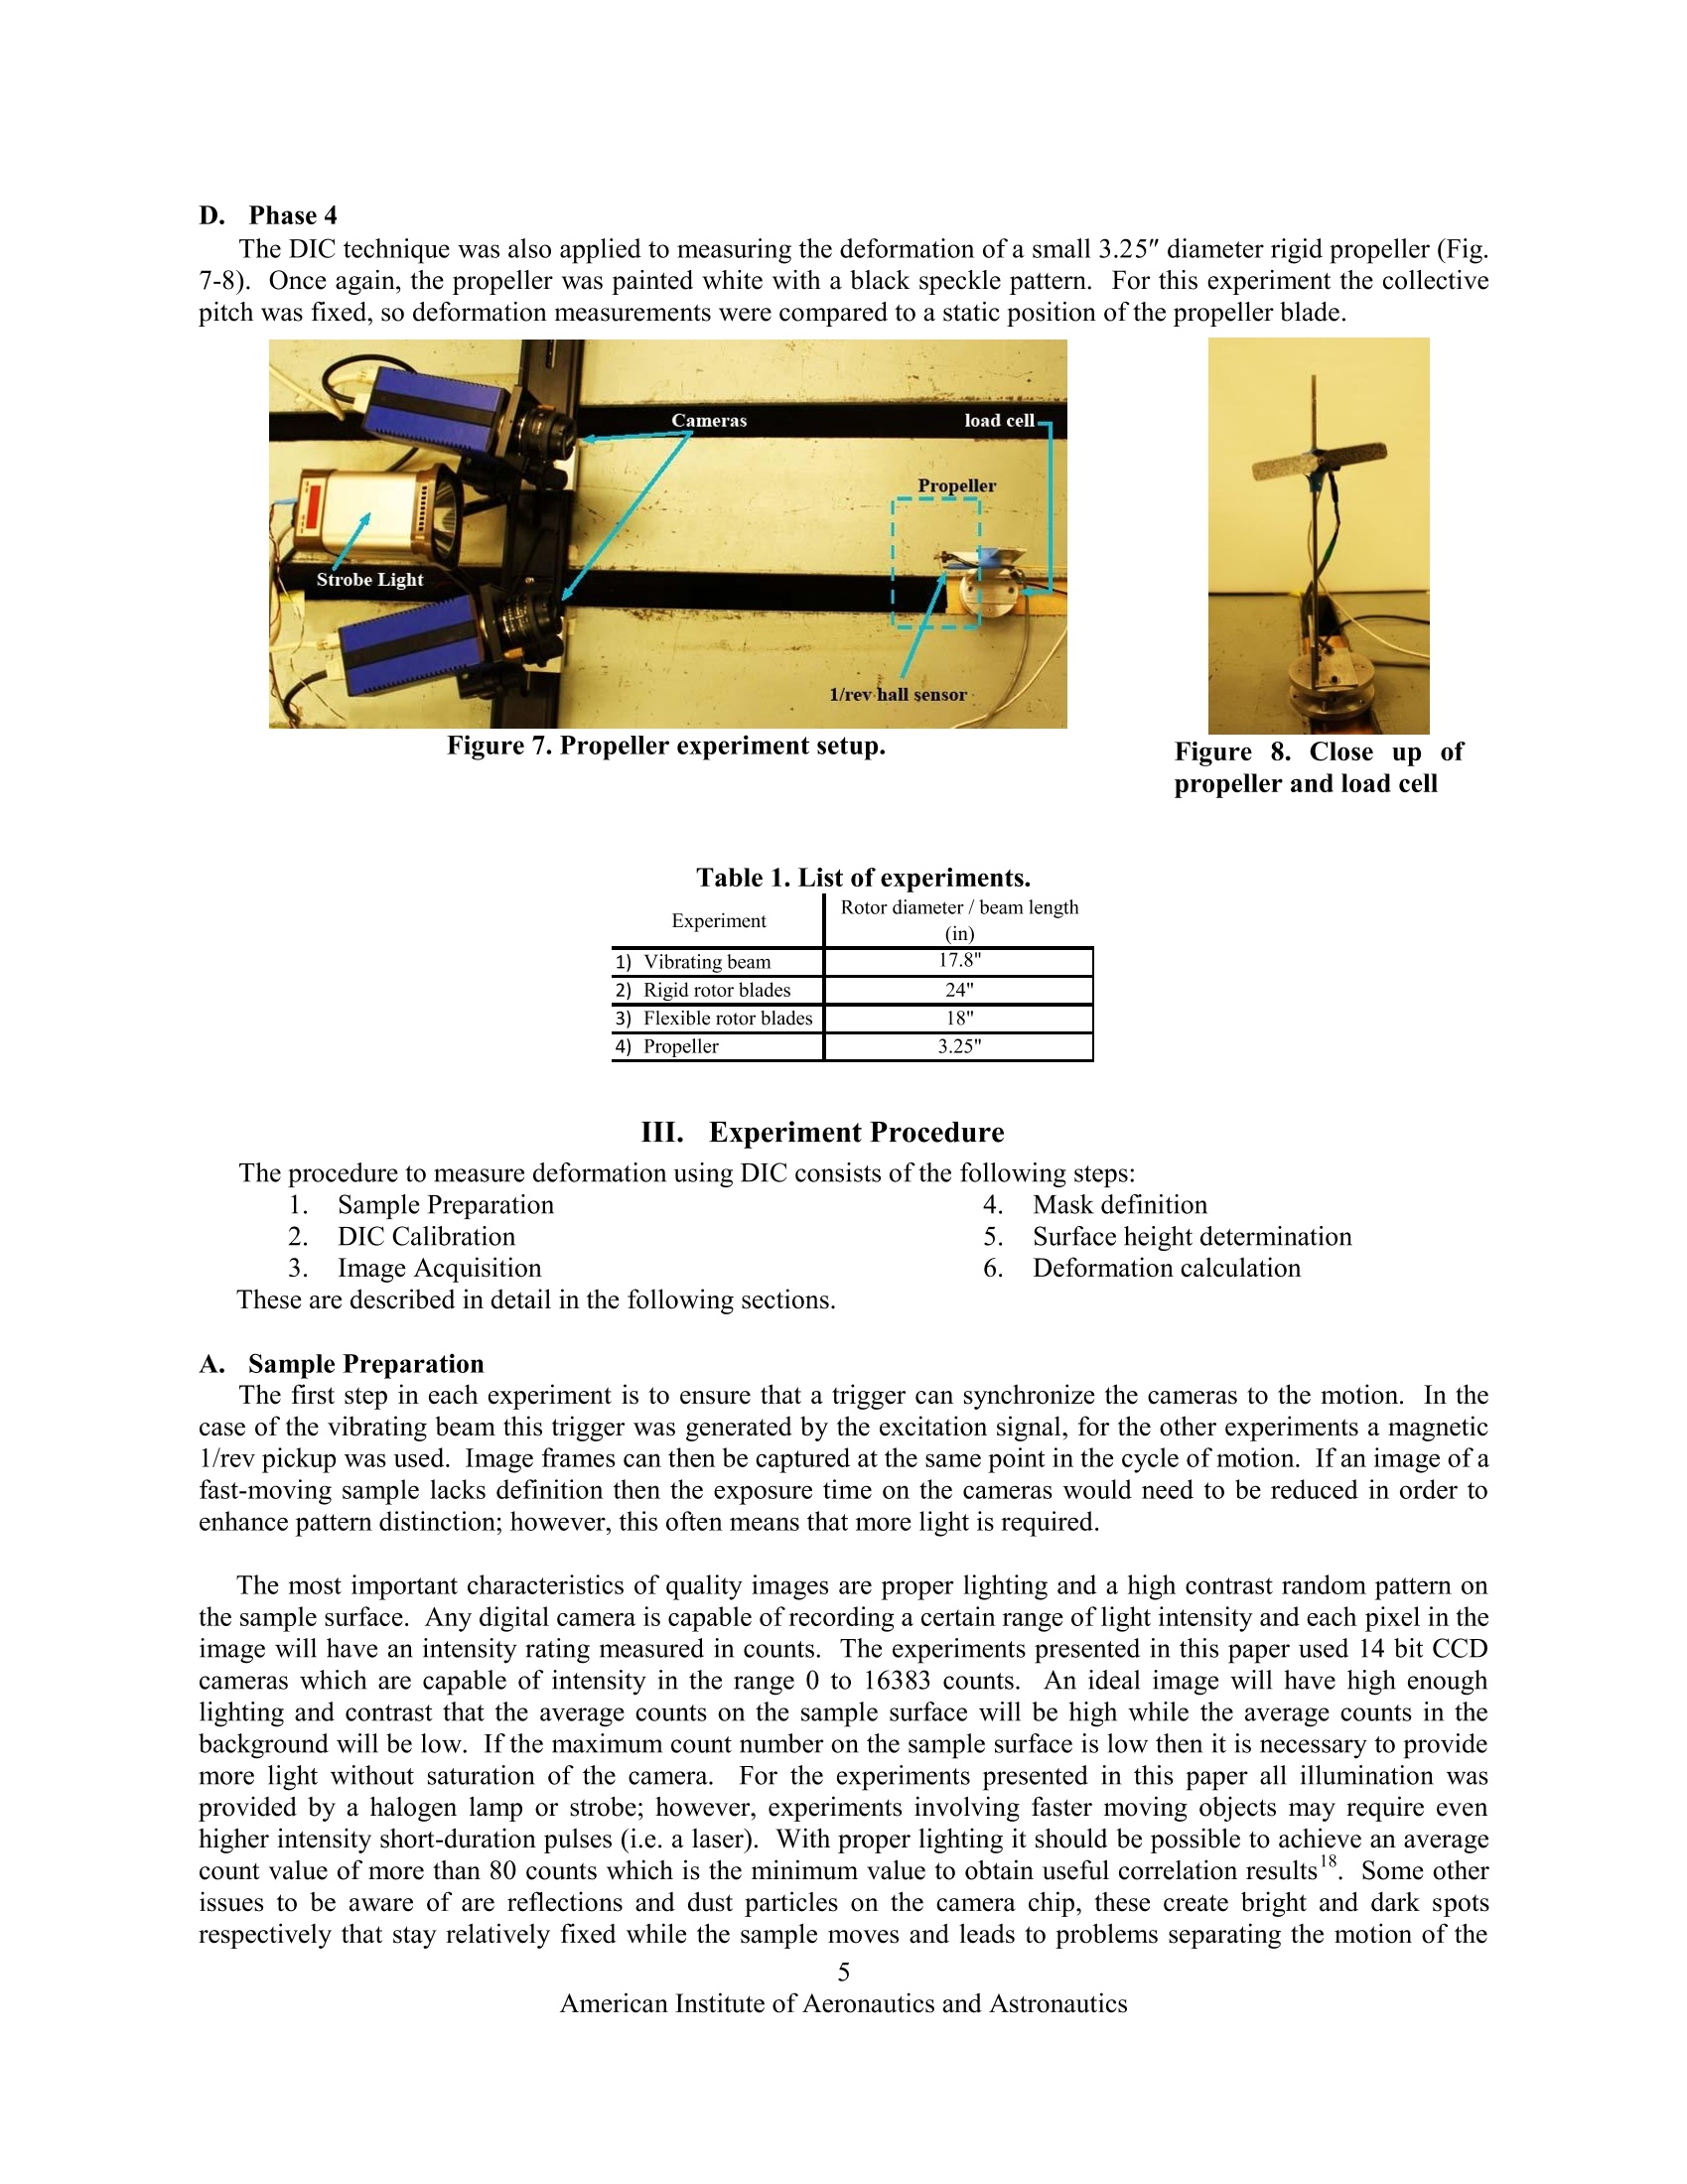


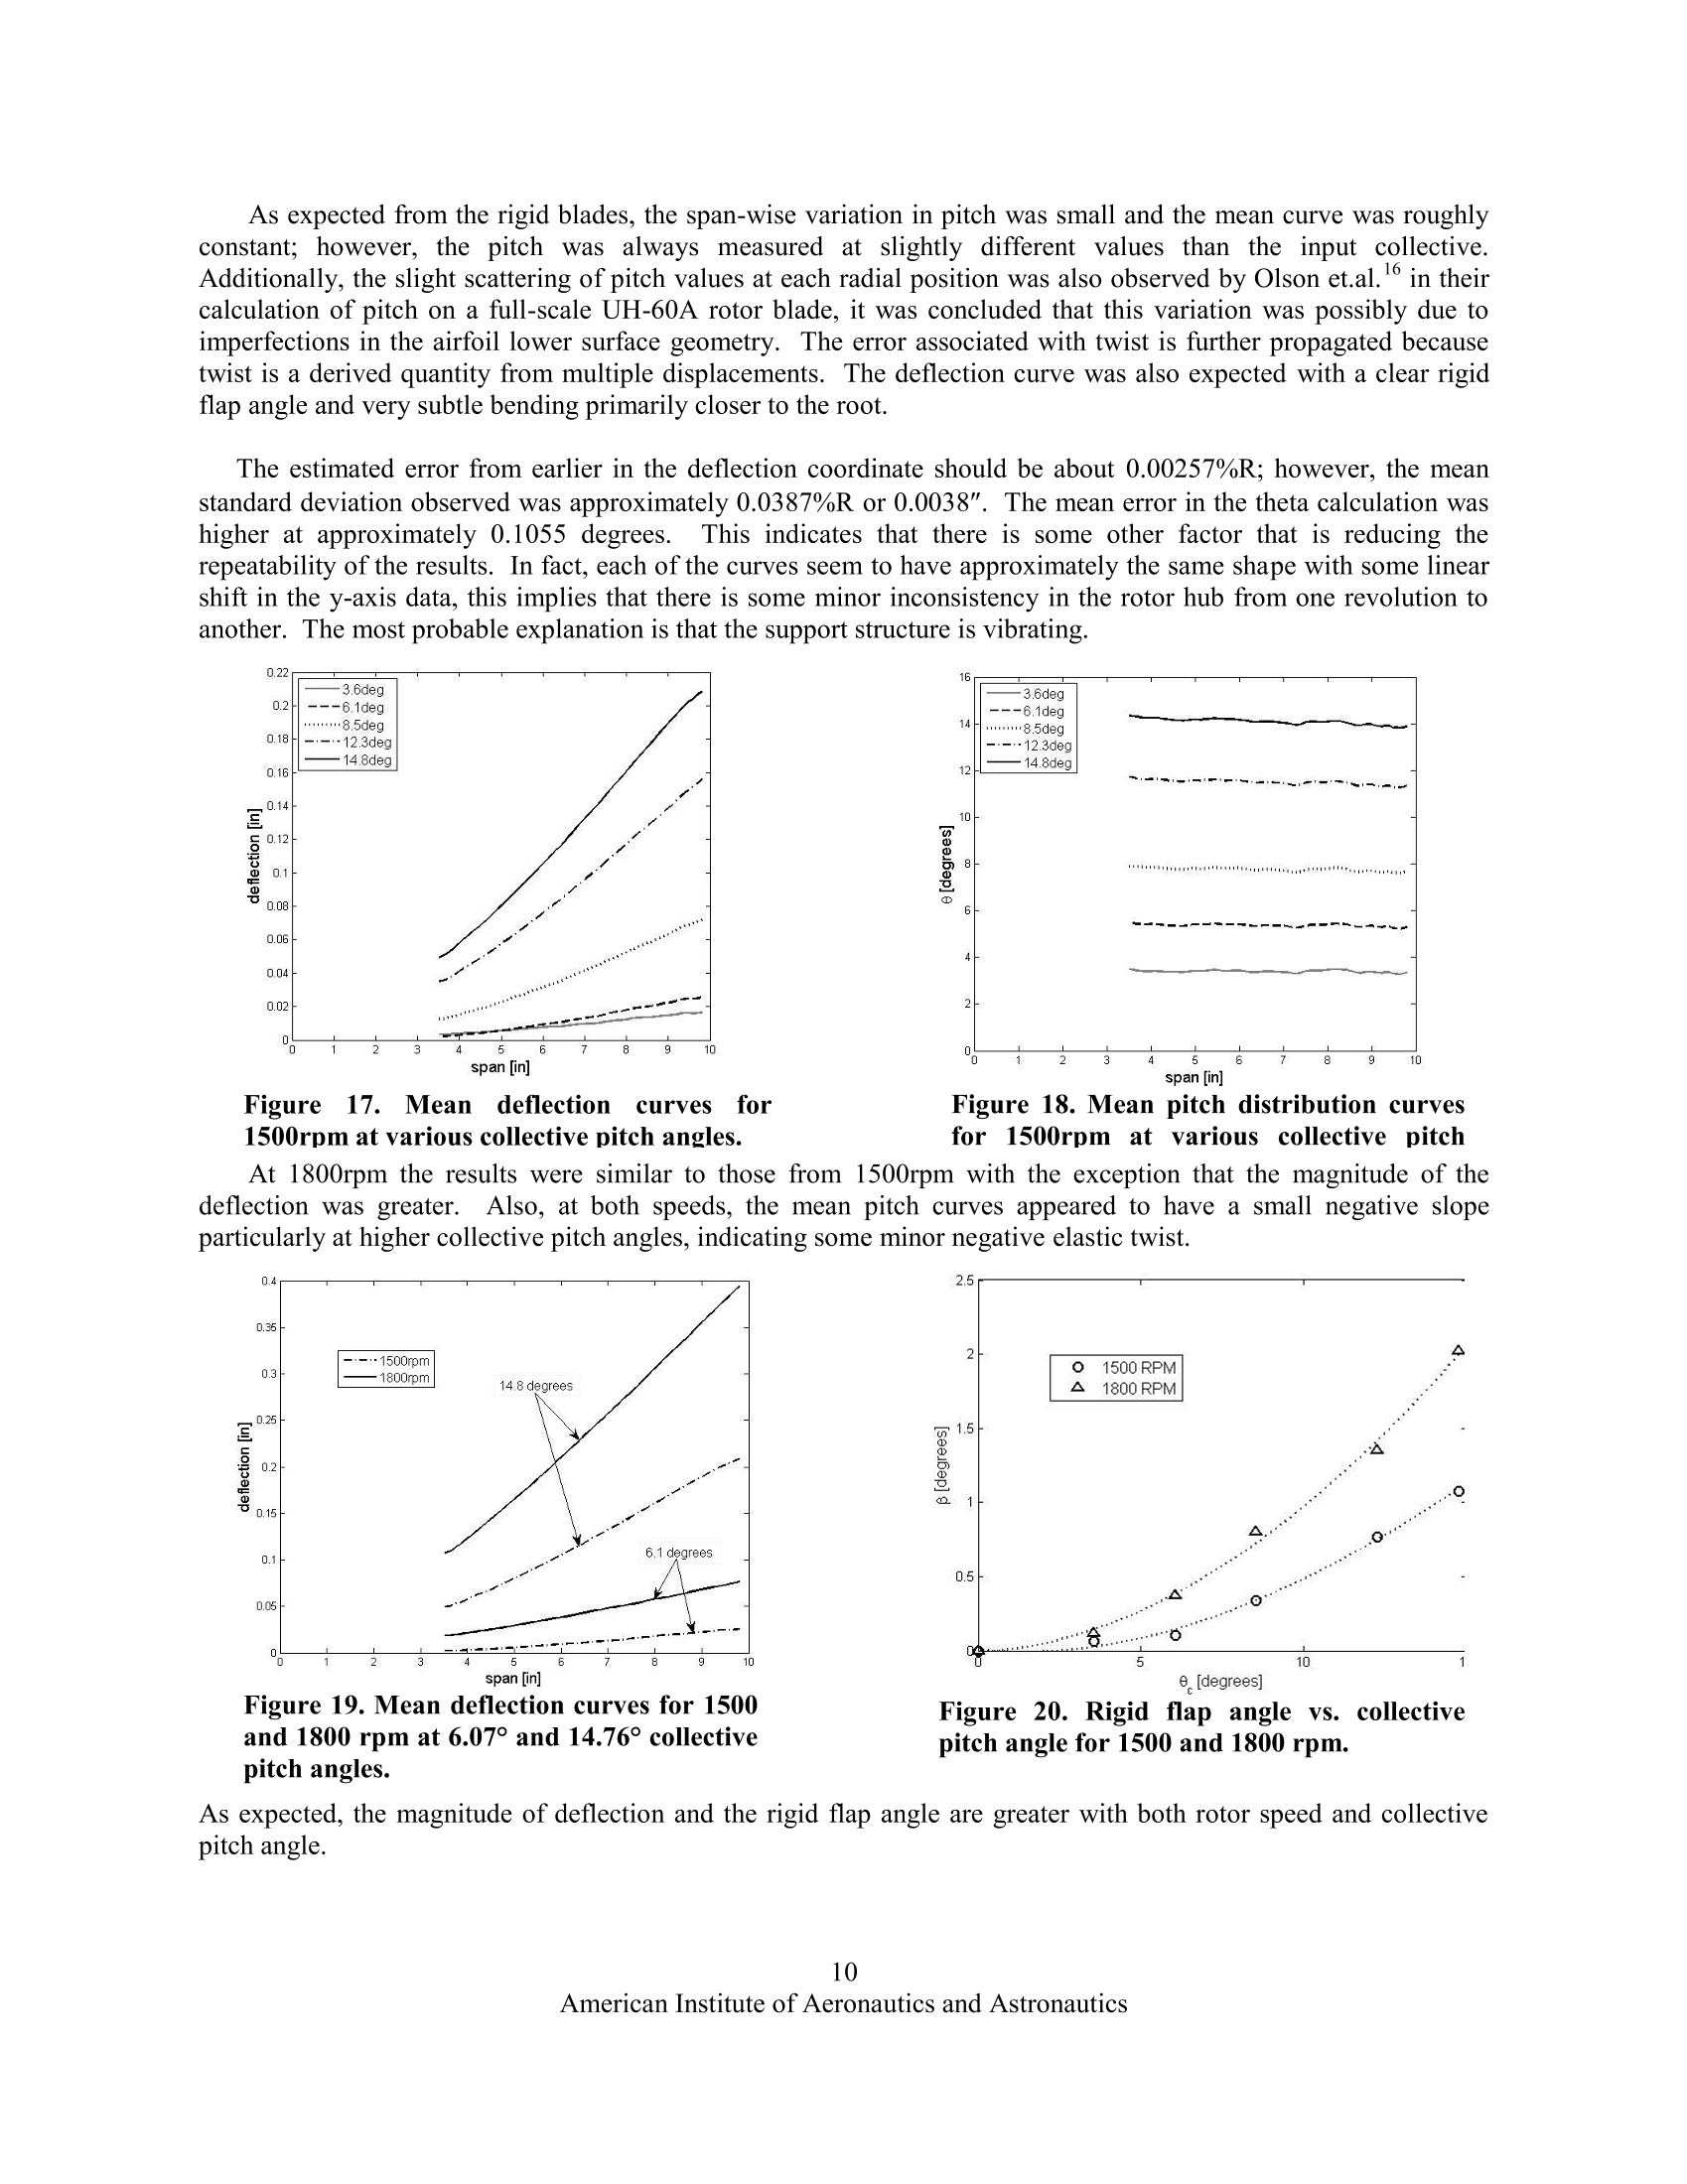


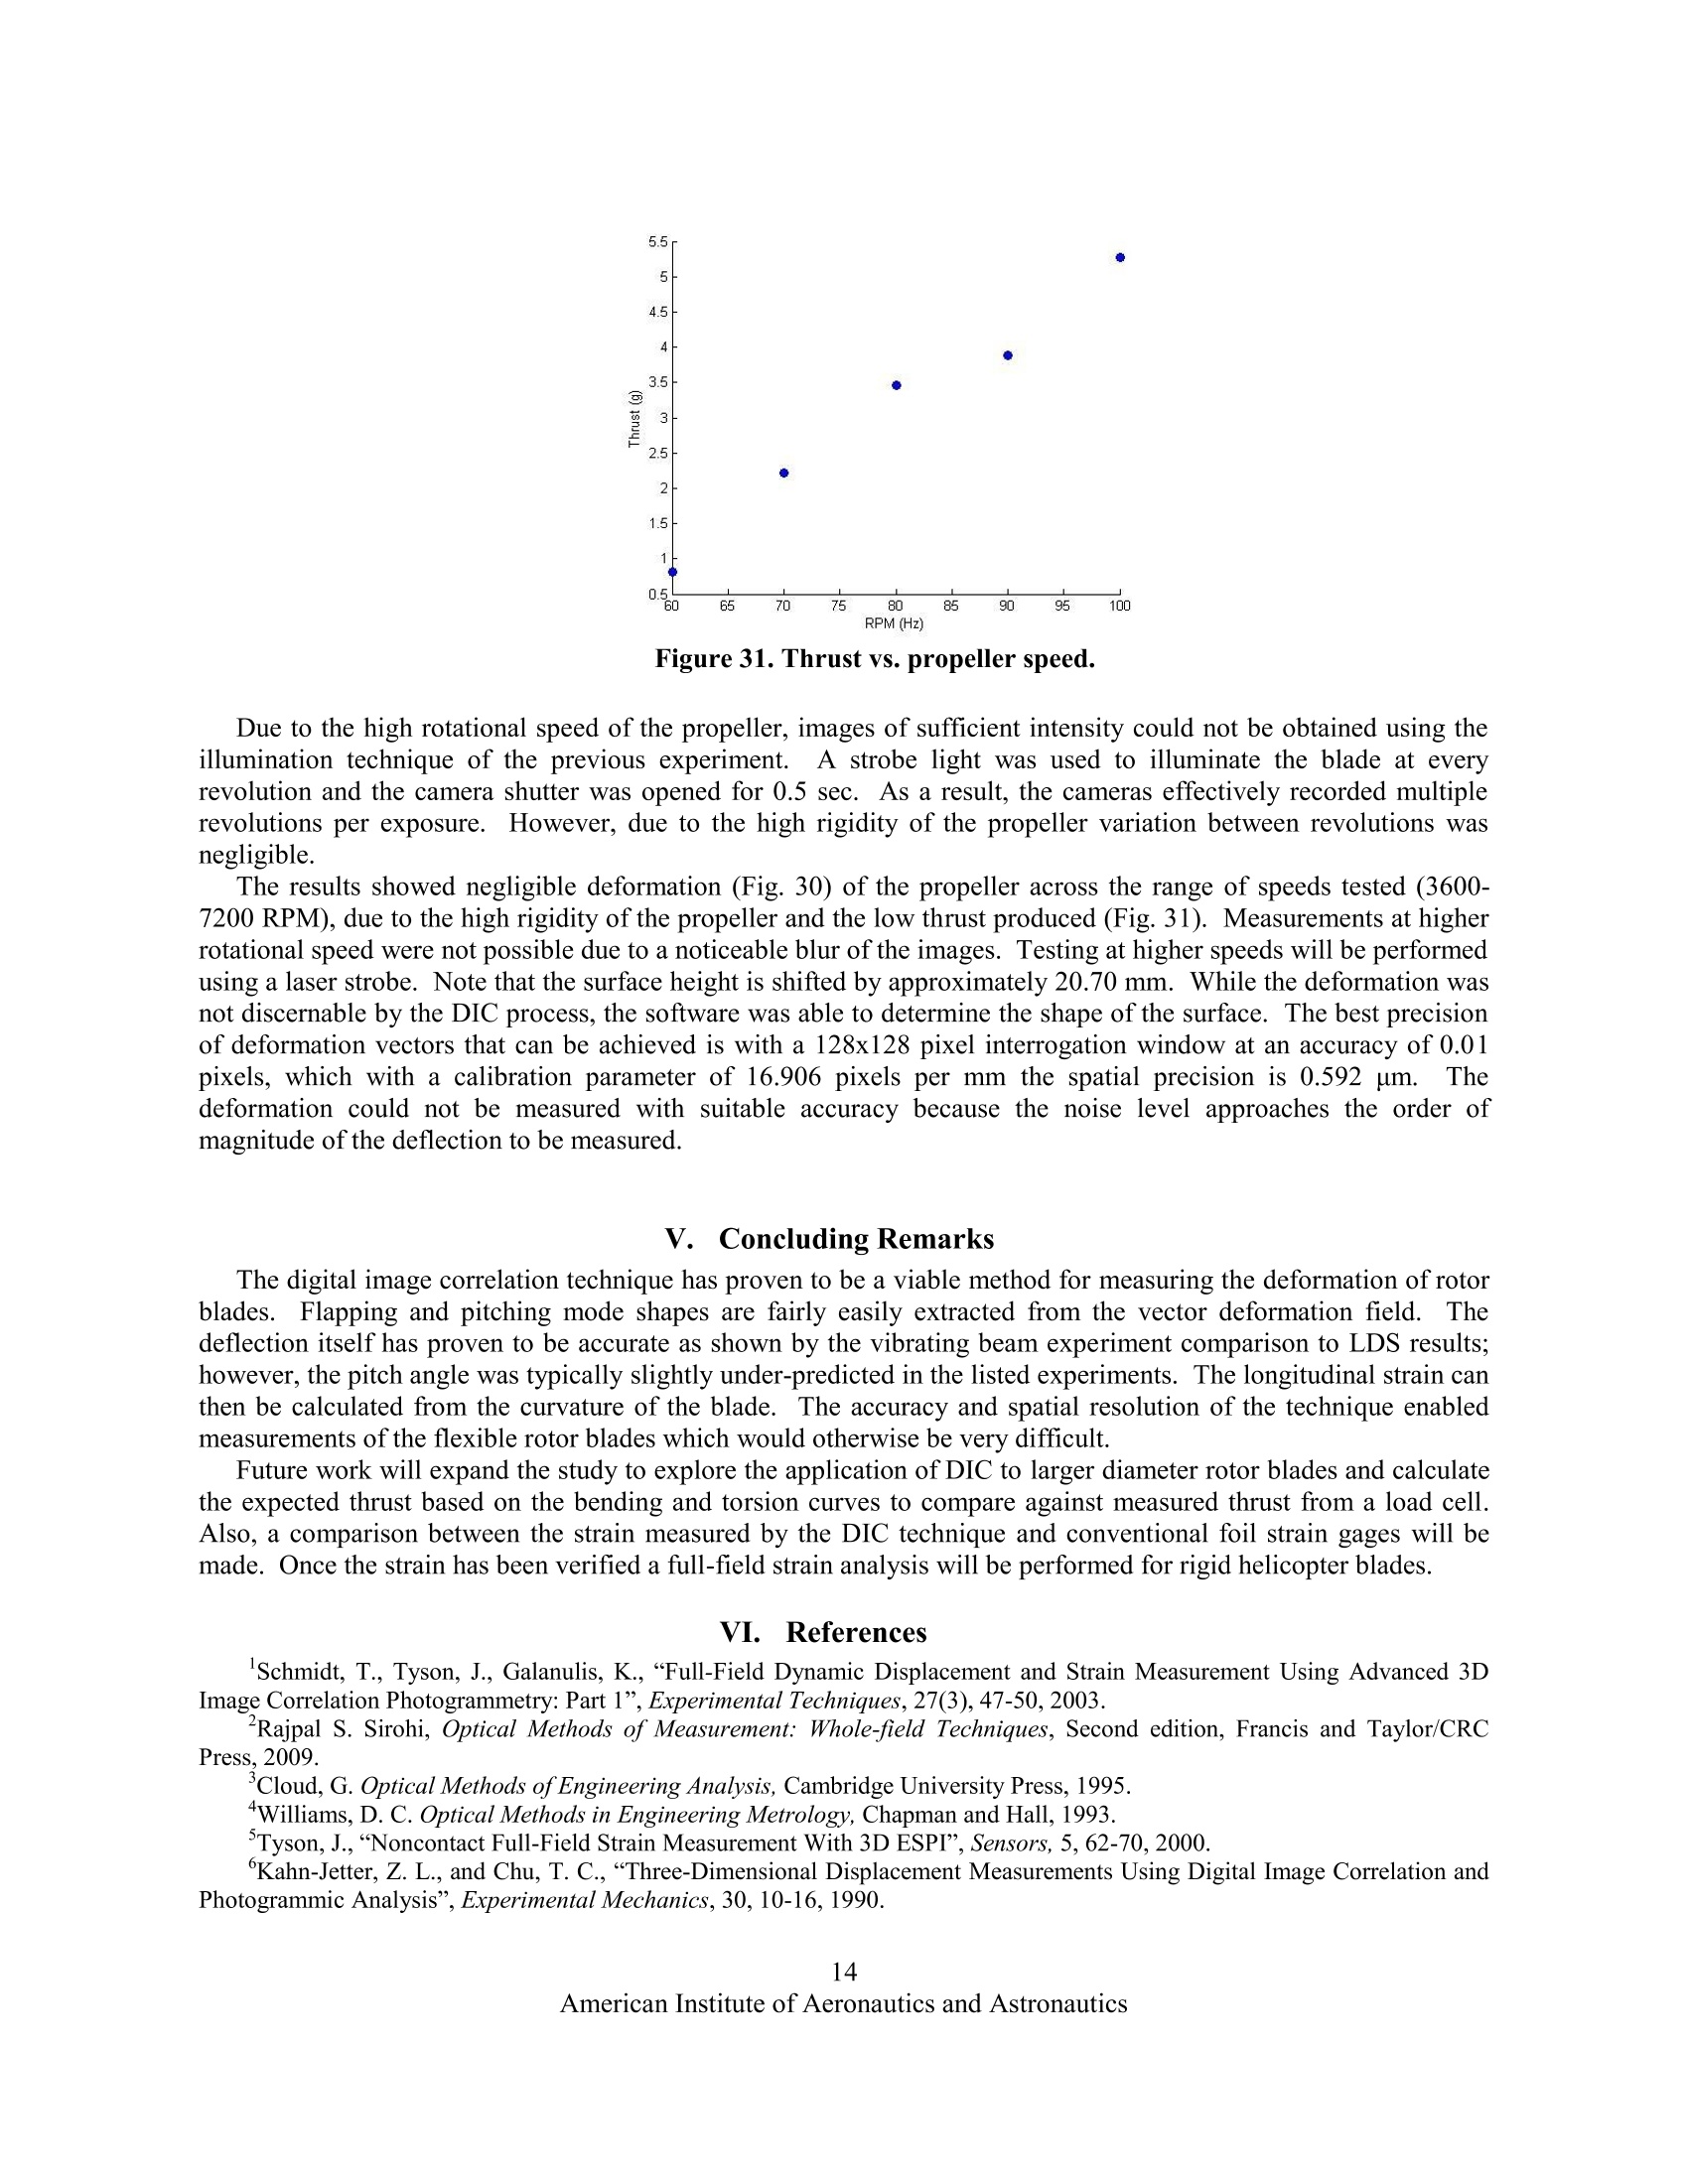

还剩13页未读,是否继续阅读?

产品配置单
北京欧兰科技发展有限公司为您提供《旋转叶片中数字图像相关形变,应变检测方案(其它无损检测仪器/设备)》,该方案主要用于其他中数字图像相关形变,应变检测,参考标准--,《旋转叶片中数字图像相关形变,应变检测方案(其它无损检测仪器/设备)》用到的仪器有LaVision StrainMaster材料应变形变成像测量系统
推荐专场
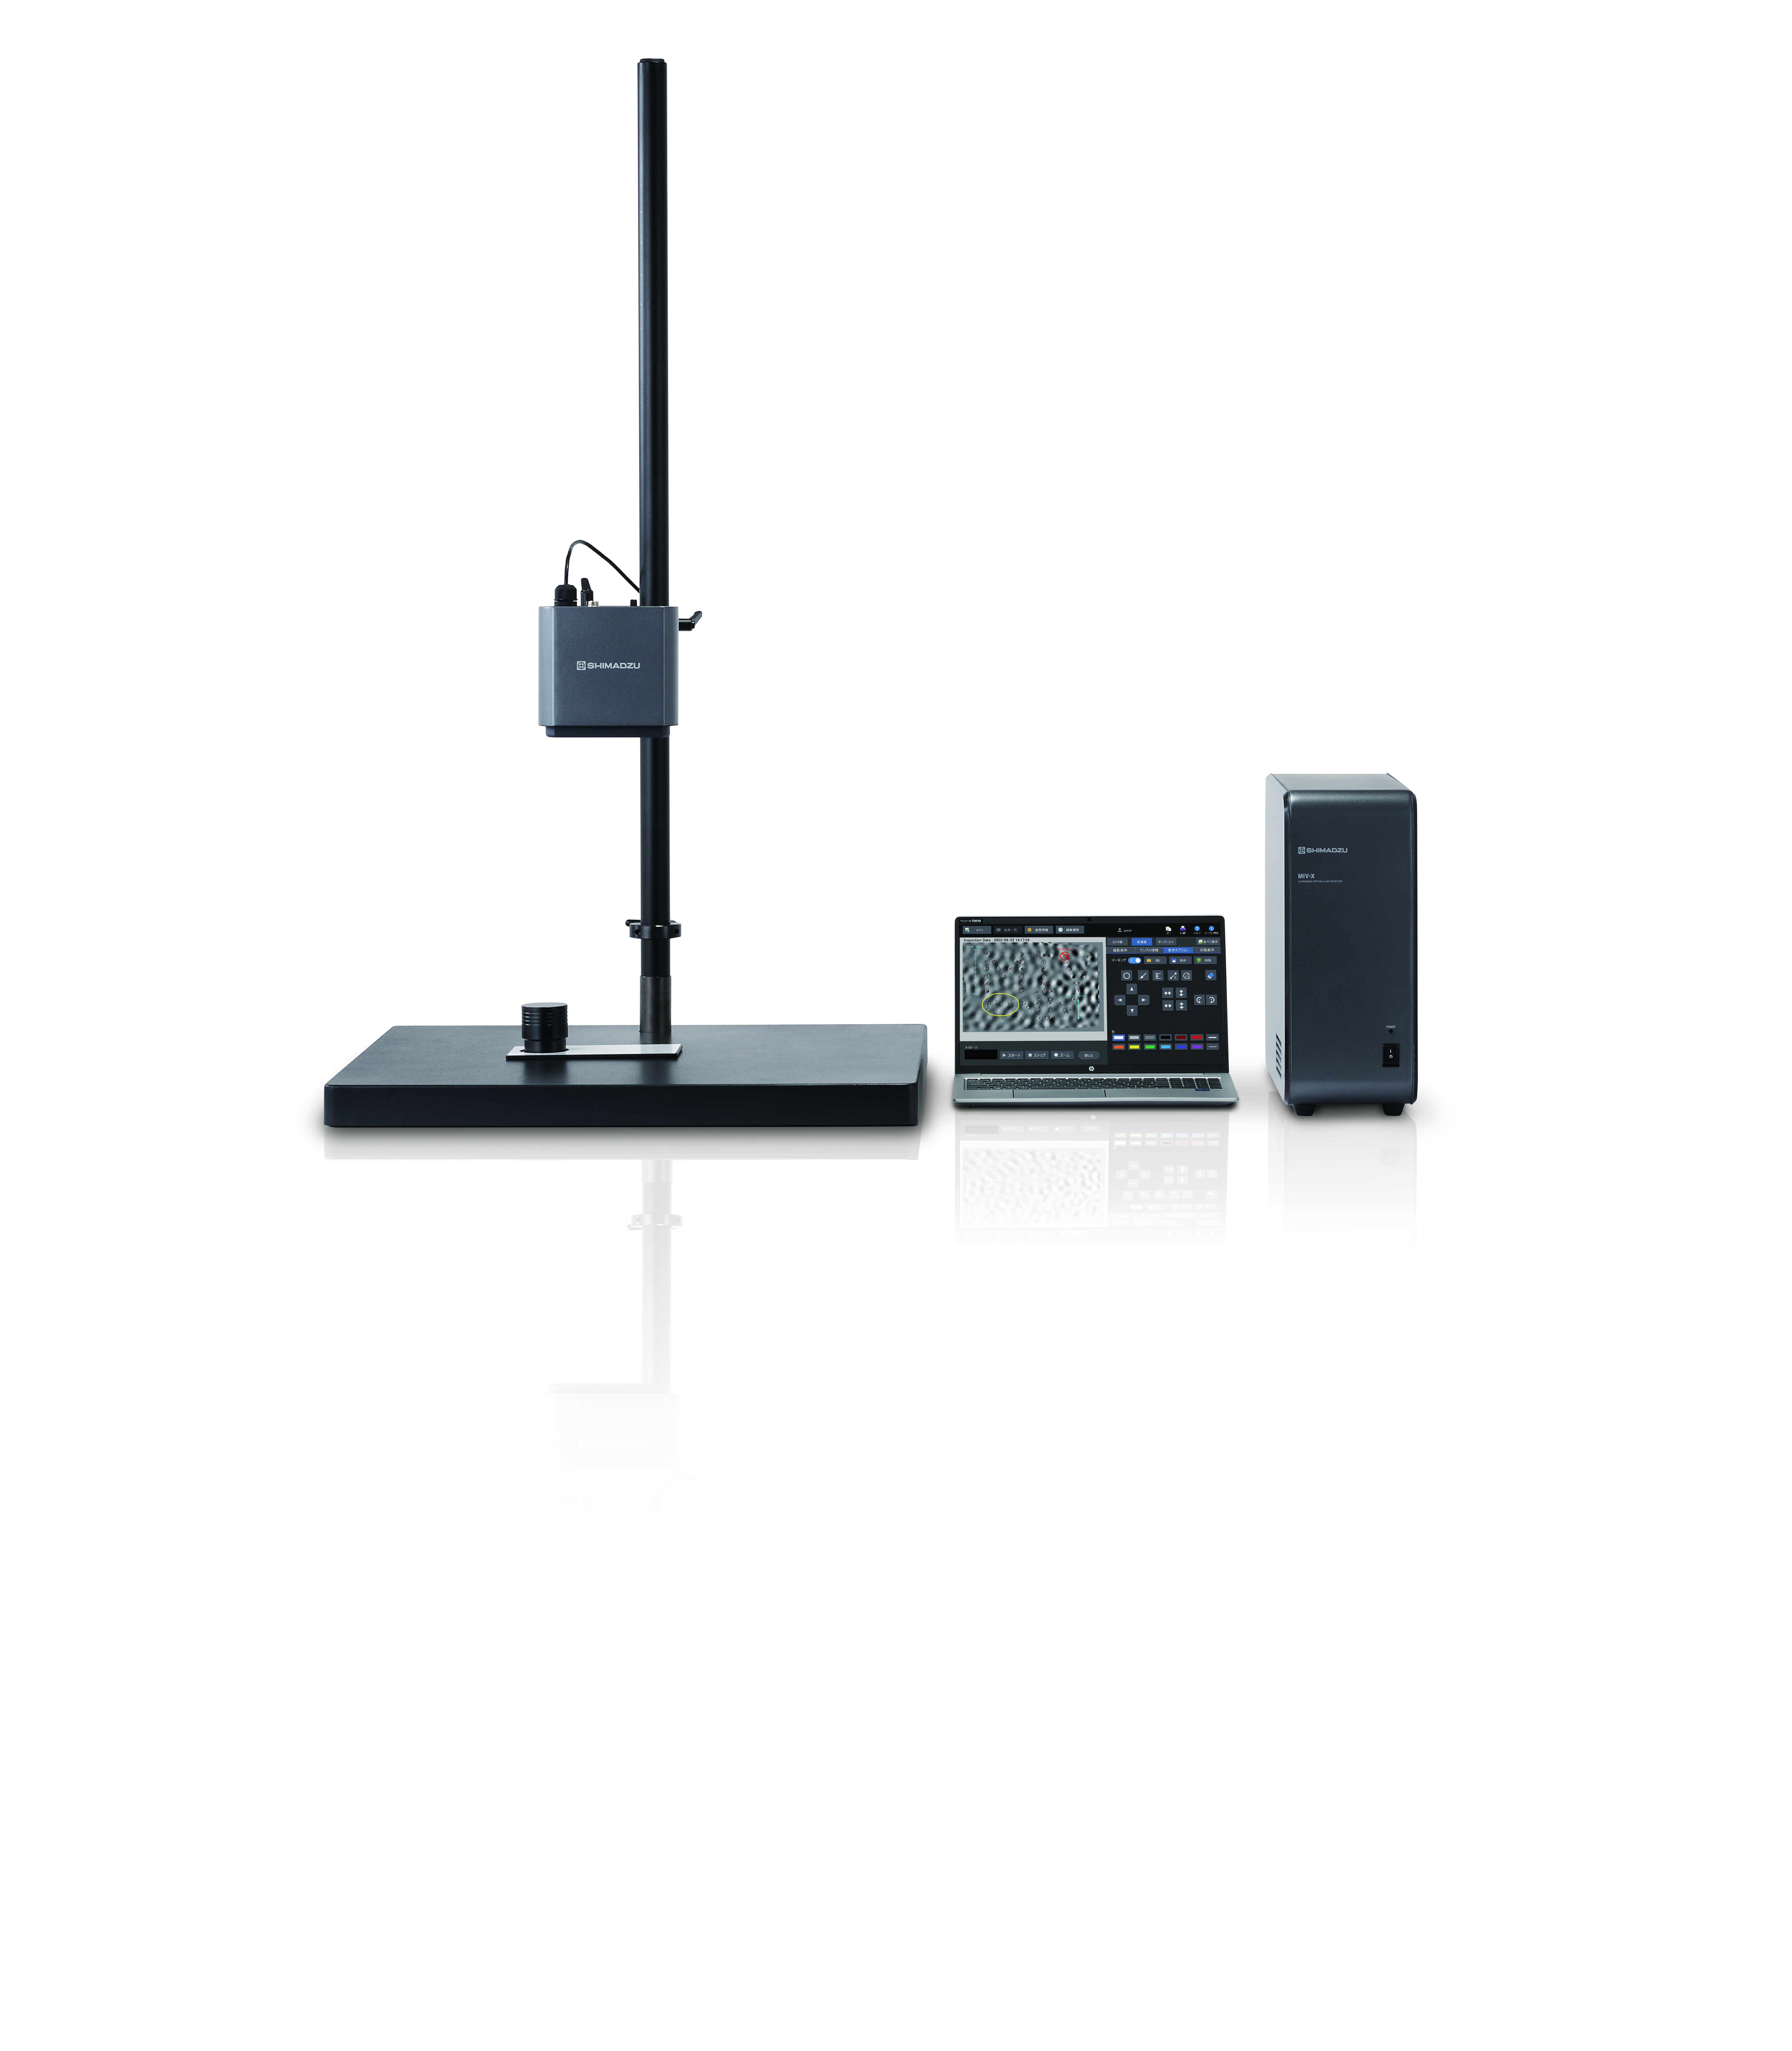
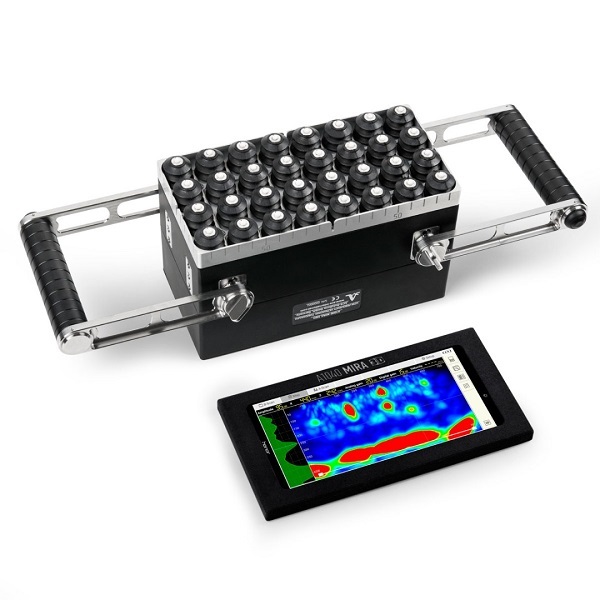

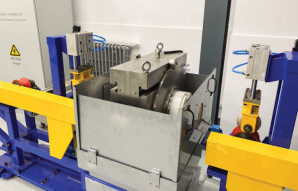
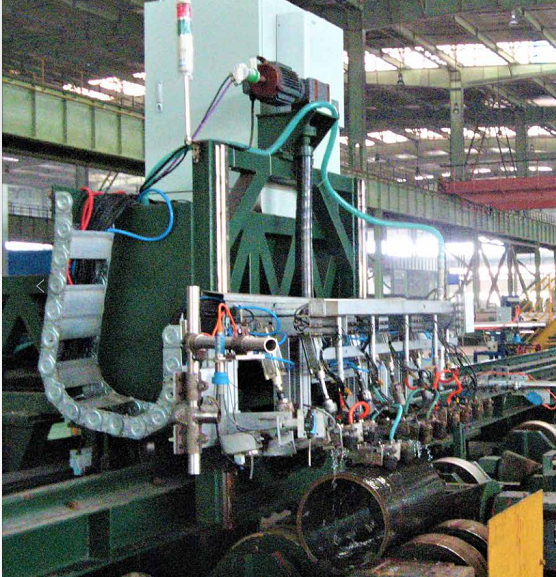
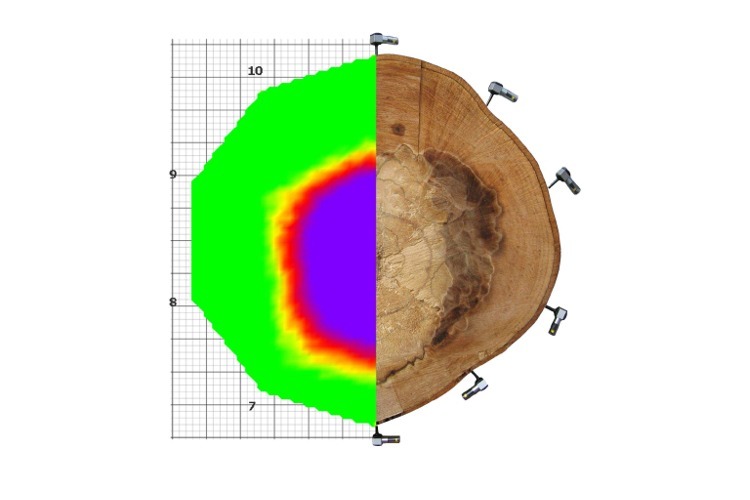
相关方案
更多
该厂商其他方案
更多