


方案详情
文
An experimental study has been conducted to investigate the static and wind-on
performance of two in-house-developed polymer-based pressure-sensitive paints. Platinum
tetrakis (pentafluorophenyl) porphyrin and tris-bathophenanthroline ruthenium II are used as the
luminophores of these two polymer-based pressure-sensitive paints. The pressure and temperature
sensitivity and the photo-degradation rate of these two pressure-sensitive paints have been
investigated. In the wind tunnel test, it was observed that the normalised intensity ratio of both
polymer-based pressure-sensitive paints being studied decreases with increasing the number of wind
tunnel runs. The exact reason that leads to the occurrence of this phenomenon is unclear, but it is
deduced that the luminophore is either removed or deactivated by the incoming flow during a wind
tunnel test.
方案详情

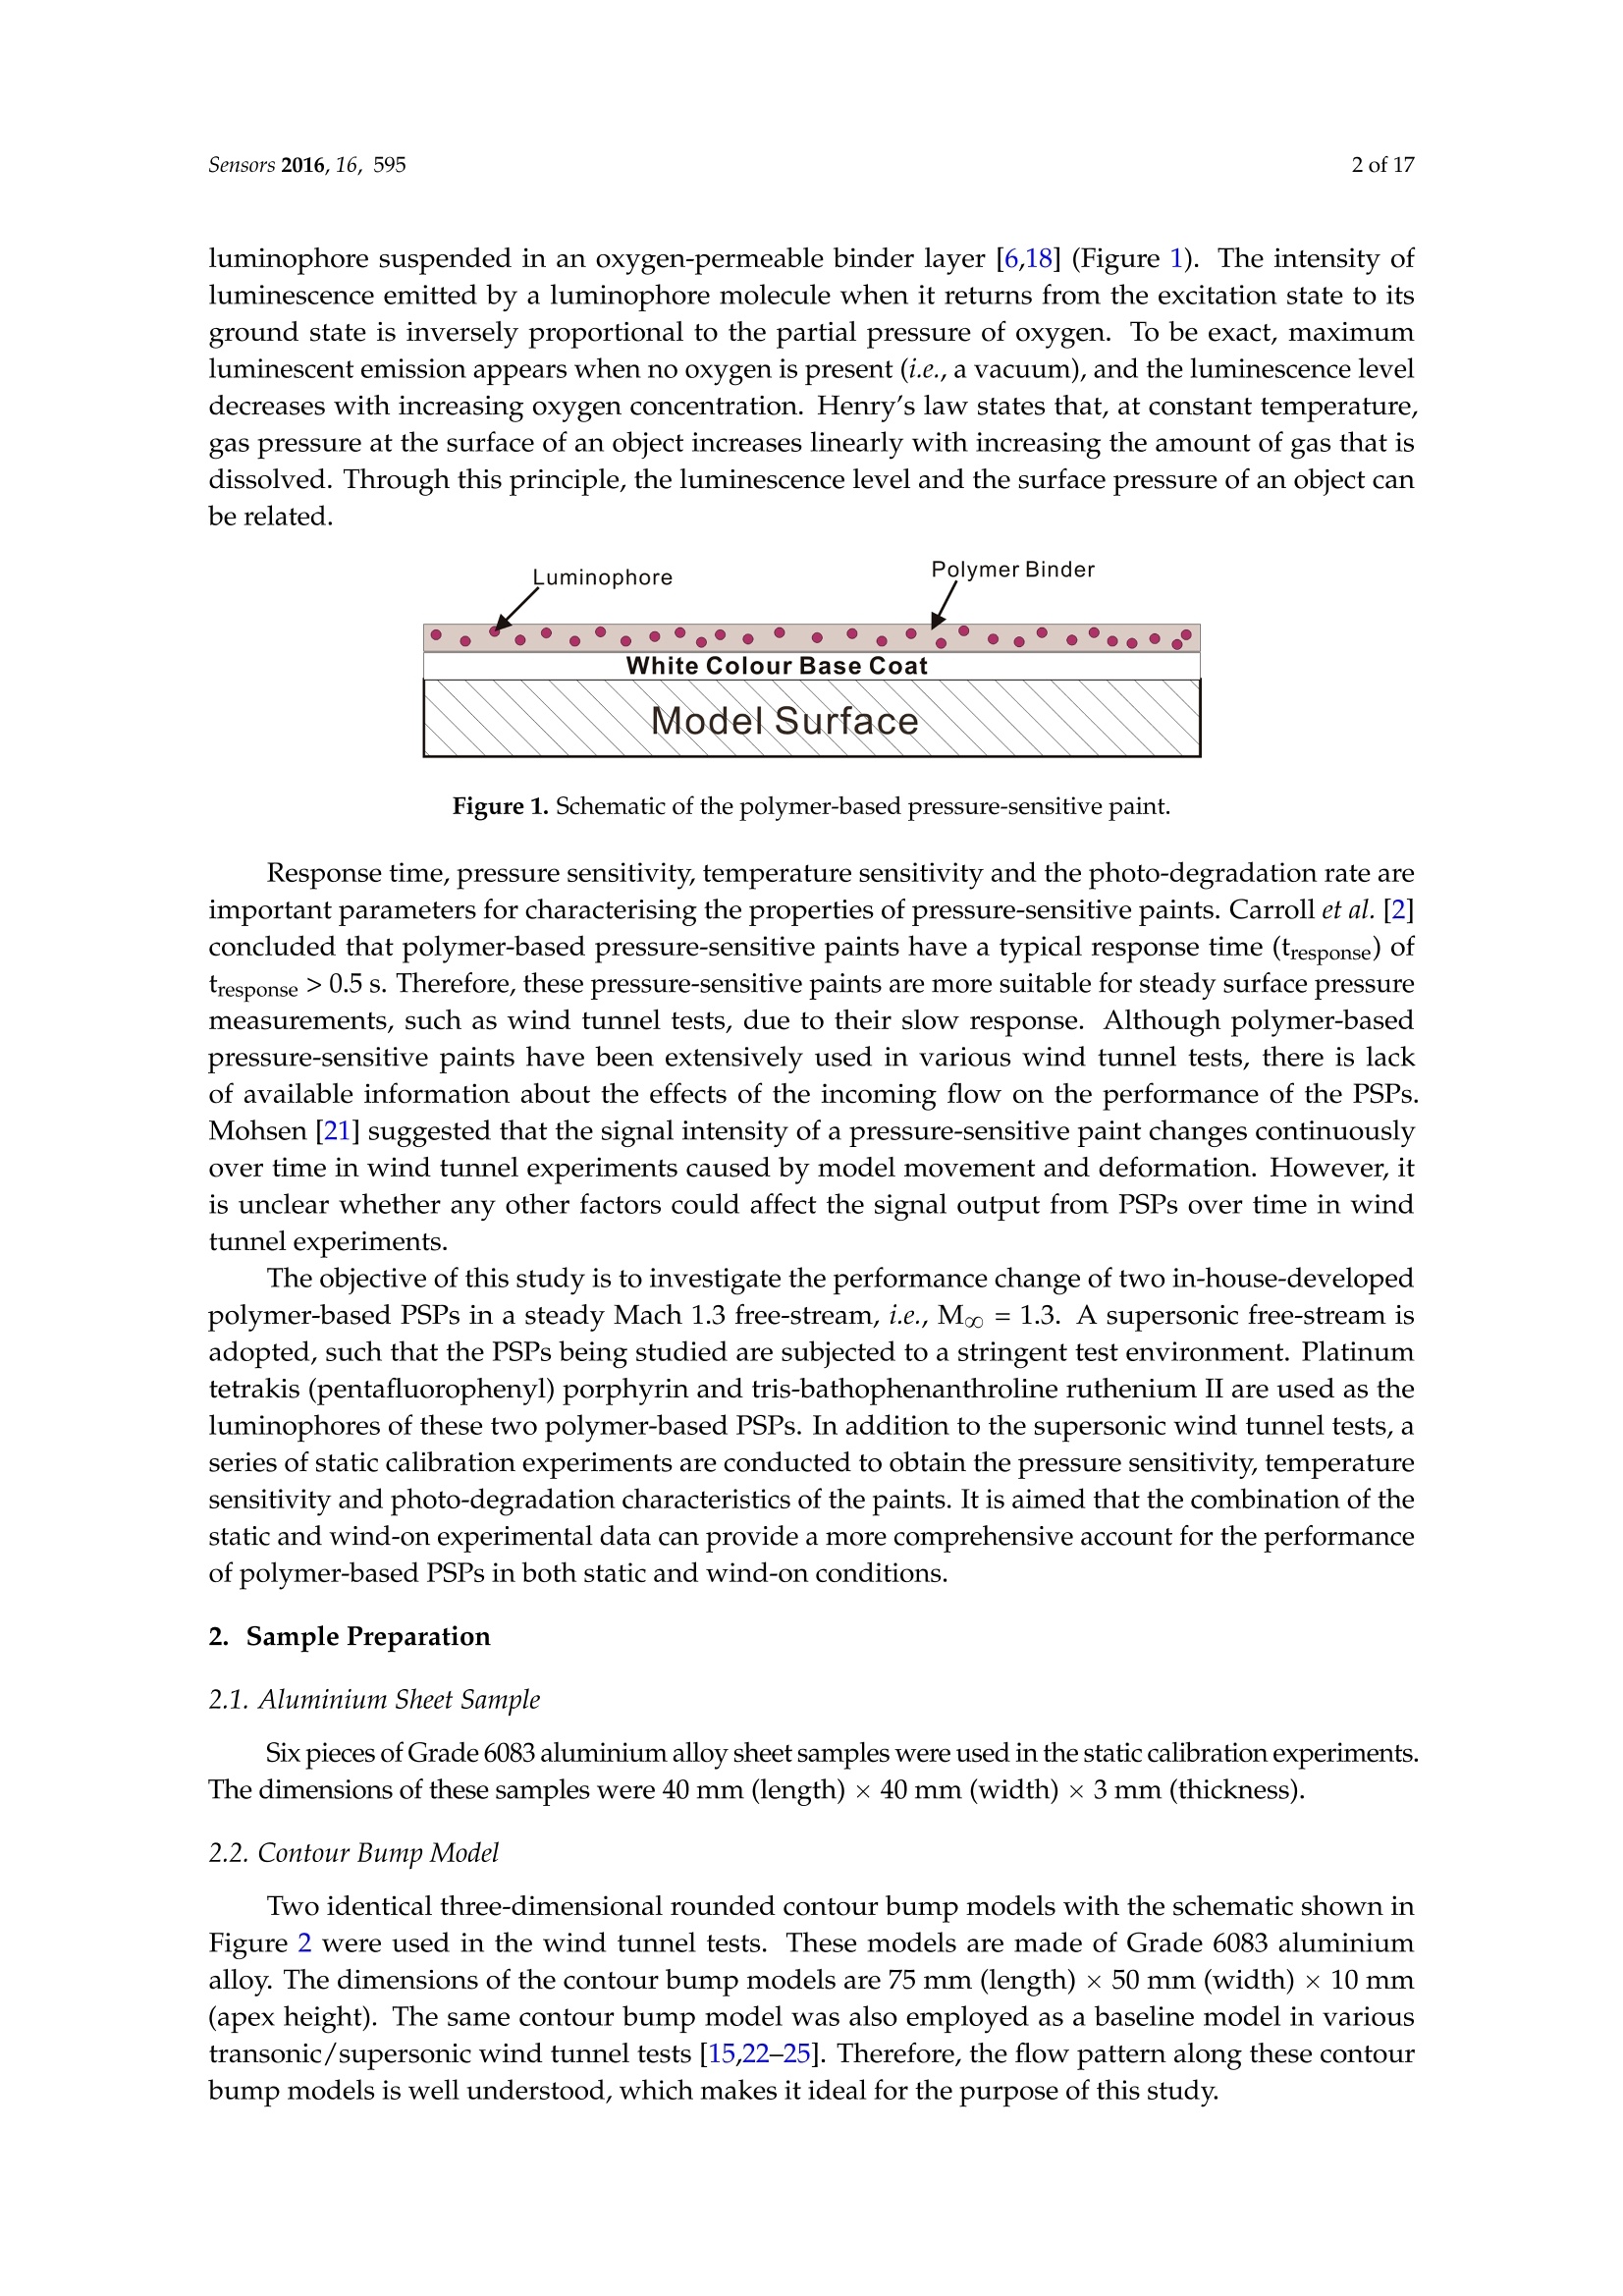
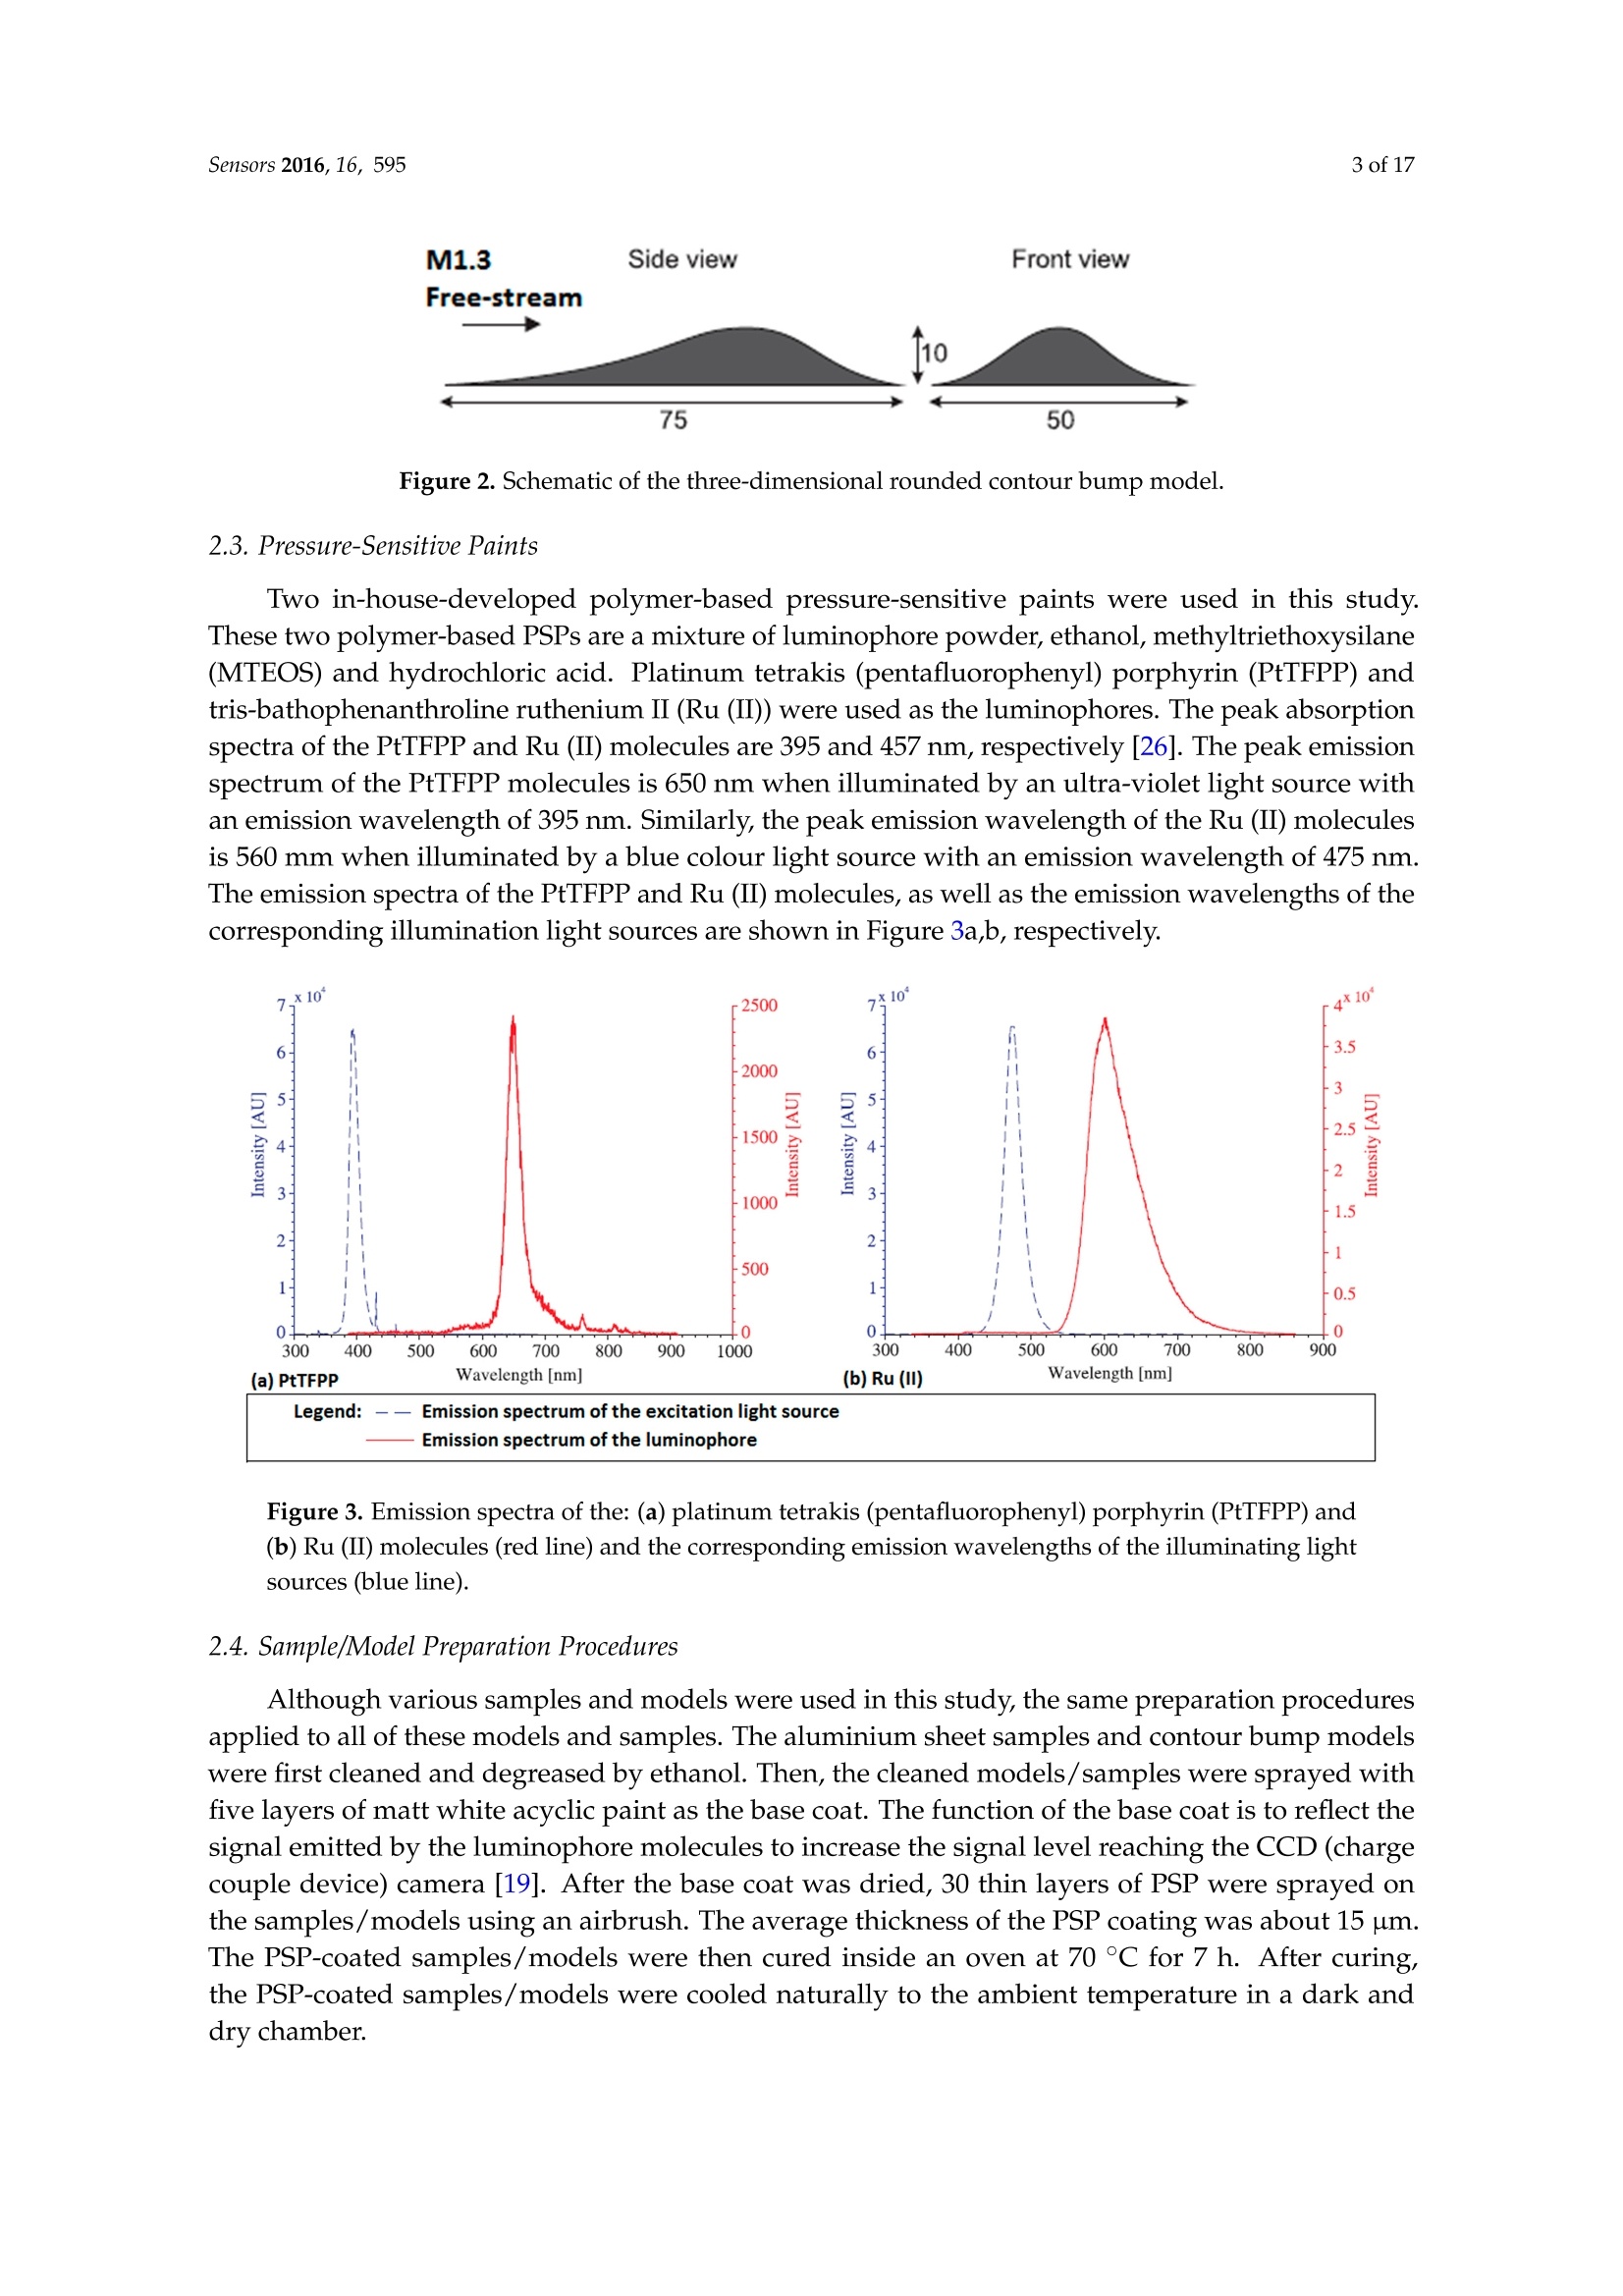
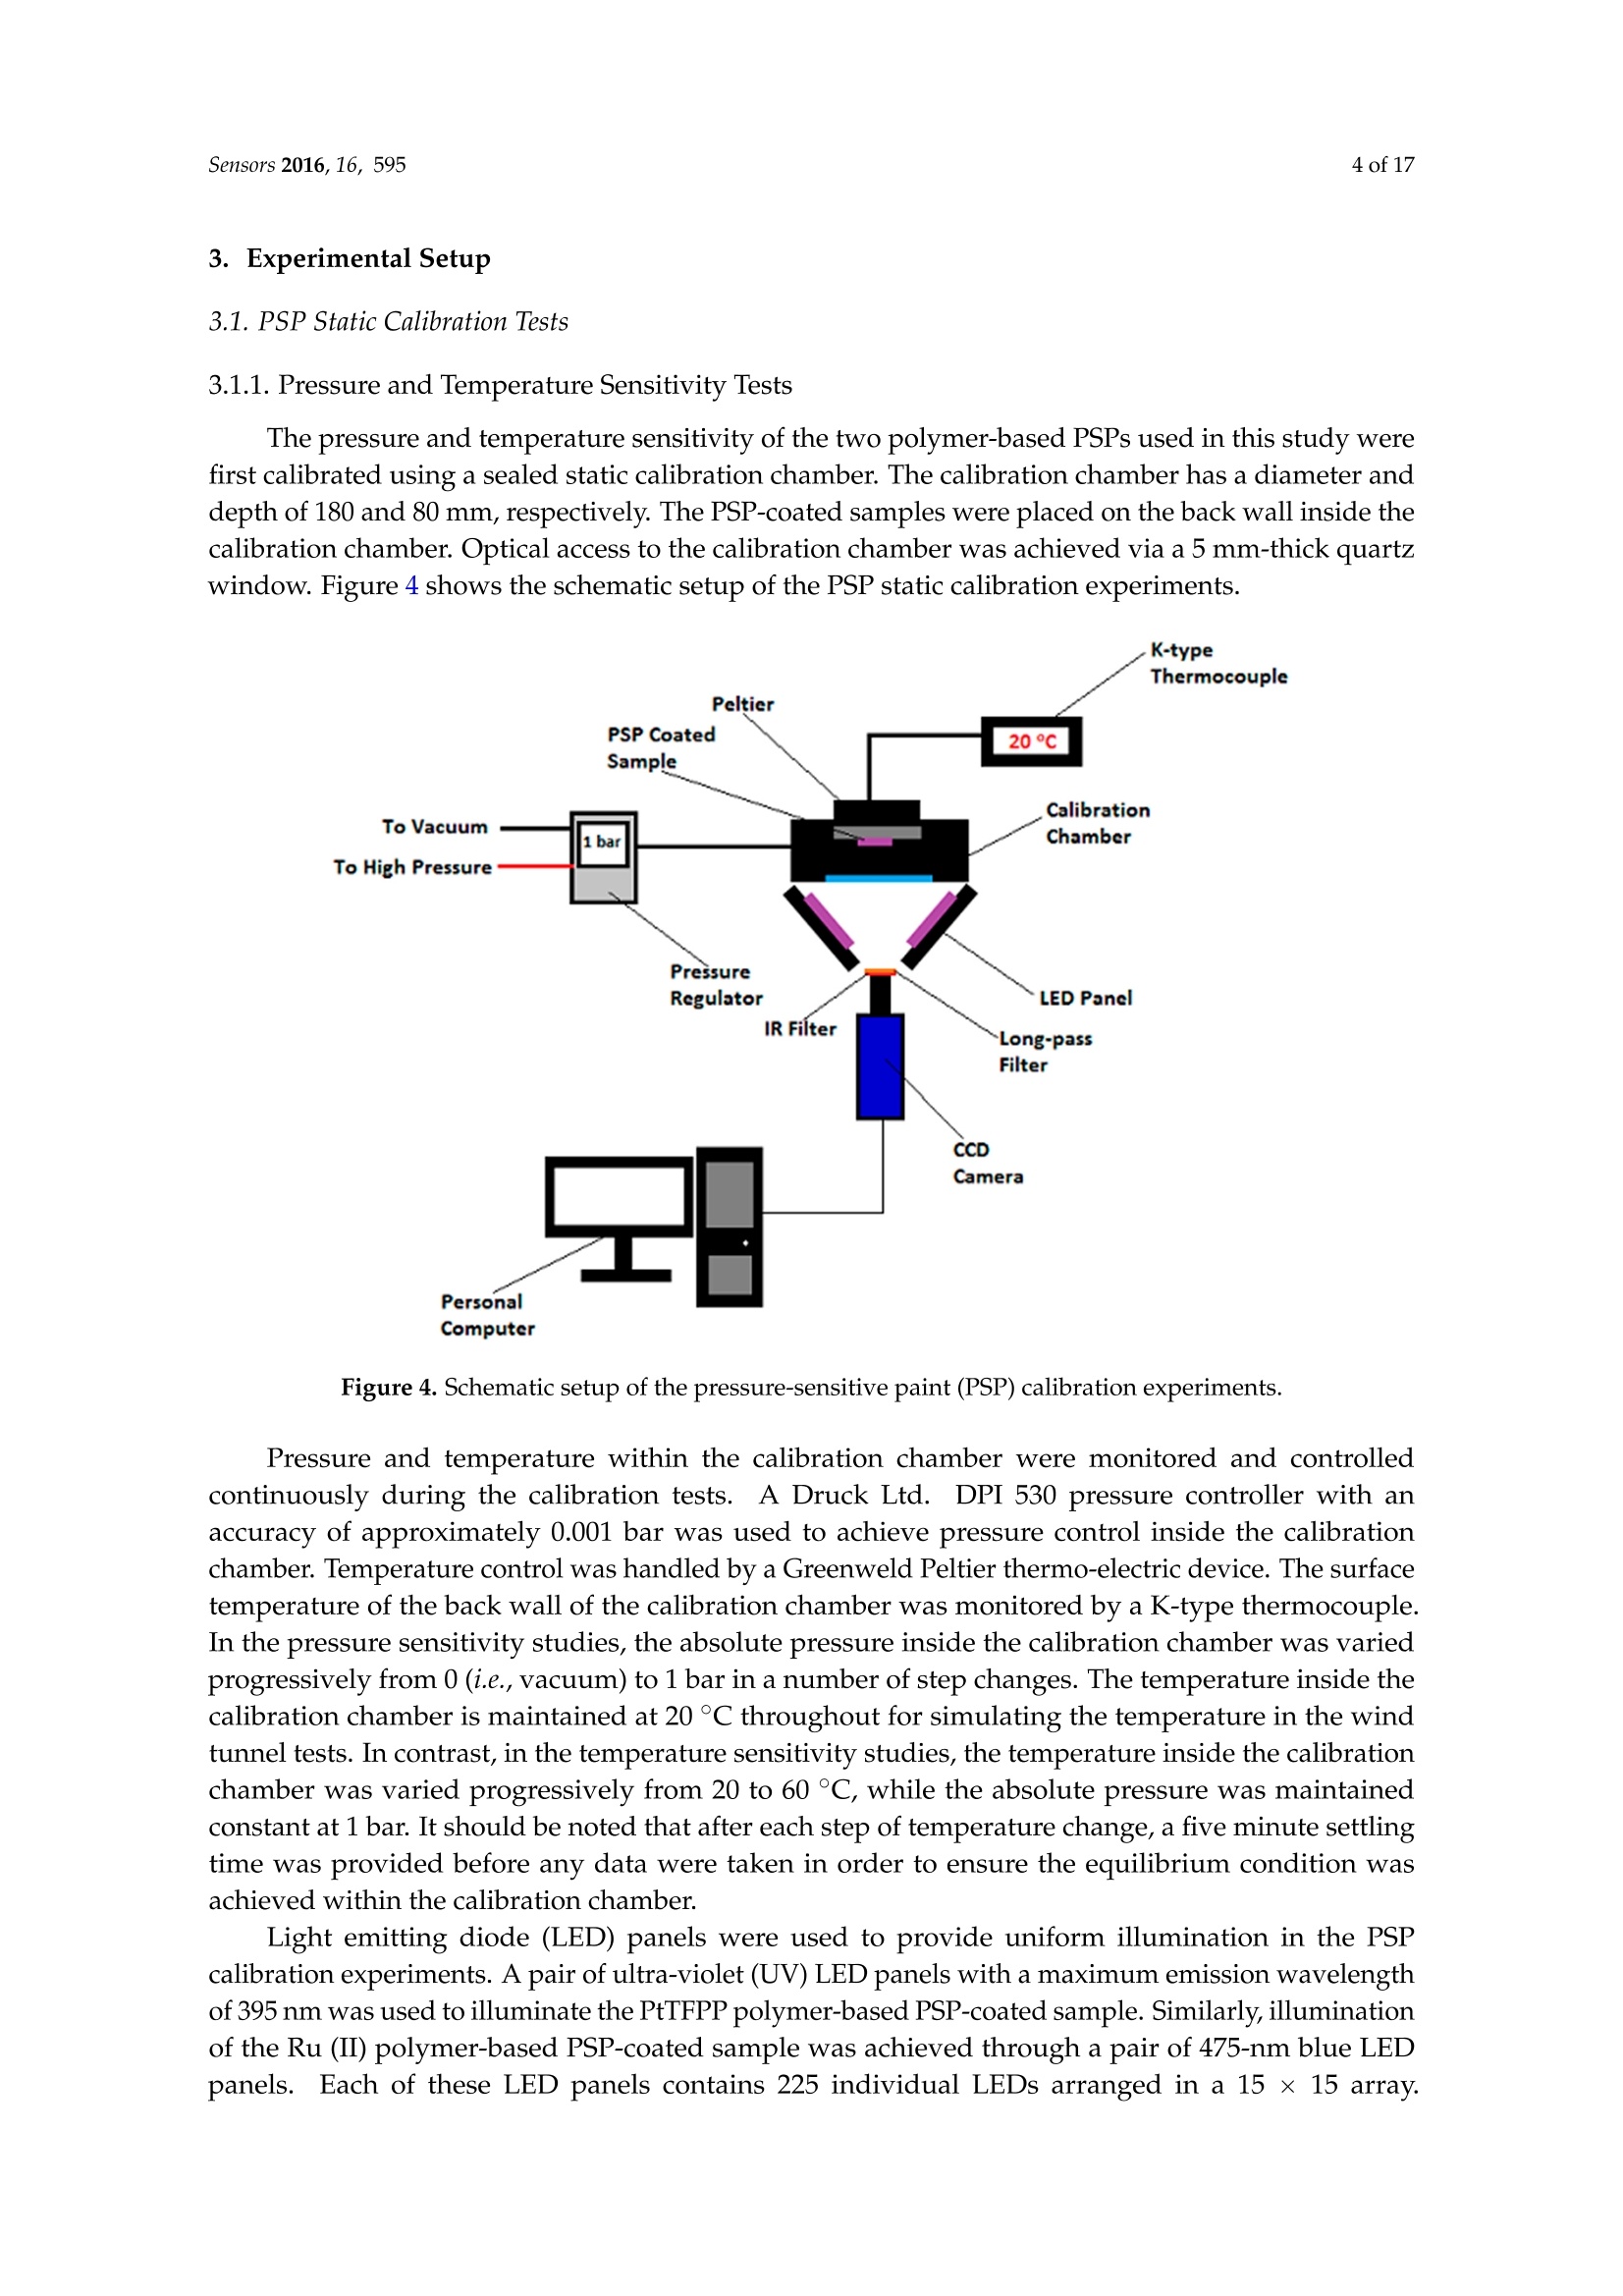
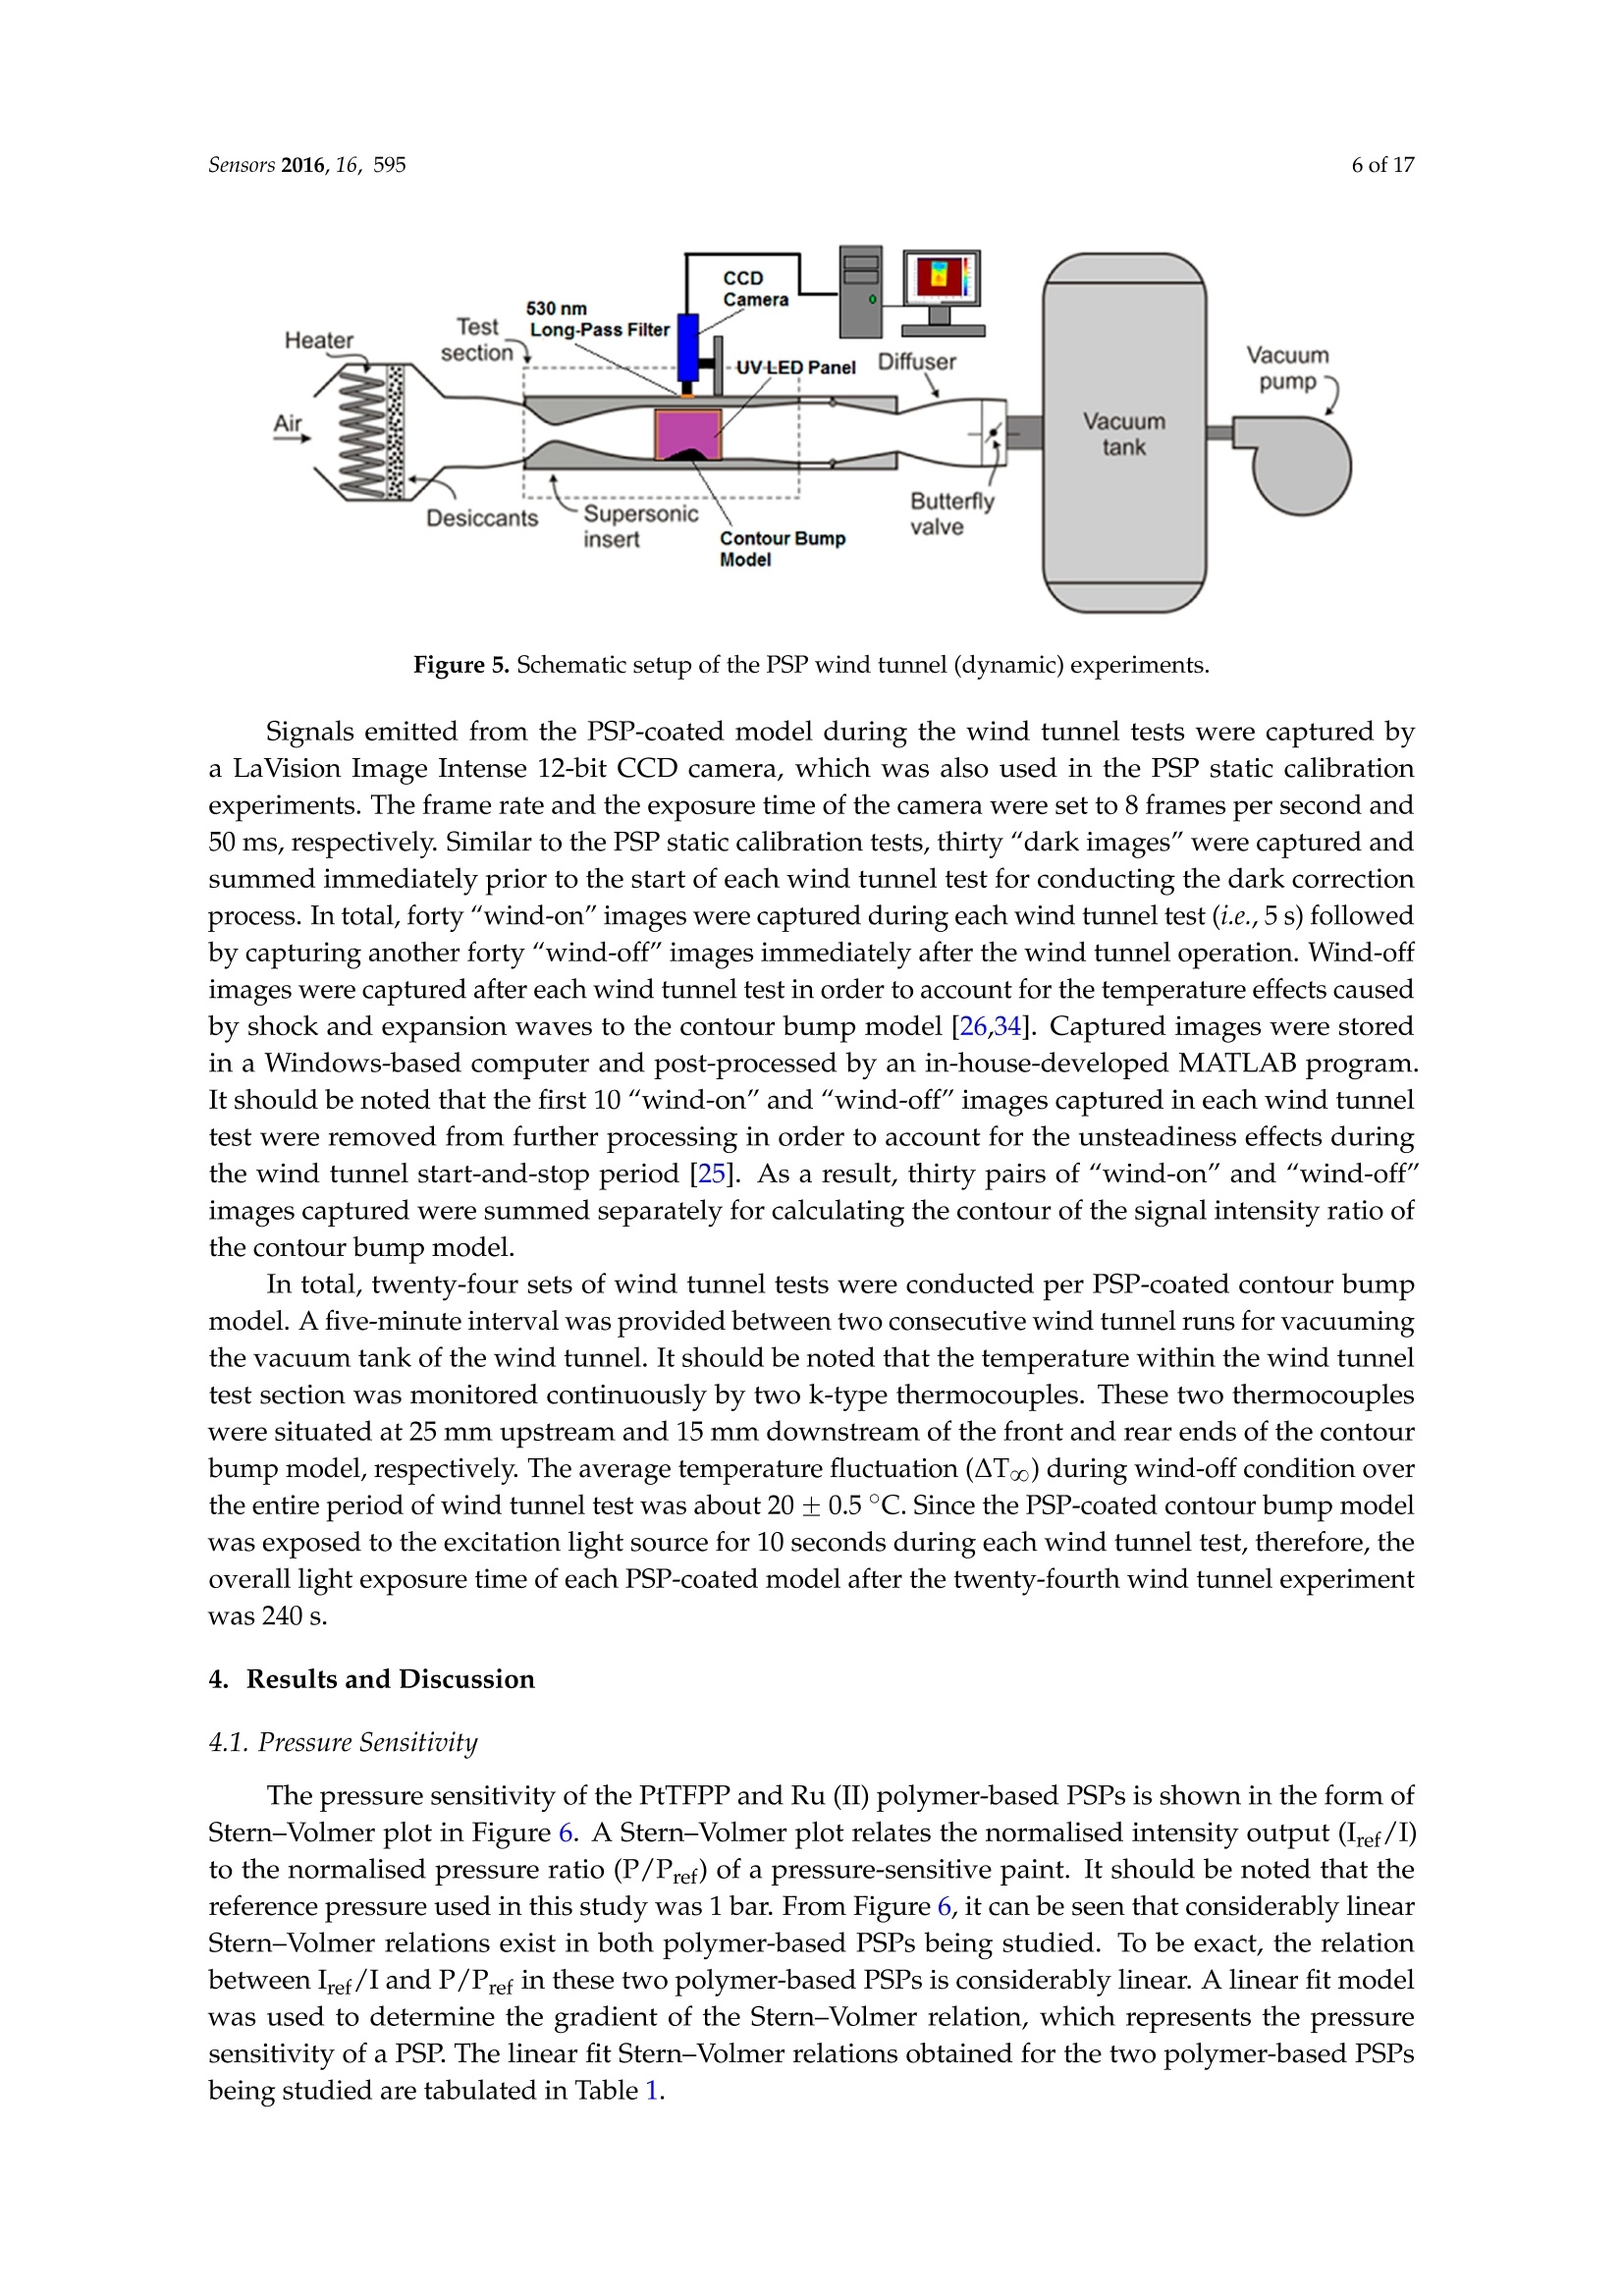
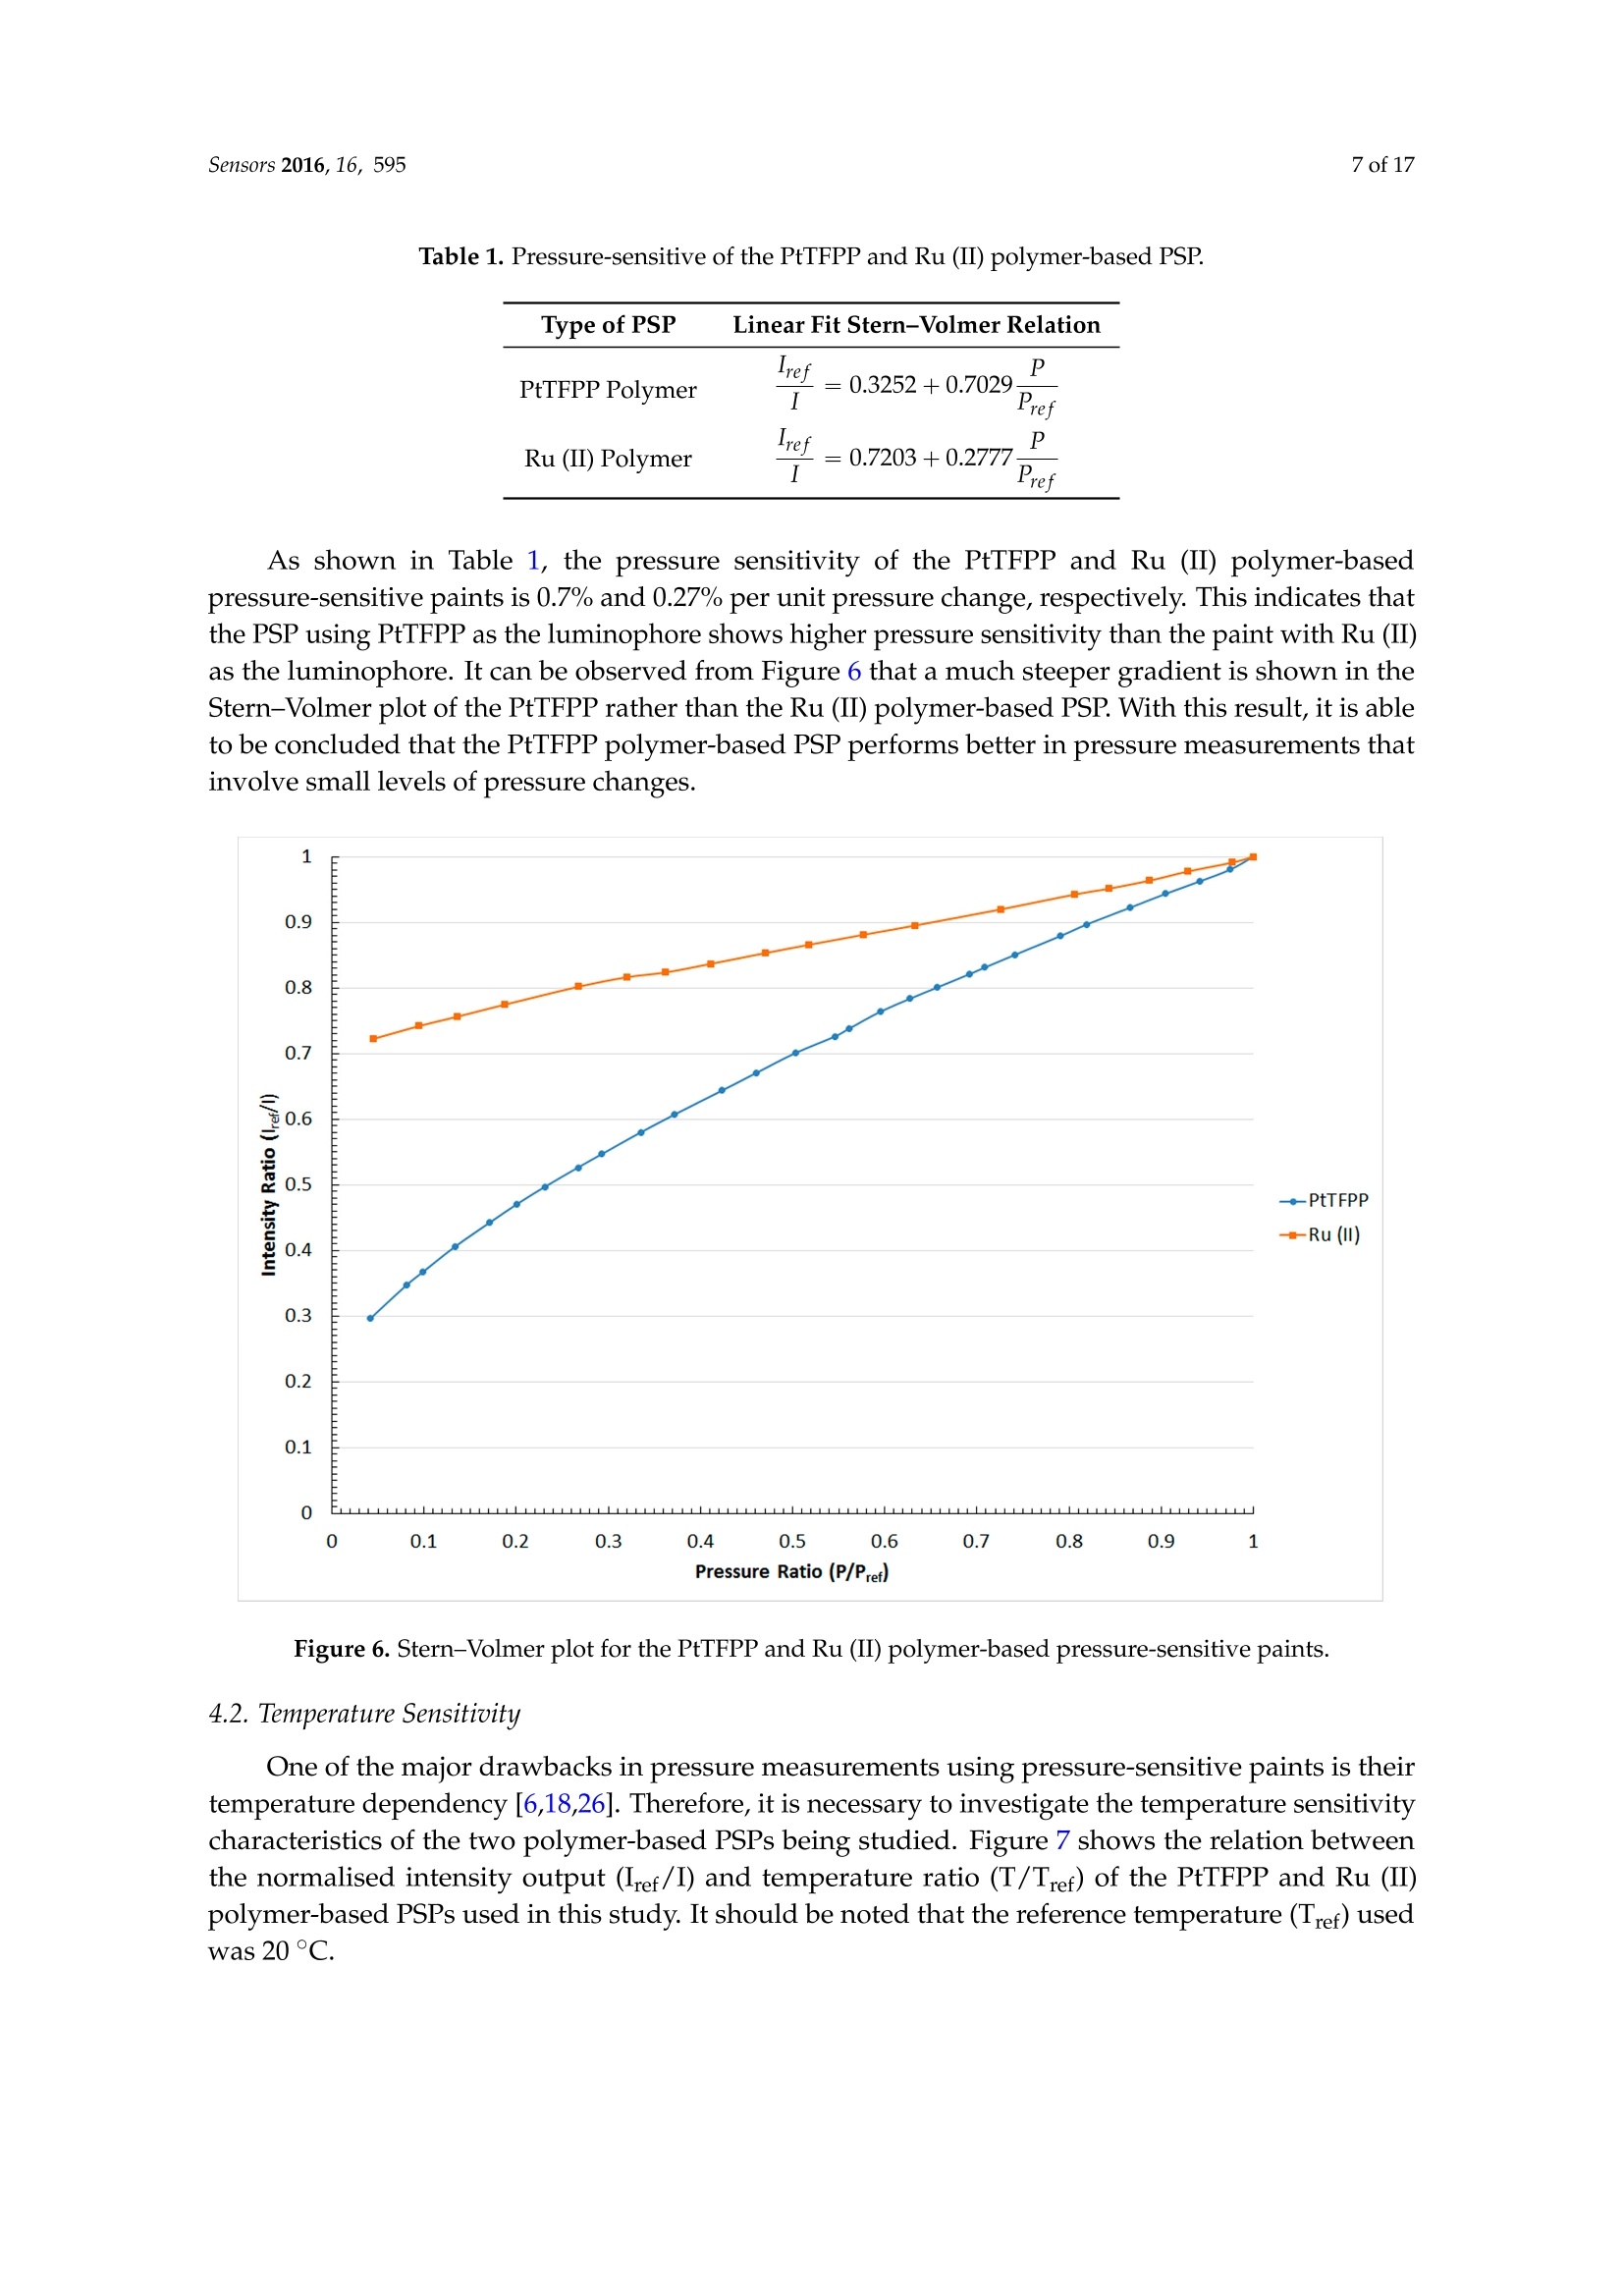
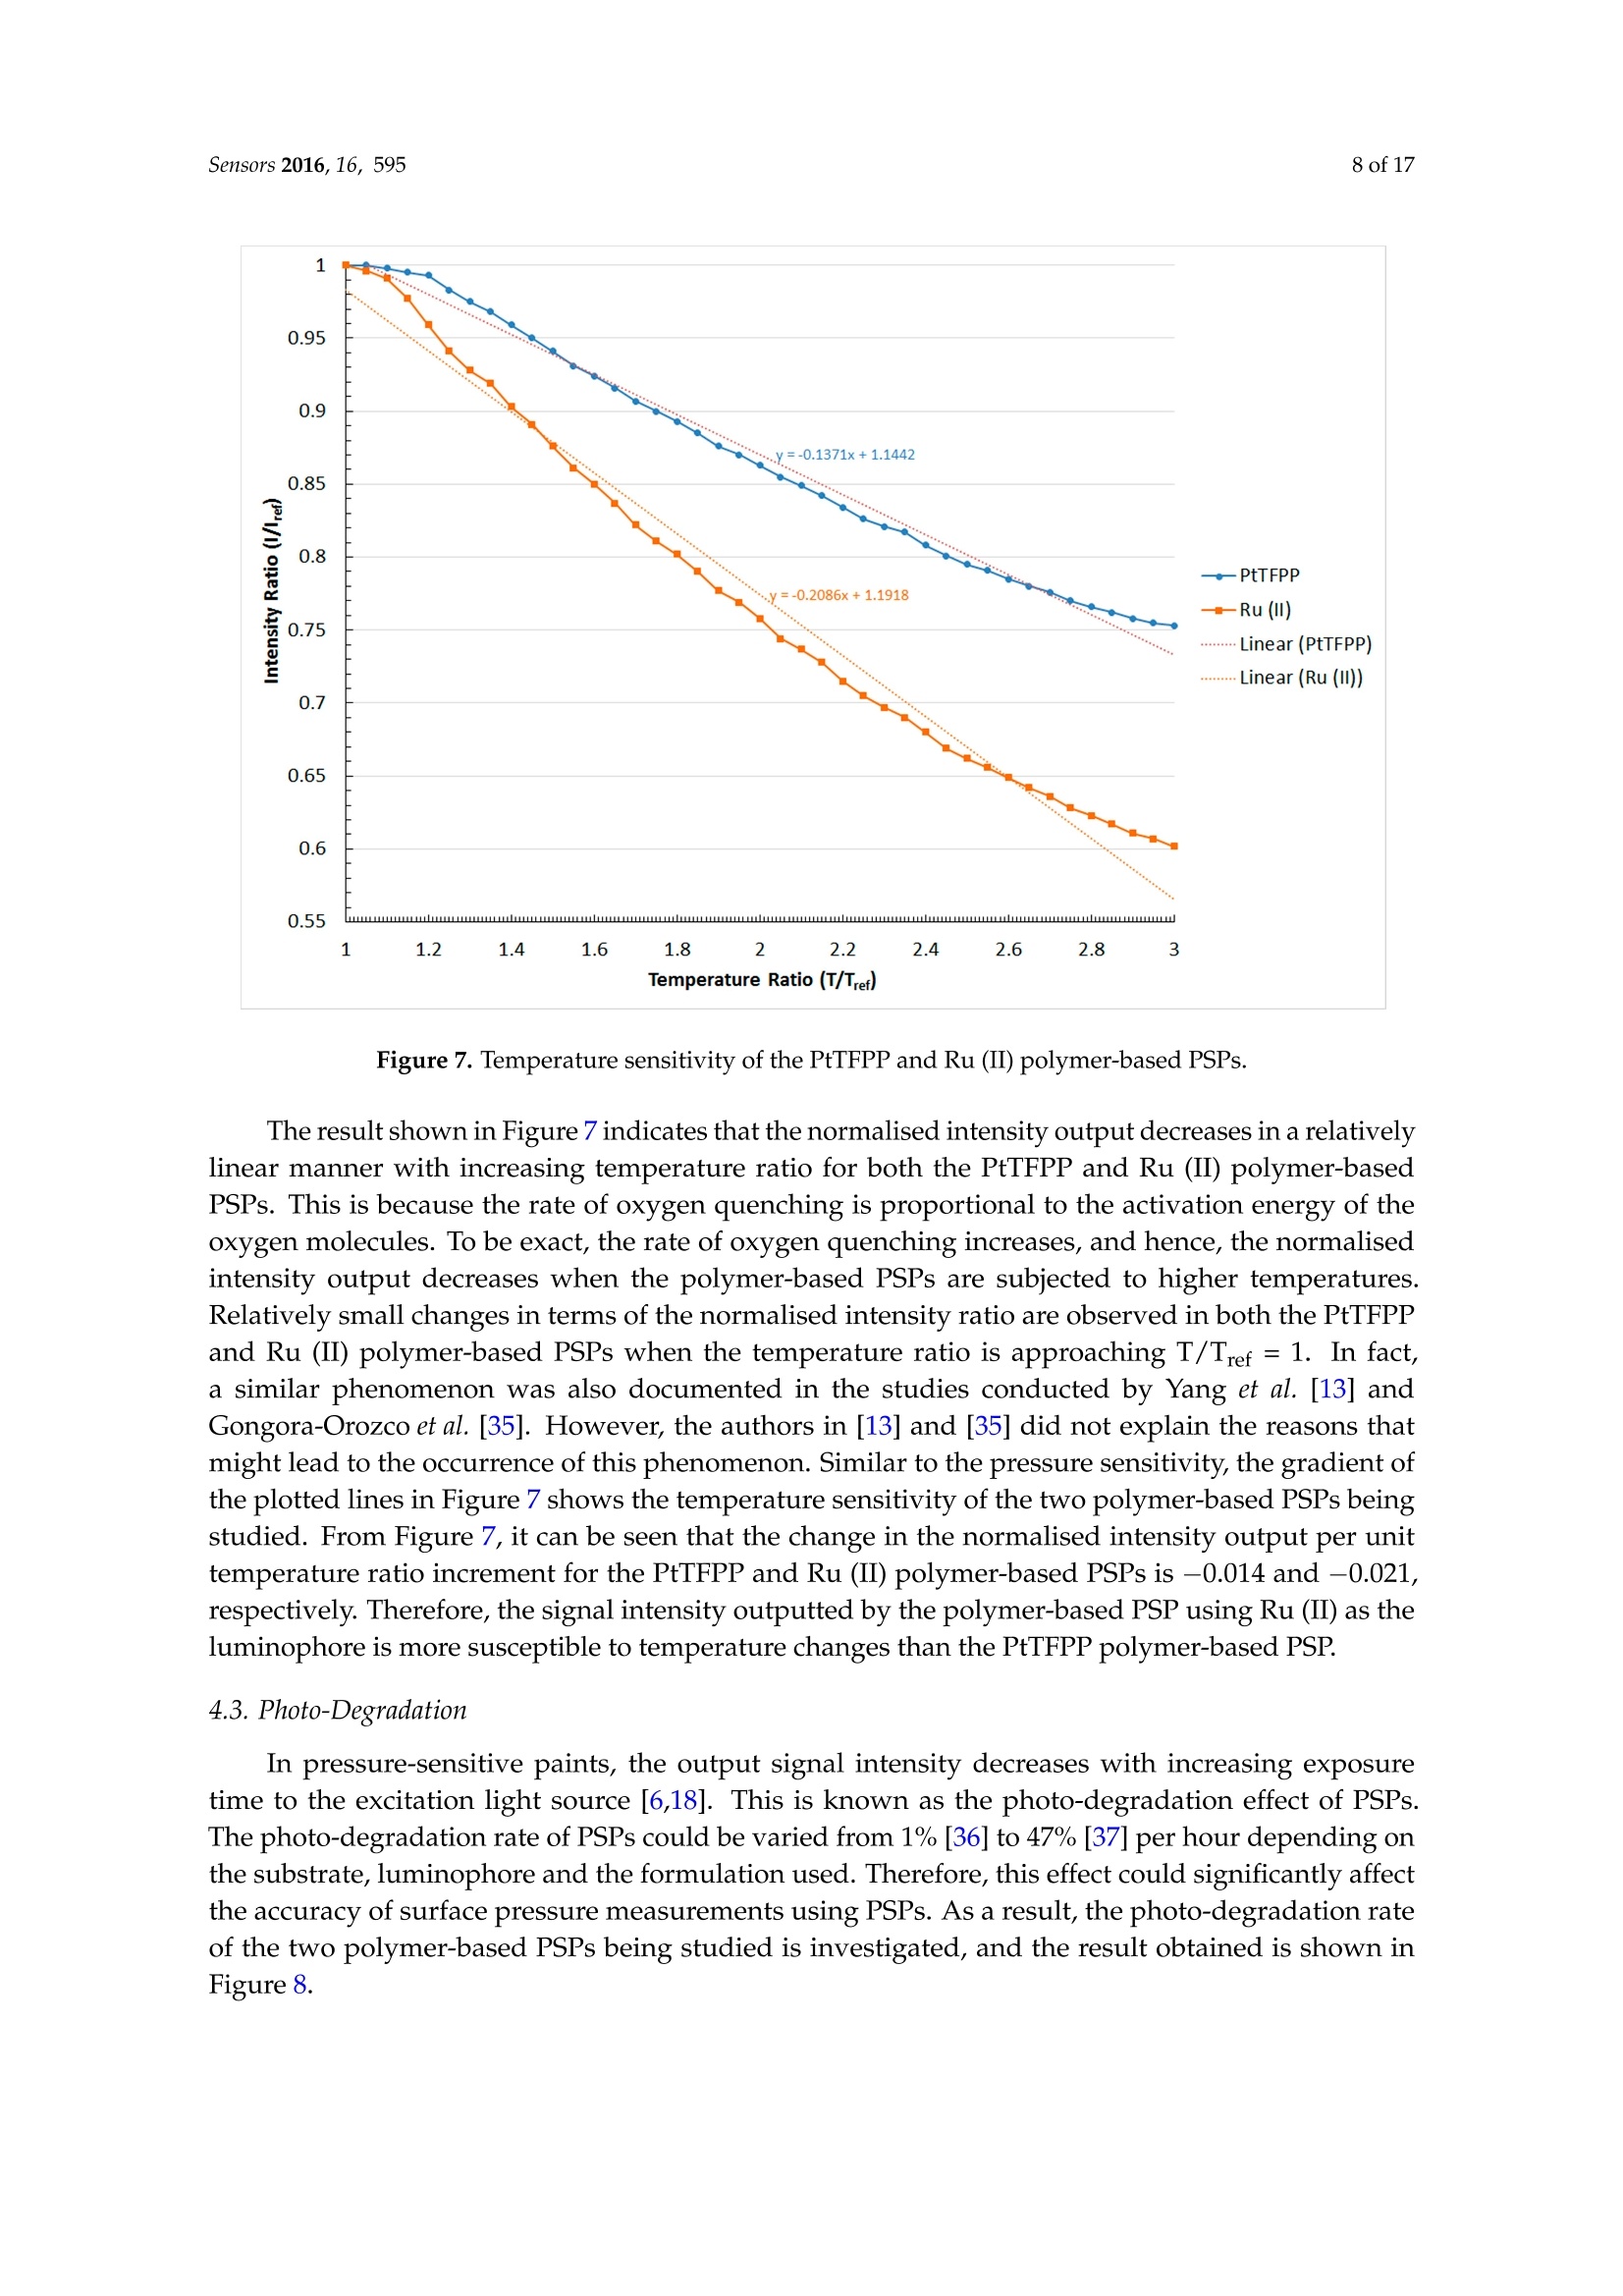
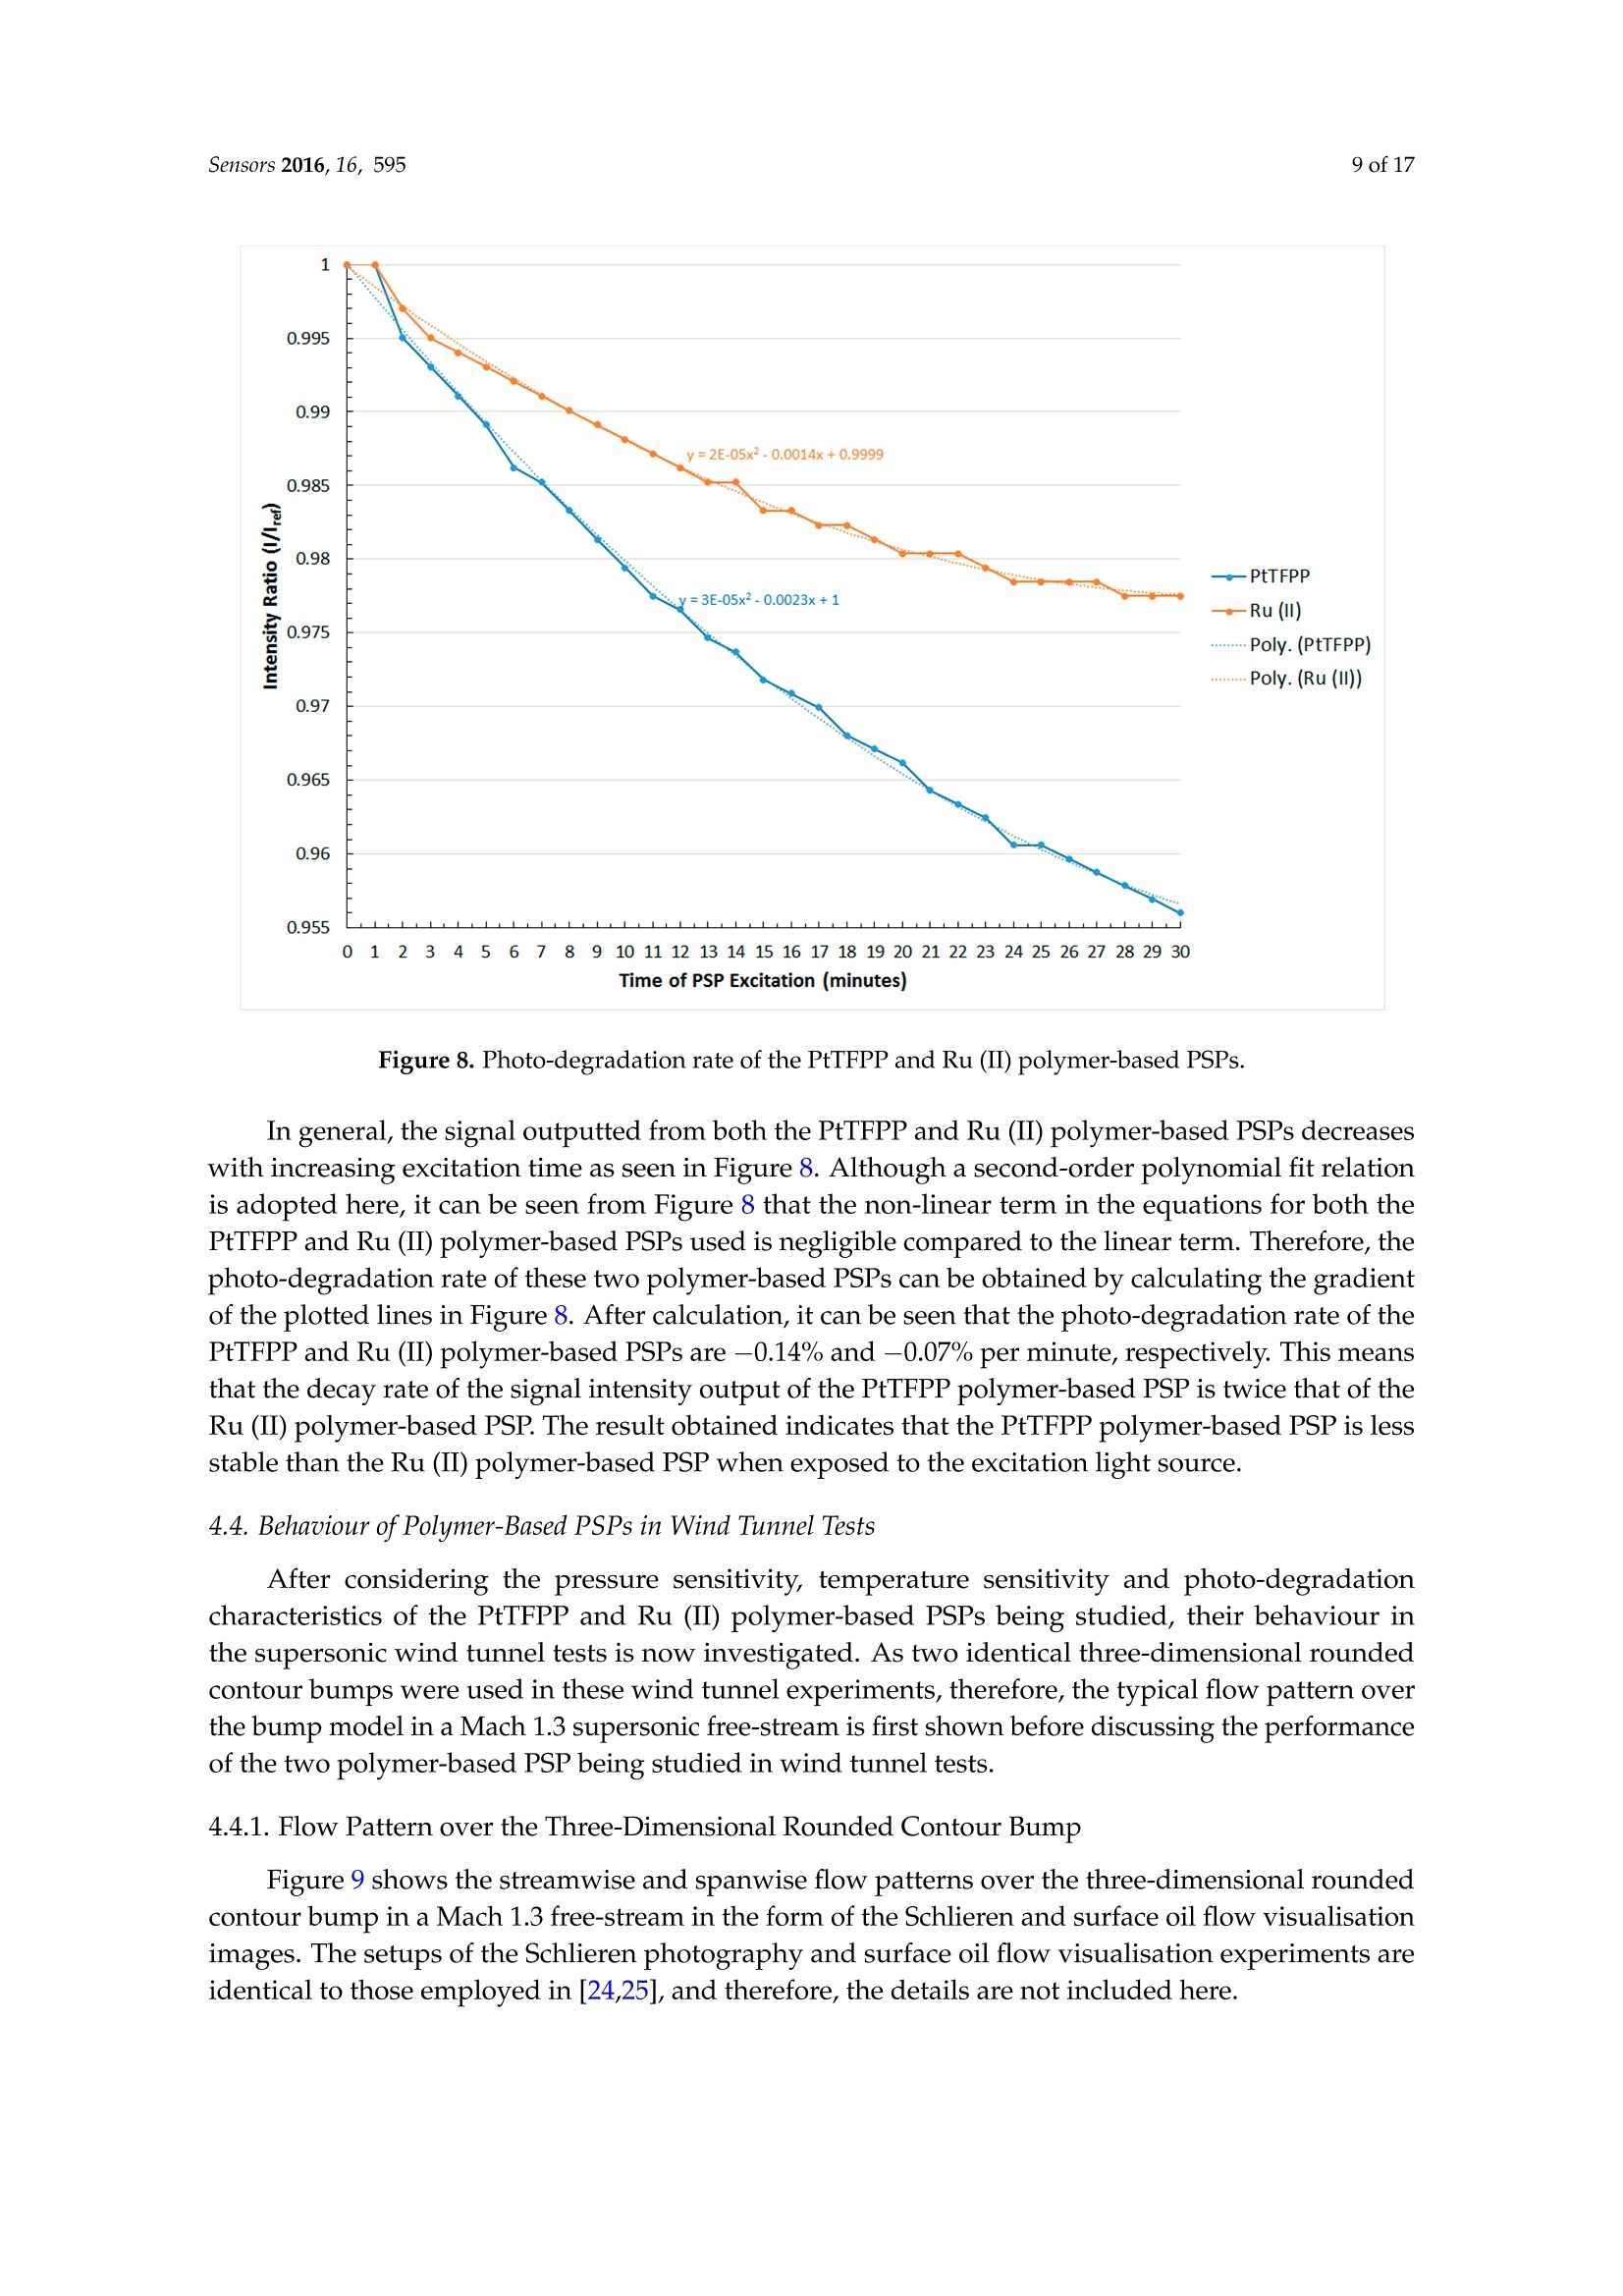
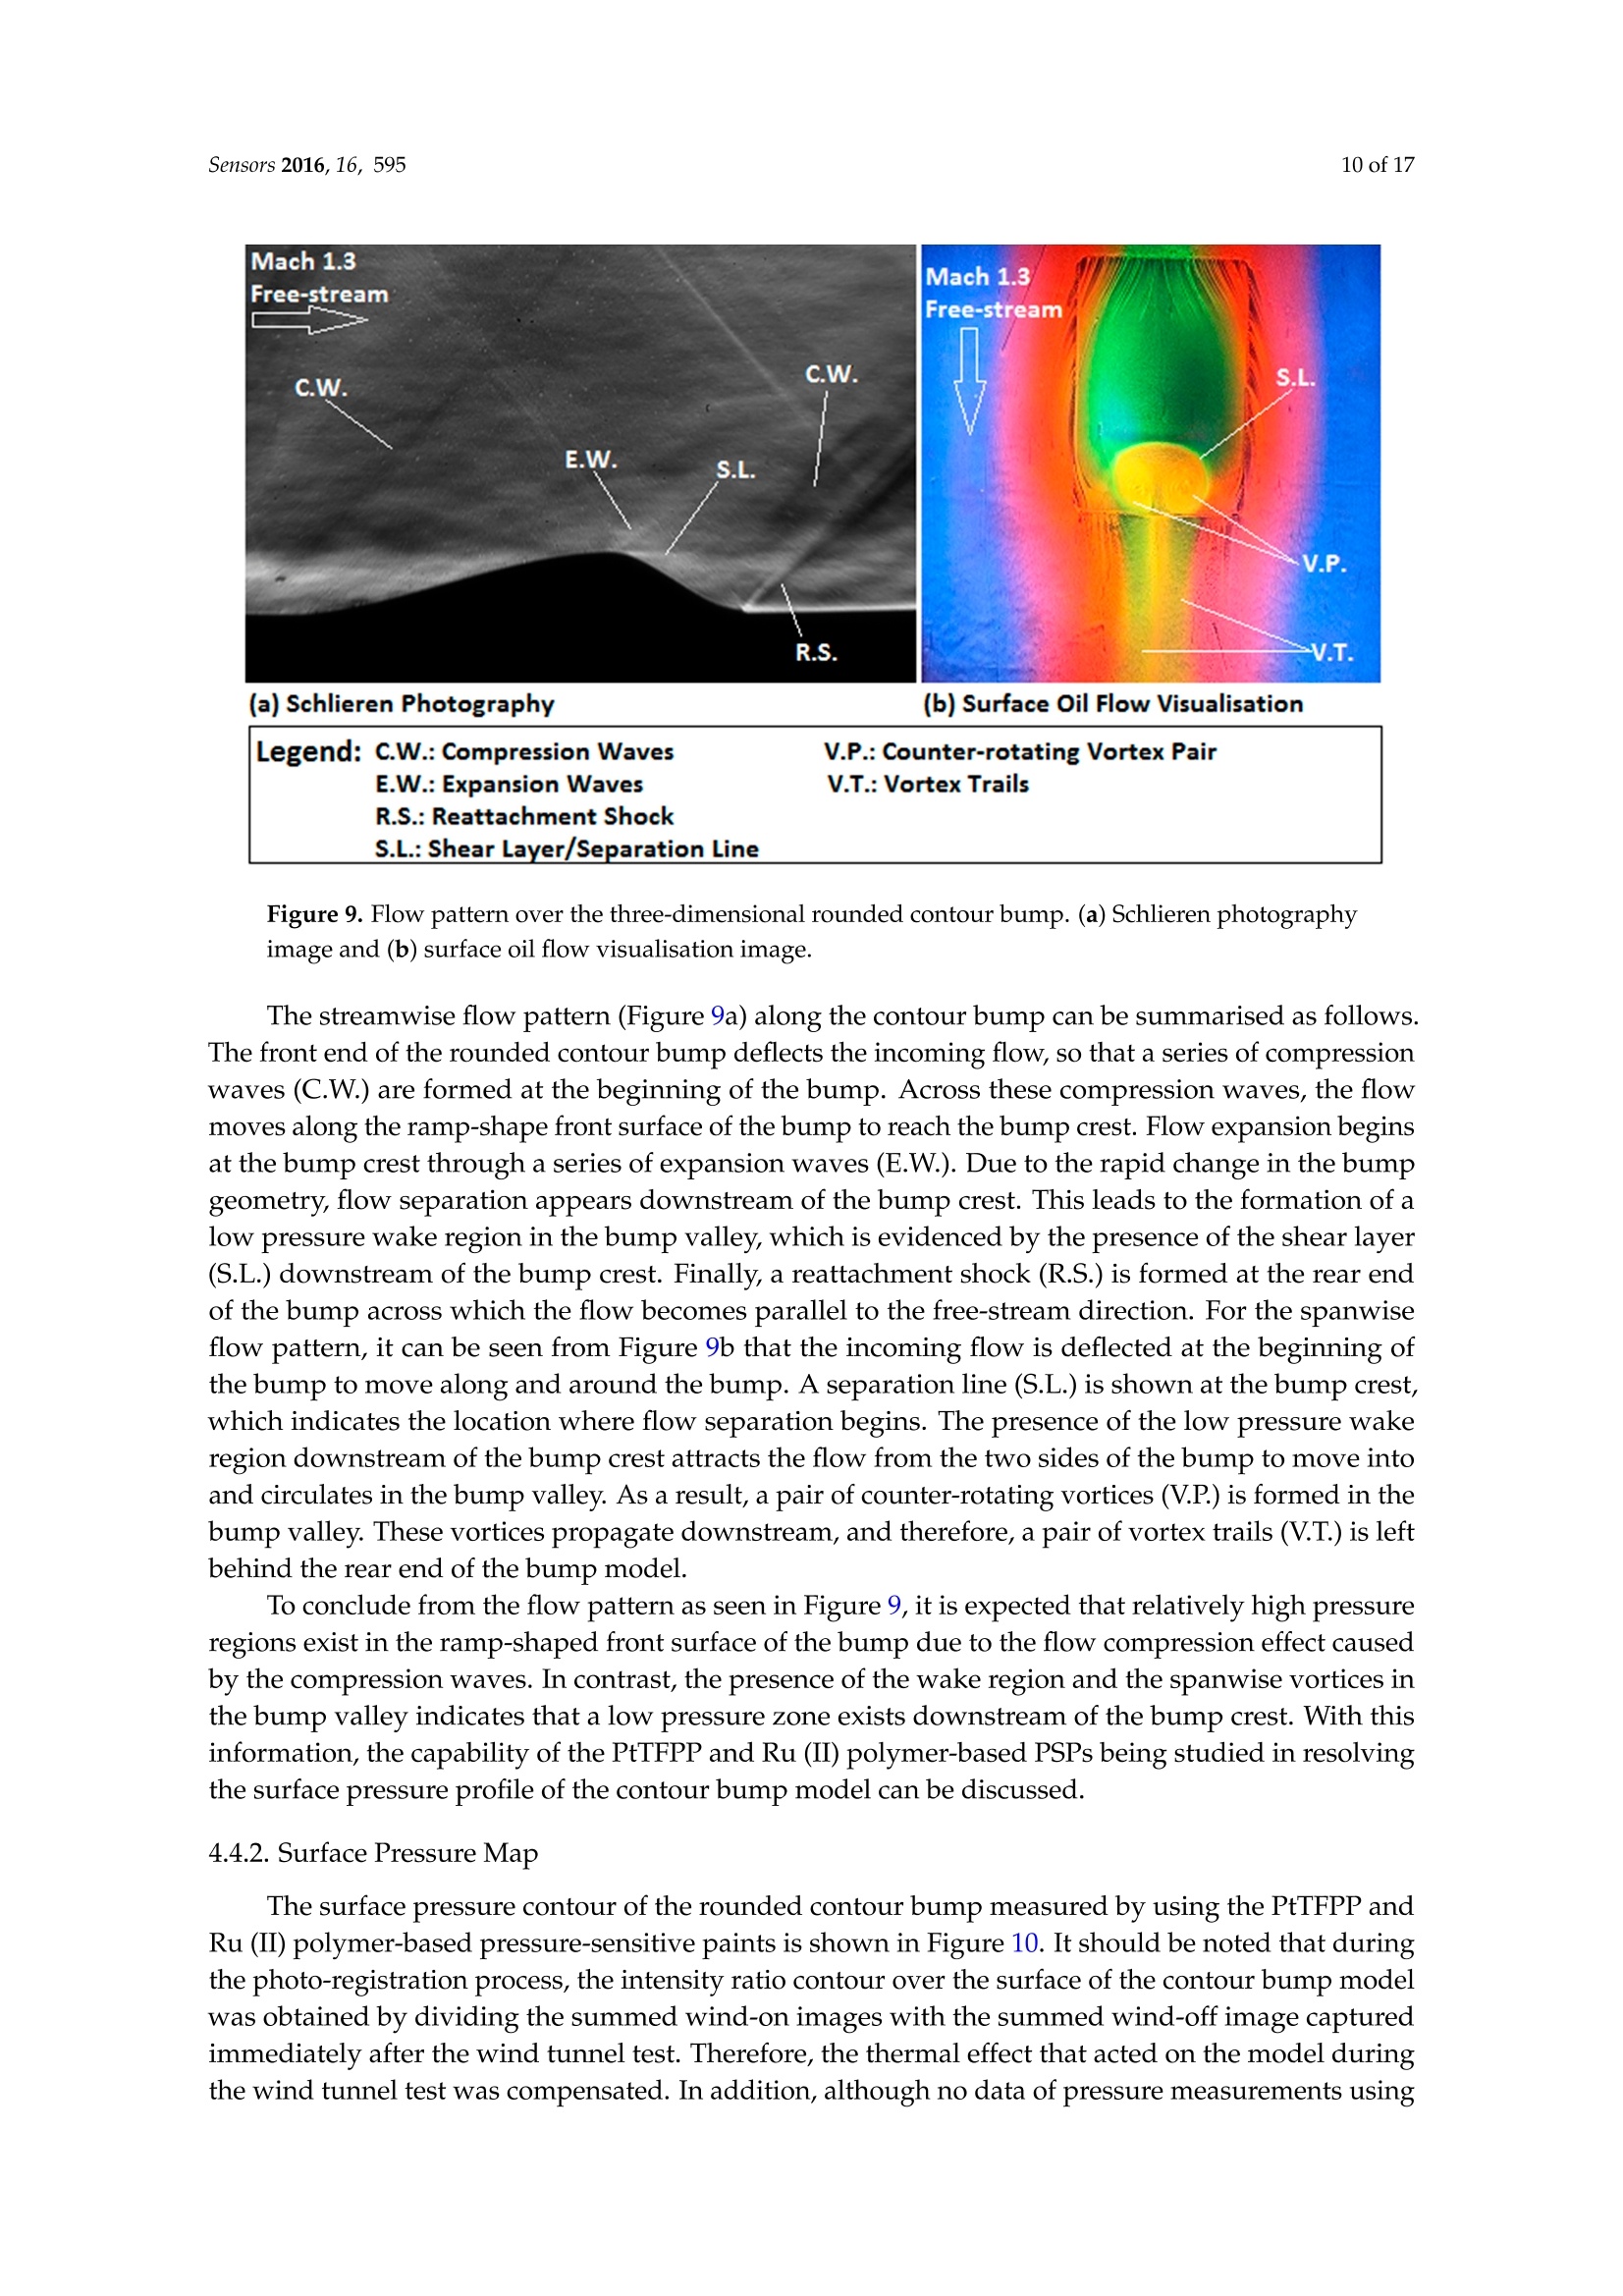
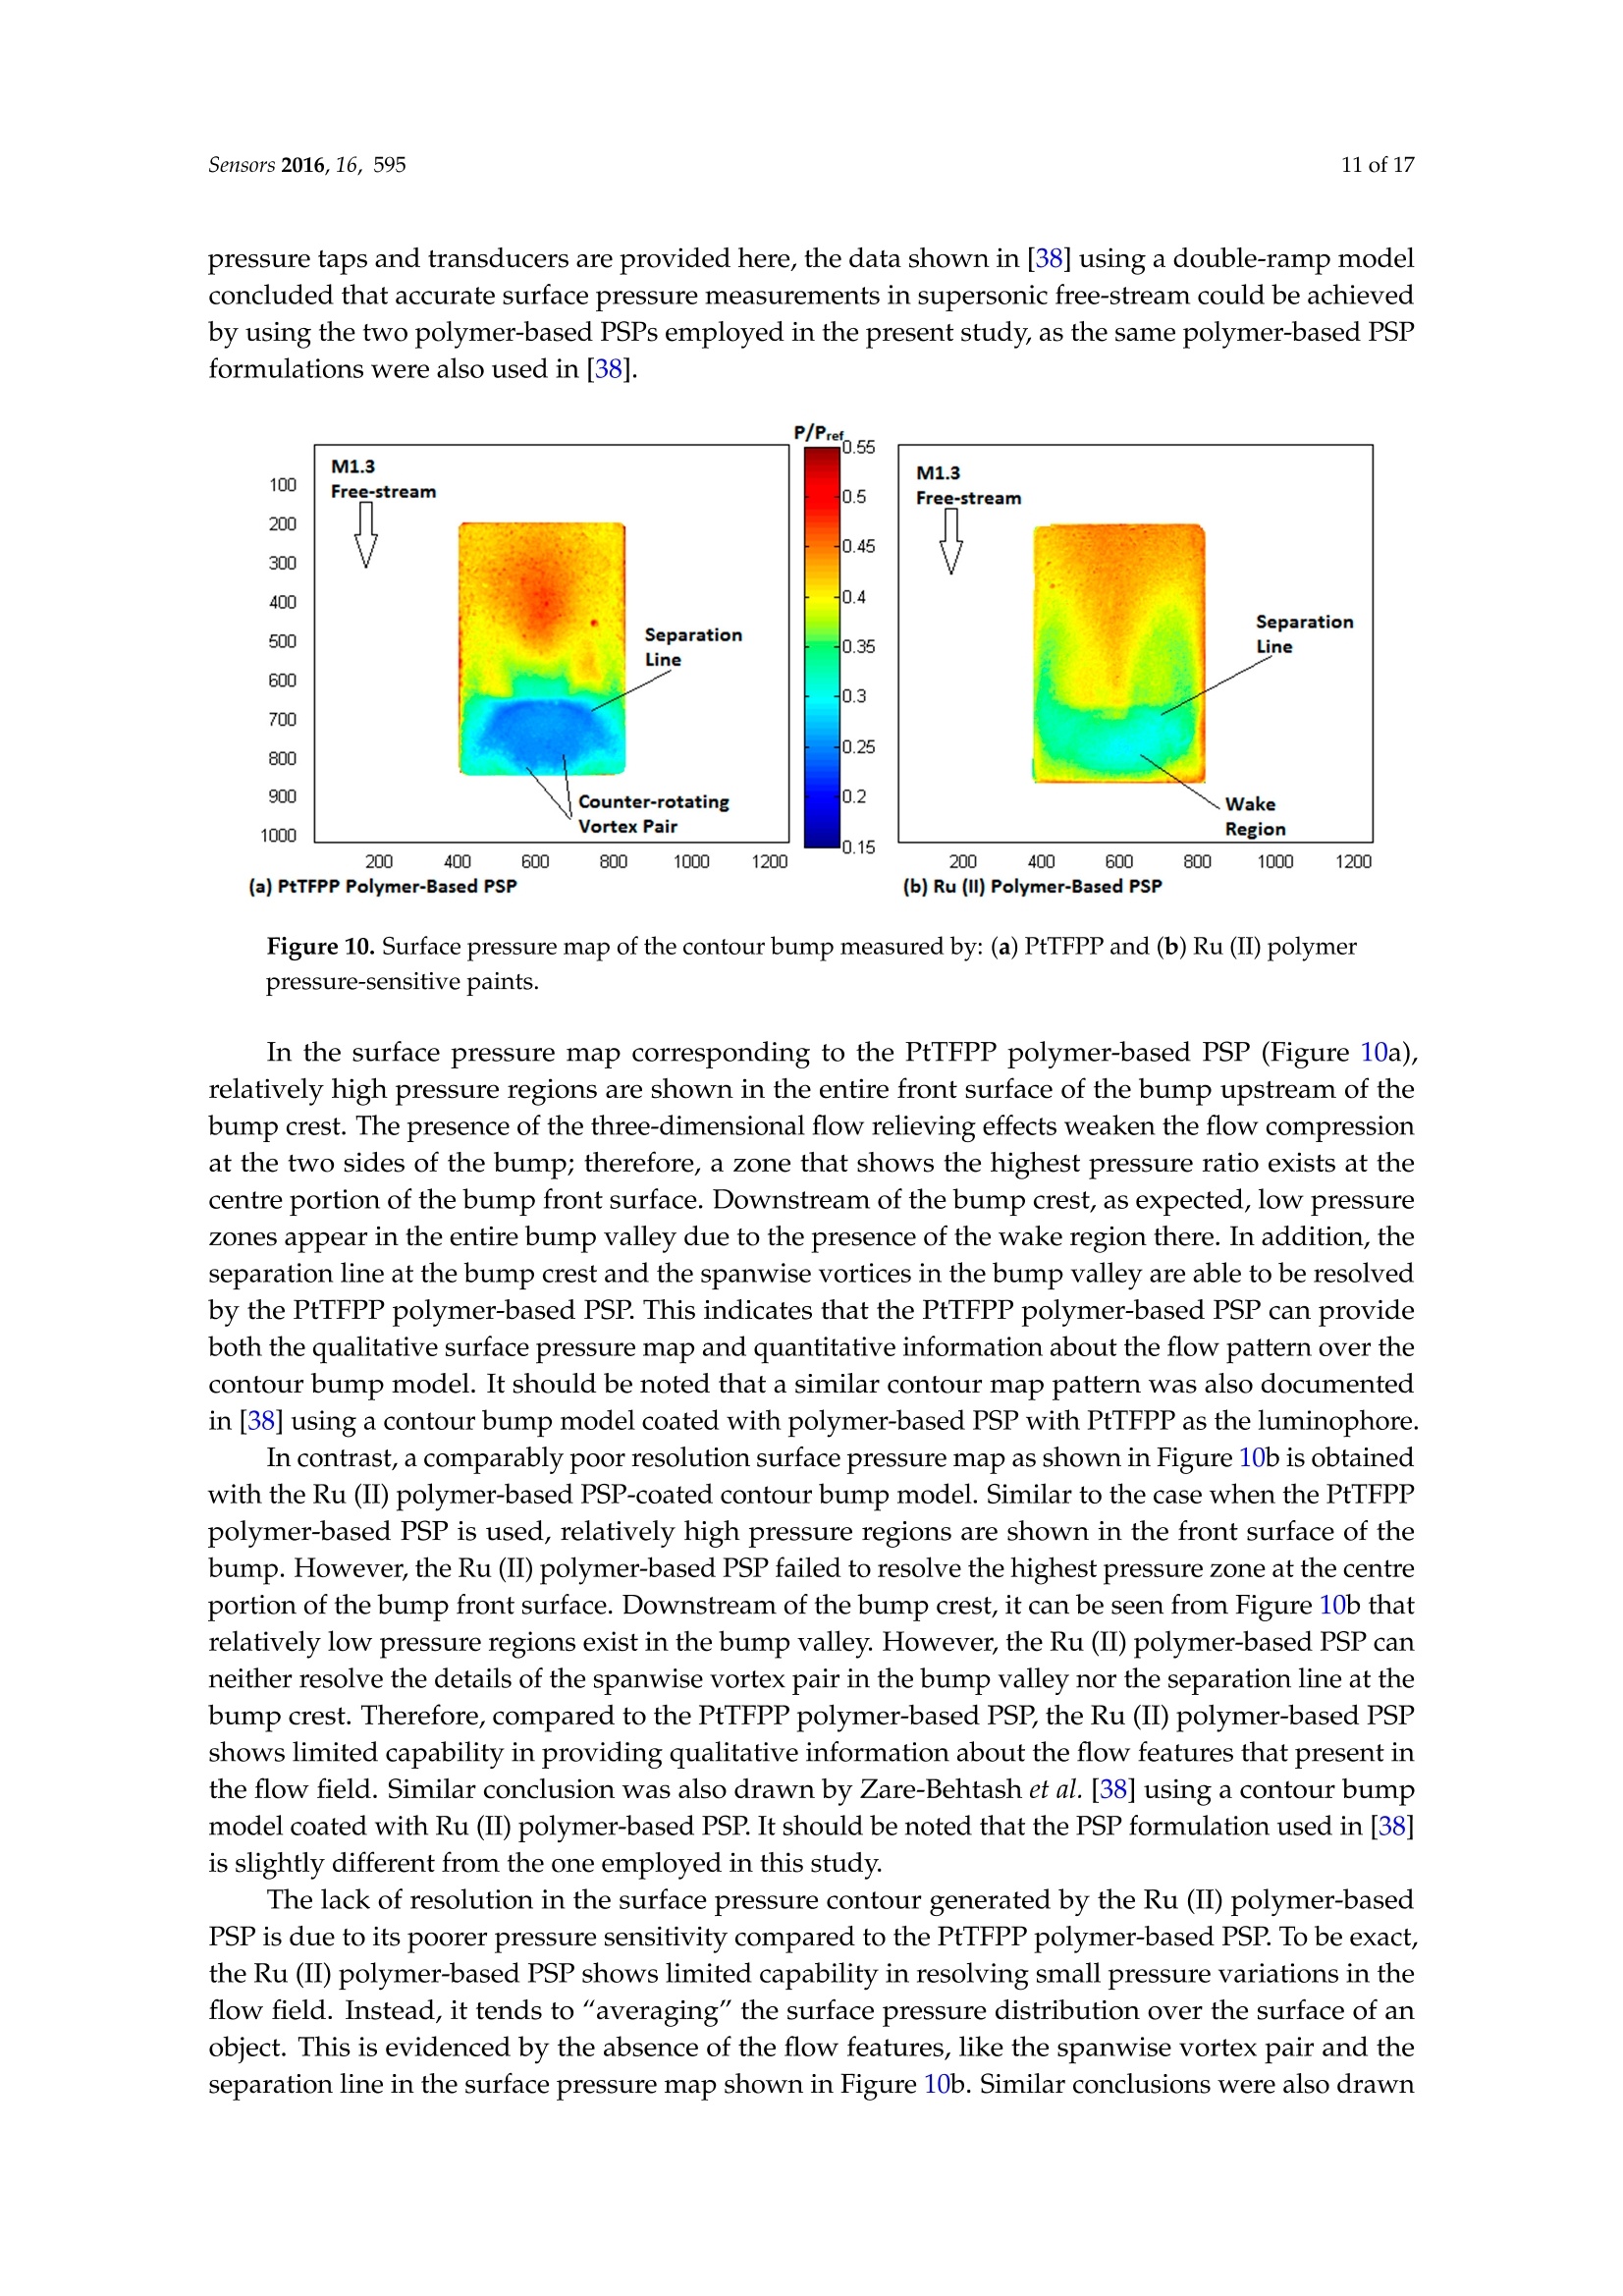
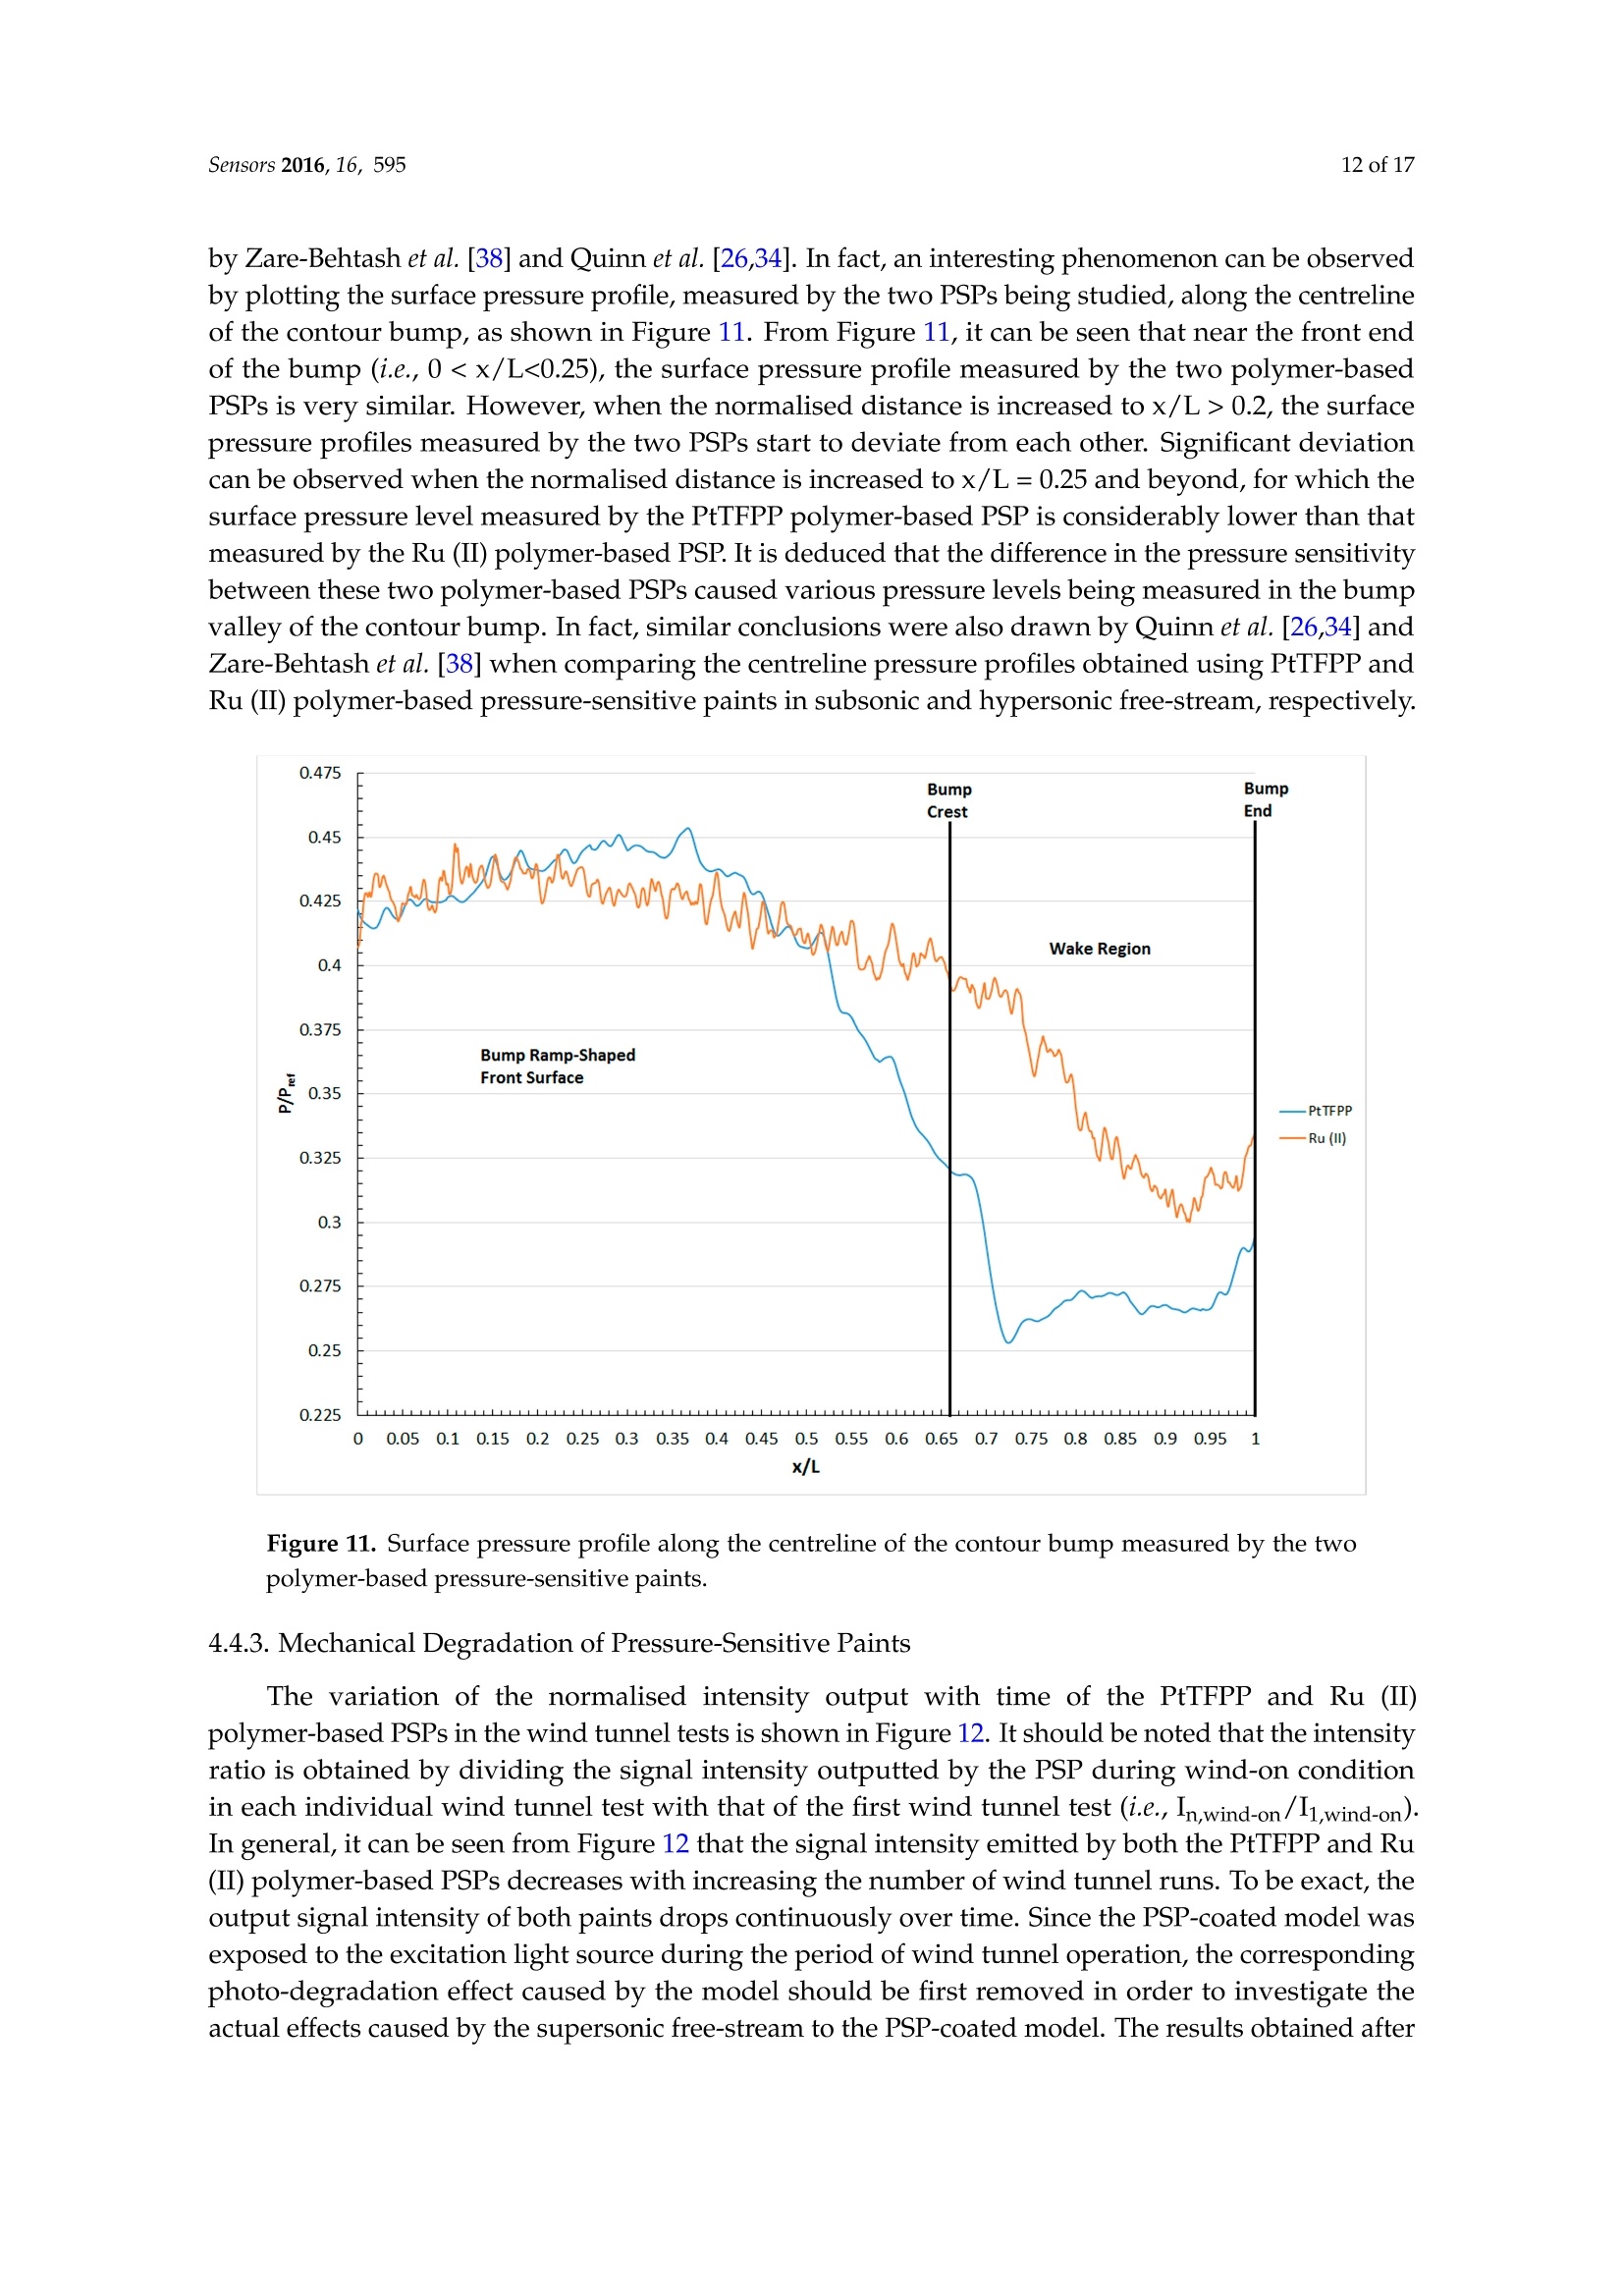
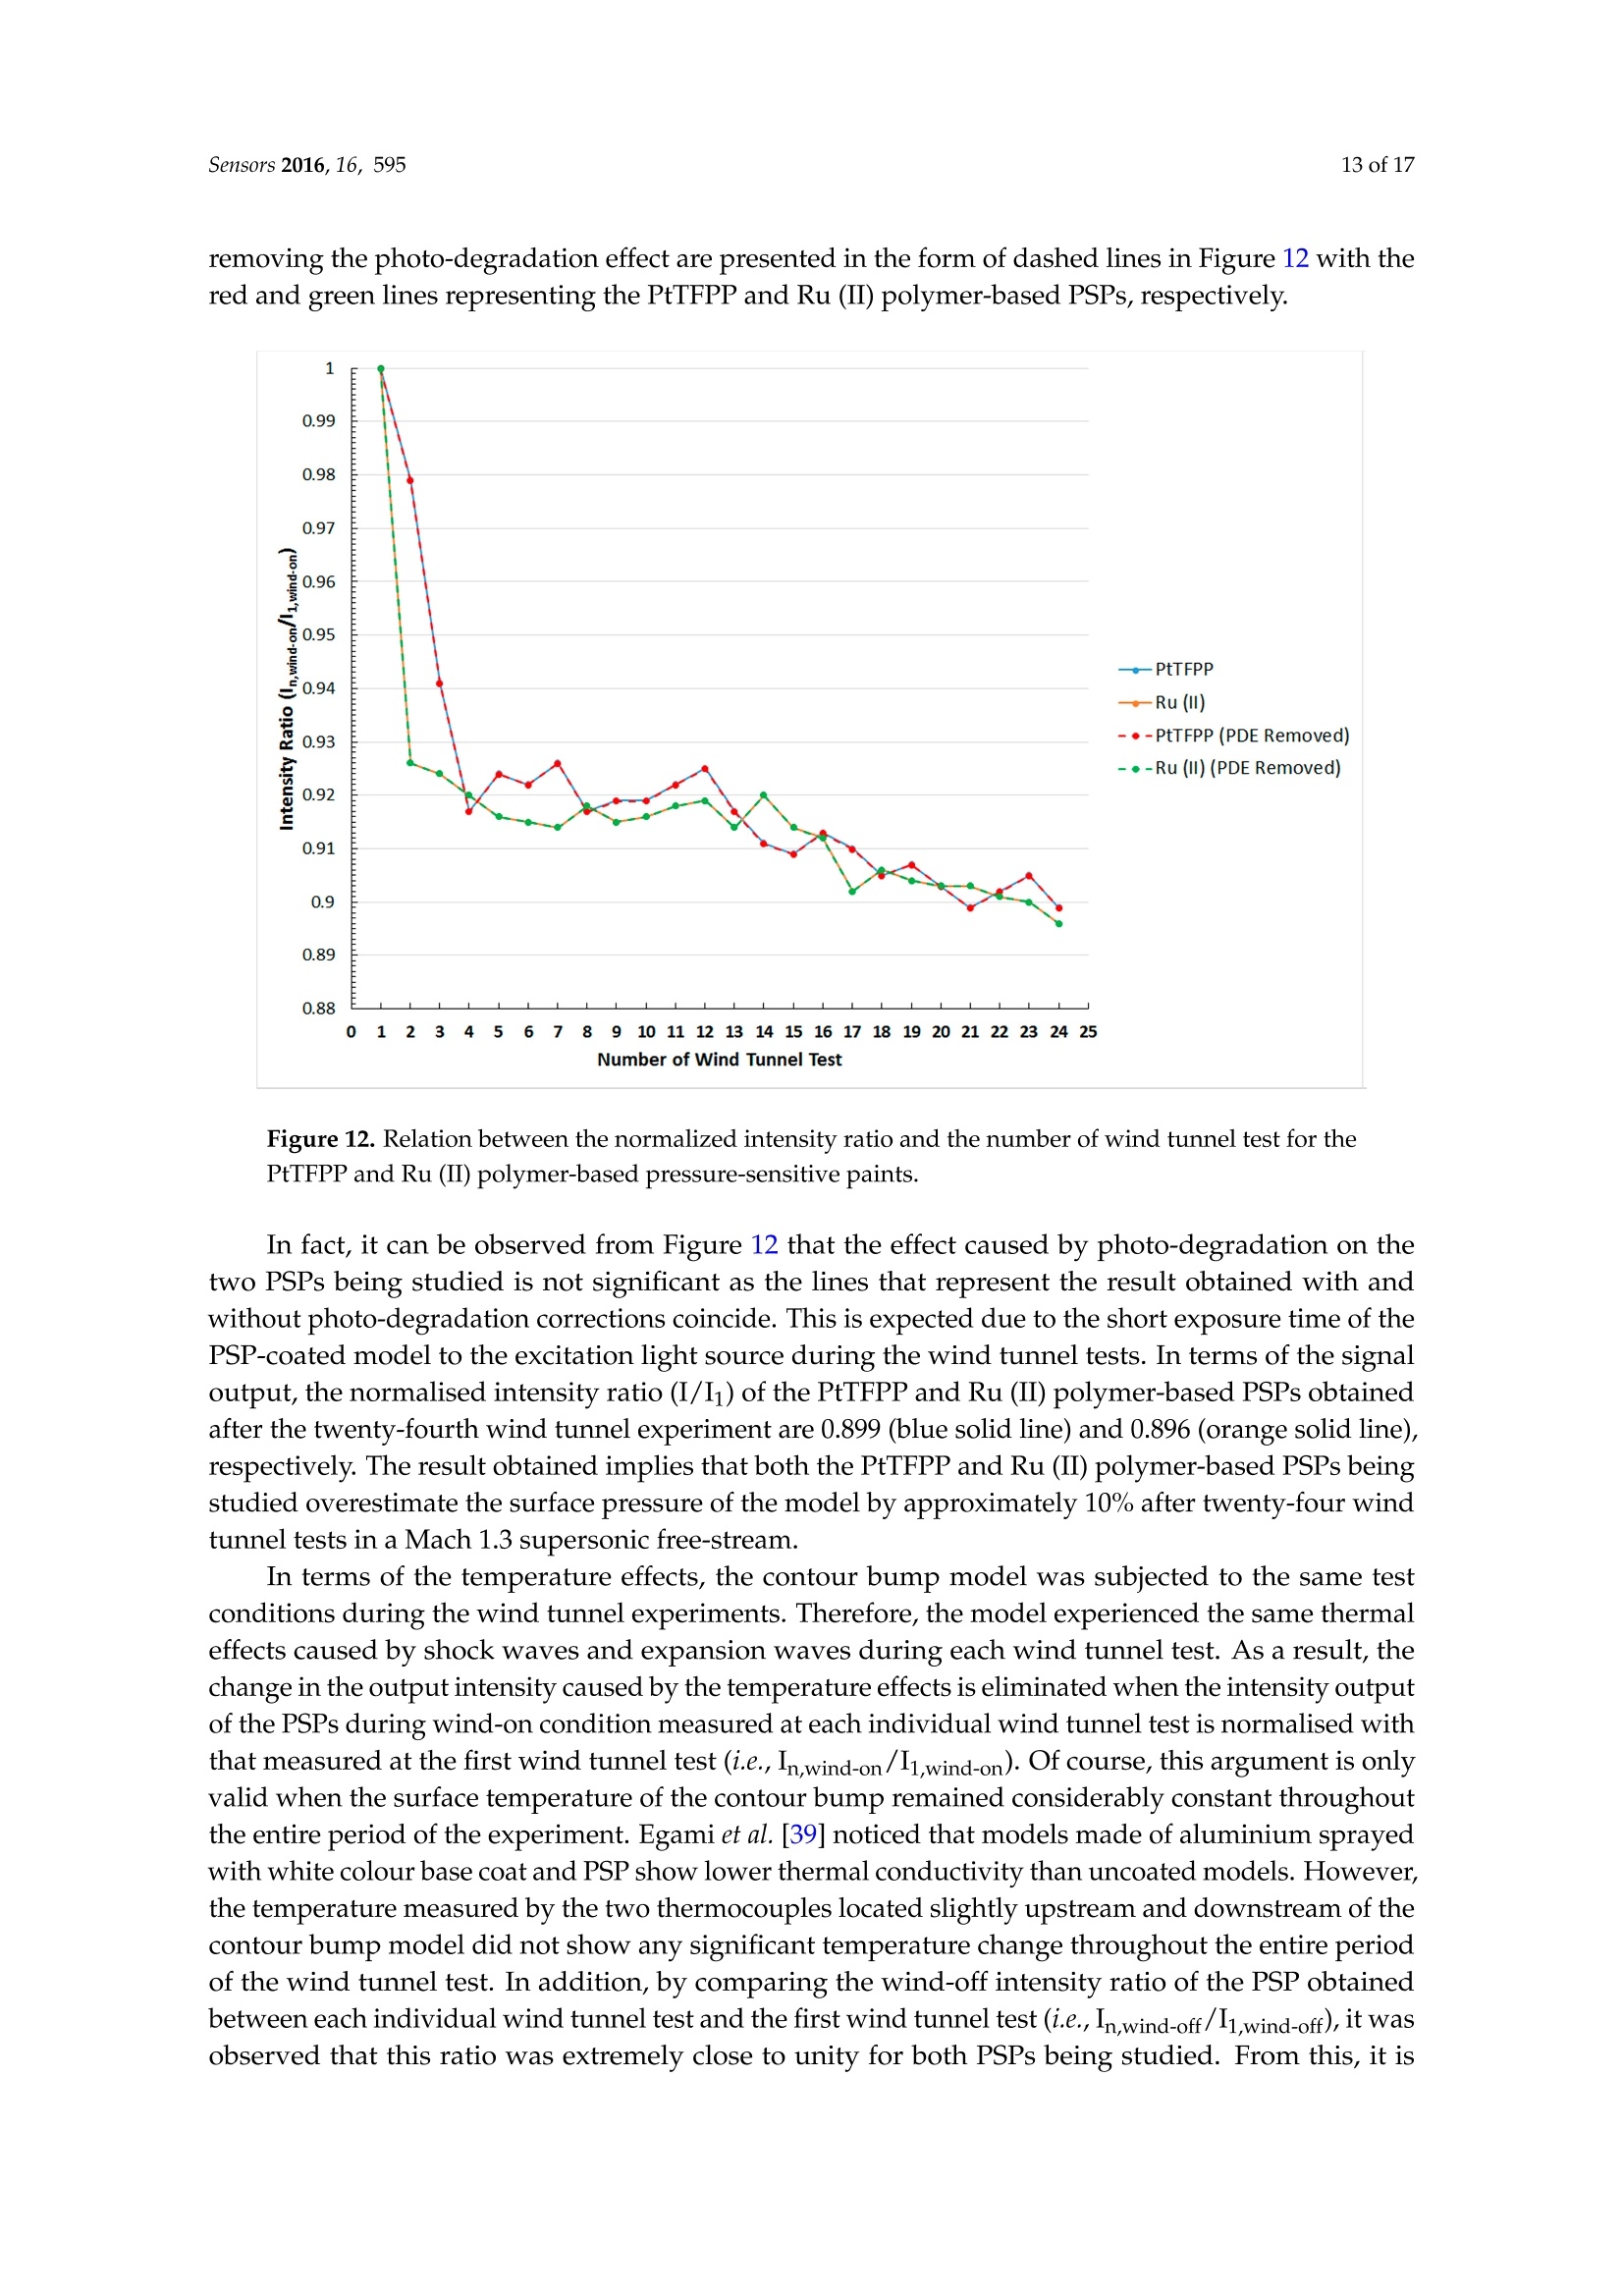
SensorS 2 of 17Sensors 2016, 16, 595 Sensors 2016,16,595; doi:10.3390/s16050595www.mdpi.com/journal/sensors Article Static and Wind-on Performance of Polvmer-BasedPressure-Sensitive Paints Using Platinum andRuthenium as the Luminophore Kin Hing Lo * and Konstantinos Kontis Division of Aerospace Sciences, School of Engineering, University of Glasgow, University Avenue, Glasgow,G12 8QQ,UK;kostas.kontis@glasgow.ac.uk * Correspondence: kinhing.lo@glasgow.ac.uk; Tel.: +44-141-330-2577 Academic Editor: Vittorio M. N. PassaroReceived: 28 January 2016; Accepted: 20 April 2016;Published: 26 April 2016 Abstract: An experimental study has been conducted to investigate the static and wind-onperformance of two in-house-developed polymer-based pressure-sensitive paints. Platinumtetrakis (pentafluorophenyl) porphyrin and tris-bathophenanthroline ruthenium II are used as theluminophores of these two polymer-based pressure-sensitive paints. The pressure and temperaturesensitivity and the photo-degradation rate of these two pressure-sensitive paints have beeninvestigated. In the wind tunnel test, it was observed that the normalised intensity ratio of bothpolymer-based pressure-sensitive paints being studied decreases with increasing the number of windtunnel runs. The exact reason that leads to the occurrence of this phenomenon is unclear, but it isdeduced that the luminophore is either removed or deactivated by the incoming flow during a windtunnel test. Keywords: pressure-sensitive paints; contour bumps; supersonic free-stream 1. Introduction Pressure-sensitive paint (PSP) techniques have become a valuable and efficient tool used forsurface pressure measurements [1-8]. Comparing to conventional point-based pressure measurementtechniques, the advantages of applying pressure-sensitive paint in surface pressure measurementsinclude: (1) pressure information over an entire surface can be obtained; (2) the non-intrusive nature ofthis experimental technique makes it ideal to be applied on surfaces with any shapes. Furthermore,the flow pattern over the surface of an object can be visualised through the "colour map"obtainedfrom the PSP measurements. Throughout the years, many pressure-sensitive paint formulationshave been developed and applied to different scenarios, ranging from typical surface pressuremeasurements on various objects in wind tunnel tests at different speeds [9-15] to flow and shockstructures visualisation [14-16], as well as used for measuring altitudes [17]. The operational principle of polymer-based pressure-sensitive paints has been well documentedin the literature, such as Liu and Sullivan [6] and Gregory et al. [18]. Therefore, only a brief summary isincluded here. When a PSP-coated sample is exposed to an excitation light source with the appropriatewavelength,luminophores in the PSP are excited from their ground state (i.e., a lower energy level state)to the excitation state (i.e., a higher energy level state). Since luminophores in the excitation state areunstable, therefore, these unstable luminophores tend to return to the ground state by releasing energyin the forms of light (i.e.,luminescent) and heat [6,18,19]. The luminescence emitted by the luminophoremolecules has a longer wavelength than its absorption wavelength [6,18]. The difference between theabsorption and emission spectra of a luminophore is known as its Stokes shift [20]. The fundamentaloperational principle of a polymer-based pressure-sensitive paint is by oxygen quenching of the luminophore suspended in an oxygen-permeable binder layer [6,18] (Figure 1). The intensity ofluminescence emitted by a luminophore molecule when it returns from the excitation state to itsground state is inversely proportional to the partial pressure of oxygen. To be exact, maximumluminescent emission appears when no oxygen is present (i.e., a vacuum), and the luminescence leveldecreases with increasing oxygen concentration. Henry’s law states that, at constant temperature,gas pressure at the surface of an object increases linearly with increasing the amount of gas that isdissolved. Through this principle, the luminescence level and the surface pressure of an object canbe related. Figure 1. Schematic of the polymer-based pressure-sensitive paint. Response time, pressure sensitivity, temperature sensitivity and the photo-degradation rate areimportant parameters for characterising the properties of pressure-sensitive paints. Carroll et al. [2]concluded that polymer-based pressure-sensitive paints have a typical response time (tresponse) oftresponse >0.5 s. Therefore, these pressure-sensitive paints are more suitable for steady surface pressuremeasurements, such as wind tunnel tests, due to their slow response. Although polymer-basedpressure-sensitive paints have been extensively used in various wind tunnel tests, there is lackof available information about the effects of the incoming flow on the performance of the PSPs.Mohsen [21] suggested that the signal intensity of a pressure-sensitive paint changes continuouslyover time in wind tunnel experiments caused by model movement and deformation. However, itis unclear whether any other factors could affect the signal output from PSPs over time in windtunnel experiments. The objective of this study is to investigate the performance change of two in-house-developedpolymer-based PSPs in a steady Mach 1.3 free-stream, i.e., Moo=1.3. A supersonic free-stream isadopted, such that the PSPs being studied are subjected to a stringent test environment. Platinumtetrakis (pentafluorophenyl) porphyrin and tris-bathophenanthroline ruthenium II are used as theluminophores of these two polymer-based PSPs. In addition to the supersonic wind tunnel tests, aseries of static calibration experiments are conducted to obtain the pressure sensitivity, temperaturesensitivity and photo-degradation characteristics of the paints. It is aimed that the combination of thestatic and wind-on experimental data can provide a more comprehensive account for the performanceof polymer-based PSPs in both static and wind-on conditions. 2. Sample Preparation 2.1. Aluminium Sheet Sample Six pieces of Grade 6083 aluminium alloy sheet samples were used in the static calibration experiments.The dimensions of these samples were 40 mm (length)x 40 mm (width)×3 mm (thickness). 2.2. Contour Bump Model Figure 2. Schematic of the three-dimensional rounded contour bump model. 2.3. Pressure-Sensitive Paints Two in-house-developed polymer-based pressure-sensitive paints were used in this study.These two polymer-based PSPs are a mixture of luminophore powder, ethanol, methyltriethoxysilane(MTEOS) and hydrochloric acid. Platinum tetrakis (pentafluorophenyl) porphyrin (PtTFPP) andtris-bathophenanthroline ruthenium ⅡI (Ru (II)) were used as the luminophores. The peak absorptionspectra of the PtTFPP and Ru (II) molecules are 395 and 457 nm, respectively [26]. The peak emissionspectrum of the PtTFPP molecules is 650 nm when illuminated by an ultra-violet light source withan emission wavelength of 395 nm. Similarly, the peak emission wavelength of the Ru (II) moleculesis 560 mm when illuminated by a blue colour light source with an emission wavelength of 475 nm.The emission spectra of the PtTFPP and Ru (II) molecules, as well as the emission wavelengths of thecorresponding illumination light sources are shown in Figure 3a,b, respectively. Figure 3. Emission spectra of the: (a) platinum tetrakis (pentafluorophenyl) porphyrin (PtTFPP) and(b) Ru (II) molecules (red line) and the corresponding emission wavelengths of the illuminating lightsources (blue line). 2.4. Sample/Model Preparation Procedures Although various samples and models were used in this study, the same preparation proceduresapplied to all of these models and samples. The aluminium sheet samples and contour bump modelswere first cleaned and degreased by ethanol. Then, the cleaned models/samples were sprayed withfive layers of matt white acyclic paint as the base coat. The function of the base coat is to reflect thesignal emitted by the luminophore molecules to increase the signal level reaching the CCD (chargecouple device) camera [19]. After the base coat was dried, 30 thin layers of PSP were sprayed onthe samples/models using an airbrush. The average thickness of the PSP coating was about 15 um.The PSP-coated samples/models were then cured inside an oven at 70 °C for 7 h. After curing,the PSP-coated samples/models were cooled naturally to the ambient temperature in a dark anddry chamber. 3. Experimental Setup 3.1. PSP Static Calibration Tests 3.1.1. Pressure and Temperature Sensitivity Tests The pressure and temperature sensitivity of the two polymer-based PSPs used in this study werefirst calibrated using a sealed static calibration chamber. The calibration chamber has a diameter anddepth of 180 and 80 mm, respectively. The PSP-coated samples were placed on the back wall inside thecalibration chamber. Optical access to the calibration chamber was achieved via a 5 mm-thick quartzwindow. Figure 4 shows the schematic setup of the PSP static calibration experiments. Figure 4. Schematic setup of the pressure-sensitive paint (PSP) calibration experiments. Pressure and temperature within the calibration chamber were monitored and controlledcontinuously during the calibration tests.. A Druck Ltd. DPI 530 pressure controller with anaccuracy of approximately 0.001 bar was used to achieve pressure control inside the calibrationchamber. Temperature control was handled by a Greenweld Peltier thermo-electric device. The surfacetemperature of the back wall of the calibration chamber was monitored by a K-type thermocouple.In the pressure sensitivity studies, the absolute pressure inside the calibration chamber was variedprogressively from 0 (i.e., vacuum) to 1 bar in a number of step changes. The temperature inside thecalibration chamber is maintained at 20°C throughout for simulating the temperature in the windtunnel tests. In contrast, in the temperature sensitivity studies, the temperature inside the calibrationchamber was varied progressively from 20 to 60°C, while the absolute pressure was maintainedconstant at 1 bar. It should be noted that after each step of temperature change, a five minute settlingtime was provided before any data were taken in order to ensure the equilibrium condition wasachieved within the calibration chamber. Light emitting diode (LED) panels were used to provide uniform illumination in the PSPcalibration experiments. A pair of ultra-violet (UV) LED panels with a maximum emission wavelengthof 395 nm was used to illuminate the PtTFPP polymer-based PSP-coated sample. Similarly, illuminationof the Ru (II) polymer-based PSP-coated sample was achieved through a pair of 475-nm blue LEDpanels. EEach of these LED panels contains 225 individual LEDs arranged in a 15 x 15 array. The illuminating light source was switched off during the pressure and temperature adjustments inorder to minimise the photo-degradation effect to the PSPs. Signals emitted from the PSP-coatedsamples were captured by a LaVision Image Intense 12-bit CCD camera, which was controlled by thesoftware Davis 7.2. The frame rate and the exposure time of the camera were set to 8 frames per secondand 50 ms, respectively. A 540-nmlong-pass filter and an infra-red cut-off filter were placed in front ofthe camera lenses to separate the luminescence emitted by the PSPs from the excitation light sourceand heat signals. Thirty "dark images" (i.e., the images captured without any illumination) were captured andsummed prior to each set of the PSP calibration experiment. In the PSP calibration tests, for eachpressure and temperature, thirty "bright"images (i.e., the images captured with illumination) werecaptured and summed. Summation of the images can improve the signal-to-noise ratio (SNR) and,therefore, increases the accuracy of the result obtained. The "dark corrected images"were obtainedby subtracting the summed "bright images" with the summed "dark image". This process aims tominimise the effect caused by background noise [19]. This "dark corrected images" were then storedin a Windows-based personal computer and processed by an in-house developed MATLAB program. 3.1.2. Pressure-Sensitive Paint Photo-Degradation Studies The experimental setup of the PSP photo-degradation studies is very similar to the PSP calibrationexperiments described in the previous Section 3.1.1. However, throughout the entire period of thephoto-degradation test, the pressure and temperatures inside the calibration chamber were maintainedat 1 bar and 20°C, respectively. 3.2.PSP Winds Tunnel Tests In the wind tunnel experiments for investigating the wind-on performance of thetwo polymer-based PSPs being studied, an intermittent in-draft transonic wind tunnel wasused. The same windtunnel1dwas also employed innawide range of supersonic flowrelated studiesis[15,23-25,27-33]. The test section of the wind tunnel }has dimensions of485.5 mm (length) x150 mm (width) ×216.5 mm (height). Optical access was achieved throughthe two quartz-made side windows and the ceiling mounted top window. The required Mach1.3 supersonic free-stream was obtained by expanding the airflow from the inlet through a pairof supersonic nozzles situated upstream of the test section. The wind tunnel has a stable runtime of6 s. At Moo=1.3, the flow Reynolds number per unit length (Re/L) is 11.7×10°[25]. Under the sameinitial conditions, the free-stream Mach number variation in the test section is Moo =1.3±0.01[24]. A schematic setup of the PSP wind tunnel tests is shown in Figure 5. During the tests, thePSP-coated contour bump model was floor mounted in the wind tunnel test section. Illumination ofthe PSP-coated models was achieved using a pair of (i) UV LED panels for the PtTFPP polymer-basedPSP-coated model or (ii) blue LED panels for the Ru (II) polymer-based PSP-coated model. The samepairs of LED panels were used in the PSP static calibration tests. The illuminating light source wasplaced at the two sides of the wind tunnel test section, so that the entire test section was uniformlyilluminated. In order to minimise the photo-degradation effect, the excitation light source was onlyswitched on during the period of each wind tunnel test, i.e., 5 s for capturing wind-on images plusanother 5 s for capturing wind-off images immediately after the wind tunnel operation. Completedarkness was maintained within the laboratory during any other periods of time. Figure 5. Schematic setup of the PSP wind tunnel (dynamic) experiments. Signals emitted from the PSP-coated model during the wind tunnel tests were captured bya LaVision Image Intense 12-bit CCD camera, which was also used in the PSP static calibrationexperiments. The frame rate and the exposure time of the camera were set to 8 frames per second and50 ms, respectively. Similar to the PSP static calibration tests, thirty "dark images" were captured andsummed immediately prior to the start of each wind tunnel test for conducting the dark correctionprocess. In total, forty“wind-on"images were captured during each wind tunnel test (i.e.,5s) followedby capturing another forty "wind-off" images immediately after the wind tunnel operation. Wind-offimages were captured after each wind tunnel test in order to account for the temperature effects causedby shock and expansion waves to the contour bump model [26,34]. Captured images were storedin a Windows-based computer and post-processed by an in-house-developed MATLAB program.It should be noted that the first 10"wind-on"and "wind-off" images captured in each wind tunneltest were removed from further processing in order to account for the unsteadiness effects duringthe wind tunnel start-and-stop period [25]. As a result, thirty pairs of"wind-on" and"wind-off"images captured were summed separately for calculating the contour of the signal intensity ratio ofthe contour bump model. In total, twenty-four sets of wind tunnel tests were conducted per PSP-coated contour bumpmodel. A five-minute interval was provided between two consecutive wind tunnel runs for vacuumingthe vacuum tank of the wind tunnel. It should be noted that the temperature within the wind tunneltest section was monitored continuously by two k-type thermocouples. These two thermocoupleswere situated at 25 mm upstream and 15 mm downstream of the front and rear ends of the contourbump model, respectively. The average temperature fluctuation (AToo) during wind-off condition overthe entire period of wind tunnel test was about 20 ±0.5°C. Since the PSP-coated contour bump modelwas exposed to the excitation light source for 10 seconds during each wind tunnel test, therefore, theoverall light exposure time of each PSP-coated model after the twenty-fourth wind tunnel experimentwas 240 s. 4. Results and Discussion 4.1. Pressure Sensitivitu The pressure sensitivity of the PtTFPP and Ru (II) polymer-based PSPs is shown in the form ofStern-Volmer plot in Figure 6. A Stern-Volmer plot relates the normalised intensity output (Iref/I)to the normalised pressure ratio (P/Pref) of a pressure-sensitive paint. It should be noted that thereference pressure used in this study was 1 bar. From Figure 6, it can be seen that considerably linearStern-Volmer relations exist in both polymer-based PSPs being studied. To be exact, the relationbetween Iref/I and P/Pref in these two polymer-based PSPs is considerably linear. A linear fit modelwas used to determine the gradient of the Stern-Volmer relation, which represents the pressuresensitivity of a PSP. The linear fit Stern-Volmer relations obtained for the two polymer-based PSPsbeing studied are tabulated in Table 1. Table 1. Pressure-sensitive of the PtTFPP and Ru (II) polymer-based PSP. Type of PSP Linear Fit Stern-Volmer Relation ref P PtTFPP Polymer I =0.3252+0.7029 Pref Ru (II) Polymer Iref =0.7203+0.2777 P I Pref As shown in Table 1, the pressure sensitivity of the PtTFPP and Ru (II) polymer-basedpressure-sensitive paints is 0.7% and 0.27% per unit pressure change, respectively. This indicates thatthe PSP using PtTFPP as the luminophore shows higher pressure sensitivity than the paint with Ru (II)as the luminophore. It can be observed from Figure 6 that a much steeper gradient is shown in theStern-Volmer plot of the PtTFPP rather than the Ru (II) polymer-based PSP. With this result, it is ableto be concluded that the PtTFPP polymer-based PSP performs better in pressure measurements thatinvolve small levels of pressure changes. Figure 6. Stern-Volmer plot for the PtTFPP and Ru (II) polymer-based pressure-sensitive paints. 4.2. Temperature Sensitivity One of the major drawbacks in pressure measurements using pressure-sensitive paints is theirtemperature dependency [6,18,26]. Therefore, it is necessary to investigate the temperature sensitivitycharacteristics of the two polymer-based PSPs being studied. Figure 7 shows the relation betweenthe normalised intensity output (Iref/I) and temperature ratio (T/Tref) of the PtTFPP and Ru (II)polymer-based PSPs used in this study. It should be noted that the reference temperature (Tref) usedwas 20°C. Figure 7. Temperature sensitivity of the PtTFPP and Ru (II) polymer-based PSPs. The result shown in Figure 7 indicates that the normalised intensity output decreases in a relativelylinear manner with increasing temperature ratio for both the PtTFPP and Ru (II) polymer-basedPSPs. This is because the rate of oxygen quenching is proportional to the activation energy of theoxygen molecules. To be exact, the rate of oxygen quenching increases, and hence, the normalisedintensity output decreases when the polymer-based PSPs are subjected to higher temperatures.Relatively small changes in terms of the normalised intensity ratio are observed in both the PtTFPPand Ru (II) polymer-based PSPs when the temperature ratio is approaching T/Tref =1. In fact,a similar phenomenon was also documented in the studies conducted by Yang et al. [13] andGongora-Orozco et al. [35]. However, the authors in [13] and [35] did not explain the reasons thatmight lead to the occurrence of this phenomenon. Similar to the pressure sensitivity, the gradient ofthe plotted lines in Figure 7 shows the temperature sensitivity of the two polymer-based PSPs beingstudied. From Figure 7, it can be seen that the change in the normalised intensity output per unittemperature ratio increment for the PtTFPP and Ru (II) polymer-based PSPs is -0.014 and -0.021,respectively. Therefore, the signal intensity outputted by the polymer-based PSP using Ru (II) as theluminophore is more susceptible to temperature changes than the PtTFPP polymer-based PSP. 4.3. Photo-Degradation In pressure-sensitive paints, the output signal intensity decreases with increasing exposuretime to the excitation light source [6,18]. This is known as the photo-degradation effect of PSPs.The photo-degradation rate of PSPs could be varied from 1% [36] to 47% [37] per hour depending onthe substrate,luminophore and the formulation used. Therefore, this effect could significantly affectthe accuracy of surface pressure measurements using PSPs. As a result, the photo-degradation rateof the two polymer-based PSPs being studied is investigated, and the result obtained is shown inFigure 8. Figure 8. Photo-degradation rate of the PtTFPP and Ru (II) polymer-based PSPs. In general, the signal outputted from both the PtTFPP and Ru (II) polymer-based PSPs decreaseswith increasing excitation time as seen in Figure 8. Although a second-order polynomial fit relationis adopted here, it can be seen from Figure 8 that the non-linear term in the equations for both thePtTFPP and Ru (II) polymer-based PSPs used is negligible compared to the linear term. Therefore, thephoto-degradation rate of these two polymer-based PSPs can be obtained by calculating the gradientof the plotted lines in Figure 8. After calculation, it can be seen that the photo-degradation rate of thePtTFPP and Ru (II) polymer-based PSPs are -0.14% and-0.07% per minute, respectively. This meansthat the decay rate of the signal intensity output of the PtTFPP polymer-based PSP is twice that of theRu (II) polymer-based PSP. The result obtained indicates that the PtTFPP polymer-based PSP is lessstable than the Ru (II) polymer-based PSP when exposed to the excitation light source. 4.4. Behaviour of Polymer-Based PSPs in Wind Tunnel Tests After considering the pressure sensitivity, temperature sensitivity and photo-degradationcharacteristics of the PtTFPP and Ru (II) polymer-based PSPs being studied, their behaviour inthe supersonic wind tunnel tests is now investigated. As two identical three-dimensional roundedcontour bumps were used in these wind tunnel experiments, therefore, the typical flow pattern overthe bump model in a Mach 1.3 supersonic free-stream is first shown before discussing the performanceof the two polymer-based PSP being studied in wind tunnel tests. 4.4.1. Flow Pattern over the Three-Dimensional Rounded Contour Bump Figure 9. Flow pattern over the three-dimensional rounded contour bump. (a) Schlieren photographyimage and (b) surface oil flow visualisation image. The streamwise flow pattern (Figure 9a) along the contour bump can be summarised as follows.The front end of the rounded contour bump deflects the incoming flow, so that a series of compressionwaves (C.W.) are formed at the beginning of the bump.Across these compression waves, the flowmoves along the ramp-shape front surface of the bump to reach the bump crest. Flow expansion beginsat the bump crest through a series of expansion waves (E.W.). Due to the rapid change in the bumpgeometry, flow separation appears downstream of the bump crest. This leads to the formation of alow pressure wake region in the bump valley, which is evidenced by the presence of the shear layer(S.L.) downstream of the bump crest. Finally, a reattachment shock (R.S.) is formed at the rear endof the bump across which the flow becomes parallel to the free-stream direction. For the spanwiseflow pattern, it can be seen from Figure 9b that the incoming flow is deflected at the beginning ofthe bump to move along and around the bump. A separation line (S.L.) is shown at the bump crest,which indicates the location where flow separation begins. The presence of the low pressure wakeregion downstream of the bump crest attracts the flow from the two sides of the bump to move intoand circulates in the bump valley. As a result, a pair of counter-rotating vortices (V.P.) is formed in thebump valley. These vortices propagate downstream, and therefore, a pair of vortex trails (V.T.) is leftbehind the rear end of the bump model. To conclude from the flow pattern as seen in Figure 9, it is expected that relatively high pressureregions exist in the ramp-shaped front surface of the bump due to the flow compression effect causedby the compression waves. In contrast, the presence of the wake region and the spanwise vortices inthe bump valley indicates that a low pressure zone exists downstream of the bump crest. With thisinformation, the capability of the PtTFPP and Ru (II) polymer-based PSPs being studied in resolvingthe surface pressure profile of the contour bump model can be discussed. 4.4.2. Surface Pressure Map The surface pressure contour of the rounded contour bump measured by using the PtTFPP andRu (II) polymer-based pressure-sensitive paints is shown in Figure 10. It should be noted that duringthe photo-registration process, the intensity ratio contour over the surface of the contour bump modelwas obtained by dividing the summed wind-on images with the summed wind-off image capturedimmediately after the wind tunnel test. Therefore, the thermal effect thatacted on the model duringthe wind tunnel test was compensated. In addition, although no data of pressure measurements using pressure taps and transducers are provided here, the data shown in [38] using a double-ramp modelconcluded that accurate surface pressure measurements in supersonic free-stream could be achievedby using the two polymer-based PSPs employed in the present study, as the same polymer-based PSPformulations were also used in [38]. Figure 10. Surface pressure map of the contour bump measured by: (a) PtTFPP and (b) Ru (II) polymerpressure-sensitive paints. In the surface pressure map corresponding to the PtTFPP polymer-based PSP (Figure 10a),relatively high pressure regions are shown in the entire front surface of the bump upstream of thebump crest. The presence of the three-dimensional flow relieving effects weaken the flow compressionat the two sides of the bump; therefore, a zone that shows the highest pressure ratio exists at thecentre portion of the bump front surface. Downstream of the bump crest, as expected, low pressurezones appear in the entire bump valley due to the presence of the wake region there. In addition, theseparation line at the bump crest and the spanwise vortices in the bump valley are able to be resolvedby the PtTFPP polymer-based PSP.This indicates that the PtTFPP polymer-based PSP can provideboth the qualitative surface pressure map and quantitative information about the flow pattern over thecontour bump model. It should be noted that a similar contour map pattern was also documentedin [38] using a contour bump model coated with polymer-based PSP with PtTFPP as the luminophore. In contrast, a comparably poor resolution surface pressure map as shown in Figure 10b is obtainedwith the Ru (II) polymer-based PSP-coated contour bump model. Similar to the case when the PtTFPPpolymer-based PSP is used, relatively high pressure regions are shown in the front surface of thebump. However, the Ru (II) polymer-based PSP failed to resolve the highest pressure zone at the centreportion of the bump front surface. Downstream of the bump crest, it can be seen from Figure 10b thatrelatively low pressure regions exist in the bump valley. However, the Ru (II) polymer-based PSP canneither resolve the details of the spanwise vortex pair in the bump valley nor the separation line at thebump crest. Therefore, compared to the PtTFPP polymer-based PSP, the Ru (II) polymer-based PSPshows limited capability in providing qualitative information about the flow features that present inthe flow field. Similar conclusion was also drawn by Zare-Behtash et al. [38] using a contour bumpmodel coated with Ru (II) polymer-based PSP. It should be noted that the PSP formulation used in [38]is slightly different from the one employed in this study. The lack of resolution in the surface pressure contour generated by the Ru (II) polymer-basedPSP is due to its poorer pressure sensitivity compared to the PtTFPP polymer-based PSP. To be exact,the Ru (II) polymer-based PSP shows limited capability in resolving small pressure variations in theflow field. Instead, it tends to"averaging" the surface pressure distribution over the surface of anobject. This is evidenced by the absence of the flow features, like the spanwise vortex pair and theseparation line in the surface pressure map shown in Figure 10b. Similar conclusions were also drawn by Zare-Behtash et al. [38] and Quinn et al. [26,34]. In fact, an interesting phenomenon can be observedby plotting the surface pressure profile, measured by the two PSPs being studied, along the centrelineof the contour bump, as shown in Figure 11. From Figure 11, it can be seen that near the front endof the bump (i.e., 0 0.2, the surfacepressure profiles measured by the two PSPs start to deviate from each other. Significant deviationcan be observed when the normalised distance is increased to x/L=0.25 and beyond, for which thesurface pressure level measured by the PtTFPP polymer-based PSP is considerably lower than thatmeasured by the Ru (II) polymer-based PSP. It is deduced that the difference in the pressure sensitivitybetween these two polymer-based PSPs caused various pressure levels being measured in the bumpvalley of the contour bump. In fact, similar conclusions were also drawn by Quinn et al. [26,34] andZare-Behtash et al. [38] when comparing the centreline pressure profiles obtained using PtTFPP andRu (II) polymer-based pressure-sensitive paints in subsonic and hypersonic free-stream, respectively. Figure 11. Surface pressure profile along the centreline of the contour bump measured by the twopolymer-based pressure-sensitive paints. 4.4.3. Mechanical Degradation of Pressure-Sensitive Paints The variation of the normalised intensity output with time of the PtTFPP and Ru (II)polymer-based PSPs in the wind tunnel tests is shown in Figure 12. It should be noted that the intensityratio is obtained by dividing the signal intensity outputted by the PSP during wind-on conditionin each individual wind tunnel test with that of the first wind tunnel test (i.e., In,wind-on/I1,wind-on).In general, it can be seen from Figure 12 that the signal intensity emitted by both the PtTFPP and Ru(II) polymer-based PSPs decreases with increasing the number of wind tunnel runs. To be exact, theoutput signal intensity of both paints drops continuously over time. Since the PSP-coated model wasexposed to the excitation light source during the period of wind tunnel operation, the correspondingphoto-degradation effect caused by the model should be first removed in order to investigate theactual effects caused by the supersonic free-stream to the PSP-coated model. The results obtained after removing the photo-degradation effect are presented in the form of dashed lines in Figure 12 with thered and green lines representing the PtTFPP and Ru (II) polymer-based PSPs, respectively. Figure 12. Relation between the normalized intensity ratio and the number of wind tunnel test for thePtTFPP and Ru (II) polymer-based pressure-sensitive paints. In fact, it can be observed from Figure 12 that the effect caused by photo-degradation on thetwo PSPs being studied is not significant as the lines that represent the result obtained with andwithout photo-degradation corrections coincide. This is expected due to the short exposure time of thePSP-coated model to the excitation light source during the wind tunnel tests. In terms of the signaloutput, the normalised intensity ratio (I/Ii) of the PtTFPP and Ru (II) polymer-based PSPs obtainedafter the twenty-fourth wind tunnel experiment are 0.899 (blue solid line) and 0.896 (orange solid line),respectively. The result obtained implies that both the PtTFPP and Ru (II) polymer-based PSPs beingstudied overestimate the surface pressure of the model by approximately 10% after twenty-four windtunnel tests in a Mach 1.3 supersonic free-stream. In terms of the temperature effects, the contour bump model was subjected to the same testconditions during the wind tunnel experiments. Therefore, the model experienced the same thermaleffects caused by shock waves and expansion waves during each wind tunnel test. As a result, thechange in the output intensity caused by the temperature effects is eliminated when the intensity outputof the PSPs during wind-on condition measured at each individual wind tunnel test is normalised withthat measured at the first wind tunnel test (i.e., In,wind-on/I1,wind-on). Of course, this argument is onlyvalid when the surface temperature of the contour bump remained considerably constant throughoutthe entire period of the experiment. Egami et al. [39] noticed that models made of aluminium sprayedwith white colour base coat and PSP show lower thermal conductivity than uncoated models. However,the temperature measured by the two thermocouples located slightly upstream and downstream of thecontour bump model did not show any significant temperature change throughout the entire periodof the wind tunnel test. In addition, by comparing the wind-off intensity ratio of the PSP obtainedbetween each individual wind tunnel test and the first wind tunnel test (i.e., In,wind-off/I1,wind-off), it wasobserved that this ratio was extremely close to unity for both PSPs being studied. From this, it is suggested that the surface temperature of the contour bump models remains considerably constantthroughout the entire period of the wind tunnel tests. It is believed that the exposure of the PSP-coated model to the strong incoming flow causes theoutput signal intensity of both the PtTFPP and Ru (II) polymer-based PSPs to drop continuouslyover time. To be exact, it is deduced that the strong incoming flow either removed or deactivatedsome luminophores in the PSPs during the wind tunnel experiments. From this, it is deduced that anew type of degradation effect called the "mechanical degradation" effect exists. Unfortunately, thehypothesis about the presence of the "mechanical degradation" effect could not be proven in this study.This is because the variation of the paint thickness with the number of wind tunnel test could not bemeasured as the surface profiler available in the author's institution does not have a sufficiently largetest section to accommodate the contour bump model. However, Basu and Kamble [40] mentionedthat polymer-based PSPs using triethoxysilane (TEOS) based sol-gel show a tendency to form cracksand peel-off from the model surface. It should be noted the data gathered from the present study did not show any signs of paintremoval.However, the phenomenon of PSP peel-off from the model surface does happen based onthe authors’ actual observation form both subsonic, supersonic and hypersonic wind tunnel tests.This phenomenon usually happened when a model is sprayed with a polymer-based PSP with a highsol-gel to catalyst/solvent ratio. Here, it must be emphasised that using a polymer-based PSP with ahigh sol-gel to solvent/catalyst ratio is sufficient, but does not necessarily means cracks and/or loosepaint layers must be developed. In fact, based on the authors' experienced that even though the samepreparation procedures and test conditions are implemented, the probability of seeing cracks and/orloose layers in the models sprayed with polymer-based PSPs with a high sol-gel to solvent/catalystratio is around 50%. Therefore, it seems like some unknown additional factors actually contribute tothis crack and/or loose paint layer formation process. Further investigations are required in order tofully understand the chemical property of TEOS-based pressure-sensitive paints. In addition, the drop in the signal intensity outputted might also be caused by luminophoredeactivation. In fact, this phenomenon appears occasionally in polymer-based PSPs using PtTFPPand Ru (II) as luminophores, as reported by Amao [41]. There is one point here that should benoted base1f Wd on actual wind tunnel test experience. In general, it was observed from a range of windtunnel experiments with wind speeds ranging from subsonic to hypersonic using various models thatprogressive whitening of the pressure-sensitive paint appears during the experiments. Moreover, itwas observed that the colour change to the PSP-coated models is reversible, and the colour of themodel tends to return to original after a period of idle time. The duration of the idle time requireddepends on the formulation used. Therefore, it is required to investigate further about the chemicalproperties of TEOS-based pressure-sensitive paint in order to understand what causes the PSP modelwhitening and the "mechanical degradation" phenomena to occur. Therefore, on top of the corrections to the temperature and photo-degradation effects, correctionsto the decay in the output signal intensity of polymer-based PSPs over time are also required in windtunnel experiments. This is particularly important in experiments that require being repeated multipletimes or that last for a long period of time. In terms of the performance of the two PSPs being studiedin the wind tunnel tests, for the PtTFPP polymer-based PSP, it can be seen from Figure 12 that theoutput signal intensity drops abruptly in the first four consecutive wind tunnel runs. To be exact,the normalised intensity ratio dropped from I/I1=1 after the first wind tunnel test to I4 /I1 =0.917after the fourth wind tunnel experiment. This indicates that the output signal intensity is reduced by8.3% after four consecutive wind tunnel tests. Afterwards, the reduction in the output signal intensitybecomes gradual, and the average change in the output signal intensity of the PtTFPP polymer-basedPSP between the fourth and twenty-fourth wind tunnel tests is about -1.96%. A similar trend couldalso be observed when the Ru (II) polymer-based PSP is used. From Figure 12, it can be seen that a 7.4%drop in the signal output intensity appears after the first two consecutive wind tunnel tests when Ru(II) polymer-based PSP is used. Changes in the output signal intensity of the Ru (II) polymer-based PSP become gradual after the second wind tunnel run. The average change in the normalised intensity ratio per wind tunnel experiment is about -0.14% between the second and the twenty-fourth wind tunnel tests.The reason that leads to the abrupt reduction in the output signal intensity of the PtTFPP and Ru(II) polymer-based PSPs in the first several consecutive wind tunnel tests is also unclear. It is deducedthat the first several layers of PSP coating on the model surface are relatively loose. These looselayers of paint are prone to be removed by the strong incoming flow during the wind-on condition.This might explain why the normalised intensity ratio drops rapidly over the first several wind tunnelruns in both the PtTFPP and Ru (II) polymer-based PSPs used in this study. In addition, comparedto the Ru (II) polymer-based PSP, the PtTFPP polymer-based PSP is more suitable to be used in caseswhen the PSP-coated model is only tested in the wind tunnel for a limited number of times. This isbecause the output signal intensity reduction is less susceptible in the PtTFPP polymer-based PSPin the first couple of consecutive wind tunnel tests. However, comparable performance is observedin both the PtTFPP and Ru (II) polymer-based PSPs being studied when the PSP-sprayed model isrequired to be used repeatedly over a long period of time. 5. Conclusions An experimental study has been conducted to investigate the static and wind-on performanceof two polymer-based pressure-sensitive paints using PLATINUM TETRAKIS (pentafluorophenyl)porphyrin (i.e.,PtTFPP) and tris-bathophenanthroline ruthenium II (i.e., Ru (II)) as the luminophores.The static calibration tests were conducted in a sealed calibration chamber, and the wind-onexperiments were conducted in a transonic wind tunnel in a Mach 1.3 supersonic free-stream. In thestatic calibration tests, it was observed that the pressure sensitivity of the PtTFPP polymer-basedpressure-sensitive paint is higher than that of the Ru (II) polymer-based pressure-sensitive paint.It was concluded that the PtTFPP polymer-based pressure-sensitive paint shows better performance inmeasuring small pressure variations in a flow field due to its higher pressure sensitivity. In addition,it was observed that the polymer-based PSP using PtTFPP as the luminophore is less prone totemperature variations than the Ru (II) polymer-based pressure-sensitive paint. However, it wasfound that the PtTFPP polymer-based PSP shows a two-times higher photo-degradation rate than theRu (II) polymer-based PSP. In the wind tunnel tests, a new type of degradation called the "mechanical degradation" wasproposed. It was emphasised that when a polymer-based PSP-coated model is used in the windtunnel tests, on top of the corrections for the temperature sensitivity and photo-degradation effects, themechanical degradation effect must also be corrected. It was observed that for both the PtTFPP and Ru(II) polymer-based PSPs, the output signal intensity of the PSP-coated model decreases continuouslyover time. For both the PtTFPP and Ru (II) polymer-based PSPs being studied, approximately a 10%reduction in the output signal intensity was observed after twenty-four consecutive wind tunnelexperiments. This corresponds to an over-estimation of the surface pressure ratio of the model byabout 10%. The presence of the"mechanical degradation effect" was deduced to be caused by thestrong incoming flow either by deactivating or removing some luminophores from the PSP-coatedmodel during the wind tunnel experiments. Moreover, it has been seen that for both the PtTFPP and Ru(II) polymer-based pressure-sensitive paints, the output signal intensity of the paints dropped abruptlyover the first several consecutive wind tunnel experiments. The underlying reason that causes thisphenomenon is currently unclear. It was deduced that the top several layers of the pressure-sensitivepaint on a model surface are loose, so that they can easily be removed by the incoming flow during thefirst several consecutive wind-on experiments. Finally, it was mentioned that the PtTFPP polymer-based pressure-sensitive paint is more suitablethan the Ru (II) polymer-based pressure-sensitive paint to be used in experiments that only last for avery short duration or only require being repeated a limited number of times. In contrast, both thePtTFPP and Ru (II) polymer-based PSPs are suitable for those experiments that need to be repeatedmany times or have a long test duration, because they show similar long-term performance. Acknowledgments: The authors would like to acknowledge the Engineering and Physical Sciences ResearchCouncil (EPSRC) loan pool for the Photon FastCam SA1.1 monochrome camera used in this experimental study. Author Contributions: All experiments were conducted by Kin Hing Lo. Data analysis was jointly conducted byKin Hing Lo and Konstantinos Kontis. Both authors contributed equally in manuscript preparation. Conflicts of Interest: The authors declare no conflict of interest. References 1. Liu, T.; Campbell, B.T. Fluorescent paint for measurement of heat transfer in shock-turbulent boundary layerinteraction. Exp. Therm. Fluid Sci. 1995, 10,101-112. [CrossRefl 2. Carroll, B.F.; Abbitt, J.D.; Lukas, E.W.;Morris, M.J. Step response of pressure-sensitive paints. AIAA J. 1996,34,521-526.[CrossRef] ( 3. Mosharov, V.;Radchenko, V.; Fonov, S. Luminescent P r essure Sensors in Aerodynamic Experiments; Central Aerohydrodynamic Institute (TsAGI): Zhukovskiy, Russia, 1998. ) ( 4. Klein, C. Application of pressure sensitive paint (PSP) for the determination of the instantaneous pressure field of models in a wind tunnel. Aerosp. Sci. Technol. 2000,4,103-109. [Cros s Ref] ) ( 5. Bell, J.H.; Schairer, E.T.;Hand, L.A.; Mehta, R.D. Surface pressure measurements using luminescent coatings.Annu. R ev. Fluid Mech.2001, 33,155-206.[Cr ossRef] ) ( 6. Liu, T.; Sullivan, J.P. Pressure and Temperature Sensitive Paints, 1 s t ed.; Springer Verlag: Berlin, Germany, 2005; pp. 1-260. ) ( 7. Sakaue, H. Luminophore application method of a n odized aluminium pressure sensitive paint a s a f a st responding global pressure sensor. Rev. Sc i . Instrum. 2005, 76 , 1-6. [Cr o s sRef] ) ( 8. Gongora-Orozco,N.; Zare-Behtash, H.; Kontis, K. Global unsteady pressure-sensitive paint measurements ofa moving shock wave using thin-layer chromatography. Measurements 2010, 43,152-155. [Cros sRef] ) ( 9. T aghavi,R.; Ramen, G.; Bencic, T. Pressure sensitive paint demonstrates relationship between ejector wall pressure and aerodynamic performance. Exp. Fluids 1999,26, 481-487. [C r o ssRef] ) ( 10. Engler, R .H.;M e rienne, M.C.; Klein, C.; Le Sant, Y. Application of PSP in low speed flows. Aerosp. Sci. T echnol. 2002,6,313-322.[C rossRef ) ( 11. Kameda, M.; Tabei, T.;N a kakita, K.; Sakaue, H . ; A s ai, K. Image measurements of unsteady pressurefluctuation by a pressure-sensitive c oating on porous anodized alu m inium. Meas. Sci. Techn o l. 2005, 1 6,2517-2524. [ CrossRef] ) ( 12. Kontis, K.; Lada, C.;Zare-Behtash, H. Effect of dimples on glancing shock wave turbulent boundary layerinteractions. Shock Waves 2008, 17,323-335. [CrossRef ) ( 13. Y ang,L.;Zare-Behtash, H.; Erdem,E.; K on t is, K. Investigation of the double ramp in hypersonic flow usingluminescent measurement systems. Exp. Therm. Fl u id Sci. 2012, 40,50-56. [C rossRef] ) ( 14. Idris, A.C.; Saad, M.R.; Zare-Behtash,H.; Kontis, K. Luminescent measurement systems for the investigation of a scramjet inlet-isolator . Sensors 2014, 14,6606-6632.[C rossRef] [ Pu bMed] ) ( 15. Lo, K.H.; Zare-Behtash, H.; Kontis, K.; Qin, N. Application of polymer-based pressure sensitive paint for qualitative and quantitative fl o w visualization in a transonic flow . In P r oc e edings of the 28th InternationalSymposium on Shock Waves, Ma d ison, WI, USA, 14-19 Jul y 2013. ) ( 16. Bruce, P .J.K.; Babinsky, H.Experimental study into the flow physics of three-dimensional shock control bumps. J. A ircr. 2012, 49, 1222-1233. [ CrossRef] ) ( 17. Khalid, A.; Kontis, K . Optical altitude sensor based on pressure sensitive paints (PSP). Int. J. Aerosp. Innov. 2009,1, 11-21. [ CrossRef ) ( 18. Gregory, J .W.; Asai, K.; Kameda, M.; Liu,T;Sullican, J.P.A review of pressure-sensitive paint for high-speedand u nsteady a e rodynamics. Proc. In s t. Mech. E n g. Part G J. A erosp. Eng. 2008,222,249-290. [Cr ossRef] ) ( 19. Quinn, M.K.;Yang, L.; Kontis, K. Pressure-sensitive paint: effect of substrate. Sensors 2011, 11, 1 1649-11663.[ CrossRef ][ PubMed] 1 ] ) ( 20. Lakowicz, J.R. P rinciples of Fluorescence Spectroscopy; Springer Science plus Business Media: New York, NY, USA, 2001; Volume 1. ) ( 21. Mohsen, J. Pressure Sensitive Paints: The Basic and Applications; Research Report 2011:07; Chalmers Universityof Technology: Goteborg, Sweden,2011. ) 22. Qin, N.; Wong, W.S.; Le Moigne, A. Three-dimensional Contour Bumps for Transonic Wing Drag Reduction.Proc. Inst. Mech. Eng. Part G J. Aerosp. Eng.2008,222,619-629. [CrossRef] ( 23. Lo,K.H.; Zare-Behtash, H.; Johnson, M.; Kontis, K. Control of Flow Separation on a Contour Bump by Jets: An Experimental Study. I n Proceedings of t h e 28th International Symposium on Shock Waves,Madison, WI, USA, 14-19 July 2013. ) 24. Lo, K.H.; Zare-Behtash, H.; Kontis, K. Flow Characteristics along an Active Jets Equipped Contour Bumpin a Supersonic Freestream and Its Potential to be Applied on Transonic Aircraft for Drag Reduction:An Experimental Study. In Proceedings of 53rd AIAA Aerospace Sciences Meeting, Kissimmee,FL,USA,5-9 January 2015. ( 25. Lo, K.H. E xperimental S tudies on C ontour Bumps an d Cv i ties at S u personic S p eed. P h .D. Thesis, University of Manchester, Manchester, UK, 14 April 2014. ) ( 26. Quinn, M. K.; Gongora-Orozco, N.; Kontis, K.; Ireland, P. Application of pressure-sensitive paint to low-speed.flow around a U-bend of strong curvatures. Exp. Therm. Fl u id Sci. 2013,48,58-66. [Cro ssRef] ) ( 28. Ukai, T .; Zare-Behtash, H.; Erdem, E.; Lo, K.H.; Ko n tis, K.; Ob a yashi, S. Eff e ctiveness of Jet Loc a tion onMixing Characteristics inside a Cavity in Supersonic Flow. E xp. Therm. Fluid Sci. 2014,52,59-67. [ C rossRef] ) ( 29. Zare-Behtash, H.; L o , K.H.; Ukai, T. ; Kontis, K.; Obayashi, S. E xperimental investigation of im p ingingshock-cavity interactions with upstream transverse jet injection. Trans.Jpn. Soc. Aeronaut. Space Sci. Aerosp. T echnol. Jpn.2014, 12,57-62. [ CrossRef] ) ( 30. Zare-Behtash, H.; Lo,K.H.; Erdem,E.; Kontis, K.; Lin,J.; U kai,T.; Obayashi,S. Incident Shock-Transverse JetInteractions at Mach 1.9: Effect of Shock Impingement Location. In Proceedings of the 29th InternationalSymposium on Shock Waves, Madison, WI, USA, 14-19 July 2013. ) ( 31. . Zare-Behtash, H . ; L o , K . H.; Ukai, T.; K o ntis, K.; O b ayashi, S. Experimental Investigation of ImpingingShock: Cavity Interactions with Upstream Transverse Jet Injection. In Proceedings of the 29th International Symposium on Space Technology and Science, Nagoya, Japan, 2-9 June 2013. ) ( 32. Lin,J.; Zare-Behtash, H.; Lo, K .H.; Erdem, E.; Kontis, K. Incident Shock-Transverse Jet Interactions at Mach1.9: Effect of Different Jet Gases . In Proceedings of the 29th International Symposium on Sho c k Waves,Madison, WI, USA, 14-19 July 2013. ) ( 33. Ukai, T.;Obayashi, S.;Zare-Behtash, H.; Kon t is, K. Exp e rimental study of dual injections with a cavi t y in supersonic flow. In Proceedings of the 29th International Symposium on Shock Waves,Madison, WI, USA, 14-19 July 2013. ) ( 34. Quinn, M.K.; Gongora-Orozco, N.; Ko n tis, K.; Ireland, P .Application of pressure-sensitive paint to low-speed flow around a U-bend o f strong curvatures . I n P roceedings of the 8th Pacific Symposium of FlowVisualisation and Image, Moscow, Russia, 21-25 August 2011. ) ( 35. ) . Gongora-Orozco, N.;Zare-Behtash, H.; Kontis, K. Effects of filters on the performance a nd characteristics of pressure-sensitive paints. Meas. Sci. Technol. 2009,20, 1-6 . [ CrossRef ) ( 36. ISSI Paints. Available online: http://www.psp-tsp.com/index.php?id=115 (accessed on 3 June 2015) ) ( 37. Egami, Y.; A sai, K . E ffects of antioxidants on p hotodegradation of porous pr e ssure-sensitive paint.In Proceedings of the 22nd AIAA Aerodynamic Measurement Technology and Ground Testing Conference, Saint Louis, MO,USA, 24-26 June 2002. ) ( 38. Zare-Behtash, H.; Lo,K.H.; Yang, L.; Kontis, K. Pressure sensitive paint measurements at high Mach numbers.Flow Meas. Instrum. 2016. in press. ) ( 40. Basu, B.; Kamble, J. Studies on the oxygen sensitivity and microstructure of sol-gel base d organ i c-inorganic hybrid coatings doped with platinum porphyrin dye. J. Sol-Gel Sci. Technol. 2009,52,24-30. [Cross Ref] ) 41. Amao, Y. Probes and polymers for optical sensing of oxygen. Microchim. Acta 2003, 143, 1-12. [CrossRef] ( O 2016 by the authors; licensee MDPI, B a sel, Switzerland. This article is an open access CC article distribute d under the terms and conditions of the Creative Commons Attribution (CC-BY) license (http://creativecommons.org/licenses/by/4.0/). )
确定
还剩15页未读,是否继续阅读?

产品配置单


北京欧兰科技发展有限公司为您提供《采用铂和钌作为发光体高分子聚合物基底压敏漆中静态和风载工况下的性能检测方案(粒子图像测速)》,该方案主要用于其他中静态和风载工况下的性能检测,参考标准--,《采用铂和钌作为发光体高分子聚合物基底压敏漆中静态和风载工况下的性能检测方案(粒子图像测速)》用到的仪器有德国LaVision PIV/PLIF粒子成像测速场仪、Imager sCMOS PIV相机、LaVision StrainMaster材料应变形变成像测量系统
推荐专场


CCD相机/影像CCD
更多


相关方案
更多
该厂商其他方案
更多