


方案详情

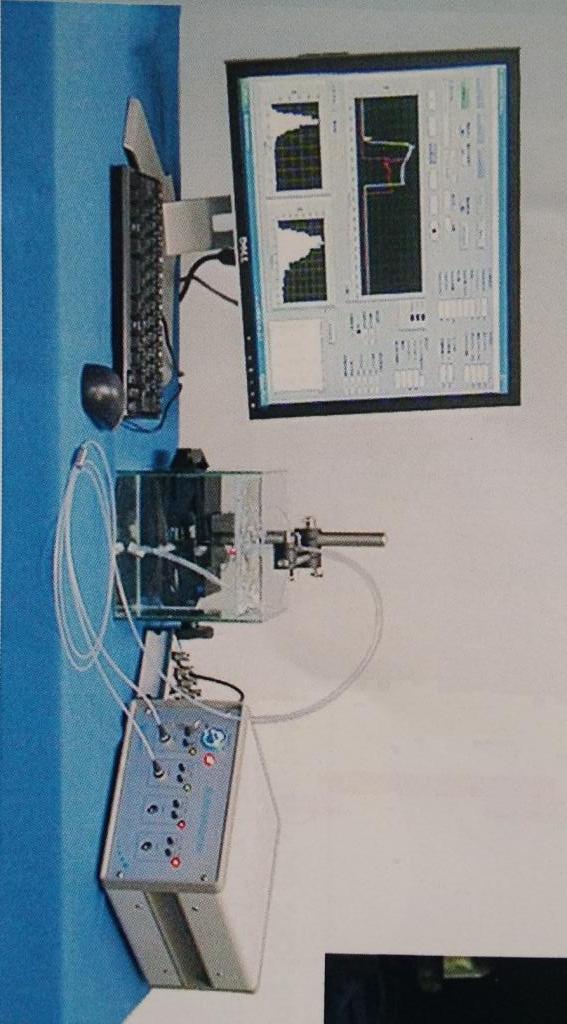
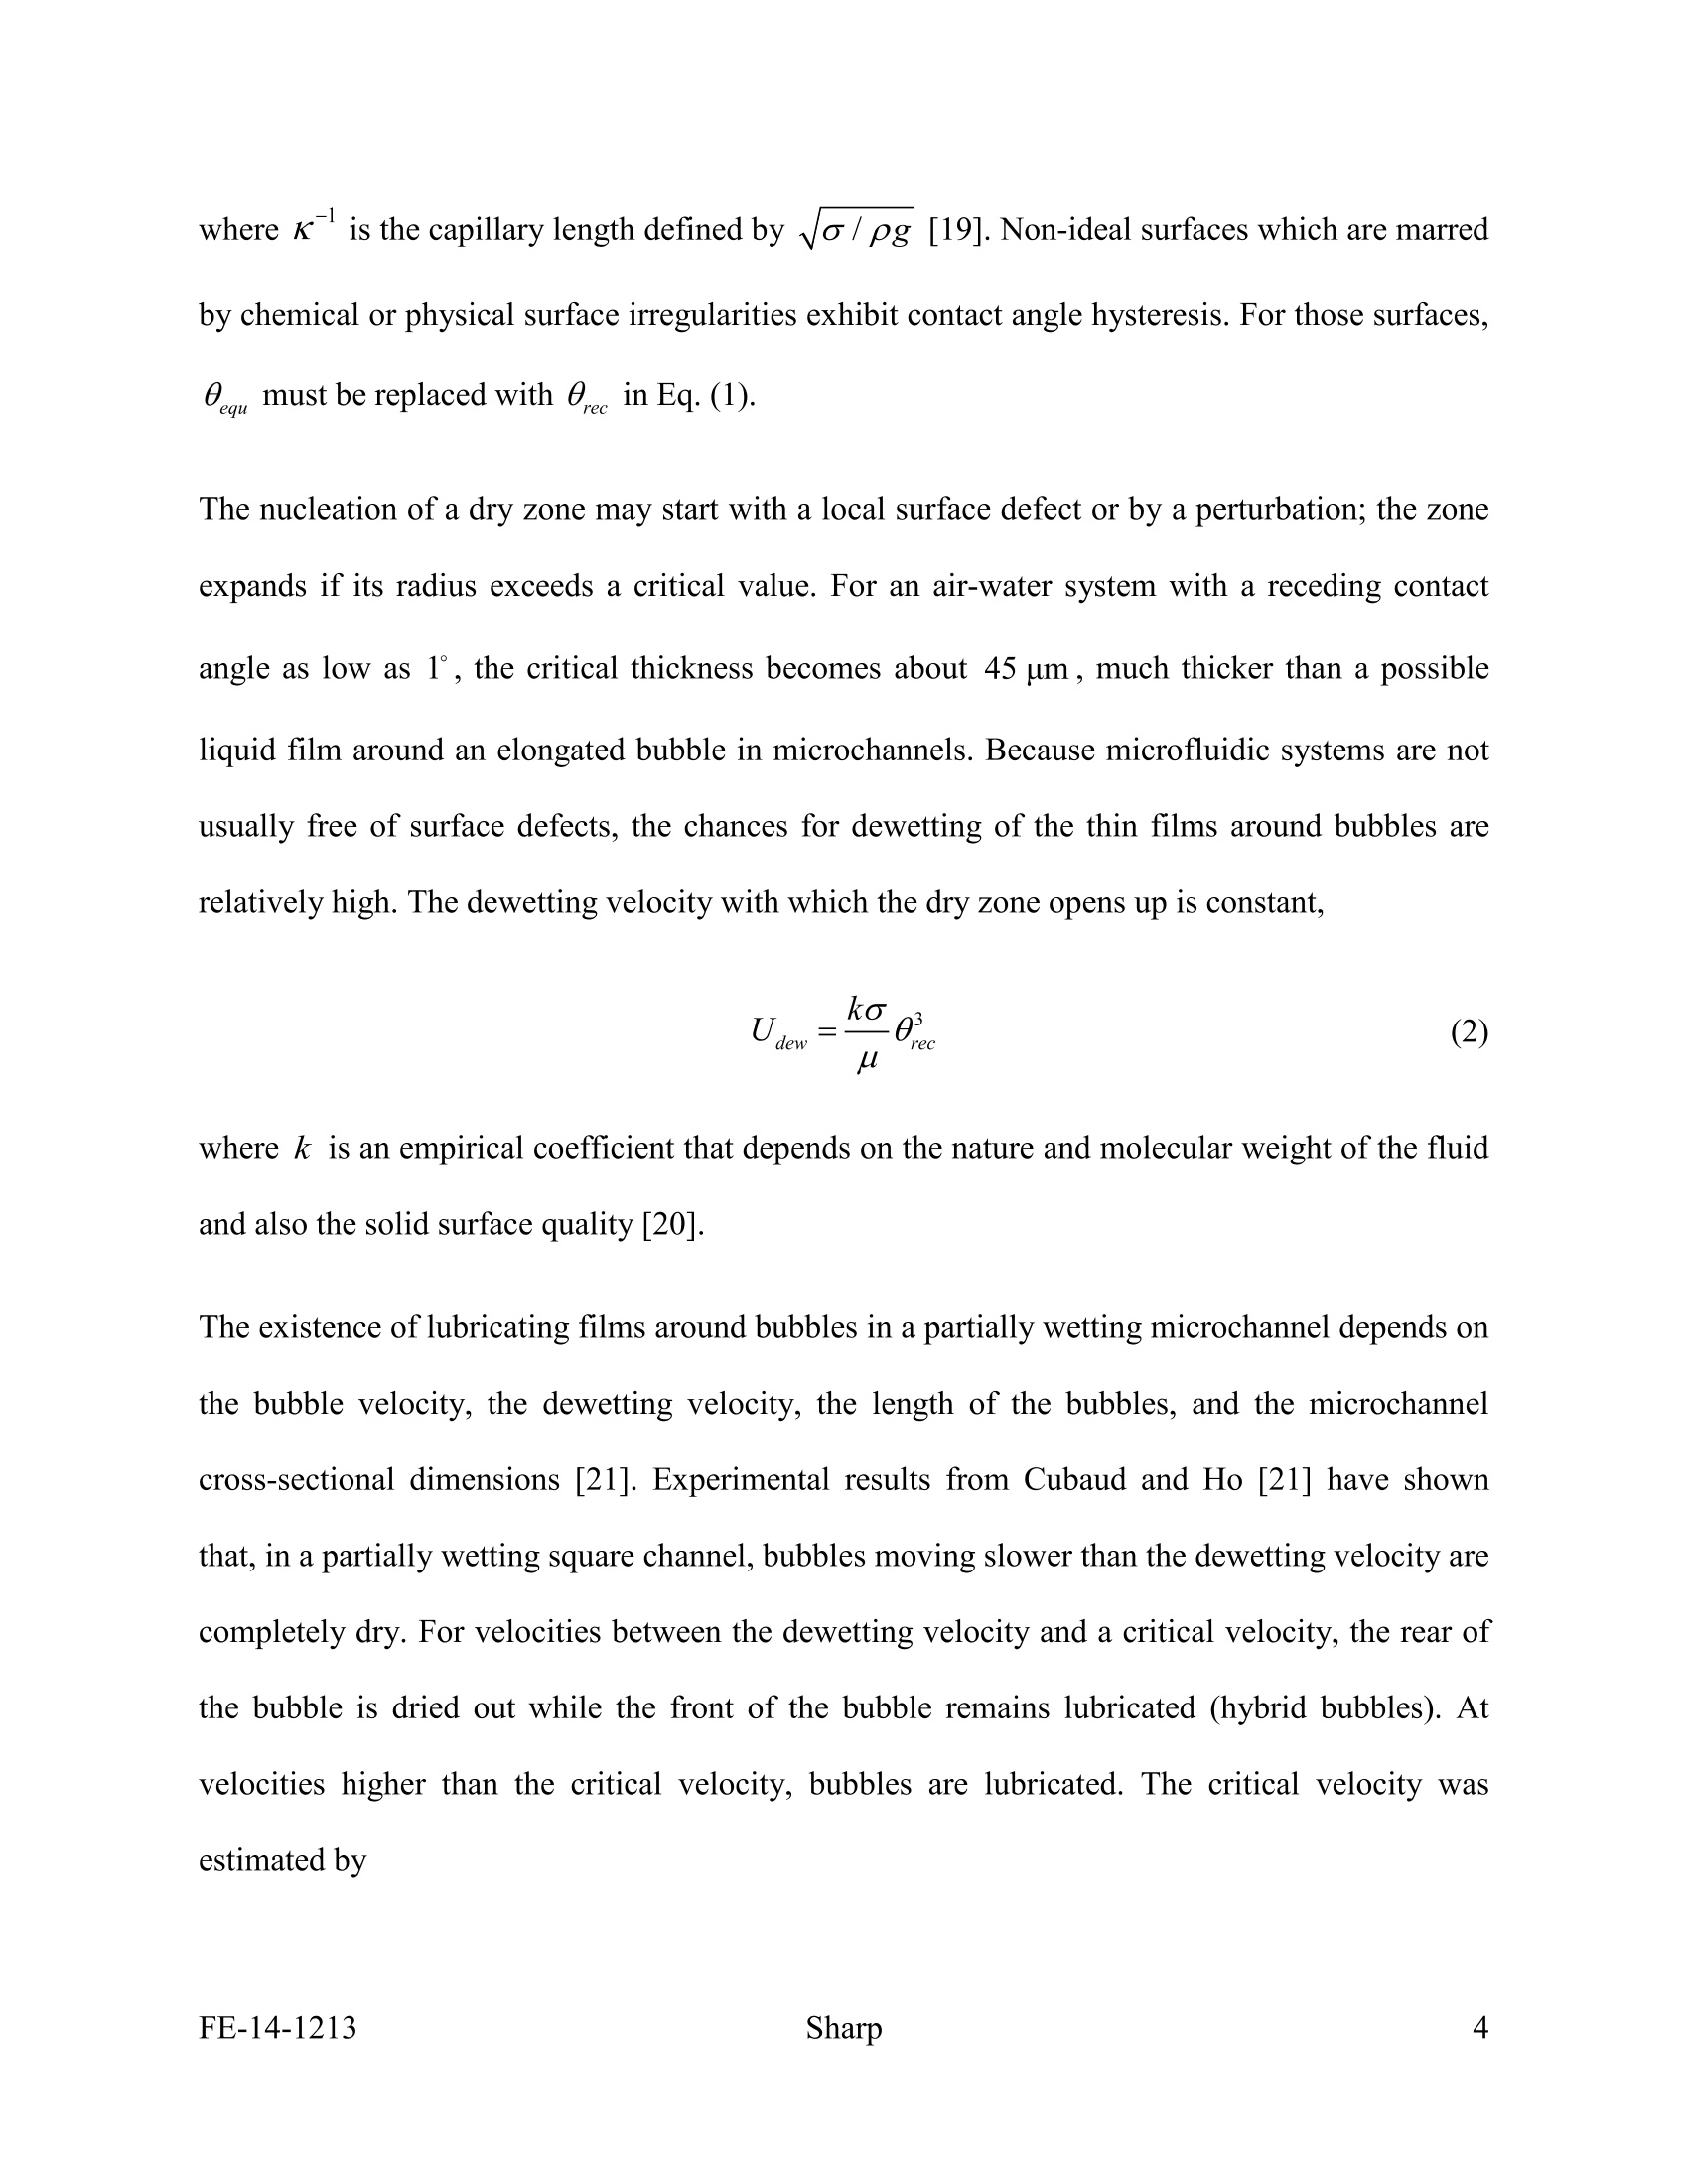
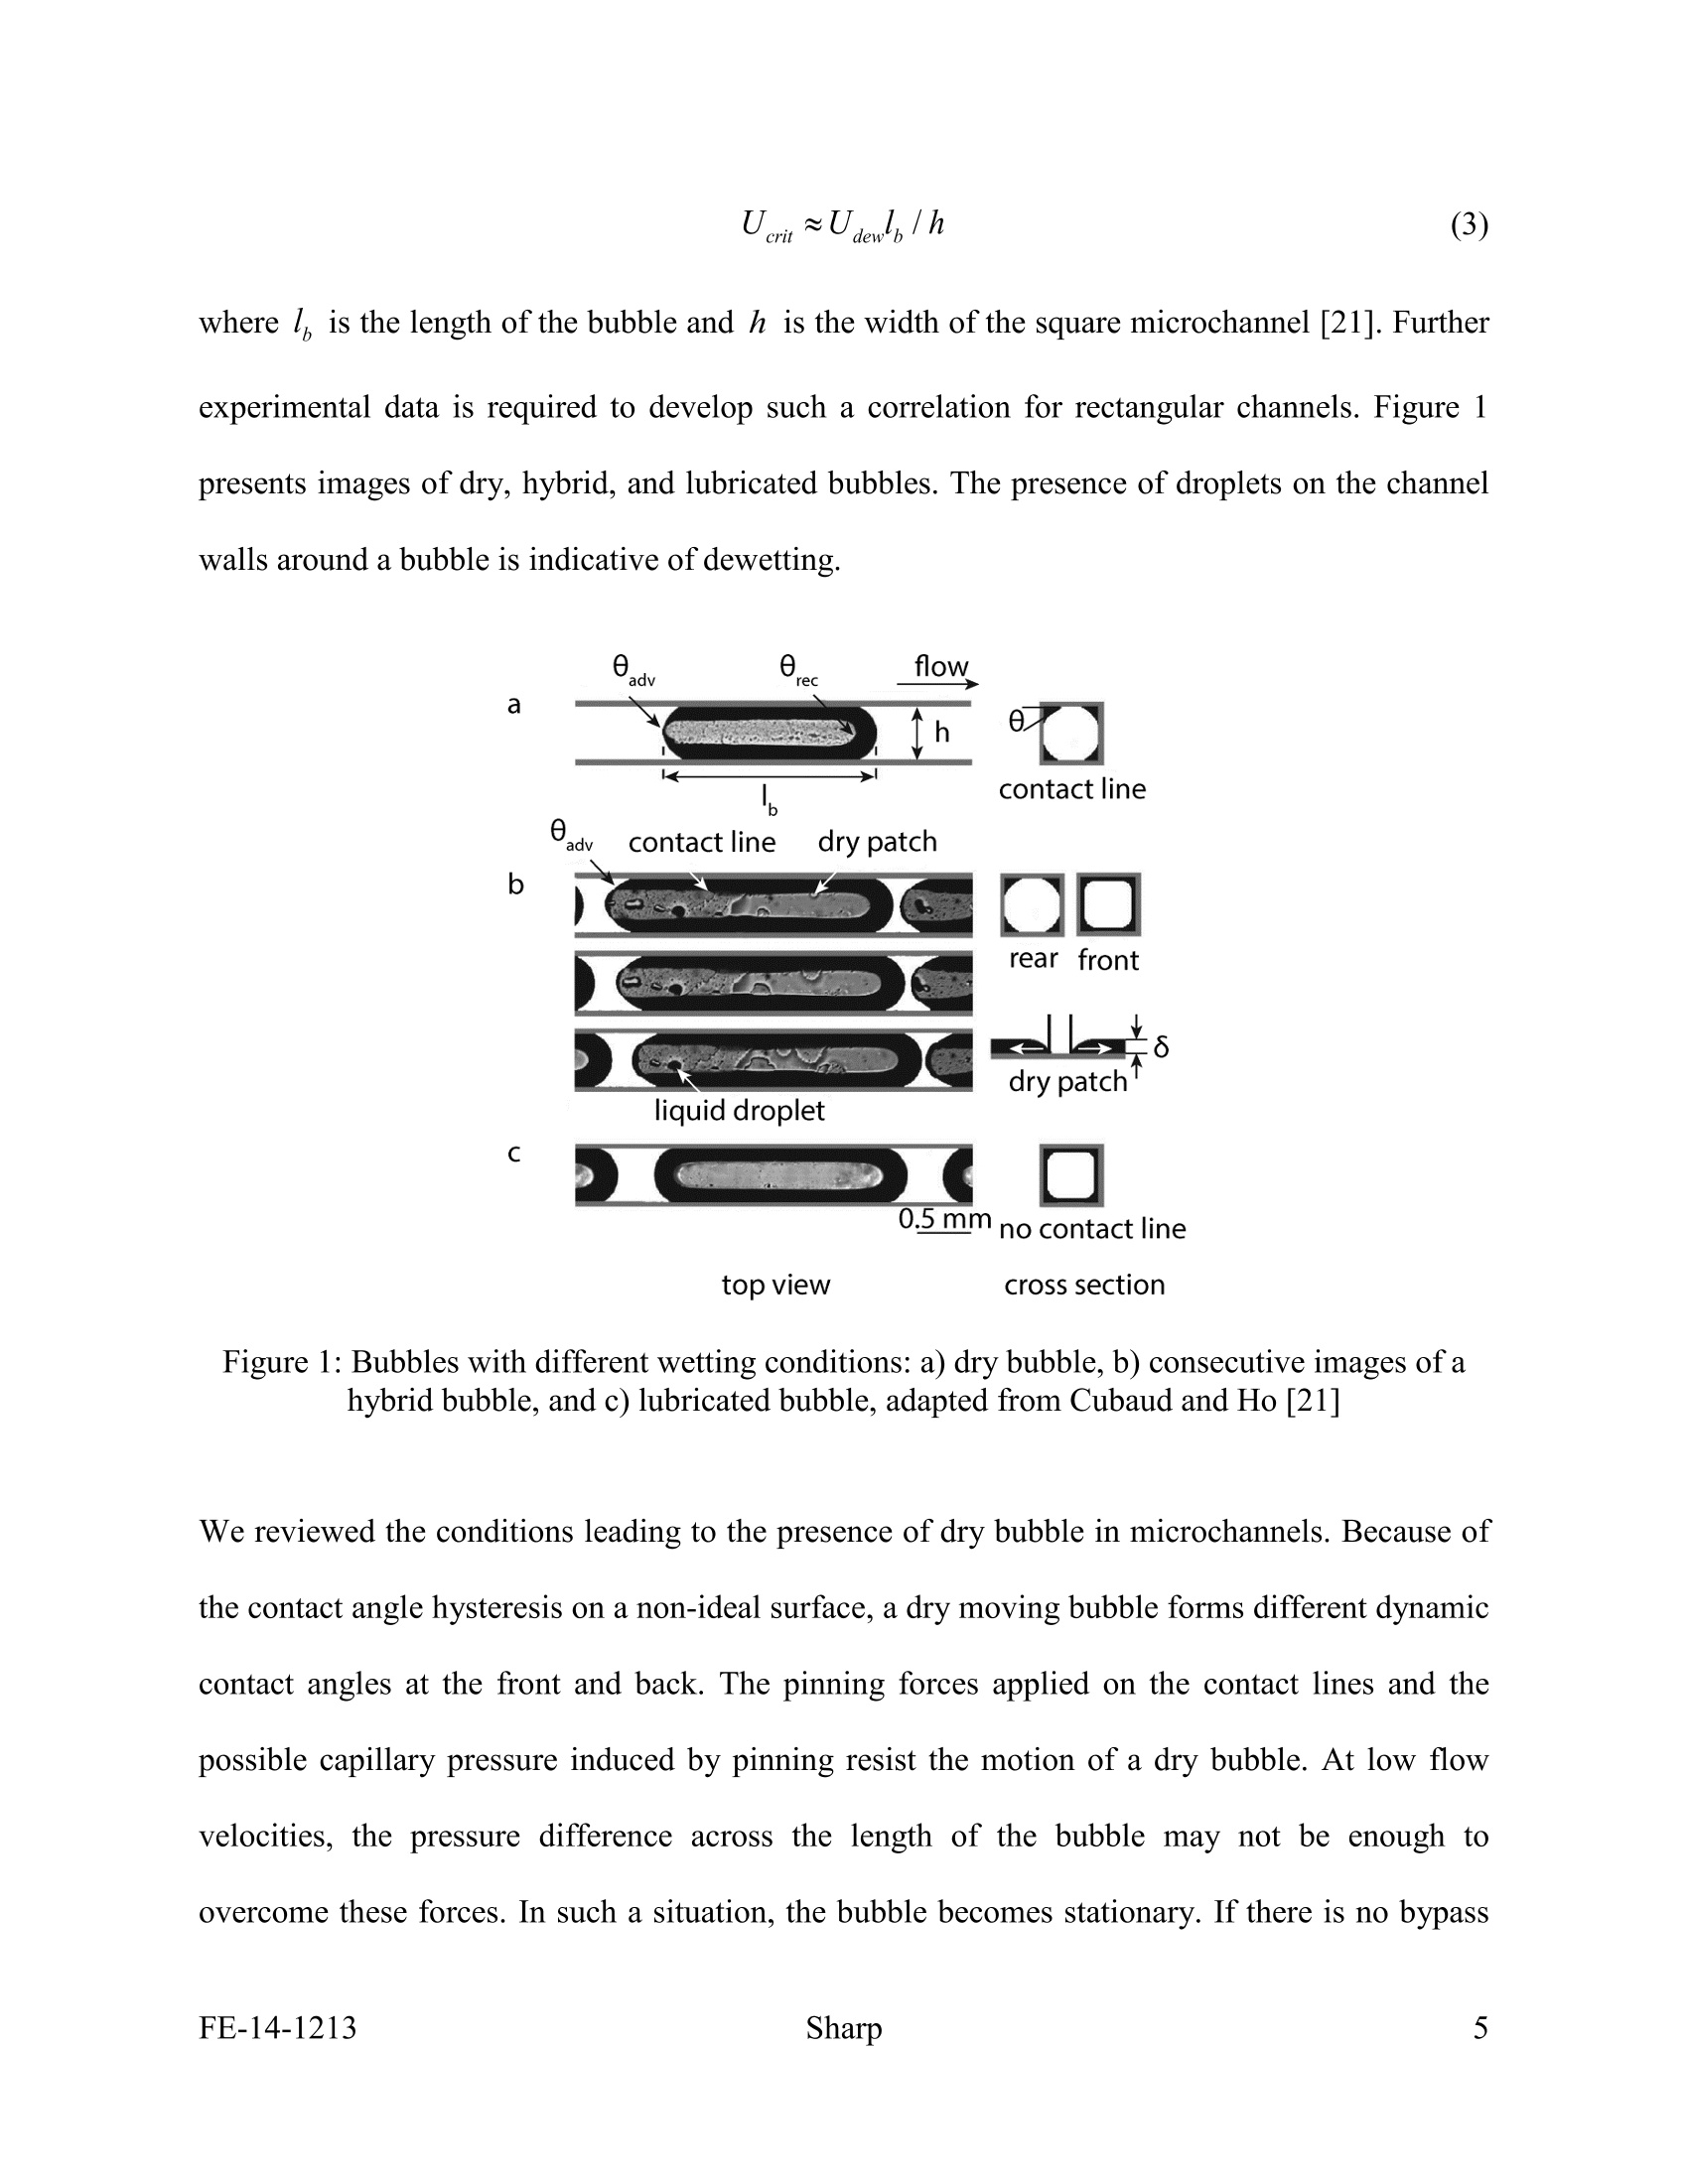
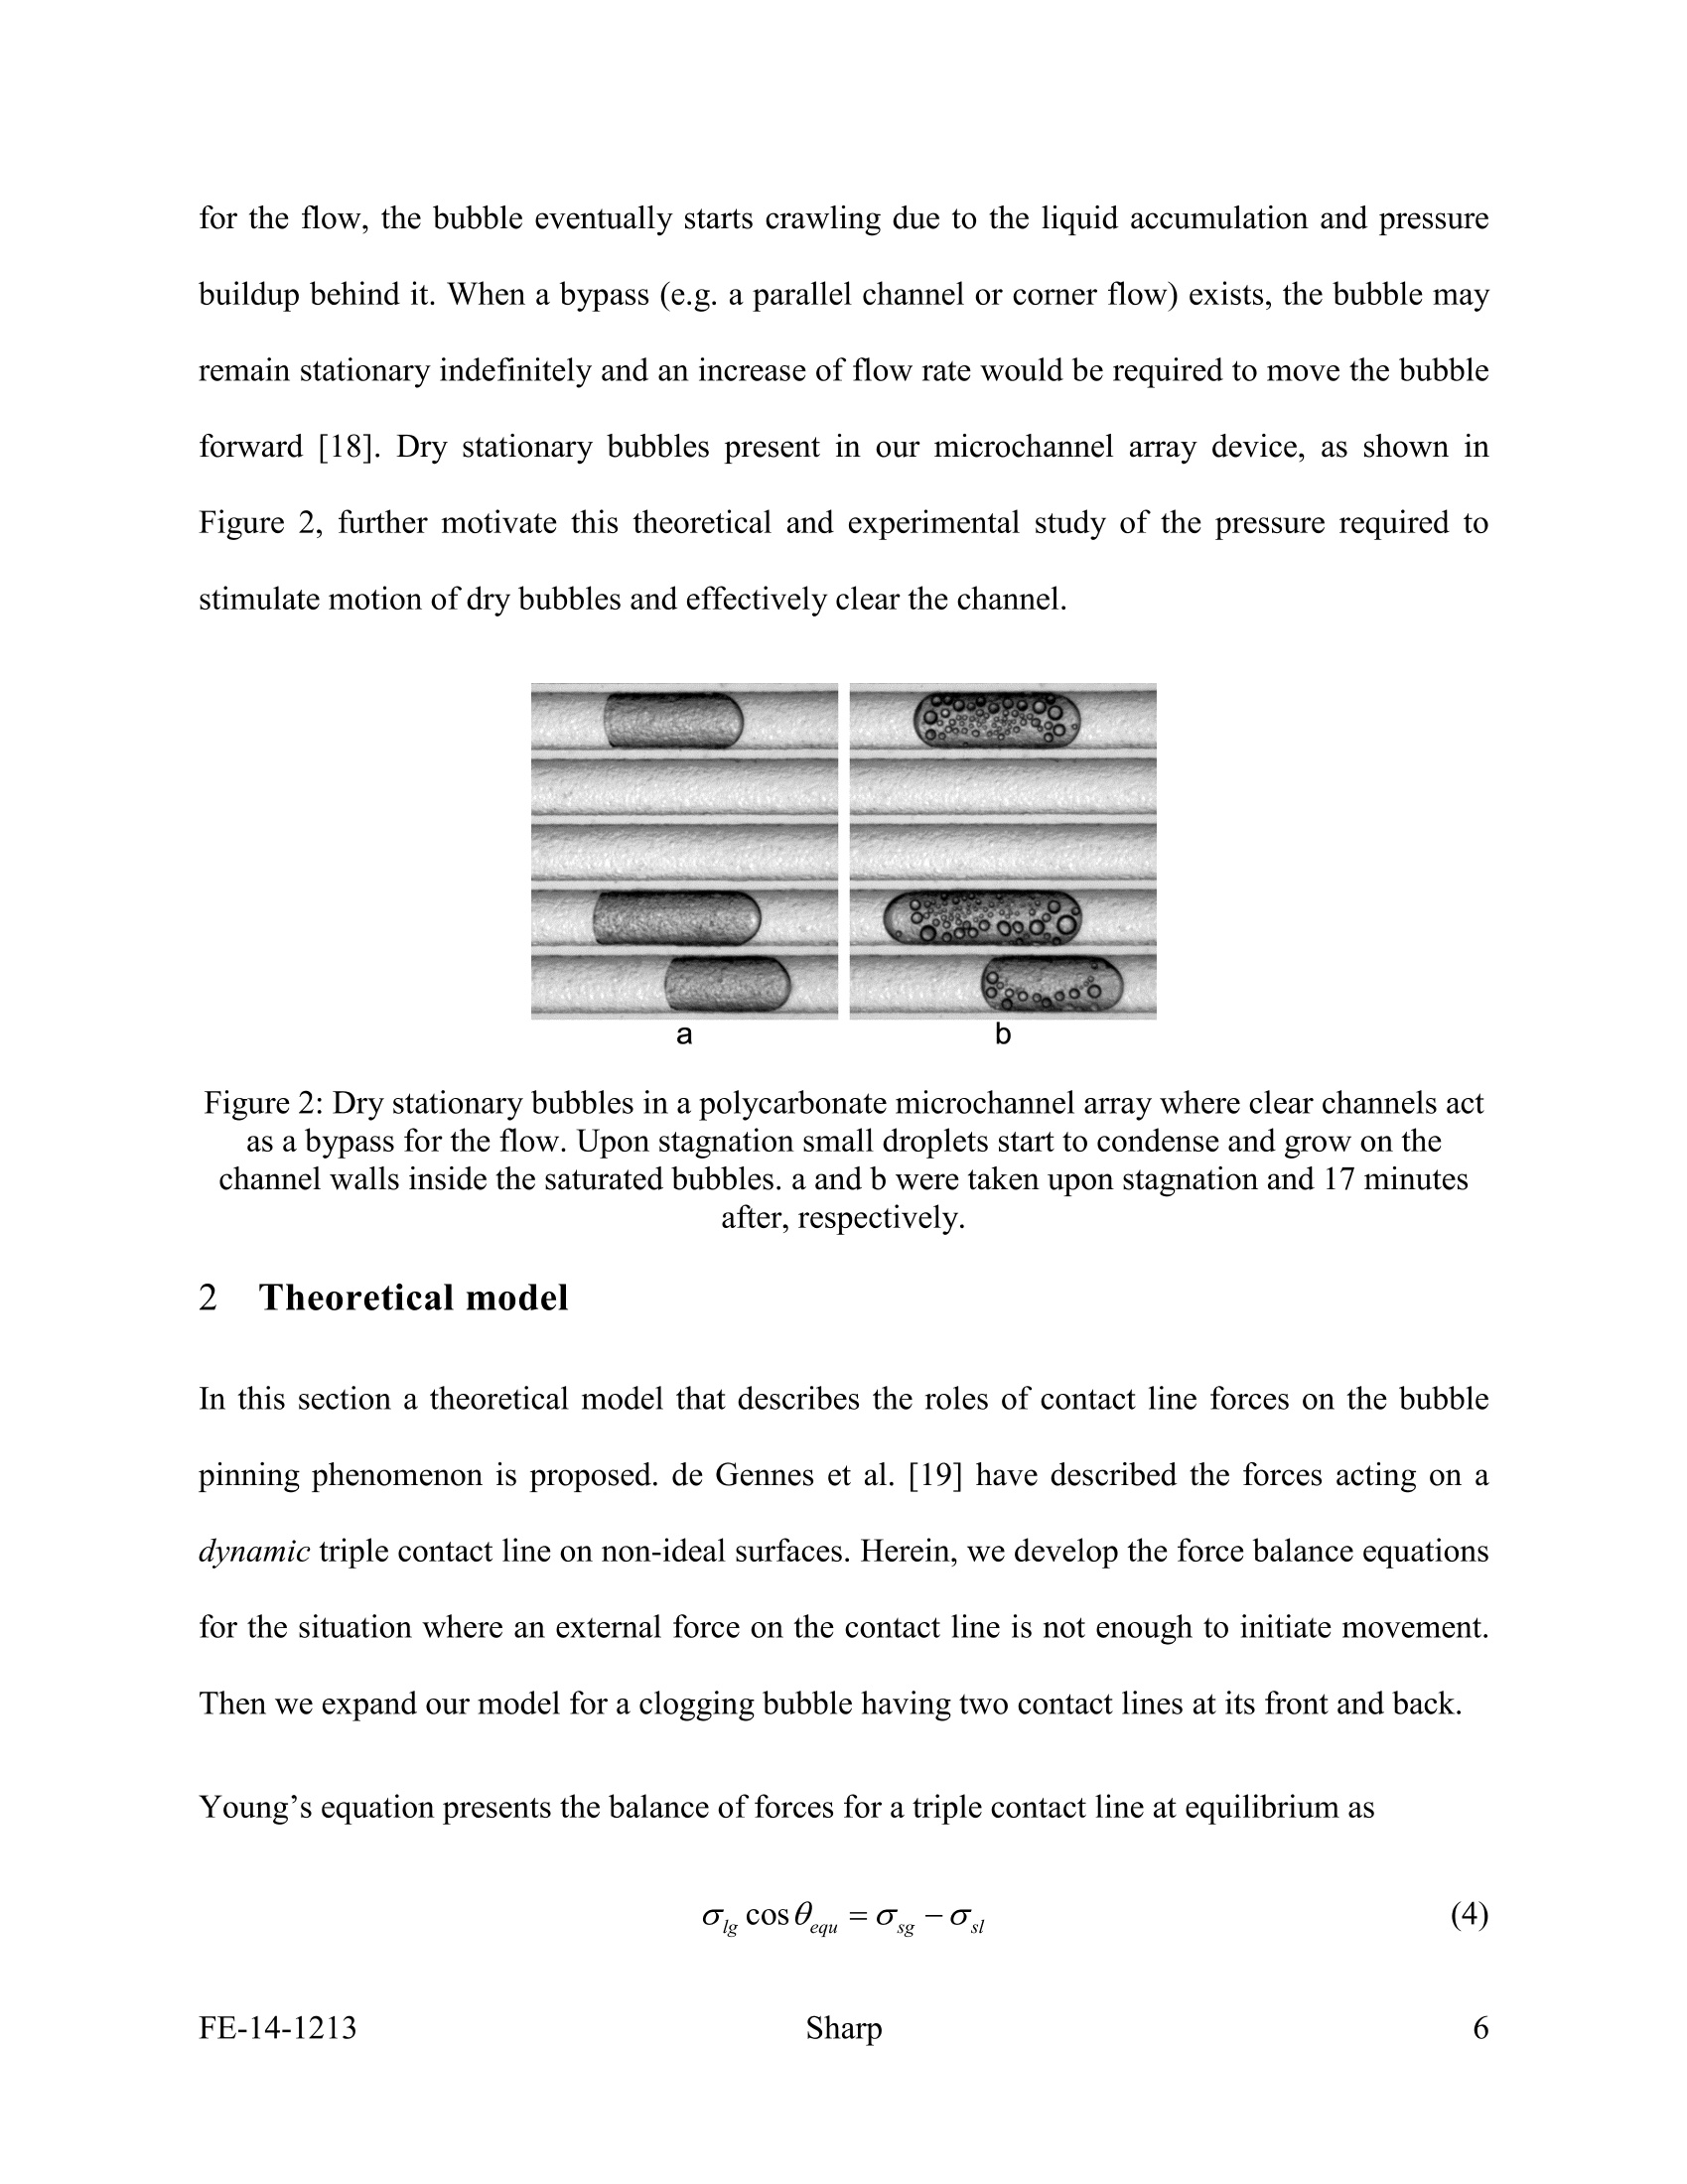
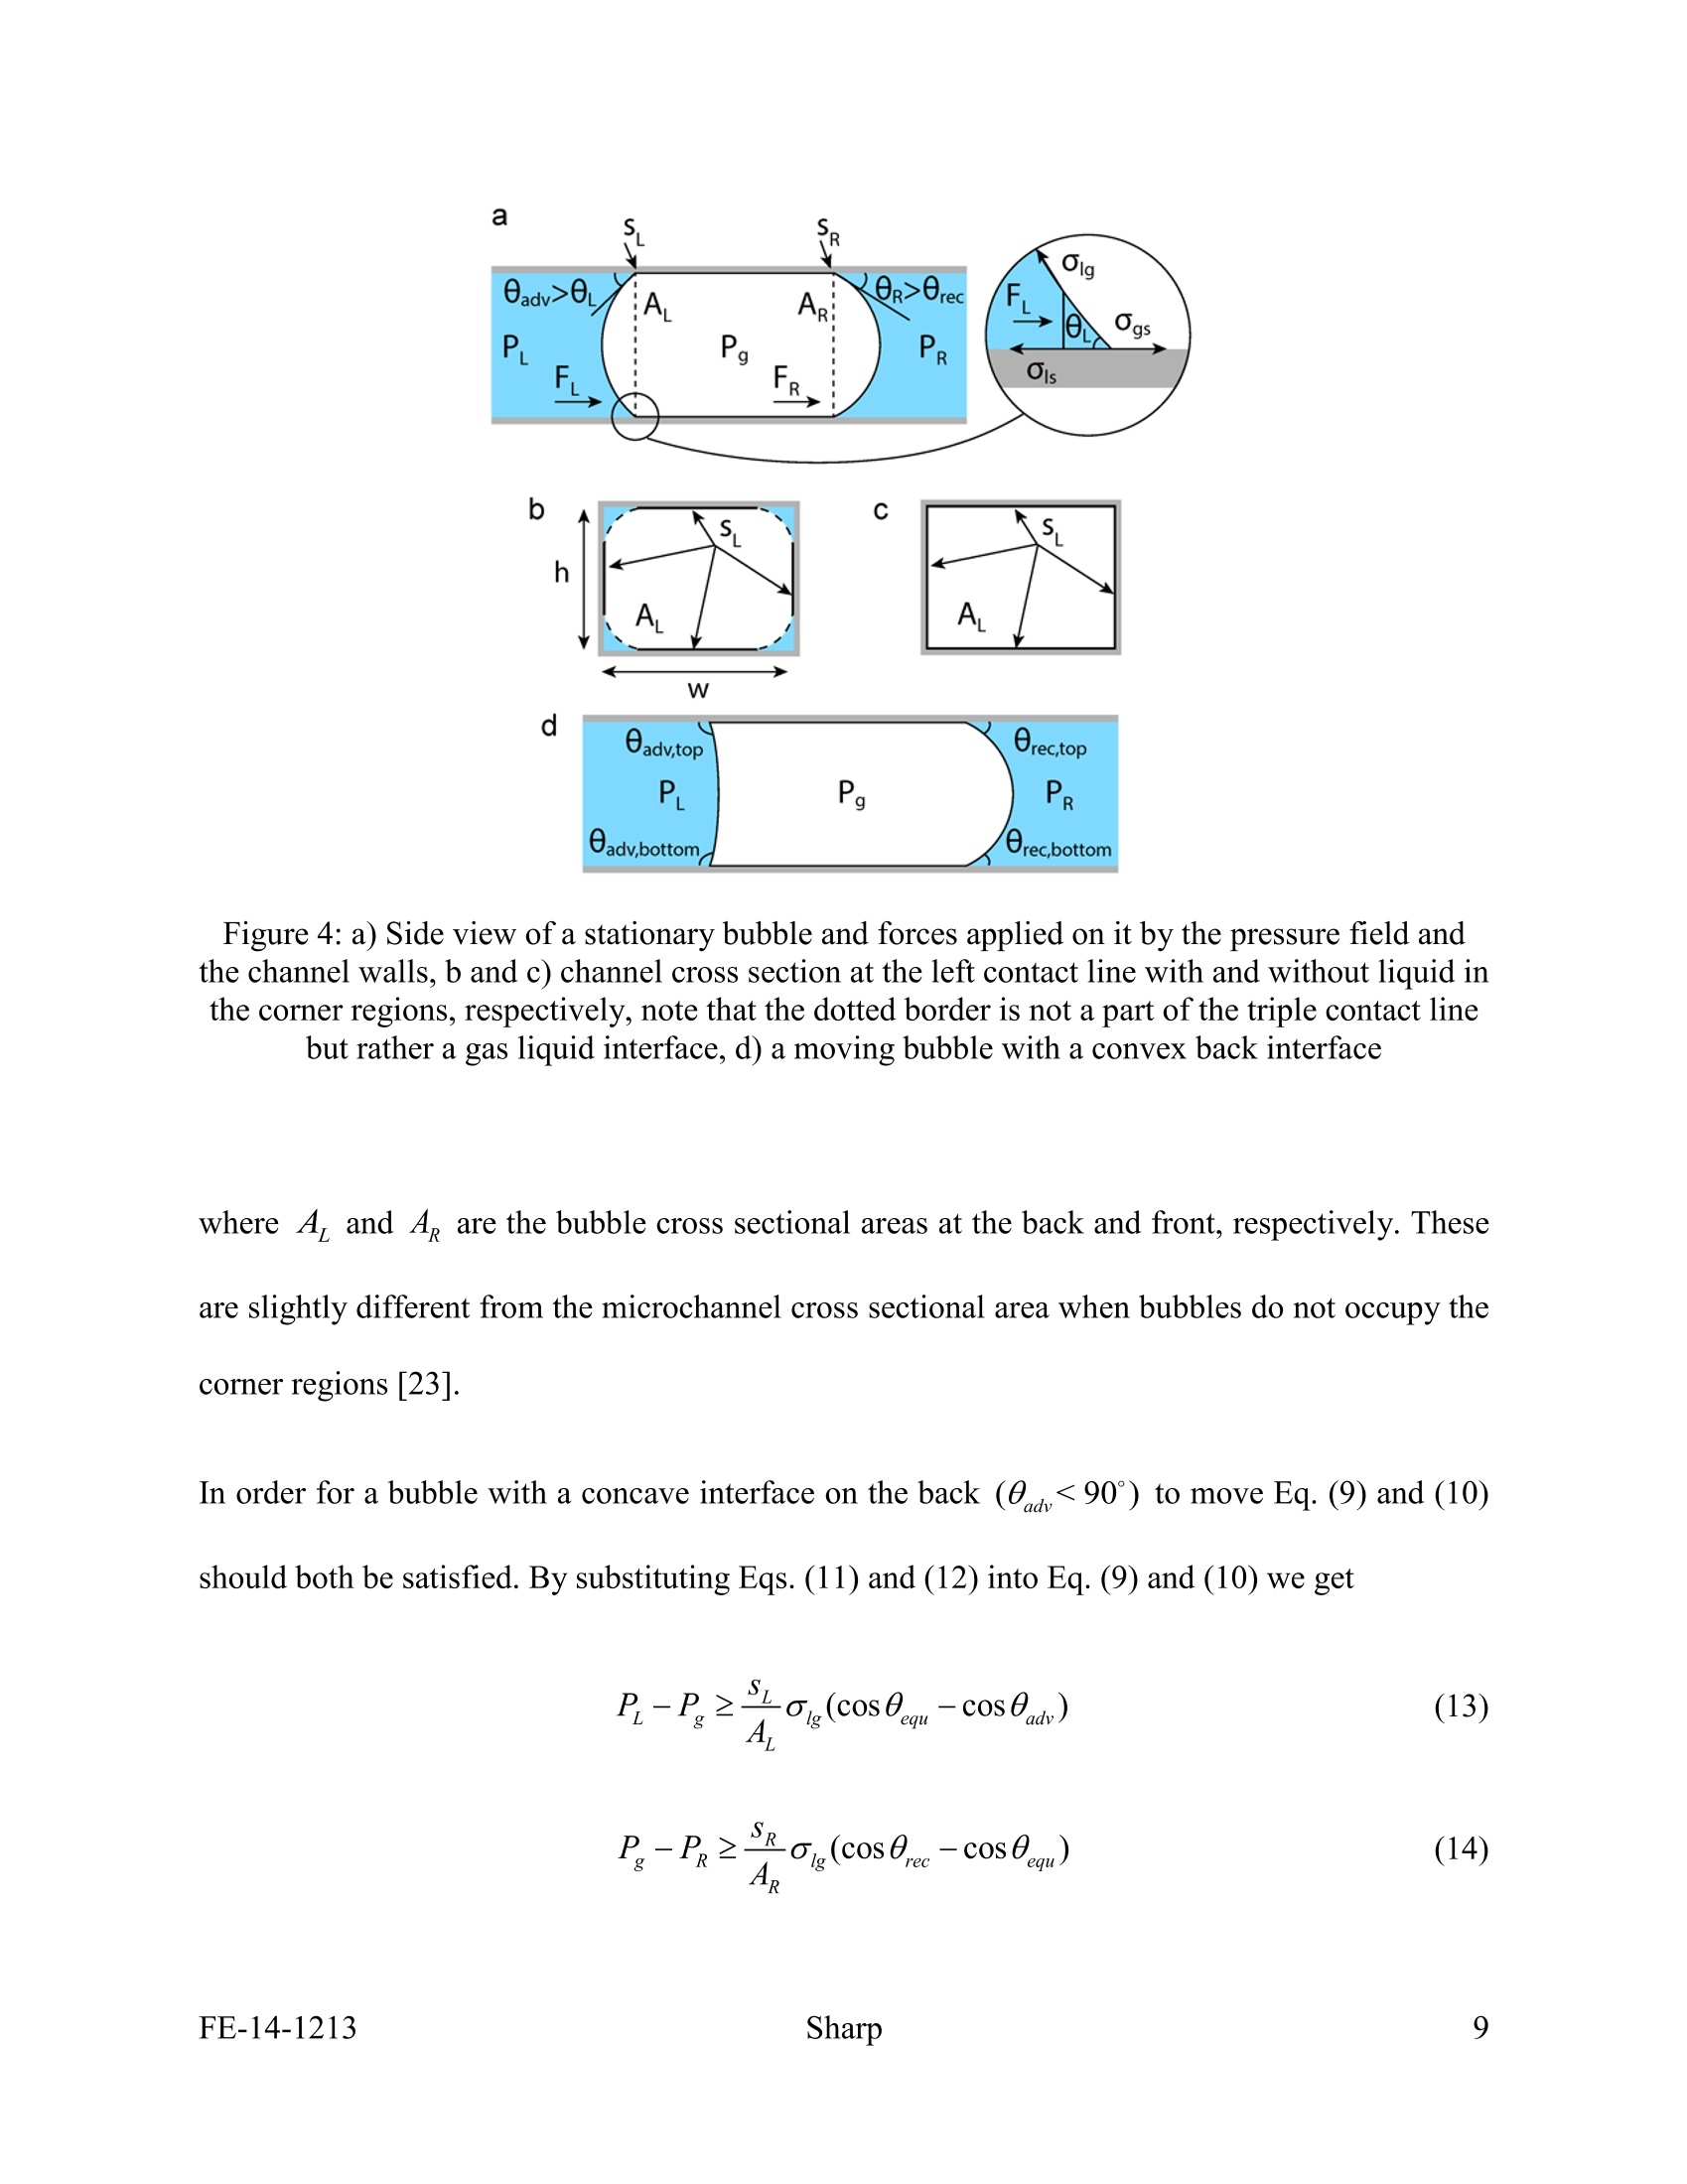
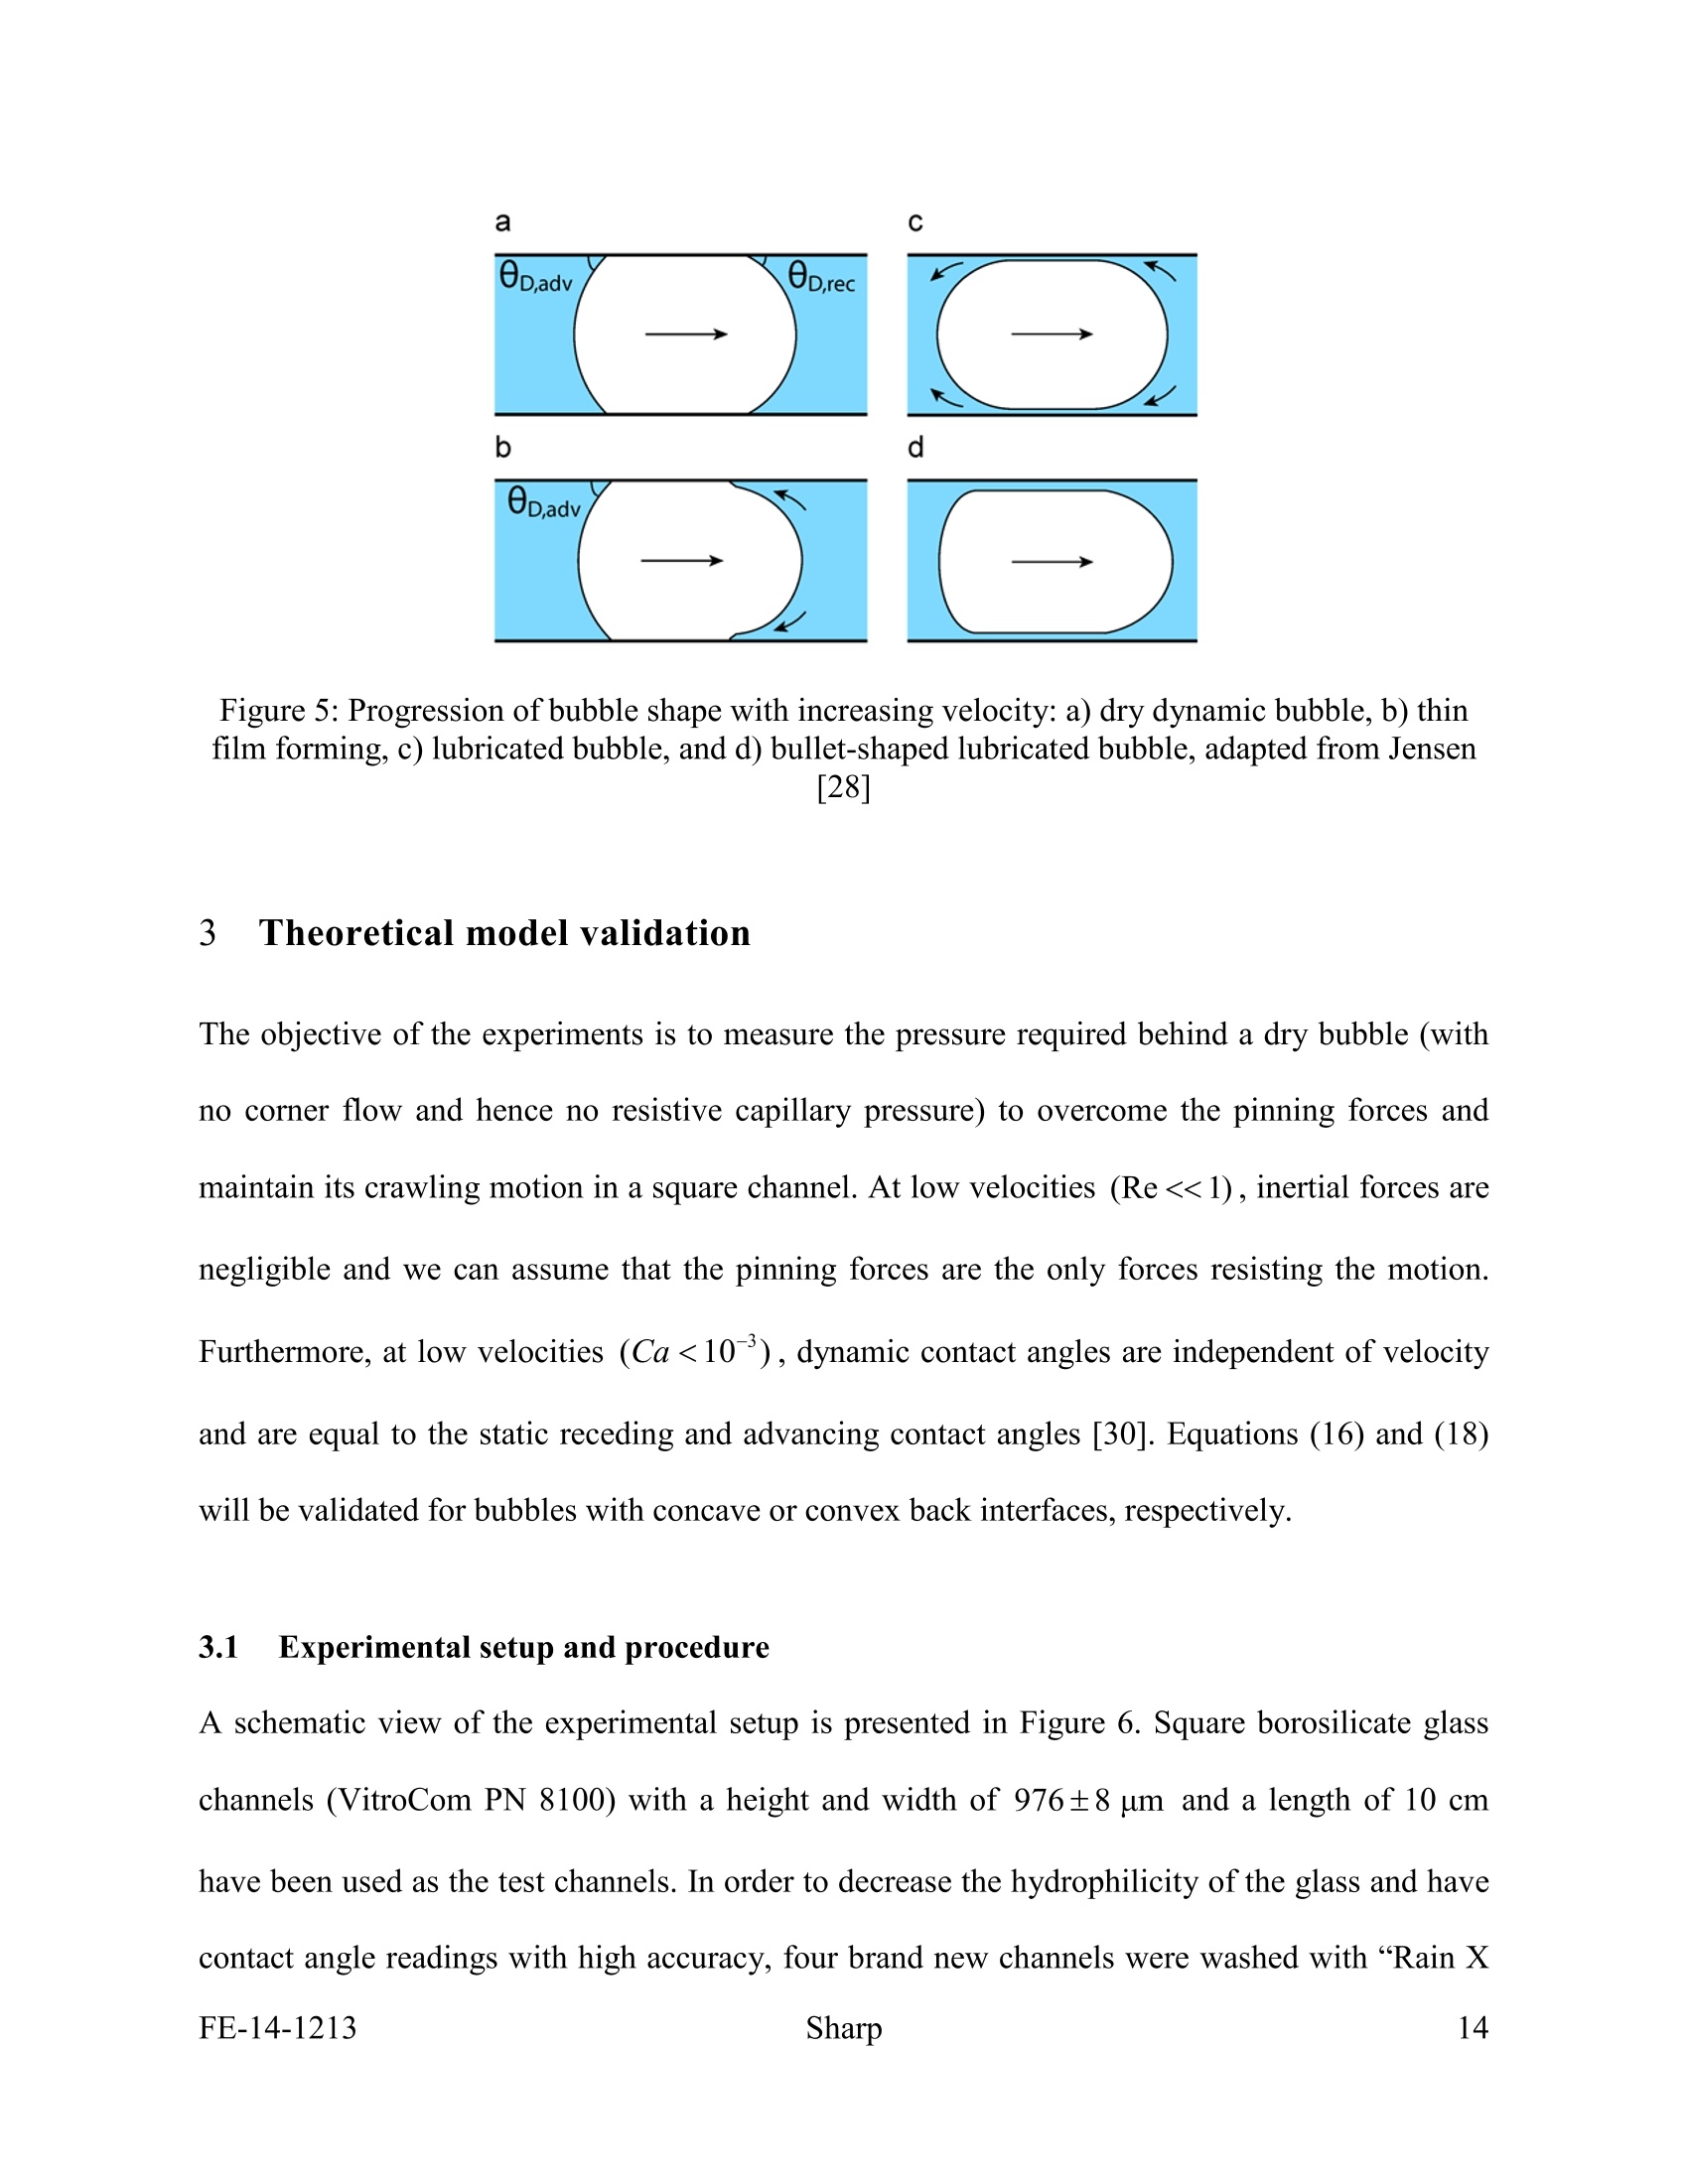
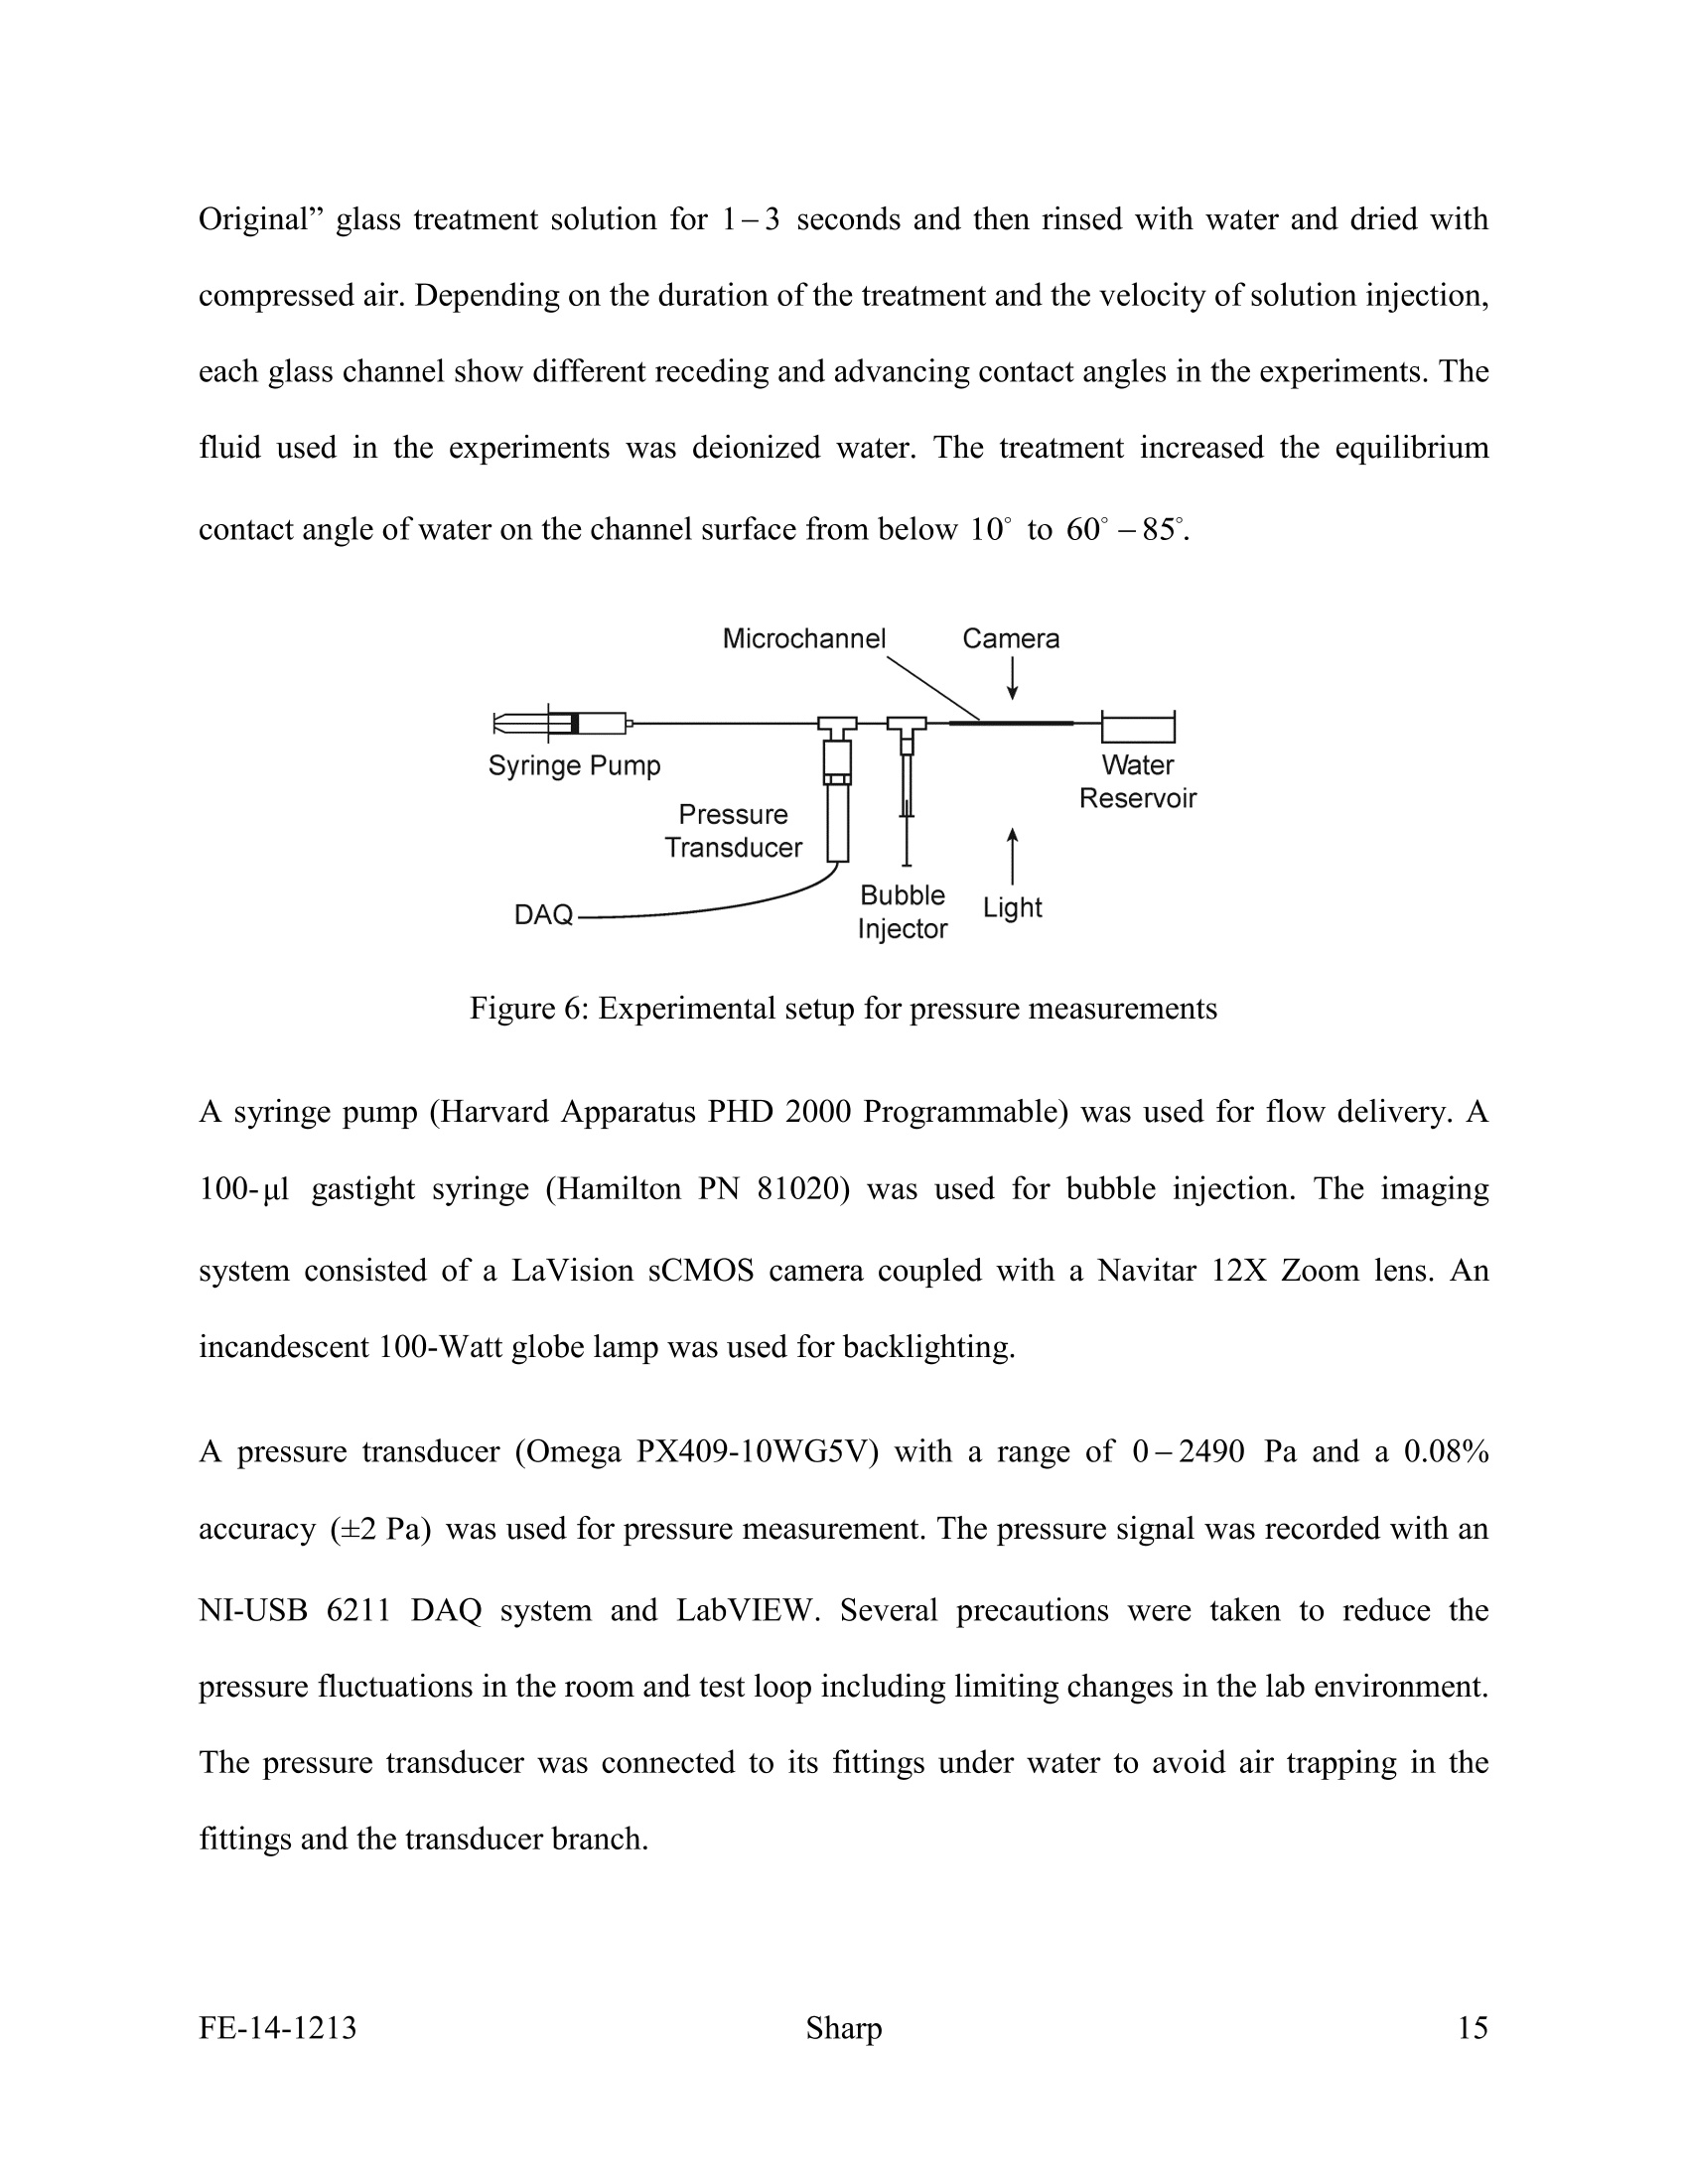
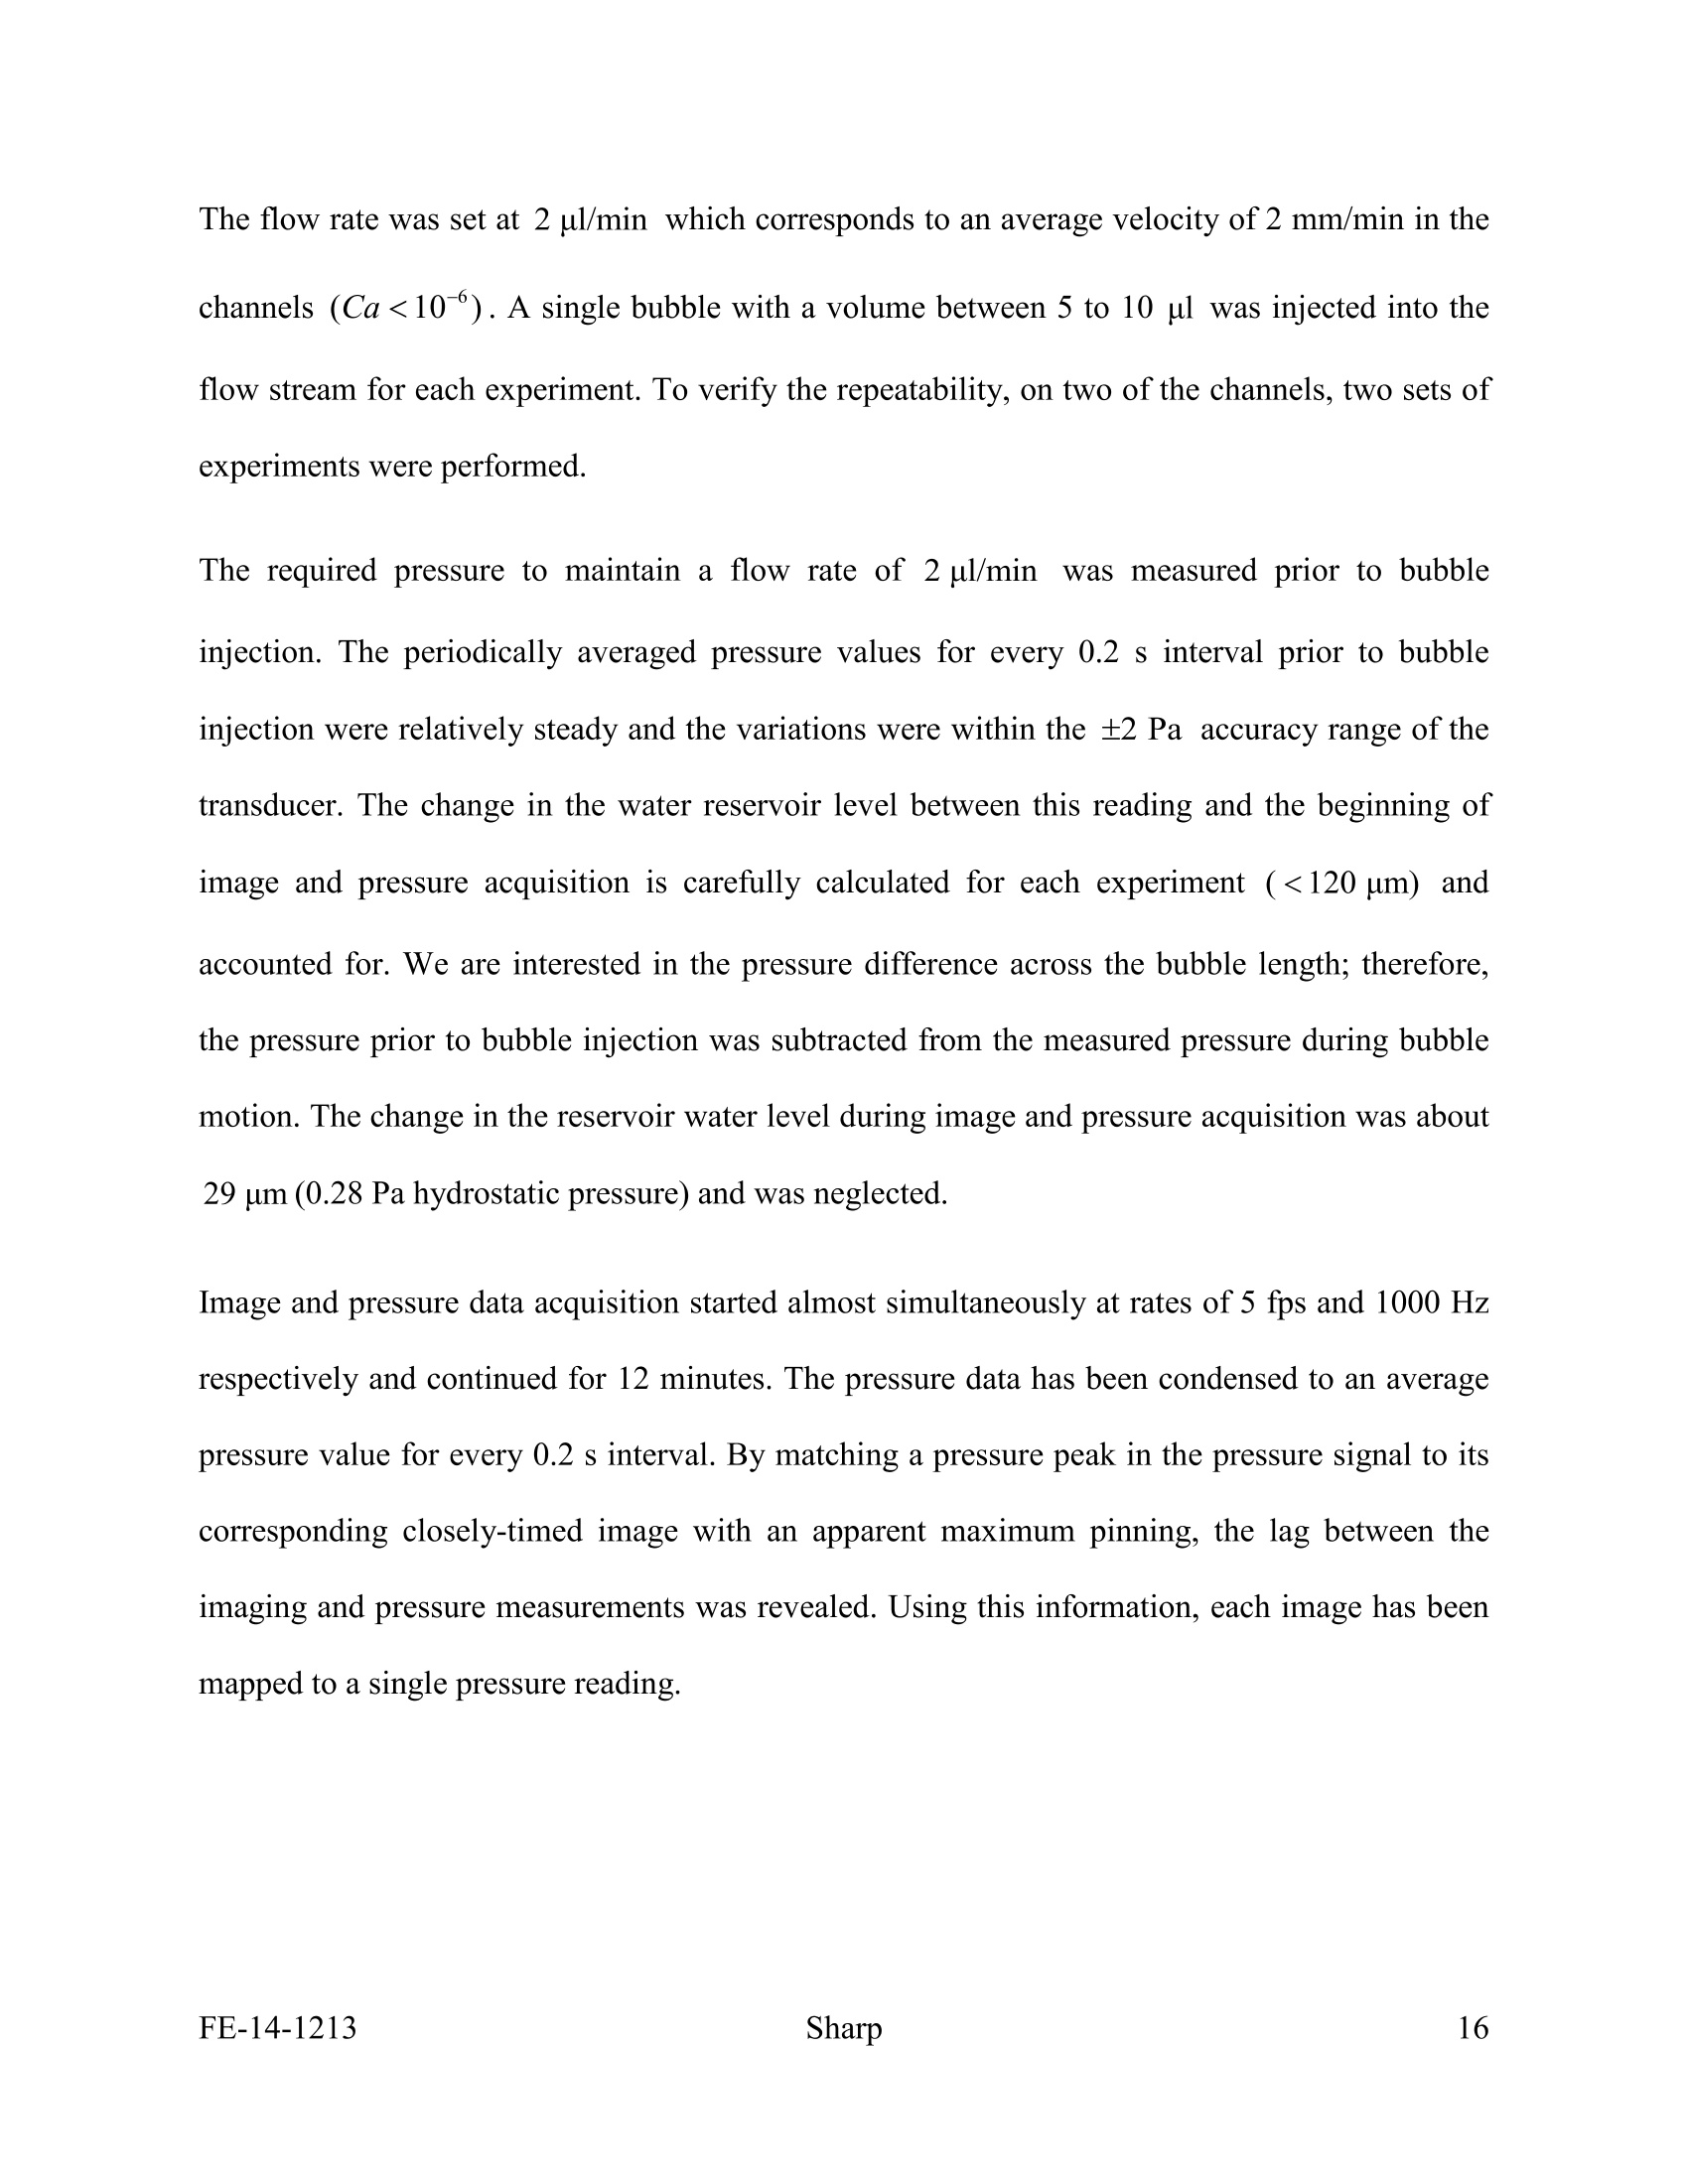
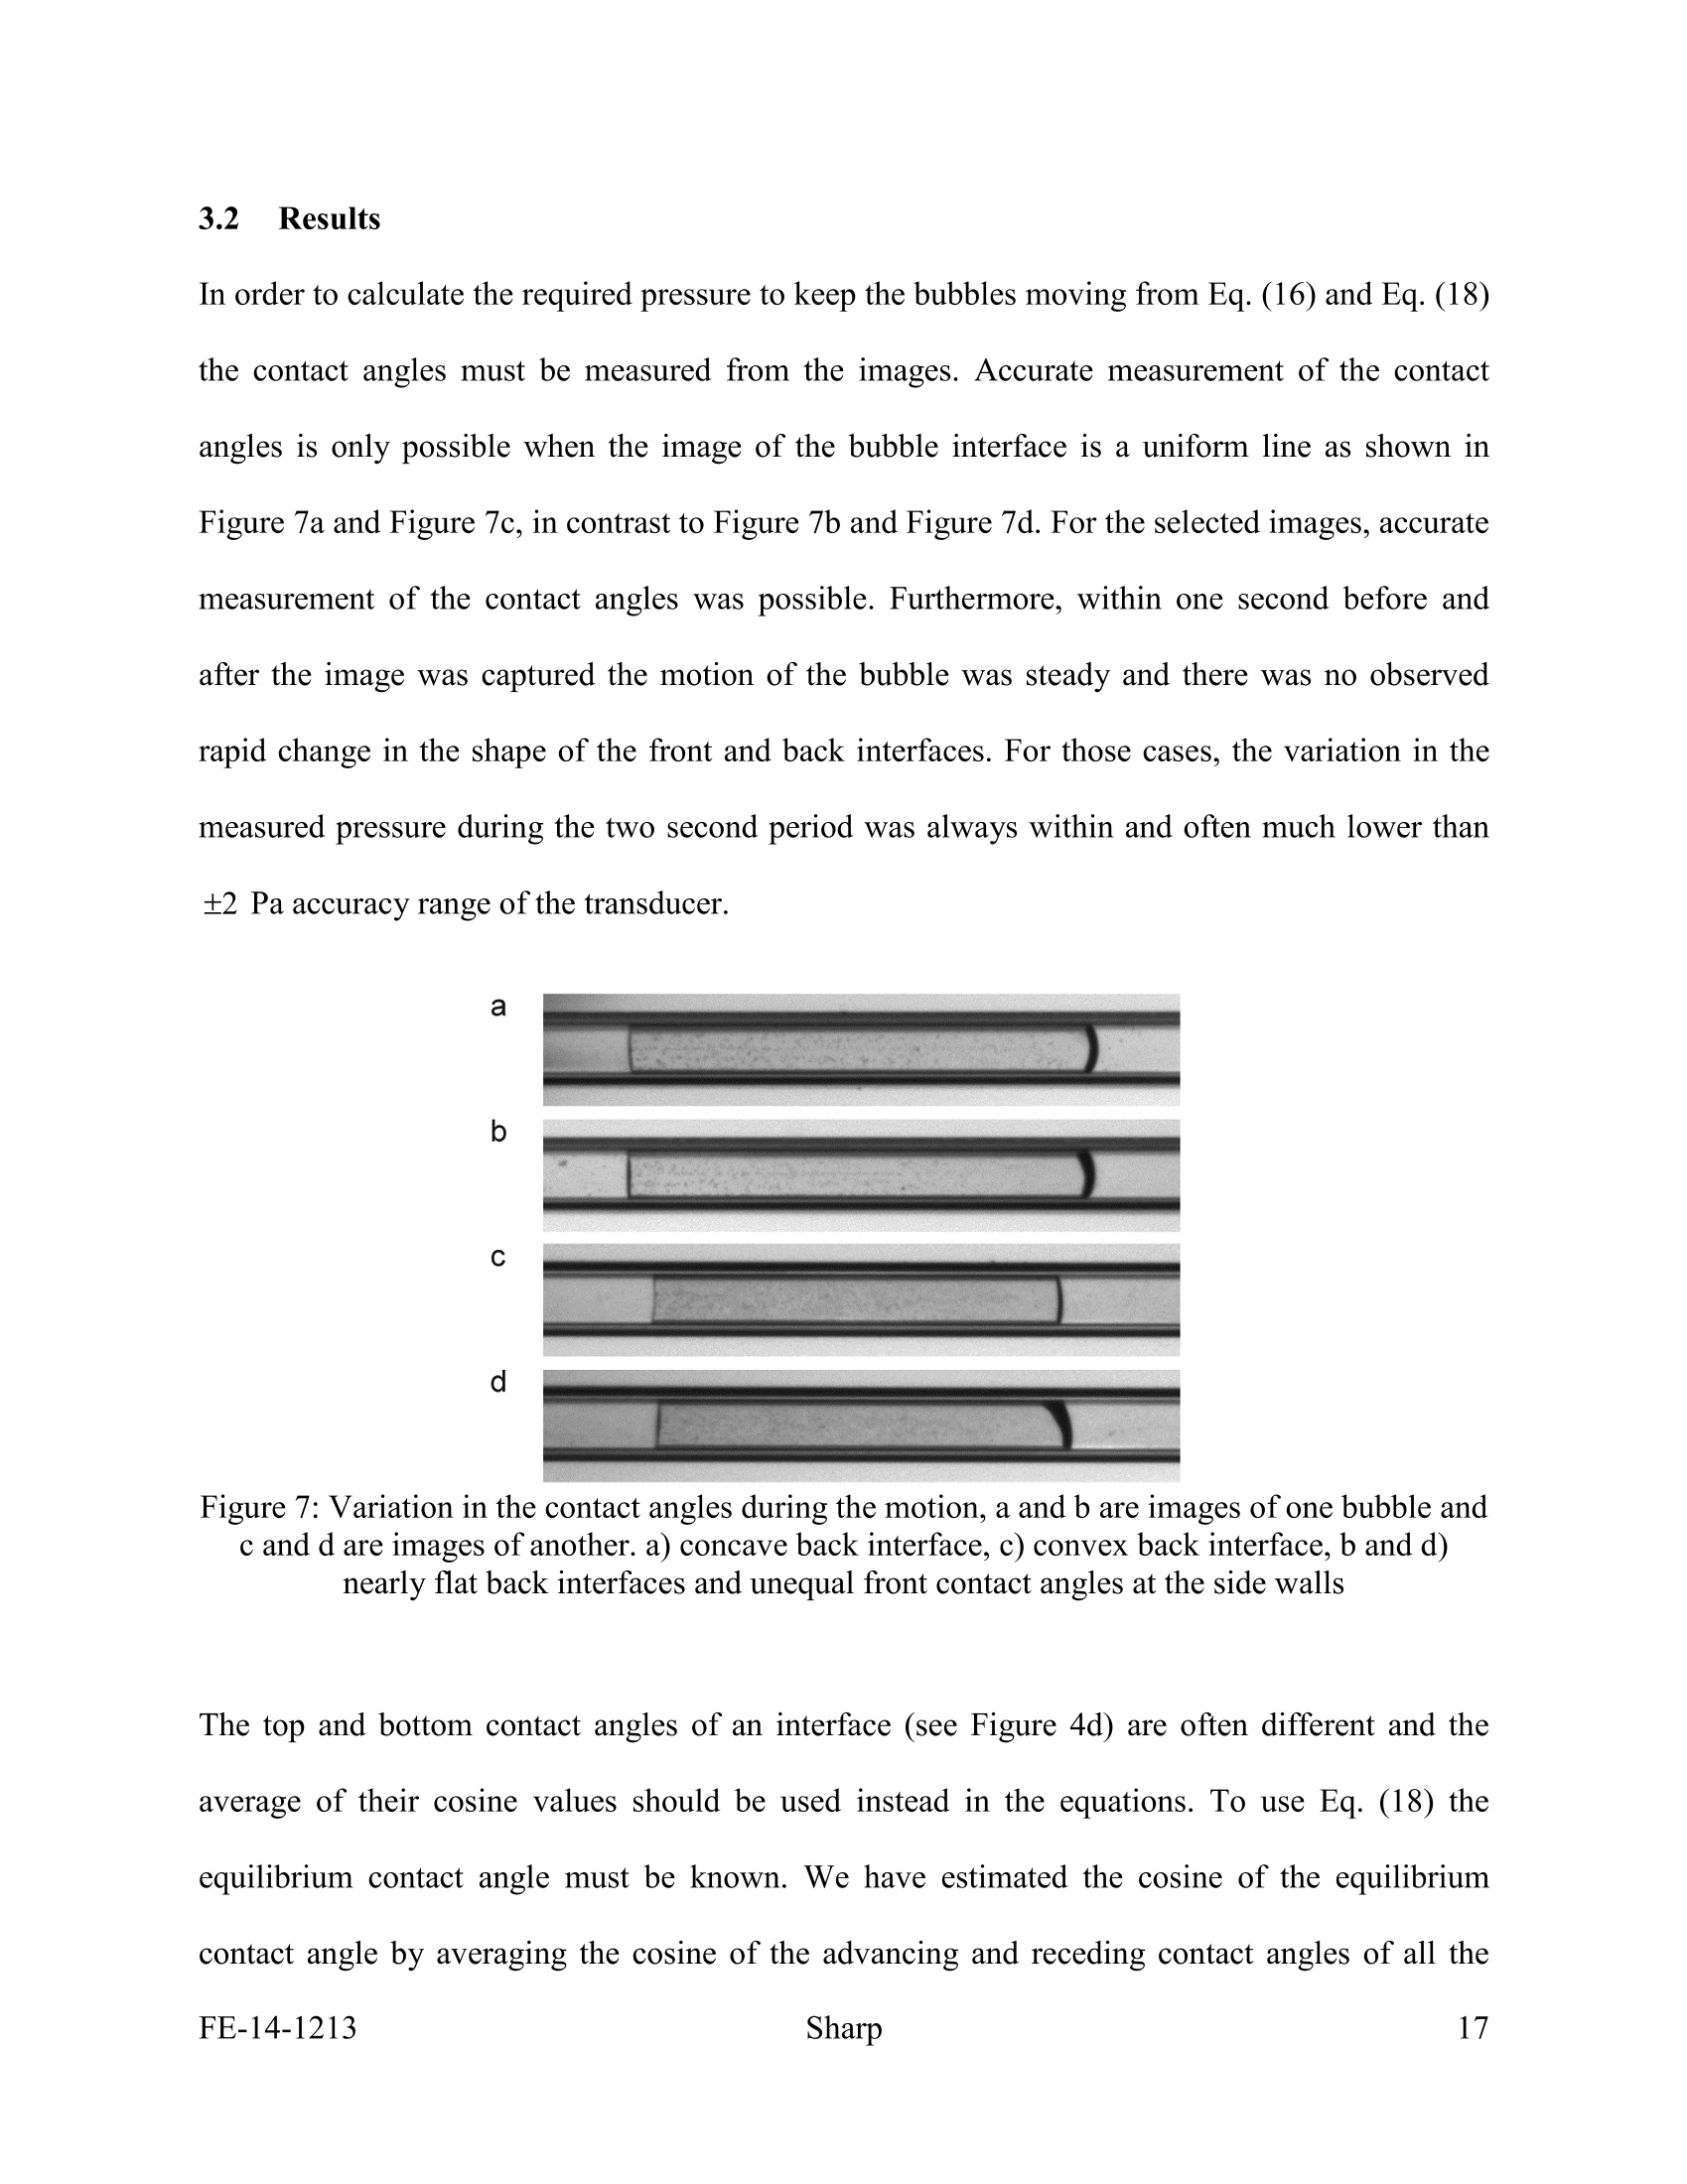
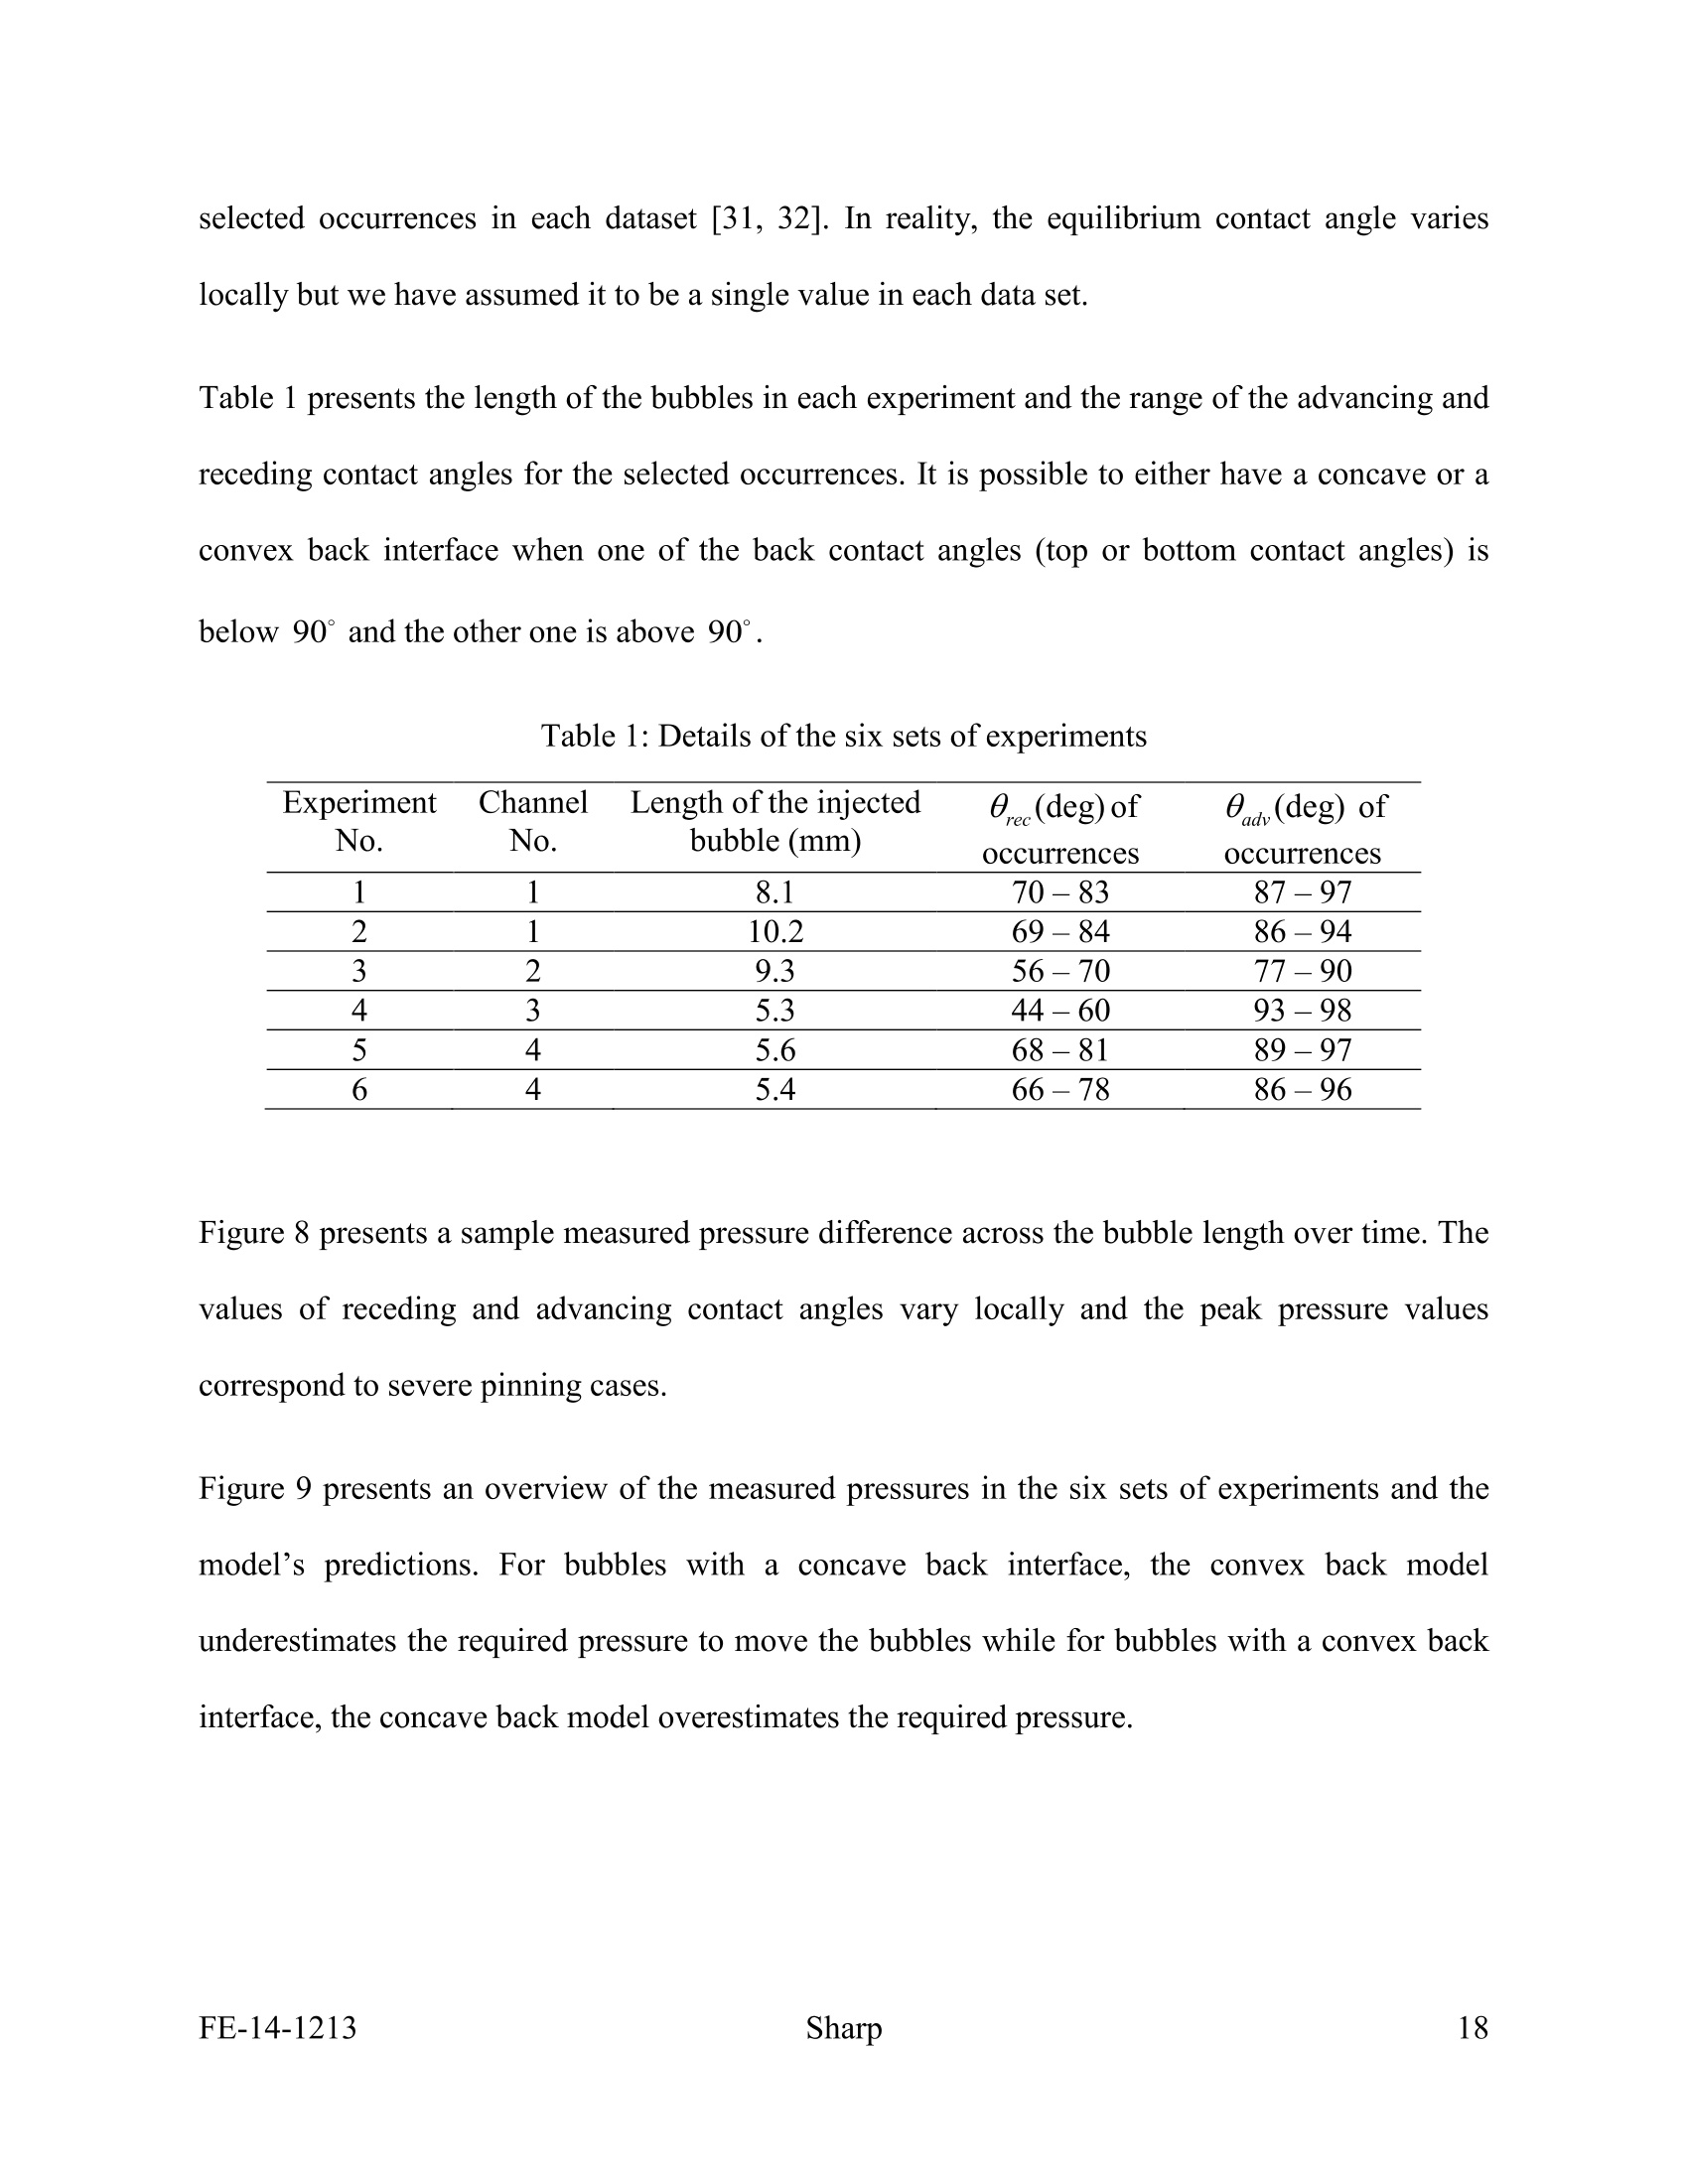
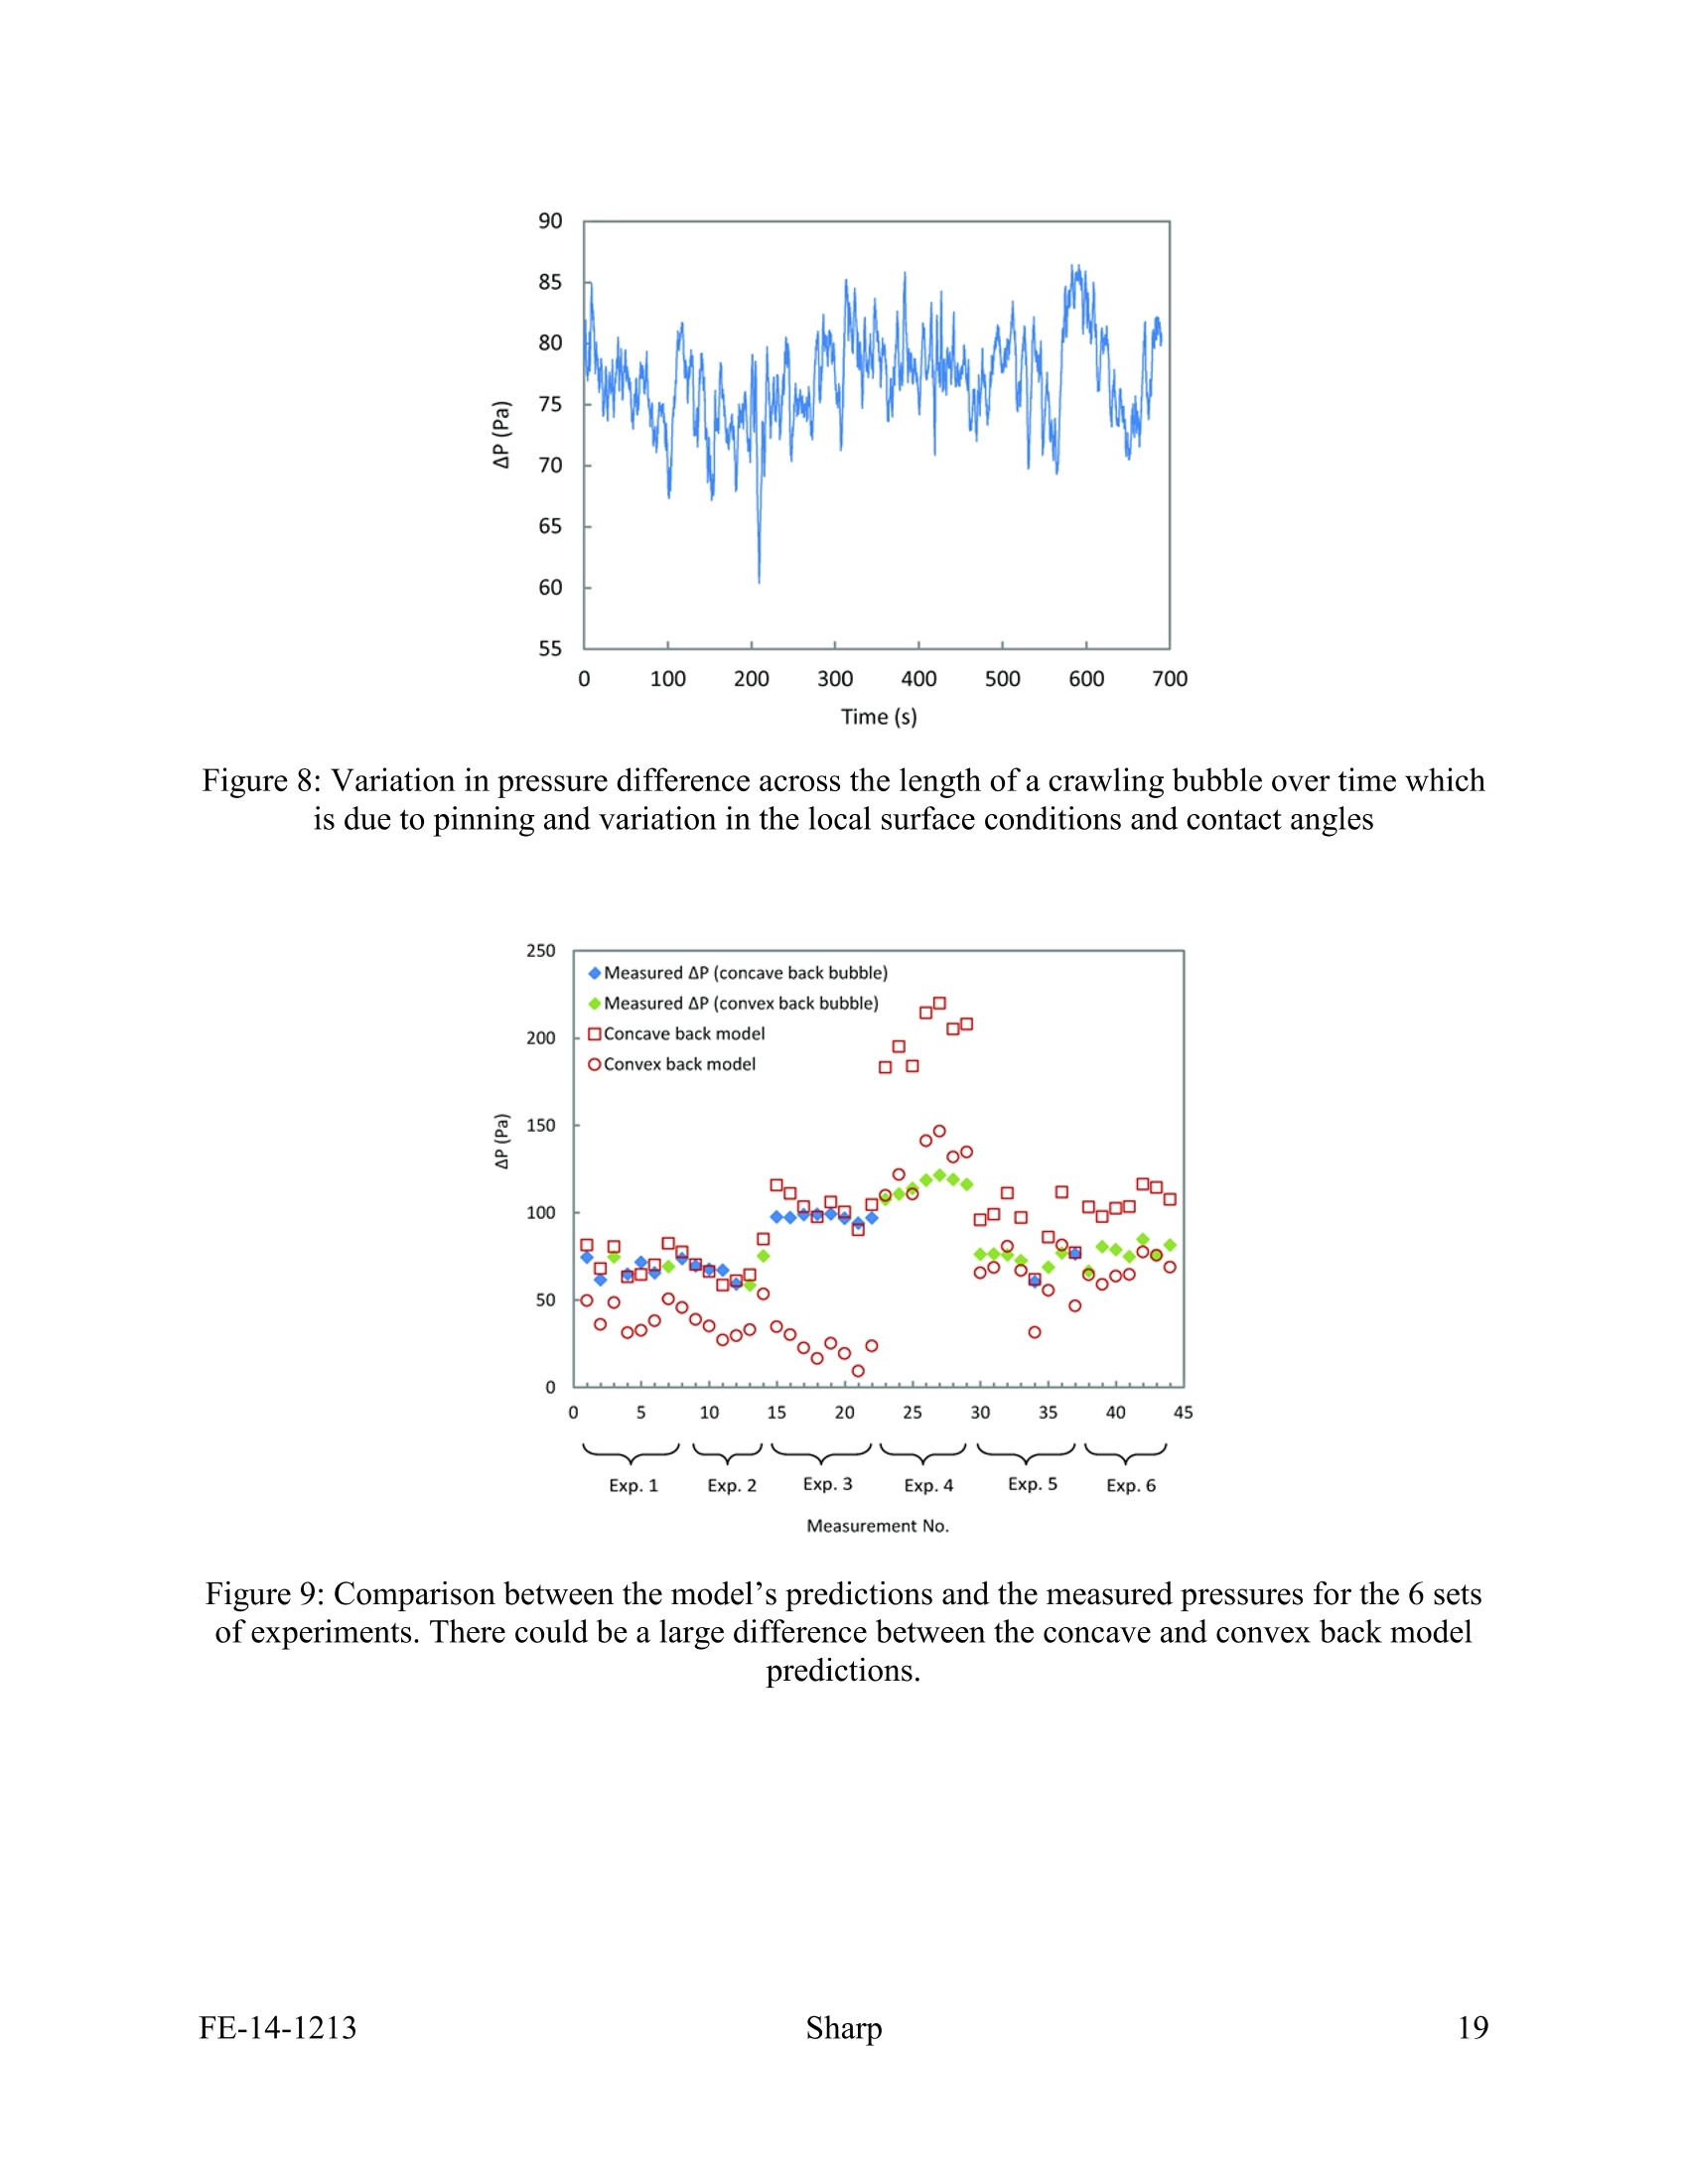
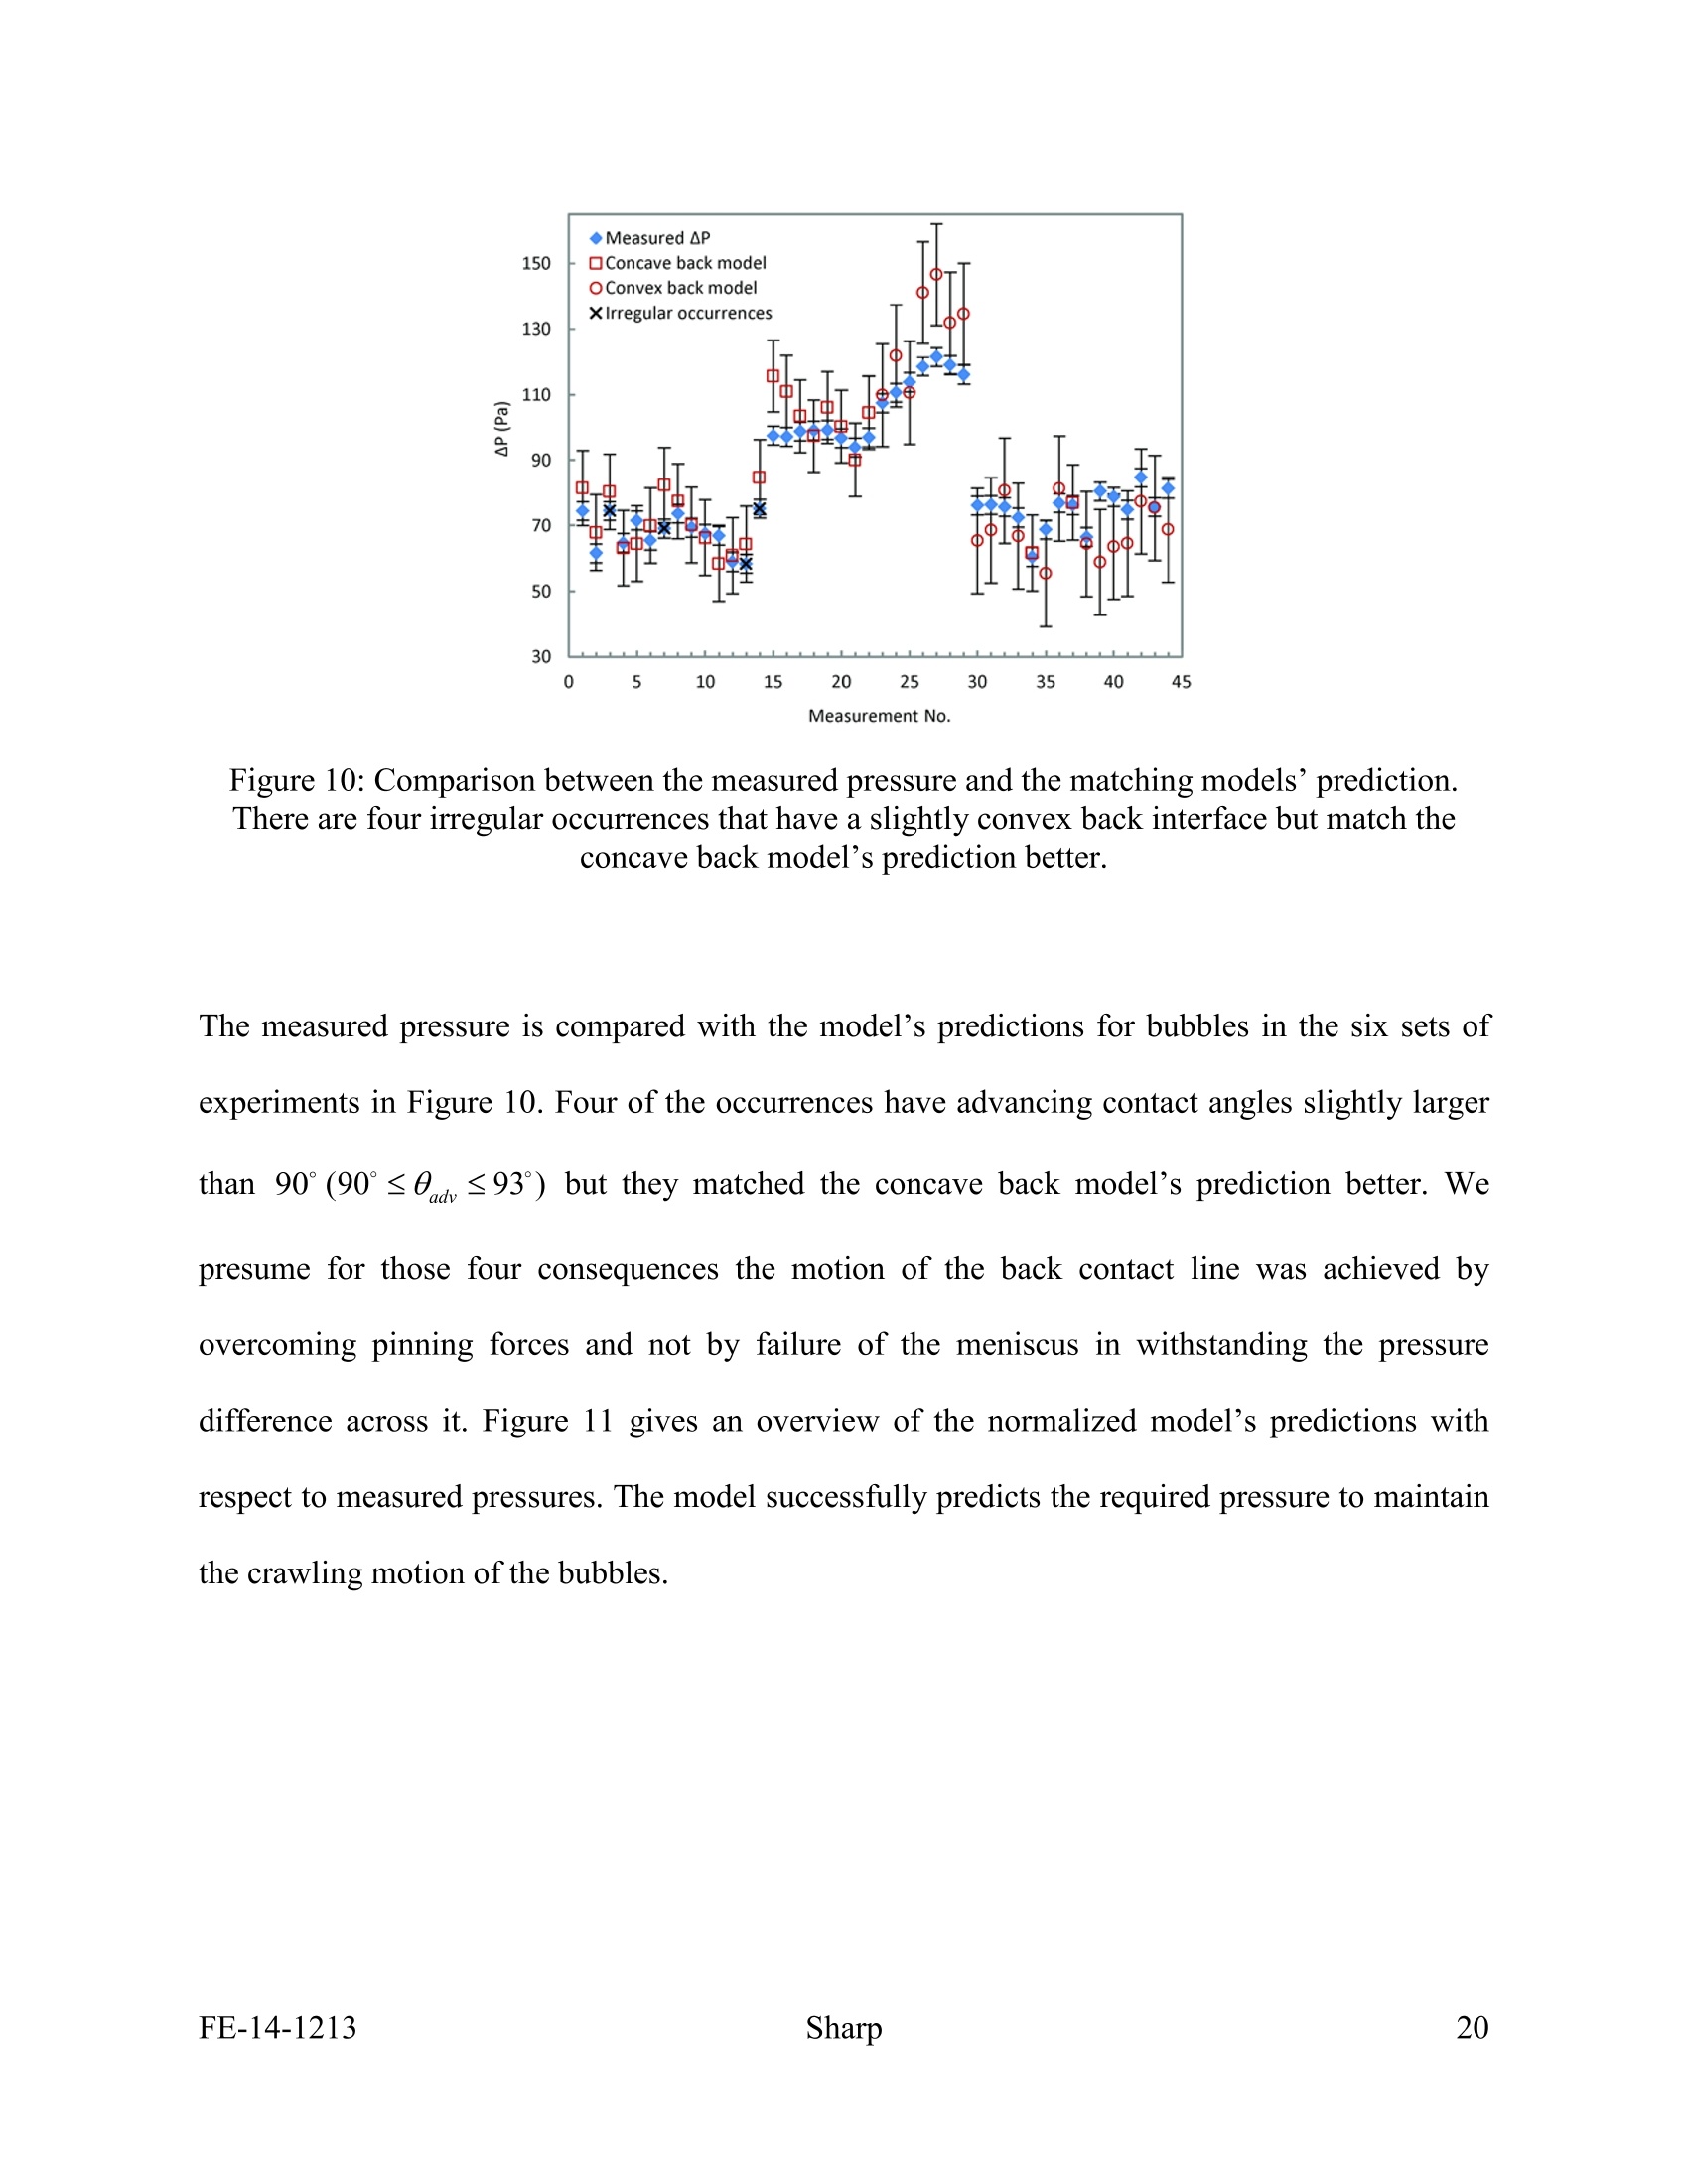
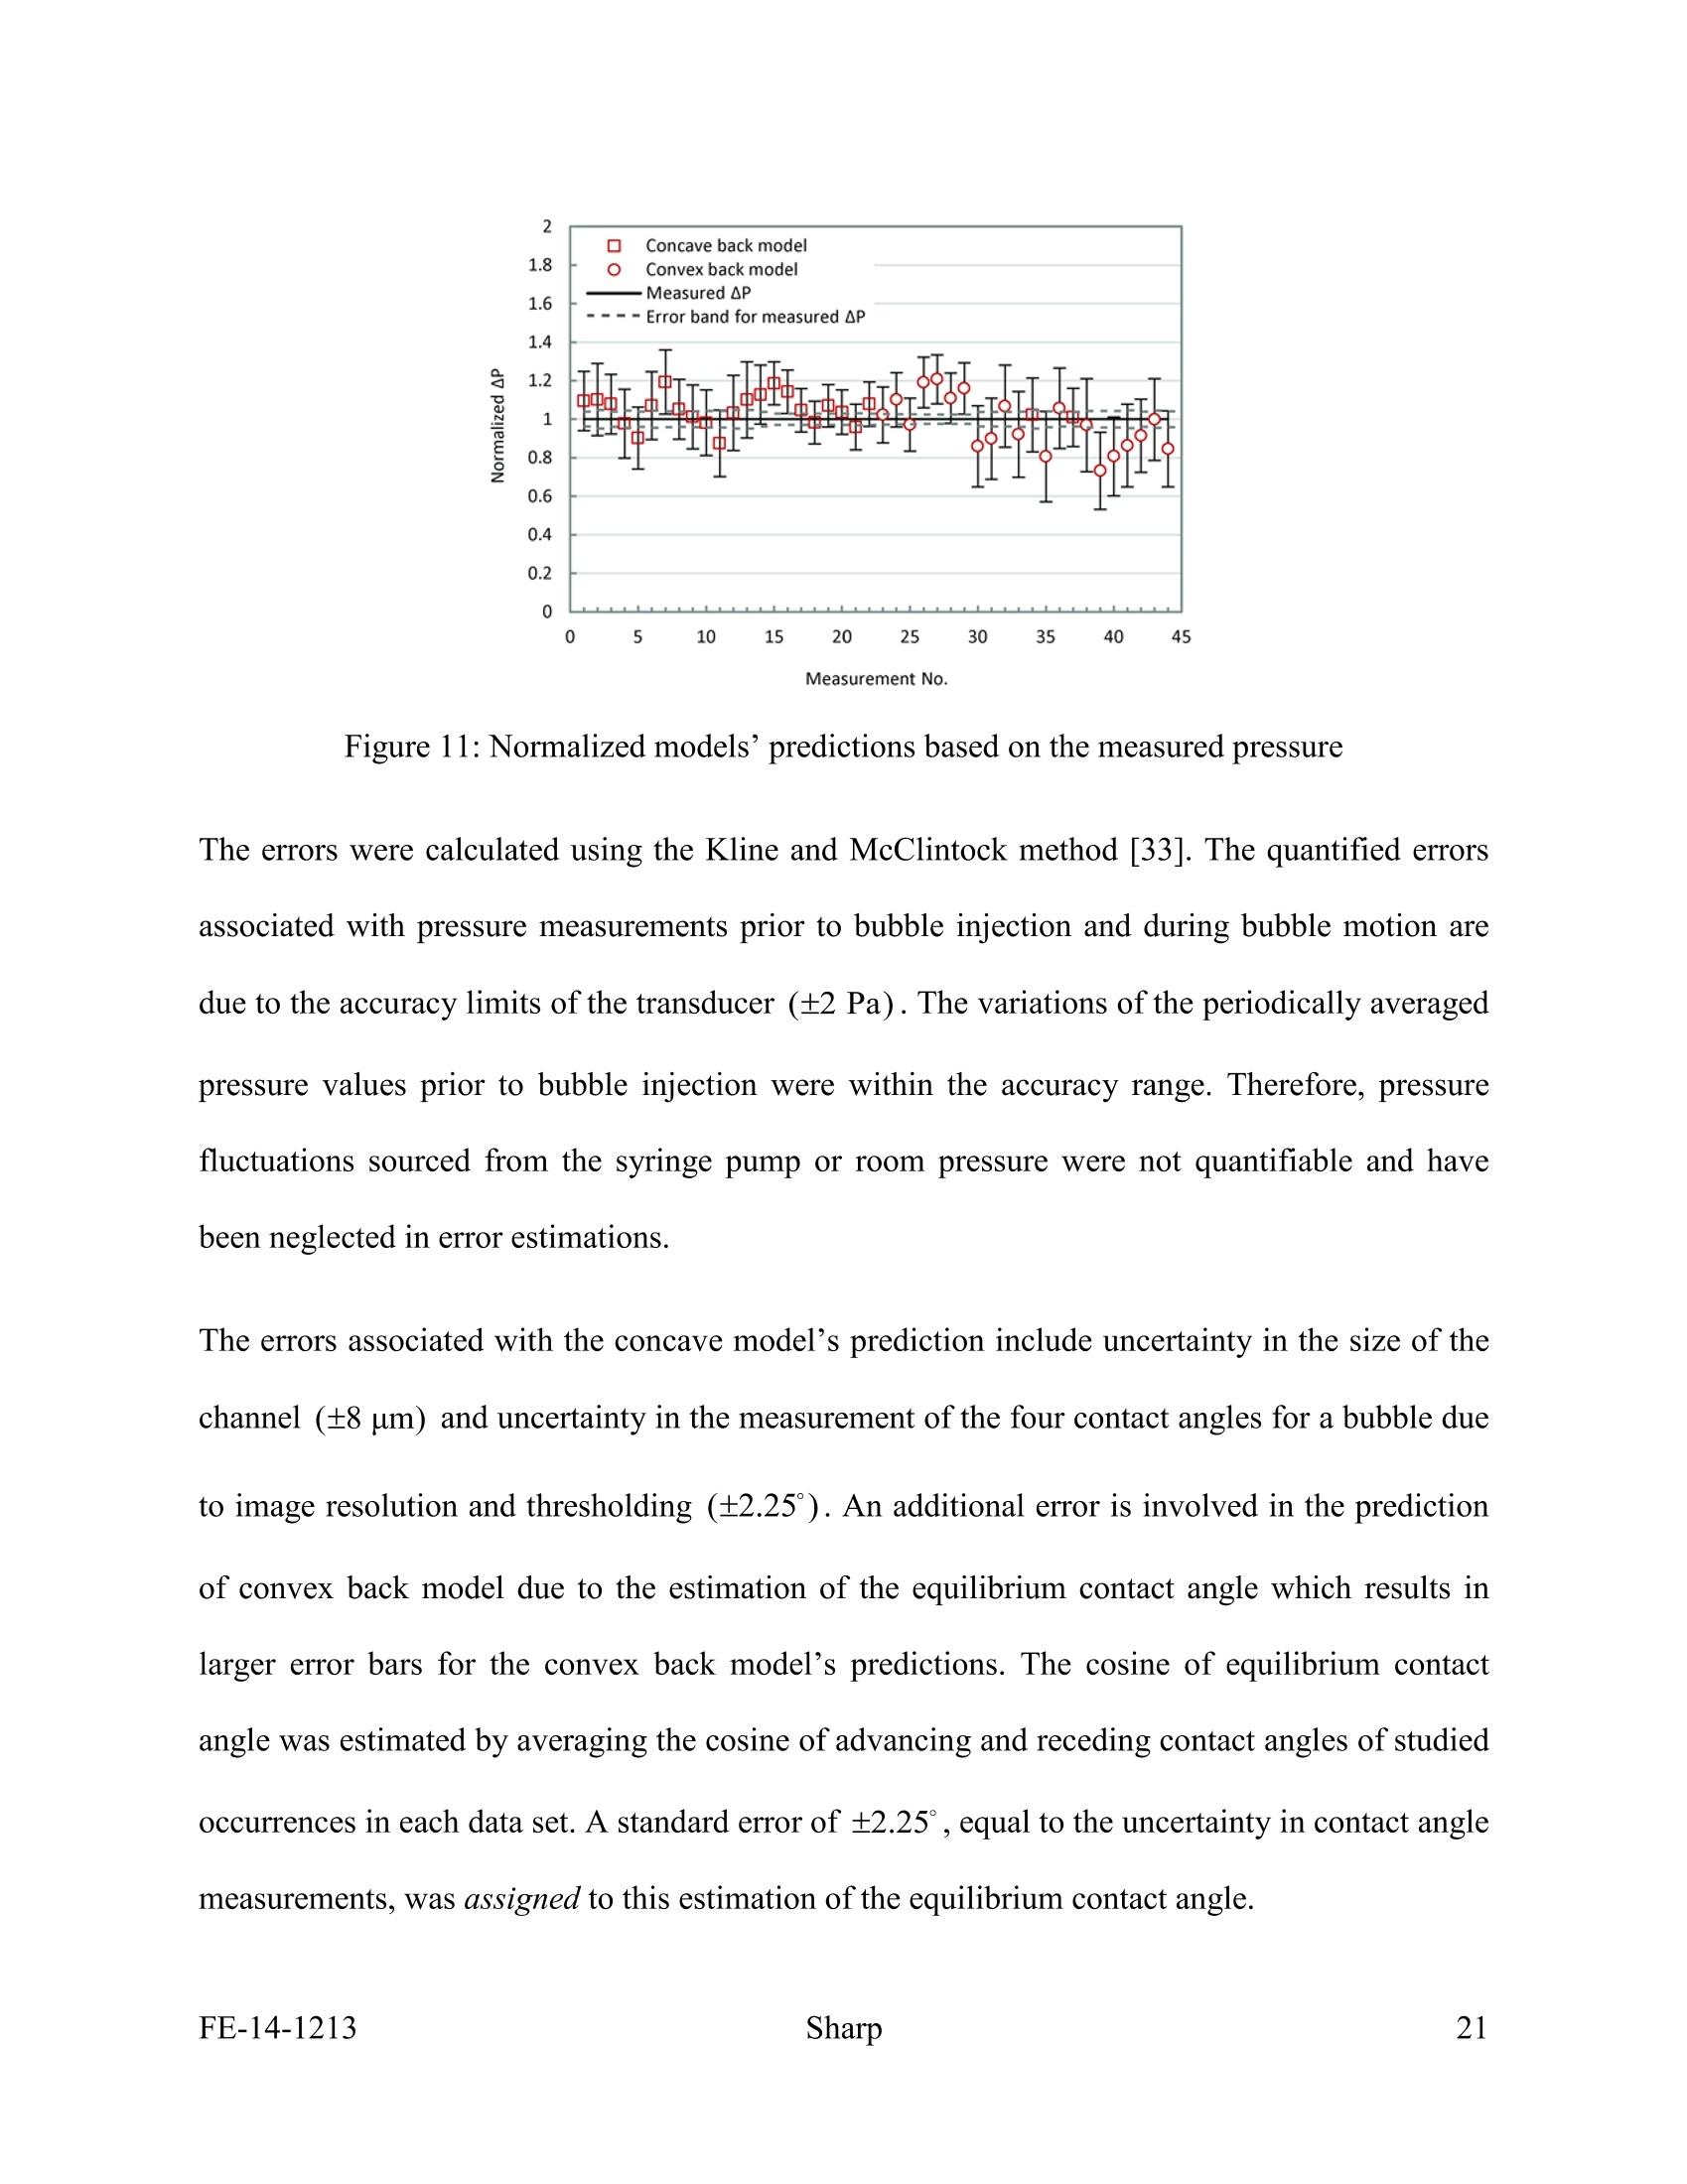
90°), as shown in Figure 4d, therequired condition for motion of the back interface might be different. Pinning forces cannoteffectively contribute to the force balance written for a fluid element at the bulged interface. Ifthe pressure difference across the interface exceeds what interfacial forces can compensate foraccording to the Young-Laplace equation, the interface will break up and move forward. In thiscase This condition is met before the pinning forces are overcome.Capillary valves often work basedon this principle [11, 24, 25]. Note that at the front interface, pressure differences up to4o cos egu /h can be easily held by surface tension. However, for higher pressure differencesand subsequently front contact angles below eou, the pinning forces are responsible for the integrity of the interface. The motion of the front interface is always triggered by overcoming thepinning forces. Adding Eq. (17) and Eq. (14) written for a square microchannel results in the necessarycondition for the motion of both the front and the back contact lines Therefore, our theoretical model consists of two parts: Eq.(16) for concave back bubbles and Eq.(18) for convex back bubbles with some exceptions. Our experimental results suggest that formoving bubbles with a slightly bulged back interface (90°≤0aiv≤93°), Eq. (16) can predict thepressure difference across the bubble much better than Eq. (18). For slightly bulged interfaces,the pinning forces may be still able to assist the surface tension to withstand the pressuredifference across the meniscus and the motion of the back contact line happens by overcomingthe pinning forces. It is important to note that in the absence of liquid regions in the corners of the channel, pinningforces are the only resistive forces acting on the bubbles. Moreover, the length of the bubble doesnot influence the pressure difference across the bubble. However, when liquid regions exist,capillary forces may act on the bubble as well [13, 26] and the pressure drop across the bubblebecomes a function of the bubble length. 2.1 Differentiation between capillary and pinning forces It is easy to confuse capillary and pinning forces because the mathematical form of the right handofEq. (15) looks similar to capillary pressure if we replace s and A with 2 (w+h) and wxh,respectively. It is important to distinguish between the concepts of capillary and pinning forcesFE-14-1213 Sharp 11 and to understand that both of these forces may act on a dry bubble. In our example, the capillarypressure gradient was caused by the difference in the back and front curvatures due to pinningand contact angle hysteresis. An integration of capillary pressure over the interface results in thecapillary force [1]. It is also possible to have capillary forces in the absence of pinning; for example, lubricatedbubbles passing through contractions or expansions experience capillary forces [1]. The capillarypressure gradient and subsequently the capillary force can also be produced by a surface tensiongradient due to variations in the temperature, concentration,or electric field [22]. Unlike pinning forces which always resist the motion, capillary forces may stimulate it. Aninteresting example presented by Paust et al. [27] demonstrates a conflict between the capillaryand pinning forces: A growing bubble in a tapered geometry is pinned at the back side. Thebubble growth toward a bigger cross section reduces the front curvature and increases thecapillary force which eventually overcomes the pinning force at the back and detaches the bubblefrom the pinning point. 2.2 Capillary Pressure In the presence of liquid regions in the corner of a channel, the capillary pressure gradientinduces an interfacial liquid flow on the gas-liquid menisci (represented by dotted line in Figure4b) from the back to front that wants to move the bubble backward [22, 27]. Indeed, the cornerliquids act as a medium for implementing the capillary pressure. The maximum capillarypressure gradient occurs when both front and back contact angles hold their limiting values. Fora rectangular channel with a width of w and depth of h the Young-Laplace equation yields The possibility of the capillary pressure to be completely transferred through the small gas-liquidmenisci is an open question. If it does AP should be added to the right hand side of Eq. (15) toresult in the necessary condition for the onset of bubble motion The pressure drop along the length of the bubble is maintained by the bypassing corner flow.Treating the corner flow as Poiseuille flow, Wong et al. [13] approximated the pressure dropalong a stationary bubble by where g is the volumetric flow rate and der is the effective dynamic diameter of the liquidflow. Longer bubbles apply more resistant to the corner flow and experience a larger pressuredifference across their length. Equation (21) suggests that for any bubble length there is a criticalflow rate that provides a pressure drop sufficient for bubble motion. The dynamic contact anglesof the front and back of the dry moving bubble vary between receding and advancing contactangles as the triple contact line still exists. If the velocity of a dry bubble becomes high enough athin film around the bubble will start to form and eventually the bubble will become lubricatedagain [28], as shown in Figure 5. Asthe velocity increases the bubble caps deformasymmetrically resulting in the so-called“bullet-shaped”appearance [22, 29]. Figure 5: Progression of bubble shape with increasing velocity: a) dry dynamic bubble, b) thinfilm forming, c) lubricated bubble, and d) bullet-shaped lubricated bubble, adapted from Jensen[28] 3 Theoretical model validation The objective of the experiments is to measure the pressure required behind a dry bubble (withno corner flow and hence no resistive capillary pressure) to overcome the pinning forces andmaintain its crawling motion in a square channel. At low velocities (Re<<1), inertial forces arenegligible and we can assume that the pinning forces are the only forces resisting the motion.Furthermore, at low velocities (Ca<10=), dynamic contact angles are independent of velocityand are equal to the static receding and advancing contact angles [30]. Equations (16) and (18)will be validated for bubbles with concave or convex back interfaces, respectively. 3.1 Experimental setup and procedure A schematic view of the experimental setup is presented in Figure 6. Square borosilicate glasschannels (VitroCom PN 8100) with a height and width of 976±8 um and a length of 10 cmhave been used as the test channels. In order to decrease the hydrophilicity of the glass and havecontact angle readings with high accuracy, four brand new channels were washed with“Rain XFE-14-1213 Sharp 14 Original” glass treatment solution for 1-3 seconds and then rinsed with water and dried withcompressed air. Depending on the duration of the treatment and the velocity of solution injection,each glass channel show different receding and advancing contact angles in the experiments. Thefluid used in the experiments was deionized water. The treatment increased the equilibriumcontact angle of water on the channel surface from below 10° to 60°-85. Figure 6: Experimental setup for pressure measurements A syringe pump (Harvard Apparatus PHD 2000 Programmable) was used for flow delivery. A100-ul gastight syringe (Hamilton PN 81020) was used for bubble injection. The imagingsystem consisted of a LaVision sCMOS camera coupled with a Navitar 12X Zoom lens. Anincandescent 100-Watt globe lamp was used for backlighting. A pressure transducer (Omega PX409-10WG5V) with a range of 0-2490 Pa and a 0.08%accuracy (±2 Pa) was used for pressure measurement. The pressure signal was recorded with anNI-USB 6211 DAQ system and LabVIEW. Several precautions were taken to reduce thepressure fluctuations in the room and test loop including limiting changes in the lab environment.The pressure transducer was connected to its fittings under water to avoid air trapping in thefittings and the transducer branch. The flow rate was set at 2 pl/min which corresponds to an average velocity of 2 mm/min in thechannels (Ca<10-). A single bubble with a volume between 5 to 10 ul was injected into theflow stream for each experiment. To verify the repeatability, on two of the channels, two sets ofexperiments were performed. The required pressure to maintain a flow rate of 2 ul/min as measured prior to bubbleinjection. The periodically averaged pressure values for every 0.2 s interval prior to bubbleinjection were relatively steady and the variations were within the ±2 Pa accuracy range of thetransducer. The change in the water reservoir level between this reading and the beginning ofimage and pressure acquisition is carefully calculated for each experiment (<120um) andaccounted for. We are interested in the pressure difference across the bubble length; therefore,the pressure prior to bubble injection was subtracted from the measured pressure during bubblemotion. The change in the reservoir water level during image and pressure acquisition was about29 um (0.28 Pa hydrostatic pressure) and was neglected. Image and pressure data acquisition started almost simultaneously at rates of 5 fps and 1000 Hzrespectively and continued for 12 minutes. The pressure data has been condensed to an averagepressure value for every 0.2 s interval. By matching a pressure peak in the pressure signal to itscorresponding closely-timed image with an apparent maximum pinning, the lag between theimaging and pressure measurements was revealed. Using this information, each image has beenmapped to a single pressure reading. 3.2 Results In order to calculate the required pressure to keep the bubbles moving from Eq. (16) and Eq. (18)the contact angles must be measured from the images. Accurate measurement of the contactangles is only possible when the image of the bubble interface is a uniform line as shown inFigure 7a and Figure 7c, in contrast to Figure 7b and Figure 7d. For the selected images, accuratemeasurement of the contact angles was possible. Furthermore, within one second before andafter the image was captured the motion of the bubble was steady and there was no observedrapid change in the shape of the front and back interfaces. For those cases, the variation in themeasured pressure during the two second period was always within and often much lower than±2 Pa accuracy range of the transducer. Figure 7: Variation in the contact angles during the motion, a and b are images of one bubble andc and d are images of another. a) concave back interface, c) convex back interface, b and d)nearly flat back interfaces and unequal front contact angles at the side walls The top and bottom contact angles of an interface (see Figure 4d) are often different and theaverage of their cosine values should be used instead in the equations. To use Eq. (18) theequilibrium contact angle must be known. We have estimated the cosine of the equilibriumcontact angle by averaging the cosine of the advancing and receding contact angles of all the FE-14-1213 selected occurrences in each dataset [31,32]. In reality, the equilibrium contact angle varieslocally but we have assumed it to be a single value in each data set. Table 1 presents the length of the bubbles in each experiment and the range of the advancing andreceding contact angles for the selected occurrences. It is possible to either have a concave or aconvex back interface when one of the back contact angles (top or bottom contact angles) isbelow 90° and the other one is above 90°. Table 1: Details of the six sets of experiments Experiment Channel Length of the injected o(deg)of Bady(deg) of No. No. bubble (mm) occurrences occurrences 1 1 8.1 70-83 87-97 2 1 10.2 69-84 86-94 3 2 9.3 56-70 77-90 4 3 5.3 44-60 93-98 5 4 5.6 68-81 89-97 6 4 5.4 66-78 86-96 Figure 8 presents a sample measured pressure difference across the bubble length over time. Thevalues of receding and advancing contact angles vary locally and the peak pressure valuescorrespond to severe pinning cases. Figure 9 presents an overview of the measured pressures in the six sets of experiments and themodel’s predictions. For bubbles witha aconcave back interface, the convex back modelunderestimates the required pressure to move the bubbles while for bubbles with a convex backinterface, the concave back model overestimates the required pressure. Time (s) Figure 8: Variation in pressure difference across the length of a crawling bubble over time whichis due to pinning and variation in the local surface conditions and contact angles Measurement No. Figure 9: Comparison between the model’s predictions and the measured pressures for the 6 setsof experiments. There could be a large difference between the concave and convex back modelpredictions. Measurement No. Figure 10: Comparison between the measured pressure and the matching models’ prediction.There are four irregular occurrences that have a slightly convex back interface but match theconcave back model's prediction better. The measured pressure is compared with the model’s predictions for bubbles in the six sets ofexperiments in Figure 10. Four of the occurrences have advancing contact angles slightly largerthan 90°(90°≤0adv≤93°) but they matched the concave back model’s prediction better. Wepresume for those four consequences the motion of the back contact line was achieved byovercoming pinning forces and not by failure of the meniscus in withstanding the pressuredifference across it. Figure 11 gives an overview of the normalized model’s predictions withrespect to measured pressures. The model successfully predicts the required pressure to maintainthe crawling motion ofthe bubbles. Measurement No. Figure 11: Normalized models’predictions based on the measured pressure The errors were calculated using the Kline and McClintock method [33]. The quantified errorsassociated with pressure measurements prior to bubble injection and during bubble motion aredue to the accuracy limits of the transducer (±2 Pa).The variations of the periodically averagedpressure values prior to bubble injection were within the accuracy range. Therefore, pressurefluctuations sourced from the syringe pump or room pressure were not quantifiable and havebeen neglected in error estimations. The errors associated with the concave model's prediction include uncertainty in the size of thechannel (±8 um) and uncertainty in the measurement of the four contact angles for a bubble dueto image resolution and thresholding (±2.25°). An additional error is involved in the predictionof convex back model due to the estimation of the equilibrium contact angle which results inlarger error bars for the convex back model's predictions. The cosine of equilibrium contactangle was estimated by averaging the cosine of advancing and receding contact angles of studiedoccurrences in each data set. A standard error of ±2.25°, equal to the uncertainty in contact anglemeasurements, was assigned to this estimation of the equilibrium contact angle. One of the most important factors contributing to the differences observed between the measuredpressure and the model’s predictions is the contact angle measurement. With a two dimensionalimage from the bubble caps it is not possible to measure the contact angles on all 4 sides of thechannel. We only measure the contact angles on the top and bottom sides of the bubble caps (asshown in Figure 4d). We assume that the cosine of contact angles on the other two sides are anaverage of the cosine of contact angles on the top and bottom sides. For a uniform cap thisassumption is reasonable but may not be accurate. Some assumptions were made in thedevelopment of our theoretical model such as assuming equal cross sectional areas, contact linelengths, and equilibrium contact angles at the front and the back of the bubbles. There is adefinite deviation from these assumptions in the experiments which also contributes to thedifferences between the measured pressure and the model's predictions. For example in thedevelopment of the model, Eq. (15) was derived by adding Eq. (13) and (14). If it turns out thats,/4 =0.99 sp/4g=0.99(4/h) the model prediction by Eq. (16) will overestimate therequired pressure by 0.04og(cosBegu-cosFadv)/h 4 Conclusions A bipartite theoretical model that describes the required pressure to initiate the motion of a drybubble in a partially hydrophilic channel is proposed. It has been shown that the motion of thefront interface of the bubble always occur by overcoming pinning forces. However, the motionof the back interface may occur either by overcoming the pinning forces or by failure of themeniscus in withstanding the pressure difference across it. The theoretical model has beenvalidated by experimental results. This work differentiates the resistive pinning forces from the capillary pressure which may get transmitted by the gas-liquid interface in the presence of cornerflow. The use of highly hydrophilic surfaces is an effective solution for reducing bubble clogging atlow velocities. At small equilibrium contact angles, cos Orec -cos Oady is essentially smaller thanthe one for large equilibrium contact angles even with similar hysteresis. Therefore, dry bubblesexperience smaller pinning and capillary forces resisting their motion. Surfaces with smallerreceding contact angles also exhibit a lower dewetting velocity and the bubbles will have a betterchance of remaining lubricated at low flow rates. Acknowledgement This work has been supported by National Institutes of Health (NIH) Contract No. 1 R01EB011567-01A1. Nomenclature References [1] Metz, T., Paust, N., Zengerle, R., and Koltay, P., 2010, "Capillary Driven Movement of GasBubbles in Tapered Structures,"Microfluid Nanofluid,9(2-3), pp. 341-355. [2] Kohnle, J., Waibel, G., Cernosa, R., Storz, M., Ernst, H., Sandmaier, H., Strobelt, T., andZengerle, R., "A Unique Solution for Preventing Clogging ofFlow Channels by Gas Bubbles,"Proc. 15th IEEE International Conference on Micro Electro Mechanical Systems, IEEE MEMS,pp. 77-80. [3] Litterst, C., Eccarius, S., Hebling, C., Zengerle, R., and Koltay, P., 2006,"Increasing pDMFCEfficiency by Passive CO2 Bubble Removal and Discontinuous (Operation,"" Journal ofMicromechanics and Microengineering, 16(9),pp. S248-S253. [4] Kandlikar, S., and Balasubramanian, P., 2003, "Effect of Channel Shape on Flow PatternDuring Flow Boiling in Single and Parallel Rectangular Microchannels," Proc. 5th InternationalConference on Boiling Heat Transfer, Montego Bay, Jamaica. [5] Kenny, T. W., Goodson, K. E., Santiago, J. G., Wang, E., Koo, J.-M. O., Jiang, L., Pop,E.,Sinha, S., Zhang, L., Fogg, D., Yao, S., Flynn, R., Chang, C.-H., and Hidrovo, C. H., 2006,"Advanced Cooling Technologies for Microprocessors," International Journal of High SpeedElectronics and Systems, 16, pp.301-313. [6] Kuo, C. Y., and Pan, C., 2009, "The Effect of Cross-Section Design of RectangularMicrochannels on Convective Steam Condensation." Journalof MicromechanicsandMicroengineering, 19(3), p. 035017. [7] Chen, T., and Garimella, S. V., 2011, "A Study of Critical Heat Flux During Flow Boiling inMicrochannel Heat Sinks," Journal of Heat Transfer, 134(1), pp. 011504-011504. [8] Mukherjee, S., and Mudawar, I., 2003, "Smart Pumpless Loop for Micro-Channel ElectronicCooling Using Flat and Enhanced Surfaces," IEEE Transactions on Components and PackagingTechnologies,26(1),pp.99-109. [9] Litterst, C., Metz, T., Zengerle, R., and Koltay, P., 2008, "Static and Dynamic Behaviour ofGas Bubbles in T-Shaped Non-Clogging Micro-Channels," Microfluid Nanofluid, 5(6), pp. 775-784. [10] Hibara, A., Iwayama, S., Matsuoka, S., Ueno, M., Kikutani, Y., Tokeshi, M., and Kitamori,T., 2004, "Surface Modification Method of Microchannels for Gas-Liquid Two-Phase Flow inMicrochips," Analytical Chemistry, 77(3), pp. 943-947. [11]Zhu, X., 2009,"Micro/NanoporousMembraneBasedGas-Water SeparationiinMicrochannel," Microsystem Technologies, 15(9),pp. 1459-1465. [12] Xu, J., Vaillant, R., and Attinger, D., 2010, "Use of a Porous Membrane for Gas BubbleRemoval in Microfluidic Channels: Physical Mechanisms and Design Criteria," MicrofluidNanofluid, 9(4-5),pp. 765-772. [13] Wong, C. W., Zhao, T. S., Ye, Q., and Liu, J. G., 2005, "Transient Capillary Blocking in theFlow Field of a Micro-DMFC and ItssEffect on Cell Performance." JJournal of TheElectrochemical Society, 152(8),p. A1600. [14] Rapolu, P., and Son, S. Y., 2011, "Characterization of Wettability Effects on Pressure Dropof Two-Phase Flow in Microchannel," Experiments in Fluids,51(4),pp. 1101-1108. [15] Paust, N., Krumbholz, S., Munt, S.,Miiller, C., Koltay, P., Zengerle, R., and Ziegler, C.,2009, "Self-Regulating Passive Fuel Supply for Small Direct Methanol Fuel Cells Operating inAll Orientations," Journal of Power Sources,192(2), pp. 442-450. [16] Gravesen, P., Branebjerg, J., and Jensen, O. S., 1993, "Microfluidics-a Review," Journal ofMicromechanics and Microengineering,3,pp.168-182. [17] Hutzenlaub, T., Paust, N., Zengerle, R., and Ziegler, C., 2011, "The Effect of WettingProperties on Bubble Dynamics and Fuel Distribution in the Flow Field of Direct Methanol FuelCells," Journal of Power Sources, 196(19), pp. 8048-8056. [18] Blackmore, B., Li,D., and Gao, J., 2001, "Detachment of Bubbles in Slit Microchannels byShearing Flow," Journal of Colloid and Interface Science, 241(2), pp. 514-520. [19] de Gennes, P. G., Brochard-Wyart, F., and Quére, D., 2004, Capillarity and WettingPhenomena : Drops, Bubbles, Pearls, Waves, Springer, New York, pp. 37, 153-174. [20] Redon, C., Brochard-Wyart, F., and Rondelez, F., 1991, "Dynamics of Dewetting," PhysicalReview Letters, 66(6),pp. 715-718. [21] Cubaud, T., and Ho, C. M., 2004, "Transport of Bubbles in Square Microchannels," PhysicsofFluids, 16(12), pp. 4575-4585. [22] Ajaev, V. S., and Homsy, G. M., 2005, "Modeling Shapes and Dynamics of ConfinedBubbles," Annual Review of Fluid Mechanics, 38(1),pp.277-307. [23] Wong, H., Morris, S., and Radke, C. J., 1992, "Three-Dimensional Menisci in PolygonalCapillaries," Journal of Colloid and Interface Science, 148(2), pp. 317-336. [24] Berthier, J., Loe-Mie, F., Tran, V. M., Schoumacker, S.,Mittler, F., Marchand, G., andSarrut, N., 2009,"On the Pinning of Interfaces on Micropillar Edges," Journal of Colloid andInterface Science, 338(1), pp. 296-303. [25] Cho, H., Kim, H. Y., Kang, J. Y., and Kim, T. S.,2007,"How the Capillary BurstMicrovalve Works," Journal of Colloid and Interface Science, 306(2), pp. 379-385. [26] Jensen, M. J., Goranovi, G., and Bruus, H., 2004, "The Clogging Pressure of Bubbles inHydrophilic Microchannel Contractions," Journal of Micromechanics and Microengineering,14(7),pp. 876-883. [27] Paust, N., Litterst, C., Metz, T., Eck, M., Ziegler, C., Zengerle, R., and Koltay, P., 2009,"Capillary-Driven Pumping for Passive Degassing and Fuel Supply in Direct Methanol FuelCells," Microfluid Nanofluid, 7(4), pp. 531-543. [28] Jensen, M. J., 2002,"Bubbles in Microchannels. Dissertation," Master of Science, TechnicalUniversity of Denmark,Lyngby. [29] Chang, H.-C., 2001, "Bubble/Drop Transport in Microchannels," The MEMS Handbook,CRC Press. [30] Kim, H.-Y.,Lee, H. J., and Kang, B. H., 2002, "Sliding of Liquid Drops Down an InclinedSolid Surface," Journal of Colloid and Interface Science, 247(2), pp.372-380. [31] Miyama, M., Yang, Y., Yasuda, T., Okuno, T., and Yasuda, H. K., 1997, "Static andDynamic Contact Angles of Water on Polymeric Surfaces," Langmuir, 13(20), pp. 5494-5503. [32] Della Volpe, C., Maniglio, D., Siboni, S., and Morra, M., 2001, "An ExperimentalProcedure to Obtain the Equilibrium Contact Angle from the Wilhelmy Method," Oil & GasScience and Technology Rev IFP, 56(1), pp. 9-22. [33] Kline, S. J., and McClintock, F. A., 1953, "Describing Uncertainties in Single-SampleExperiments," Mechanical Engineering, 75, pp. 3-8. List of Table Captions Table 1: Details of the six sets of experiments List of Figure Captions Figure 1: Bubbles with different wetting conditions: a) dry bubble, b) consecutive images of ahybrid bubble, and c) lubricated bubble, adapted from Cubaud and Ho [21] Figure 2: Dry stationary bubbles in a polycarbonate microchannel array where clear channels actas a bypass for the flow. Upon stagnation small droplets start to condense and grow on thechannel walls inside the saturated bubbles. a and b were taken upon stagnation and 17 minutesafter, respectively. Figure 3: Pinning forces resisting motion under the action of a piston in a circular tube, adaptedfrom de Gennes et al.[19] Figure 4: a) Side view of a stationary bubble and forces applied on it by the pressure field andthe channel walls, b and c) channel cross section at the left contact line with and without liquid inthe corner regions, respectively, note that the dotted border is not a part of the triple contact linebut rather a gas liquid interface, d) a moving bubble with a convex back interface Figure 5: Progression of bubble shape with increasing velocity: a) dry dynamic bubble, b) thinfilm forming, c) lubricated bubble, and d) bullet-shaped lubricated bubble, adapted from Jensen[281 Figure 6: Experimental setup for pressure measurements Figure 7: Variation in the contact angles during the motion, a and b are images of one bubble andc and d are images of another. a) concave back interface, c) convex back interface, b and d)nearly flat back interfaces and unequal front contact angles at the side walls Figure 8: Variation in pressure difference across the length of a crawling bubble over time whichis due to pinning and variation in the local surface conditions and contact angles Figure 9: Comparison between the model's predictions and the measured pressures for the 6 setsof experiments. There could be a large difference between the concave and convex back modelpredictions. Figure 10: Comparison between the measured pressure and the matching models’ prediction.There are four irregular occurrences that have a slightly convex back interface but match theconcave back model's prediction better. Figure 11: Normalized models’predictions based on the measured pressure FE- FE-harp

还剩29页未读,是否继续阅读?

产品配置单

北京欧兰科技发展有限公司为您提供《微通道气泡中堵塞现象检测方案(流量计)》,该方案主要用于其他中堵塞现象检测,参考标准--,《微通道气泡中堵塞现象检测方案(流量计)》用到的仪器有BubbleMaster气泡检测仪、LaVision ParticleMaster-Shadow 粒径测量系统、德国LaVision PIV/PLIF粒子成像测速场仪


