


方案详情
文
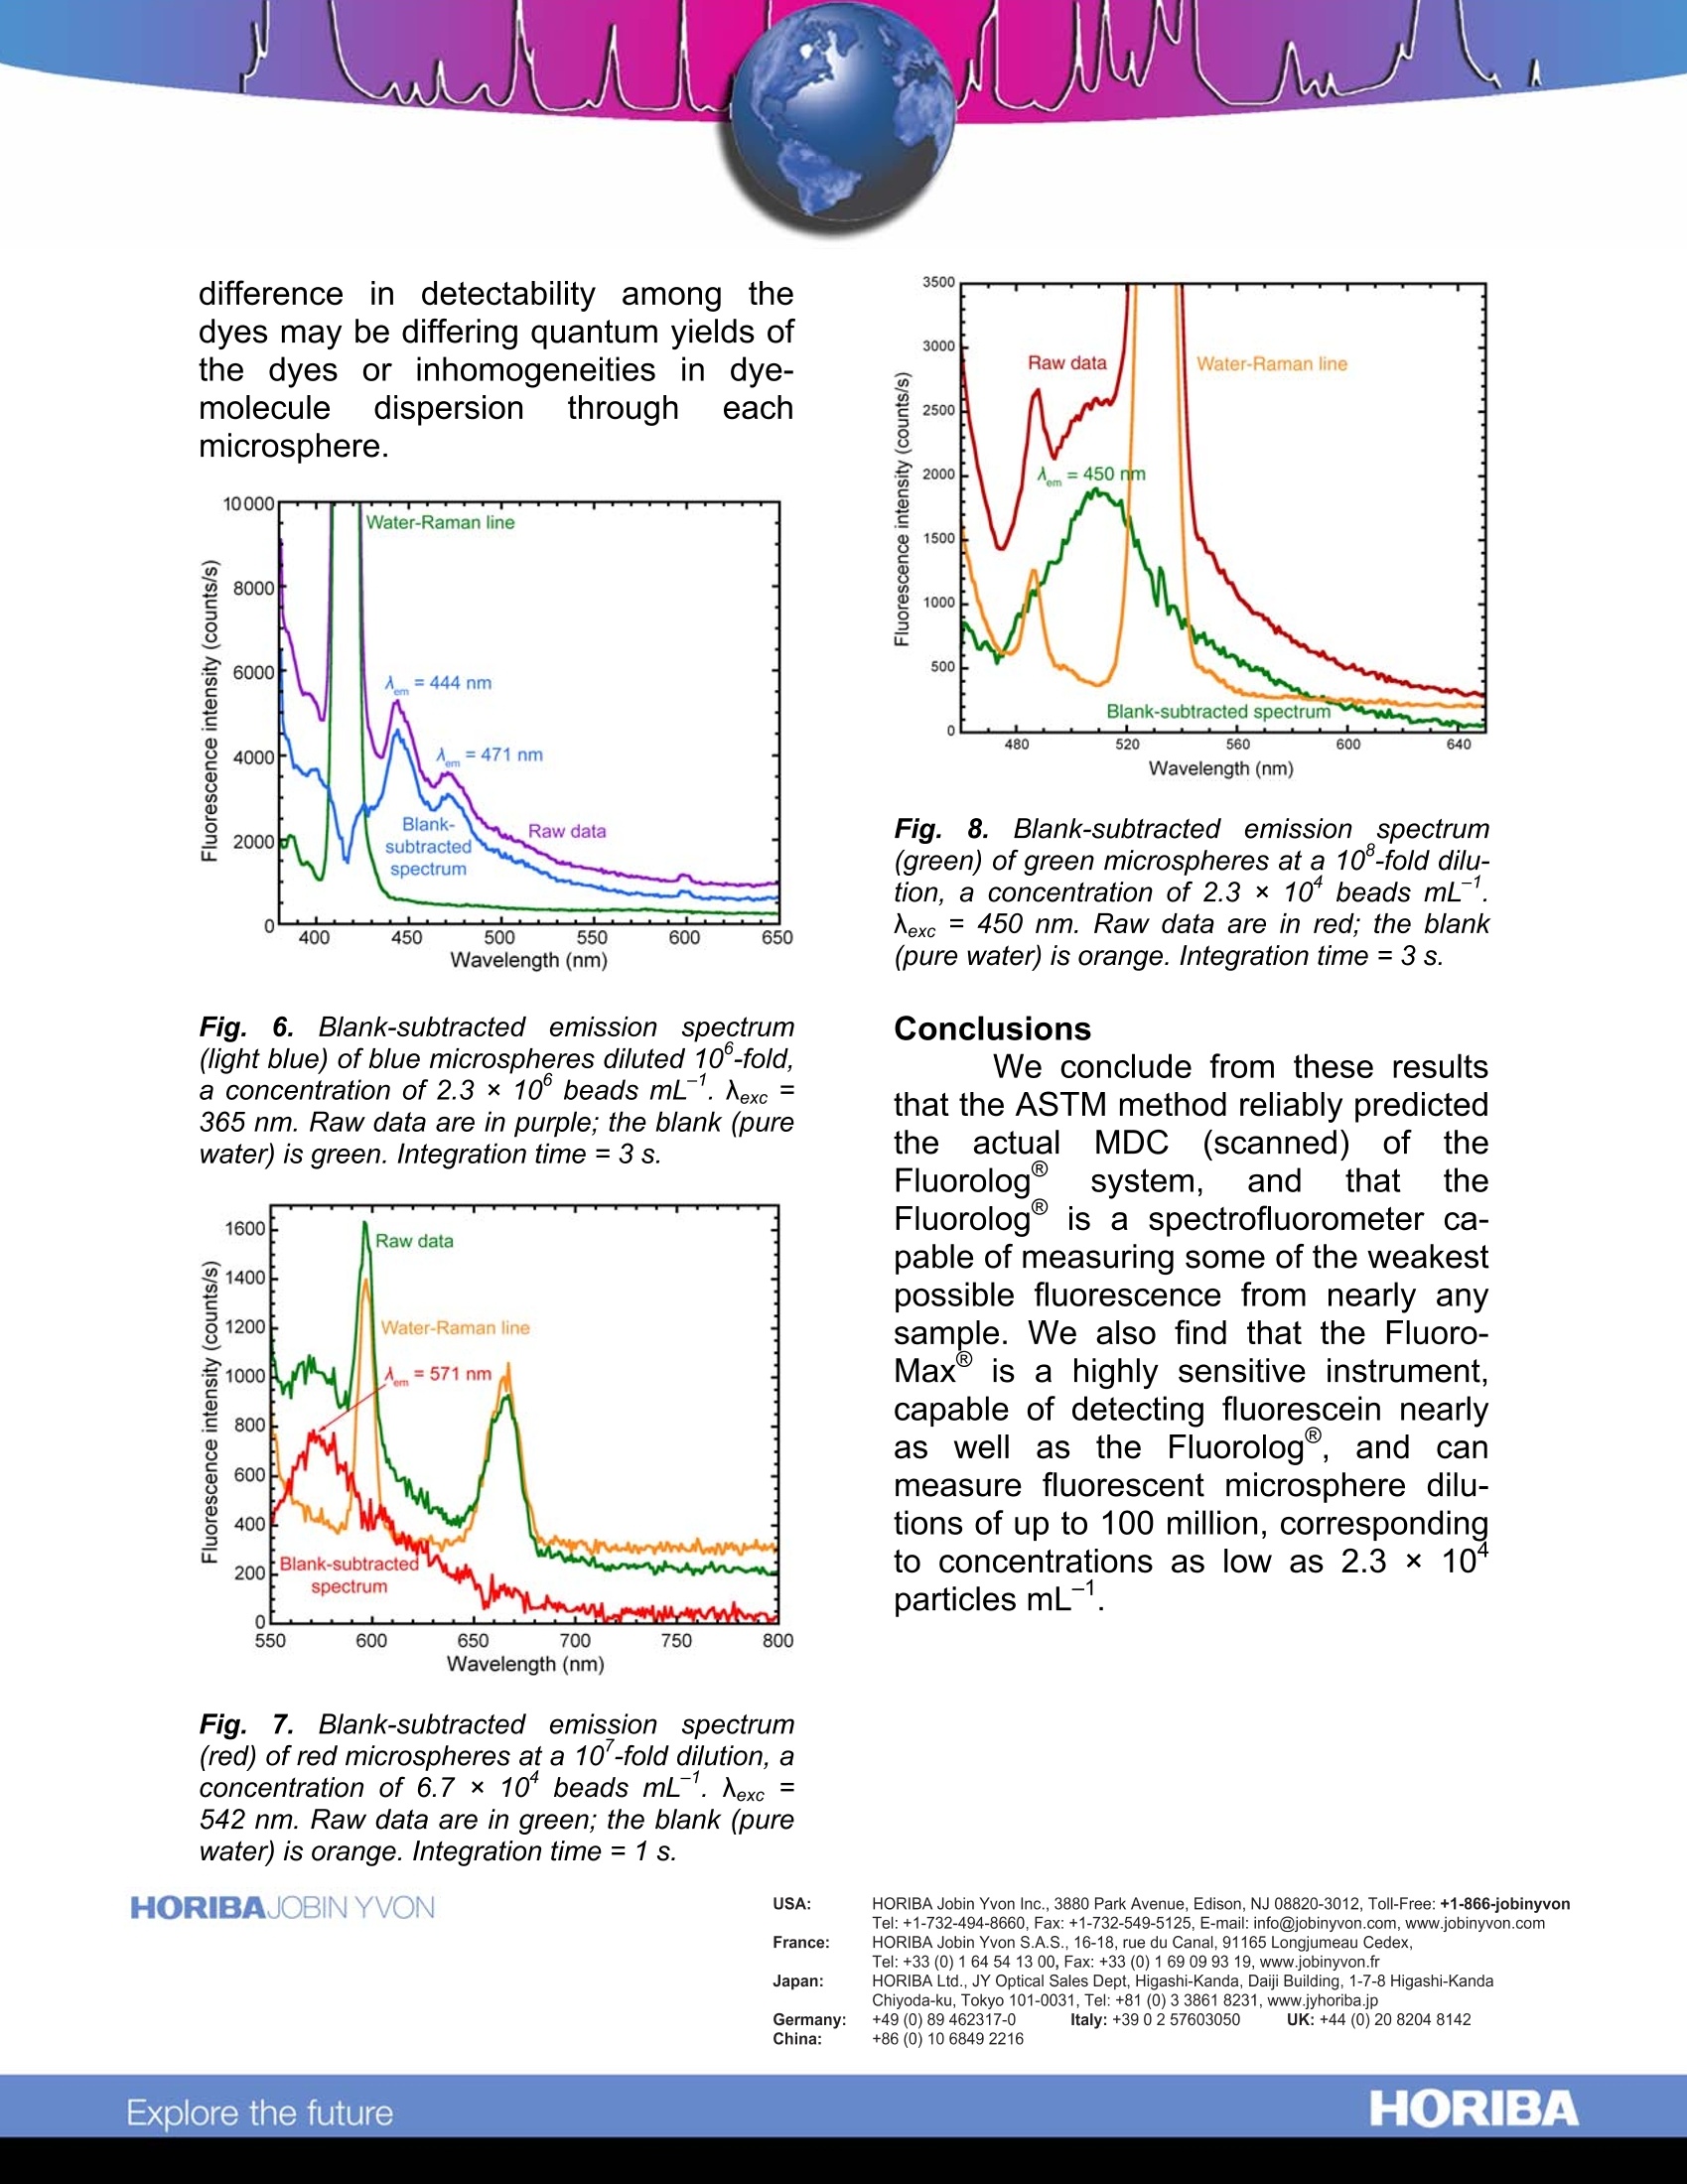
We conclude from these results that the ASTM method reliably predicted the actual MDC (scanned) of the Fluorolog® system, and that the Fluorolog® is a spectrofluorometer capable of measuring some of theweakest possible fluorescence from nearly any sample. We also find that the FluoroMax is a highly sensitive instrument, capable of detecting fluorescein nearly as well as the Fluorolog, and can measure fluorescent microsphere dilutions of up to 100 million, corresponding to concentrations as low as 2.3×10⁴ particles mL-1.
方案详情

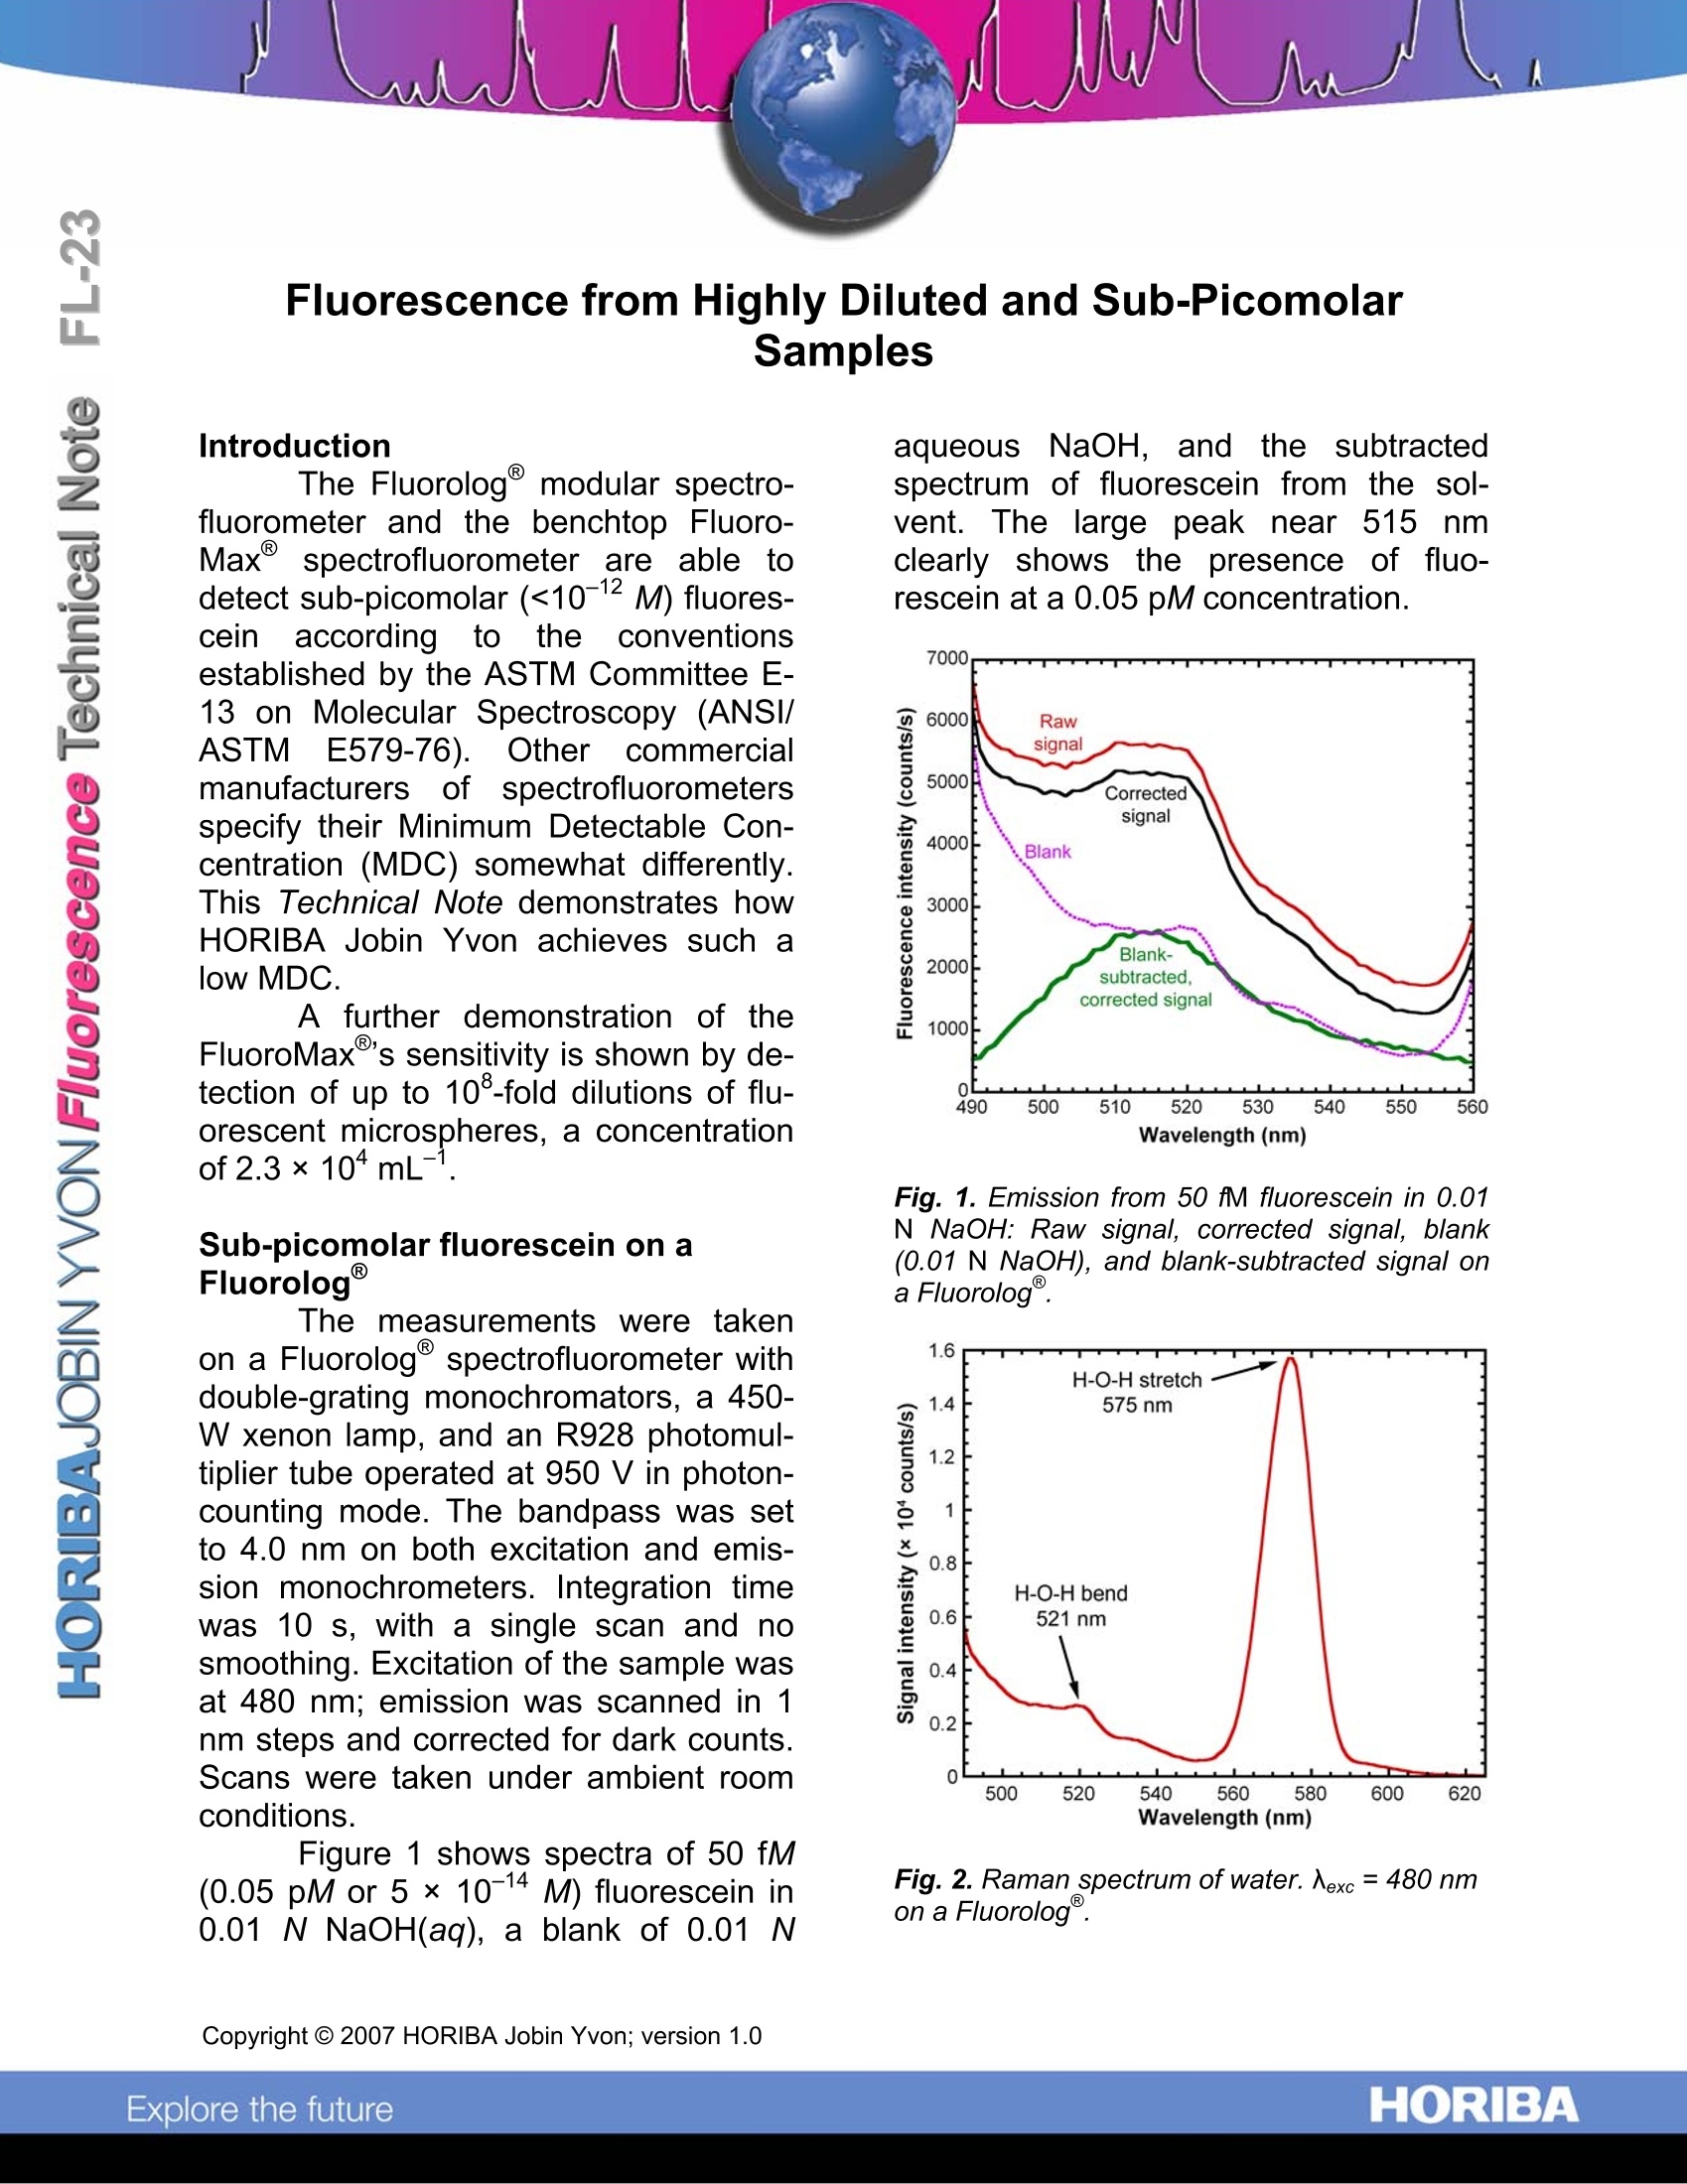
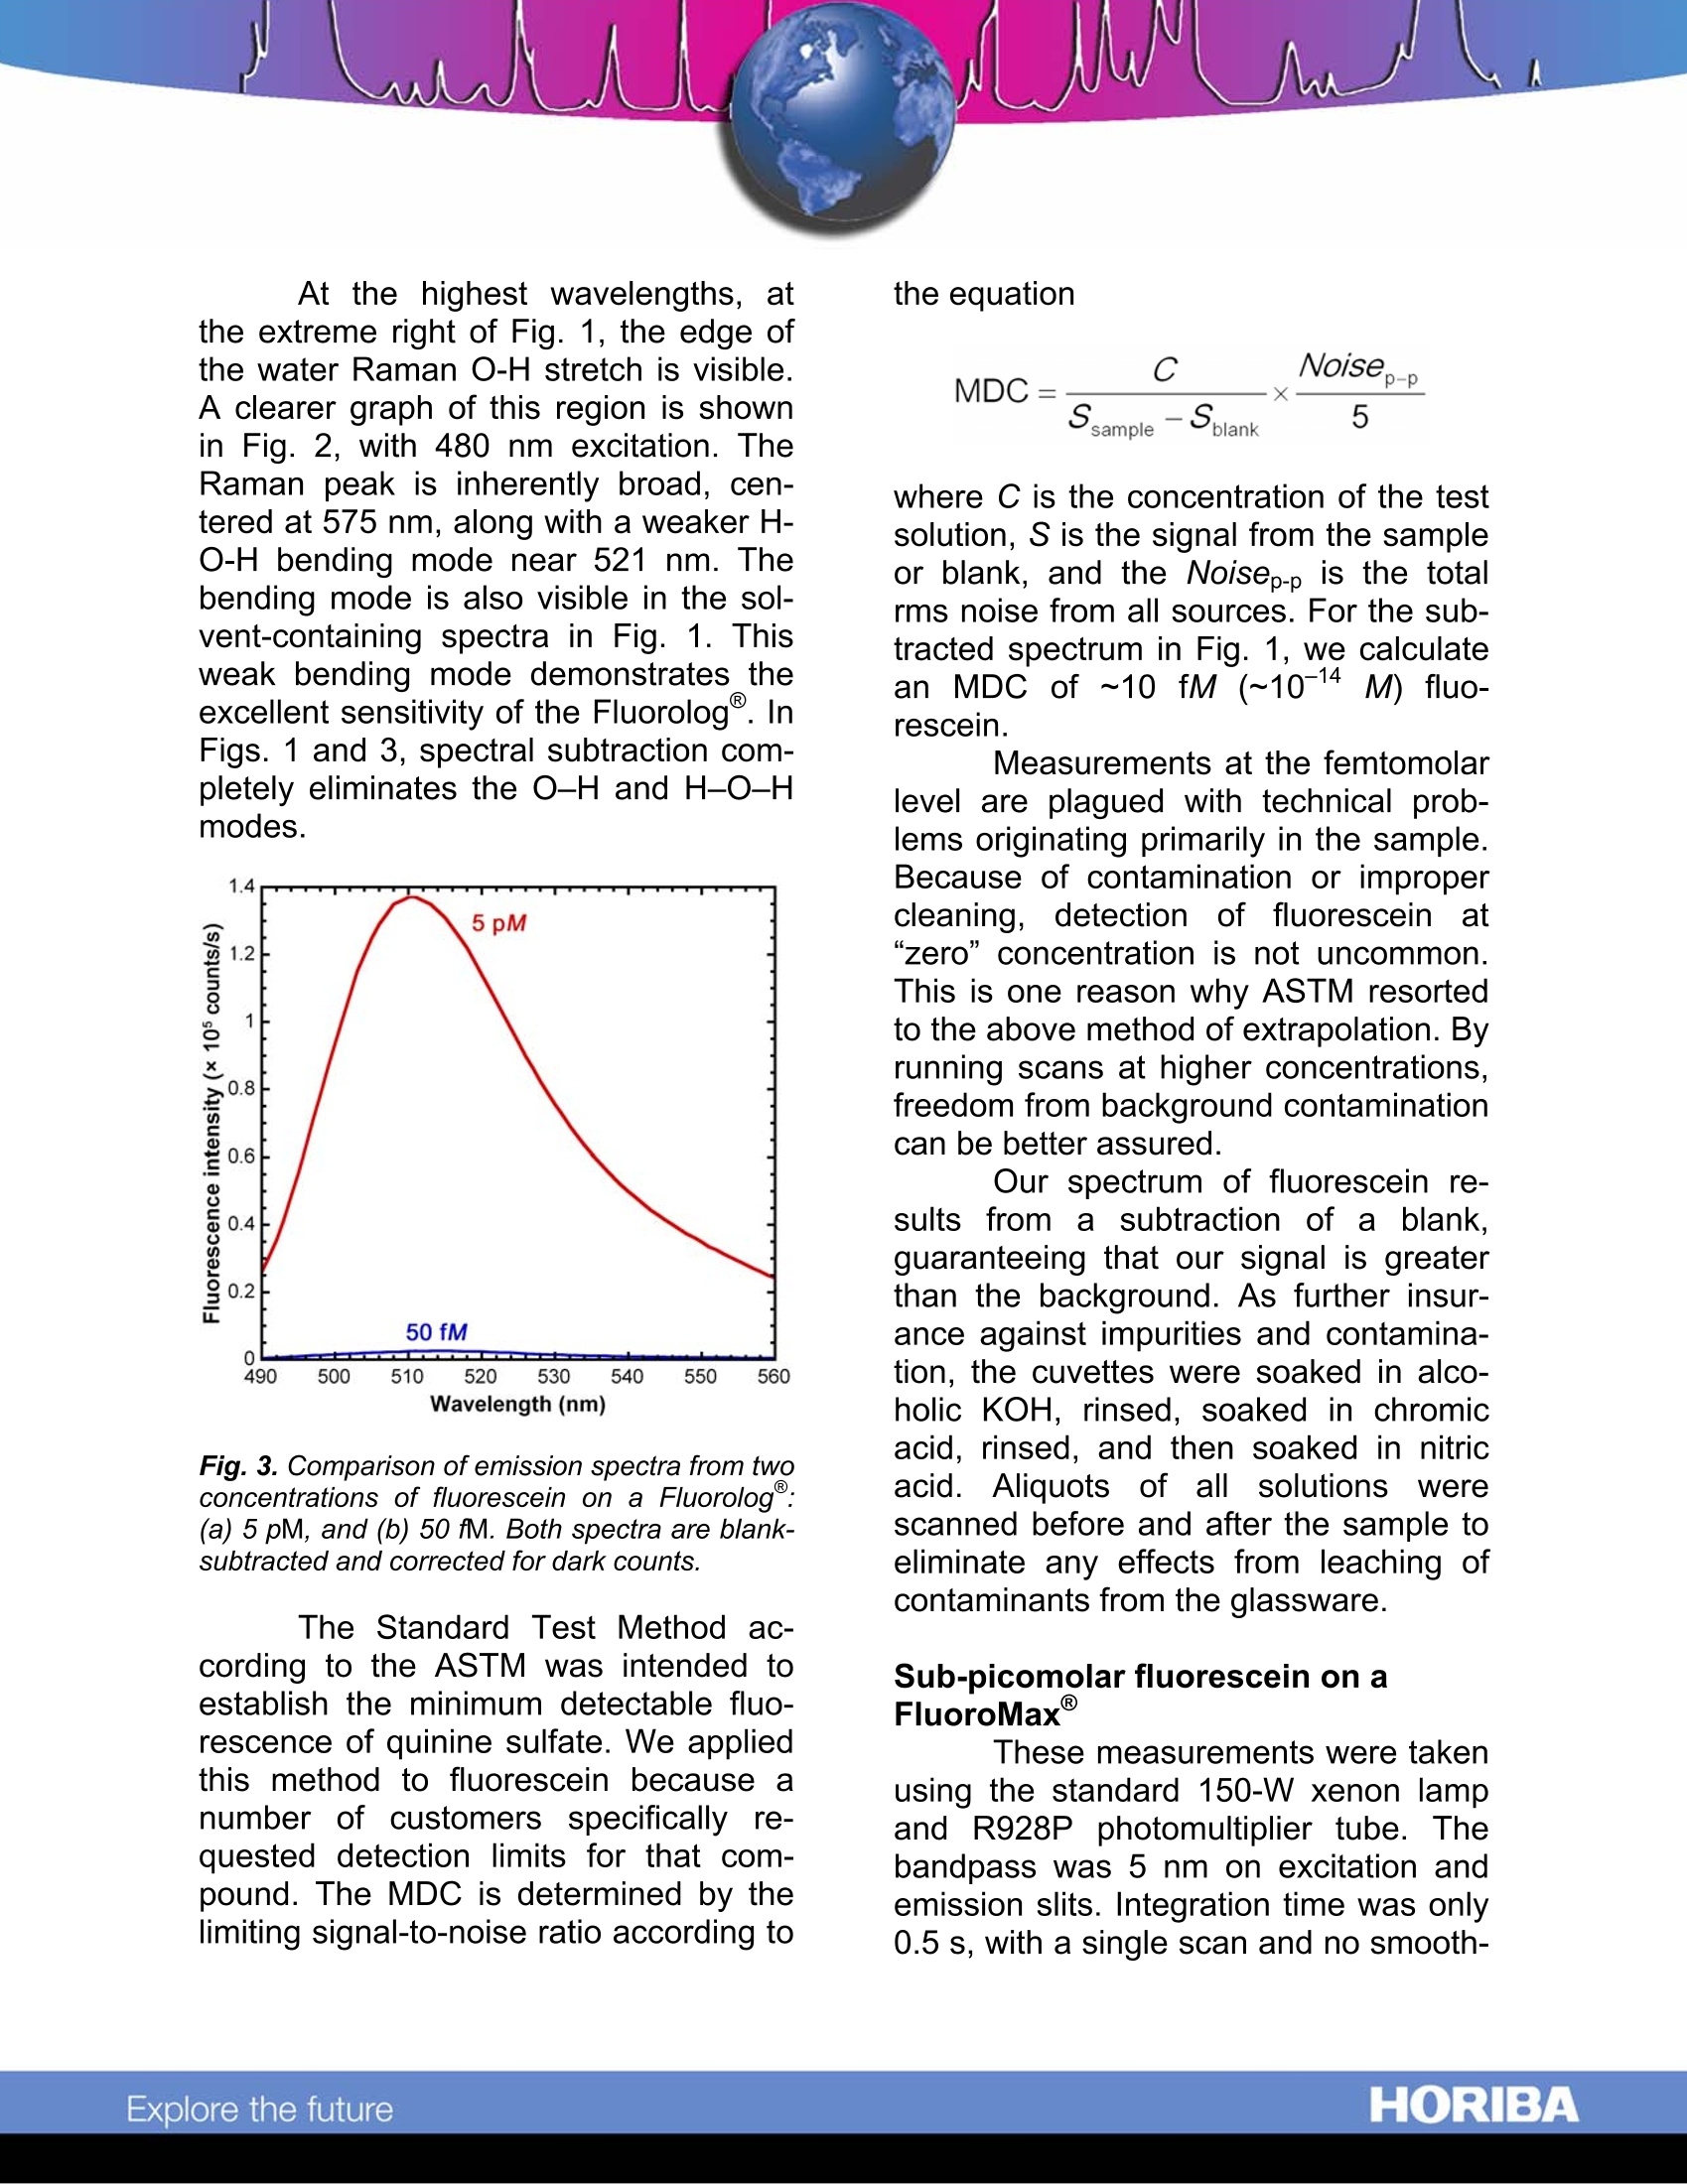
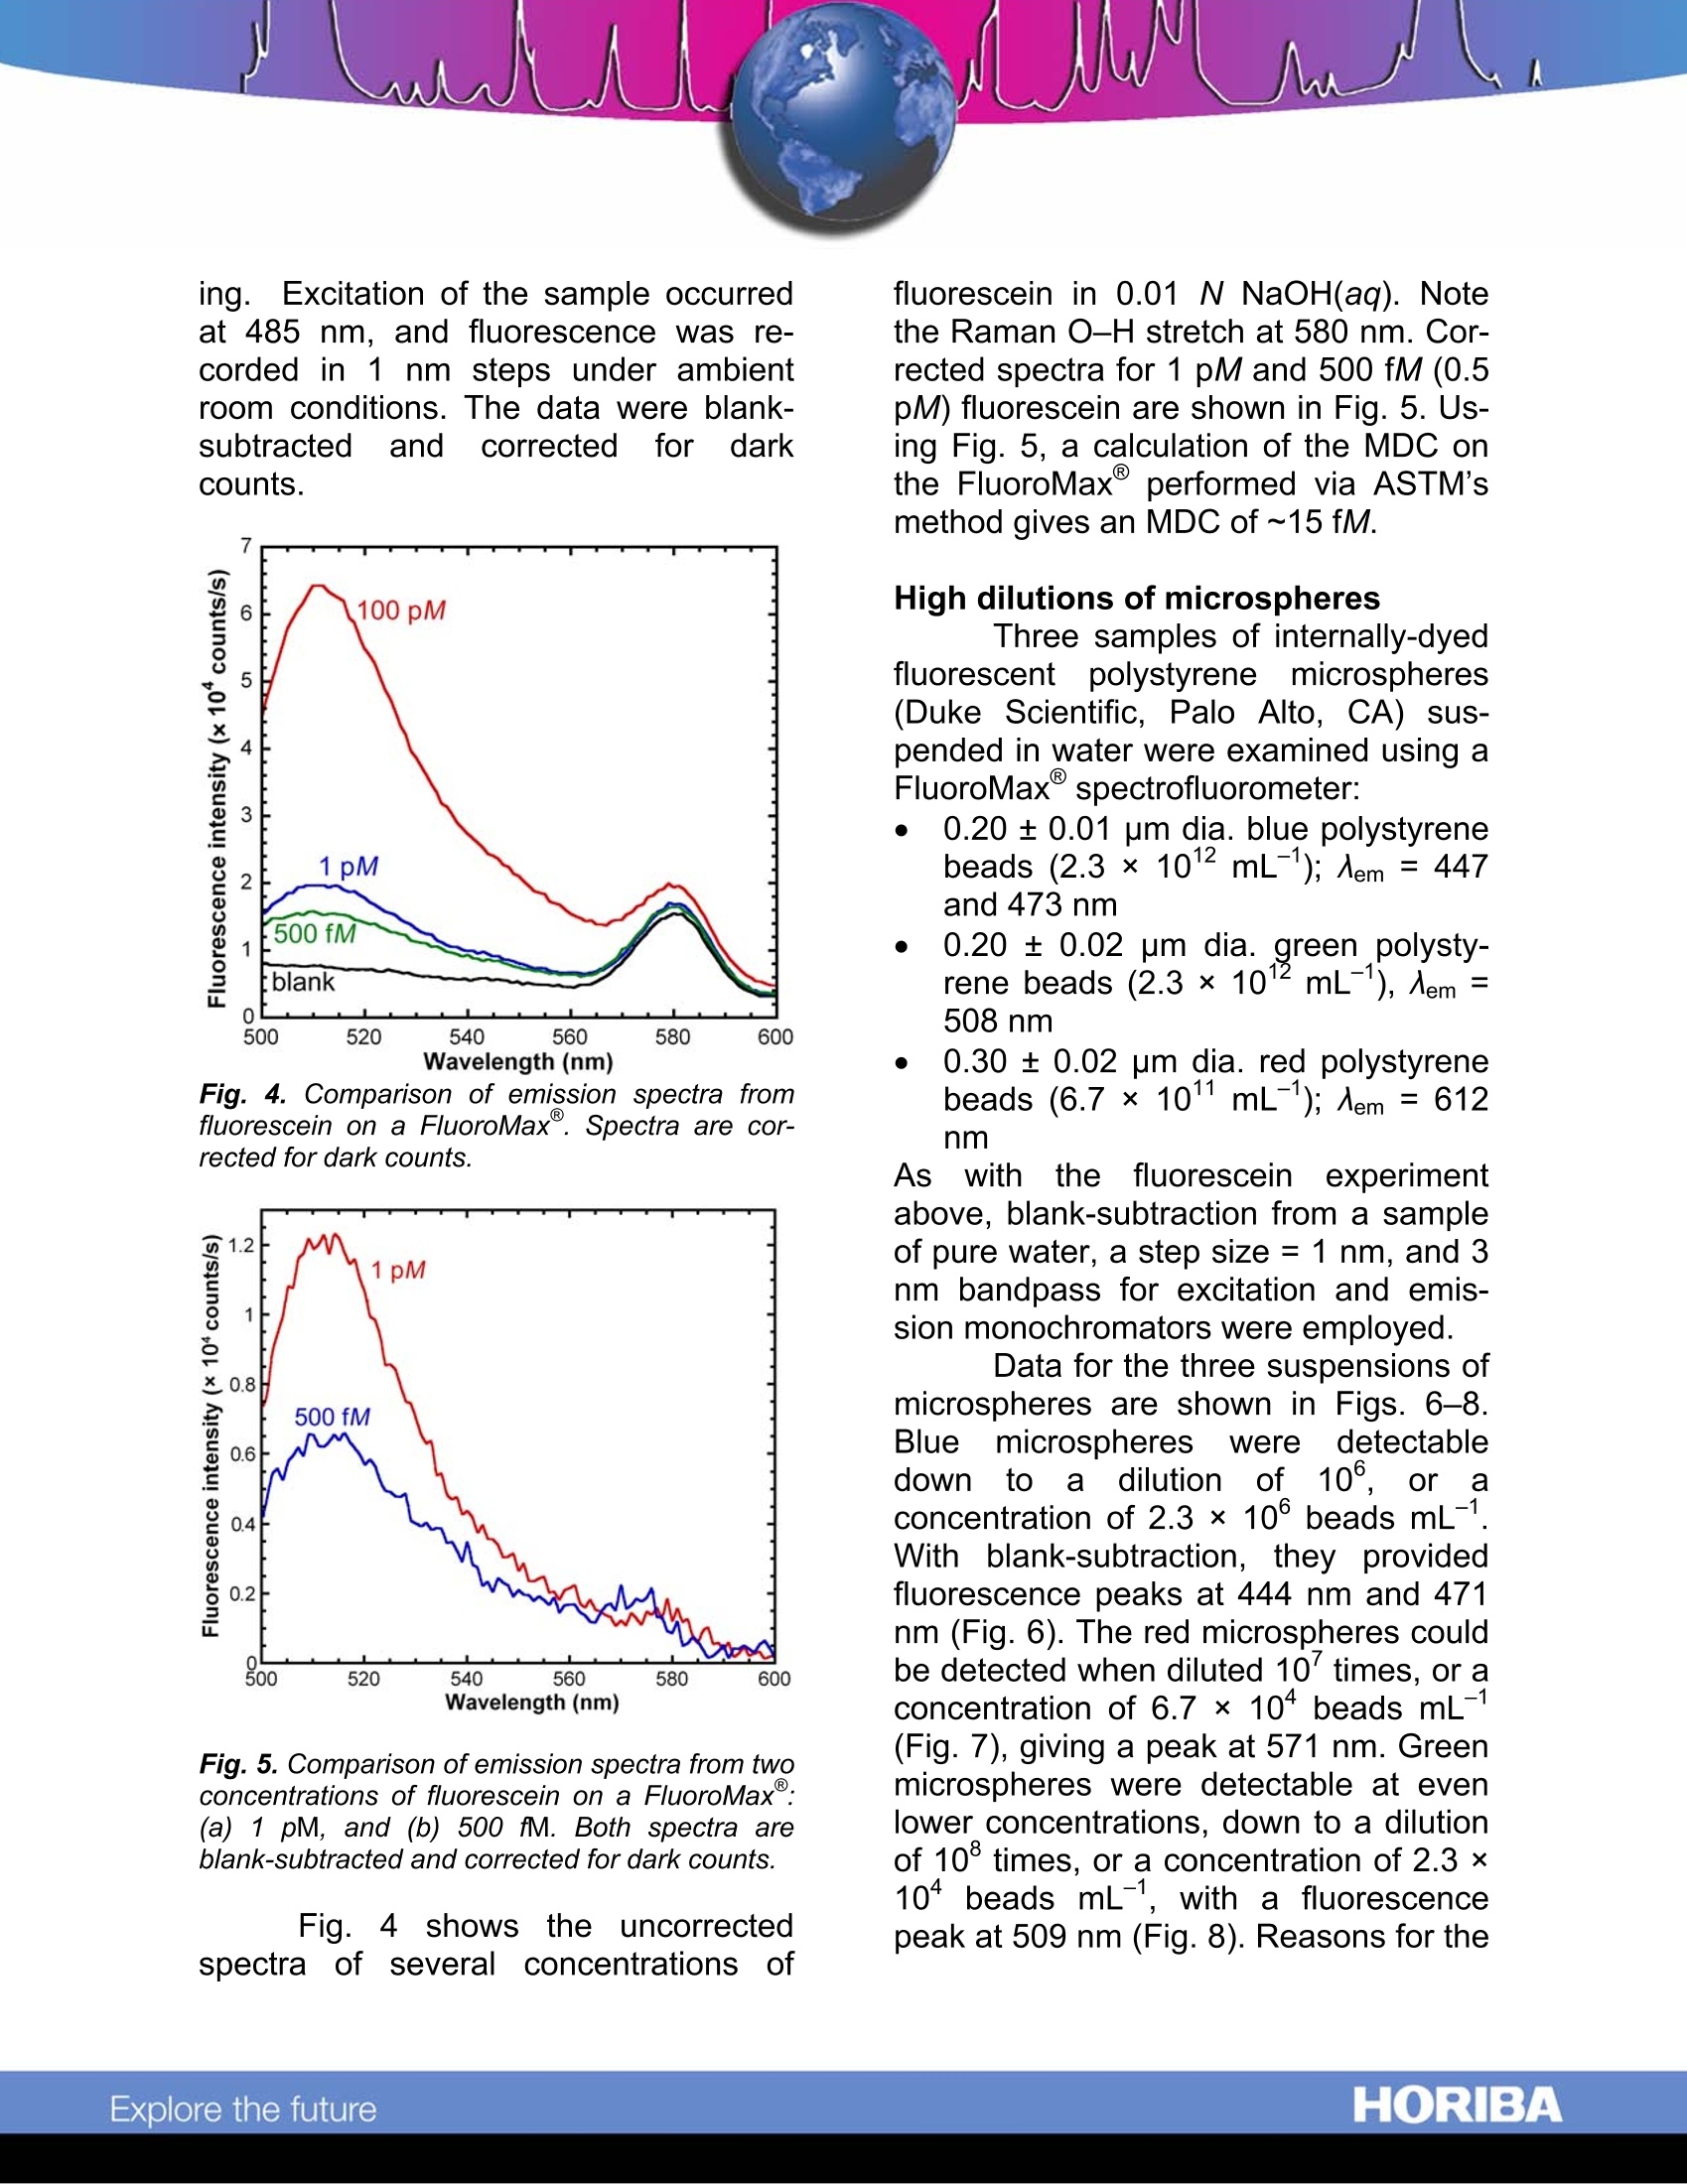
Fluorescence from Highly Diluted and Sub-PicomolarSamples Introduction The Fluorolog@ modular spectro-fluorometer and the benchtop Fluoro-Max spectrofluorometer are able todetect sub-picomolar (<10-12M) fluores-ceinaccording tothe conventionsestablished by the ASTM Committee E-13 on Molecular Spectroscopy (ANSI/ASTME579-76).GOther commercialmanufacturers ofspectrofluorometersspecify their Minimum Detectable Con-centration (MDC) somewhat differently.This Technical Note demonstrates howHORIBA Jobin Yvon achieves such alow MDC. A further demonstration of theFluoroMax@s sensitivity is shown by de-tection of up to 10-fold dilutions of flu-orescent microspheres, a concentrationof 2.3×10⁴mL-1. Sub-picomolar fluorescein on aFluorolog@ The measurements were takenona Fluorolog@ spectrofluorometer withdouble-grating monochromators, a 450-W xenon lamp, and an R928 photomul-tiplier tube operated at 950 V in photon-counting mode. The bandpass was setto 4.0 nm on both excitation and emis-sion monochrometers. Integration timewas10 s, with a single scan and nosmoothing. Excitation of the sample wasat 480 nm; emission was scanned in 1nm steps and corrected for dark counts.Scans were taken under ambient roomconditions. Figure 1 shows spectra of 50 fM(0.05 pM or 5×10-14 M) fluorescein in0.01 N NaOH(aq),a blank of 0.01N aqueousNaOH, and the subtractedspectrum of fluorescein from the sol-vent.The large peak( nearr515 nmclearly shows the presence of fluo-rescein at a 0.05 pM concentration. Fig. 1. Emission from 50 fM fluorescein in 0.01N NaOH: Raw signal, corrected signal, blank(0.01 N NaOH), and blank-subtracted signal ona Fluorolog Fig. 2. Raman spectrum of water. 入exc=480 nmon a Fluorolog. At the highest wavelengths, atthe extreme right of Fig. 1, the edge ofthe water Raman O-H stretch is visible.A clearer graph of this region is shownin Fig. 2, with 480 nm excitation. TheRaman peak is inherently broad, cen-tered at 575 nm, along with a weaker H-O-H bending mode near 521 nm. Thebending mode is also visible in the sol-vent-containing spectra in Fig. 1. Thisweak bending mode demonstrates theexcellent sensitivity of the Fluorolog@. InFigs. 1 and 3, spectral subtraction com-pletely eliminates the O-H and H-O-Hmodes. Fig.3. Comparison of emission spectra from twoconcentrations of fluorescein on a Fluorolog:(a) 5 pM, and (b) 50 fM. Both spectra are blank-subtracted and corrected for dark counts. The Standard Test Method ac-cording to the ASTM was intended toestablish the minimum detectable fluo-rescence of quinine sulfate. We appliedthis method to fluorescein because anumber of customers specifically re-quested detection limits for that com-pound. The MDC is determined by thelimiting signal-to-noise ratio according to the equation where C is the concentration of the testsolution, S is the signal from the sampleor blank, and the Noisep-p is the totalrms noise from all sources. For the sub-tracted spectrum in Fig. 1, we calculatean MDC of ~10 fM (~10-14M) fluo-rescein. Measurements at the femtomolarlevel are plagued with technical prob-lems originating primarily in the sample.Because of contamination or impropercleaning, detection of fluorescein at“zero”concentration is not uncommon.This is one reason why ASTM resortedto the above method of extrapolation. Byrunning scans at higher concentrations,freedom from background contaminationcan be better assured. Our spectrum of fluorescein re-sults from a subtraction of a blank.guaranteeing that our signal is greaterthan the background. As further insur-ance against impurities and contamina-tion, the cuvettes were soaked in alco-holic KOH, rinsed, soaked in chromicacid, rinsed, and then soaked in nitricacid. Aliquots of all solutionsSwerescanned before and after the sample toeliminate any effects from leaching ofcontaminants from the glassware. Sub-picomolar fluorescein on aFluoroMax These measurements were takenusing the standard 150-W xenon lampand R928P photomultiplier tube. Thebandpass was 5 nm on excitation andemission slits. Integration time was only0.5 s, with a single scan and no smooth- ing. Excitation of the sample occurredat 485 nm, and fluorescence was re-corded in 1 nm steps under ambientroom conditions. The data were blank-subtractedand corrected fordarkcounts. Fig.4. Comparison of emission spectra fromfluorescein on a FluoroMax. Spectra are cor-rected for dark counts. Fig. 5. Comparison of emission spectra from twoconcentrations of fluorescein on a FluoroMax:(a) 1 pM, and (b) 500 fM. Both spectra areblank-subtracted and corrected for dark counts. Fig.4shows tthe uncorrectedspectra of several concentrations of fluorescein in 0.01 N NaOH(aq). Notethe Raman O-H stretch at 580 nm. Cor-rected spectra for 1 pM and 500 fM (0.5pM) fluorescein are shown in Fig. 5. Us-ing Fig. 5, a calculation of the MDC onthe FluoroMax performed via ASTM’smethod gives an MDC of~15 fM. High dilutions of microspheres Three samples of internally-dyedfluorescent polystyrene microspheres(Duke Scientific, Palo Alto, CA) sus-pended in water were examined using aFluoroMaxspectrofluorometer: 0.20 ±0.01 pm dia. blue polystyrenebeads (2.3×10¹² mL-1); Aem = 447and 473 nm 0.20 ±0.02 pm dia. green polysty-rene beads (2.3×10¹²mL-1), Aem=508 nm 0.30±0.02 pm dia. red polystyrenebeads (6.7×10"mL-1); Aem = 612nm Aswithitthe fluorescein experimentabove, blank-subtraction from a sampleof pure water, a step size = 1 nm, and 3nm bandpass for excitation and emis-sion monochromators were employed. Data for the three suspensions ofmicrospheres are shown in Figs. 6-8.Blue microspheresweredetectabledown to a dilution of 10, oraconcentration of 2.3×10° beads mL-1.With blank-subtraction, they providedfluorescence peaks at 444 nm and 471nm (Fig. 6). The red microspheres couldbe detected when diluted 10'times, or aconcentration of 6.7× 10⁴ beads mL-1(Fig. 7), giving a peak at 571 nm. Greenmicrospheres were detectable at evenlower concentrations, down to a dilutionof 10 times, or a concentration of 2.3 ×10 beads mL-1, with a fluorescencepeak at 509 nm (Fig. 8). Reasons for the difference in detectability among thedyes may be differing quantum yields ofthe dyes or inhomogeneities in dye-moleculeCdispersion through eachmicrosphere. Fig. 6. Blank-subtractedemission spectrum(light blue) of blue microspheres diluted 10°-fold,a concentration of 2.3×10°beads mL.入exc=365 nm. Raw data are in purple; the blank (purewater) is green. Integration time=3 s. Fig. 7. Blank-subtracted emission spectrum(red) of red microspheres at a 10'-fold dilution, aconcentration of 6.7 ×10beads mL-1. Xexc=542 nm. Raw data are in green; the blank (purewater) is orange. Integration time=1 s. Fig. 8. .Blank-subtracted emission spectrum(green) of green microspheres at a 10°-fold dilu-tion, a concentration of 2.3 ×10 beads mL-.Nexc = 450 nm. Raw data are in red; the blank(pure water) is orange. Integration time=3 s. Conclusions We conclude from these resultsthat the ASTM method reliably predictedthe actualMDC (scanned) oftheFluorolog@ system,andthat theFluorologeis a spectrofluorometer ca-pable of measuring some of the weakestpossible fluorescence from nearly anypo:sample. We also find that the Fluoro-Max is a highly sensitive instrument,capable of detecting fluorescein nearlyass well as tthe Fluorolog@, and canmeasure fluorescent microsphere dilu-tions of up to 100 million, correspondingto concentrations as low as 2.3×10“particles mL. Copyright C HORIBA Jobin Yvon; version .HORIBAExplore the future HORIBAExplore the future We conclude from these results that the ASTM method reliably predicted the actual MDC (scanned) of the Fluorolog® system, and that the Fluorolog® is a spectrofluorometer capable of measuring some of theweakest possible fluorescence from nearly any sample. We also find that the FluoroMax is a highly sensitive instrument, capable of detecting fluorescein nearly as well as the Fluorolog, and can measure fluorescent microsphere dilutions of up to 100 million, corresponding to concentrations as low as 2.3×10⁴ particles mL-1.
确定
还剩2页未读,是否继续阅读?

产品配置单

HORIBA(中国)为您提供《染料中荧光素检测方案(分子荧光光谱)》,该方案主要用于染料中荧光素检测,参考标准--,《染料中荧光素检测方案(分子荧光光谱)》用到的仪器有HORIBA高灵敏一体式FluoroMax-4荧光光谱仪
推荐专场
相关方案
更多
该厂商其他方案
更多