


方案详情
文
The application of Raman spectroscopy to online monitoring of chemical products has been described. The important functions of the system that are specific to such analysis have been highlighted.
Recent developments in the field of detectors, laser sources and software have made such analysers more compact and reliable, as well as easy-to-use. For an important number of industrial processes, Raman spectroscopy has become the analytical tool of choice for on-line applications.
方案详情

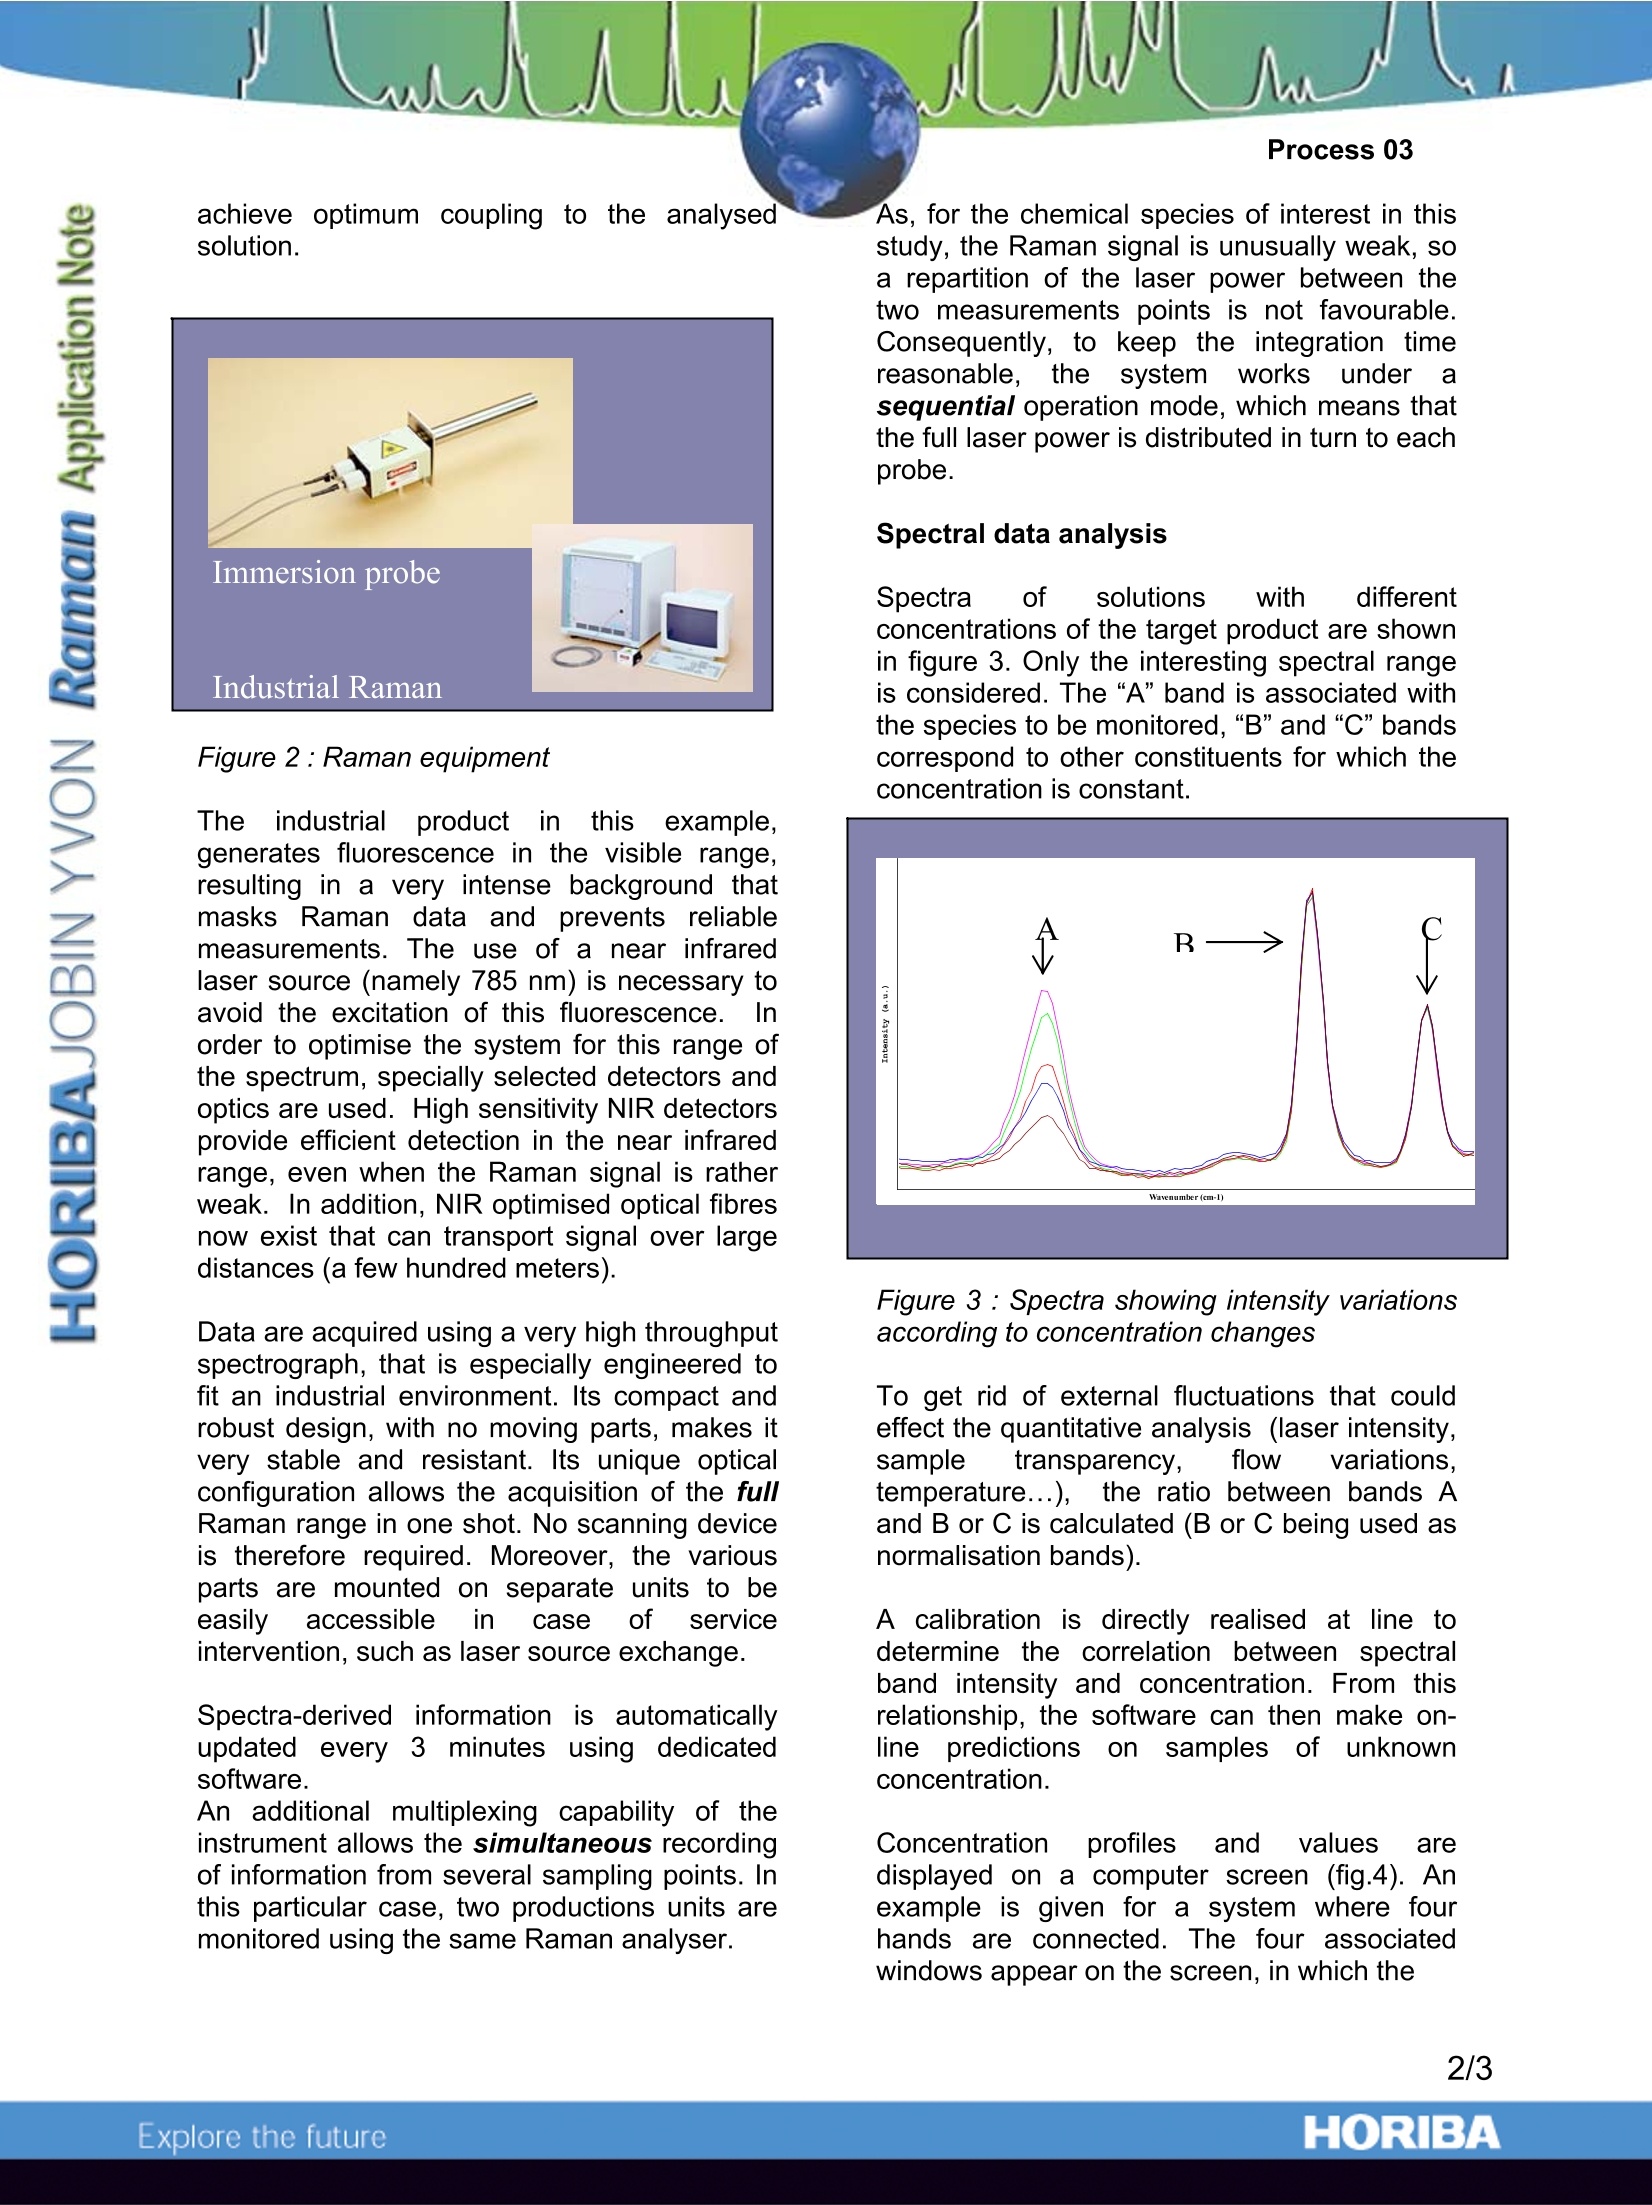
Process 03 New advances in on-line monitoring of chemical products Introduction In industrial processes, performance dependson the abilitytoidetectandcounteractproblems in the process rapidly. A wide range of on-line analysis techniquesexist that can be used for a reliable monitoringof manufacturing conditions. Among them,spectroscopicc methodsiaare continuinggttodevelop in order to provide non-invasive andnon-destructive real-time analysis. Ramanspectroscopy is one of them. It can give directaccess to the concentrations of the monitoredproduct which allows efficient tuning of theprocess. In this note, an industrial application, whichconcerns the real-time monitoring of chemicalproducts,isdescribed. To adapt to theindustrial environment, the Raman equipmentrequires specific features that will be reviewed. Goal of the analysis The identity of the chemical product can not berevealed for confidentiality reasons. Howeverthe purpose of coupling Raman spectroscopyto the manufacturing unit is the following. Thisproduct “x” is one of the constituents of acomplex chemical product, and has to beneutralised at a further step of the process.The product “y"used for neutralising it is highlytoxic and therefore, only the right amountshould be added to the original mixture.Deriving the concentration of“x”consequentlyallows a proper dosage and avoids further re-treatments. which would otherwise benecessary. If a Raman probe is not used, a differentmethod of analysis has to be used to estimatethe concentration.However. itrequiressamplingj oftheproduct2andmanualintervention for chemical dosage which make itrather inconvenient and expensive. For thisreason, such analyses are done twice a day. On the other hand, implementation of ;acontinuous, on-line Raman method provides updated information within seconds or minutesof any changes in the product. The operatortherefore has access to a detailed history ofproduction that helps himto optimise theprocess conditions. Experimental set-up Plant installation A remote Raman probe is directly installed atthe production plant (fig.1). Figure 1 : Experimental set up at the plant This probe is coupled via optical fibres to aspectral analyser (fig.2) installed in a pilot roomlocated about 200 m from the sampling point. The bypass device (fig.1) involves a pump forfeeding purposes and a filtering stage to get ridof impurities that would otherwise generatefluorescence. After filtering, the mixture enters a container inwhich the flow slows down to avoid emulsions.lndeed, too much turbulence can cause signallOss. The immersion package with which the probeis equipped (fig.2) is made in such a way thatthe sampling optic can be selected in order to achieve optimum coupling to the analysedsolution. Figure 2:Raman equipment Theeindustrial productin thisexample,generates fluorescence in the visible range,resulting in a very intense background thatmasks Raman data and prevents reliablemeasurements. The use of a near infraredlaser source (namely 785 nm) is necessary toavoid the excitation of this fluorescence. Inorder to optimise the system for this range ofthe spectrum, specially selected detectors andoptics are used. High sensitivity NIR detectorsprovide efficient detection in the near infraredrange, even when the Raman signal is ratherweak. In addition, NIR optimised optical fibresnow exist that can transport signal over largedistances (a few hundred meters). Data are acquired using a very high throughputspectrograph, that is especially engineered tofit an industrial environment. Its compact androbust design, with no moving parts, makes itvery stable and resistant. Its unique opticalconfiguration allows the acquisition of the fullRaman range in one shot. No scanning deviceis therefore required. Moreover, the variousparts are mounted on separate units to beeasilyaccessible in case ofSserviceintervention, such as laser source exchange. Spectra-derivedinformationiiss automaticallyupdated every33 minutesusing dedicatedsoftware. An additional multiplexing capability of theinstrument allows the simultaneous recordingof information from several sampling points. Inthis particular case, two productions units aremonitored using the same Raman analyser. As, for the chemical species of interest in thisstudy, the Raman signal is unusually weak, soa repartition of the laser power between thetwo measurements points is not favourable.Consequently, to keep the integration timereasonable, the systemworkssunderasequential operation mode, which means thatthe full laser power is distributed in turn to eachprobe. Spectral data analysis Spectra of solutions with differentconcentrations of the target product are shownin figure 3. Only the interesting spectral rangeis considered. The“A” band is associated withthe species to be monitored,“B”and“C”bandscorrespond to other constituents for which theconcentration is constant. Figure 3 : Spectra showing intensity variationsaccording to concentration changes To get rid of external fluctuations that couldeffect the quantitative analysis (laser intensity,sample transparency, flow variations.temperature...),,tthe ratio between bands Aand B or C is calculated (B or C being used asnormalisation bands). A calibration is directly realised at line todetermine the correlation between spectralband intensity and concentration. From thisrelationship, the software can then make on-line predictionson samples(ofunknowmconcentration. Concentration profiles and values aredisplayed on a computer screen (fig.4). Anexample is given for a system where fourhands are connected. The four associatedwindows appear on the screen, in which the four spectra are simultaneously displayed. Ineach spectrum, one can select by means ofcursors the Raman bands associated with the components which one wishes to be quantified.The resulting intensity or concentration profilesCan1be plottedbelowaccounting for theevolution of the process. The user can pre-define output values that aredisplayed on the right side of the screen andthat are calculated from the intensity values ofthe pre-selected Raman bands. Figure 4: Example of IndSpec software displaywhen four measurements points areconsidered. Concentration profiles and valuesare automatically calculated and displayed onthe screen, as shown on the left upper cornerfor one of the spectrum. The spectra and derived concentration dataare stored in a spreadsheet format from whichevolution diagrams can be plotted. Simultaneously, data is transferred to the unitpilot board, for example via a digital/analogueconverter that releases 4-20 mA electronicsignals. These quantitative data must lie withina well definedinterval to attest of the goodquality of the product. When out of the rangevalues occur, this results in the activation ofalarms that reveal problems in the process.This enables faster detection and operatorintervention when problems do occur. lf ttrhemonitored productsIS; at thedifferentsampling pointsare not similar,. differentcalibration functions can be entered into the software so that each specific component isanalysed and quantified separately. Because offtthe engineering concept,implementation, and automation of such recentRaman systems, the operator no longer needsto be familiar with spectroscopic techniques.He has direct access to the information ofinterest. which are in this exampleconcentration values. Summary The application of Raman spectroscopy to on-line monitoring of chemical products has beendescribed. The important functions of thesystem that are specific to such analysis have CINDSPEC F区 been highlighted. Recent developments in the field of detectors,laser sources and software have made suchanalysers more compact and reliable, as wellas easy-to-use. For an important number ofindustrial processes, Raman spectroscopy hasbecome the analytical tool of choice for on-lineapplications. France: HORIBA Jobin Yvon S.A.S., 231 rue de Lille, 59650 Villeneuve d'Ascq. Tel:+33 (0)3 20 59 18 00, ( Fax:+33 (0)3 20 59 18 08. Email : raman@jobinyvon.fr www.jobinyvon.fr USA: HORIBA Jobin Yvon In c ., 3880 P a rk Avenue, Edison, NJ 08820-3012. Tel:+1-732-494-8660, ) ( Fax:+1-732-549-2571. Email : raman@jobinyvon.com www.jobinyvon.com Japan : HORIBA Ltd., JY Optical Sales Dept., 1-7-8 Higashi-kanda, Chiyoda-ku, Tokyo 101-0031. T el: + 81 (0)3 3861 8231,Fax:+81 (0)3 3 8 61 8259. E m ail: raman@horiba.com ) R:248080 8204 8142Germany: +49 (0) 6251 8475-0 Italy: +39 02 57603050China: +86(0)106849 2216 ORIBAExplore the future ORIBAExplore the future The application of Raman spectroscopy to online monitoring of chemical products has been described. The important functions of the system that are specific to such analysis have been highlighted.Recent developments in the field of detectors, laser sources and software have made such analysers more compact and reliable, as well as easy-to-use. For an important number of industrial processes, Raman spectroscopy has become the analytical tool of choice for on-line applications.
确定


还剩1页未读,是否继续阅读?

HORIBA(中国)为您提供《化学制品中在线监控检测方案(激光拉曼光谱)》,该方案主要用于其他中在线监控检测,参考标准--,《化学制品中在线监控检测方案(激光拉曼光谱)》用到的仪器有
相关方案
更多
该厂商其他方案
更多