


方案详情
文
This application report shows that the ICP-AES is a suitable technique for the analysis of dialysis samples. The accuracy for the major elements can be improved by using Yttrium as internal standard. Dilution is not necessary because of the argon humidifier, sheath gas and the large internal diameter of the injector available. Because of these three features, solutions with very high level of salts can be run with ease.
方案详情

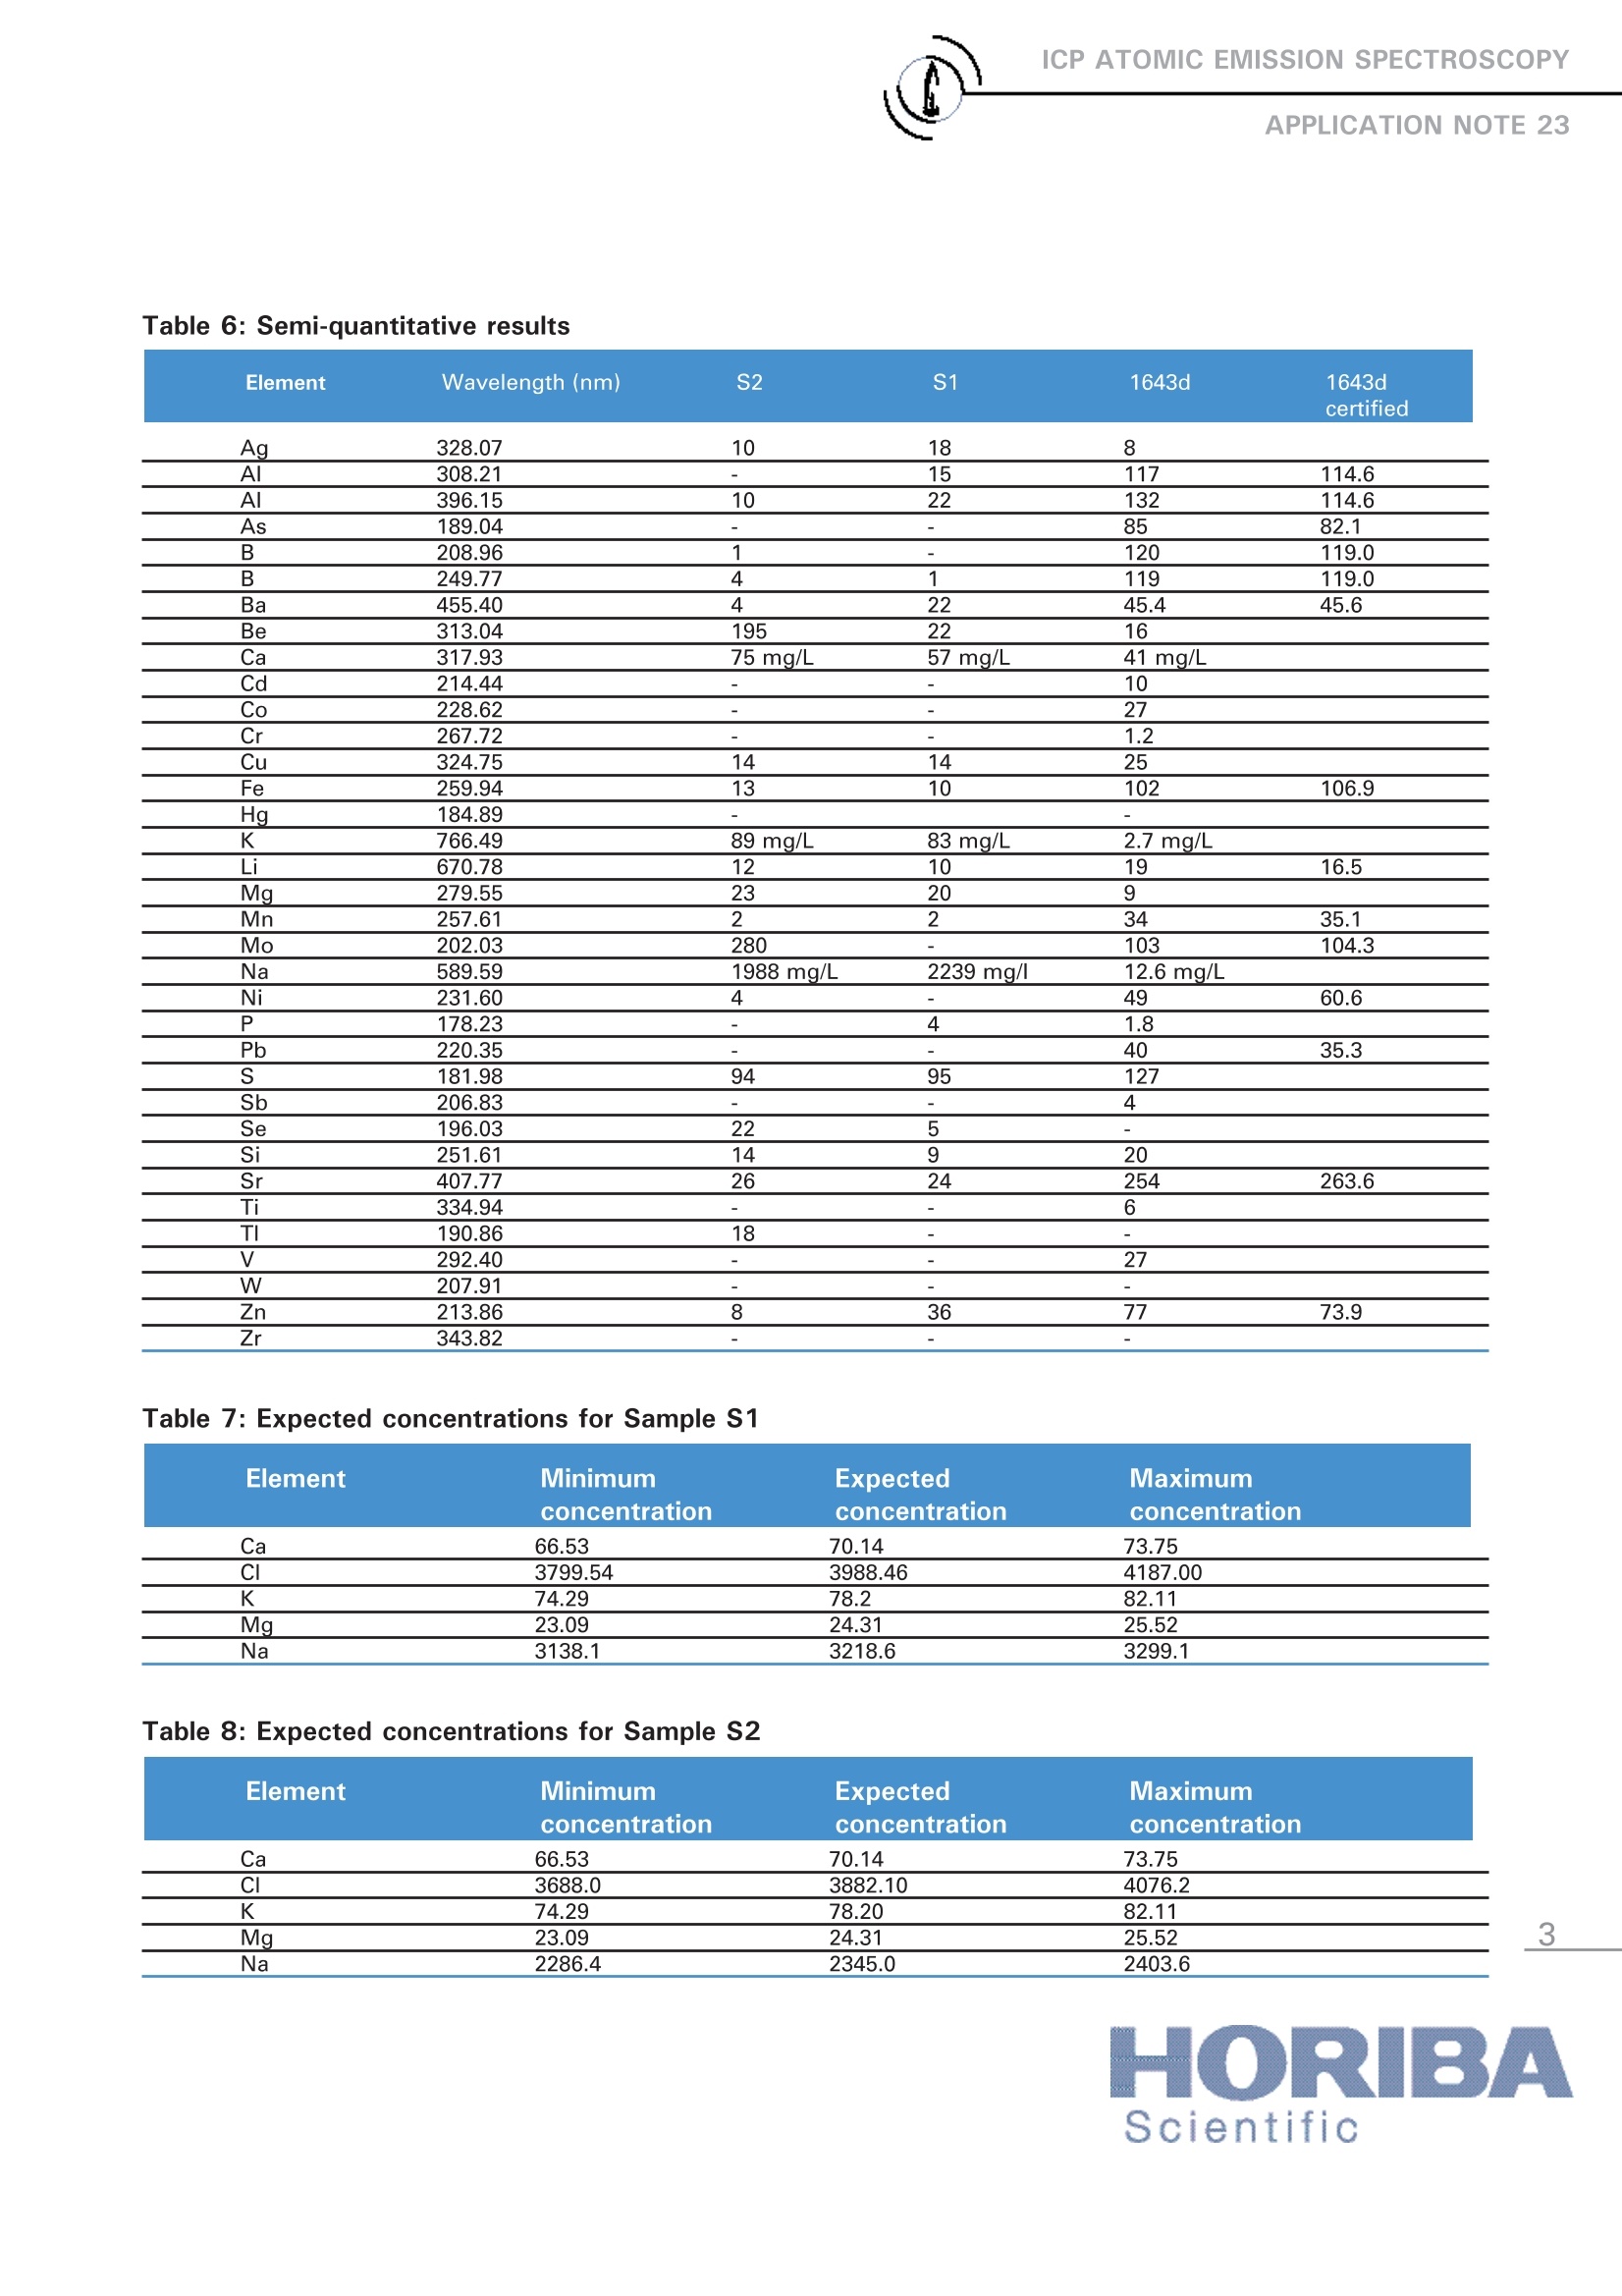
ICP ATOMIC EMISSION SPECTROSCOPY ICP ATOMIC EMISSION SPECTROSCOPYAPPLICATION NOTE 23 1 Introduction Dialysis is a method of removing toxic sub-stances (impuritities or wastes) from the bloodwhen the kidneys are unable to do so. ICP-AESis particularly suitable to measure the dialysissolutions for the high accuracy analysis of Na,K, Ca, Mg and Cl. This Application Note pres-ents the preparation and analysis results of twodialysis samples. 2 Principle 2.1 Technique used The elemental analysis of these samples wasundertaken by Inductively Coupled PlasmaAtomic Emission Spectrometry (ICP-AES). Thesample is nebulized then transferred to anargon plasma. It is decomposed, atomized andionized whereby the atoms and ions are excited.We measure the intensity of the light emittedwhen the atoms or ions return to lower levels ofenergy. Each element emits light at characteris-tic wavelengths and these lines can be used forquantitative analysis after a calibration. 2.2 Wavelength choice The choice of the wavelength in a given matrixcan be made using the "profile"function, or byusing Win-IMAGE, which is rapid semi-quantita-tive analysis mode using multiple wavelengths.The principle is the same in either case: recordthe scans of analytes at low concentration, andof the matrix. By superimposing the spectra, wesee possible interferences. 3 Sample preparation Two dialysis samples were analyzed, labeled S1and S2. These samples contain K, Ca, and Mg inthe chloride form. In sample S1, Na is present asa mixture of chloride and acetate. It is at a totalconcentration of 140 mmol/L, with the acetatecompound concentration of 35 mmol/L. In S2, the Na is present as the chlorideand is at a con-centration of 102 mmol/L. As the level of acetate is considered as negligi-ble, a solution of NaCl 6 g/L (105 mmoles/L) wasprepared to matrix match the standards. Fourstandards for K, Ca and Mg were prepared with250 ml of the Na solution and using 1,000 mg/LSpexCertiPrep Standards. Four standards werealso prepared for Na and Cl at concentrations of5, 6, 7 and 8.2 g/L of NaCl. 4. Instrument specification The work in this Application Note was undertak-en on a JY 2000. The specifications of thisinstrument are listed in Tables 1 and 2. Table 1: Specification of spectrometer Parameters Specifications Mounting Czerny Turner Focal length 0.64 m Nitrogen purge Yes Variable resolution Yes Grating number of grooves 2400 gr/mm 0.016 nm Table 2: Specification of RF Generator Parameters Specifications Type of generator Solid state Observation Radial Frequency 40.68 MHz Control of gas flowrate by computer Control of pump flow by computer Cooling air 5 Operating conditions Two series of analyses were made. The first was adirect analysis, without dilution and the secondwas with a 1:10 dilution using deionized water.The operating conditions are listed in Table 3below. Table 3: Operating conditions Parameter No dilution Dilution RF Generator power 1400 W 1400 W Plasma gas flowrate 13 L/min 13 L/min Auxiliary gas flowrate 0.4 L/min 0 L/min Sheath gas flowrate 0.35 L/min 0.2 L/min Nebulizer gas flowrate 0.67 L/min 0.67 L/min Nebulizer flowrate 2.8 bars (41 psi) 2.8 bars(41 psi) Sample uptake 1 mL/min 1mL/min Type of nebulizer Concentric Concentric Type of spray chamber Cyclonic Cyclonic Argon humidifier Yes Yes Injector tube diameter 3.0mm 3.0 mm 6 Wavelength selection and analyti-cal conditions The line with the highest sensitivity was used foranalysis of each element, as there were no prob-lems with interferences. The analysis conditionswere the same for all elements. Table 4: Analytical conditions Element Slits Analysis Integration (pm) mode time (sec) All elements 20x15 Gaussian 2 Table 5: Background correction Element Wavelength (nm) Background correction (nm) Ca 317.933 0.0325 CI 725.665 0.0233 K 769.898 0.0372 Mg_ 279.806 0.0349 Na 588.995 0.0381 7 Discussion 7.1 Semi-quantitative analysis The semi-quantitative method allows for the deter-mination of 36 elements in less than three min-utes. Background correction is used for each ele-ment to compensate for background shifts causedby matrix or acidity differences. Table 6 on the fol-lowing page gives the result, expressed in pg/L(except where indicated) obtained for the semi-quantitative analysis and for a certified sample(NBS1643d). An alternative to the semi-quantitative method isan option called Win-IMAGE, which offers fullspectrum acquisition within 2 minutes. Full spec-trum acquisition gives the capability to undertakea semi-quantitative analysis, to perform retrospec-tive analysis and to use multiple wavelengths foran analysis of an element to improve accuracy. 7.2 Results The two samples were measured three times eachwith three replicates for each measurement, bothdirectly and with a dilution of 1:10. The results arepresented in Tables 7 to 12, with the concentra-tions given in mg/l and the RSD in%. The Cl was not measured in the diluted samplesbecause the 725 nm Cl line was not sufficientlysensitive. In the diluted samples, the far UV optionwould be necessary to measure the CI at the 134nm line. This is the most sensitive line for Cl andgives an LOD < 1000 ppb on the JY 2000, and<200ppb for the ULTIMA. Table 6: Semi-quantitative results Table 7: Expected concentrations for Sample S1 Element Minimum Expected Maximum concentration concentration concentration Ca 66.53 70.14 73.75 CI 3799.54 3988.46 4187.00 K 74.29 78.2 82.11 Mg 23.09 24.31 25.52 Na 3138.1 3218.6 3299.1 Table 8: Expected concentrations for Sample S2 Element Minimum Expected Maximum concentration concentration concentration Ca 66.53 70.14 73.75 CI 3688.0 3882.10 4076.2 K 74.29 78.20 82.11 Mg 23.09 24.31 25.52 Na 2286.4 2345.0 2403.6 Element Measure 1 Measure 2 Measure 3 Mean RSD Conc. RSD Conc. RSD Conc. RSD Conc. (%) Ca 70.47 0.40 71.31 0.90 71.55 0.70 71.11 0.80 CI 3930.93 2.50 32974.53 2.30 3953.56 1.80 3932.30 1.05 K 78.24 1.50 78.42 0.80 78.23 1.40 78.30 0.15 Mg 23.05 0.90 22.94 1.40 23.05 1.10 23.02 0.30 Na 3193.78 1.10 3149.56 1.10 3142.61 0.50 3161.98 0.90 Table 10: Results for Sample S2, no dilution Element Measure 1 Measure 2 Measure 3 Mean RSD Conc. RSD Conc. RSD Conc. RSD Conc. (%) Ca 71.37 0.80 71.61 0.90 70.82 0.65 71.27 0.55 CI 4060.49 2.10 3910.38 1.20 3926.32 1.20 3925.73 2.00 K 80.92 0.60 79.91 1.20 80.62 0.45 80.48 0.65 Mg 23.03 0.90 23.23 0.70 23.21 0.60 23.16 0.50 Na 2287.94 0.15 2290.47 1.10 2349.15 0.90 2309.19 1.50 Table 11: Results for Sample S1, with dilution Element Measure 1 Conc. RSD Measure 2 Measure 3 Mean RSD Conc. RSD Conc. RSD Conc. (%) Ca 70.91 0.35 71.00 0.50 71.15 0.65 71.02 0.15 K 78.90 1.20 78.30 0.45 78.80 0.85 78.67 0.40 Mg 22.81 0.90 22.26 0.30 22.32 0.80 22.46 1.30 Na 3163.09 0.95 3124.85 0.25 3183.71 0.45 3157.22 0.95 Table 12: Results for Sample S2, with dilution Element Measure 1 Measure 2 Measure 3 Mean RSD Conc. RSD Conc. RSD Conc. RSD Conc. (%) Ca 70.26 1.30 71.000 0.30 71.18 0.20 70.81 0.70 K 81.23 0.75 80.93 1.10 81.30 0.85 81.15 0.25 Mg 22.43 0.70 22.65 0.65 22.62 0.45 22.57 0.55 Na 2343.97 0.75 2390.82 0.60 2352.13 0.90 2362.31 1.05 8Summary This application report shows that the ICP-AES is asuitable technique for the analysis of dialysis sam-ples. The accuracy for the major elements can beimproved by using Yttrium as internal standard. Dilution is not necessary because of the argonhumidifier,sheath gas and the large internal diam-eter of the injector available. Because of thesethree features, solutions with very high level ofsalts can be run with ease. Scientific France: HORIBA Jobin Yvon S.A.S., 16-18 rue du Canal, 91165 Longjumeau Cedex - Tel: +33 (0)1 64 54 1300-Fax: +33 (0)1 69 09 07 21 -Email: info-sci.fr@horiba.com USA: HORIBA Jobin Yvon Inc., 3880 Park Avenue, Edison, NJ 08820-3012. Toll-free: +1-866-jobinyvon-Tel:+1-732-494-8660-Fax:+1-732-549-5125 Email: info-sci.us@horiba.com Japan: HORIBA Ltd., Scientific Instruments Sales Dept., Alte-Building Higashi-Kanda, 1-7-8 Higashi-Kanda, Chiyoda-ku, 101-0031 Tokyo -Tel:+81 (0)3 3861 8231Fax: +81 (0)3 3861 8259-Email: info-sci.jp@horiba.com VGermany: HORIBA Jobin Yvon GmbH, Hauptstrasse 1, 82008 Unterhaching- Tel: +49 (0)89 46 23 17-0-Fax: +49 (0)89 46 23 17-99-Email: info-sci.de@horiba.com Italy: HORIBA Jobin Yvon Srl, Via Cesare Pavese 35/AB, 20090 Opera (Milano)-Tel:+39 02 57 60 30 50-Fax: +39 0 2 57 60 08 76-Email: info-sci.it@horiba.com UK: HORIBA Jobin Yvon Ltd, 2 Dalston Gardens, Stanmore, Middlesex HA7 1BQ -Tel: +44 (0)20 8204 8142-Fax: +44(0)20 8204 6142-Email: info-sci.uk@horiba.com China: HORIBA Jobin Yvon SAS, Room 1801, Capital Tower No.6, Jianguomenwai Av., Chaoyang District, Beijing 100022- Tel: +86 (0)108567 9966-Fax: +86 (0)10 8567 9066 Email: info-sci.cn@horiba.com ORIBAScientific This application report shows that the ICP-AES is a suitable technique for the analysis of dialysis samples. The accuracy for the major elements can be improved by using Yttrium as internal standard. Dilution is not necessary because of the argon humidifier, sheath gas and the large internal diameter of the injector available. Because of these three features, solutions with very high level of salts can be run with ease.
确定


还剩2页未读,是否继续阅读?

产品配置单

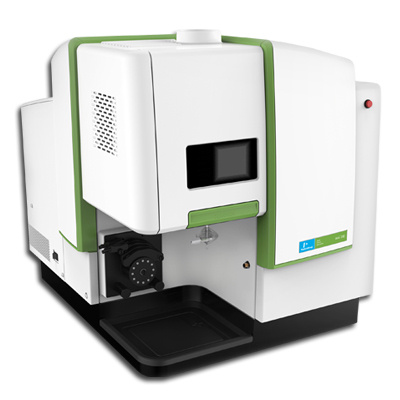
HORIBA(中国)为您提供《渗析液中元素检测方案(ICP-AES)》,该方案主要用于其他中元素检测,参考标准--,《渗析液中元素检测方案(ICP-AES)》用到的仪器有HORIBA Ultima Expert高性能ICP光谱仪
推荐专场
相关方案
更多
该厂商其他方案
更多