


方案详情
文
An experimental study of the interaction of a planar diffusion flame with a line vortex is presented. A planar
diffusion flame is established between two coflowing, equal velocity streams of acetylene diluted with nitrogen
and air. A line vortex is generated on demand by momentarily pulsing one of the flow streams by way of electromagnetic
actuation of a piston in the flow apparatus. The flame–vortex interactions are diagnosed by planar
laser-induced incandescence for soot yield and by particle image velocimetry for vortex flow characterization. The
results show that soot formation and distribution are influenced by the reactant streams from which vortices are
initiated. The vortices interacting with the flame from the air side produce more soot and soot is distributed in and
around the vortex core in diffuse layers. In contrast, topography of soot in vortices interacting from the fuel side
is such that soot is confined to thinner layers around the vortex core which does not contain any soot. The flame
curvature is found to influence the local soot production with the flame regions convex to the fuel side containing
more soot locally. It is also found that the overall soot yield is less sensitive to the vortex strength and is of lower
magnitude when vortex is spun from the fuel side. The knowledge of this type of asymmetry in soot yield in
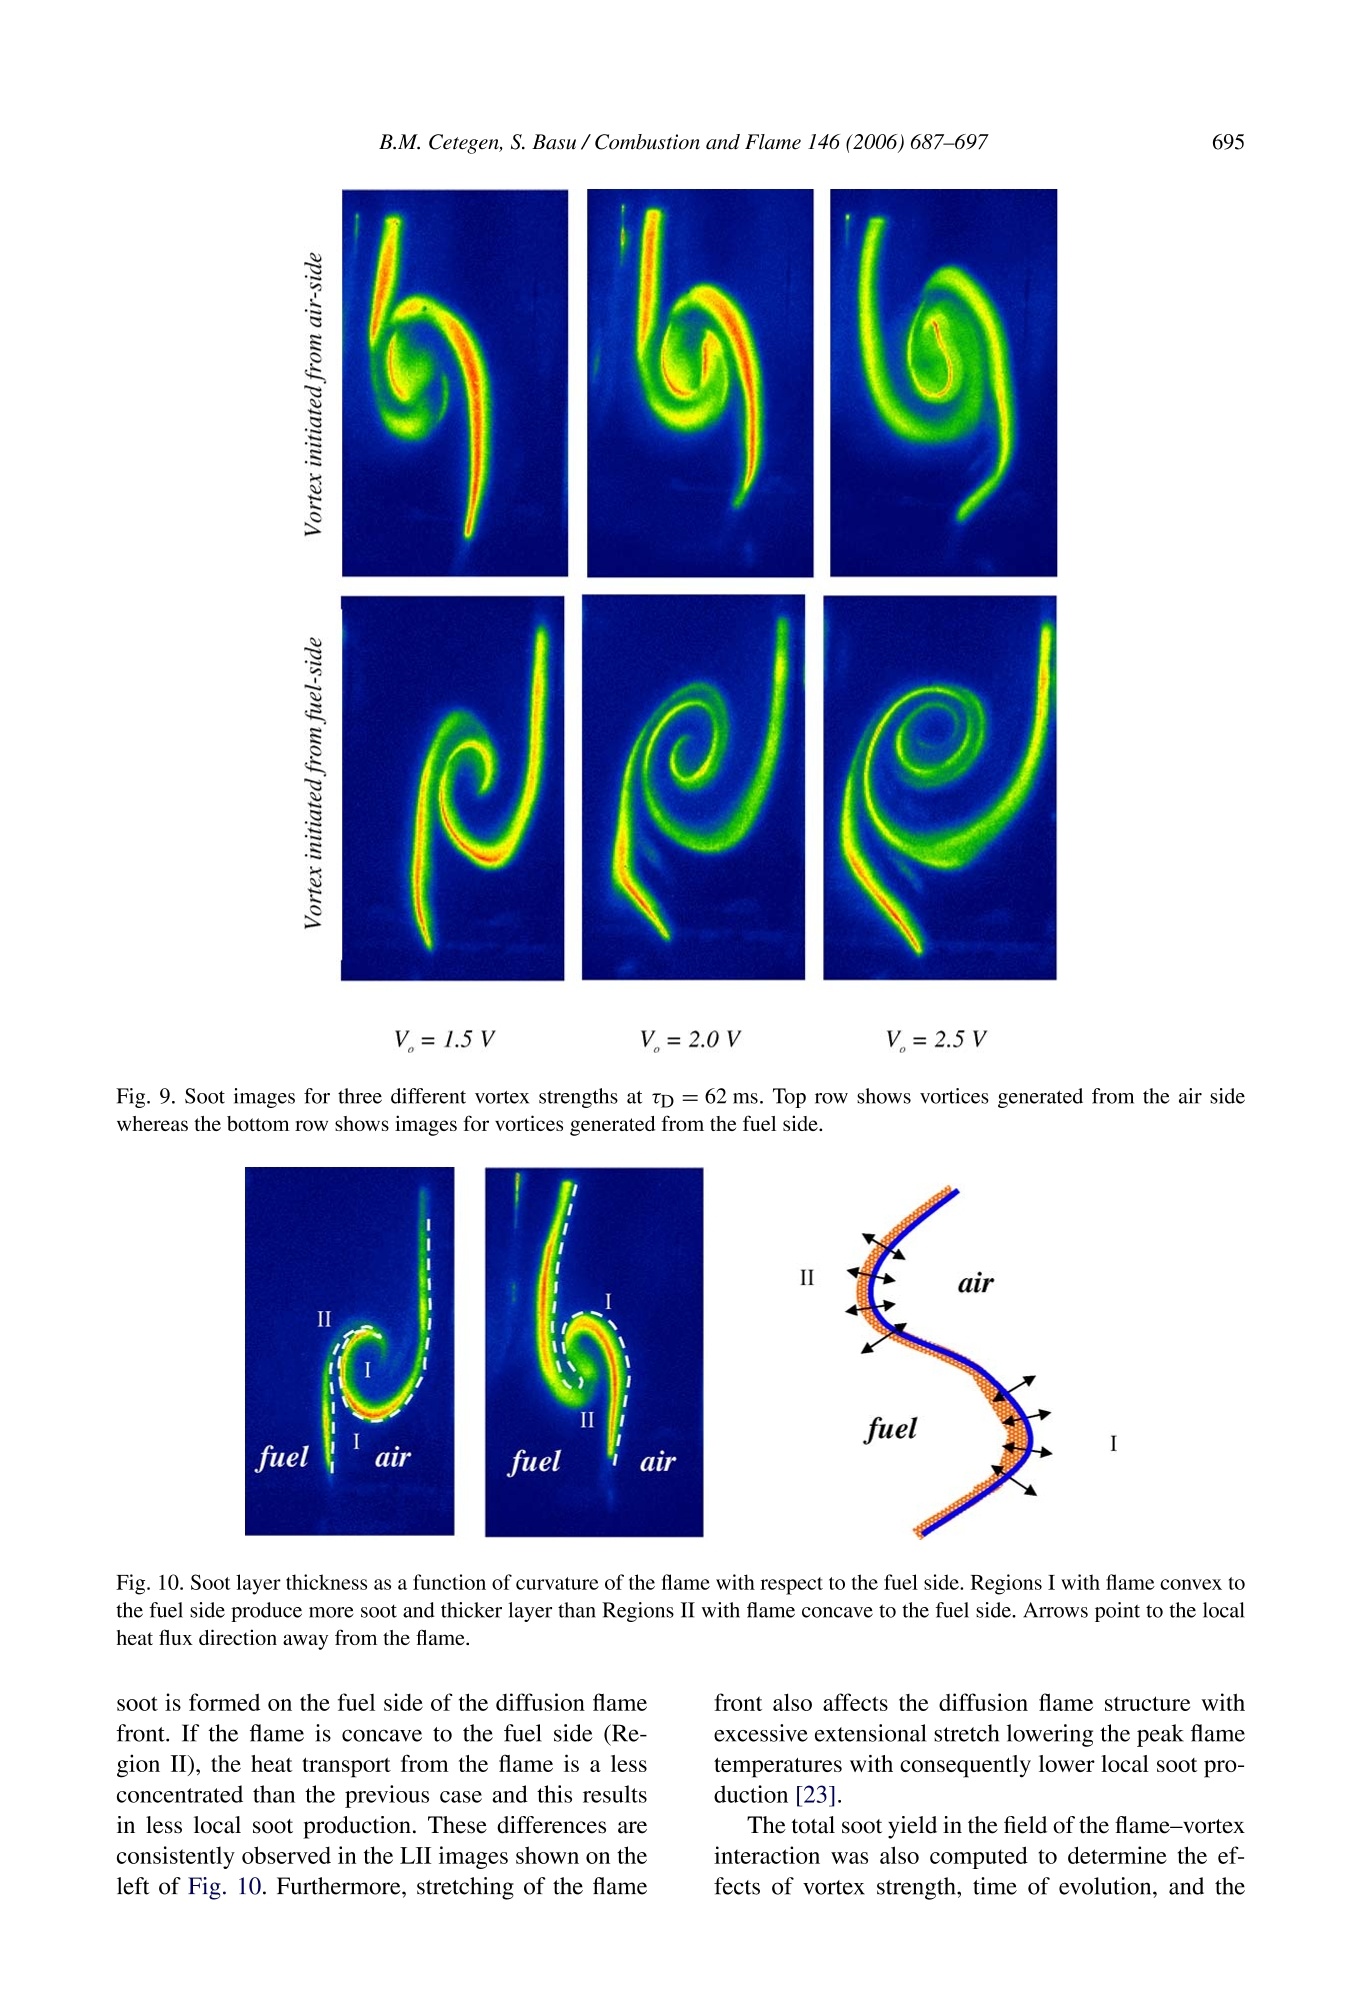
flame–vortex interactions is useful for combustion engineering and design of practical devices.
方案详情

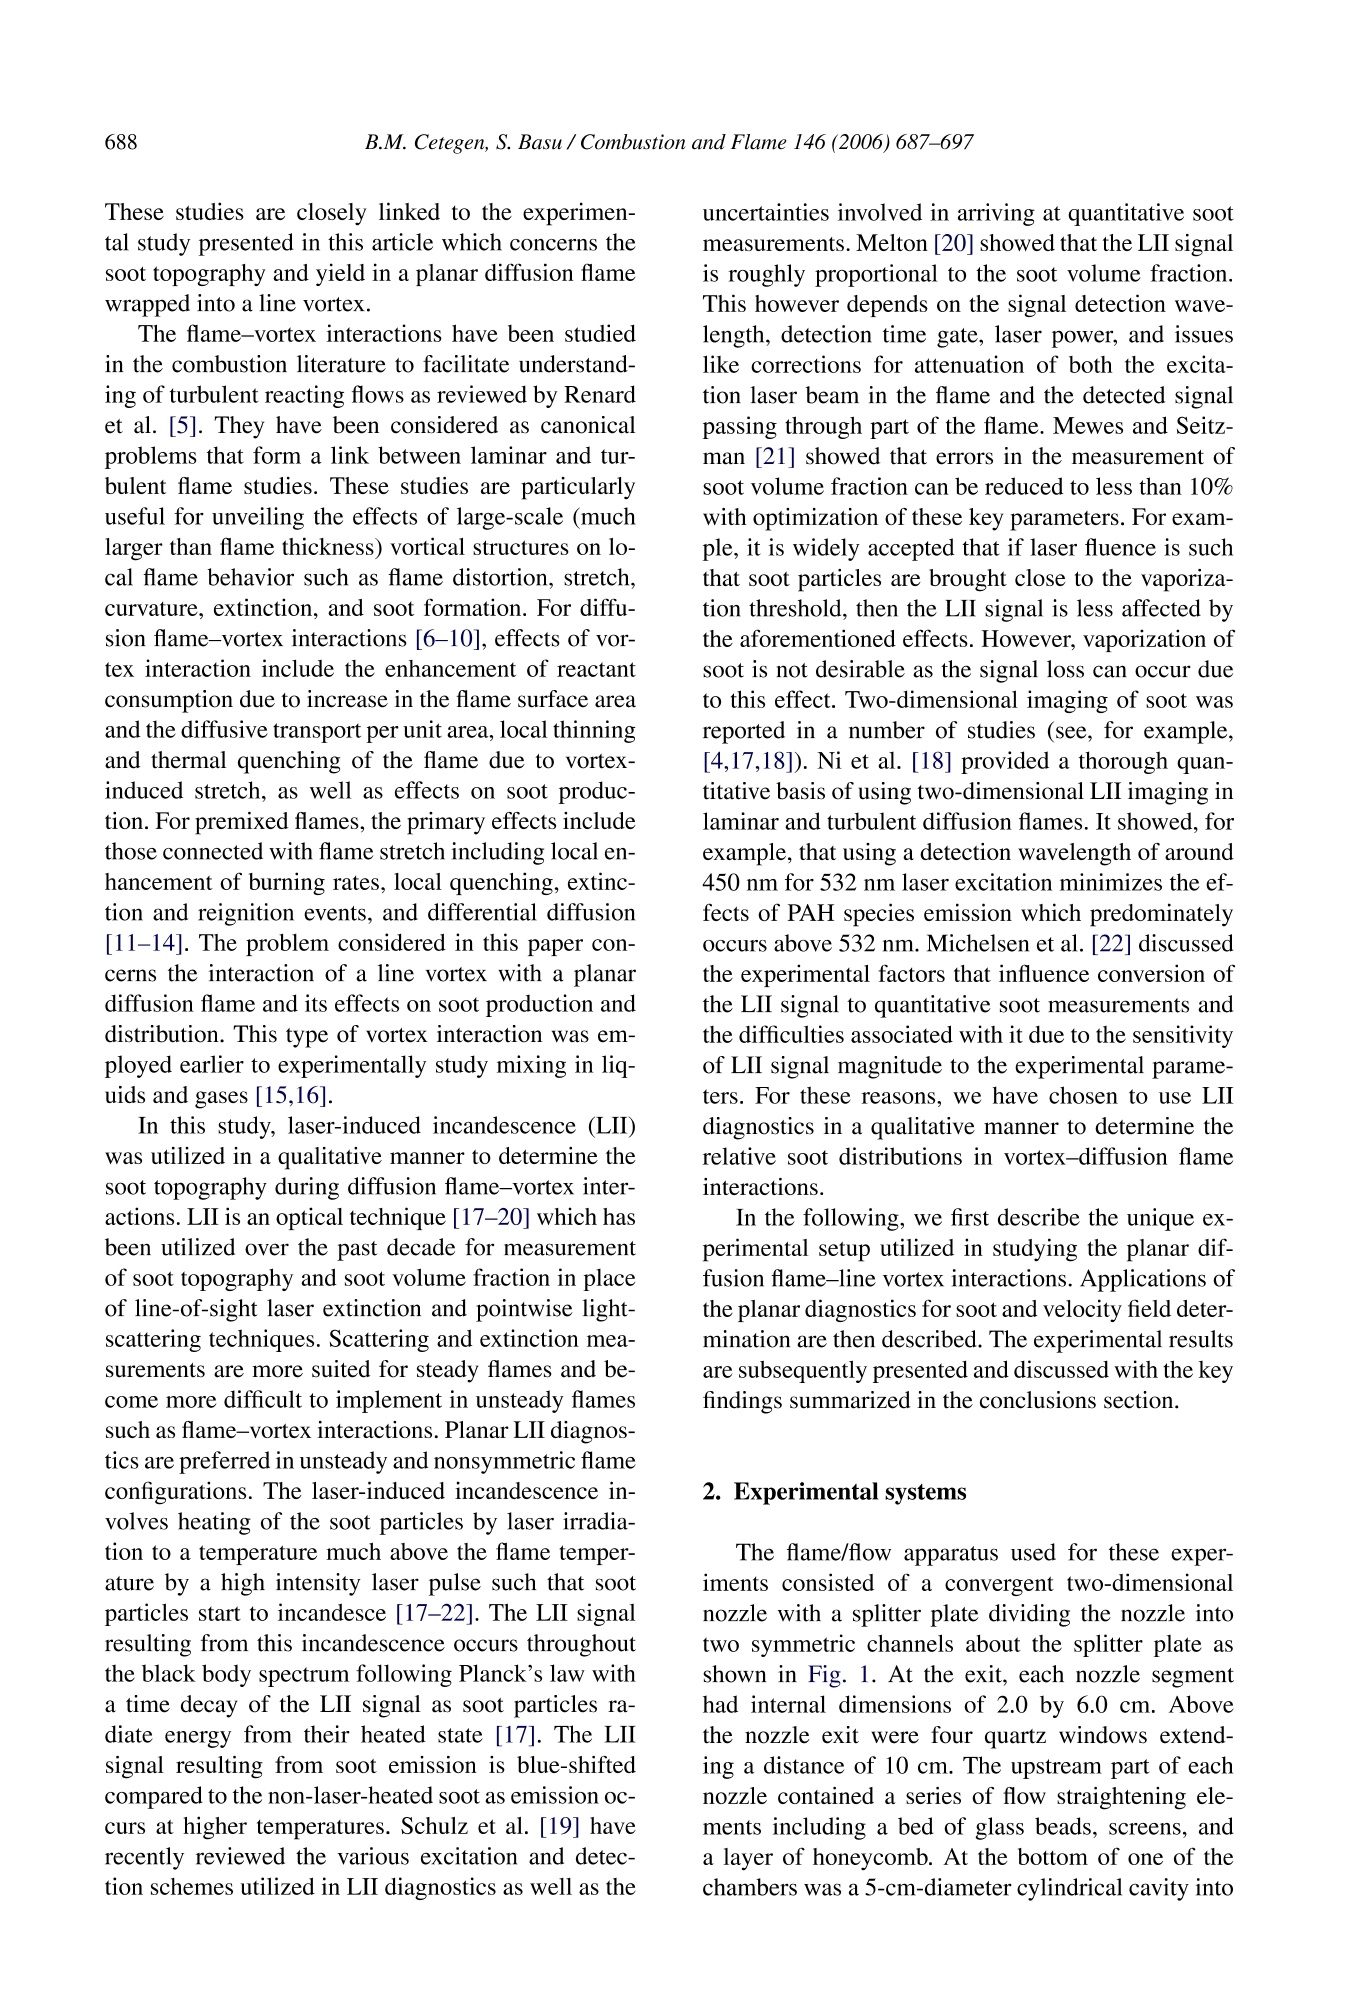
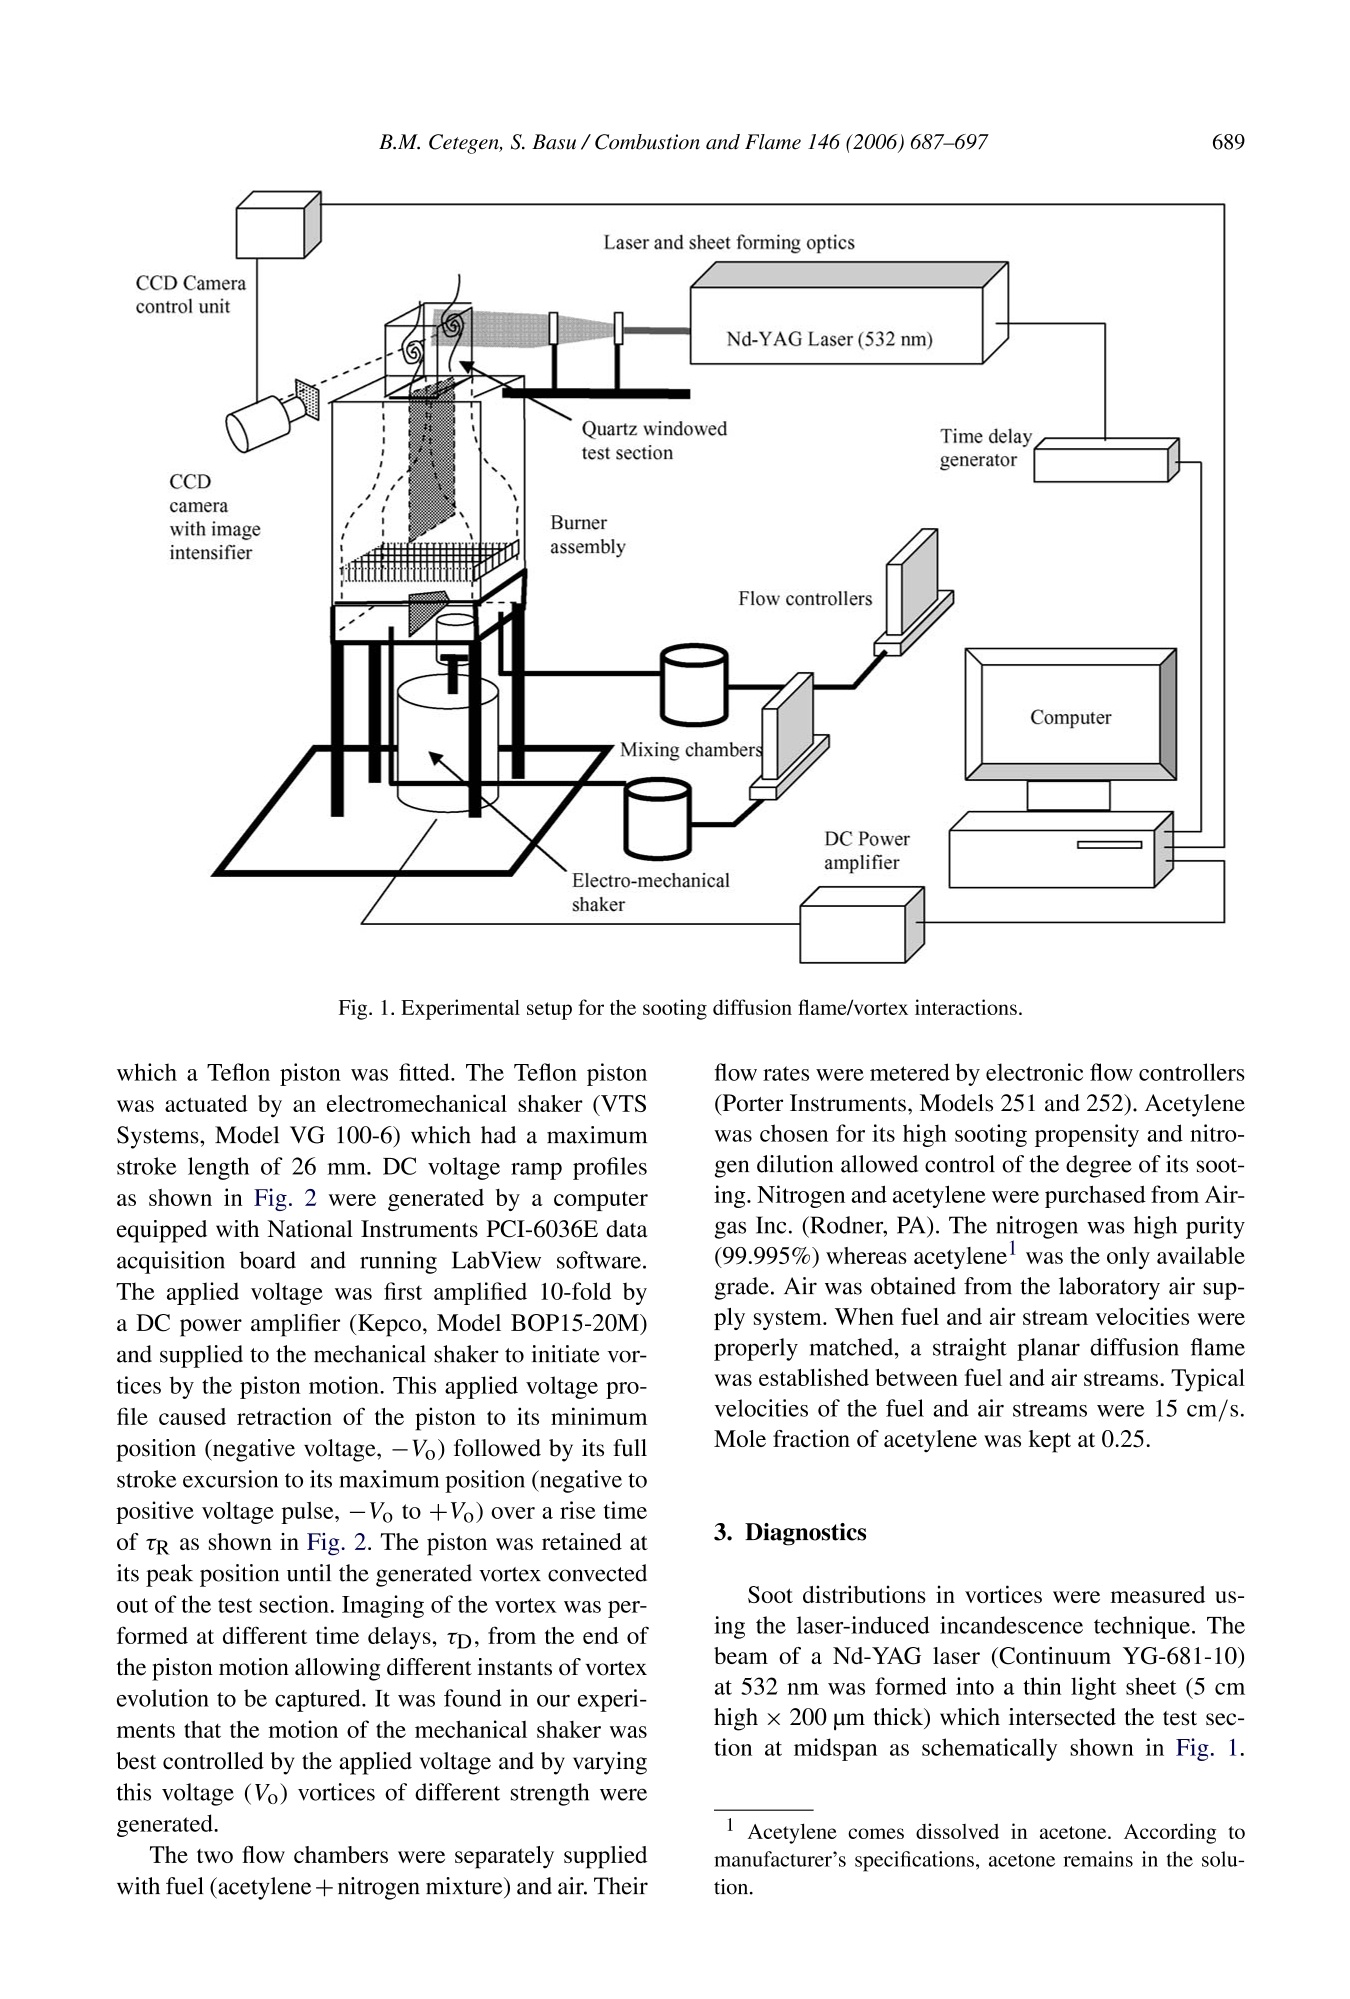
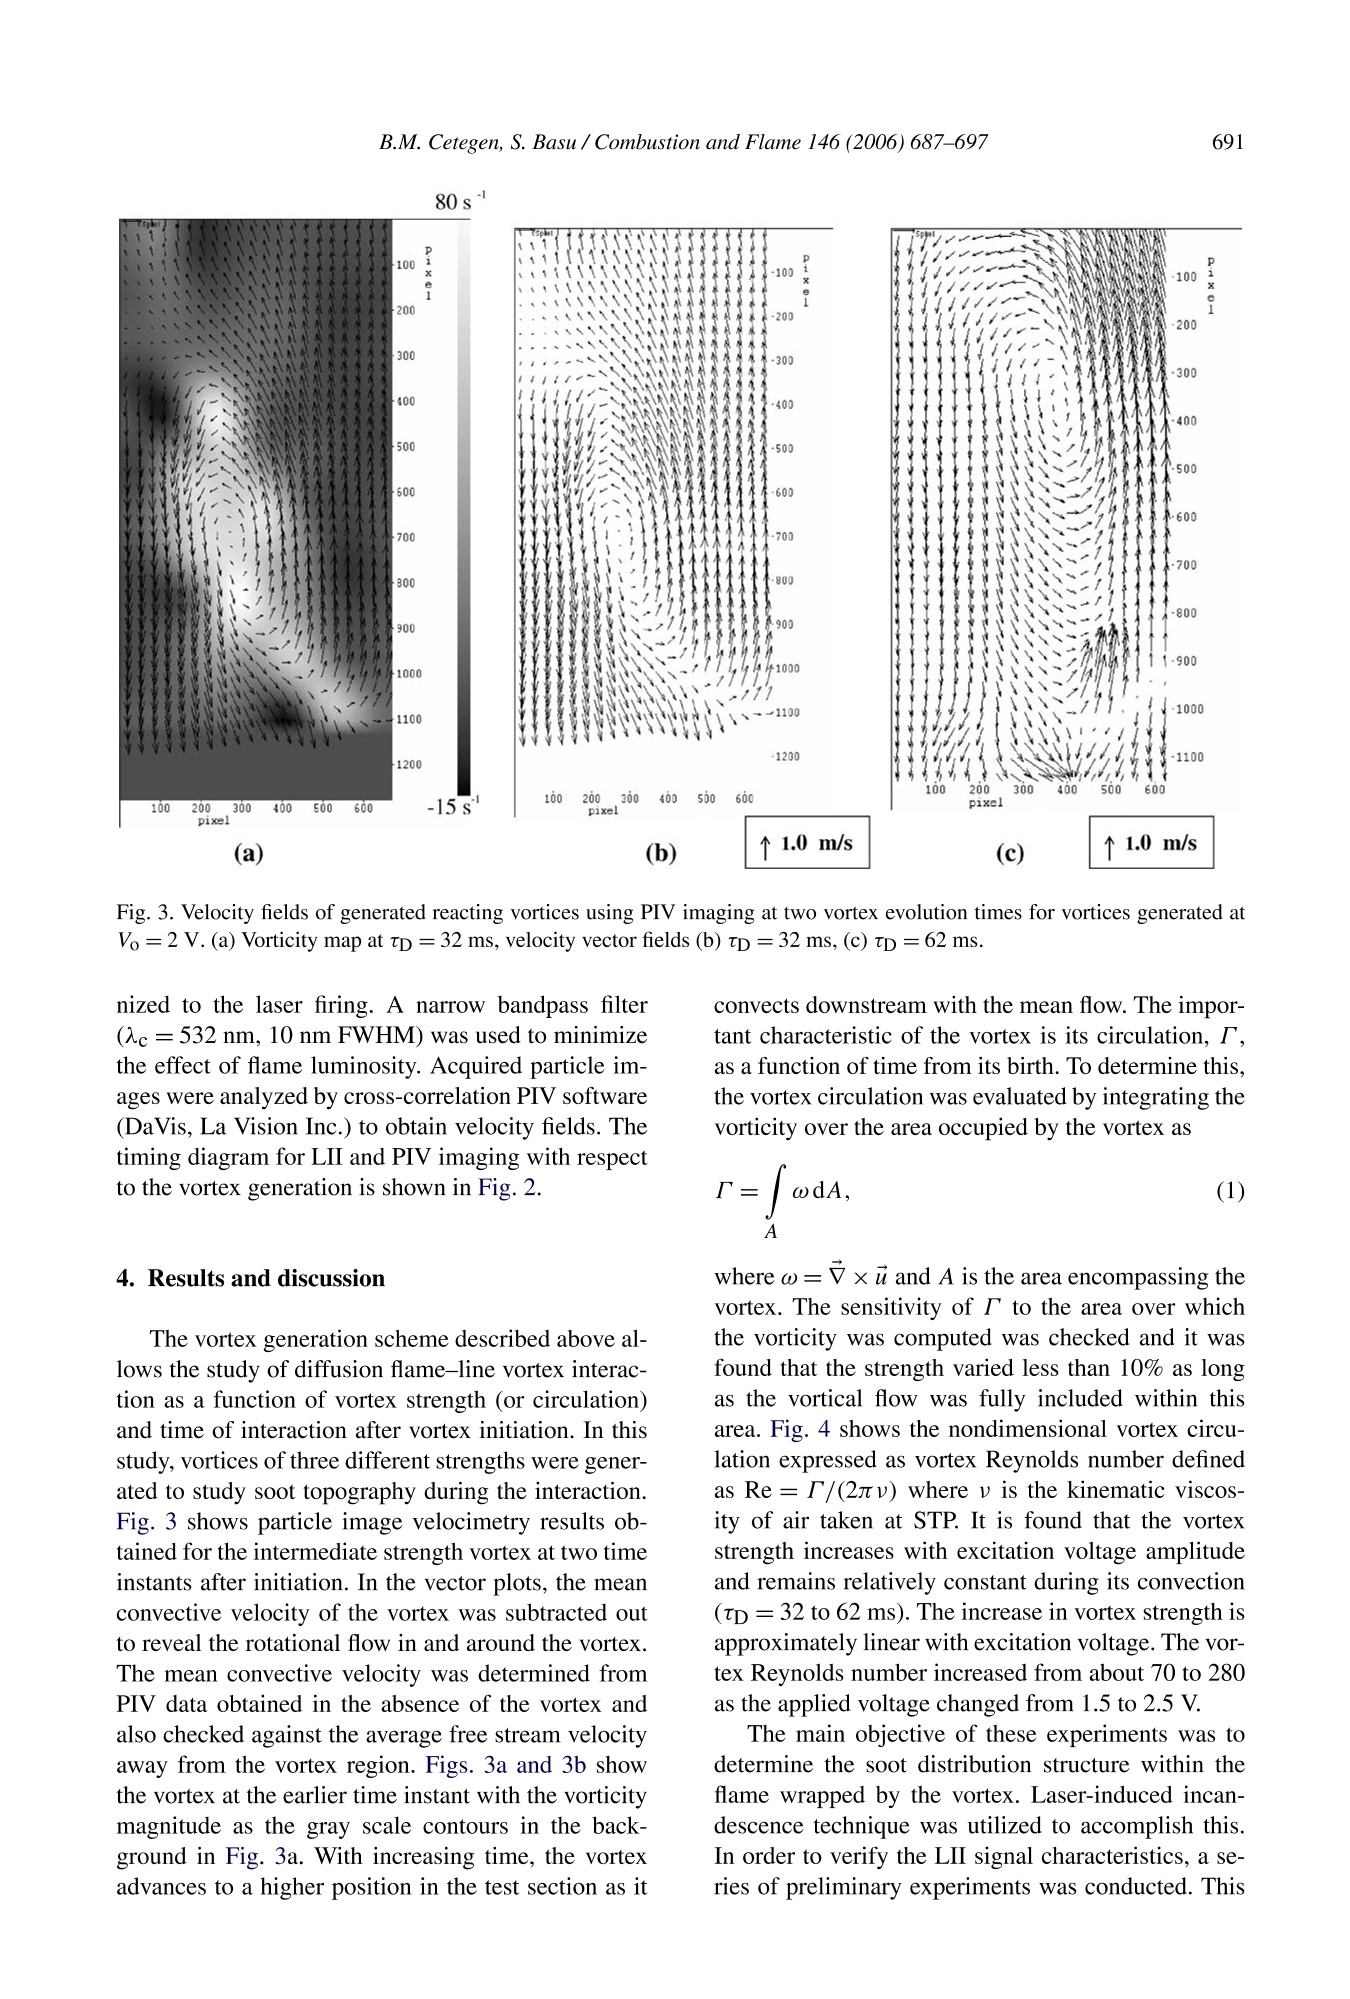
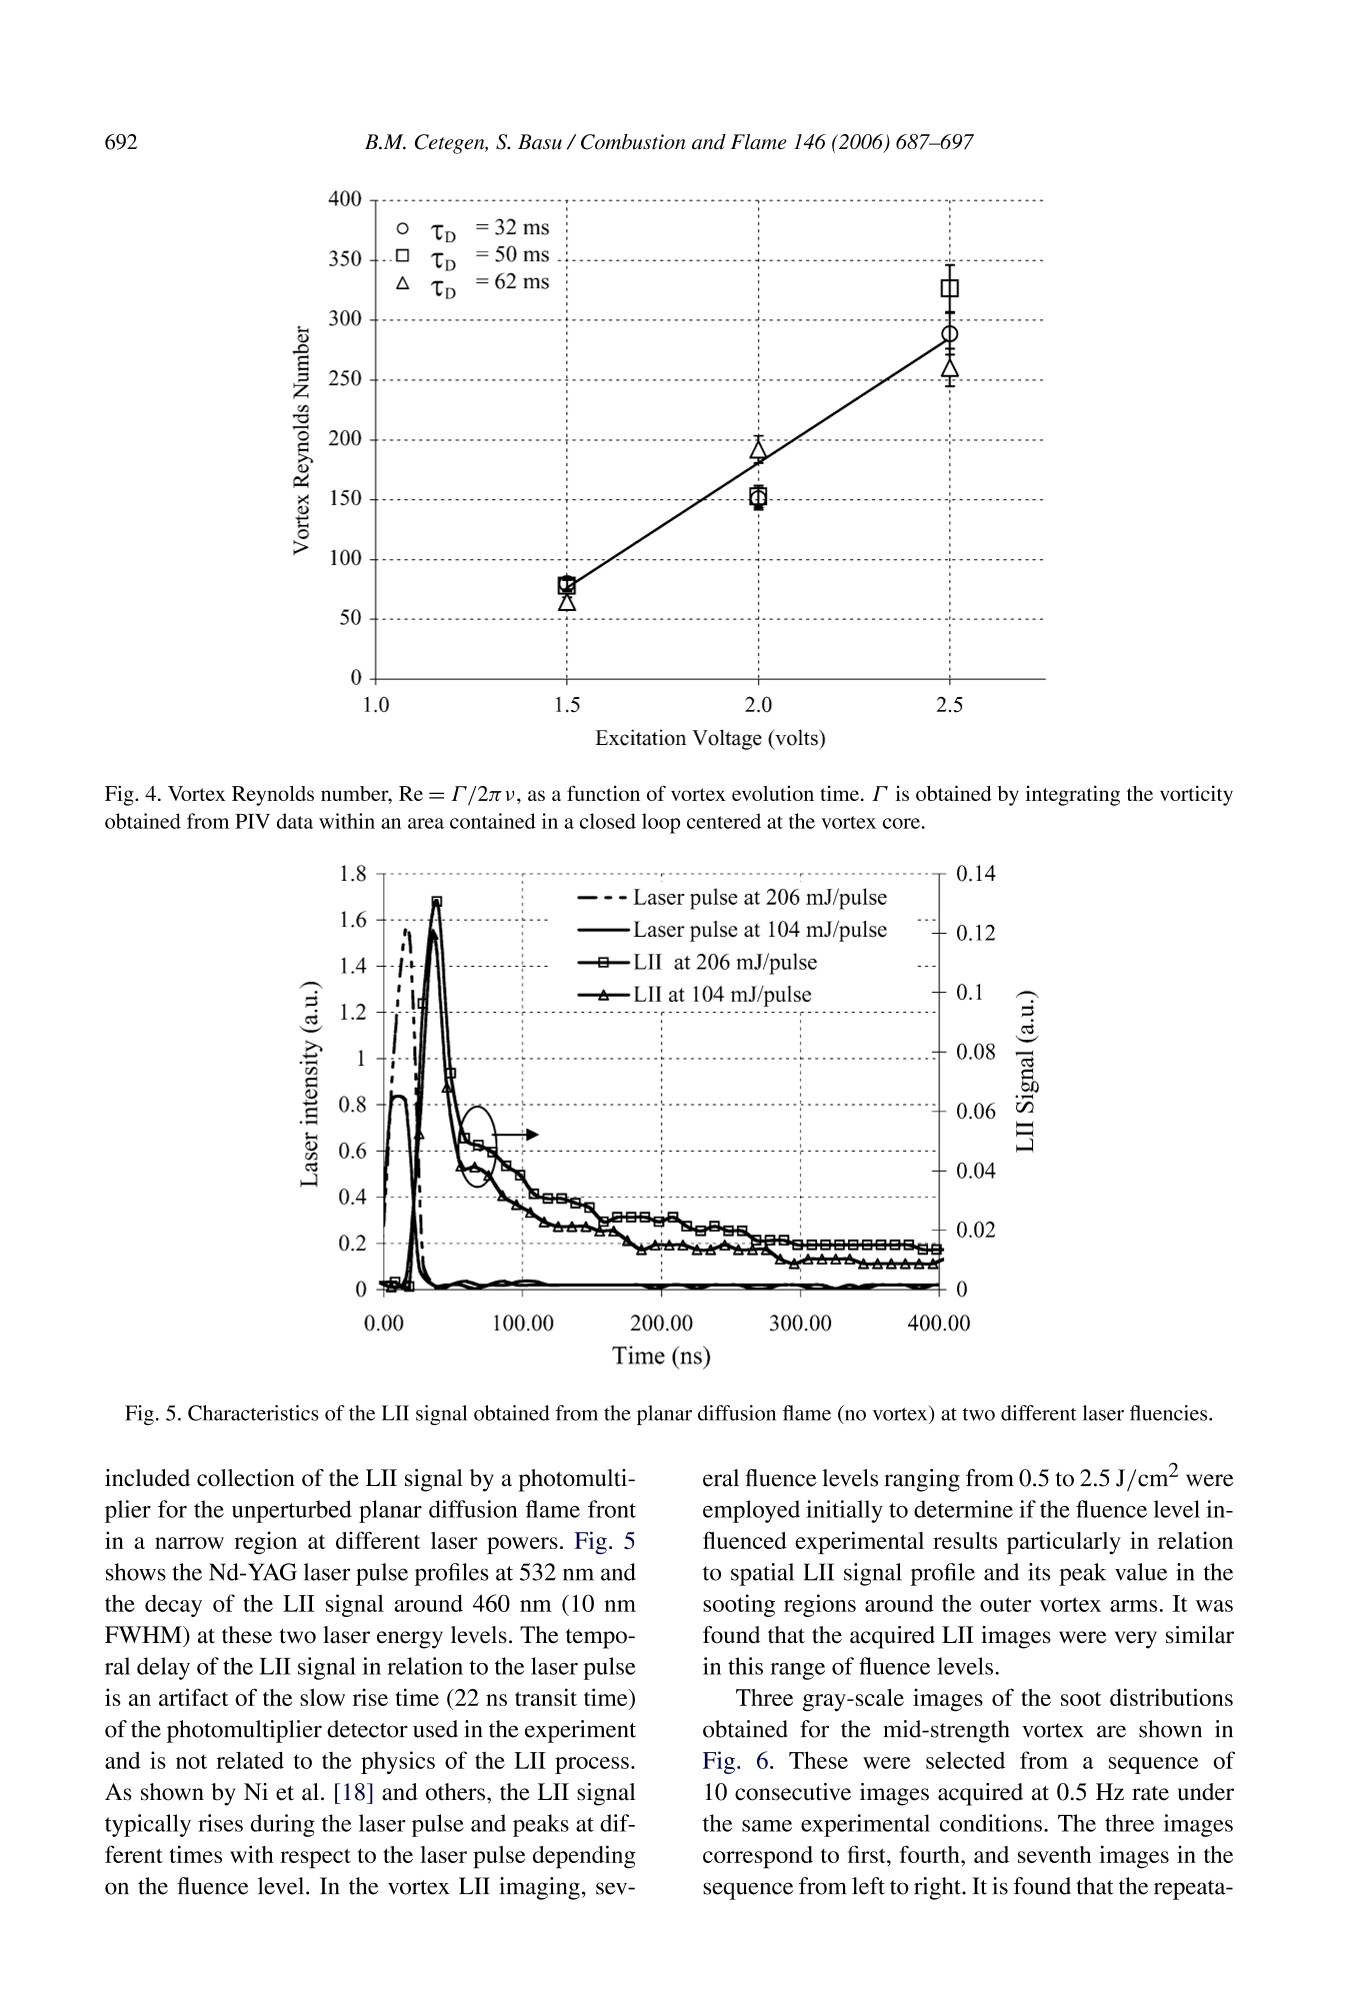
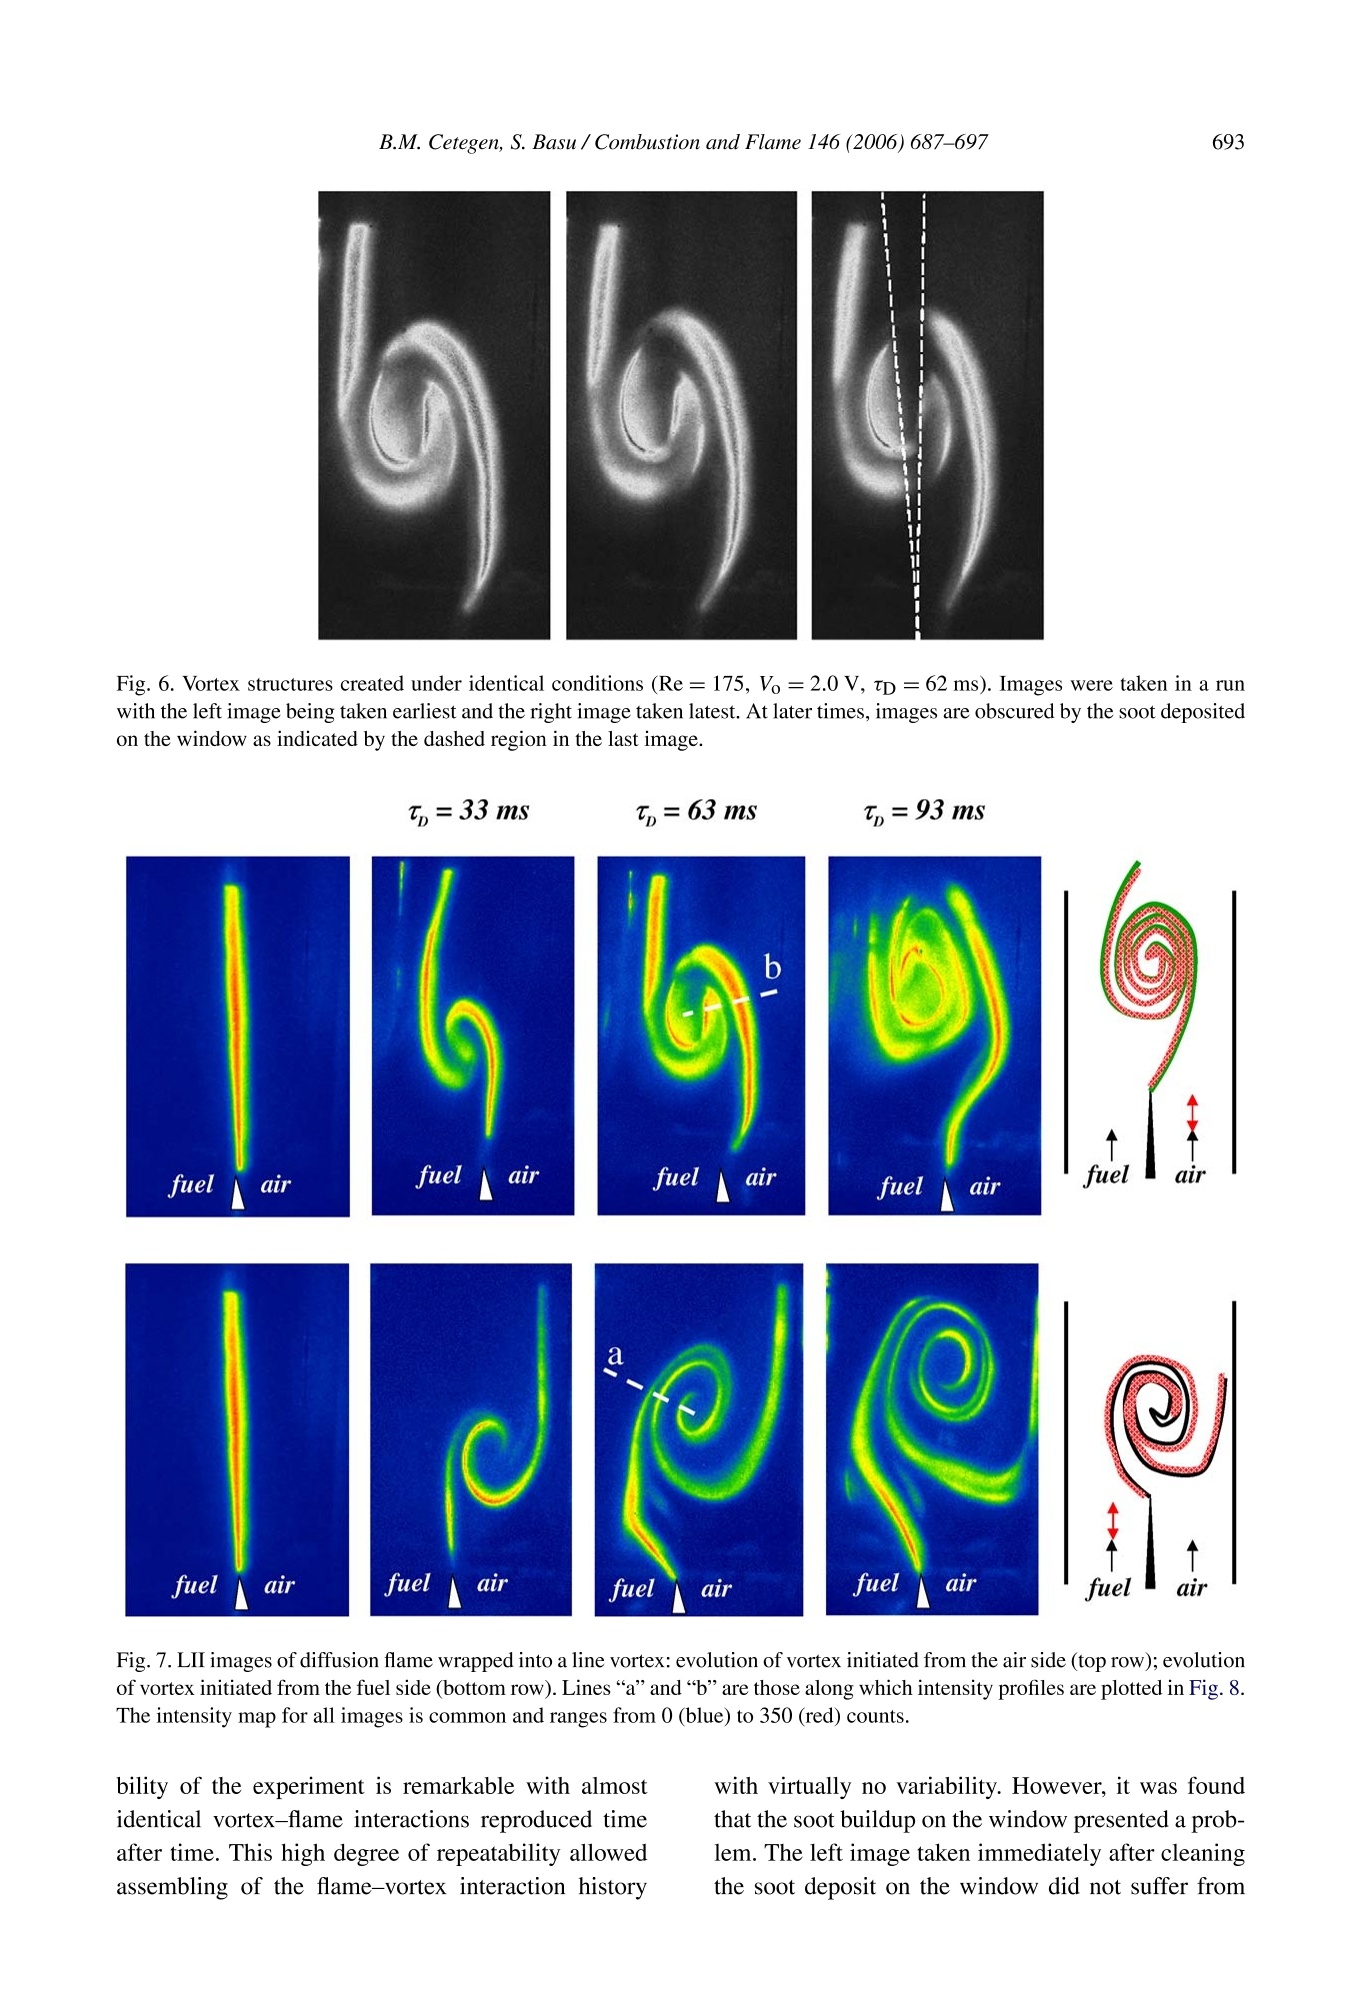
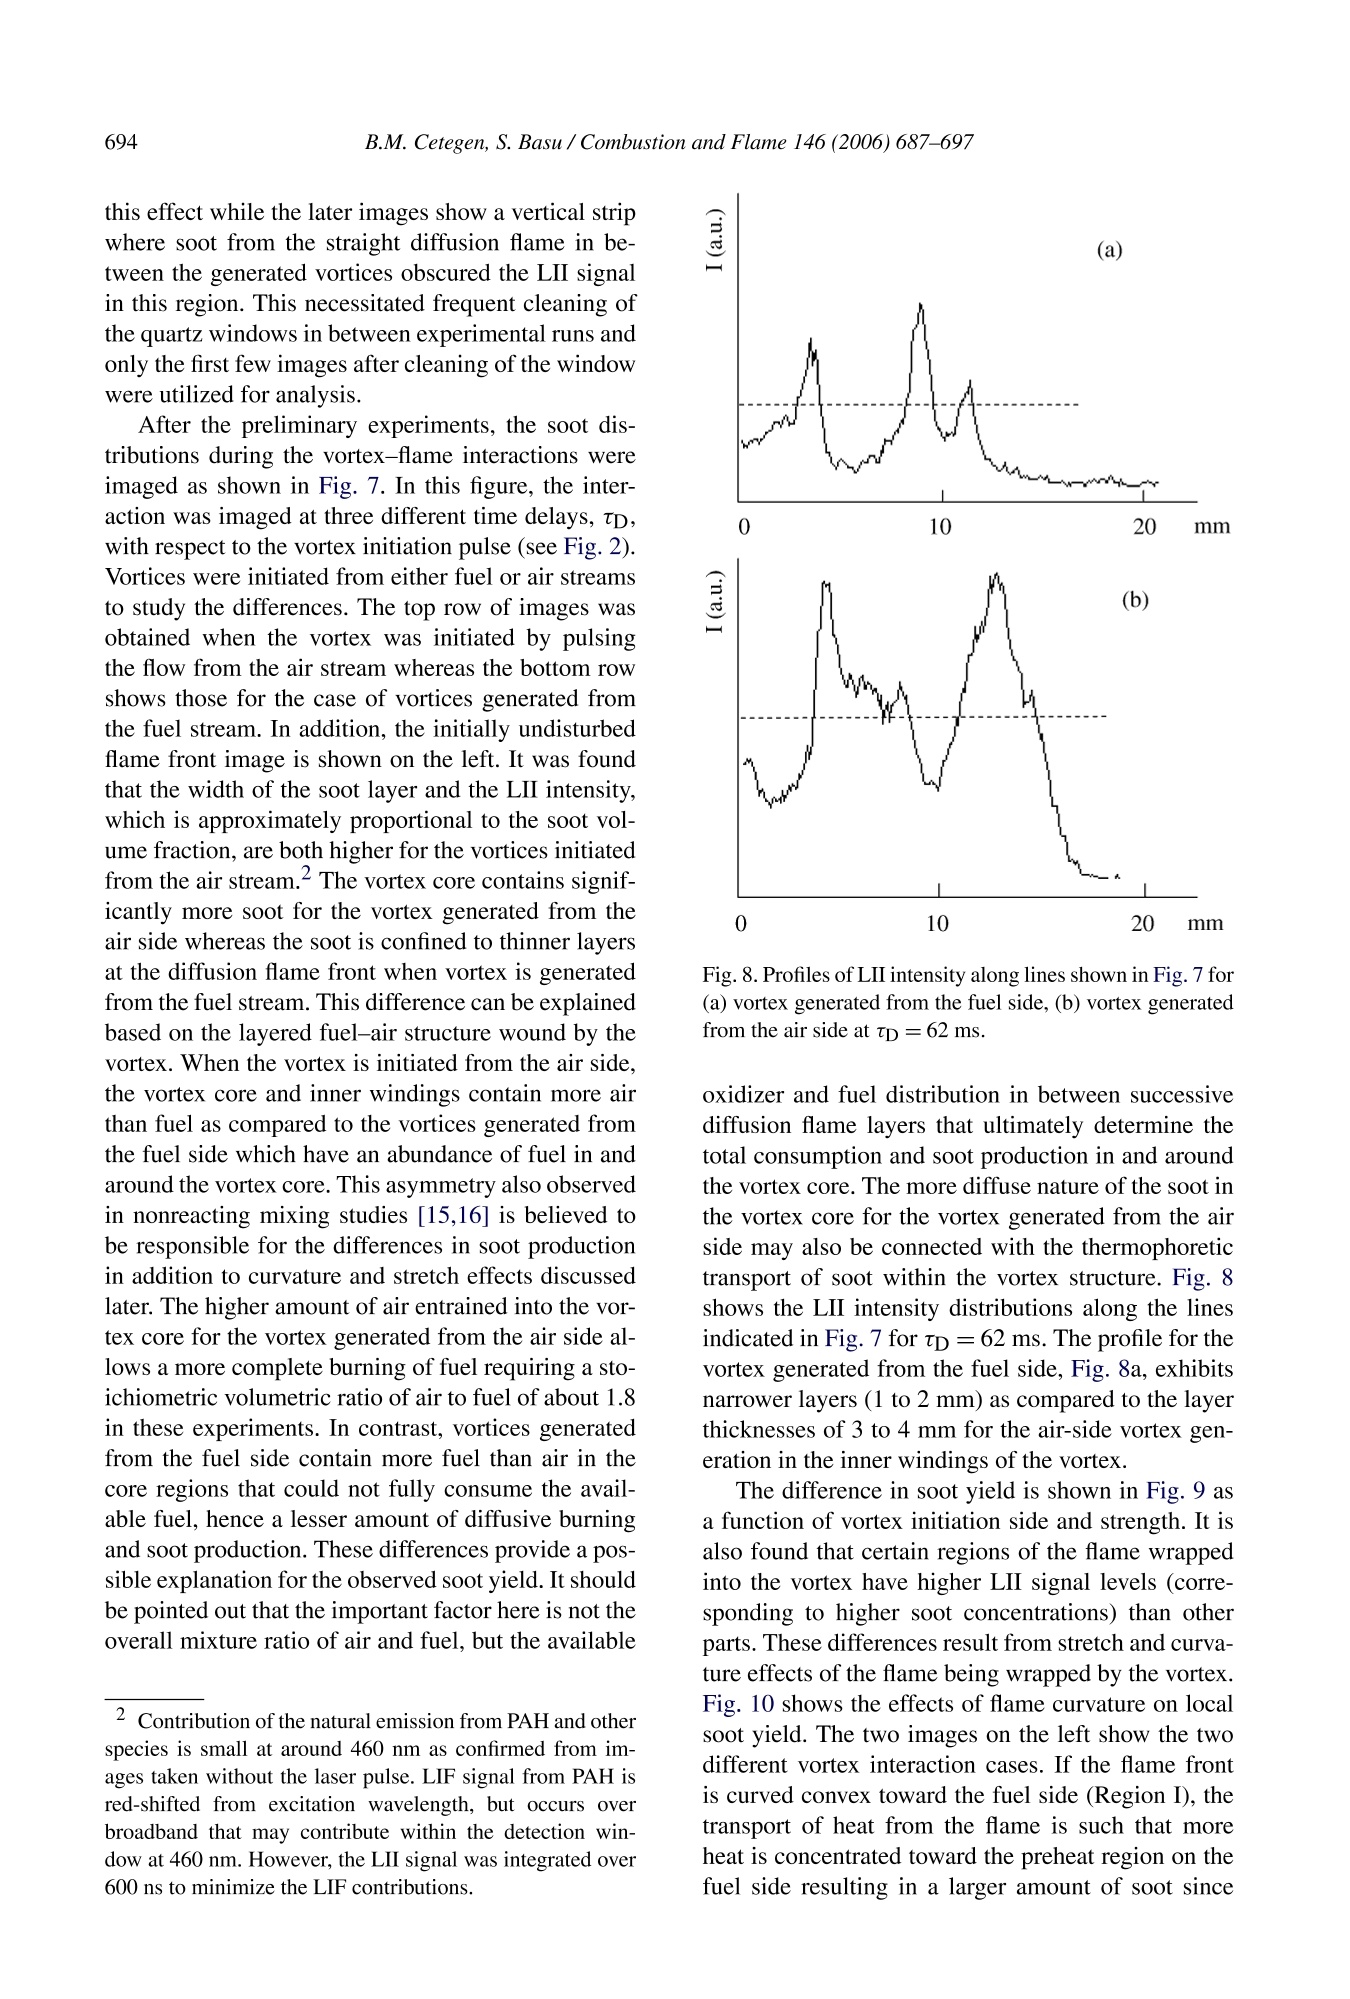
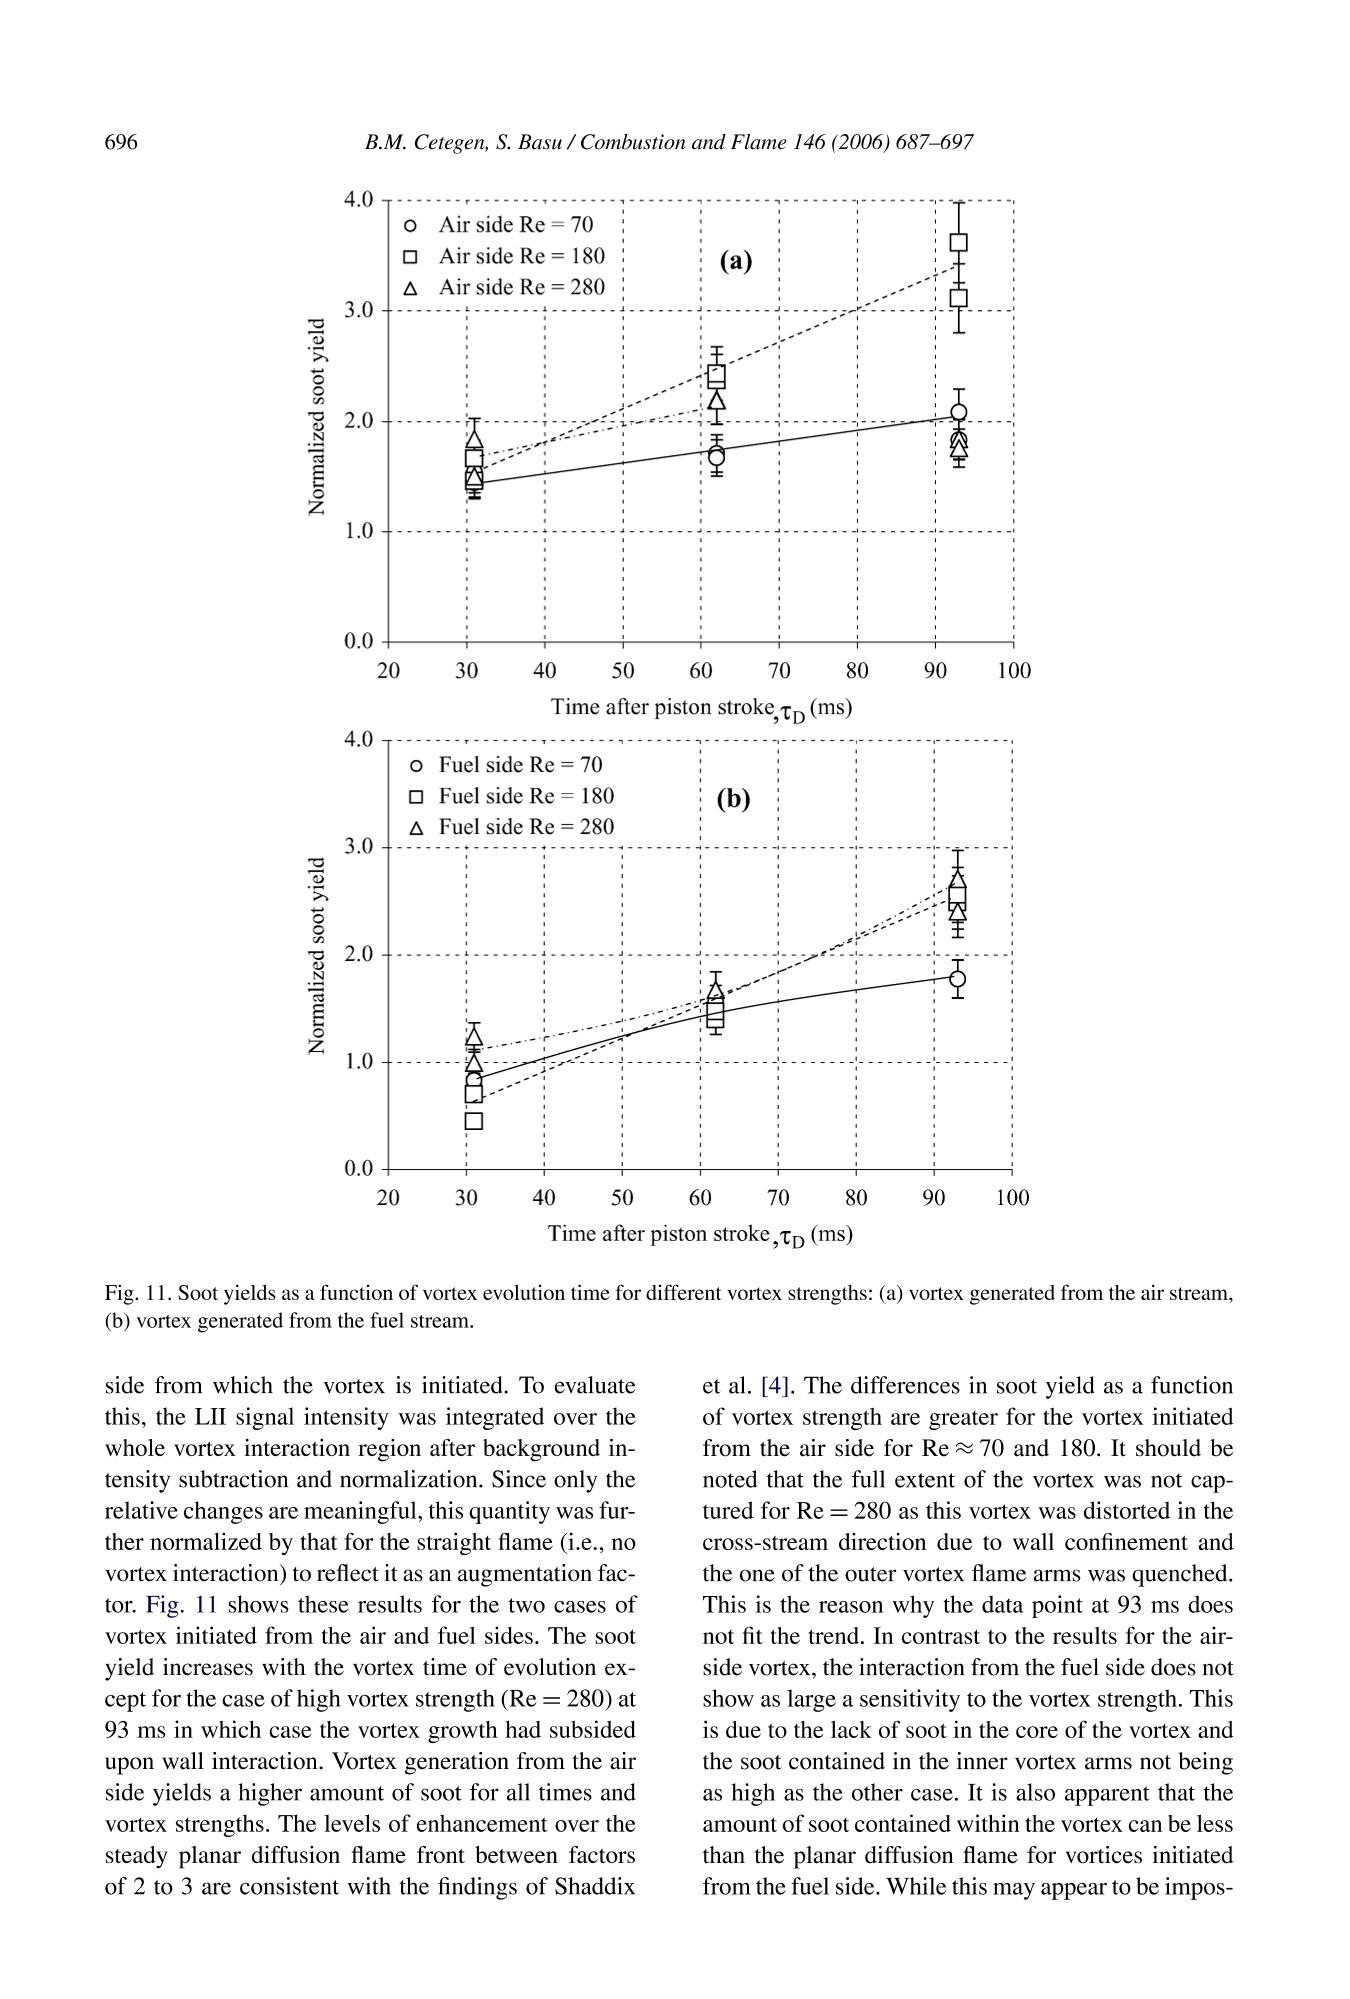
Available online at www.sciencedirect.comCombustionand FlameScienceDirectCombustion and Flame 146 (2006) 687-697 688B.M. Cetegen, S. Basu / Combustion and Flame 146 (2006) 687-697 www.elsevier.com/locate/combustflame Soot topography in a planar diffusion flame wrapped by aline vortex B.M. Cetegen*, S. Basu Department of Mechanical Engineering, University of Connecticut, Storrs, CT 06269-3139, USA Received 25 January 2006; received in revised form 8 June 2006; accepted 8 June 2006 Available online 2 August 2006 Abstract An experimental study of the interaction of a planar diffusion flame with a line vortex is presented. A planardiffusion flame is established between two coflowing, equal velocity streams of acetylene diluted with nitrogenand air. A line vortex is generated on demand by momentarily pulsing one of the flow streams by way of elec-tromagnetic actuation of a piston in the flow apparatus. The flame-vortex interactions are diagnosed by planarlaser-induced incandescence for soot yield and by particle image velocimetry for vortex flow characterization. Theresults show that soot formation and distribution are influenced by the reactant streams from which vortices areinitiated. The vortices interacting with the flame from the air side produce more soot and soot is distributed in andaround the vortex core in diffuse layers. In contrast, topography of soot in vortices interacting from the fuel sideis such that soot is confined to thinner layers around the vortex core which does not contain any soot. The flamecurvature is found to influence the local soot production with the flame regions convex to the fuel side containingmore soot locally. It is also found that the overall soot yield is less sensitive to the vortex strength and is of lowermagnitude when vortex is spun from the fuel side. The knowledge of this type of asymmetry in soot yield inflame-vortex interactions is useful for combustion engineering and design of practical devices. @ 2006 The Combustion Institute. Published by Elsevier Inc. All rights reserved. Keywords: Diffusion flames; Soot; Laser-induced incandescence; Vortex-flame interactions 1. Introduction Soot formation in flames has been extensivelystudied in the combustion literature [1,2]. Experimen-tal and computational studies of laminar and turbu-lent flames have been conducted with the majorityof the research being focused on soot formation inlaminar flames. As a bridge between laminar and tur-bulent flames, some studies have focused on unsteady *Corresponding author. Fax: +1 860 4865088. ( E-mail address: cetegen@engr.uconn.edu ) ( (B.M. Cetegen). ) laminar diffusion flames by periodic modulation offuel flow [3]. More recently Shaddix et al. [4] stud-ied normal (fuel jet bounded by oxidizer) and inverse(oxidizer jet bounded by fuel) diffusion flames in aplanar slot jet configuration with and without externalforcing of the center jet. They found that soot yieldincreases with modulation of the flame and the modu-lated inverse flames produce significantly more poly-cyclic aromatic hydrocarbons (PAH) than the mod-ulated normal flames. They attributed this increaseto the formation of the buoyant vortical structuresnear the natural buoyant puffing frequency toward theouter stream, i.e., fuel side for the inverse flames. ( 0010-2180/$ - see front matter @ 2 006 The Combu s tion Institute. Published by Elsevier Inc. All rights reserved.doi:10.1016/j . combustflame.2006.06.005 ) These studies are closely linked to the experimen-tal study presented in this article which concerns thesoot topography and yield in a planar diffusion flamewrapped into a line vortex. The flame-vortex interactions have been studiedin the combustion literature to facilitate understand-ing of turbulent reacting flows as reviewed by Renardet al. [5]. They have been considered as canonicalproblems that form a link between laminar and tur-bulent flame studies. These studies are particularlyuseful for unveiling the effects of large-scale (muchlarger than flame thickness) vortical structures on lo-cal flame behavior such as flame distortion, stretch,curvature, extinction, and soot formation. For diffu-sion flame-vortex interactions [6-10], effects of vor-tex interaction include the enhancement of reactantconsumption due to increase in the flame surface areaand the diffusive transport per unit area, local thinningand thermal quenching of the flame due to vortex-induced stretch, as well as effects on soot produc-tion. For premixed flames, the primary effects includethose connected with flame stretch including local en-hancement of burning rates, local quenching, extinc-tion and reignition events, and differential diffusion[11-14]. The problem considered in this paper con-cerns the interaction of a line vortex with a planardiffusion flame and its effects on soot production anddistribution. This type of vortex interaction was em-ployed earlier to experimentally study mixing in liq-uids and gases [15,16]. In this study, laser-induced incandescence (LII)was utilized in a qualitative manner to determine thesoot topography during diffusion flame-vortex inter-actions. LII is an optical technique [17-20] which hasbeen utilized over the past decade for measurementof soot topography and soot volume fraction in placeof line-of-sight laser extinction and pointwise light-scattering techniques.Scattering and extinction mea-surements are more suited for steady flames and be-come more difficult to implement in unsteady flamessuch as flame-vortex interactions. Planar LII diagnos-tics are preferred in unsteady and nonsymmetric flameconfigurations. The laser-induced incandescence in-volves heating of the soot particles by laser irradia-tion to a temperature much above the flame temper-ature by a high intensity laser pulse such that sootparticles start to incandesce [17-22]. The LII signalresulting from this incandescence occurs throughoutthe black body spectrum following Planck’s law witha time decay of the LII signal as soot particles ra-diate energy from their heated state [17]. The LIlsignal resulting from soot emission is blue-shiftedcompared to the non-laser-heated soot as emission oc-curs at higher temperatures. Schulz et al. [19] haverecently reviewed the various excitation and detec-tion schemes utilized in LII diagnostics as well as the uncertainties involved in arriving at quantitative sootmeasurements.Melton [20] showed that the LII signalis roughly proportional to the soot volume fraction.This however depends on the signal detection wave-length, detection time gate, laser power, and issueslike corrections for attenuation of both the excita-tion laser beam in the flame and the detected signalpassing through part of the flame. Mewes and Seitz-man [21] showed that errors in the measurement ofsoot volume fraction can be reduced to less than 10%with optimization of these key parameters. For exam-ple, it is widely accepted that if laser fluence is suchthat soot particles are brought close to the vaporiza-tion threshold, then the LII signal is less affected bythe aforementioned effects. However, vaporization ofsoot is not desirable as the signal loss can occur dueto this effect. Two-dimensional imaging of soot wasreported in a number of studies (see, for example,[4,17,18]).Ni et al. [18] provided a thorough quan-titative basis of using two-dimensional LII imaging inlaminar and turbulent diffusion flames. It showed. forexample, that using a detection wavelength of around450 nm for 532 nm laser excitation minimizes the ef-fects of PAH species emission which predominatelyoccurs above 532 nm. Michelsen et al.[22] discussedthe experimental factors that influence conversion ofthe LII signal to quantitative soot measurements andthe difficulties associated with it due to the sensitivityof LII signal magnitude to the experimental parame-ters. For these reasons, we have chosen to use LIIdiagnostics in a qualitative manner to determine therelative soot distributions in vortex-diffusion flameinteractions. In the following, we first describe the unique ex-perimental setup utilized in studying the planar dif-fusion flame-line vortex interactions. Applications ofthe planar diagnostics for soot and velocity field deter-mination are then described. The experimental resultsare subsequently presented and discussed with the keyfindings summarized in the conclusions section. 2. Experimental systems The flame/flow apparatus used for these exper-iments consisted of a convergent two-dimensionalnozzle with a splitter plate dividing the nozzle intotwo symmetric channels about the splitter plate asshown in Fig. 1. At the exit, each nozzle segmenthad internal dimensions of 2.0 by 6.0 cm. Abovethe nozzle exit were four quartz windows extend-ing a distance of 10 cm. The upstream part of eachnozzle contained a series of flow straightening ele-ments including a bed of glass beads, screens, anda layer of honeycomb. At the bottom of one of thechambers was a 5-cm-diameter cylindrical cavity into Fig. 1. Experimental setup for the sooting diffusion flame/vortex interactions. which a Teflon piston was fitted. The Teflon pistonwas actuated by an electromechanical shaker (VTSSystems, Model VG 100-6) which had a maximumstroke length of 26 mm. DC voltage ramp profilesas shown in Fig. 2 were generated by a computerequipped with National Instruments PCI-6036E dataacquisition board and running LabView software.The applied voltage was first amplified 10-fold bya DC power amplifier (Kepco, Model BOP15-20M)and supplied to the mechanical shaker to initiate vor-tices by the piston motion. This applied voltage pro-file caused retraction of the piston to its minimumposition (negative voltage,-Vo) followed by its fullstroke excursion to its maximum position (negative topositive voltage pulse, -Vo to +Vo) over a rise timeof tR as shown in Fig. 2. The piston was retained atits peak position until the generated vortex convectedout of the test section. Imaging of the vortex was per-formed at different time delays, tD, from the end ofthe piston motion allowing different instants of vortexevolution to be captured. It was found in our experi-ments that the motion of the mechanical shaker wasbest controlled by the applied voltage and by varyingthis voltage (Vo) vortices of different strength weregenerated. The two flow chambers were separately suppliedwith fuel (acetylene + nitrogen mixture) and air. Their flow rates were metered by electronic flow controllers(Porter Instruments, Models 251 and 252). Acetylenewas chosen for its high sooting propensity and nitro-gen dilution allowed control of the degree of its soot-ing. Nitrogen and acetylene were purchased from Air-gas Inc. (Rodner, PA). The nitrogen was high purity(99.995%) whereas acetylene was the only availablegrade. Air was obtained from the laboratory air sup-ply system. When fuel and air stream velocities wereproperly matched, a straight planar diffusion flamewas established between fuel and air streams. Typicalvelocities of the fuel and air streams were 15 cm/sMole fraction of acetylene was kept at 0.25. 3. Diagnostics Soot distributions in vortices were measured us-ing the laser-induced incandescence technique. Thebeam of a Nd-YAG laser (Continuum YG-681-10)at 532 nm was formed into a thin light sheet (5 cmhigh×200 um thick) which intersected the test sec-tion at midspan as schematically shown in Fig. 1. ( 1 . Acetylene comes d i ssolved i n a c etone. According to manufacturer’s s p ecifications, acetone remains in th e solu- tion. ) Fig. 2. Timing diagram for the vortex experiments and image acquisition. tR is the rise time of the vortex generating pulse. tD isthe time delay from the end of vortex generating pulse to image acquisition A microchannel plate intensifier (DEP, Gen II) waslens-coupled to a CCD camera (1300×1035 pixel,Photometrics, CH 200) and it viewed the LII signalthrough a bandpass interference filter (Ac =460 nm,10 nm FWHM). In order to evaluate the LII sig-nal characteristics, a series of experiments were per-formed at different laser fluences ranging from 0.5 to2.5 J/cm. Additionally time variation of the LII sig-nal was obtained from a photomultiplier detector(Hamamatsu, Model R7517) with a restricted viewin a planar diffusion flame (i.e., without the vortex)and this signal was used to check its decay charac-teristics as compared to those reported in the litera-ture [18]. In each imaging experiment, background lu-minosity was recorded. The laser energy was checkedby a laser energy meter (Scientech, Models MD10and MC25HD) between experimental runs to ensurethat the laser power remained nominally constant. Ad-ditionally, a photodiode (Thorlabs,Model DET-200)was used to view the laser light reflected off one of thesheet-forming lenses to determine the timing of laser firing. An experimental run consisted of consecutiveimaging of 10 vortices generated at 0.5 Hz frequency.Soot deposited on the windows during each exper-imental run was also cleaned between experimentalruns. Particle image velocimetry (PIV) was utilized tocharacterize the flow field before and during vortexinteraction. For this purpose a dual cavity Nd-YAGlaser (Continuum Surelite-10) was utilized for illumi-nation with independent control of laser pulse sep-aration via a time delay generator (Stanford Instru-ments, DG535). Alumina particles with a nominalsize less than 2 um were seeded into both fuel and airstreams with custom-built fluidized bed seeders withagitation. Significant difficulties of clouding of win-dows with seed particles and accumulation of seedin the apparatus and flow distribution manifolds wereovercome laboriously by frequent cleaning. Detectionof particle images was accomplished by a 1000 ×1300 pixel interline transfer CCD camera (Roper Sci-entific Micromax) with the exposure timing synchro- 100 ·200 %·300 ·400 500 -600 -700 -800 1-900 -1000 -1100 11 400 500 600 个 1.0 m/s Fig. 3. Velocity fields of generated reacting vortices using PIV imaging at two vortex evolution times for vortices generated atVo=2V. (a) Vorticity map at tD =32 ms, velocity vector fields (b) tD =32 ms, (c) tD =62 ms. nized to the laser firing. A narrow bandpass filter(入c = 532 nm, 10 nm FWHM) was used to minimizethe effect of flame luminosity. Acquired particle im-ages were analyzed by cross-correlation PIV software(DaVis, La Vision Inc.) to obtain velocity fields. Thetiming diagram for LII and PIV imaging with respectto the vortex generation is shown in Fig. 2. 4. Results and discussion The vortex generation scheme described above al-lows the study of diffusion flame-line vortex interac-tion as a function of vortex strength (or circulation)and time of interaction after vortex initiation. In thisstudy, vortices of three different strengths were gener-ated to study soot topography during the interaction.Fig. 3 shows particle image velocimetry results ob-tained for the intermediate strength vortex at two timeinstants after initiation. In the vector plots, the meanconvective velocity of the vortex was subtracted outto reveal the rotational flow in and around the vortex.The mean convective velocity was determined fromPIV data obtained in the absence of the vortex andalso checked against the average free stream velocityaway from the vortex region. Figs. 3a and 3b showthe vortex at the earlier time instant with the vorticitymagnitude as the gray scale contours in the back-ground in Fig. 3a. With increasing time, the vortexadvances to a higher position in the test section as it convects downstream with the mean flow. The impor-tant characteristic of the vortex is its circulation, T,as a function of time from its birth. To determine this.the vortex circulation was evaluated by integrating thevorticity over the area occupied by the vortex as A where ω=V ×u and A is the area encompassing thevortex. The sensitivity of I to the area over whichthe vorticity was computed was checked and it wasfound that the strength varied less than 10% as longas the vortical flow was fully included within thisarea. Fig. 4 shows the nondimensional vortex circu-lation expressed as vortex Reynolds number definedas Re=T/(2元v) where v is the kinematic viscos-ity of air taken at STP. It is found that the vortexstrength increases with excitation voltage amplitudeand remains relatively constant during its convection(tD=32 to 62 ms). The increase in vortex strength isapproximately linear with excitation voltage. The vor-tex Reynolds number increased from about 70 to 280as the applied voltage changed from 1.5 to 2.5 V. The main objective of these experiments was to.determine the soot distribution structure within theflame wrapped by the vortex. Laser-induced incan-descence technique was utilized to accomplish thisIn order to verify the LII signal characteristics, a se-ries of preliminary experiments was conducted. This Fig. 4. Vortex Reynolds number, Re=T/2nv, as a function of vortex evolution time. Iis obtained by integrating the vorticityobtained from PIV data within an area contained in a closed loop centered at the vortex core. Fig. 5. Characteristics of the LII signal obtained from the planar diffusion flame (no vortex) at two different laser fluencies included collection of the LII signal by a photomulti-plier for the unperturbed planar diffusion flame frontin a narrow region at different laser powers. Fig. 5shows the Nd-YAG laser pulse profiles at 532 nm andthe decay of the LII signal around 460 nm (10 nmFWHM) at these two laser energy levels. The tempo-ral delay of the LII signal in relation to the laser pulseis an artifact of the slow rise time (22 ns transit time)of the photomultiplier detector used in the experimentand is not related to the physics of the LII process.As shown by Ni et al. [18] and others, the LII signaltypically rises during the laser pulse and peaks at dif-ferent times with respect to the laser pulse dependingon the fluence level. In the vortex LII imaging, sev- eral fluence levels ranging from 0.5 to 2.5 J/cm’ wereemployed initially to determine if the fluence level in-fluenced experimental results particularly in relationto spatial LII signal profile and its peak value in thesooting regions around the outer vortex arms. It wasfound that the acquired LII images were very similarin this range of fluence levels. Three gray-scale images of the soot distributionsobtained for the mid-strength vortex are shown inFig. 6. These were selected from a sequence of10 consecutive images acquired at 0.5 Hz rate underthe same experimental conditions. The three imagescorrespond to first, fourth, and seventh images in thesequence from left to right. It is found that the repeata- Fig. 6. Vortex structures created under identical conditions (Re=175, Vo=2.0V, tD =62 ms). Images were taken in a runwith the left image being taken earliest and the right image taken latest. At later times, images are obscured by the soot depositedon the window as indicated by the dashed region in the last image. t,=33 ms t= 63 ms t=93 ms Fig. 7. LII images of diffusion flame wrapped into a line vortex: evolution of vortex initiated from the air side (top row); evolutionof vortex initiated from the fuel side (bottom row). Lines “a”and“b”are those along which intensity profiles are plotted in Fig. 8.The intensity map for all images is common and ranges from 0 (blue) to 350 (red) counts. bility of the experiment is remarkable with almostidentical vortex-flame interactions reproduced timeafter time. This high degree of repeatability allowedassembling of the flame-vortex interaction history with virtually no variability. However, it was foundthat the soot buildup on the window presented a prob-lem. The left image taken immediately after cleaningthe soot deposit on the window did not suffer from this effect while the later images show a vertical stripwhere soot from the straight diffusion flame in be-tween the generated vortices obscured the LII signalin this region. This necessitated frequent cleaning ofthe quartz windows in between experimental runs andonly the first few images after cleaning of the windowwere utilized for analysis. After the preliminary experiments, the soot dis-tributions during the vortex-flame interactions wereimaged as shown in Fig. 7. In this figure, the inter-action was imaged at three different time delays, tD,with respect to the vortex initiation pulse (see Fig.2).Vortices were initiated from either fuel or air streamsto study the differences. The top row of images wasobtained when the vortex was initiated by pulsingthe flow from the air stream whereas the bottom rowshows those for the case of vortices generated fromthe fuel stream. In addition, the initially undisturbedflame front image is shown on the left. It was foundthat the width of the soot layer and the LII intensity,which is approximately proportional to the soot vol-ume fraction, are both higher for the vortices initiatedfrom the air stream. The vortex core contains signif-icantly more soot for the vortex generated from theair side whereas the soot is confined to thinner layersat the diffusion flame front when vortex is generatedfrom the fuel stream. This difference can be explainedbased on the layered fuel-air structure wound by thevortex. When the vortex is initiated from the air side,the vortex core and inner windings contain more airthan fuel as compared to the vortices generated fromthe fuel side which have an abundance of fuel in andaround the vortex core. This asymmetry also observedin nonreacting mixing studies [15,16] is believed tobe responsible for the differences in soot productionin addition to curvature and stretch effects discussedlater. The higher amount of air entrained into the vor-tex core for the vortex generated from the air side al-lows a more complete burning of fuel requiring a sto-ichiometric volumetric ratio of air to fuel of about 1.8in these experiments. In contrast, vortices generatedfrom the fuel side contain more fuel than air in thecore regions that could not fully consume the avail-able fuel, hence a lesser amount of diffusive burningand soot production. These differences provide a pos-sible explanation for the observed soot yield. It shouldbe pointed out that the important factor here is not theoverall mixture ratio of air and fuel, but the available ( -C o ntribution of the natural emission from PAH and other species is small a t around 460 nm as confirmed from i m-ages t aken w ithout the laser pulse. LIF s ignal f rom P AH is red-shifted from excitation wavelength, but occurs over broadband t h at may co n tribute within th e de t ection wi n - dow at 460 nm. H o wever, the LII signal w a s integrated over 600 ns to minimize t h e LIF contributions. ) Fig. 8. Profiles of LII intensity along lines shown in Fig.7 for(a) vortex generated from the fuel side, (b) vortex generatedfrom the air side at tD=62 ms. oxidizer and fuel distribution in between successivediffusion flame layers that ultimately determine thetotal consumption and soot production in and aroundthe vortex core. The more diffuse nature of the soot inthe vortex core for the vortex generated from the airside may also be connected with the thermophoretictransport of soot within the vortex structure. Fig. 8shows the LII intensity distributions along the linesindicated in Fig. 7 for tD =62 ms. The profile for thevortex generated from the fuel side, Fig. 8a, exhibitsnarrower layers (1 to 2 mm) as compared to the layerthicknesses of 3 to 4 mm for the air-side vortex gen-eration in the inner windings of the vortex. The difference in soot yield is shown in Fig. 9 asa function of vortex initiation side and strength. It isalso found that certain regions of the flame wrappedinto the vortex have higher LII signal levels (corre-sponding to higher soot concentrations) than otherparts. These differences result from stretch and curva-ture effects of the flame being wrapped by the vortex.Fig. 10 shows the effects of flame curvature on localsoot yield. The two images on the left show the twodifferent vortex interaction cases. If the flame frontis curved convex toward the fuel side (Region I), thetransport of heat from the flame is such that moreheat is concentrated toward the preheat region on thefuel side resulting in a larger amount of soot since V=1.5V V= 2.0 V V=2.5V Fig. 9. Soot images for three different vortex strengths at tD=62 ms. Top row shows vortices generated from the air sidewhereas the bottom row shows images for vortices generated from the fuel side. Fig. 10. Soot layer thickness as a function of curvature of the flame with respect to the fuel side. Regions I with flame convex tothe fuel side produce more soot and thicker layer than Regions II with flame concave to the fuel side. Arrows point to the localheat flux direction away from the flame. soot is formed on the fuel side of the diffusion flamefront. If the flame is concave to the fuel side (Re-gion II), the heat transport from the flame is a lessconcentrated than the previous case and this resultsin less local soot production. These differences areconsistently observed in the LII images shown on theleft of Fig. 10. Furthermore, stretching of the flame front also affects the diffusion flame structure withexcessive extensional stretch lowering the peak flametemperatures with consequently lower local soot pro-duction[231. Thetotal soot yield in the field of the flame-vortexinteraction was also computed to determine the ef-fects of vortex strength, time of evolution, and the o Fuel side Re =70 Fuel side Re=180 A Fuel side Re=280 (b) side from which the vortex is initiated. To evaluatethis, the LII signal intensity was integrated over thewhole vortex interaction region after background in-tensity subtraction and normalization. Since only therelative changes are meaningful, this quantity was fur-ther normalized by that for the straight flame (i.e., novortex interaction) to reflect it as an augmentation fac-tor. Fig. 11 shows these results for the two cases ofvortex initiated from the air and fuel sides. The sootyield increases with the vortex time of evolution ex-cept for the case of high vortex strength (Re=280) at93 ms in which case the vortex growth had subsidedupon wall interaction. Vortex generation from the airside yields a higher amount of soot for all times andvortex strengths. The levels of enhancement over thesteady planar diffusion flame front between factorsof 2 to 3 are consistent with the findings of Shaddix et al. [4]. The differences in soot yield as a functionof vortex strength are greater for the vortex initiatedfrom the air side for Re~ 70 and 180. It should benoted that the full extent of the vortex was not cap-tured for Re=280 as this vortex was distorted in thecross-stream direction due to wall confinement andthe one of the outer vortex flame arms was quenched.This is the reason why the data point at 93 ms doesnot fit the trend. In contrast to the results for the air-side vortex, the interaction from the fuel side does notshow as large a sensitivity to the vortex strength. Thisis due to the lack of soot in the core of the vortex andthe soot contained in the inner vortex arms not beingas high as the other case. It is also apparent that theamount of soot contained within the vortex can be lessthan the planar diffusion flame for vortices initiatedfrom the fuel side. While this may appear to be impos- sible based on the larger flame surface area generatedby the vortex, the lower local soot yield in the vortexcan still result in a smaller overall soot yield as shownin Fig.7. Finally, the rate of growth of soot yield ismuch less dependent on vortex strength as comparedto the case where vortices were generated from the airside with the possible exception for Re=70. 5. Concluding remarks An experimental study of soot topography in aplanar diffusion flame-vortex interaction is reported.Using the laser-induced incandescence as a qualita-tive means for identifying the soot-containing regions,planar soot distribution images during this interactionwere obtained and analyzed to determine the overallsoot yield. It was found that the soot distribution in thevortex is different depending on the reactant streamfrom which the vortex is initiated. For vortices inter-acting with the flame front from the air side, the totalamount of soot is higher and it diffusely occupies thecore region of the vortex. The laser-induced incandes-cence from soot appears in thicker layers and is ofhigher magnitude than the cases when vortex is spunfrom the fuel side. For fuel-side interaction, soot isconfined to thinner regions of lower maximum inten-sity. Flame curvature affects the local soot yield withregions of the flame convex toward the fuel producinglocally more soot. This is explained based on the heattransport away from the curved flame front and its ef-fect on soot forming in the preheat zone on the fuelside of the flame front. The normalized (with respectto the planar undisturbed flame) overall soot yield hasvalues between 2 and 3 which agrees with the resultsof Shaddix et al. [4]. The soot yield from the vorticesgenerated from the air side is higher than those gener-ated from the fuel side and show higher sensitivity tovortex strength. Acknowledgments Early development of flow apparatus and prelimi-nary experiments were undertaken when B.M.C. wason sabbatical visit at Ecole Centrale Paris. B.M.C.thanks Prof. S. Candel for hosting him during thisvisit. Financial support of CNRS during this stay wasvery much appreciated. B.M.C. also thanks Dr. Daniel Durox and Mr. Philippe Scouflaire of EM2C labora-tory for their help with the early development of thevortex apparatus. References ( . [1 ] I . Glassman, Proc. Combust. I nst. 22(1988) 2 9 5. ) ( [2] H. Richter, J.B. Howard, P rog. E nergy Combust.Sci. 26(4-6)(2000)565. ) ( [3] K.C. Smyth, C .R. S haddix, D. E v erest, Combust.Flame 111 (1997) 185. ) ( [4] C. Shaddix, T.C. Williams, L . G. Blevins, R.W. Sc h efer, Proc.Combust. Inst. 30 (2004) 1501. ) ( [5] P.H. Renard, D. Th e venin, J.C. Rolon, S. C a ndel, Prog. Energy Combust. Sci. 26 (2000) 225. ) ( .[6] F.E . Marble, in: C. Casci, C. Bruno (Eds.), Recent Advances in Aerospace Sciences, Plenum, New Y ork, 1985, pp. 395-413. ) ( [7] A.R. Karagozian, F .E. Marble, C ombust. S c i. T e ch- nol. 45 (1986) 65. ) ( [8] A.M. Laverdant, S . Candel, Combust. Sci. Technol. 60 (1989)79. ) ( [9] J.C. Rolon, F . Aguerre , S . Candel , Combust. Flame 100(3)(1995)422. ) ( [10] B.M. Cetegen, W .A. S i rignano, Combust. Sci. T e ch-nol. 72(1990) 157. ) ( [11 ] A.M. Laverdant, S. Candel, J. Propul. Power 5 (1989) 139. ) ( [12] N. Peters, F.A. Williams, Proc. C ombust. I n st. 22 (1988) 495. ) ( [13] W.L. R oberts, J. F .Driscoll, Combust. Flame 87 (1991) 245-256. ) ( [14] J .F.Driscoll, D.J. Sutkus, W.L. R o berts, M.E. Post, L.P.Goss, Combust. Sci. Technol. 96(4-6)(1996) 213. ) ( [ 1 5] B.M. C etegen,N. M o hamad, J. Fluid Mech. 249 (1993) 391-414. ) ( [16] B.M. C etegen, E xp. F luids 40 (2006) 967-976. ) ( [17] B. Quay, T.W. L ee, T . N i, R.J. Santoro, Combust. F lame 97 (1994) 384. ) ( [18] T . Ni, J.A. Pinson,S. Gupta, R.J. Santoro, Appl. Opt. 34(1995) 7083. ) ( [19] C. Schulz, B.F. Kock, M. Hofmann, H . M i chelen, S Will, B. Bougie, R. Suntz, G. Smallwood, Appl. PhysB 83 (3)(2006)333. ) ( [20] L.A. Melton, Appl. Opt. 23 (1984) 2201. ) ( [21] B. Mewes, J .M. S eitzman, Appl. Opt. 36 (3) ( 1997) 709. ) ( [22] H.A. M ichelsen, P.O. Witze, D . K a yes, S. Hochgreb,Appl. Opt.42(27) (2003)5577. ) ( [23] B.M. Cetegen, D.R. Bogue, Combust. Flame 86 (1991) 359. )
确定
还剩9页未读,是否继续阅读?

产品配置单


北京欧兰科技发展有限公司为您提供《碳烟,火焰,流体中速度场,浓度场,碳烟体积分数,碳烟初级粒径检测方案(粒子图像测速)》,该方案主要用于其他中速度场,浓度场,碳烟体积分数,碳烟初级粒径检测,参考标准--,《碳烟,火焰,流体中速度场,浓度场,碳烟体积分数,碳烟初级粒径检测方案(粒子图像测速)》用到的仪器有德国LaVision PIV/PLIF粒子成像测速场仪、PLIF平面激光诱导荧光火焰燃烧检测系统、激光诱导白炽光烟雾粒子成像分析仪(LII)
推荐专场


相关方案
更多
该厂商其他方案
更多