


方案详情
文
An aqueous ionic surfactant 1-dodecyl-4-dimethylaminopyridinium (DMP) bromide and the
corresponding zwitterion 2-(4-dimethylaminopyridinio)-dodecanoate (DPN) were explored
by means of molecular dynamics (MD) simulations and, for the ionic system, by infraredvisible
sum frequency generation (IR-VIS SFG). The molecular structure of the interfacial
layer was investigated for the ionic and zwitterionic systems as a function of surfactant
concentration, both in water and in salt (KF or KBr) solutions, by MD simulations in a slab
geometry. The build up of the surface monolayer and a sublayer was monitored, and density
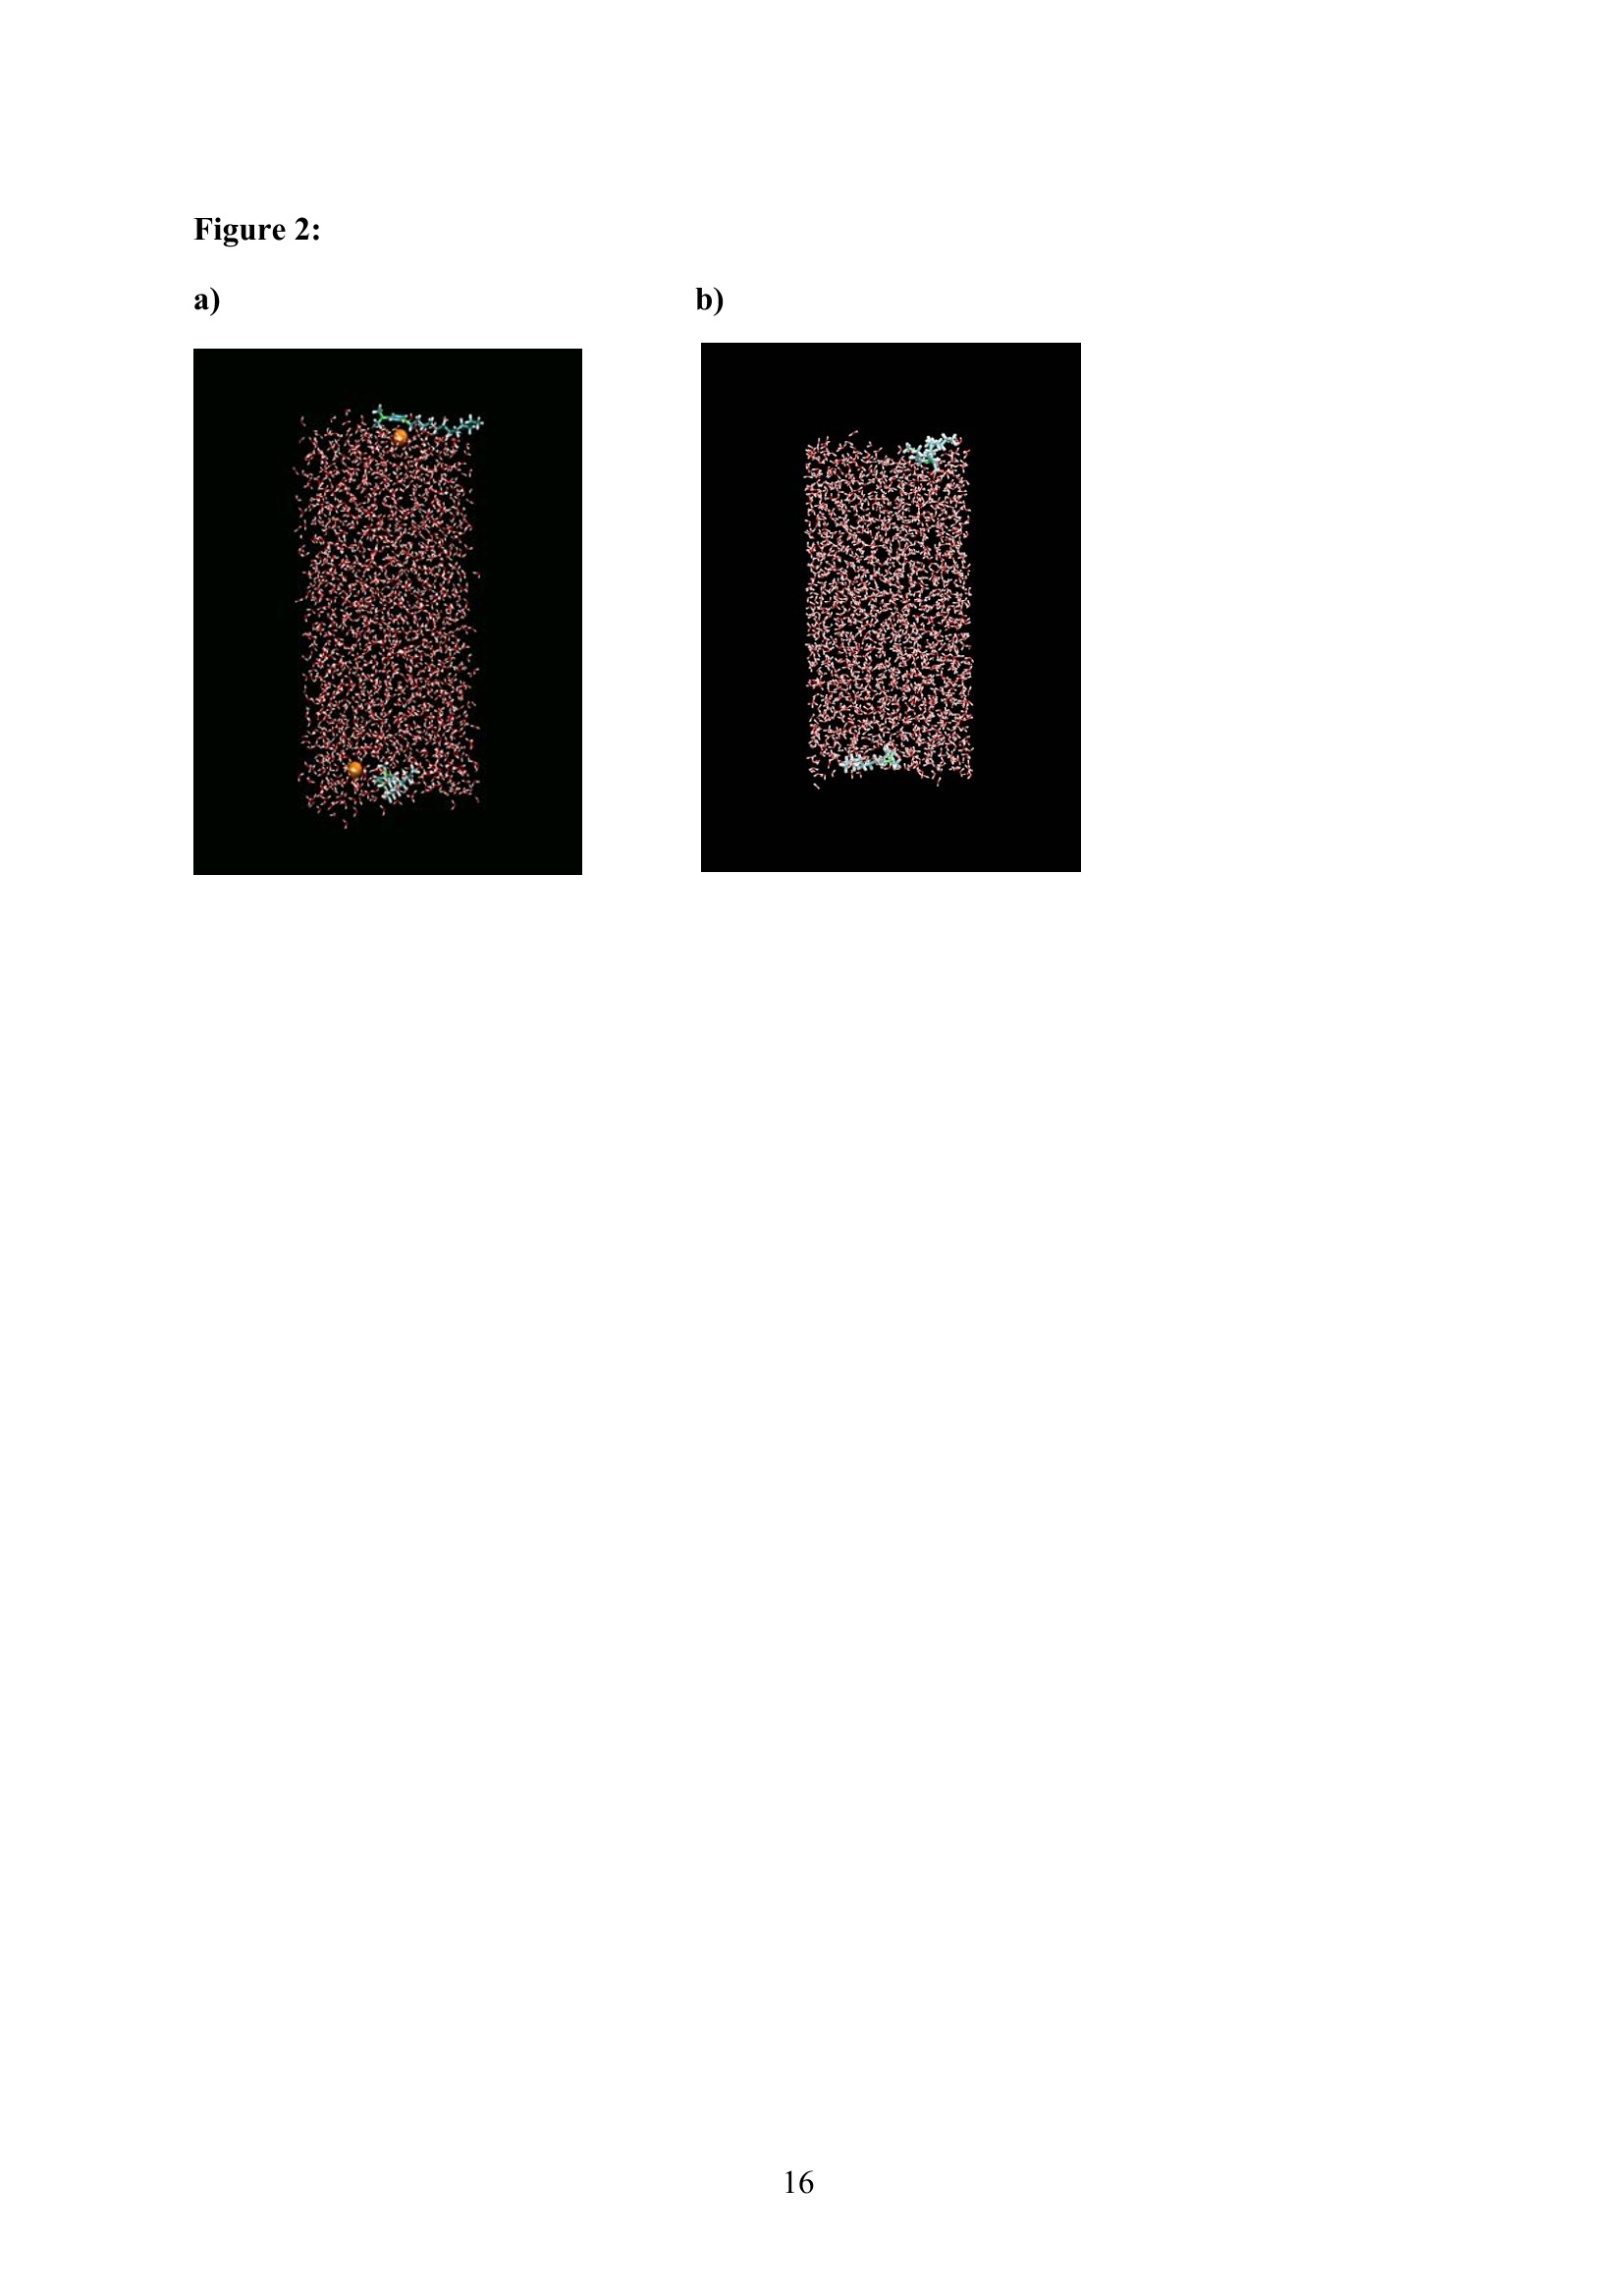
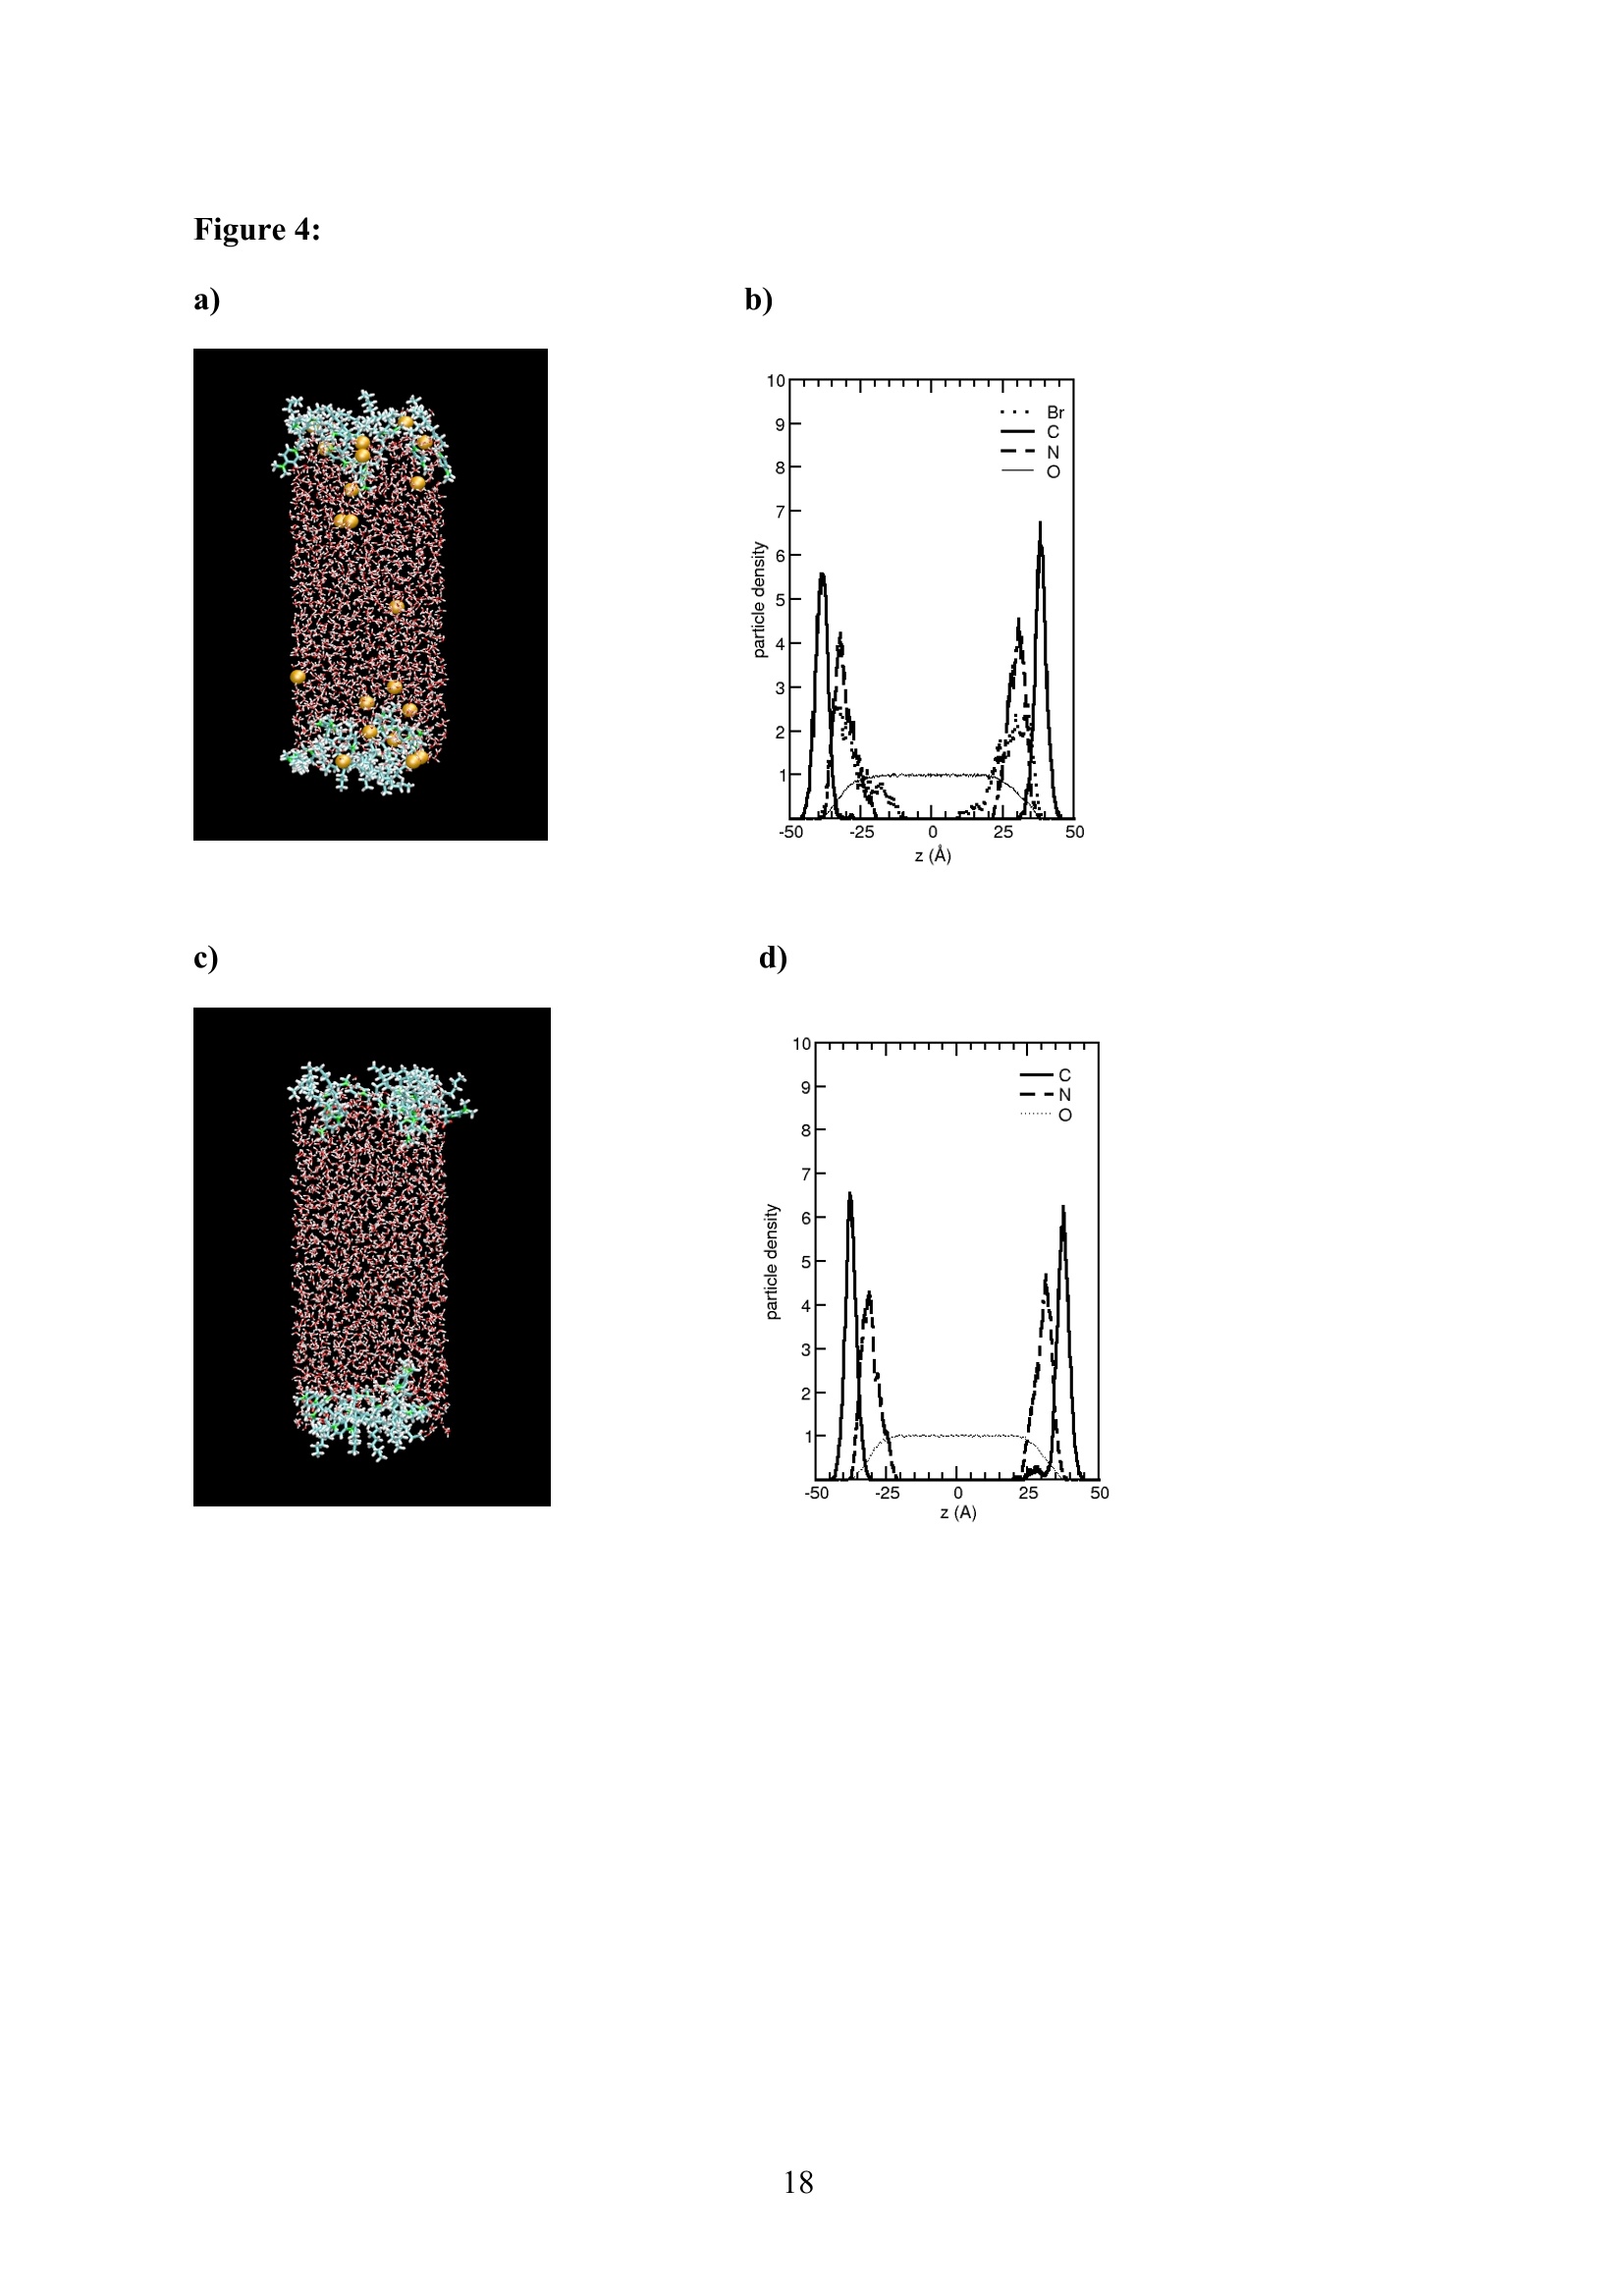
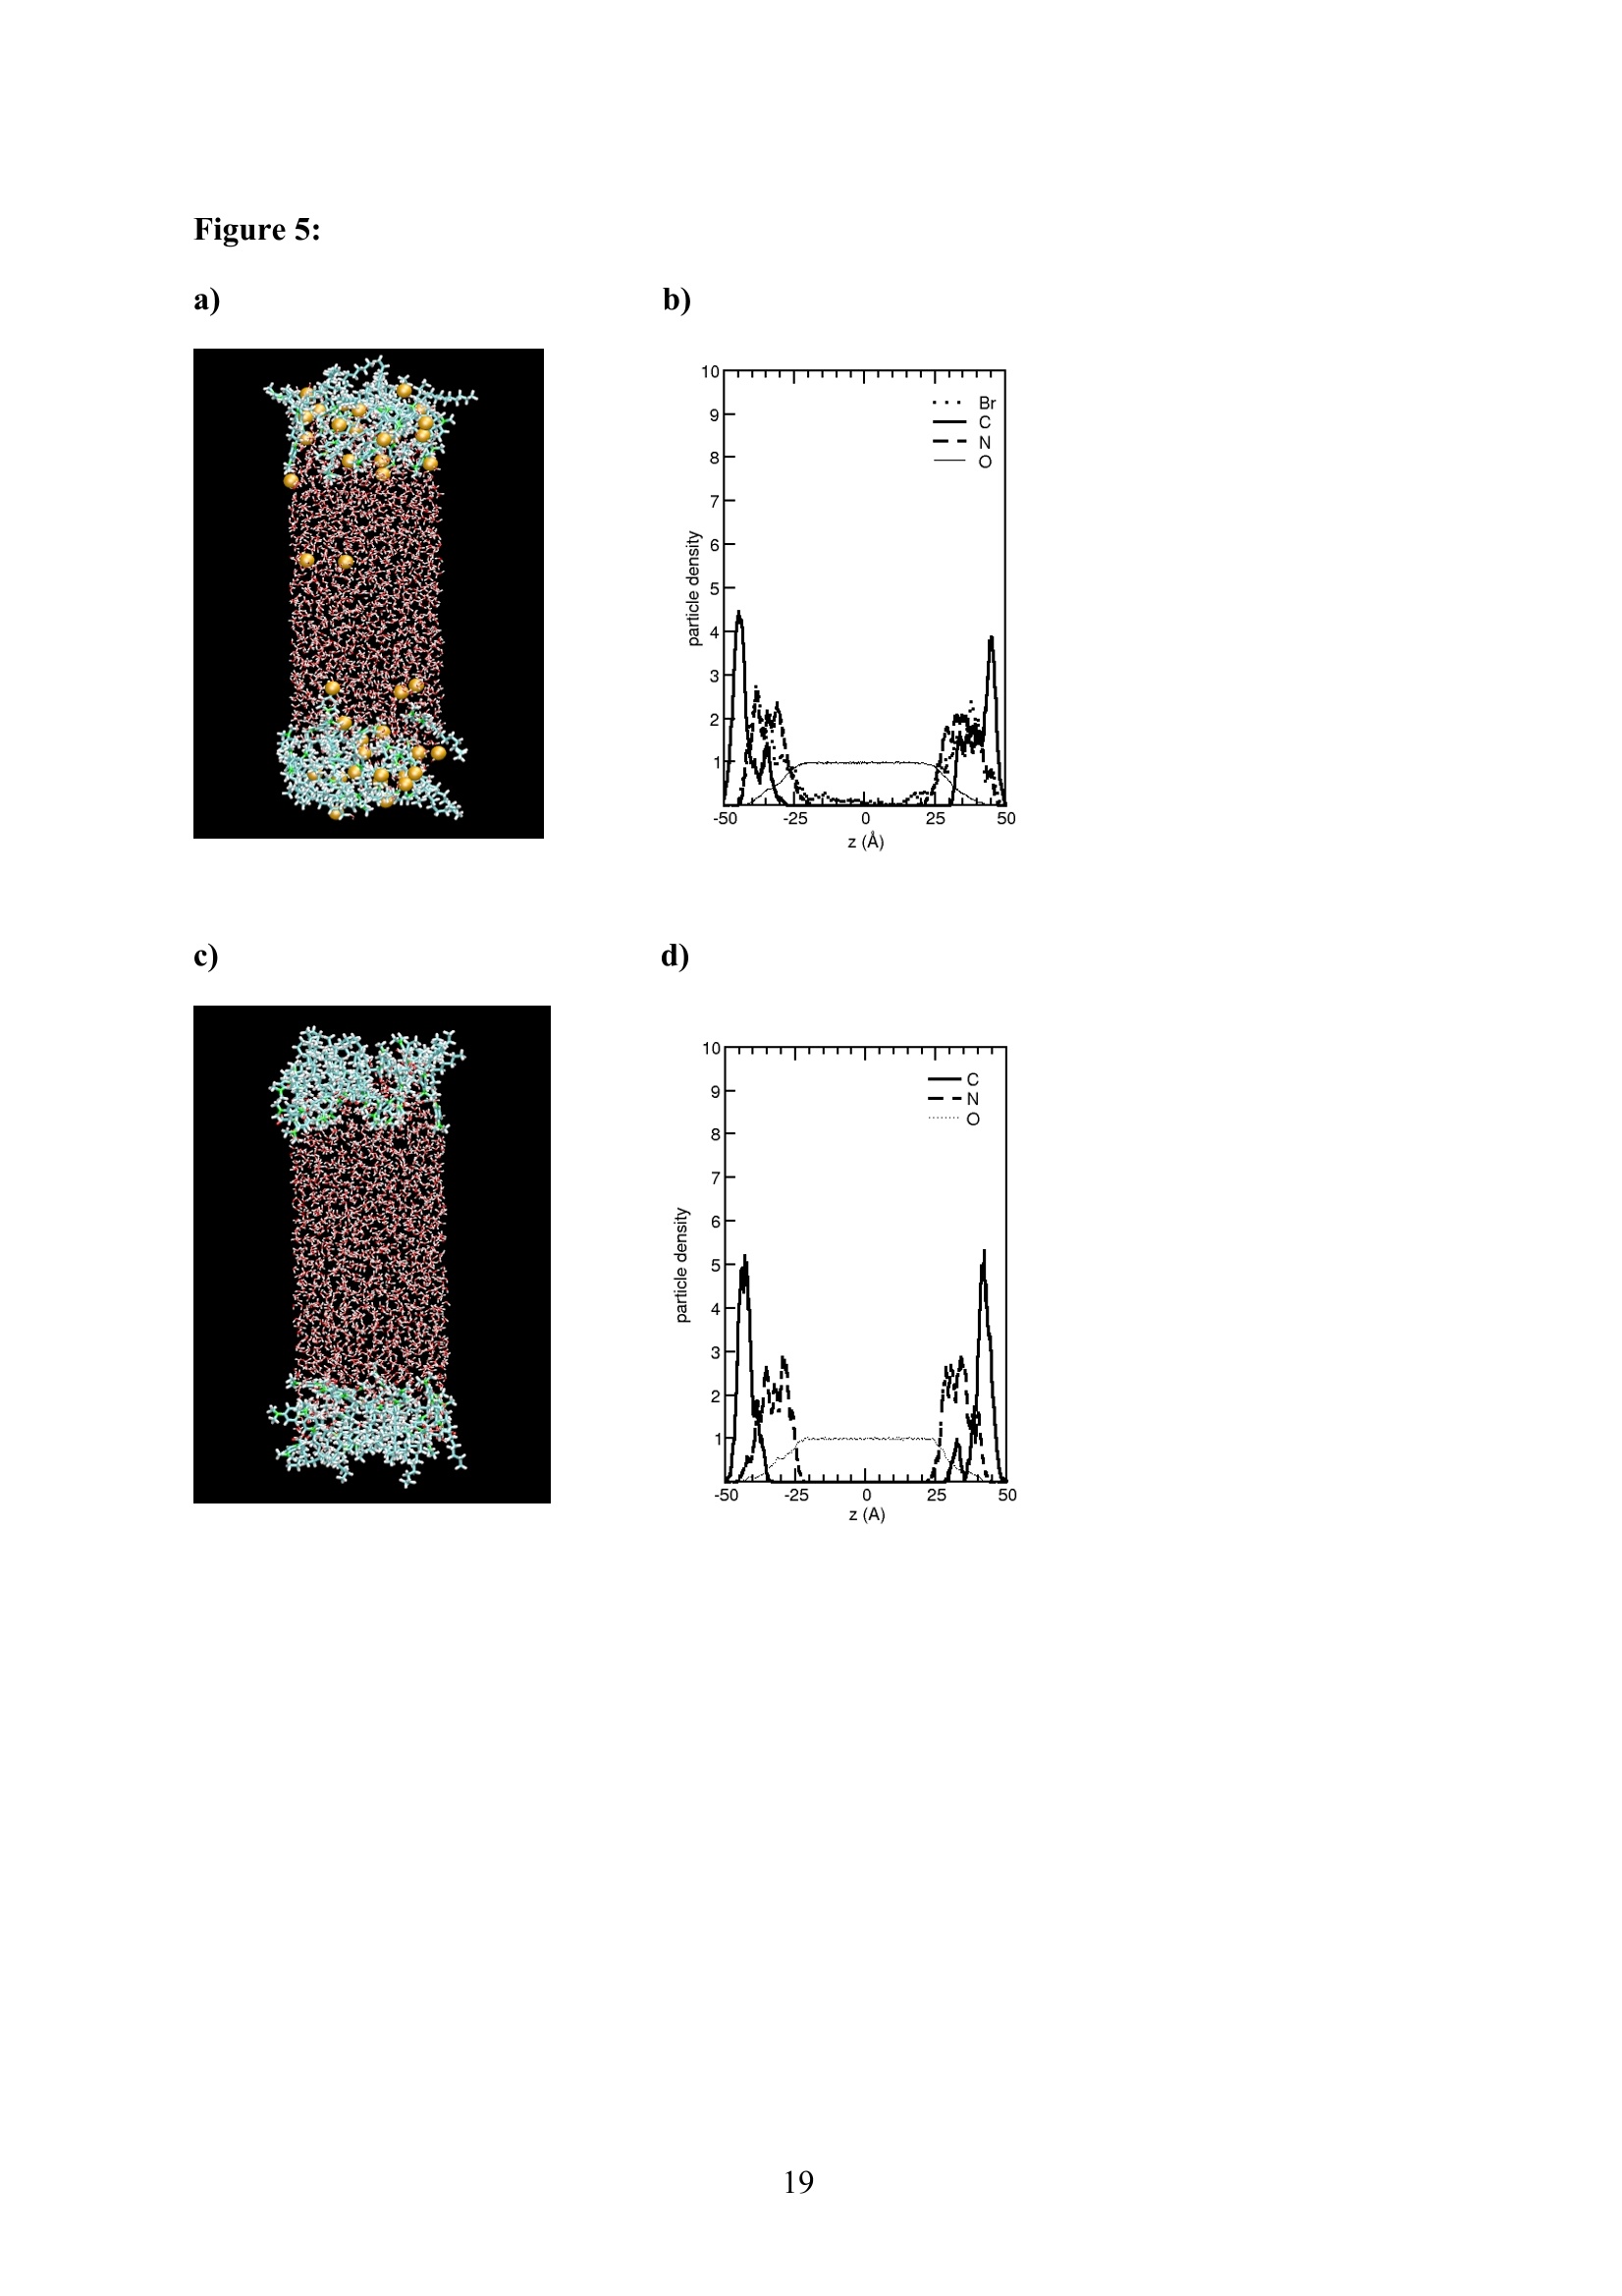
and orientational profiles of the surfactants were evaluated. The difference between the ionic
and zwitterionic systems and the effect of the added salt were analyzed at a molecular level.
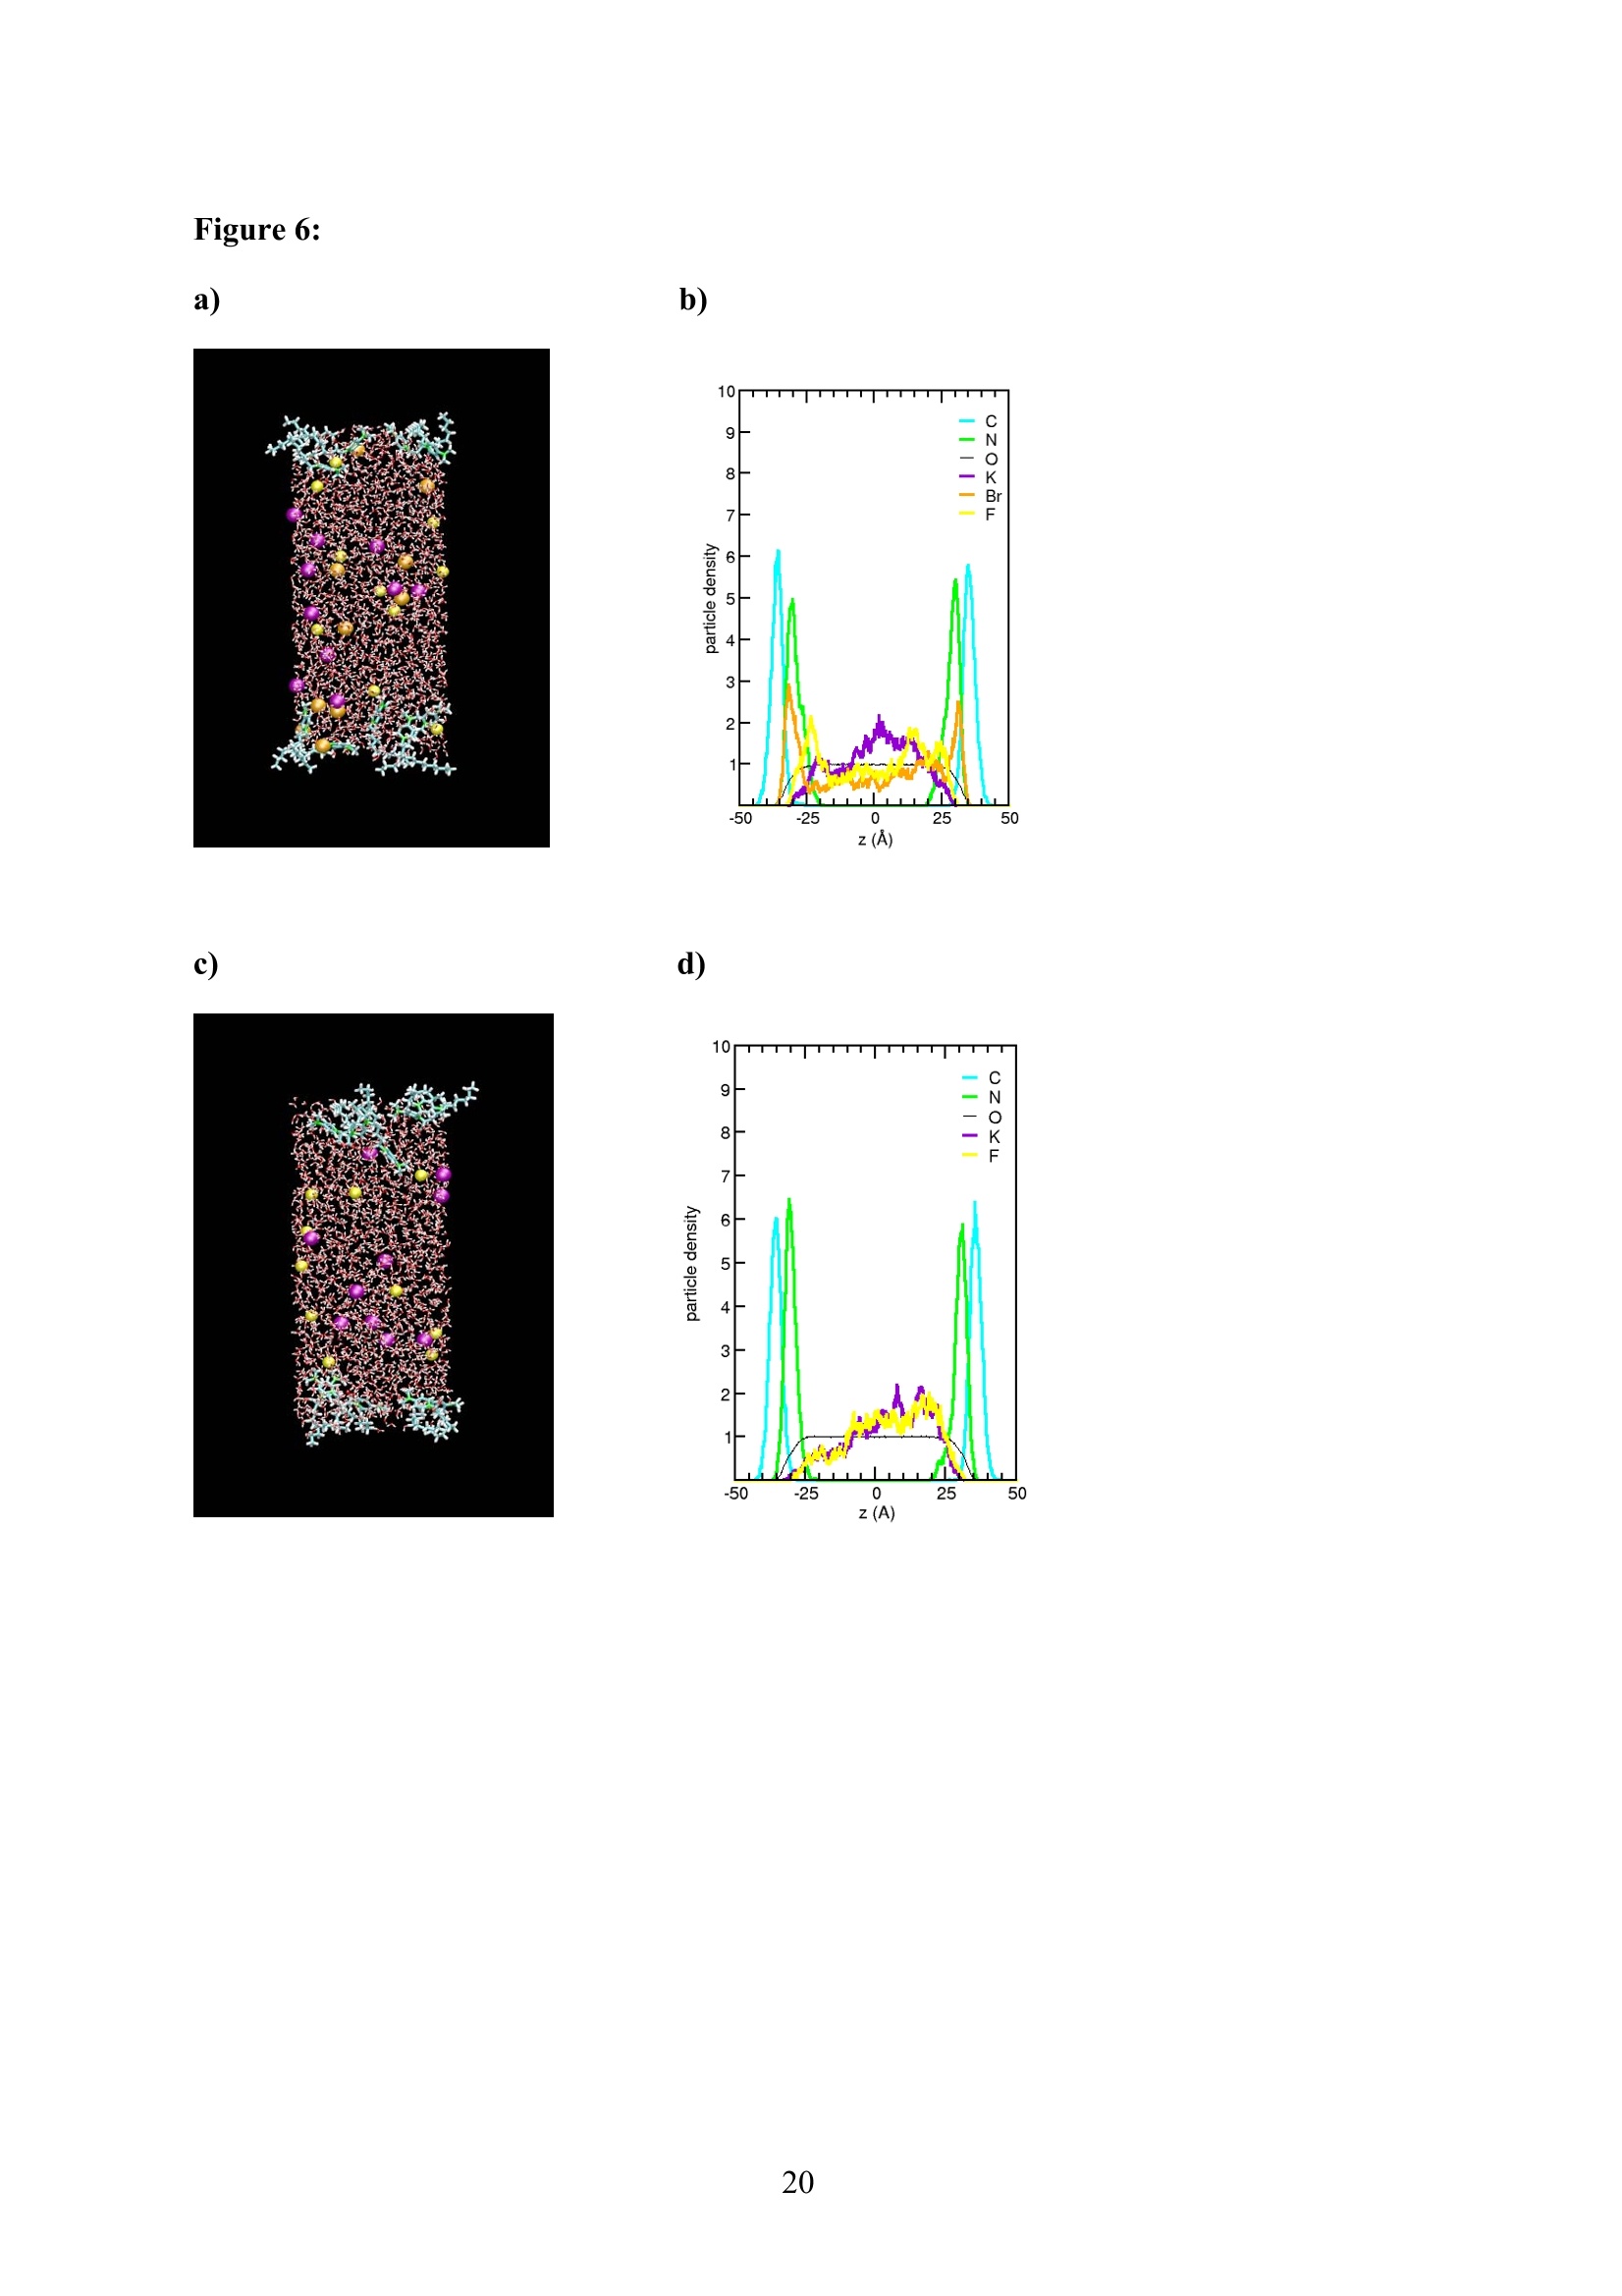
The results of MD simulations were compared to those of nonlinear optical spectroscopy
measurements. Infrared visible sum frequency generation (IR-VIS SFG) was employed to
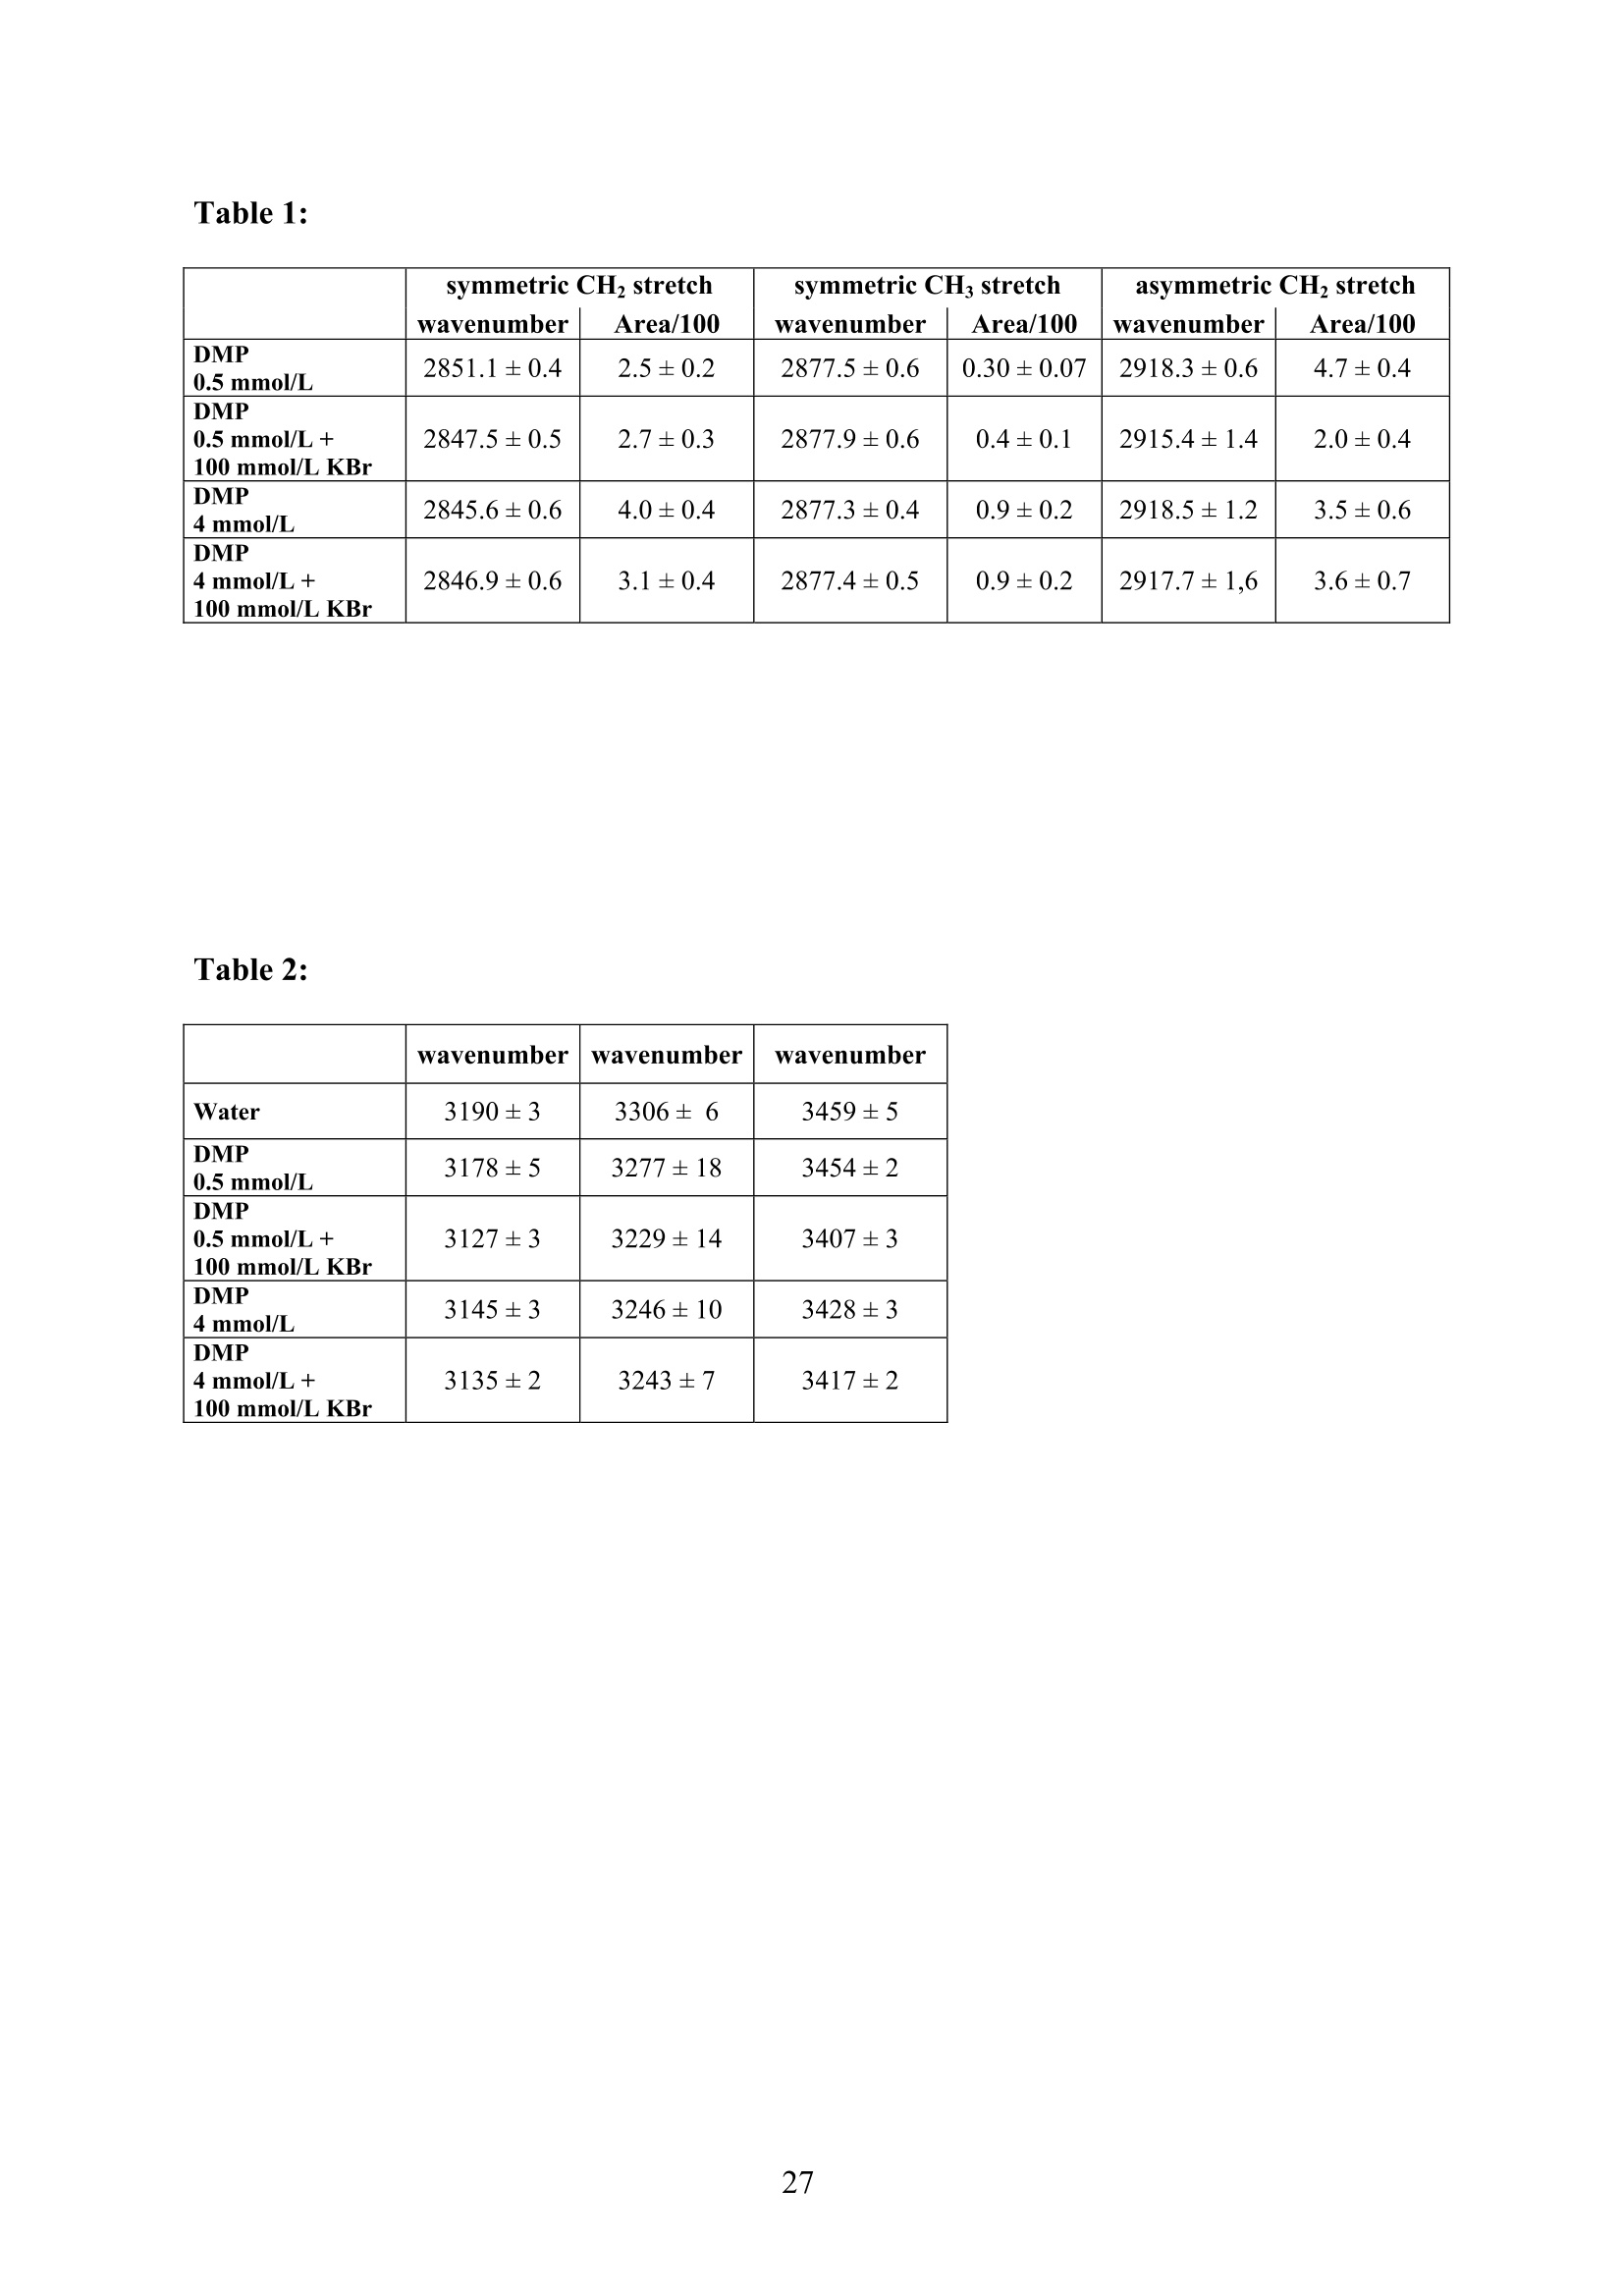
study the DMP ionic surfactant in water and upon addition of simple salts. The influence of
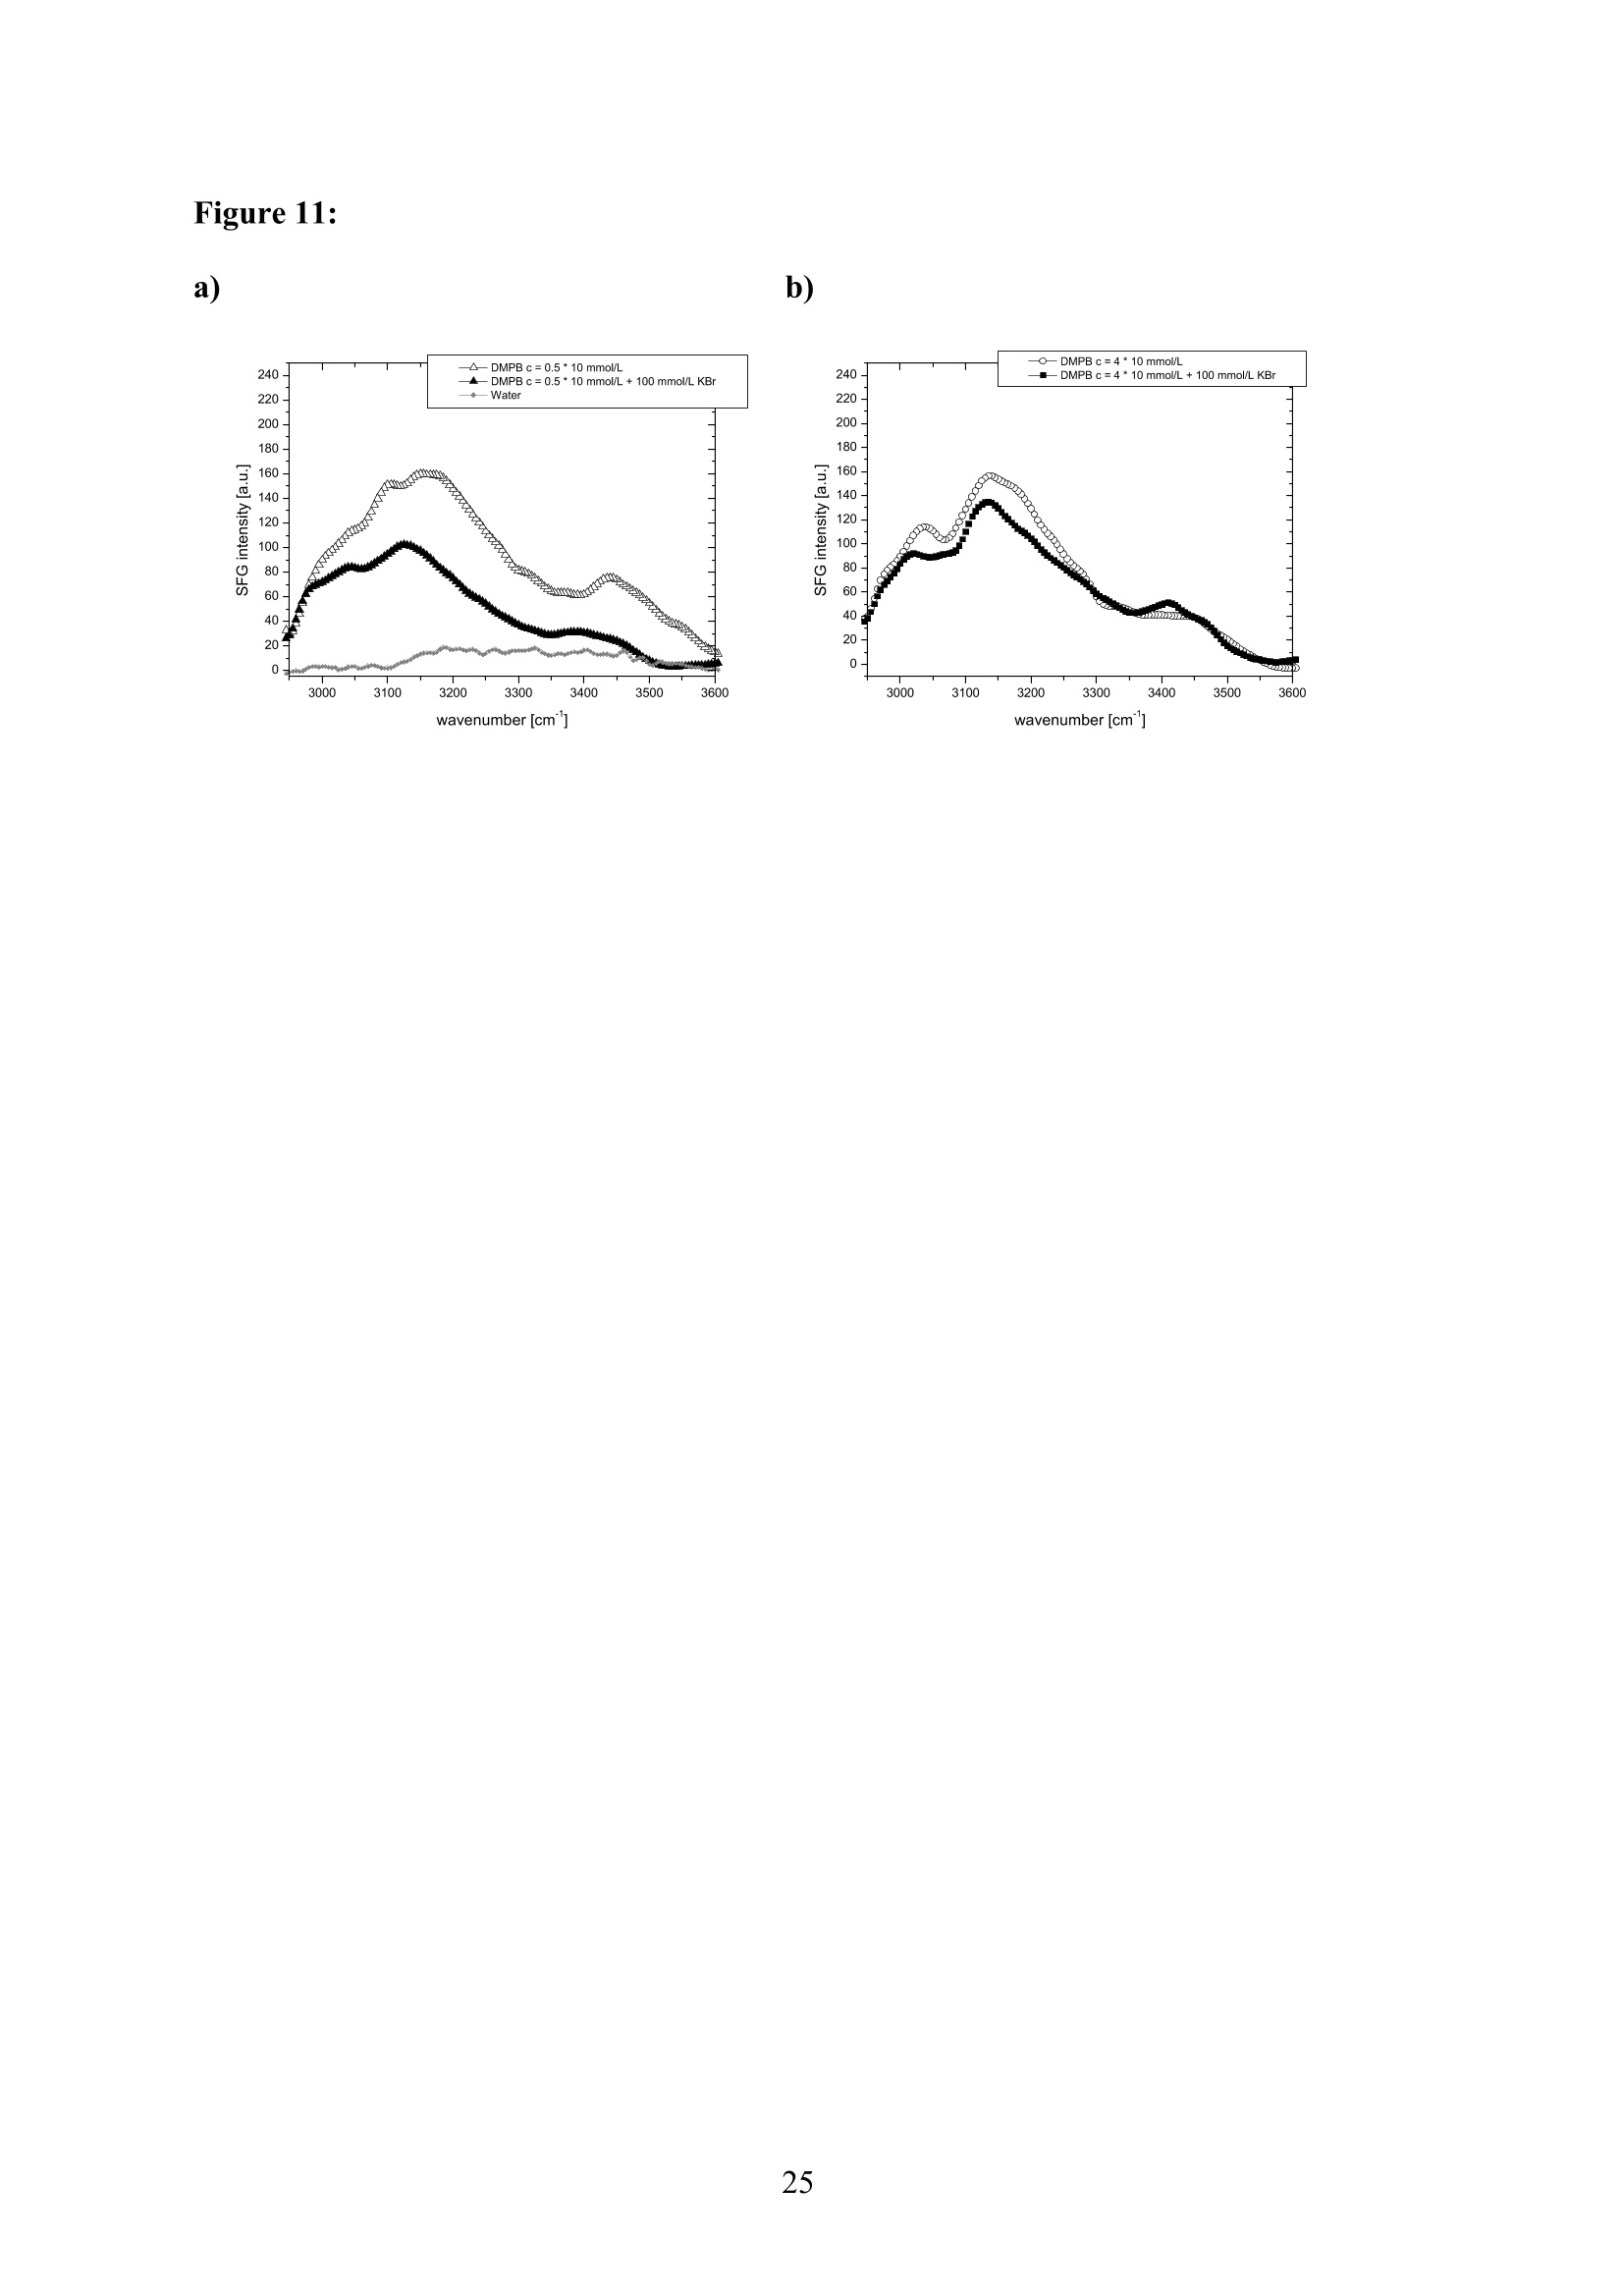
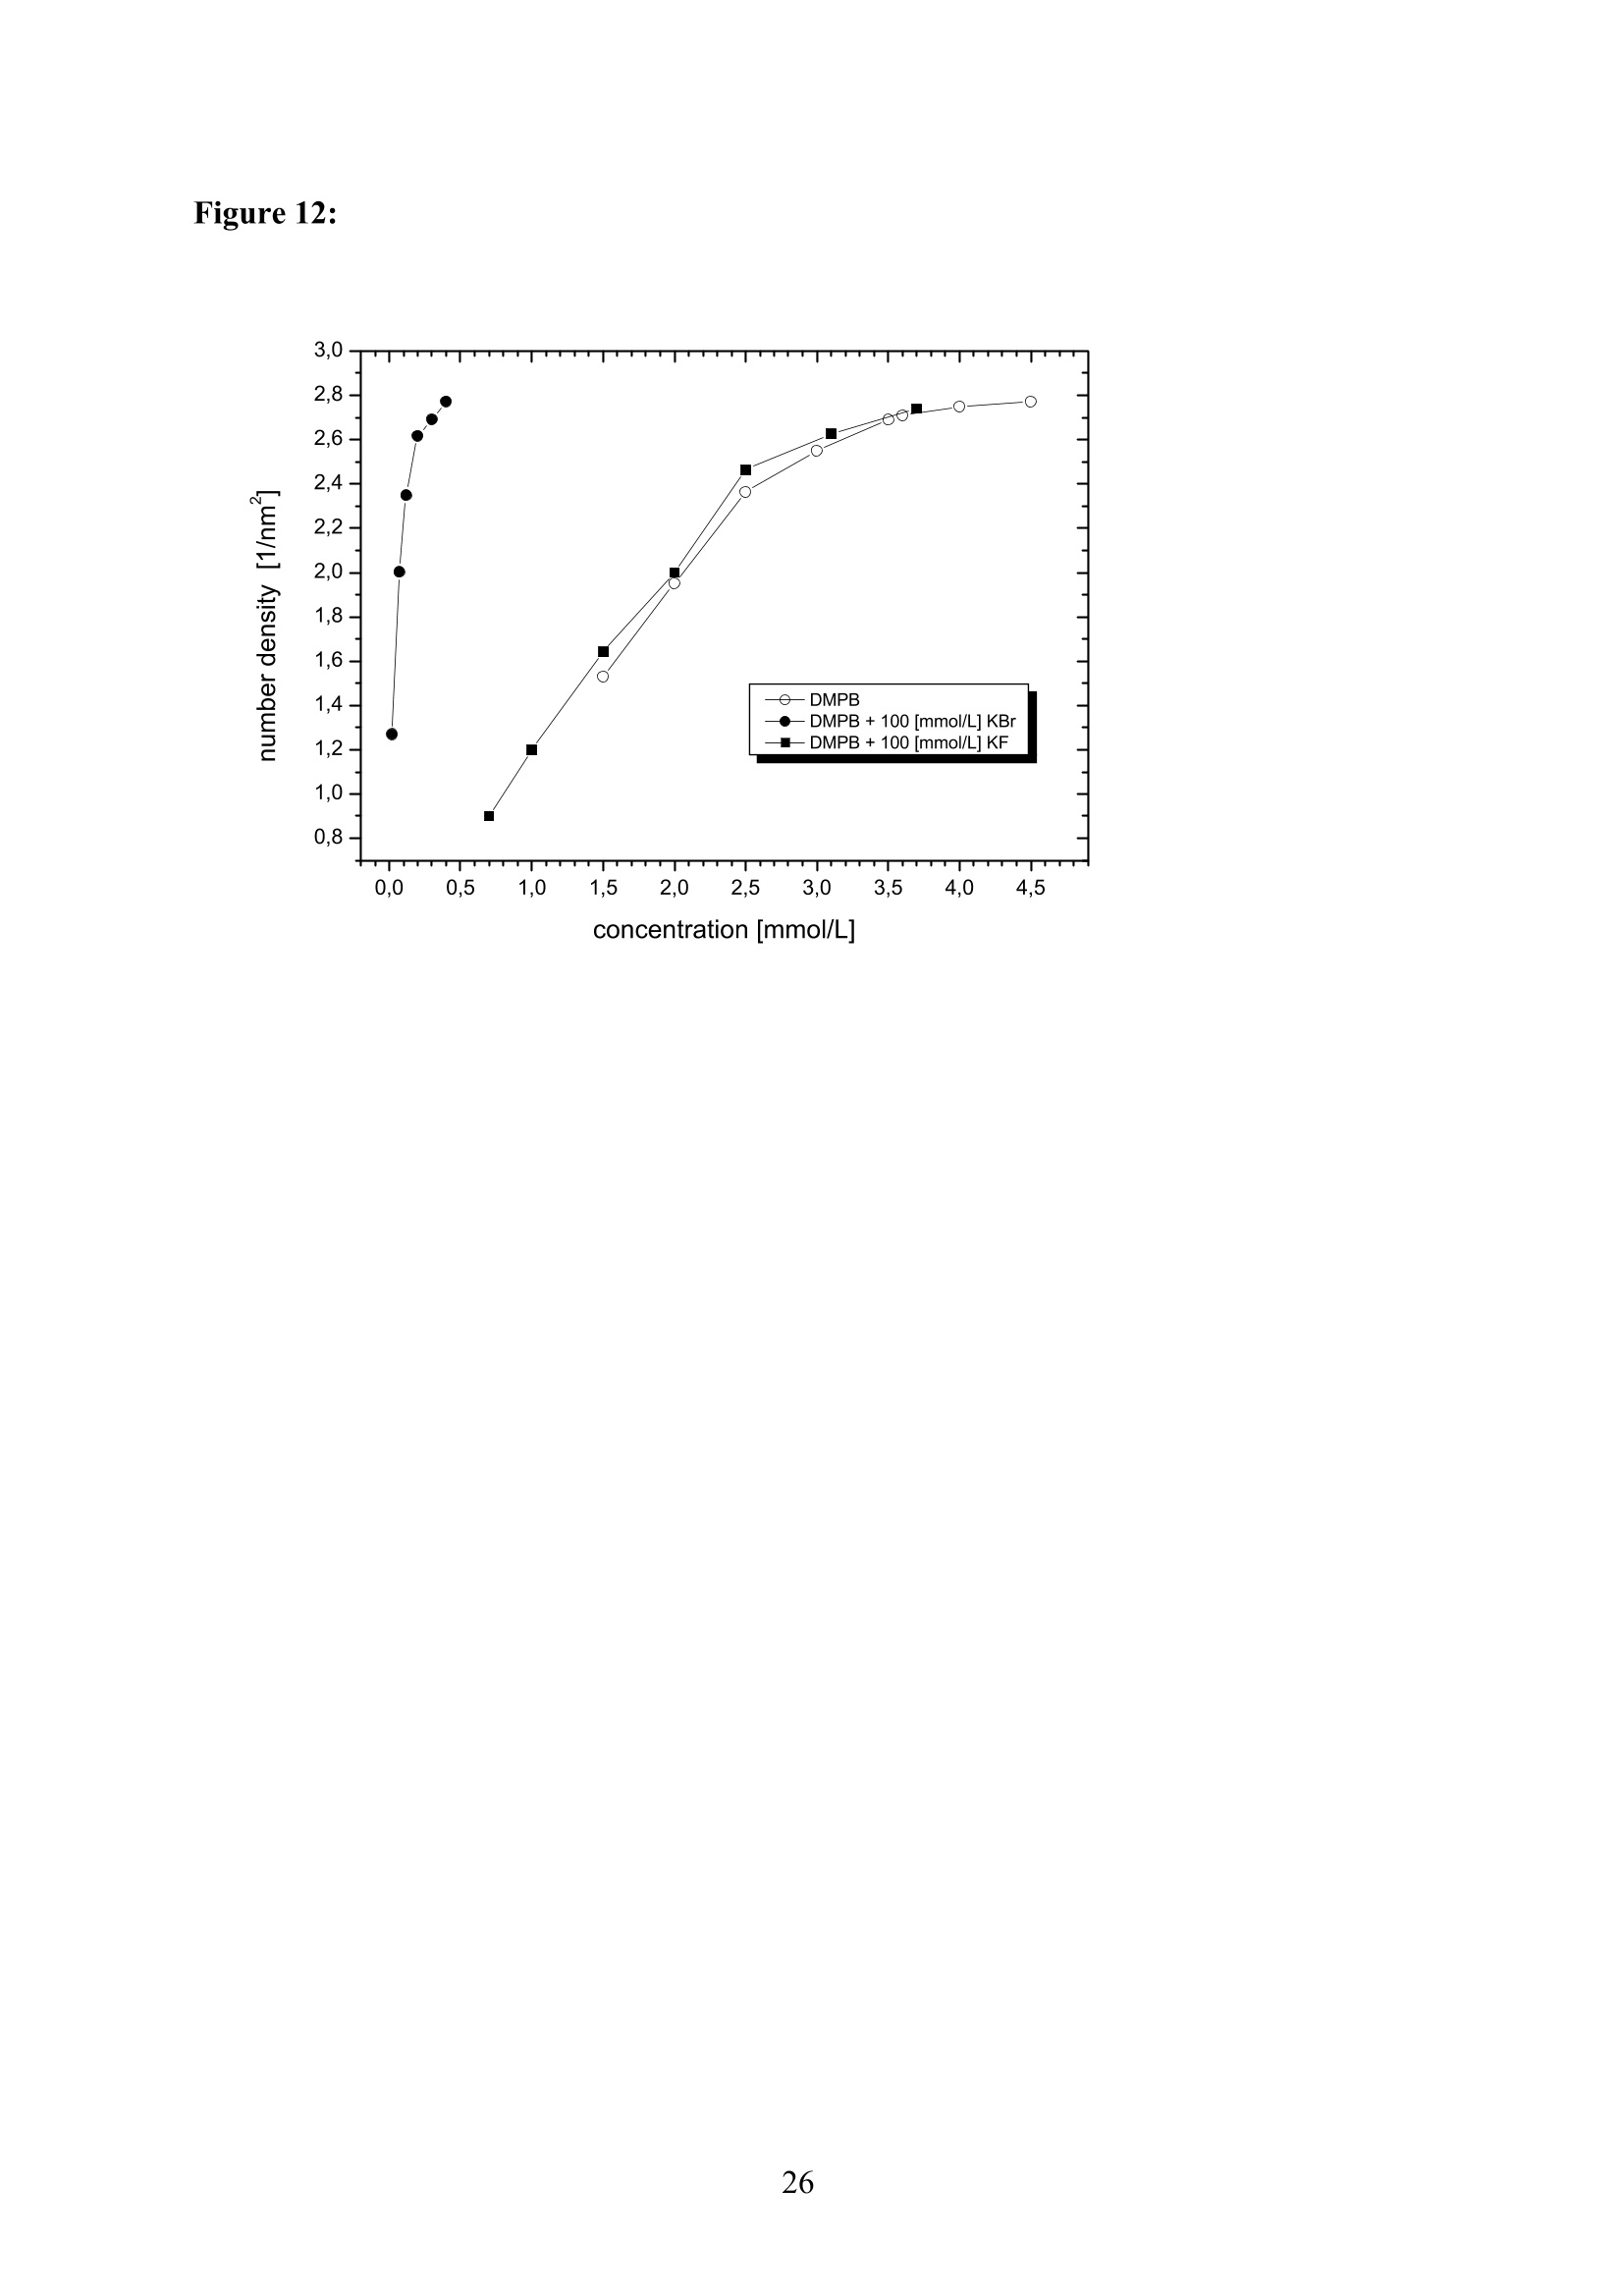
added salts on the different molecular moieties at the interface was quantified in detail
experimentally.
方案详情

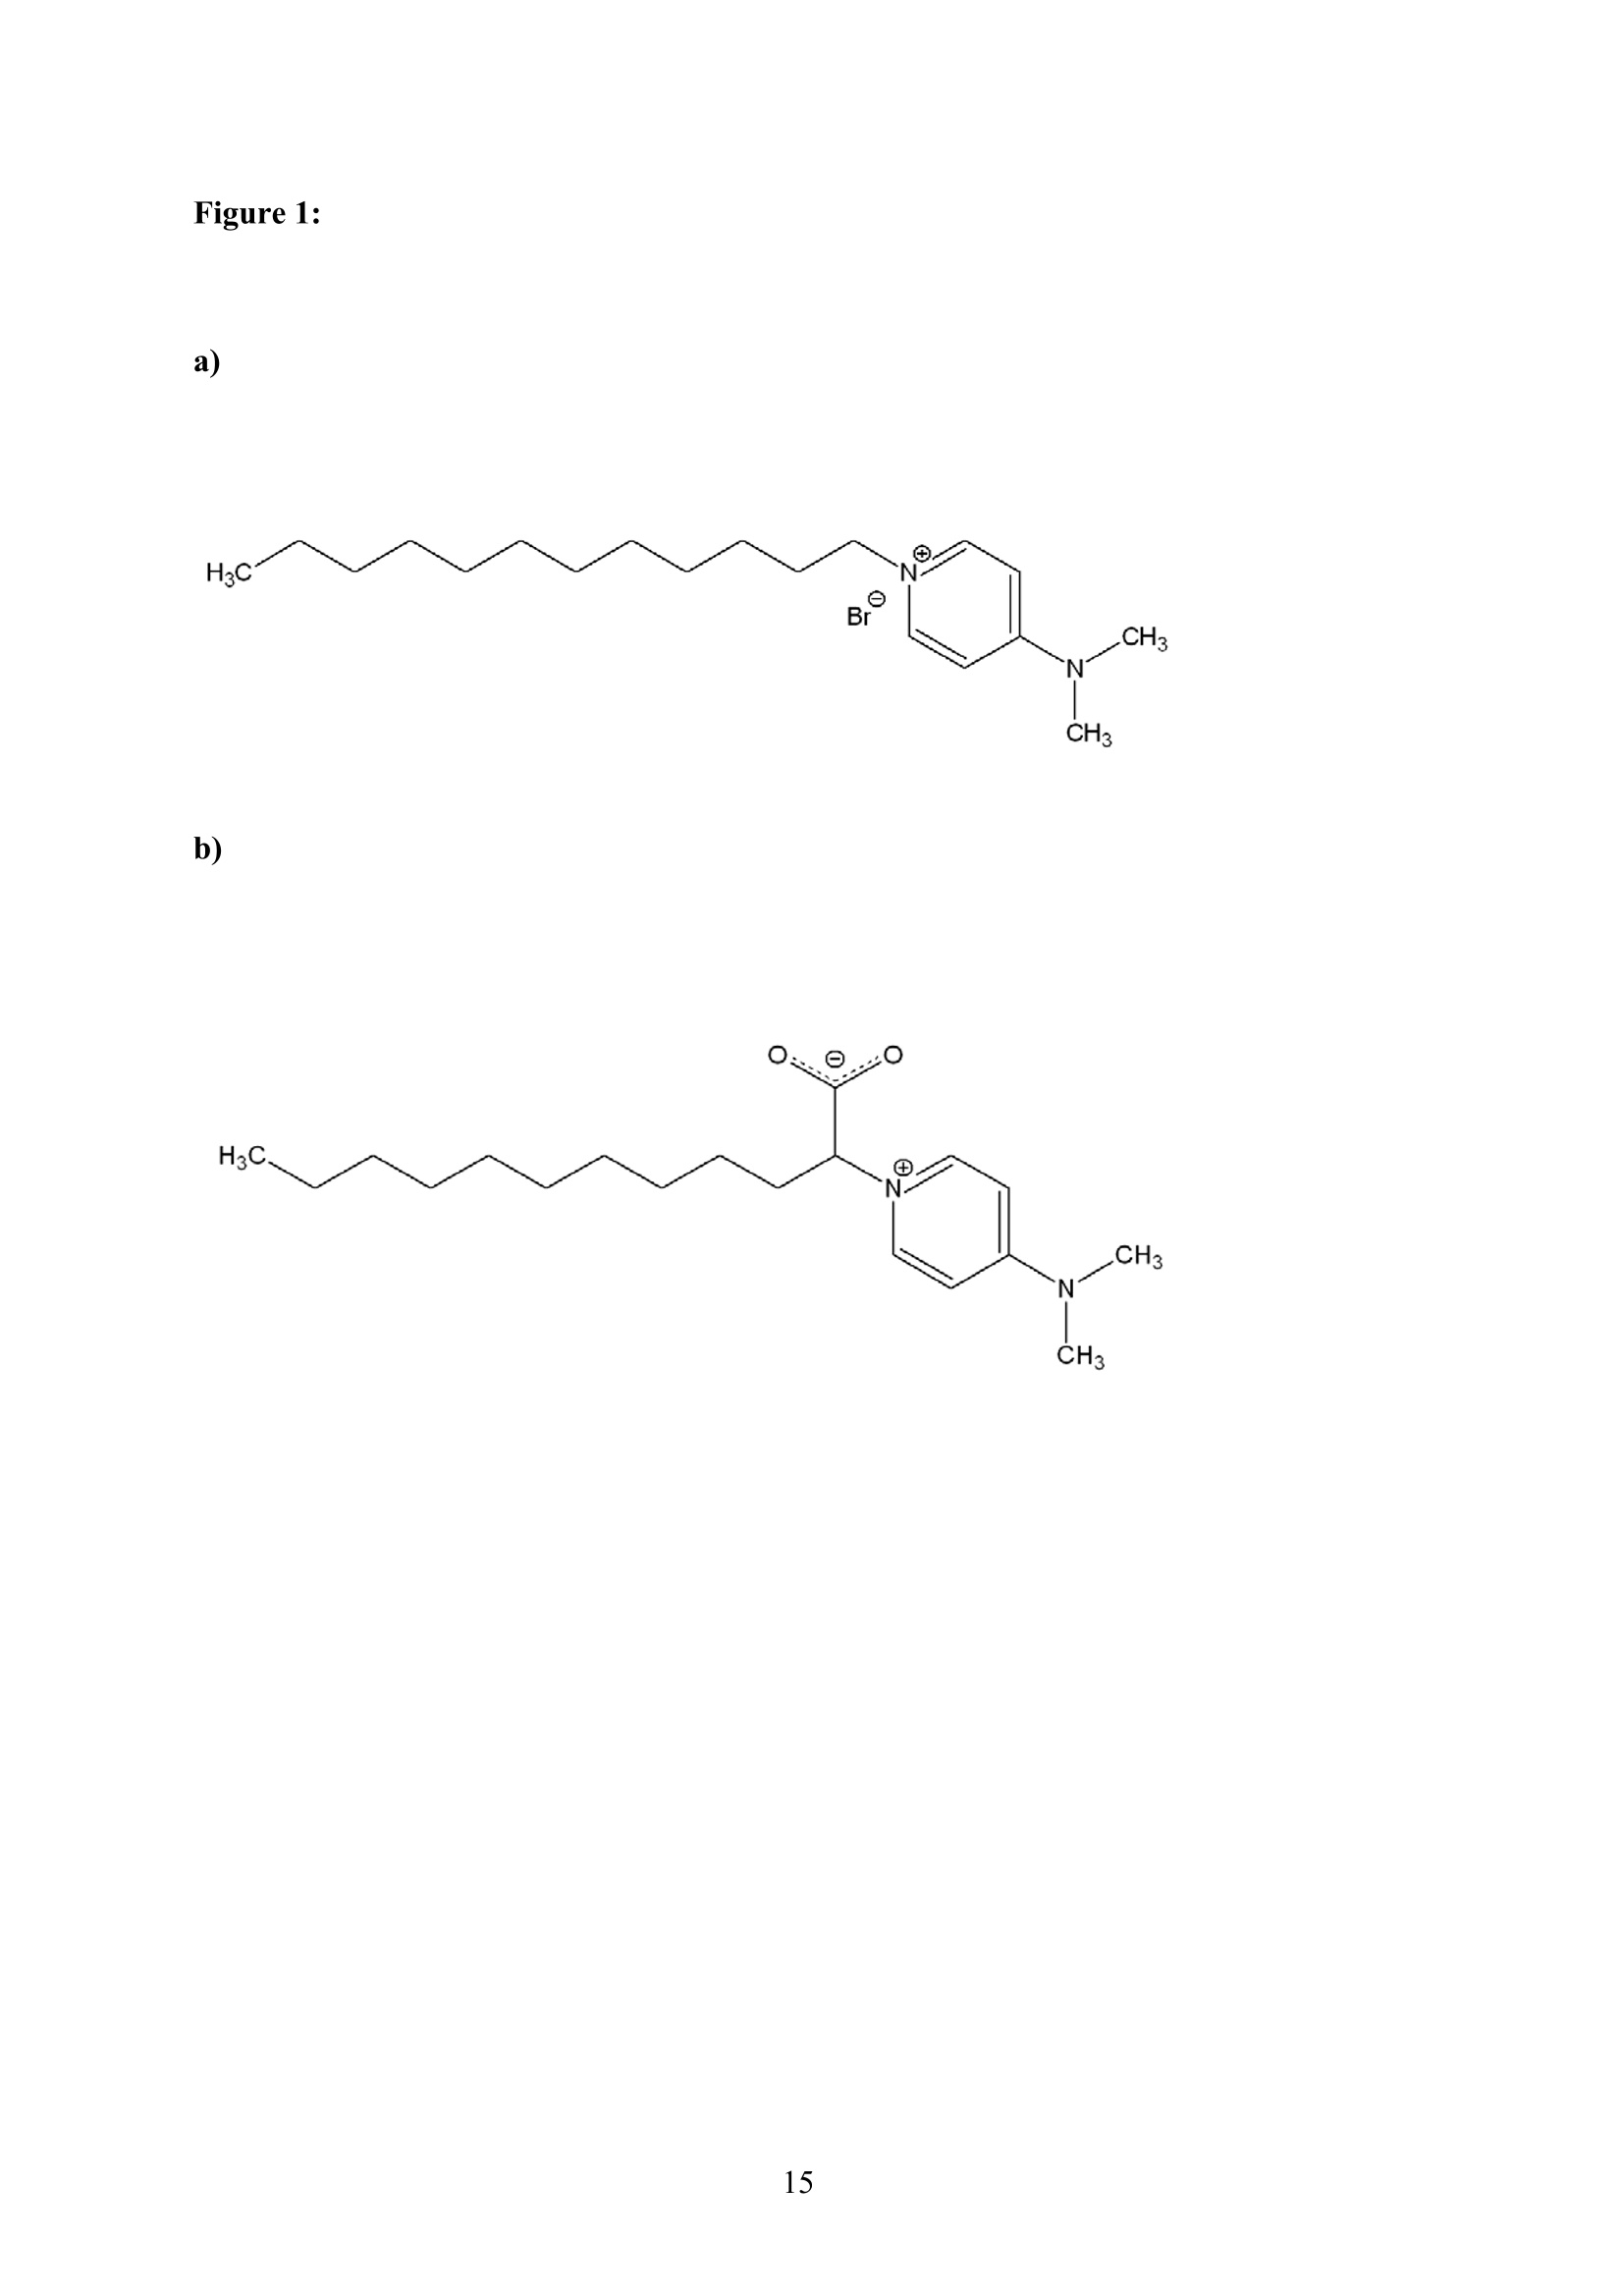
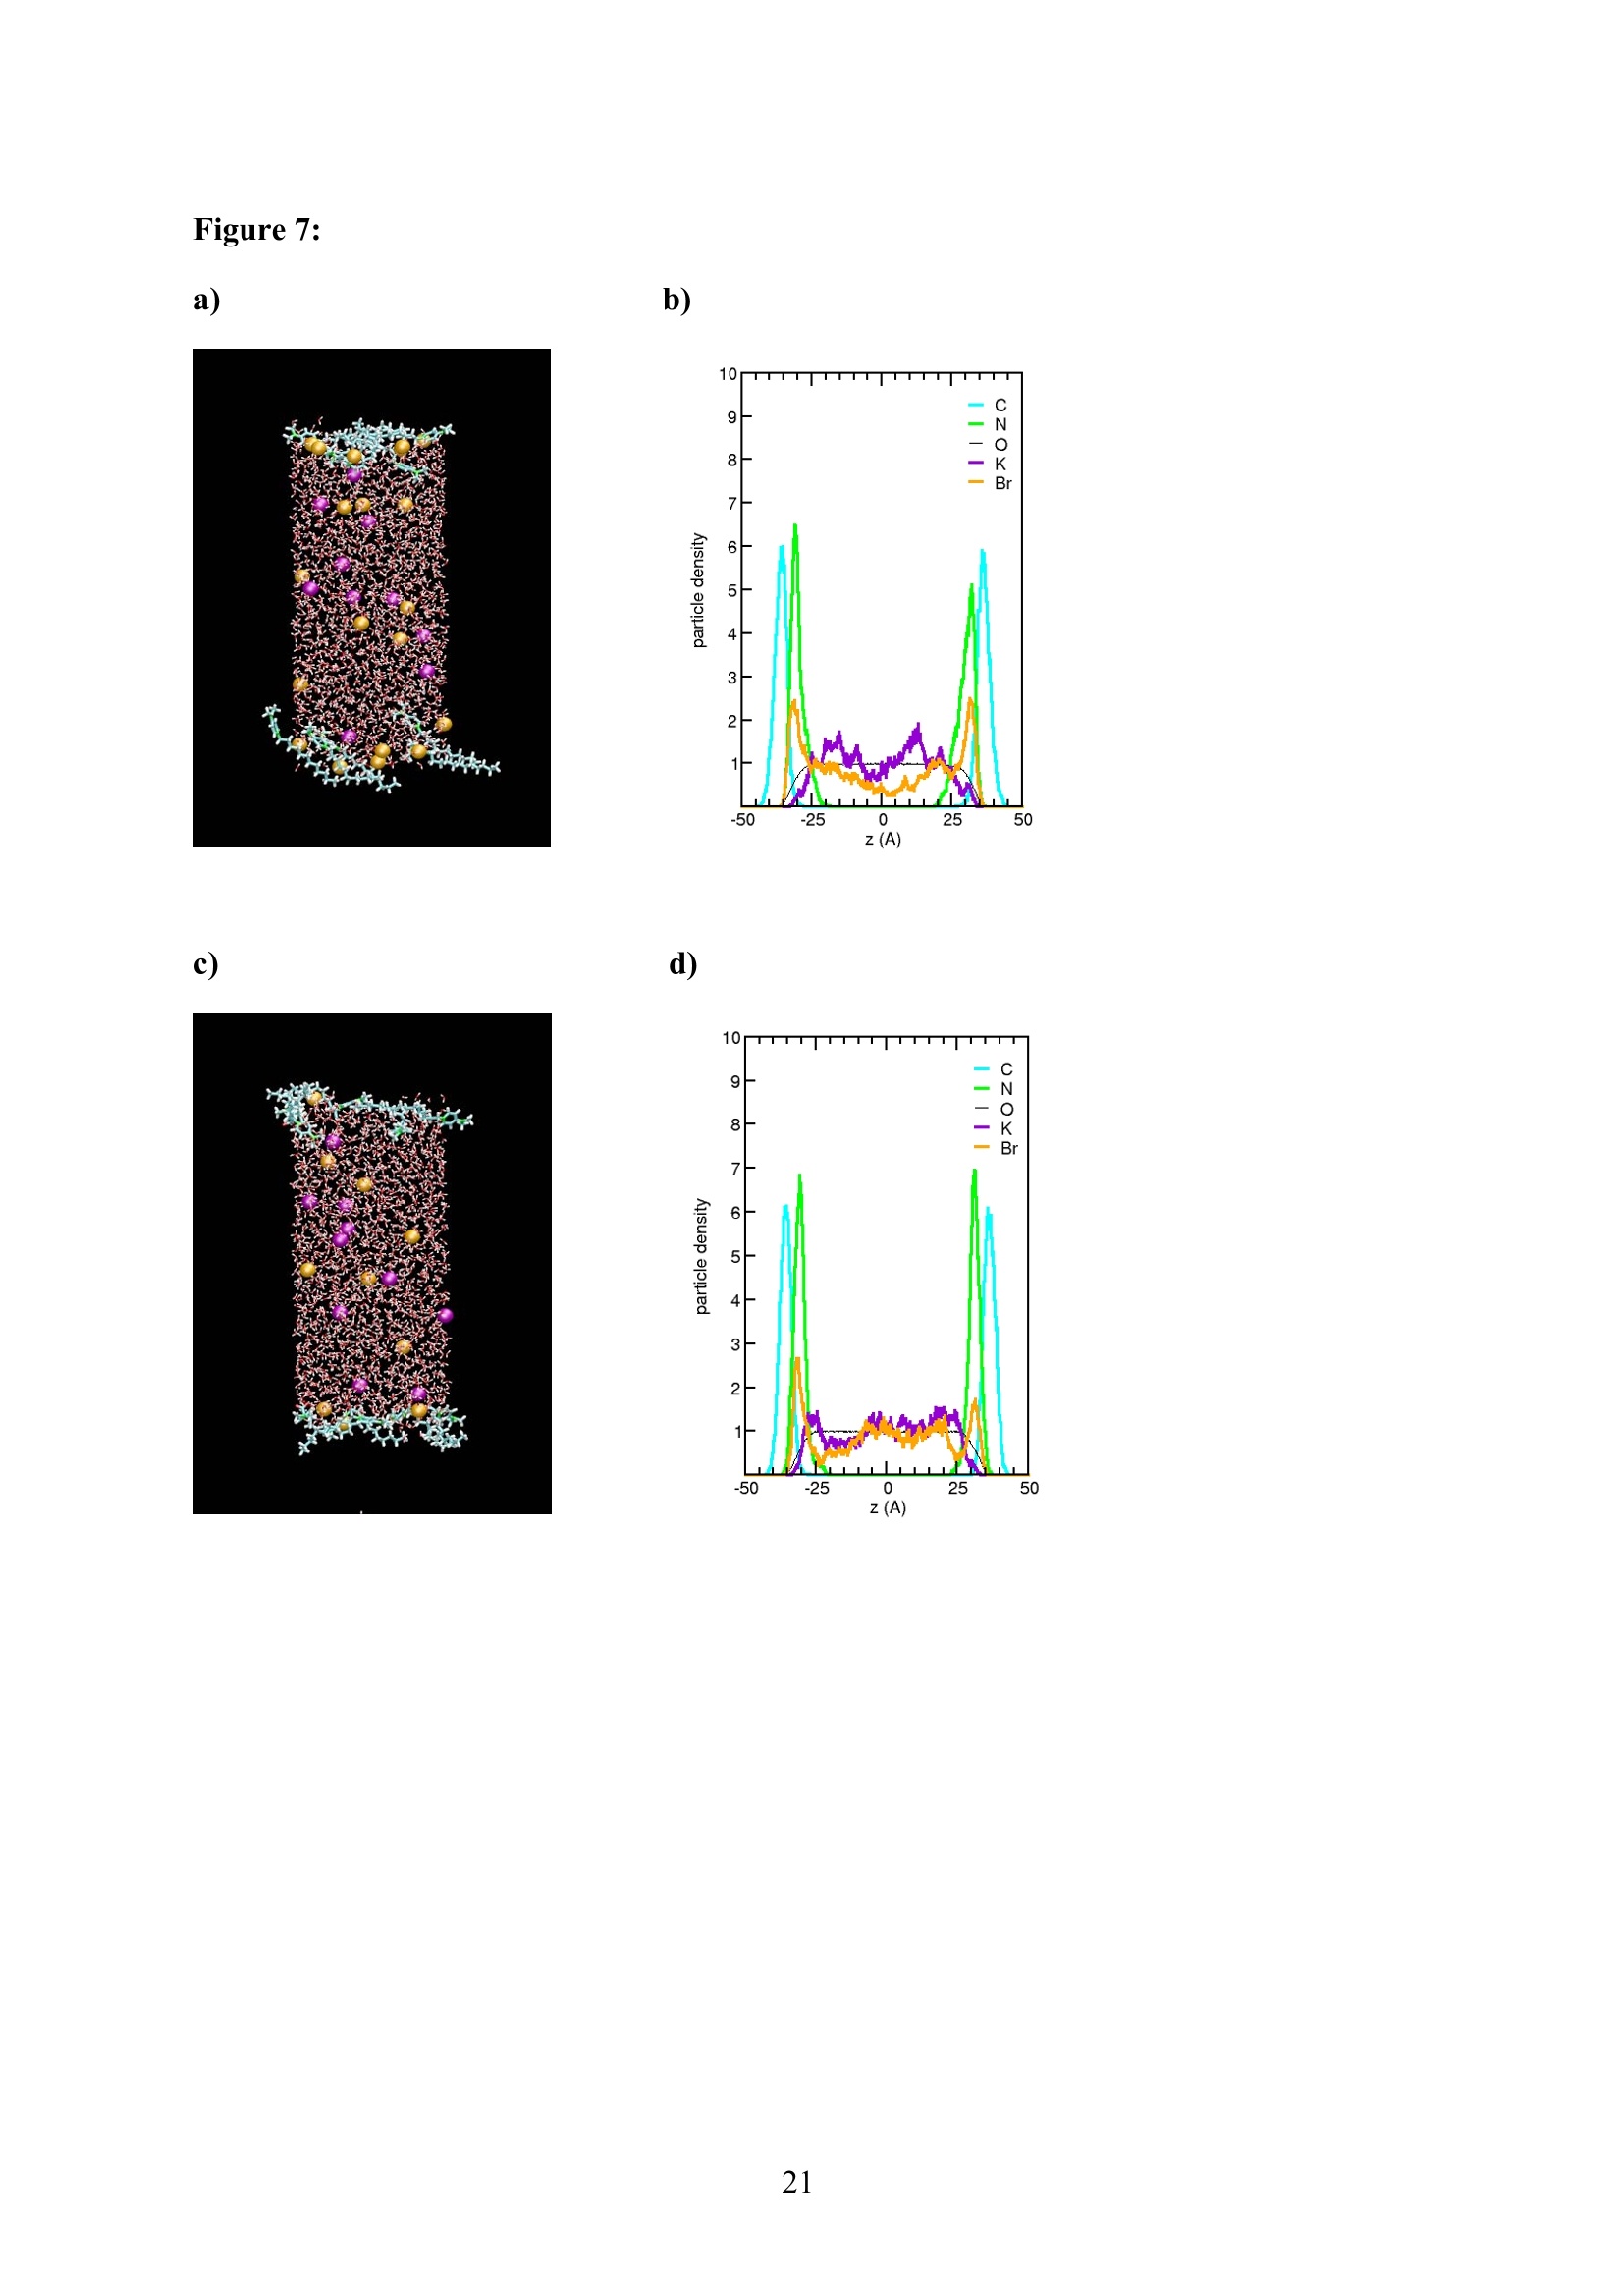
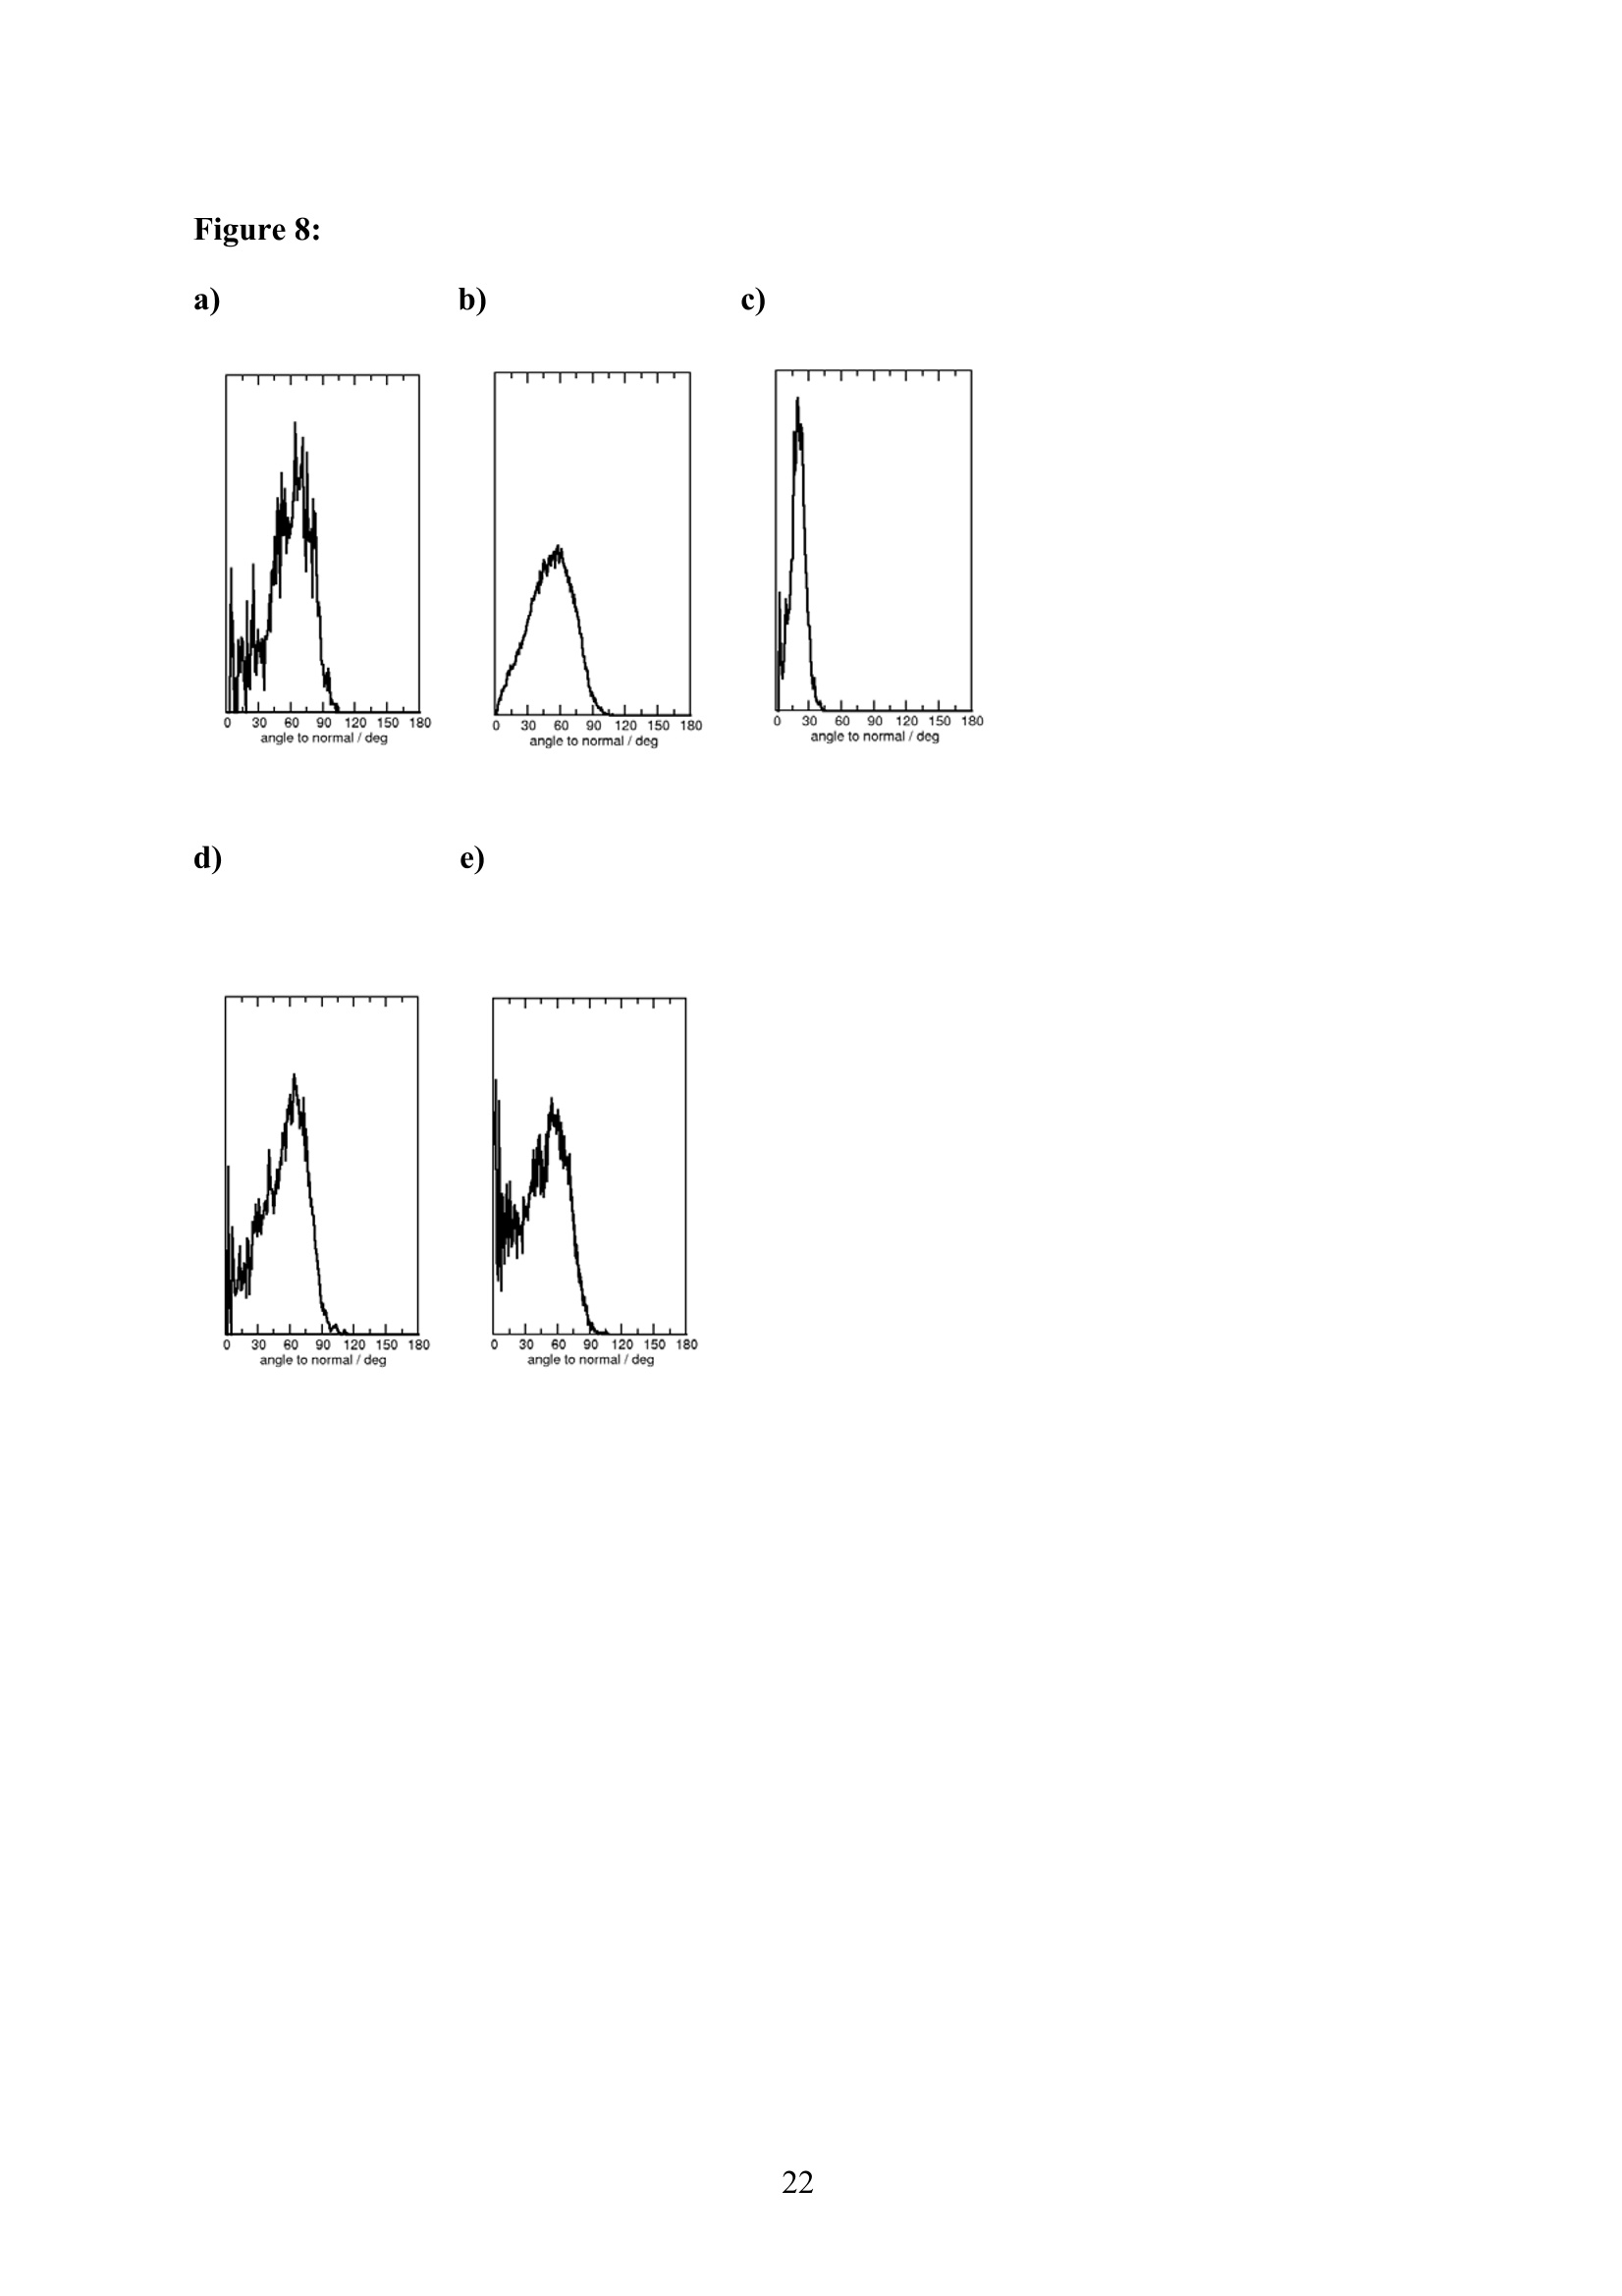
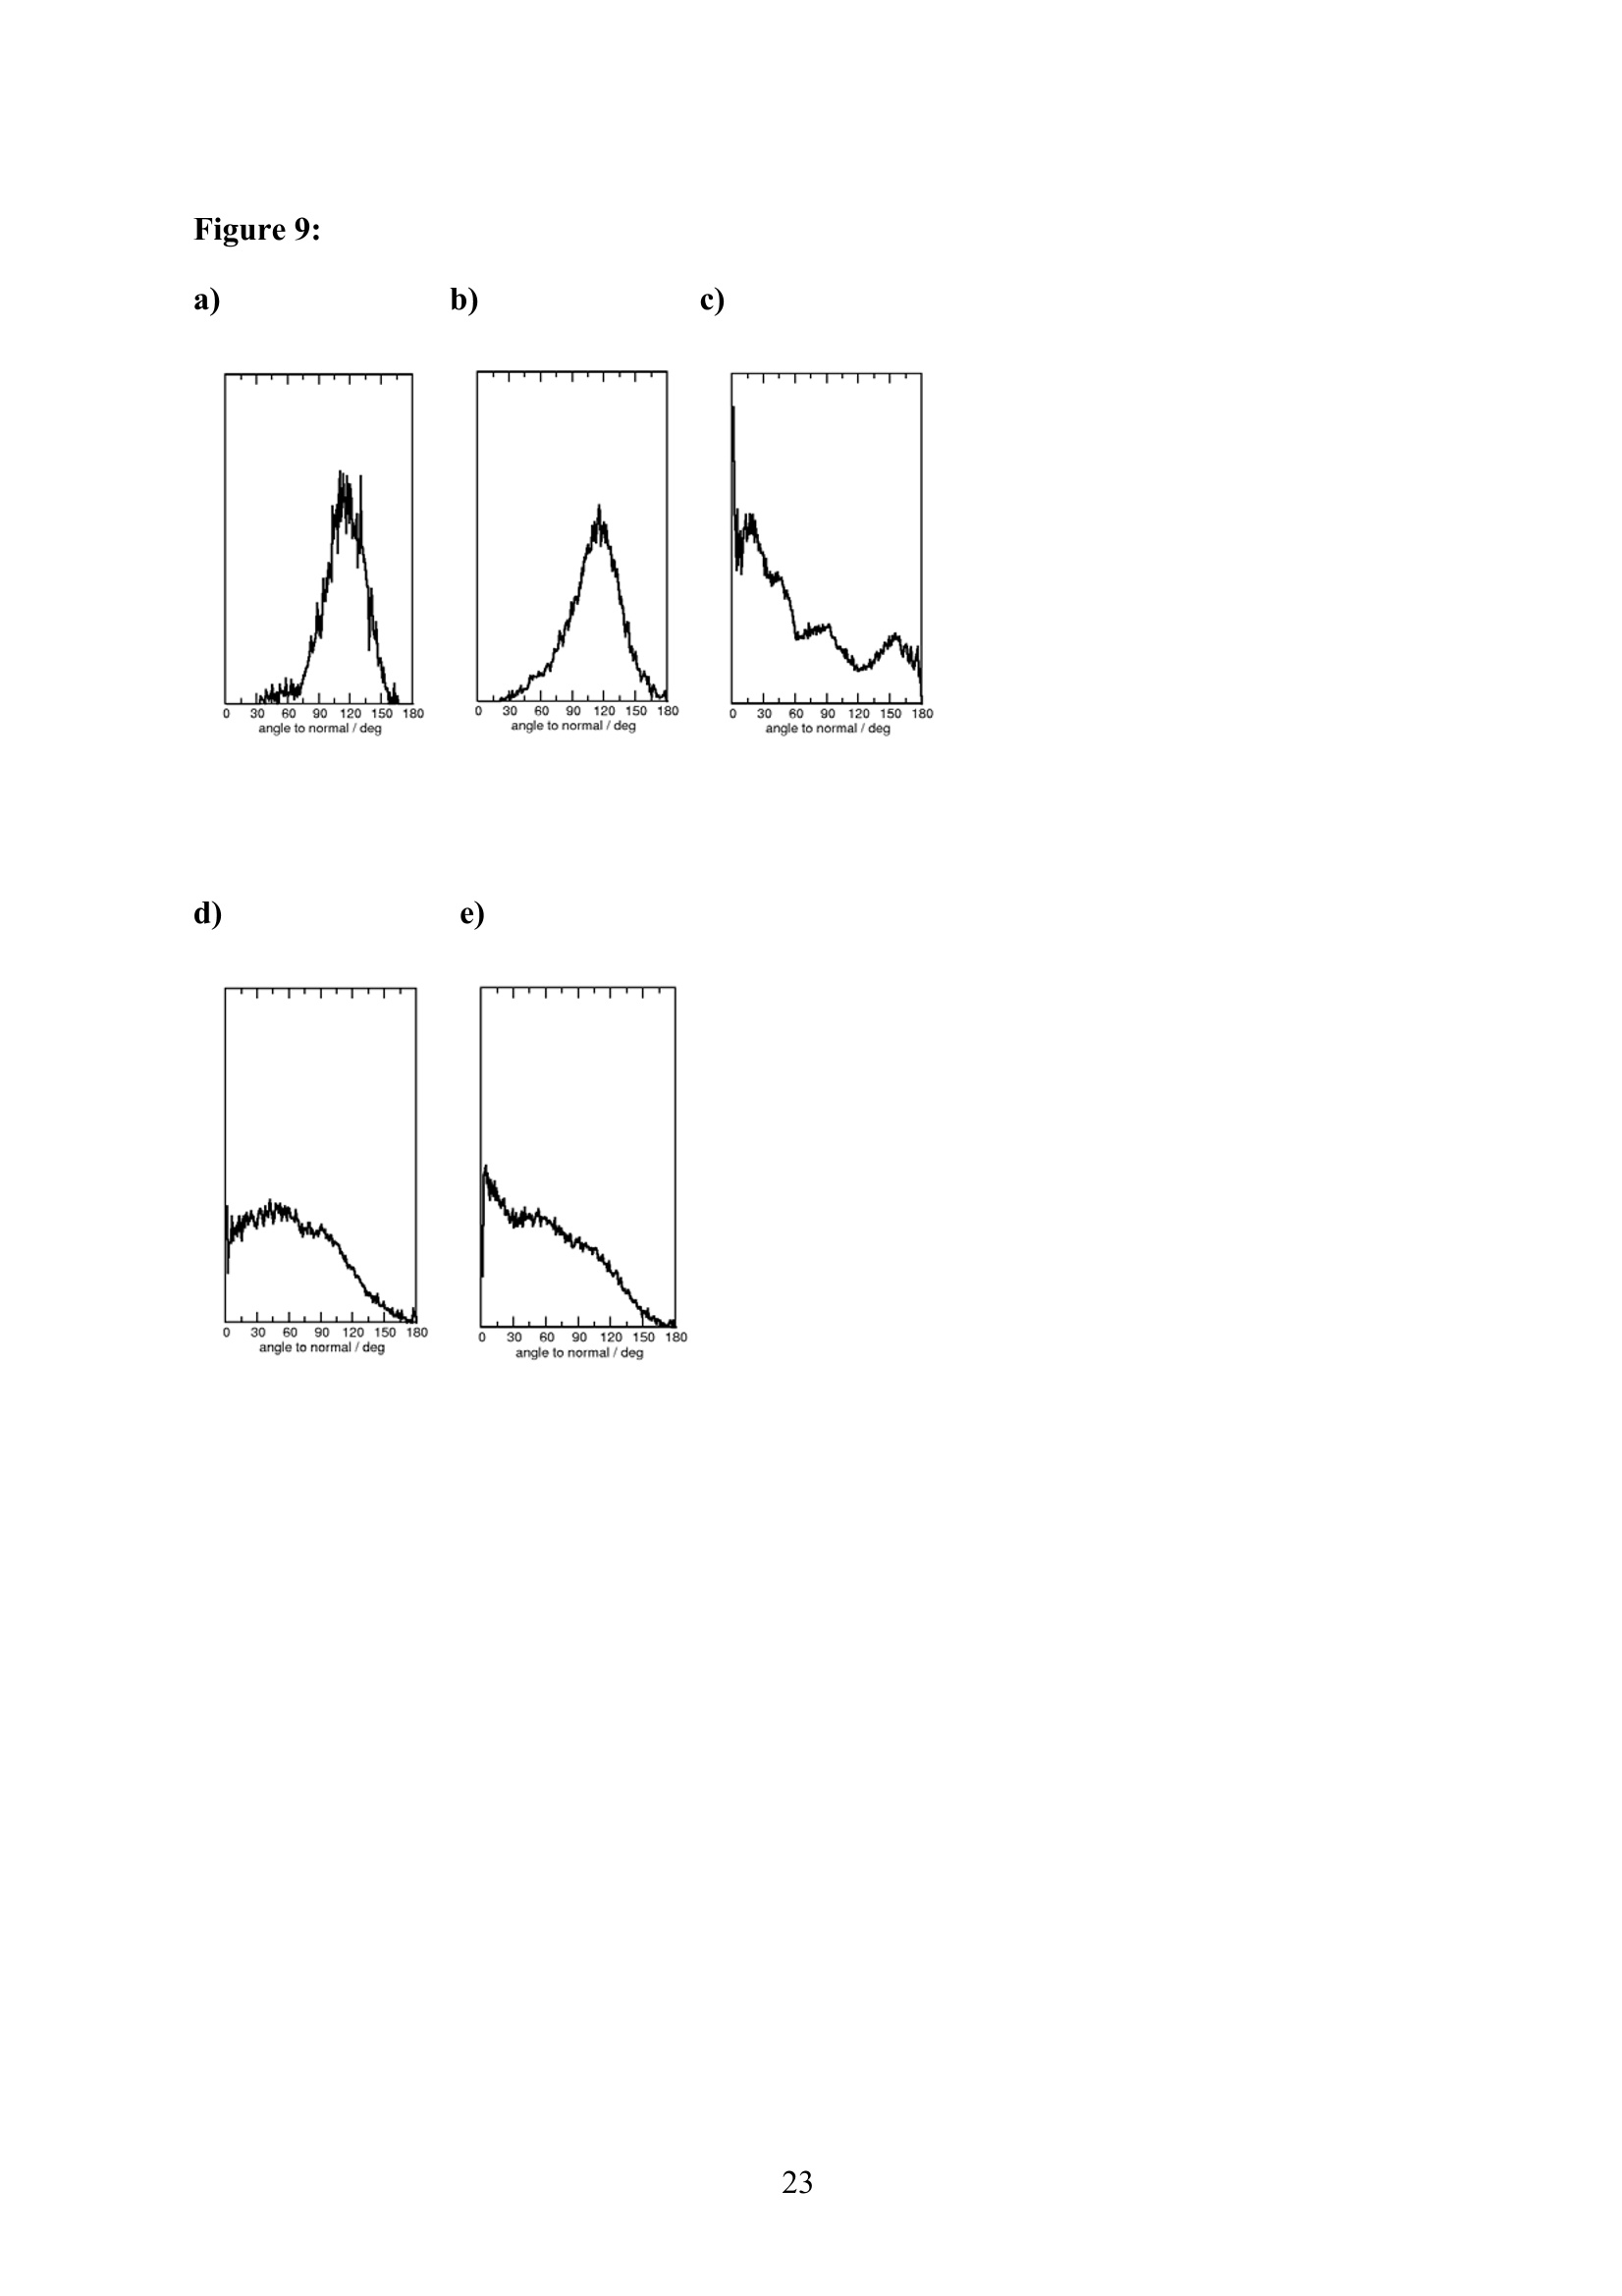
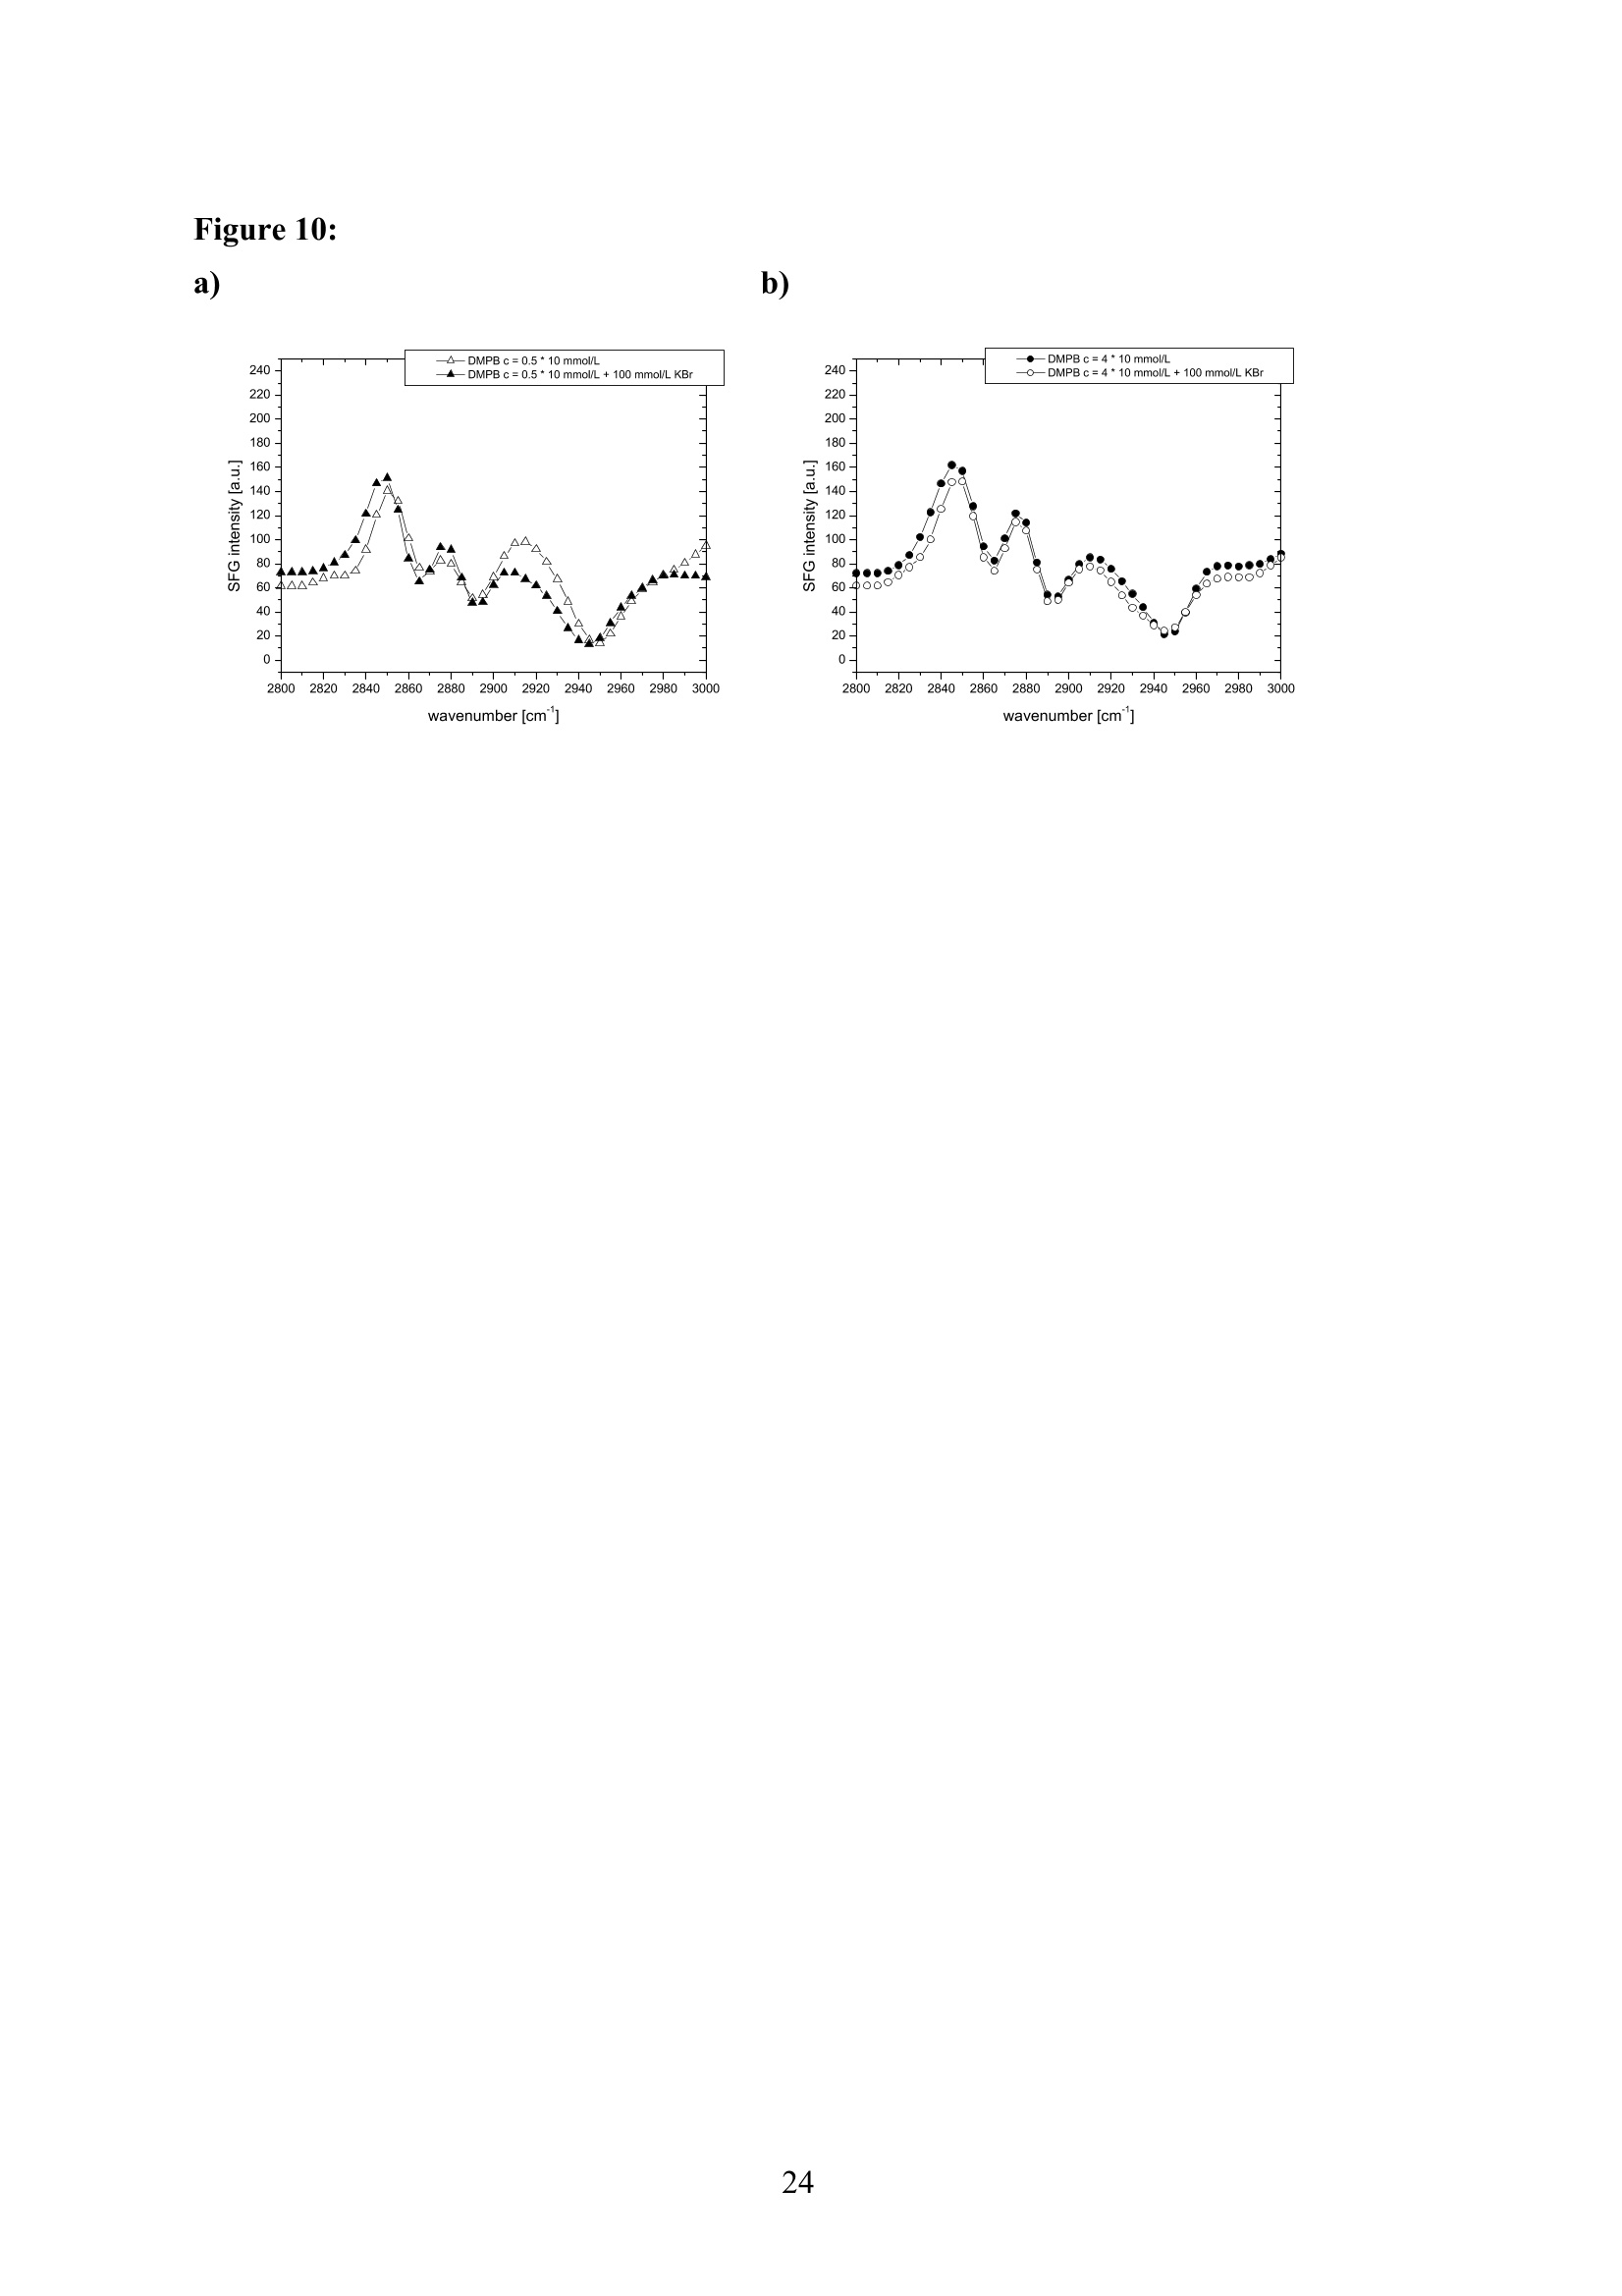
EZ Aqueous ionic and complementary zwitterionic solublesurfactants: Molecular dynamics simulations and sum frequencygeneration spectroscopy of the surfaces Michal Petrov, Babak Minofar, Lubos Vrbka, and Pavel Jungwirth* Institute of Organic Chemistry and Biochemistry, Academy of Sciences of the CzechRepublic and Center for Biomolecules and Complex Molecular Systems, Flemingovo nám.2,16610 Prague 6, Czech Republic Patrick Kolsch#* and Hubert Motschmann Max-Planck Institute of Colloids and Interfaces, Am Muihlenberg 2, 14476 Golm, Germany “Present address: University of Leipzig, Faculty ofPhysics and Earth Science, Linnestrasse5, 04103 Leipzig,Germany *Corresponding authors. E-mails: pavel.jungwirth@uochb.cas.cz (P.J.) andkoelsch@physik.uni-leipzig.de (P. K.) Abstract An aqueous ionic surfactant 1-dodecyl-4-dimethylaminopyridinium (DMP) bromide and thecorresponding zwitterion 2-(4-dimethylaminopyridinio)-dodecanoate (DPN) were exploredby means of molecular dynamics (MD) simulations and, for the ionic system, by infrared-visible sum frequency generation (IR-VIS SFG). The molecular structure of the interfaciallayer was investigated for the ionic and zwitterionic systems as a function of surfactantconcentration, both in water and in salt (KF or KBr) solutions, by MD simulations in a slabgeometry. The build up of the surface monolayer and a sublayer was monitored, and densityand orientational profiles of the surfactants were evaluated. The difference between the ionicand zwitterionic systems and the effect of the added salt were analyzed at a molecular level.The results of MD simulations were compared to those of nonlinear optical spectroscopymeasurements. Infrared visible sum frequency generation (IR-VIS SFG) was employed tostudy the DMP ionic surfactant in water and upon addition of simple salts. The influence ofadded salts on the different molecular moieties at the interface was quantified in detailexperimentally. Introduction Amphiphilic species, such as ionic or zwitterionic surfactants tend to form a twodimensional film at the air/water interface. This behavior is described in thermodynamicterms of surface tension and surface excess. The basic description is given by the Gibbsadsorption isotherm dy=-I du, where I is the surface excess of the surfactant, y is thesurface tension, and u represents the chemical potential. The advantage of molecularsimulations and surface selective spectroscopies is that one can go beyond the description interms of the integral surface excess Tand obtain a detailed molecular picture of thedistribution and orientation of the surfactants in the interfacial layer. Our study concerns a soluble ionic surfactant 1-dodecyl-4-dimethylaminopyridinium(DMP) bromide and a related zwitterion 2-(4-dimethylaminopyridinio)-dodecanoate (DPN) inwater and in aqueous solutions of KF and KBr. The chemical structures of both species areshown in Fig. 1. These surfactants exhibit several basic features. They have both ahydrophobic moiety (carbon chain) and hydrophilic moiety (head group). Due to thisasymmetric molecular structure the surfactants spontaneously self-assemble at the air/waterinterface, where there is an exchange of adsorbed surfactants with those in the adjacentsublayer. At the critical micelle concentration (cmc) the interface saturates and the surfactantstend to form micelles or at higher concentration more complicated structures such as vesiclesor lamellas in the bulk phase. The head groups of DMP and DPN consist of a pyridinium ring acting as an electronacceptor and a dimethylamino group acting as an electron donor. Thus, the electron densitydistribution creates a push-pull system resulting in a high hyperpolarizability and,consequently, in an nonlinear optical activity. On one hand, DMP has an ionic character.Once solvated the bromide anion and the cationic DMP can stay apart from each other. On theother hand, DPN is a zwitterion with the positive charge residing at the nitrogen of thepyridinium head group and the negative charge fixed at the carboxyl moiety, i.e., theseparation between the charges is constrained by chemical bonds. The present molecular dynamics (MD) simulations in a slab geometry of DMPbromide and DPN in neat water and in aqueous solutions of KF and KBr provide a detailedpicture of the interface with atomic resolution, as well as thermodynamically averaged densitydistributions of individual species, from the surface to the bulk region. Simulations were thuscarried out to explore the interfacial structures at a molecular level and to verify theinterpretation of the experimental results. The above mentioned properties of DMP and DPN enable the use of surface selectivenonlinear optical techniques such as second harmonic generation (SHG) spectroscopy tocharacterize the structure of the interface in terms of surfactant distributions. In a recentstudy the influence of simple salts on the adsorption behavior and the ion distribution at theinterface for cationic DMP solutions with bromide as a generic counterion have beeninvestigated by surface tension measurements, ellipsometry, and SHG spectroscopy. Usingan algorithm described in Refs. 5.8 ellipsometric measurements allow under certain conditionsto determine the ion distribution at a charged interface. Each technique probes differentstructural elements and the combined data reveal a spatial distribution of bromide ionstowards a condensed state at monolayer DMP coverages. The addition of KF modifies the surface tension isotherm according to thethermodynamic Gibbs equation, but does not change the number density of adsorbedsurfactants determined by SHG. Consequently, the same transition towards a condensed stateof bromide anions as in the pure solution of DMP bromide was observed. However, theaddition of potassium chloride or bromide leads immediately to a condensed state andstrongly modifies the adsorption behaviour. In the present contribution infrared-visible sumfrequency generation (IR-VIS SFG) experiments of DMP bromide solutions with and withoutadded salt have been carried out in order to observe changes in the aliphatic chainconformations and water structure at the interface. The experimental data are interpreted withthe aid of the corresponding MD simulations. Systems and Computational Methodology An extended set of systems was prepared for the MD simulations. All these systemsconsist of a slab of water, varying numbers of DMP bromide or DPN surfactants and, in somecases, also additional solutes, such as KF or KBr. In detail, the following systems wereinvestigated: water slabs with 2, 10, 20, and 40 surfactant species, and aqueous slabscontaining 10 KF or KBr ion pairs together with 10 surfactants. In all cases half of thenumber of the surfactant species was initially placed on each of the two surfaces of the slab. The slab geometry was realized by employing periodic boundary conditions using aprismatic box with approximate dimensions of 30 x 30 x 120 A and 1726 water molecules inthe unit cell. A polarizable force field was used. Potential parameters for potassium andhalides were the same as in Refs.9.10, for the surfactants we used the general amber forcefield.and for water the POL3 model. The simulation protocol was as follows. A steepest descend minimization (15 000steps) was first employed in order to remove bad contacts. This was followed by 50 ps ofheating to 300 K and by a 500 ps equilibration MD run. Data were then collected from aconsequent 1 ns production runs. Trajectory data were saved every 500 steps, so theproduction run resulted in 2000 frames used for the analysis. All MD simulations employed atime step of 1 fs. Van der Waals and electrostatic interaction were cut off at 12 A. The longrange electrostatic interactions were accounted for using the smooth particle-mesh Ewaldprocedure.3 The SHAKE algorithm was used to freeze all bonds connecting hydrogenatoms. Except for the heating phase, temperature was kept at 300 K and the canonical NVTensemble was generated. All the MD simulations were carried out using the AMBER7program package. Experimental Methods Sample Preparation An aqueous solution of DMP bromide close to the critical micelle concentration(cmc) of 4 mmol/L was prepared using bi-distilled water. Details about the synthesis,analysis, and various physical properties of this surfactant can be found in Ref.1. Thissolution was then purified with the aid of a fully automated device described in Ref.1. Thepurification scheme ensures the removal of any surface active impurities by repeated cyclesof a) compression of the surface layer, b) its removal with the aid of a capillary, c) dilation toan increased surface area and d) again a formation of a new adsorption layer. The cleaningcycles are repeated until the equilibrium surface tension y levels off in a plateau whichindicates that all surface active trace impurities are completely removed. Solutions ofdifferent concentrations were prepared by diluting the stock solution. In order to study theimpact of simple salt solutions on the adsorption behavior, we added to each solution 100mmol/L of purified KF and KBr solutions. Infrared-Visible Sum Frequency Generation (IR-VIS SFG) IR-VIS SFG is a nonlinear optical technique allowing to perform surface selectiveoptical spectroscopy with monolayer resolution. In an IR-VIS SFG experiment two laserpulses are coincident in time and space at the interface of a sample. One visible laser pulse isfixed in frequency, while the other one is tunable through the infrared region of 2800 to 3800 cm. If the intensities of the incident laser pulses are high enough they can induce apolarization of the second order in the medium which gives rise to the SFG signal traveling atthe sum frequency ωsFG = WIR+ ωvis of the two incident beams. If the frequency of the IR beam meets a vibrational mode of the interfacial molecules aresonant enhancement of the SFG signal occurs. The surface specificity is the directconsequence of a second-order nonlinear optical process. Second order processes areforbidden in media with inversion symmetry. The inversion symmetry is broken at theinterface of two isotropic phases and, consequently, a SFG signal is produced within theinterfacial region. Details about the theory of non-linear optics can be found in Ref. All spectra shown in this contribution are measured with a SFG spectrometer ofEKSPLA. A 20-30 pico-second NdYAG laser is pumping an optical parametric generator andamplifier for tunable IR light in the region of 2800 to 3800 cmat energies of about 200uJ/pulse at the sample. A part of the NdYAG beam is used to pump a KTP crystal to obtainsecond harmonic generated green light (532 cm) with an energy of about 1 mJ. Theexperiments were performed using ssp polarization listed in order of decreasing frequency(sum frequency,VIS, IR). Computational Results Snapshots and Density Profiles Illustrative snapshots from the MD simulations and, for the more concentratedsystems, also the density profiles (i.e., averaged distributions of individual species in 0.2 Athick slices parallel with the surface) are shown in Figs. 2-7. These figures concern aqueousslabs with varying concentrations of DMP bromide or DPN with or without added salt (KF orKBr). For the single DMP or DPN species on each side of the slab the snapshots demonstrateboth the inherent surfactant behavior and the varying conformations of the aliphatic chains ofthe isolated species (Fig. 2). All the systems involving DMP molecules exhibit similardistributions of the individual species across the slab.Namely, both the cationic DMP and thebromide anions prefer the surface region. While the surface segregation ofthe cationicsurfactants is very strong, that of the bromide anions is much weaker, which results in acreation of a more diffuse anion distribution. This is due to the fact, that on one hand theDMP cations are“anchored"at the surface due to very strong hydrophobic forces, while onthe other hand the propensity of bromide anions for the surface is due to relatively weak polarization interactions10.20 and, at higher concentrations, also due to surface neutralizationeffects. The characteristic patterns of the density profiles of the DMP containing systems areas follows. The carbon chains, stabilized by the hydrophobic interaction, form a single peak atthe air side of the slab (at and above the top-most water layer) for all concentrations. Thenitrogen signal peaks closer to the aqueous phase than the carbon peak, confirming thepreferential orientation of the amphiphiles with the charged head groups pointing towards theaqueous bulk and the aliphatic chain expelled from the aqueous phase. The distribution ofnitrogen of the head groups gets broader and develops a shoulder towards the bulk region ofthe slab at higher concentrations. This indicates that upon adding more DMP surfactants asublayer starts to build up in accordance to Refs.21.22. While at low concentrations thealiphatic chains of the cationic surfactants can rather freely fold and unfold at the surface, athigher concentrations the mobility of the individual chains is strongly hindered. The densityprofile of the bromide counterions follows the distribution of DMP nitrogens,i.e., bromideanions exhibit a density peak at the same position on the z-axis and of a similar intensity.Still, there are some bromide anions in the bulk region. With additional salt (KF or KBr) an interesting situation arises in the slabs. In bothcases, the bulk region of the slabs contains large amounts of alkali cations and halide anions.Potassium cations are always repelled from the surface. This is both due to the repulsion bythe cationic surfactants and due to image charge repulsion of hard ions from the air/waterinterface. However, the two salts differ with respect to the surface behavior of the halideanions. Fluoride, as a small non-polarizable ion is per se strongly repelled from the watersurface.Due to the attraction to the surface-bound DMP cations a very weak fluoridepropensity for the sub-surface region can be observed (Fig.6b). In the case of added KBr,there is only a single anionic species in the solution. Bromide, as a large polarizable anion, isattracted to the aqueous surface per se, as well as by the DMP cations. As a result, there is asizable surface peak in the bromide distribution (see Fig. 7b). Hence, at appreciable DMPconcentrations there is an increased transition of bromides towards the surface, as postulatedin Refs. 24.25 using a simple thermodynamic model. This model ad hoc divides ions intosurface-bound and bulk fractions, which is at least qualitatively correct for bromide, but notfor fluoride. Interestingly, the surface adsorption of bromide is not apparent in recent Monte-Carlo simulations,26,27 probably due to the use of a nonpolarizable force field. The surface behavior of the DPN zwitterions is in many respects analogous to that ofthe cationic DMP surfactants (see Figs. 2-7). The carbon chains of DPN form again a single peak in the top-most layer, with the nitrogen peak being somewhat broader and shiftedtowards the bulk phase. With rising DPN concentration a sublayer starts to form as in theDMP case. The structure of the interface is than formed by the two prevailing conformation ofthe DPN molecules. The DPN molecules, located in the top-most layer, prefer bentconformations with often a rather sharp angle between the carbon chain and the head group.The carboxylic moiety tends to be oriented towards the water molecules and repelled from thecarbon chain.This is the preferable state from the energetic point of view and it is the onlyconformation that prevails for the more dilute systems. At higher concentrations, thesubsurface DPN species are more straightened up with the carbon chains protruding towardsthe gas phase. This arrangement is apparent from the simulation snapshot depicted in the Fig.5c. Upon adding the KF salt (Figs. 6c,d), both potassium and fluoride reside only in thebulk region of the slab. In this respect the zwitterionic DNP is different from DMP cations -there is no preferential attraction of the anions to the surface or sub-surface due to surfaceneutralization. For the KBr solutions, bromide anions nevertheless exhibit a surface peak,which is due to their inherent propensity for the air/water interface (Figs. 7c,d). Head Group Orientational Analysis Normalized distributions of the head group orientations, defined as the angle betweenthe N-N line and the surface normal, are shown for DMP solutions in Fig. 8 and for DPNsolutions in Fig. 9. The orientation of this group has a significant importance as it is the SHGactive moiety. The head group orientation exhibit an appreciable dependency onconcentration. The systems involving DMP molecules show a transition from a peak in thehead group orientation around 60° for low concentrations to 30° for 20 DMP. In systems withadded salt orientational angles around0° are also present. The orientational angles ofthe DPN containing systems are as follows. The headgroup orientational angle peaks around 120° at low concentrations, while at higherconcentrations and in systems with added salt a wide range of orientational angles is sampledwith a preference for smaller angles (Fig. 9). The different orientational distributionscompared to the systems with DMP are primarily due to the steric interaction of thecarboxylic group. Experimental Results and Comparison with Calculations Infrared-Visible Sum Frequency Generation Measurements The IR-VIS SFG spectra of the ionic DMP at a low concentration of 0.5 mmol/L and aconcentration close to the cmc at 4 mmol/L are shown in Fig. 10 and 11. In accordance withpreviously discussed SHG measurements (see Fig. 12), these concentrations correspond to anumber densities of 0.5 and 2.8 molecules/nm², which are directly comparable with the abovesimulations with 10 and 40 DMP in the unit cell. All spectra presented in this paper have been measured under identical settings and theintensities can be directly compared. In Fig.10 the SFG response in the spectral region from2800 to 3000 cmfor the two different surfactant concentrations with and without addition ofKBr are shown. The peaks can be attributed to CH2 stretching modes within the aliphaticchain of the surfactant. The peak at 2850 cm° and 2915 cmcorresponds to the symmetricand asymmetric CH2 stretch. Since the CH2 stretching mode is not visible in an all-transconformation of the chains due to symmetry considerations, the number of gauche defectsdetermines the CH2 peak intensities. A low surfactant concentration yields a significantlylower peak intensity compared to the same DMP concentration upon addition of KBr,indicating a decreased number of gauche defects in the aliphatic chain (Fig.10a). Each of the peak was fitted with a Lorentz oscillator and the results are shown inTable 1. The peak area of the asymmetric CH2 stretch decreases at the low concentration by afactor of two upon adding KBr. At the higher DMP concentration of 4 mmol/L the spectra donot change significantly upon addition of KBr, neither in the peak positions nor in the peakareas. Additionally the number density of adsorbed surfactants at the cmc is the same for thepure surfactant solution and the solution where KBr was added. as shown in the next sectionand in Fig.12. We, therefore, conclude that the counterions were already in the condensedstate prior to the addition of the salt in accordance with the MD simulations (Fig. 7) andpreviously done measurements.2? Hence, the procedure of measuring IR-VIS SFG spectra ofsoluble ionic surfactants and those where counterions of the same species are added to thesurfactant solution provides an experimental method to determine whether the ions are in thecondensed state or not. In Fig. 11 the IR-VIS SFG spectra in the 3000 cm° to 3600 cmregion of the DMPbromide solution with or without additional KBr are shown. Here, the intensities are dominated by the OH-stretch of water molecules. In Fig. 11a) the spectrum of a neat water/airinterface is also shown. At the ionic surfactant covered interface the IR-VIS SFG intensity isincreased by a factor of 10 mainly due to an increased depth of aligned water molecules inthe vicinity of a charged interface and hence, to a higher amount of oriented water molecules.contributing to the IR-VIS SFG response. The density profiles from the MD simulations in Fig. 3b, 4b and 5b indicate, that withincreasing number density of adsorbed DMP the concentration of bromide ions in theinterfacial region increases. At higher surface coverages almost no bromide ions reside in thecenter of the slab (Fig.5). Due to this surface neutralization, the depth of aligned watermolecules should be reduced with increasing amounts of bromide anions in the solution,leading to a lowered IR-VIS SFG response in the OH stretch which is indeed observed in theexperiment. At the low DMP concentration the addition of KBr lowers the amount of orientedwater molecules resulting in a significantly reduced IR-VIS SFG response (Fig. 11a). At thehigher concentration (Fig. 11 b), where counterions are already condensed at the interface, theaddition of KBr does not have a strong influence neither on the IR-VIS SFG response nor onthe DMP surface coverages (as described in the next section). In Table 2 the peak positions for water and the surfactant systems are shown. Thedetailed assignment of the peaks to different types of OH vibrations is still controversial28,29and it is not particularly relevant for the present discussion since the effects are essentially thesame for all peaks. The peak positions are significantly lowered at surfactant coveredinterfaces and addition of KBr further decreases the peak position at each concentration. Thishas a different direction in comparison to IR-VIS SFG investigations of the pure water/airinterface, where the addition of bromide and iodide salts leads to an increased peak in the3400 cmregion.30,31 Possibly, the exchange process of adsorbed surfactants with those in thebulk is playing an important role in this context and should be carefully addressed in futurestudies. Second Harmonic Generation In a recent study the adsorption behaviour of the DMP surfactant upon addition ofsimple salts was experimentally investigated by SHG measurements on DMP bromide in neatwater and in solutions with added100 mmol/L of KBr or 100 mmol/L ofKF, at DMPconcentrations up to the critical micelle concentration (cmc). Fig. 12 shows thecorresponding number density of the surfactant headgroup as a function of surfactant bulk concentration for the studied systems. The adsorption behaviour reveals a pronounced ionspecific feature: The addition of KF practically does not change the adsorbed amount of DMPat any concentration, whereas the addition of KBr has a strong effect on the adsorptionbehaviour. Fluoride is not screening the charged headgoups of the adsorbed surfactants, evenif the concentration of fluoride ions is 100 times higher than that of bromide ions. However,upon addition of KBr the surface charges are more screened by the increased amount ofadsorbed Br ions in the vicinity of the interface which leads, consequentely, to a shift in thecmc of about one decade from 4 mmol/L to 0.5 mmol/L. The experimental results can now beinterpreted with the aid of the MD simulations for 10 DMP bromides and 10 additional KF orKBr ion pairs (Figs. 6b and 7b). Whereas bromide is adsorbing at the interface, fluoride hasno propensity for the surface region and, consequentely, the adsorbed amount is not increasedupon addition ofKF (Fig.6b). The SHG response stems from the surfactant headgroups due to the highhyperpolarizability of the n push-pull system of the pyridinium ring. Polarization dependentSHG measurements revealed that the orientational order of the headgroup is independent ofthe surface coverage with a tilt angle of 59° of the long chromophore axis with respect to thesurface normal and the symmetry of the molecular arrangement of the headgroup belongs tothe point group Coov, which is characteristic for an isotropic azimuthal arrangement within theadsorption layer. The orientation of the headgroup is in very good agreement to the MDsimulations at lower surface coverages. However, the calculated change with DMPconcentration is not apparent in the experiment. This might be due to the fact that the SHGresponse stems predominantly from the molecules in the topmost monolayer and not from thesublayer which was also included into the MD analysis. Summary and Conclusion Molecular dynamics simulations of ionic DMP bromide and zwitterionic DPN inaqueous slabs were performed. Both DMP and DPN strongly adsorb at the aqueous surface.At higher surface coverages a build up of a sublayer is observed. For the former system,bromide counterions mostly co-adsorb to the surface (both due to their polarizability and thepresence ofDMP cations) but they are also present in the bulk region. The ratio betweensurface adsorbed and bulk bromide anions increases with the DMP concentration up to acondensed state due to surface neutralization effects. Thus, the conventional notion of the adsorbed Stern layer and diffuse Guy-Chapman layer naturally emerges from the MDsimulations without any ad hoc assumptions. The effect of added salt (KF or KBr) was alsoinvestigated. On one hand, adding KF has little effect on the surface behavior of both DMPand DPN due to the fact that both potassium and fluoride strongly favor the aqueous bulk. Onthe other hand, added KBr affects the interface due to a significant surface propensity ofbromide. IR-VIS SFG spectroscopy has been performed on solutions of ionic DMP surfactantsat various surface DMP concentrations with and without addition of KBr. The conformationalchanges of the aliphatic chain upon addition of KBr were monitored for a low DMPconcentration and a concentration close to the cmc. Only at the low DMP concentration asignificant lowering of gauche defects is observed. At the higher concentration correspondingto a condensed state for the distribution of bromide ions, the addition of salt has virtually noeffect on the chain conformation. In this way one can elegantly determine the point ofcounterion condensation. Similarly, at low DMP concentration addition of KBr has adecreasing effect on the intensity of the OH stretching region of the spectrum, indicating anincreased amount of bromide ions at the interface, while at high DMP concentrations thechange is small. The results of the present MD simulations support the above conclusions as well as theresults of previous SHG and ellipsometry measurements in a series of potassium halidessolutions. In particular, MD simulations provide rationalization for the strong effect of addedKBr and the lack of effect for added KF in terms of different surface behavior of bromideversus fluoride. Furthermore the experimentally observed condensed state for bromide athigher surface DMP coverages was reproduced in the MD simulations. Acknowledgment Support from the Granting Agency of the Academy of Sciences (grantIAA400400503), the Czech Ministry of Education (grant LC512), and the NSF (grants CHE0209719 and 0431312) is gratefully acknowledged. L.V. and B. M. would like to thank theGranting Agency of the Czech Republic for support (grant 203/05/H001). P.K. and H.M.thank Prof. Mohwald for his steady support and stimulating discussions. Figure captions Figure 1: a) Chemical structure of a) DMP andb) DPN. Figure 2: Snapshot from a MD simulation of an aqueous slab with a) 2 DMP and b)2 DPN. Figure 3: a) Snapshot from a MD simulation of an aqueous slab with 10 DMP and b) thecorresponding density profiles. c) Snapshot from a MD simulation of an aqueous slab with 10DPN and d) the corresponding density profiles. Figure 4: a) Snapshot from a MD simulation of an aqueous slab with 20 DMP and b) thecorresponding density profiles. c) Snapshot from a MD simulation of an aqueous slab with 20DPN and d) the corresponding density profiles. Figure 5: a) Snapshot from a MD simulation of an aqueous slab with 40 DMP and b) thecorresponding density profiles. c) Snapshot from a MD simulation of an aqueous slab with 40DPN and d) the corresponding density profiles. Figure 6: a) Snapshot from a MD simulation of an aqueous slab with 10 DMPs and 10additional KF ion pairs and b) the corresponding density profiles. c) Snapshot from a MDsimulation of an aqueous slab with 10 DPNs and 10 additional KF ion pairs and d) thecorresponding density profiles. Figure 7: a) Snapshot from a MD simulation of an aqueous slab with 10 DMPs and 10additional KBr ion piars and b) the corresponding density profiles.c) Snapshot from a MDsimulation of an aqueous slab with 10 DPNs and 10 additional KBr ion pairs and d) thecorresponding density profiles. Figure 8: Head group orientation for a) 2 DMP, b) 10 DMP, c) 40 DMP, d) 10 DMP and 10additional KF ion pairs, and e) 10 DMP and 10 additional KBr ion pairs. Figure 9: Head group orientation for a) 2 DPN, b) 10 DPN,c) 40 DPN, d) 10 DPN and 10additional KF ion pairs, and e) 10 DPNs and 10 additional KBr ion pairs. Figure 10: IR-VIS SFG spectra in the region of 2800 cm"'to 3000 cm°at different surfactantconcentrations with (filled) and without (blank) addition of 100 mmol/L KBr. a) 0.5 mmol/LDMP bromide, and b) 4.0 mmol/L DMP bromide. All spectra were measured in SSPconfiguration. Figure 11: IR-VIS SFG spectra in the region of 3000 cm° to 3600 cm° at different surfactantconcentrations with (filled) and without (blank) addition of 100 mmol/L KBr. a) 0.5 mmol/LDMP bromide, and b) 4.0 mmol/L DMP. In a) the neat water/air spectrum is shown as well.All spectra were measured in SSP configuration. Figure 12: Number density of the adsorbed surfactant headgroup at the interface as a functionof concentration for DMP solutions and where 100 mmol/L KF and KBr are added to theDMP bromide solution.6 Table 1: Average frequencies and peak areas for the resonant peaks of DMP and DMP plusaddition of salt with their corresponding uncertainties in the CH stretch. Table 2: Average frequencies for the resonant peaks ofDMPB and DMPB plus addition ofsalt with their corresponding uncertainties in the OH stretch. Figure 1: a) b) .0 CH3 Figure 2: a) b) o b) d) Figure 5: a) c) Z(A) Figure 6: c)d) Figure 8: a) b) 306090 120 150 180angle to normal / dcg d) e) (e (P :6a.n3H Figure 10: a) b) Figure 11: a) b) c Figure 12: Table 1: wavenumber symmetric CH2 stretchArea/100 symmetric CH3 stretch wavenumber Area/100 wavenumber asymmetric CH2 stretch Area/100 DMP 0.5mmol/L 2851.1±0.4 2.5±0.2 2877.5±0.6 0.30±0.07 2918.3±0.6 4.7±0.4 DMP 0.5 mmol/L+100 mmol/L KBr 2847.5±0.5 2.7±0.3 2877.9±0.6 0.4±0.1 2915.4±1.4 2.0±0.4 DMP4 mmol/L 2845.6±0.6 4.0±0.4 2877.3±0.4 0.9±0.2 2918.5±1.2 3.5±0.6 DMP 4mmol/L+100 mmo/L KBr 2846.9±0.6 3.1±0.4 2877.4±0.5 0.9±0.2 2917.7±1,6 3.6±0.7 Table 2: wavenumber wavenumber wavenumber Water 3190±3 3306±6 3459±5 DMP 0.5 mmol/L 3178±5 3277±18 3454±2 DMP 0.5 mmol/L+ 100 mmol/L KBr 3127±3 3229±14 3407±3 DMP 4 mmol/L 3145±3 3246±10 3428±3 DMP 4mmol/L+ 100 mmol/L KBr 3135±2 3243±7 3417±2 TOC: References: (1) Adam, N. K. The Physics and Chemistry of Surfaces; Oxford University Press:London, 1941. (2) Dukhin, S. S.; Kretzschmar, G.; Miller,R. Dynamics of Adsorption at LiquidInterfaces - Theory, Experiment, Application; Elsevier: Amsterdam, 1995. (3) Tarek,M.; Tobias, D. J.; Klein, M. L. Journal of Physical Chemistry 1995,99,1393. (4) Winter, B.;Weber, R.; Schmidt, P. M.; Hertel, I. V.; Faubel, M.; Vrbka, L.;Jungwirth, P. Journal ofPhysical Chemistry B 2004,108,14558. (5) Koelsch, P.; Motschmann, H. Journal of Physical Chemistry B 2004, 108,18659. (6) Koelsch, P.; Motschmann, H. Langmuir 2005,21, 3436. (7) Bae, S.; Haage, K.; Wantke, K.; Motschmann, H. Journal of PhysicalChemistry B 1999, 103,1045. (8) Koelsch, P.; Motschmann, H. Current Opinion in Colloid & Interface Science2004,9,87. (9) Chang, T. M.; Dang, L. X. Journal ofPhysical Chemistry B 1999,103,4714. (10) Jungwirth, P.; Tobias, D. J. Journal ofPhysical Chemistry B 2001, 105,10468. (11) Wang, J. M.; Wolf, R. M.; Caldwell, J. W.; Kollman,P. A.; Case, D. A. Journal ofComputational Chemistry 2004,25,1157. (12) Caldwell, J. W.; Kollman, P. A. Journal of Physical Chemistry 1995, 99, 6208. (13) Essmann, U.; Perera, L.; Berkowitz, M. L.; Darden, T.; Lee, H.; Pedersen, L.G. Journal of Chemical Physics 1995, 103,8577. (14) Ryckaert, J.-P.; Ciccotti, G.; Berendsen, H. J. C. Journal of ComputationalPhysics 1977,23,327. (15) Case, D. A. P., D.A.; Caldwell, J.W.; Cheatham III, T.E.; Wang, J.; Ross,W.S.; Simmerling, C.L.; Darden, T.A.; Merz, K.M.; Stanton, R.V.; Cheng, A.L.; Vincent,J.J.; Crowley,M.; Tsui,V.; Gohlke, H.; Radmer,R.J.; Duan, Y.; Pitera,J.; Massova, I.;Seibel, G.L.; Singh, U.C.; Weiner, P.K.; Kollman, P.A. Amber7; Amber7, University ofCalifornia: San Francisco, 2002. (16) Haage, K.; Motschmann, H.; Bae, S. M.; Grundemann, E. Colloids andSurfaces a-Physicochemical and Engineering Aspects 2001, 183,583. (17) Lunkenheimer, K.; Pergande, H. J.; Kruger, H. Review of Scientific Instruments1987,58,2313. (18) Shen, Y. R. Annual Review of Physical Chemistry 1989, 40, 327. (19) Shen, Y. R. The Principles of Nonlinear Optics; Wiley: New York, 1984. (20) Jungwirth, P.; Tobias, D. J. Journal of Physical Chemistry B 2002, 106,6361. (21) Ortegren, J.; Wantke, K. D.;Motschmann, H.; Mohwald, H. Journal of ColloidandInterface Science 2004, 279,266. (22) Koelsch, P.; Motschmann, H. Langmuir 2005, 21, 6265. (23) Onsager, L.; Samaras, N. N. T. Jornal of Chemical Physics 1934, 2,528. (24) Lau, A. W. C.; Pincus, P. Physical Review E 2002, 66. (25) Lau, A. W. C.; Lukatsky, D. B.; Pincus, P.; Safran, S. A. Physical Review E2002,65. (26) Moreira, A. G.; Netz,R. R. European Physical Journal E 2002, 8,33. (27) Netz,R. R.;Orland, H. European Physical Journal E 2000, 1, 203. (28) Richmond, G. L. Chemical Reviews 2002, 102,2693. (29) Buch, V. Journal ofPhysical Chemistry B 2005,109,17771. (30) Liu,D. F.; Ma,G.; Levering, L. M.; Allen, H. C. Journal of PhysicalChemistry B 2004, 108,2252. (31) Raymond, E. A.; Richmond, G.L. Journal of Physical Chemistry B 2004, 108,5051.
确定

还剩29页未读,是否继续阅读?

产品配置单

北京欧兰科技发展有限公司为您提供《水解离子,互补两性离子,可溶性表面活性剂,表面分子中反应动力学模拟,和频发生光谱学,SFG检测方案(其它光谱仪)》,该方案主要用于其他中反应动力学模拟,和频发生光谱学,SFG检测,参考标准--,《水解离子,互补两性离子,可溶性表面活性剂,表面分子中反应动力学模拟,和频发生光谱学,SFG检测方案(其它光谱仪)》用到的仪器有Ekspla SFG 表面和频光谱分析系统、Ekspla PL2230型高能量皮秒激光器、Ekspla CARS 相干反斯托克斯拉曼显微光谱仪
推荐专场
其它光谱仪
更多


相关方案
更多
该厂商其他方案
更多