


Sum frequency generation imaging microscopy has been used to investigate a self-assembled monolayer of
an alkanethiol (octadecanethiol, ODT) on a mild steel surface. The images are used to analyze the orientation
of the alkanethiol monolayer and the distribution of orientational angles as well as defects in the film. The
results show that, on average, ODT forms an ordered monolayer on mild steel when compared to the same
monolayer on gold. However, the image analysis suggests that the distribution of tilt angles and conformational
defects is greater for ODT on a mild steel surface compared to ODT/Au.
方案详情

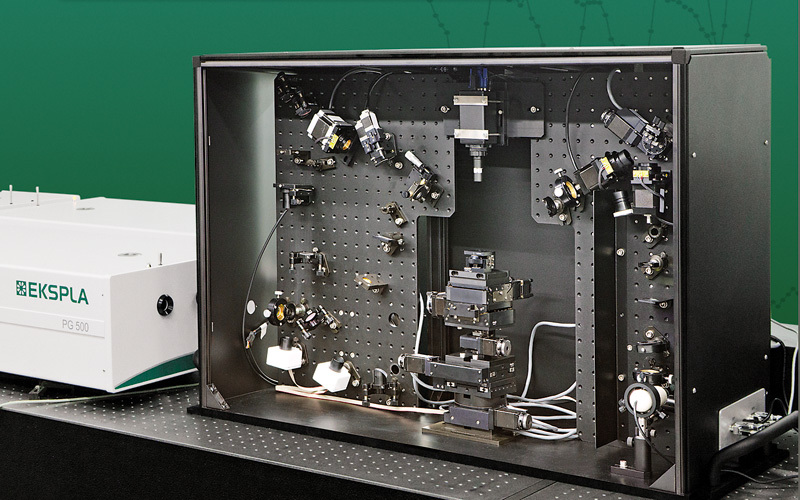
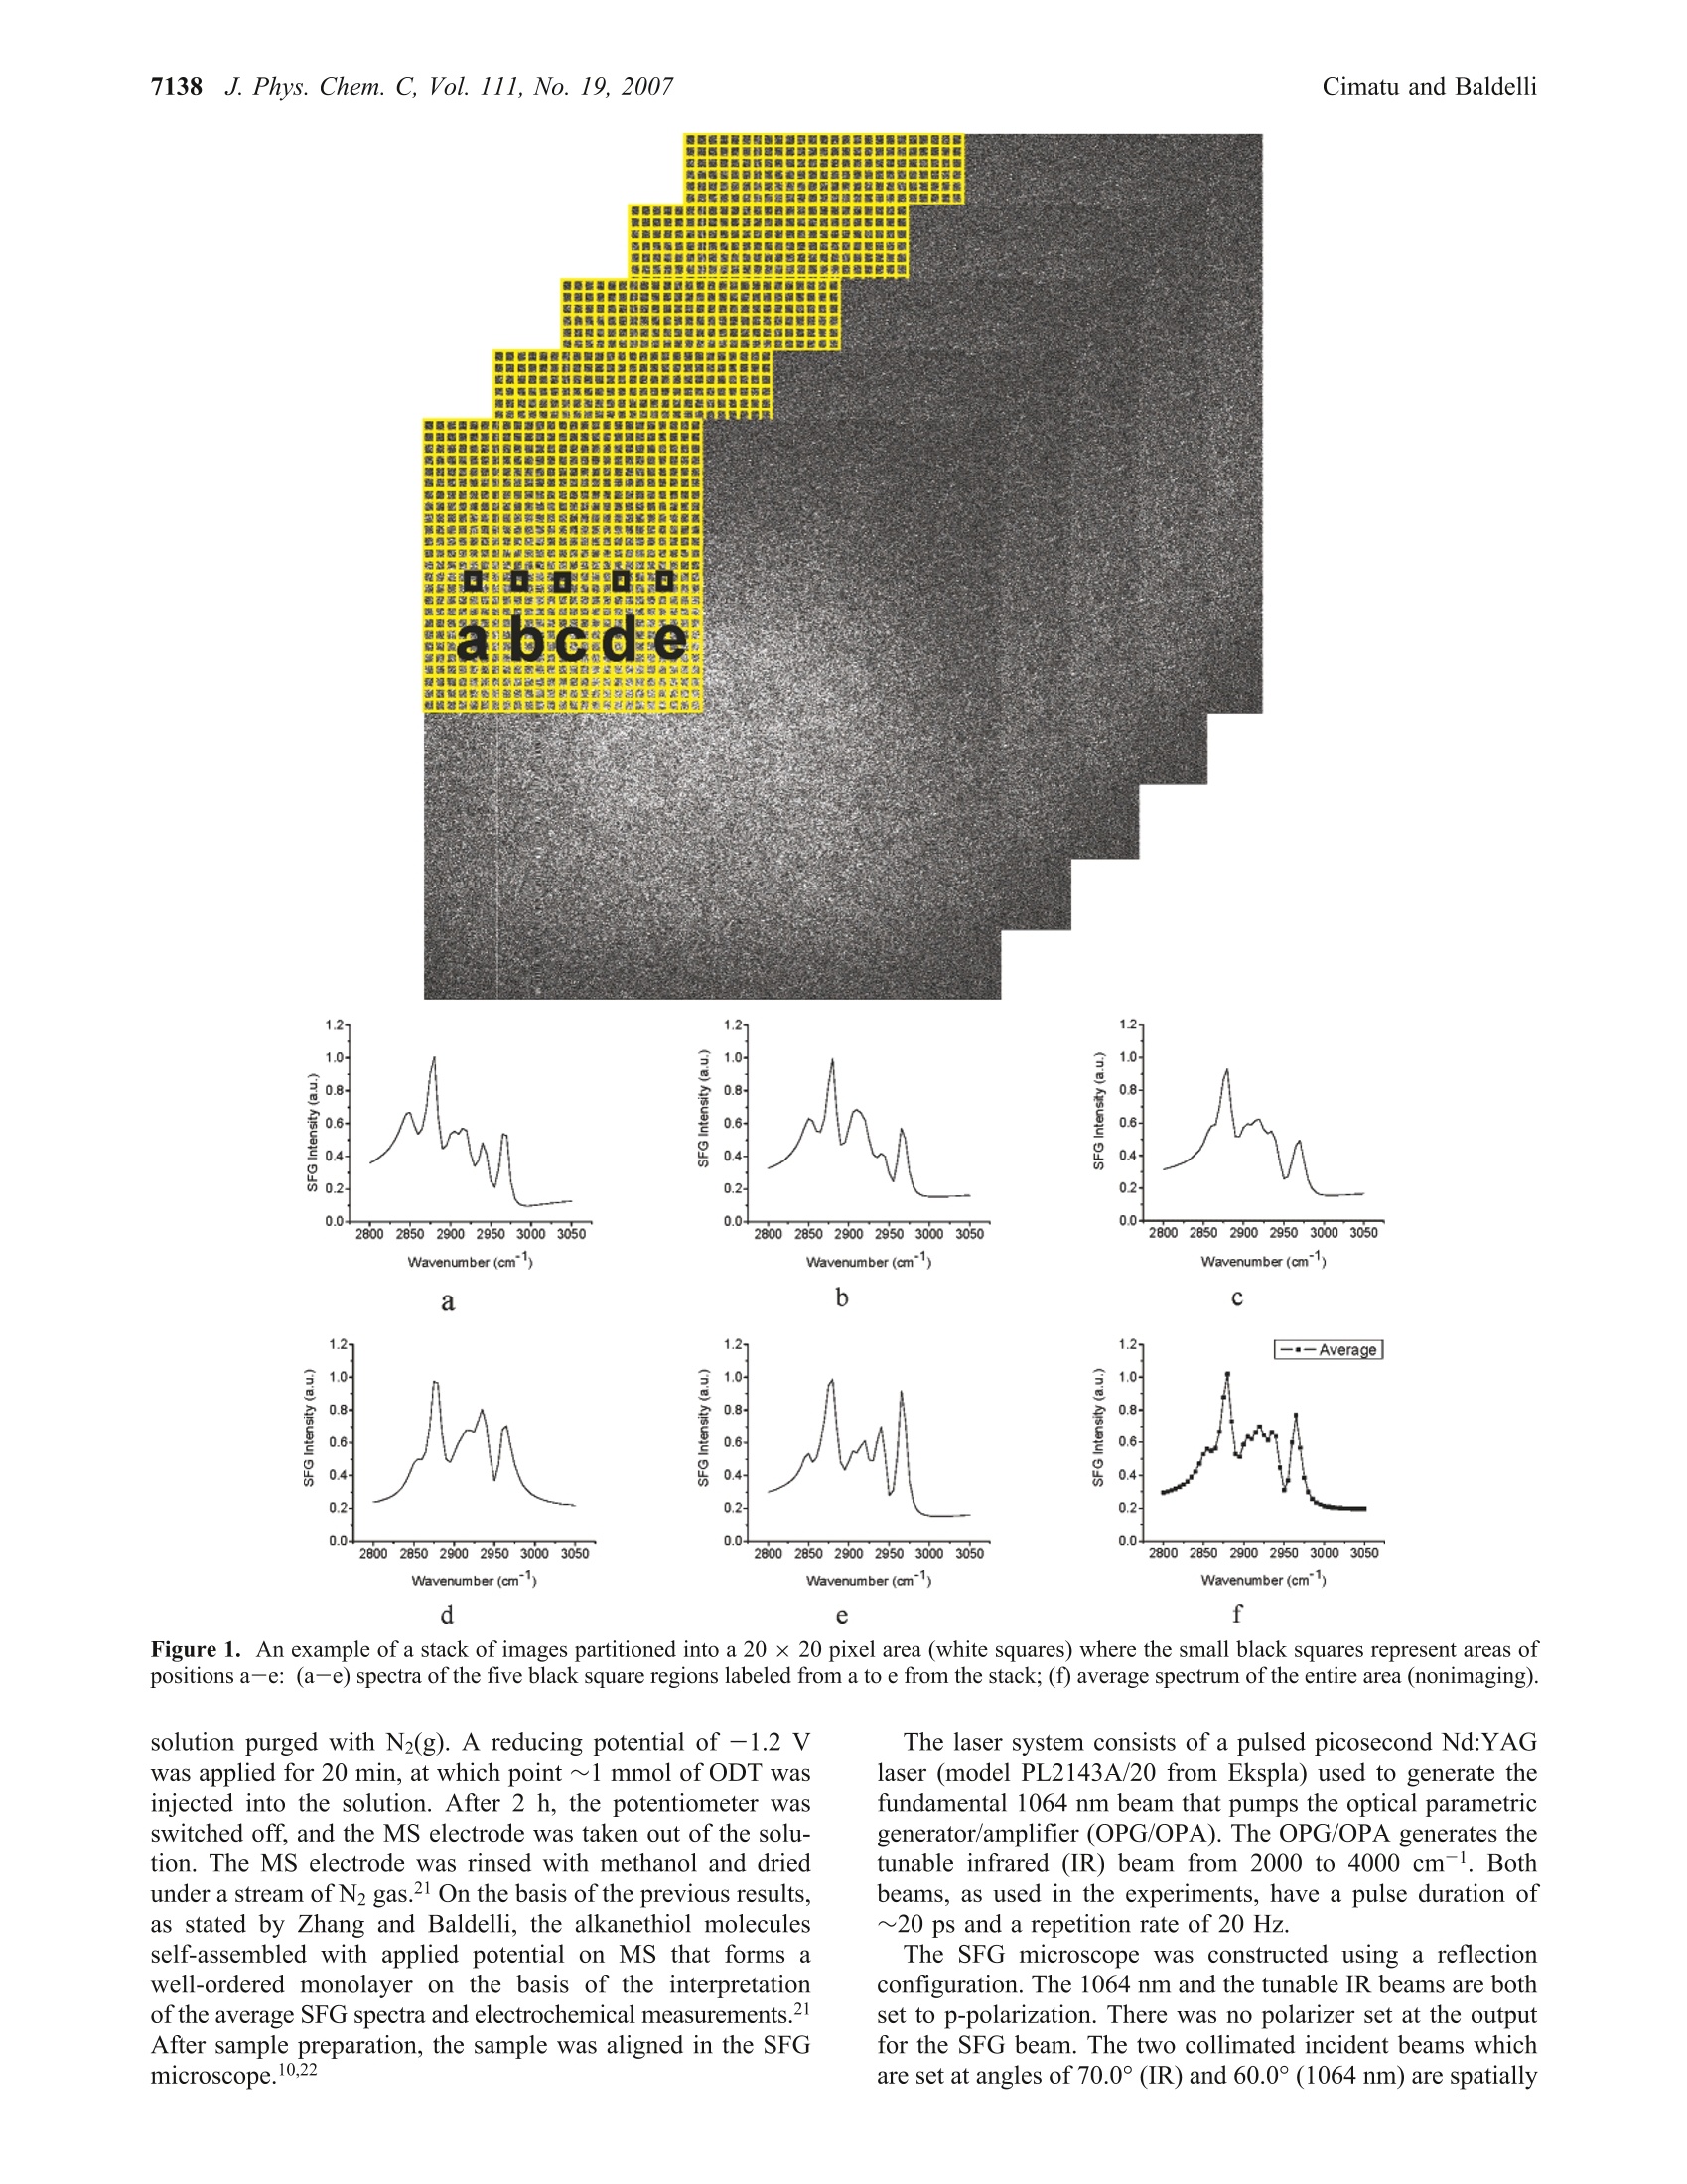
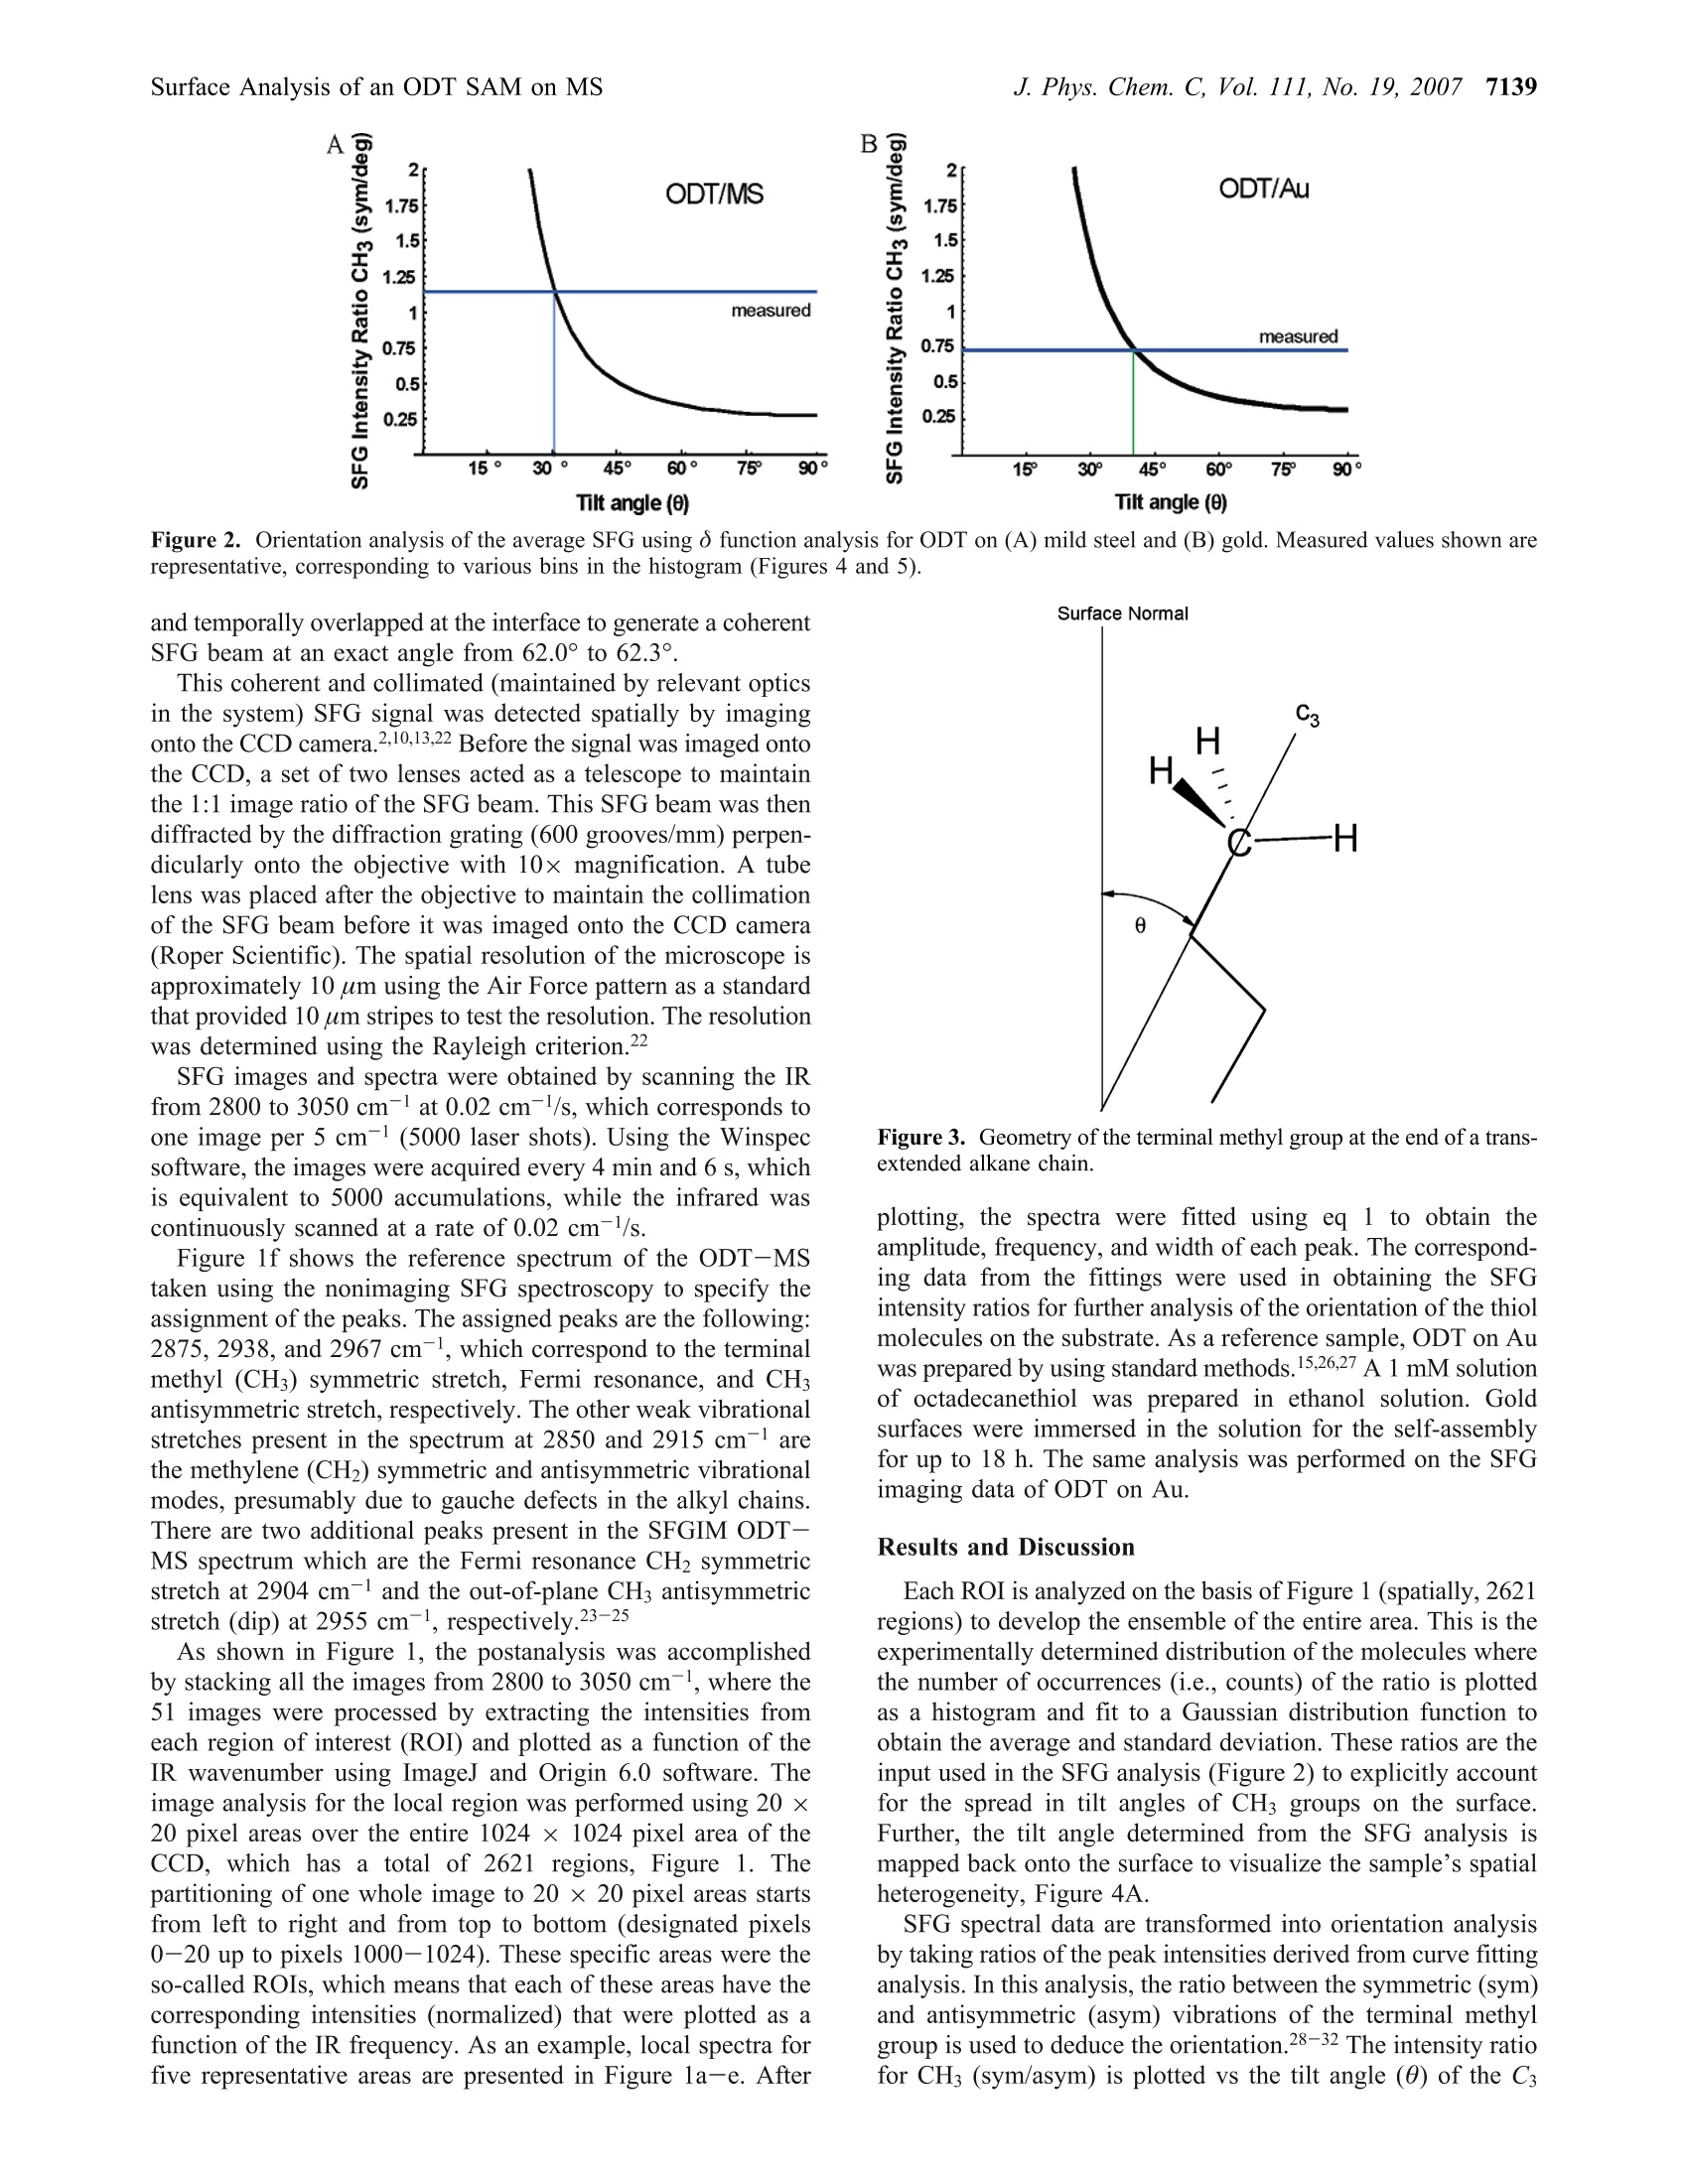
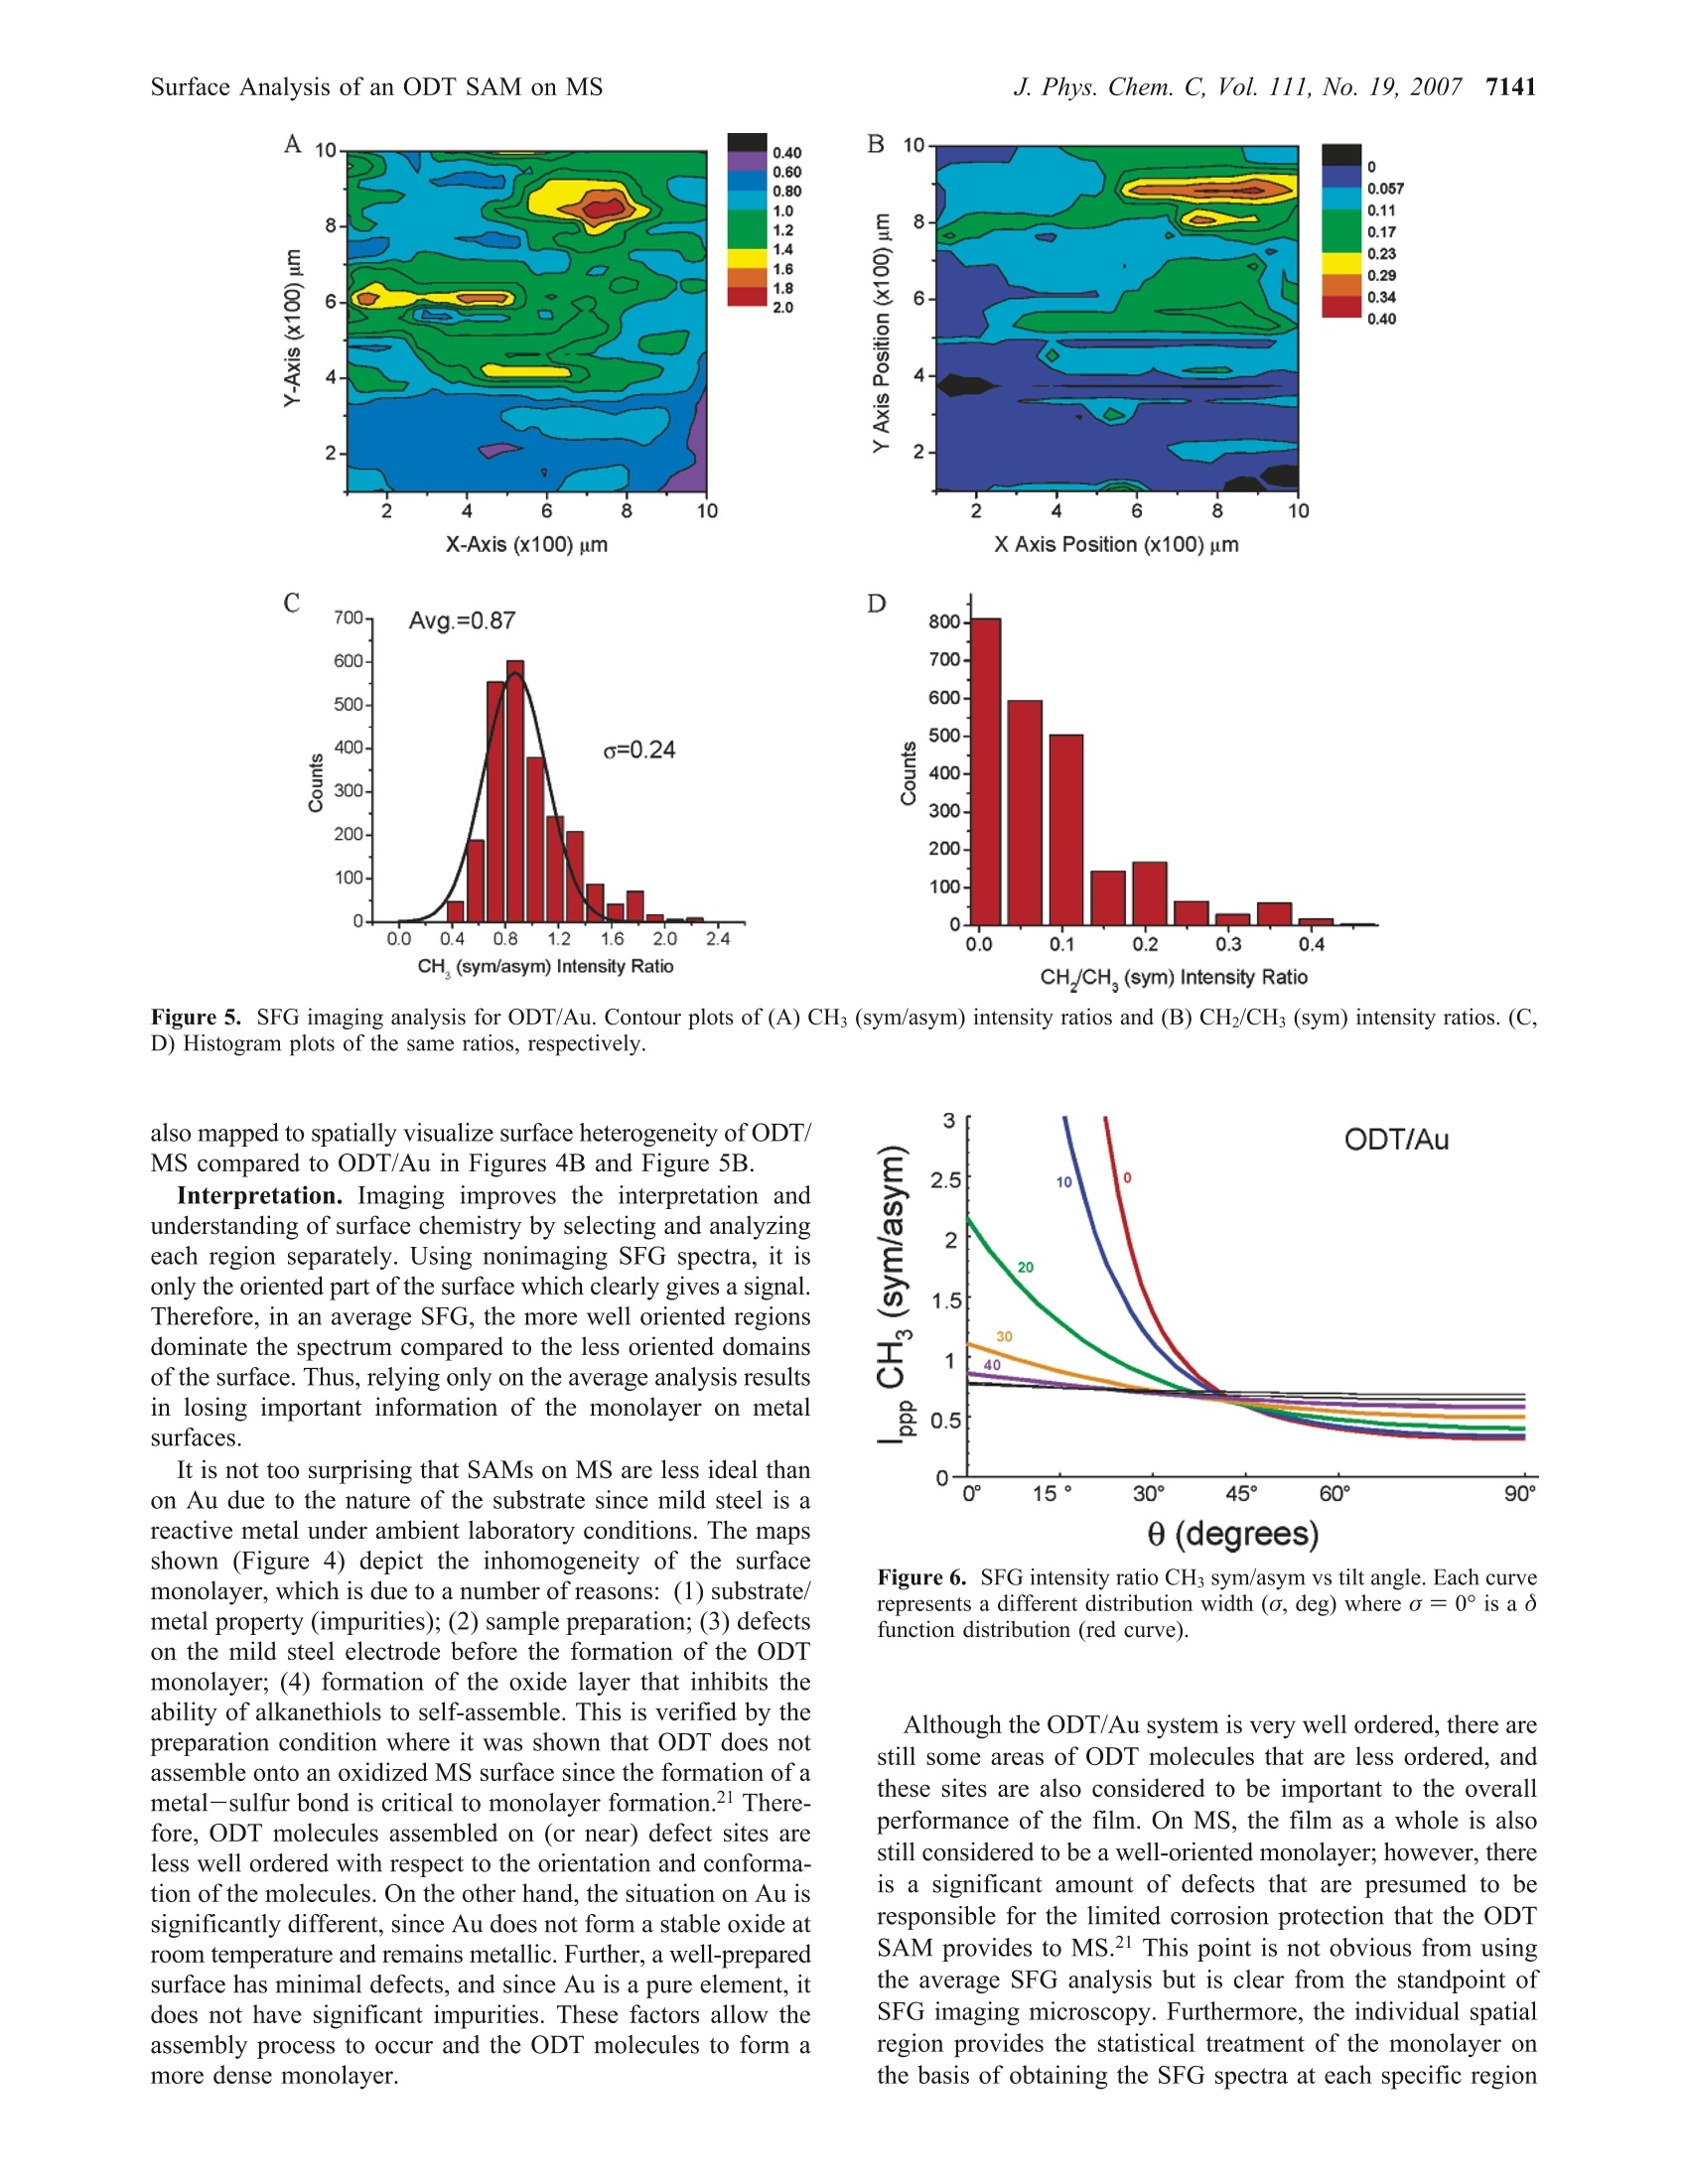
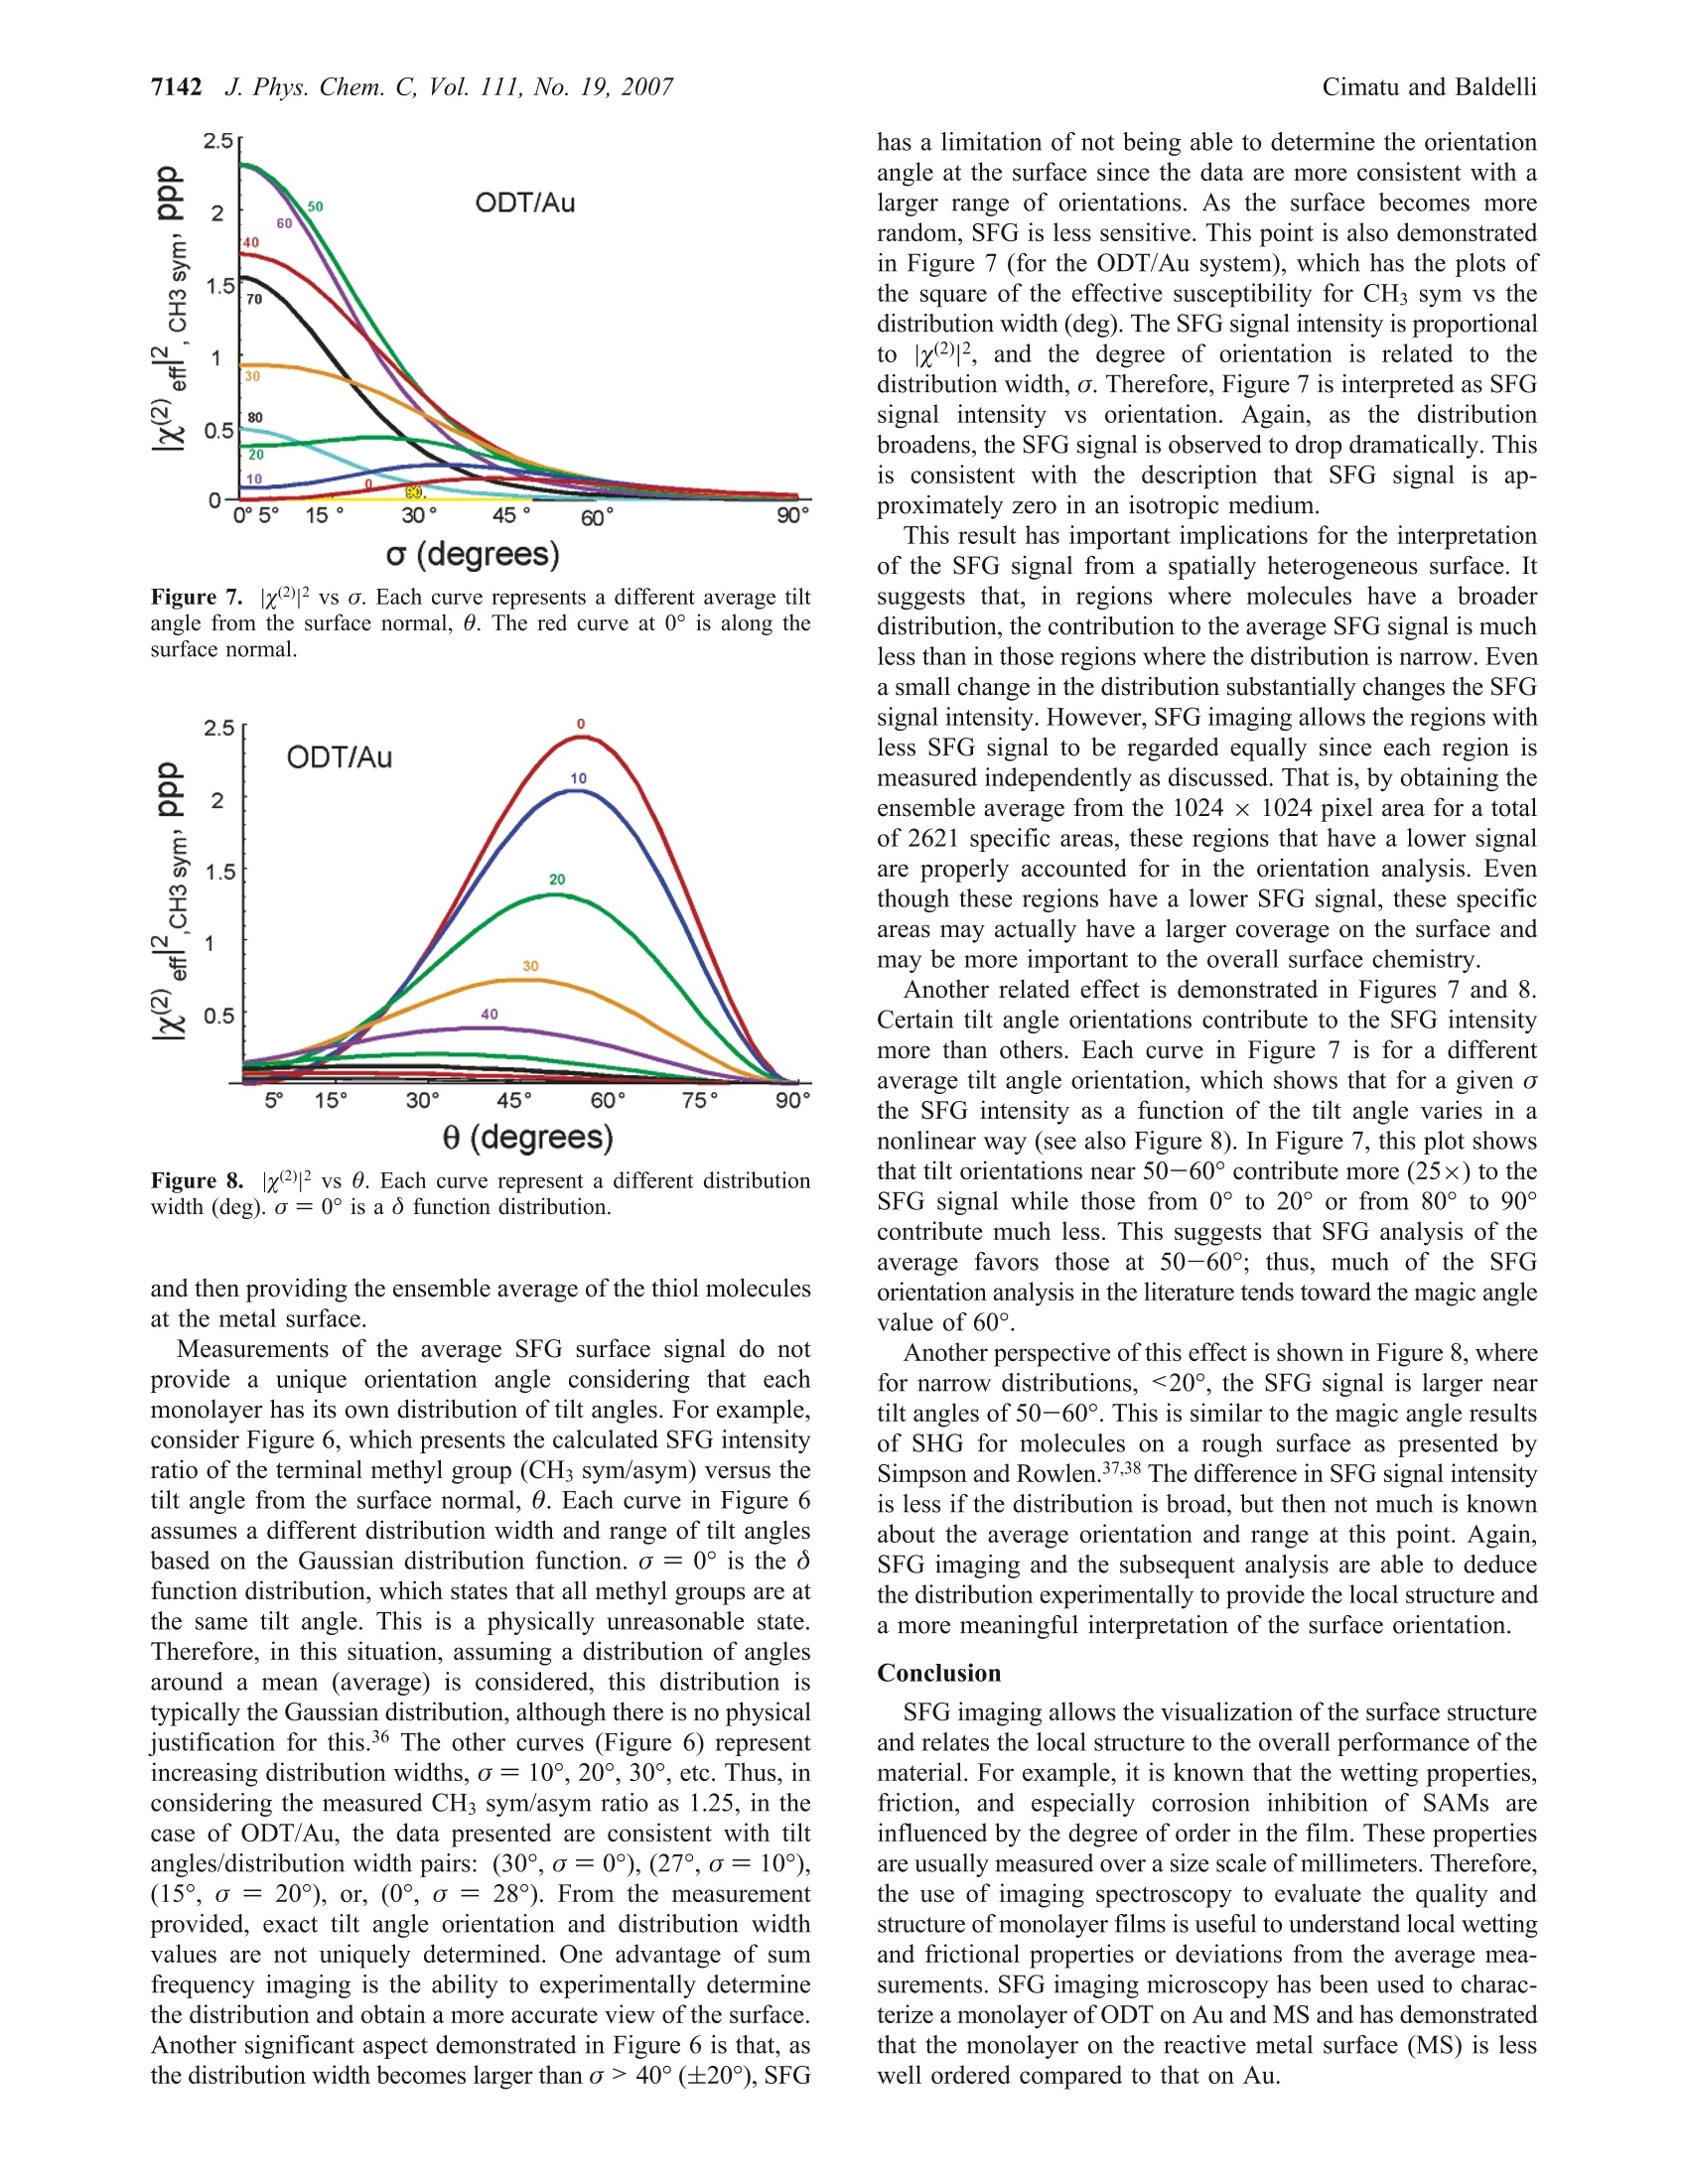
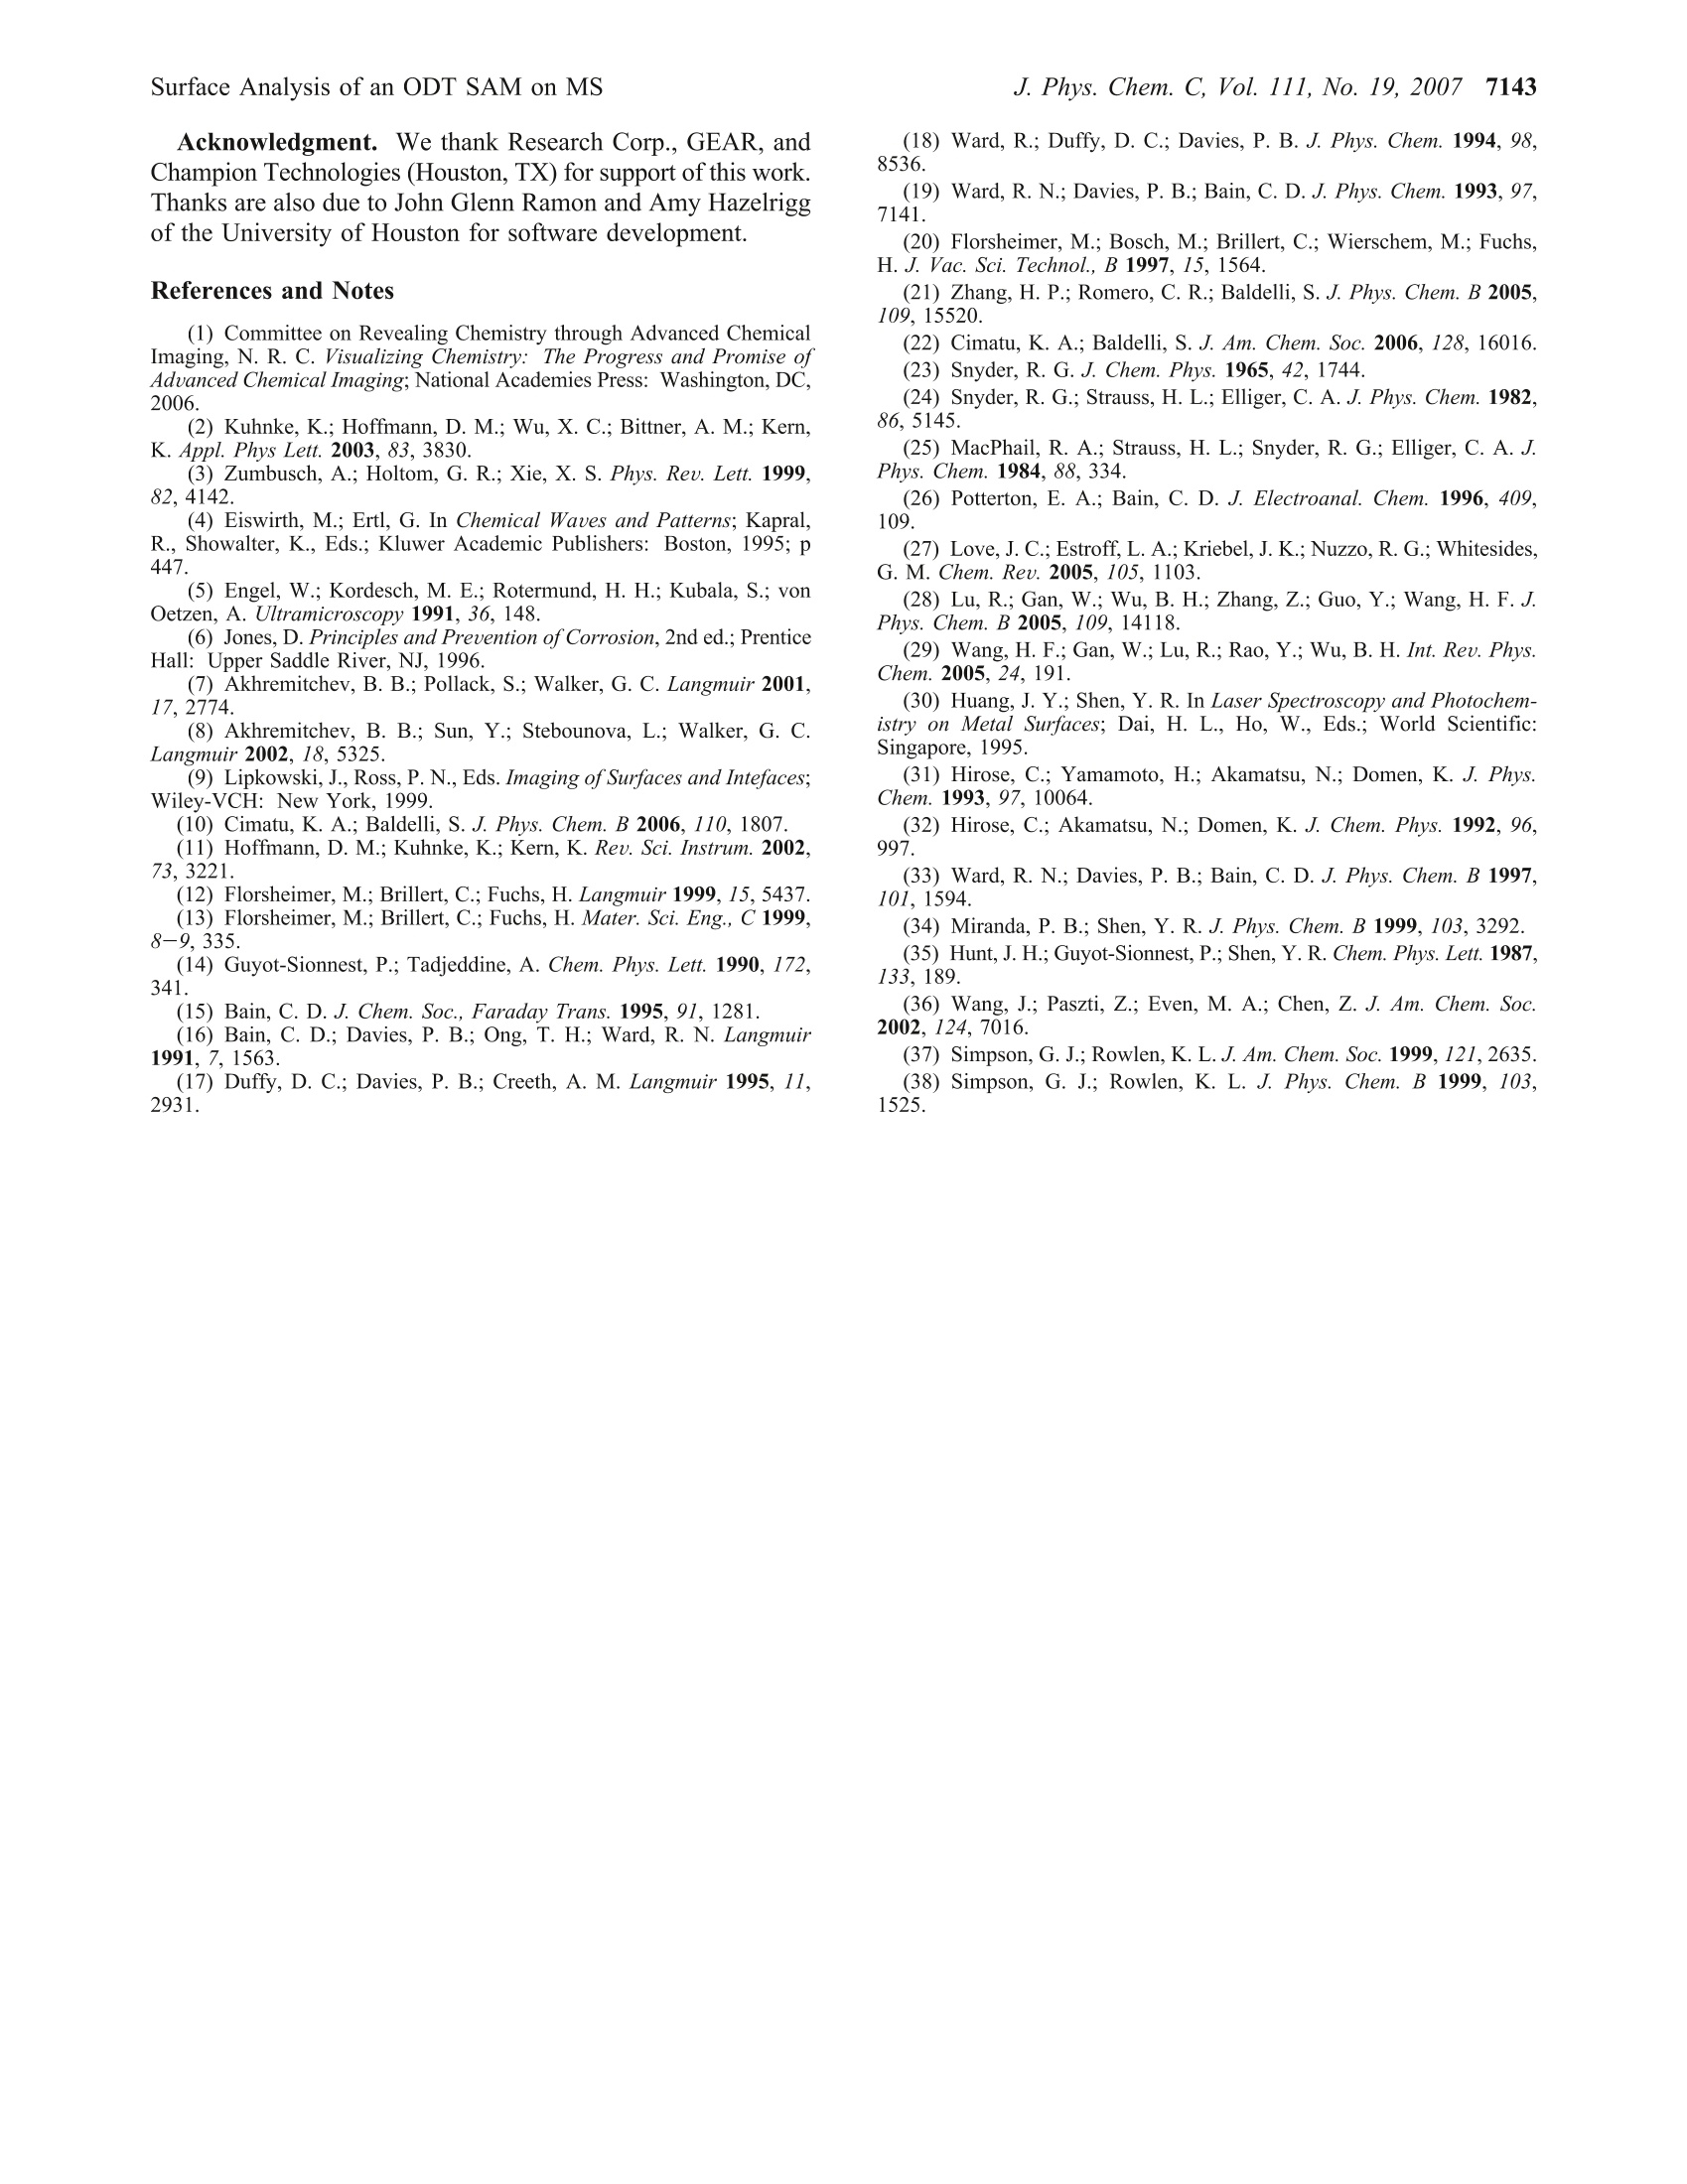
J. Phys. Chem. C 2007,111,7137-71437137 7138J. Phys. Chem. C, Vol. 111, No. 19, 2007Cimatu and Baldelli 10.1021/jp070095s CCC: $37.00 C2007 American Chemical SocietyPublished on Web 04/21/2007 Spatially Resolved Surface Analysis of an Octadecanethiol Self-Assembled Monolayer onMild Steel Using Sum Frequency Generation Imaging Microscopy Katherine Cimatu and Steven Baldelli* Department of Chemistry, University of Houston, Houston, Texas 77204 Received: January 5, 2007; In Final Form: March 15, 2007 Sum frequency generation imaging microscopy has been used to investigate a self-assembled monolayer ofan alkanethiol (octadecanethiol, ODT) on a mild steel surface. The images are used to analyze the orientationof the alkanethiol monolayer and the distribution of orientational angles as well as defects in the film. Theresults show that, on average, ODT forms an ordered monolayer on mild steel when compared to the samemonolayer on gold. However, the image analysis suggests that the distribution of tilt angles and conformationaldefects is greater for ODT on a mild steel surface compared to ODT/Au. Introduction A persistent problem in the analysis of solid surfaces is thateven a carefully prepared surface contains defects in the rangeof 0.1-1000 um.-4 These defects are, for example, fromscratches, impregnated particles from polishing, or other foreignmaterials. The molecules adsorbed at or near these sitesdramatically influence the surface properties in applicationssuch as corrosion inhibition, catalysis, electronics, and biocom-patibility.s,6 As a result, analysis of the average surface pro-perties is misleading when the spatial distribution of themolecules on the surface is not taken into account. Thus, surfacecharacterization with spatial resolution has its benefits inobtaining structural and topological differences and also acquir-ing chemical information. The ability to spectroscopically and spatially investigatesurfaces is not common in a single-probe technique becauseeach method has its own limitation. Sum frequency generation(SFG) imaging is able to address some of these issues since ithas a high surface specificity, submonolayer sensitivity, chemi-cal selectivity, and a potential spatial resolution of approximately1 um.10-13 This study focuses on the utilization of this imagingtechnique tto Odetermine the chemical composition of an al-kanethiolate monolayer at the gas-metal interface and dif-ferentiate the molecules oriented at a local region versus thesample average. Spatial resolution is achieved without scanningand focusing on the sample but rather using collimated inputbeams and having the SFG signal imaged onto a CCD camera.Self-assembled monolayers (SAMs) on metal surfaces providea good model system to demonstrate the significance of aheterogeneous surface film. A two-dimensional surface analysis of octadecanethiol (ODT)on mild steel (MS) is performed using sum frequency generationimaging microscopy (SFGIM). A systematic statistical analysisof SFG spectra at different surface positions is performed toobtain the symmetric and antisymmetric ratios of the CHstretches (CH sym/asym) to provide the distribution of tiltangles for the terminal methyl group. In addition, the CH2/CH3(sym) ratio is obtained to estimate the degree of conformationaldisorder of the alkyl chain in the monolayer. SFG imagingmicroscopy is able to deduce tilt angle and defect distributionsofthe ODT molecules across the mild steel surface. In summary.ODT-MS has a wider range of tilt angles and conformational disorder but is still considered a well-ordered monolayer whencompared to the ODT-Au system. Background SFG is a second-order surface-sensitive nonlinear process, 14and as a surface technique, SFG spectroscopy has become avery effective tool in obtaining the vibrational spectra ofmolecules at the interface 15 In general, the SFG process involvesthe spatial and temporal overlap of two pulsed laser beams onthe surface with molecules in a noncentrosymmetric environ-ment to generate the SFG signal effectively.14-16 The generationprocess is proportional to the second-order nonlinear susceptibil-ity, x(2), which contains the vibrational molecular information,x, and a nonresonant term, XNR, shown as where N is the total number of vibrational modes and (B) isthe orientational averaged hyperpolarizability, which containsthe IR and Raman transition moments. Accordingly, as the IRlaser frequency, ωR, approaches the qth vibrational mode,ωq,of the molecules at the interface,resonance enhancement of theSFG intensity is observed. Plotting the SFG intensity as afunction of the IR wavenumber yields a vibrational spectrumwhich has either a peak or a dip. The peak or dip is a result ofthe interference between x and x that is either constructiveor destructive interference depending on the phase and magni-tude of the terms, respectively.17-20 Experimental Section The sample was prepared by purchasing the standard reagents(ODT, CH(CH2)17SH, 98%; LiCl, anhydrous, 99% minimum;MeOH, 99.9%, spectrophotometric grade) and using them asreceived. The mild steel electrode from Champion Technologieswas mounted onto a Teflon sheath. The electrode was polisheddown to 0.05 um with alumina slurry and then sonicated withethanol to remove the polishing residues. It was then rinsedwith water and methanol. Next the electrode was placed in athree-electrode electrochemical cell with a 0.1 M LiCl/CHOH 1.2 0.2 0.00- 1.2 一-Average 一c0.4 0.2. 0.0· solution purged with N2(g). A reducing potential of -1.2 Vwas applied for 20 min, at which point ~1 mmol of ODT wasinjected into the solution. After 2 h, the potentiometer wasswitched off. and the MS electrode was taken out of the solu-tion. The MS electrode was rinsed with methanol and driedunder a stream of N2 gas.21 On the basis of the previous results,as stated by Zhang and Baldelli, the alkanethiol moleculesself-assembled with applied potential on MS that forms awell-ordered monolayer on the basis of the interpretationofthe average SFG spectra and electrochemical measurements.After sample preparation, the sample was aligned in the SFGmicroscope.10,22 The laser system consists of a pulsed picosecond Nd:YAGlaser (model PL2143A/20 from Ekspla) used to generate thefundamental 1064 nm beam that pumps the optical parametricgenerator/amplifier (OPG/OPA). The OPG/OPA generates thetunable infrared (IR) beam from 2000 to 4000 cm. Bothbeams, as used in the experiments, have a pulse duration of~20 ps and a repetition rate of 20 Hz. The SFG microscope was constructed using a reflectionconfiguration. The 1064 nm and the tunable IR beams are bothset to p-polarization. There was no polarizer set at the outputfor the SFG beam. The two collimated incident beams whichare set at angles of 70.0° (IR) and 60.0°(1064 nm) are spatially A B 3E工c Tilt angle (0) Tilt angle () Figure 2. Orientation analysis of the average SFG using o function analysis for ODT on (A) mild steel and (B) gold. Measured values shown arerepresentative, corresponding to various bins in the histogram (Figures 4 and 5). and temporally overlapped at the interface to generate a coherentSFG beam at an exact angle from 62.0° to 62.3°. This coherent and collimated (maintained by relevant opticsin the system) SFG signal was detected spatially by imagingonto the CCD camera.2,10,13,22 Before the signal was imaged ontothe CCD, a set of two lenses acted as a telescope to maintainthe 1:1 image ratio of the SFG beam. This SFG beam was thendiffracted by the diffraction grating (600 grooves/mm) perpen-dicularly onto the objective with 10x magnification. A tubelens was placed after the objective to maintain the collimationof the SFG beam before it was imaged onto the CCD camera(Roper Scientific). The spatial resolution of the microscope isapproximately 10 um using the Air Force pattern as a standardthat provided 10 um stripes to test the resolution. The resolutionwas determined using the Rayleigh criterion." SFG images and spectra were obtained by scanning the IRfrom 2800 to 3050 cm- at 0.02 cm-l/s, which corresponds toone image per 5 cm- (5000 laser shots). Using the Winspecsoftware, the images were acquired every 4 min and 6 s, whichis equivalent to 5000 accumulations, while the infrared wascontinuously scanned at a rate of 0.02 cm-/s. Figure 1f shows the reference spectrum of the ODT-MStaken using the nonimaging SFG spectroscopy to specify theassignment of the peaks. The assigned peaks are the following:2875, 2938, and 2967 cm-l, which correspond to the terminalmethyl (CH3) symmetric stretch, Fermi resonance, and CHantisymmetric stretch, respectively. The other weak vibrationalstretches present in the spectrum at 2850 and 2915 cm- arethe methylene (CH2) symmetric and antisymmetric vibrationalmodes, presumably due to gauche defects in the alkyl chains.There are two additional peaks present in the SFGIM ODT-MS spectrum which are the Fermi resonance CH2 symmetricstretch at 2904 cm- and the out-of-plane CH3 antisymmetricstretch (dip) at 2955 cm-l,respectively.23-25 As shown in Figure 1, the postanalysis was accomplishedby stacking all the images from 2800 to 3050 cm-, where the51 images were processed by extracting the intensities fromeach region of interest (ROI) and plotted as a function of theIR wavenumber using ImageJ and Origin 6.0 software. Theimage analysis for the local region was performed using 20 x20 pixel areas over the entire 1024 x 1024 pixel area of theCCD, which has a total of 2621 regions, Figure 1. Thepartitioning of one whole image to 20 ×20 pixel areas startsfrom left to right and from top to bottom (designated pixels0-20 up to pixels 1000-1024). These specific areas were theso-called ROIs. which means that each of these areas have thecorresponding intensities (normalized) that were plotted as afunction of the IR frequency. As an example, local spectra forfive representative areas are presented in Figure la-e. After Figure 3. Geometry of the terminal methyl group at the end of a trans-extended alkane chain. plotting, the spectra were fitted using eq 1 to obtain theamplitude, frequency, and width of each peak. The correspond-ing data from the fittings were used in obtaining the SFGintensity ratios for further analysis of the orientation of the thiolmolecules on the substrate. As a reference sample,ODT on Auwas prepared by using standard methods. 15,26,27 A1 mM solutionof octadecanethiol was prepared in ethanol solution. Goldsurfaces were immersed in the solution for the self-assemblyfor up to 18 h. The same analysis was performed on the SFGimaging data of ODT on Au. Results and Discussion Each ROI is analyzed on the basis of Figure 1 (spatially, 2621regions) to develop the ensemble of the entire area. This is theexperimentally determined distribution of the molecules wherethe number of occurrences (i.e.,counts) of the ratio is plottedas a histogram and fit to a Gaussian distribution function toobtain the average and standard deviation. These ratios are theinput used in the SFG analysis (Figure 2) to explicitly accountfor the spread in tilt angles of CH3 groups on the surface.Further, the tilt angle determined from the SFG analysis ismapped back onto the surface to visualize the sample’s spatialheterogeneity, Figure 4A. SFG spectral data are transformed into orientation analysisby taking ratios of the peak intensities derived from curve fittinganalysis. In this analysis, the ratio between the symmetric (sym)and antisymmetric (asym) vibrations of the terminal methylgroup is used to deduce the orientation.28-32 The intensity ratiofor CH(sym/asym) is plotted vs the tilt angle (0) of the C3 0.50 0.68 0 0.18 0.86 0.36 0.55 0.73 0.91 X Axis(x 100)um X Axis(x 100)um C 1000- D 1000- 3.5 axis from the surface normal in Figure 2, where this analysisuses the ò function distribution (i.e., all molecules have iden-tical angles). Each ROI is considered to have a o functiondistribution. Parts A and B of Figure 4 show the spatial distribution (map)of the (A) CH3 (sym/asym) ratio for tilt angle interpretationand (B) CH2/CHs (sym) ratio for the number of defects (localdistribution of defects across the area) represented by the contourplot. Analysis of the SFG images for ODT on MS is compared tothe well-established information available for ODT on gold.Insight into the structure of the ODT monolayer is obtainedfrom the SFG imaging analysis. First, SFG spectra are used to deduce the average tilt anglefrom CH the (sym/asym) ratio.29,31,32 Under nonimagingconditions, this analysis provides the so-called o functionorientation where all groups are considered to have a single tiltangle (O). This is not a physically reasonable situation. However,using spatially resolved SFG spectra, each ROI becomes onecomponent of the entire ensemble, and therefore, the distributionis directly determined. The size for the specific regions ofinterest in this experiment is 20 × 20 um. Tilt Angle Analysis. The histogram plots of CHs (sym/asym)for ODT on MS and Au are presented in Figures 4C and 5C,respectively. From this analysis, two important observa-tions are made. First, the average values are different, i.e.,different tilt angles on the two surfaces. On Au, the ratio is0.87, which corresponds to a tilt angle of 37° from the sur-face normal. On MS, the ratio is 1.23 and is consistent with atilt angle of 29°. Then the calculated intensity ratios aremapped back onto the surface to observe the surface’s hetero-geneity (on the basis of the difference in color whichpertains to the intensity ratio at a specific area), Figures 4Aand 5A. It is interesting to note that without consideration of the distribution (nonimaging SFG) the tilt angles are deter-mined to be 30° and 23° for ODT/Au and ODT/MS, respec-tively.21 Second, each system has a different distribution widthfor the tilt angle. The width, from the Gaussian curve, is ameasure of the degree of surface heterogeneity. The CH3 (sym/asym) ratio for each ROI is summarized in the histograms shownin Figures 4C and 5C and also transformed into a tilt orientationas given in Figure 2A. Thus, the results show tilt angle rangesof about 9° for ODT/Au and 17° for ODT/MS. The interpreta-tion is that the surface monolayer is less oriented on MS thanAu. Important information is neglected or overlooked that leadsto a misinterpretation of the degree of homogeneity for SAMson the metal surface when only the average spectrum isconsidered. Film Disorder Analysis. SFG spectra are also useful indetermining how densely packed (or“perfect") the chains inthe film are by considering the conformational defects. It issuggested that, as the alkyl chain deviates from the all-transconfiguration, pairs of CH2 groups without an inversion centerwill appear in the SFG spectrum.15,26,33,34 Since an ideally densemonolayer, theoretically, has no conformational defects, theCH2/CH(sym) stretching ratio is commonly used as a guideto determine the degree of disorder in the monolayer.35 The1-alkanethiols on gold are considered the standard of a well-ordered monolayer; thus, this system is used to compare withthe ODT on MS. In considering conformational defects across the surface, theratios of the CH2/CH3 (sym) intensities are obtained fromspectral analysis. These ratios are compared in the histogramsshown in Figure 4D for ODT on MS and Figure 5D for ODTon Au. The CH2/CH3(sym) ratio for ODT/Au is ~0.04, whileon MS this ratio is 0.6. The average values clearly demonstratethat as the ratio deviates from zero the monolayer contains moredefects on MS than on Au. The ratios of these two surfaces are 0.40 B110 0 0.60 0.80 0.057 1.0 0.11 E8-位仙侣c> 0.17 0.23 0.29 6 0.34 0.40 4- 2- 2 4 6 8 10 X-Axis (x100) um X Axis Position (x100) um C D 2.4 Figure 5. SFG imaging analysis for ODT/Au. Contour plots of (A) CH (sym/asym) intensity ratios and (B) CH2/CH (sym) intensity ratios. (C,D) Histogram plots of the same ratios, respectively. also mapped to spatially visualize surface heterogeneity ofODT/MS compared to ODT/Au in Figures 4B and Figure 5B. Interpretation. Imaging improves the interpretation andunderstanding of surface chemistry by selecting and analyzingeach region separately. Using nonimaging SFG spectra, it isonly the oriented part of the surface which clearly gives a signal.Therefore, in an average SFG, the more well oriented regionsdominate the spectrum compared to the less oriented domainsof the surface. Thus, relying only on the average analysis resultsin losing important information of the monolayer on metalsurfaces. It is not too surprising that SAMs on MS are less ideal thanon Au due to the nature of the substrate since mild steel is areactive metal under ambient laboratory conditions. The mapsshown (Figure 4) depict the inhomogeneity of the surfacemonolayer, which is due to a number of reasons: (1) substrate/metal property (impurities); (2) sample preparation;(3) defectson the mild steel electrode before the formation of the ODTmonolayer; (4) formation of the oxide layer that inhibits theability of alkanethiols to self-assemble. This is verified by thepreparation condition where it was shown that ODT does notassemble onto an oxidized MS surface since the formation of ametal-sulfur bond is critical to monolayer formation.21 There-fore, ODT molecules assembled on (or near) defect sites areless well ordered with respect to the orientation and conforma-tion ofthe molecules. On the other hand, the situation on Au issignificantly different, since Au does not form a stable oxide atroom temperature and remains metallic. Further, a well-preparedsurface has minimal defects, and since Au is a pure element, itdoes not have significant impurities. These factors allow theassembly process to occur and the ODT molecules to form amore dense monolayer. Figure 6. SFG intensity ratio CH3 sym/asym vs tilt angle. Each curverepresents a different distribution width (o, deg) where o =0° is a ofunction distribution (red curve). Although the ODT/Au system is very well ordered, there arestill some areas of ODT molecules that are less ordered, andthese sites are also considered to be important to the overallperformance of the film. On MS, the film as a whole is alsostill considered to be a well-oriented monolayer; however, thereis a significant amount of defects that are presumed to beresponsible for the limited corrosion protection that the ODTSAM provides to MS.21 This point is not obvious from usingthe average SFG analysis but is clear from the standpoint ofSFG imaging microscopy. Furthermore, the individual spatialregion provides the statistical treatment of the monolayer onthe basis of obtaining the SFG spectra at each specific region Figure 7. x(2)|2vs o. Each curve represents a different average tiltangle from the surface normal, 0. The red curve at 0° is along thesurface normal. Figure 8.x2)|2 vs 0. Each curve represent a different distributionwidth (deg). o =0° is a o function distribution. and then providing the ensemble average of the thiol moleculesat the metal surface. Measurements of the average SFG surface signal do notprovide a unique orientation angle considering that eachmonolayer has its own distribution of tilt angles. For example,consider Figure 6, which presents the calculated SFG intensityratio of the terminal methyl group (CH3 sym/asym) versus thetilt angle from the surface normal, 0. Each curve in Figure 6assumes a different distribution width and range of tilt anglesbased on the Gaussian distribution function. o=0° is the ofunction distribution, which states that all methyl groups are atthe same tilt angle. This is a physically unreasonable state.Therefore, in this situation, assuming a distribution of anglesaround a mean (average) is considered, this distribution istypically the Gaussian distribution, although there is no physicaljustification for this.36 The other curves (Figure 6) representincreasing distribution widths, a=10°, 20°, 30°, etc. Thus, inconsidering the measured CH3 sym/asym ratio as 1.25, in thecase of ODT/Au, the data presented are consistent with tiltangles/distribution width pairs: (30°,a=0°),(27°,0=10°),(15°,a =20°), or, (0°,a=28). From the measurementprovided, exact tilt angle orientation and distribution widthvalues are not uniquely determined. One advantage of sumfrequency imaging is the ability to experimentally determinethe distribution and obtain a more accurate view of the surface.Another significant aspect demonstrated in Figure 6 is that, asthe distribution width becomes larger than o >40°(±20°), SFG has a limitation of not being able to determine the orientationangle at the surface since the data are more consistent with alarger range of orientations. As the surface becomes morerandom, SFG is less sensitive. This point is also demonstratedin Figure 7 (for the ODT/Au system), which has the plots ofthe square of the effective susceptibility for CH sym vs thedistribution width (deg). The SFG signal intensity is proportionalto x(2)|2, and the degree of orientation is related to thedistribution width, o. Therefore, Figure 7 is interpreted as SFGsignal intensity vs orientation. Again, as the distributionbroadens, the SFG signal is observed to drop dramatically. Thisis consistent with the description that SFG signal is ap-proximately zero in an isotropic medium. This result has important implications for the interpretationof the SFG signal from a spatially heterogeneous surface. Itsuggests that, in regions where molecules have a broaderdistribution, the contribution to the average SFG signal is muchless than in those regions where the distribution is narrow. Evena small change in the distribution substantially changes the SFGsignal intensity. However, SFG imaging allows the regions withless SFG signal to be regarded equally since each region ismeasured independently as discussed. That is, by obtaining theensemble average from the 1024 × 1024 pixel area for a totalof 2621 specific areas, these regions that have a lower signalare properly accounted for in the orientation analysis. Eventhough these regions have a lower SFG signal, these specificareas may actually have a larger coverage on the surface andmay be more important to the overall surface chemistry. Another related effect is demonstrated in Figures 7 and 8.Certain tilt angle orientations contribute to the SFG intensitymore than others. Each curve in Figure 7 is for a differentaverage tilt angle orientation, which shows that for a given othe SFG intensity as a function of the tilt angle varies in anonlinear way (see also Figure 8). In Figure 7, this plot showsthat tilt orientations near 50-60° contribute more (25×) to theSFG signal while those from 0° to 20° or from 80° to 90°contribute much less. This suggests that SFG analysis of theaverage favors those at 50-60°; thus, much of the SFGorientation analysis in the literature tends toward the magic anglevalue of 60°. Another perspective of this effect is shown in Figure 8, wherefor narrow distributions, <20°, the SFG signal is larger neartilt angles of 50-60°. This is similar to the magic angle resultsof SHG for molecules on a rough surface as presented bySimpson and Rowlen.37,38 The difference in SFG signal intensityis less if the distribution is broad, but then not much is knownabout the average orientation and range at this point. Again,SFG imaging and the subsequent analysis are able to deducethe distribution experimentally to provide the local structure anda more meaningful interpretation of the surface orientation. Conclusion SFG imaging allows the visualization of the surface structureand relates the local structure to the overall performance of thematerial. For example, it is known that the wetting properties,friction, and especially corrosion inhibition of SAMs areinfluenced by the degree of order in the film. These propertiesare usually measured over a size scale of millimeters. Therefore,the use of imaging spectroscopy to evaluate the quality andstructure of monolayer films is useful to understand local wettingand frictional properties or deviations from the average mea-surements. SFG imaging microscopy has been used to charac-terize a monolayer of ODT on Au and MS and has demonstratedthat the monolayer on the reactive metal surface (MS) is lesswell ordered compared to that on Au. Acknowledgment. We thank Research Corp., GEAR, andChampion Technologies (Houston, TX) for support of this work.Thanks are also due to John Glenn Ramon and Amy Hazelriggof the University of Houston for software development. References and Notes ( ( 1) Committee on Revealing Chemistry t hrough Advanced ChemicalImaging, N . R . C . V isualizing Chemistry : The Progress and P r omise ofAdvanced Chemical Imaging; N a tional Academies Press: W a shington, DC , 2006. ) (2) Kuhnke, K.; Hoffmann, D. M.; Wu, X. C.; Bittner, A. M.; Kern,K. Appl. Phys Lett. 2003, 83, 3830. (3) Zumbusch, A.; Holtom, G. R.; Xie, X. S. Phys. Rev. Lett. 1999,82,4142. ( ( 4) E iswirth , M.; E rtl, G. In Chemical W aves and Patterns; K a pral,R., Showalter, K., Eds. ; K l uwer Academic P ublishers: Boston, 1 995; p 447. ) (5) Engel, W.; Kordesch, M. E.; Rotermund, H. H.; Kubala, S.; vonOetzen, A. Ultramicroscopy 1991, 36, 148. (6) Jones,D. Principles and Prevention of Corrosion, 2nd ed.; PrenticeHall: Upper Saddle River, NJ, 1996. (7) Akhremitchev, B. B.; Pollack, S.; Walker, G. C. Langmuir 2001,17,2774. (8) Akhremitchev, B. B.; Sun, Y.; Stebounova, L.; Walker, G. C.Langmuir 2002, 18, 5325. (9) Lipkowski,J., Ross, P. N., Eds. Imaging of Surfaces and Intefaces;Wiley-VCH: New York, 1999. ( (10) C imatu, K. A.; B aldelli, S. J . Phys . Chem. B 2006, 110,1 8 07. ) (11) Hoffmann, D. M.; Kuhnke, K.; Kern, K. Rev. Sci. Instrum. 2002,73,3221. (12) Florsheimer, M.; Brillert, C.; Fuchs, H. Langmuir 1999, 15, 5437.(13) Florsheimer, M.; Brillert, C.; Fuchs, H. Mater. Sci. Eng., C 1999, 8-9,335. (14) Guyot-Sionnest, P.; Tadjeddine, A. Chem. Phys. Lett. 1990, 172,341. (15) Bain, C. D. J. Chem.Soc., Faraday Trans. 1995, 91,1281. (16) Bain, C. D.; Davies, P. B.; Ong, T. H.; Ward, R. N. Langmuir1991,7,1563. (17) Duffy, D. C.; Davies, P. B.; Creeth, A. M. Langmuir 1995,11,2931. (18) Ward, R.; Duffy, D. C.; Davies, P. B. J. Phys. Chem. 1994, 98,8536. (19) Ward, R. N.; Davies, P. B.; Bain, C. D. J. Phys. Chem. 1993, 97,7141. (20) Florsheimer, M.; Bosch, M.; Brillert, C.; Wierschem, M.; Fuchs,H. J. Vac. Sci. Technol.,B 1997, 15, 1564. (21) Zhang, H. P.; Romero, C. R.; Baldelli, S. J. Phys. Chem. B 2005,109,15520. (22) Cimatu, K. A.; Baldelli, S. J. Am. Chem. Soc. 2006,128,16016. (23) Snyder, R. G. J. Chem. Phys. 1965, 42, 1744. (24) Snyder, R. G.; Strauss, H. L.; Elliger, C. A. J. Phys. Chem. 1982,86,5145. (25) MacPhail, R. A.; Strauss, H. L.; Snyder, R. G.; Elliger, C. A. J.Phys. Chem. 1984, 88, 334. (26) Potterton, E. A.; Bain, C. D. J. Electroanal. Chem. 1996, 409,109. (27) Love,J. C.; Estroff, L. A.; Kriebel,J. K.;Nuzzo,R. G.; Whitesides,G. M. Chem. Rev.2005,105,1103. (28) Lu, R.; Gan, W.; Wu, B. H.; Zhang, Z.;Guo, Y.; Wang, H. F. J.Phys. Chem. B 2005, 109, 14118. (29) Wang, H. F.; Gan, W.; Lu, R.; Rao, Y.; Wu, B. H. Int. Rev. Phys.Chem. 2005, 24,191. (30) Huang,J. Y.; Shen, Y. R. In Laser Spectroscopy and Photochem-istry on Metal Surfaces; Dai, H. L., Ho, W., Eds.; World Scientific:Singapore, 1995. (31) Hirose, C.; Yamamoto, H.; Akamatsu, N.; Domen, K. J. Phys.Chem. 1993.97.10064. (32) Hirose, C.; Akamatsu, N.; Domen, K. J. Chem. Phys. 1992, 96,997. (33) Ward, R. N.; Davies, P. B.; Bain, C. D. J. Phys. Chem. B 1997,101,1594. (34) Miranda, P. B.; Shen, Y. R. J. Phys. Chem. B 1999, 103, 3292.(35) Hunt, J. H.; Guyot-Sionnest, P.; Shen, Y. R. Chem. Phys. Lett. 1987,133,189. (36) Wang, J.; Paszti, Z.; Even, M. A.; Chen, Z. J. Am. Chem. Soc.2002,124,7016. (37) Simpson, G. J.; Rowlen, K. L. J. Am. Chem. Soc. 1999,121, 2635. (38) Simpson, G. J.; Rowlen, K. L. J. Phys. Chem. B 1999, 103,1525.
确定


还剩5页未读,是否继续阅读?

产品配置单

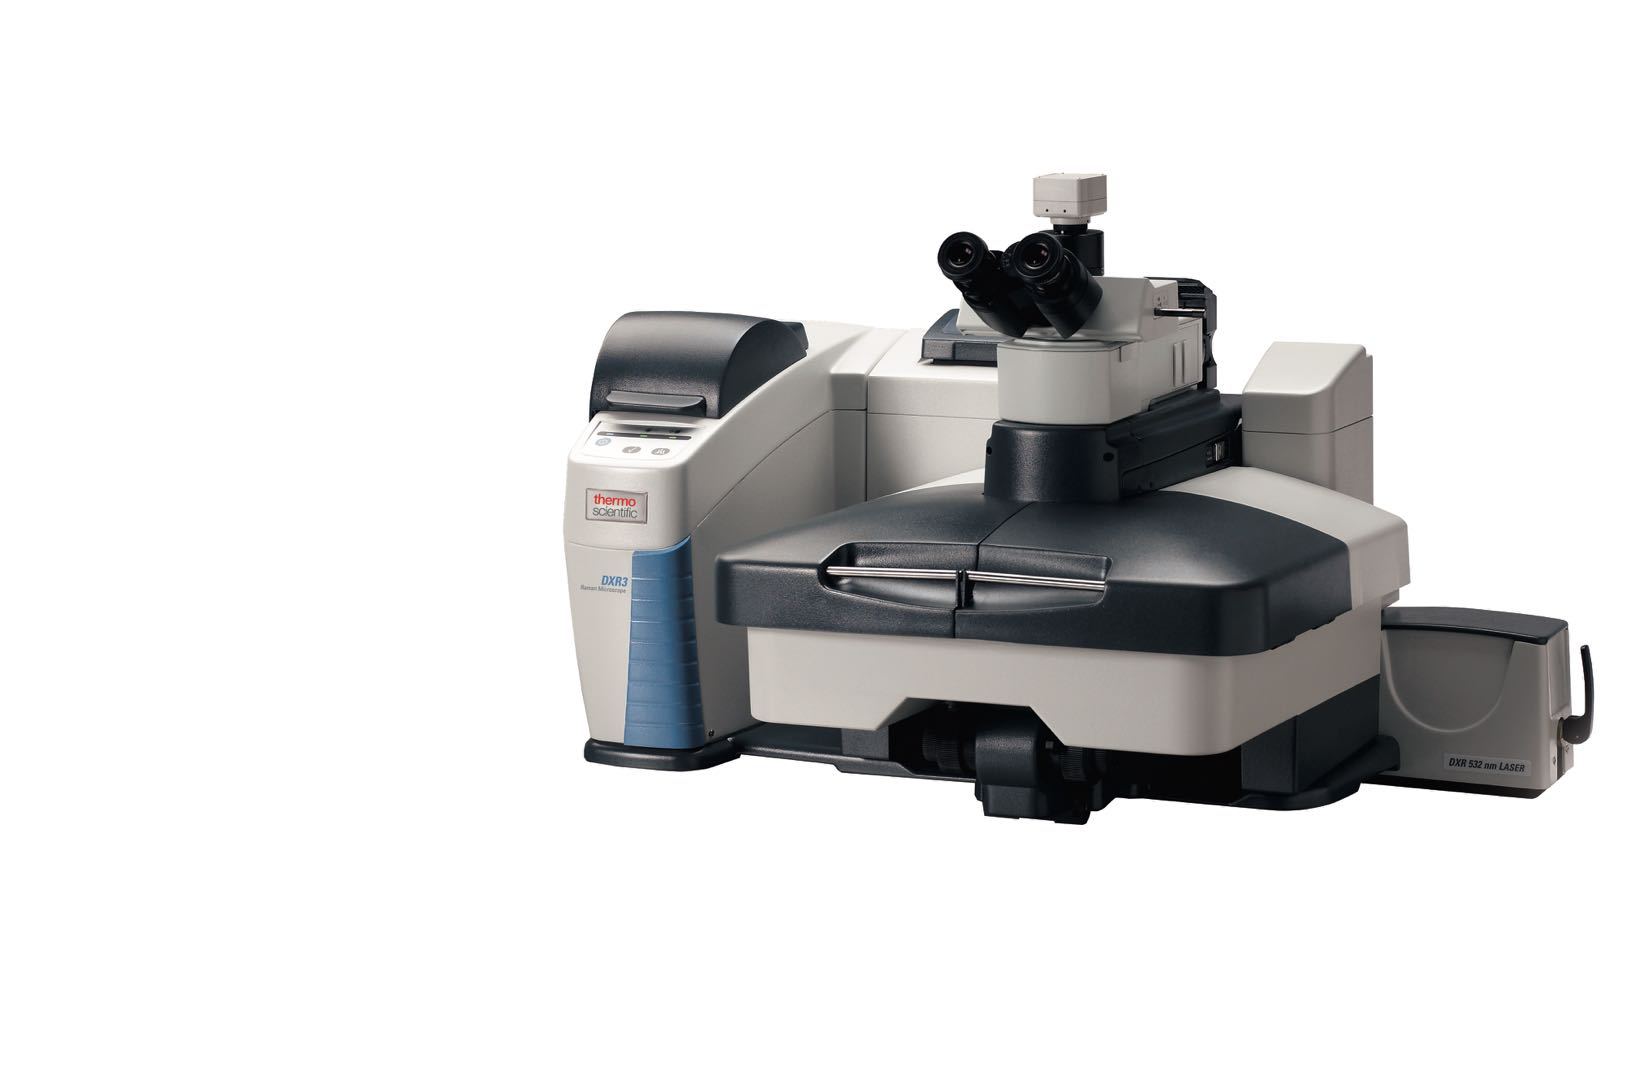
北京欧兰科技发展有限公司为您提供《低碳钢表面,硫醇,自组装,单层膜中显微成像,自组装,单层膜的空间分辨,表面分析检测方案(其它光谱仪)》,该方案主要用于合金中显微成像,自组装,单层膜的空间分辨,表面分析检测,参考标准--,《低碳钢表面,硫醇,自组装,单层膜中显微成像,自组装,单层膜的空间分辨,表面分析检测方案(其它光谱仪)》用到的仪器有Ekspla SFG 表面和频光谱分析系统、Ekspla PL2230型高能量皮秒激光器、Ekspla CARS 相干反斯托克斯拉曼显微光谱仪
推荐专场


相关方案
更多
该厂商其他方案
更多