


方案详情
文
Nitric oxide laser-induced-fluorescence (NO-LIF) 2-D imaging measurements using a new multi-spectral
detection strategy are reported for high-pressure flames (1–60 bar). This work builds on previous
research that identified interference LIF from O2 and CO2 in high-pressure flames and optimized the choice
of excitation strategies as a function of application conditions. In this study, design rules are presented to
optimize the LIF detection wavelengths for quantitative 2-D NO-LIF measurements over a wide range of
pressures (1–60 bar) and temperatures. Simultaneous detection of LIF in multiple wavelength regions
enables correction of the NO signal for interference from O2 and CO2 and allows simultaneous imaging
of all three species. New experiments of wavelength-resolved 1-D LIF in slightly lean (/ = 0.9) and slightly
rich (/ = 1.1) methane/air flames are used to evaluate the design rules and estimate the NO detection limits
for a wide range of flame conditions. The quantitative 2-D measurements of NO in the burnt gas are compared
with model calculations (using GRI-Mech 3.0) versus pressure for slightly lean and slightly rich
flames. The discussions and demonstrations reported in this study provide a practical guideline for application
of instantaneous 1-D or 2-D NO-LIF imaging strategies in high-pressure combustion systems.
方案详情

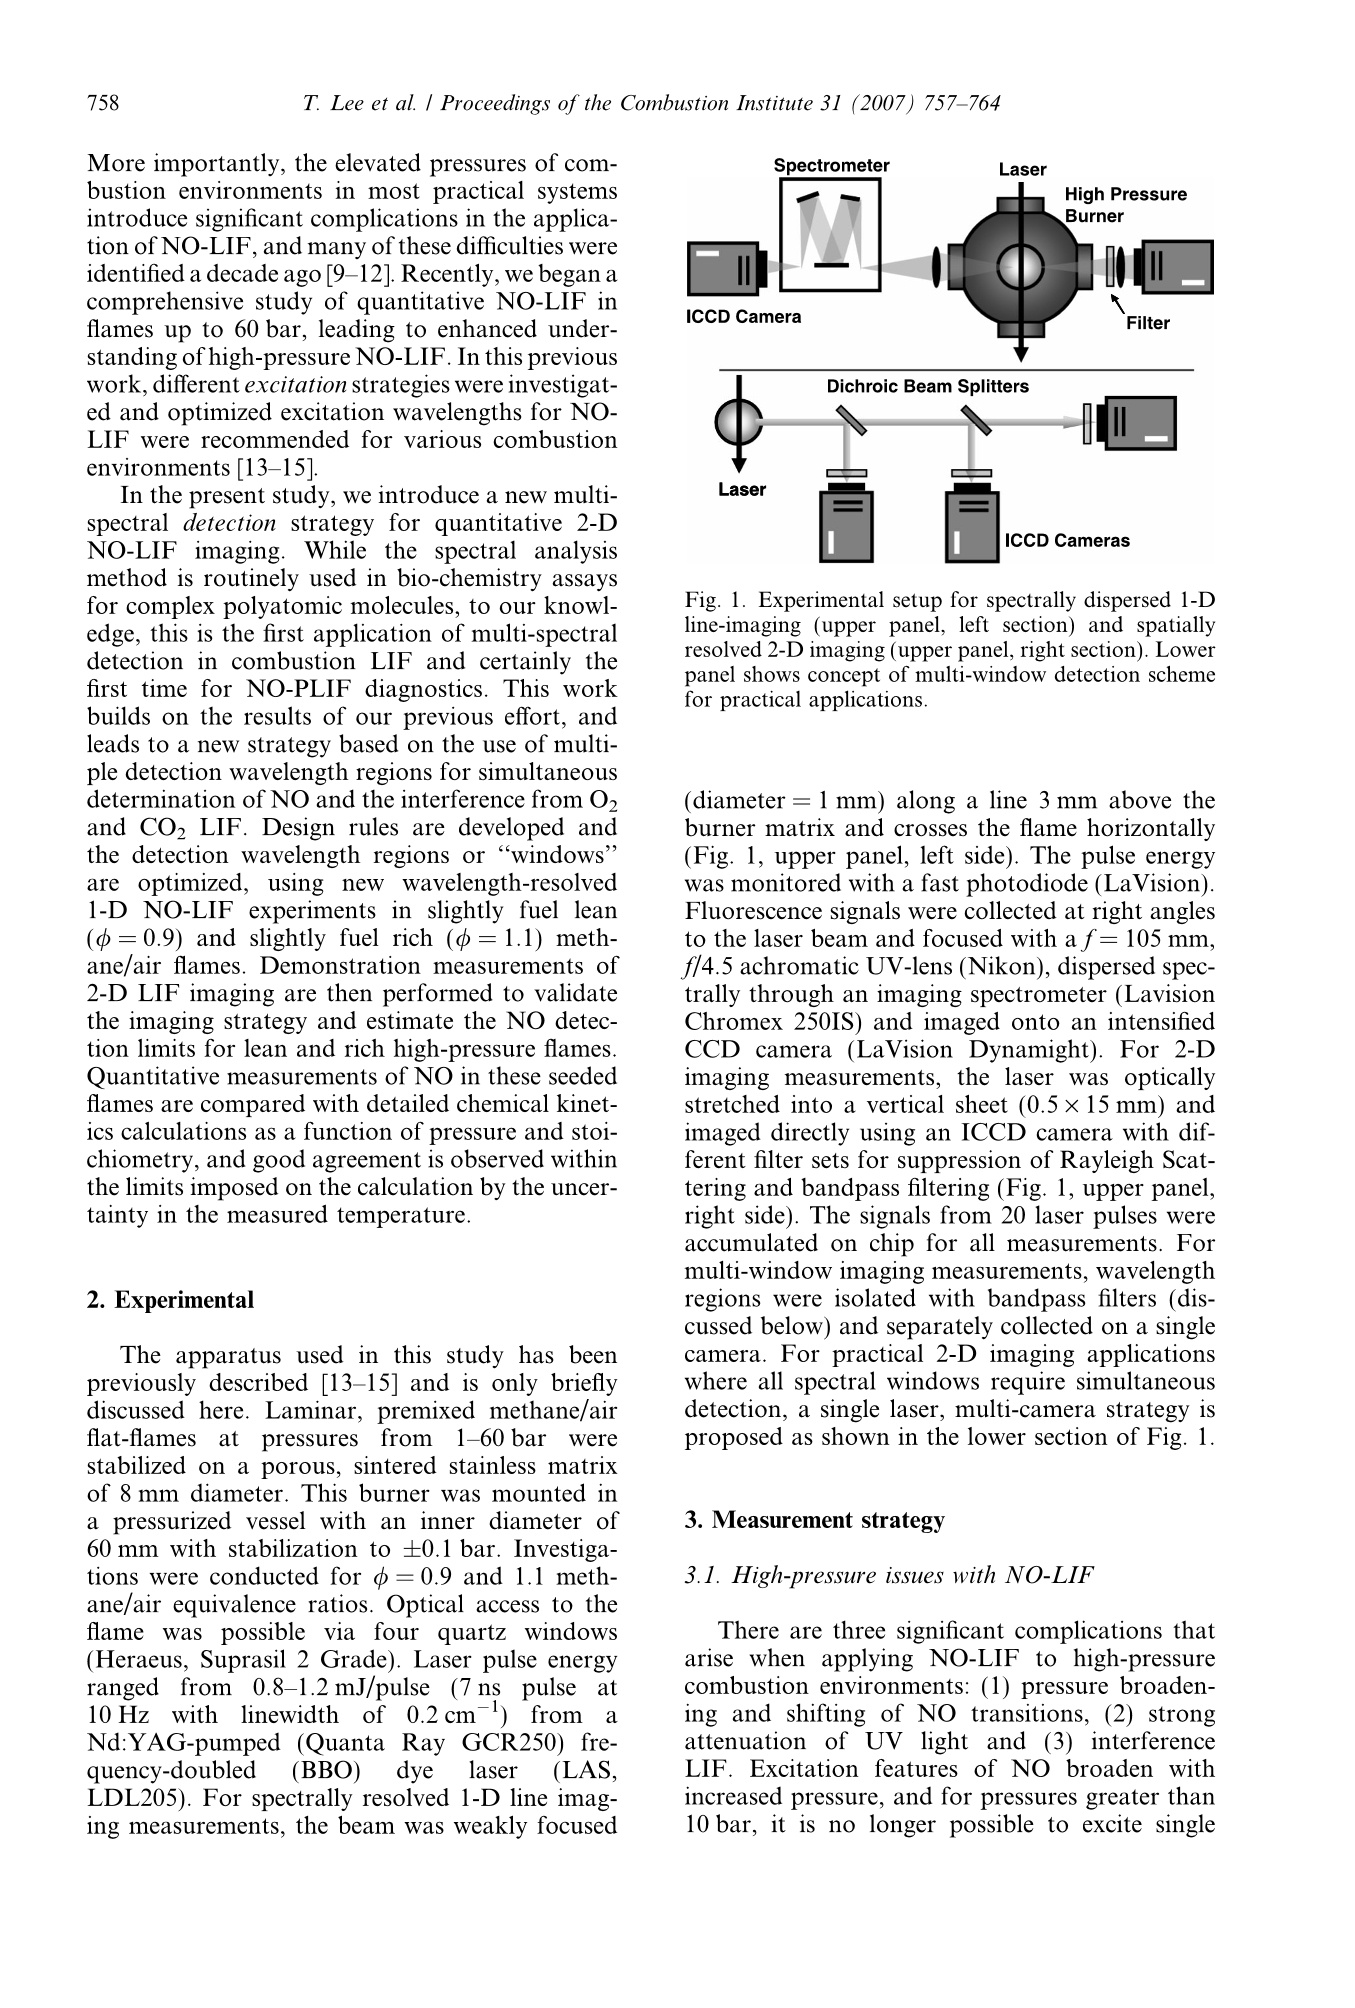
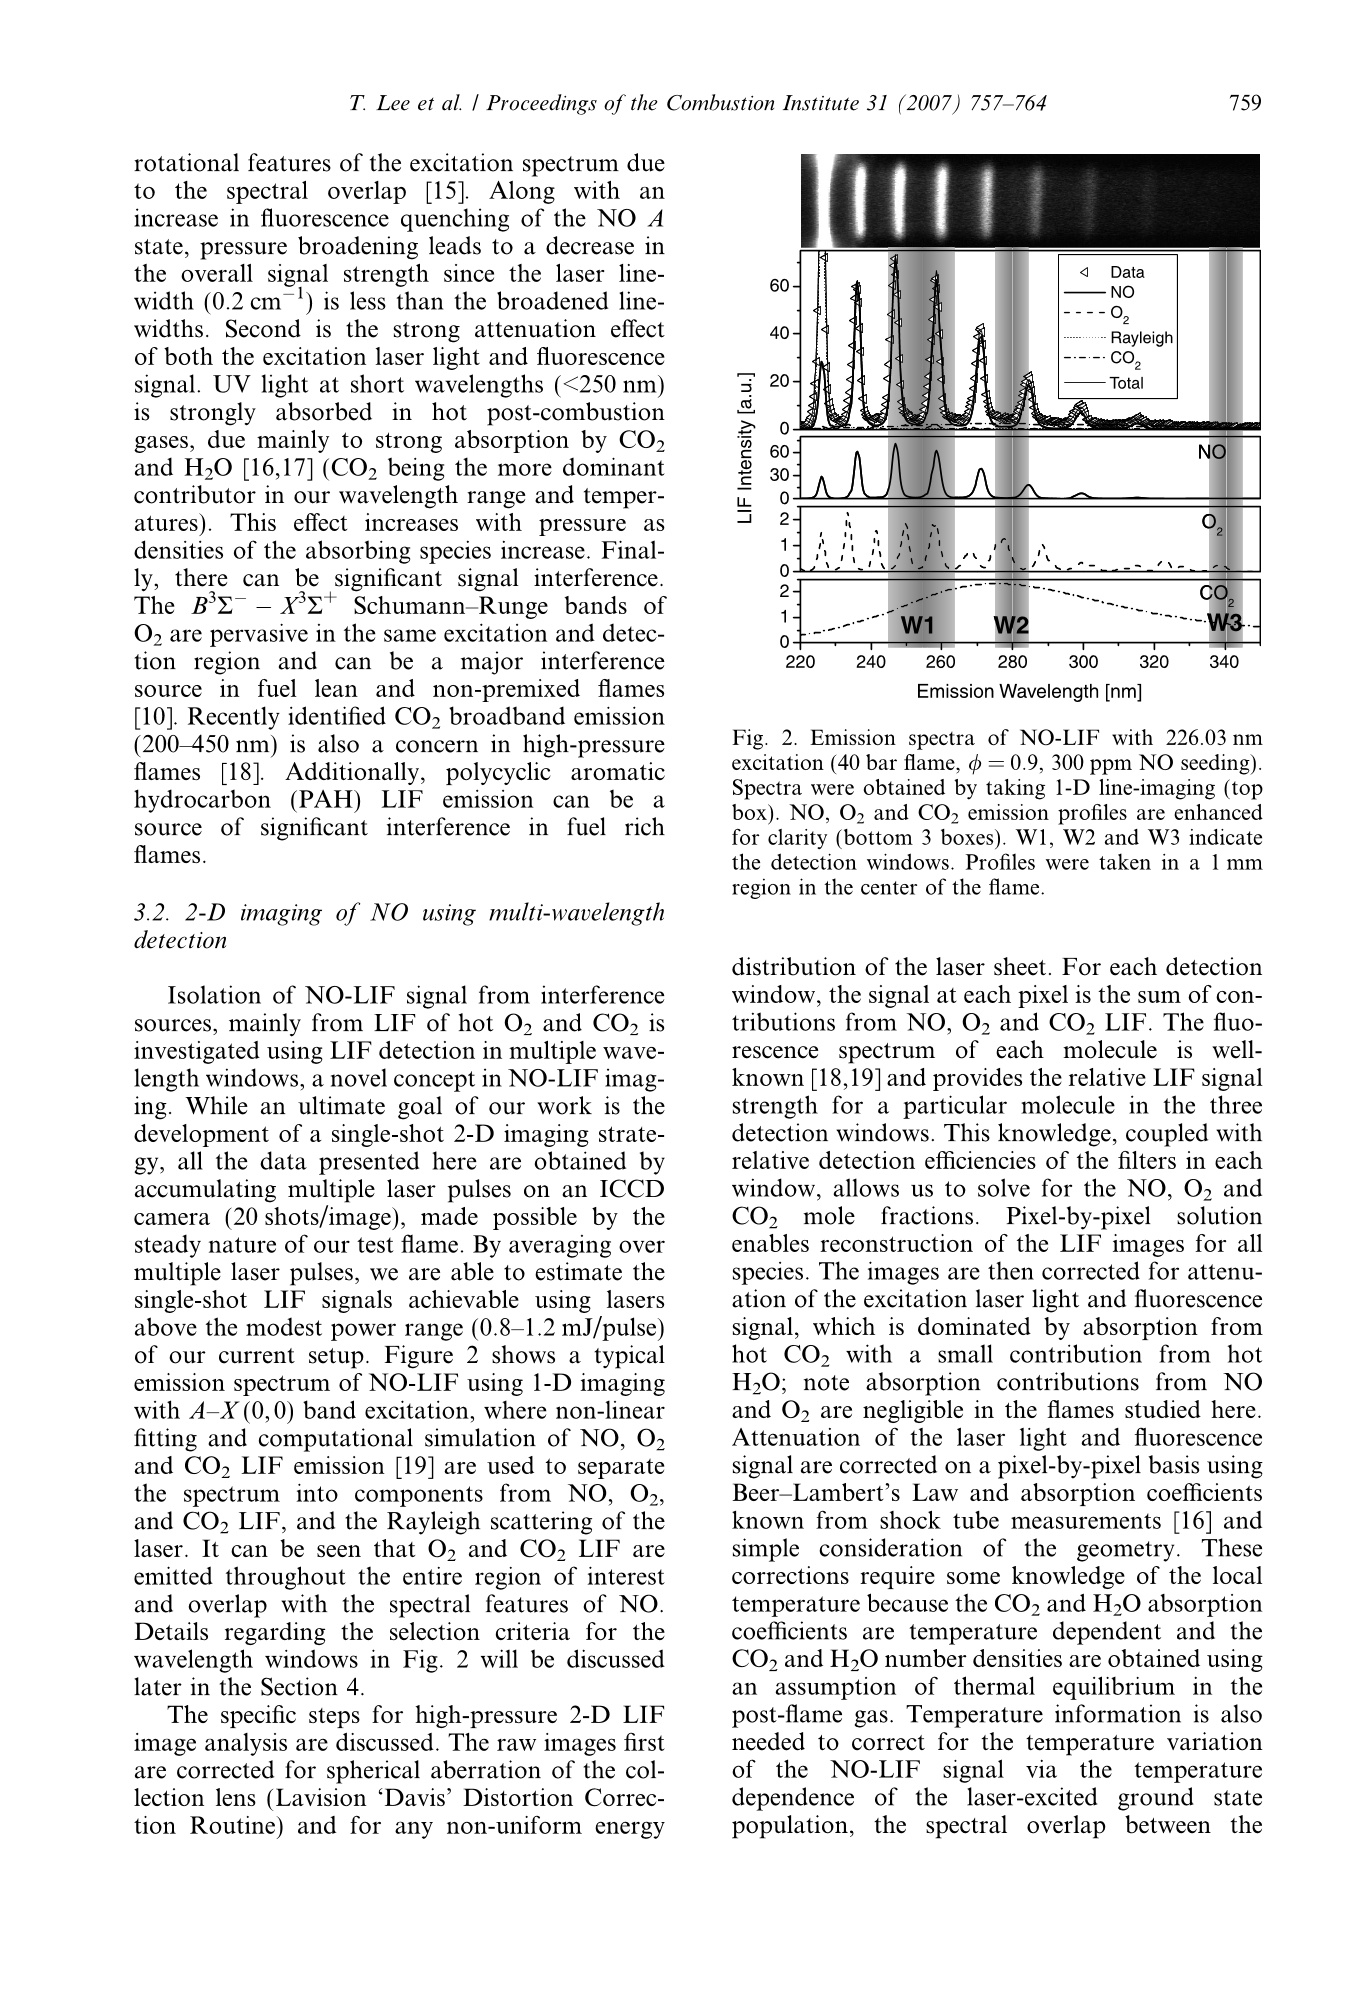
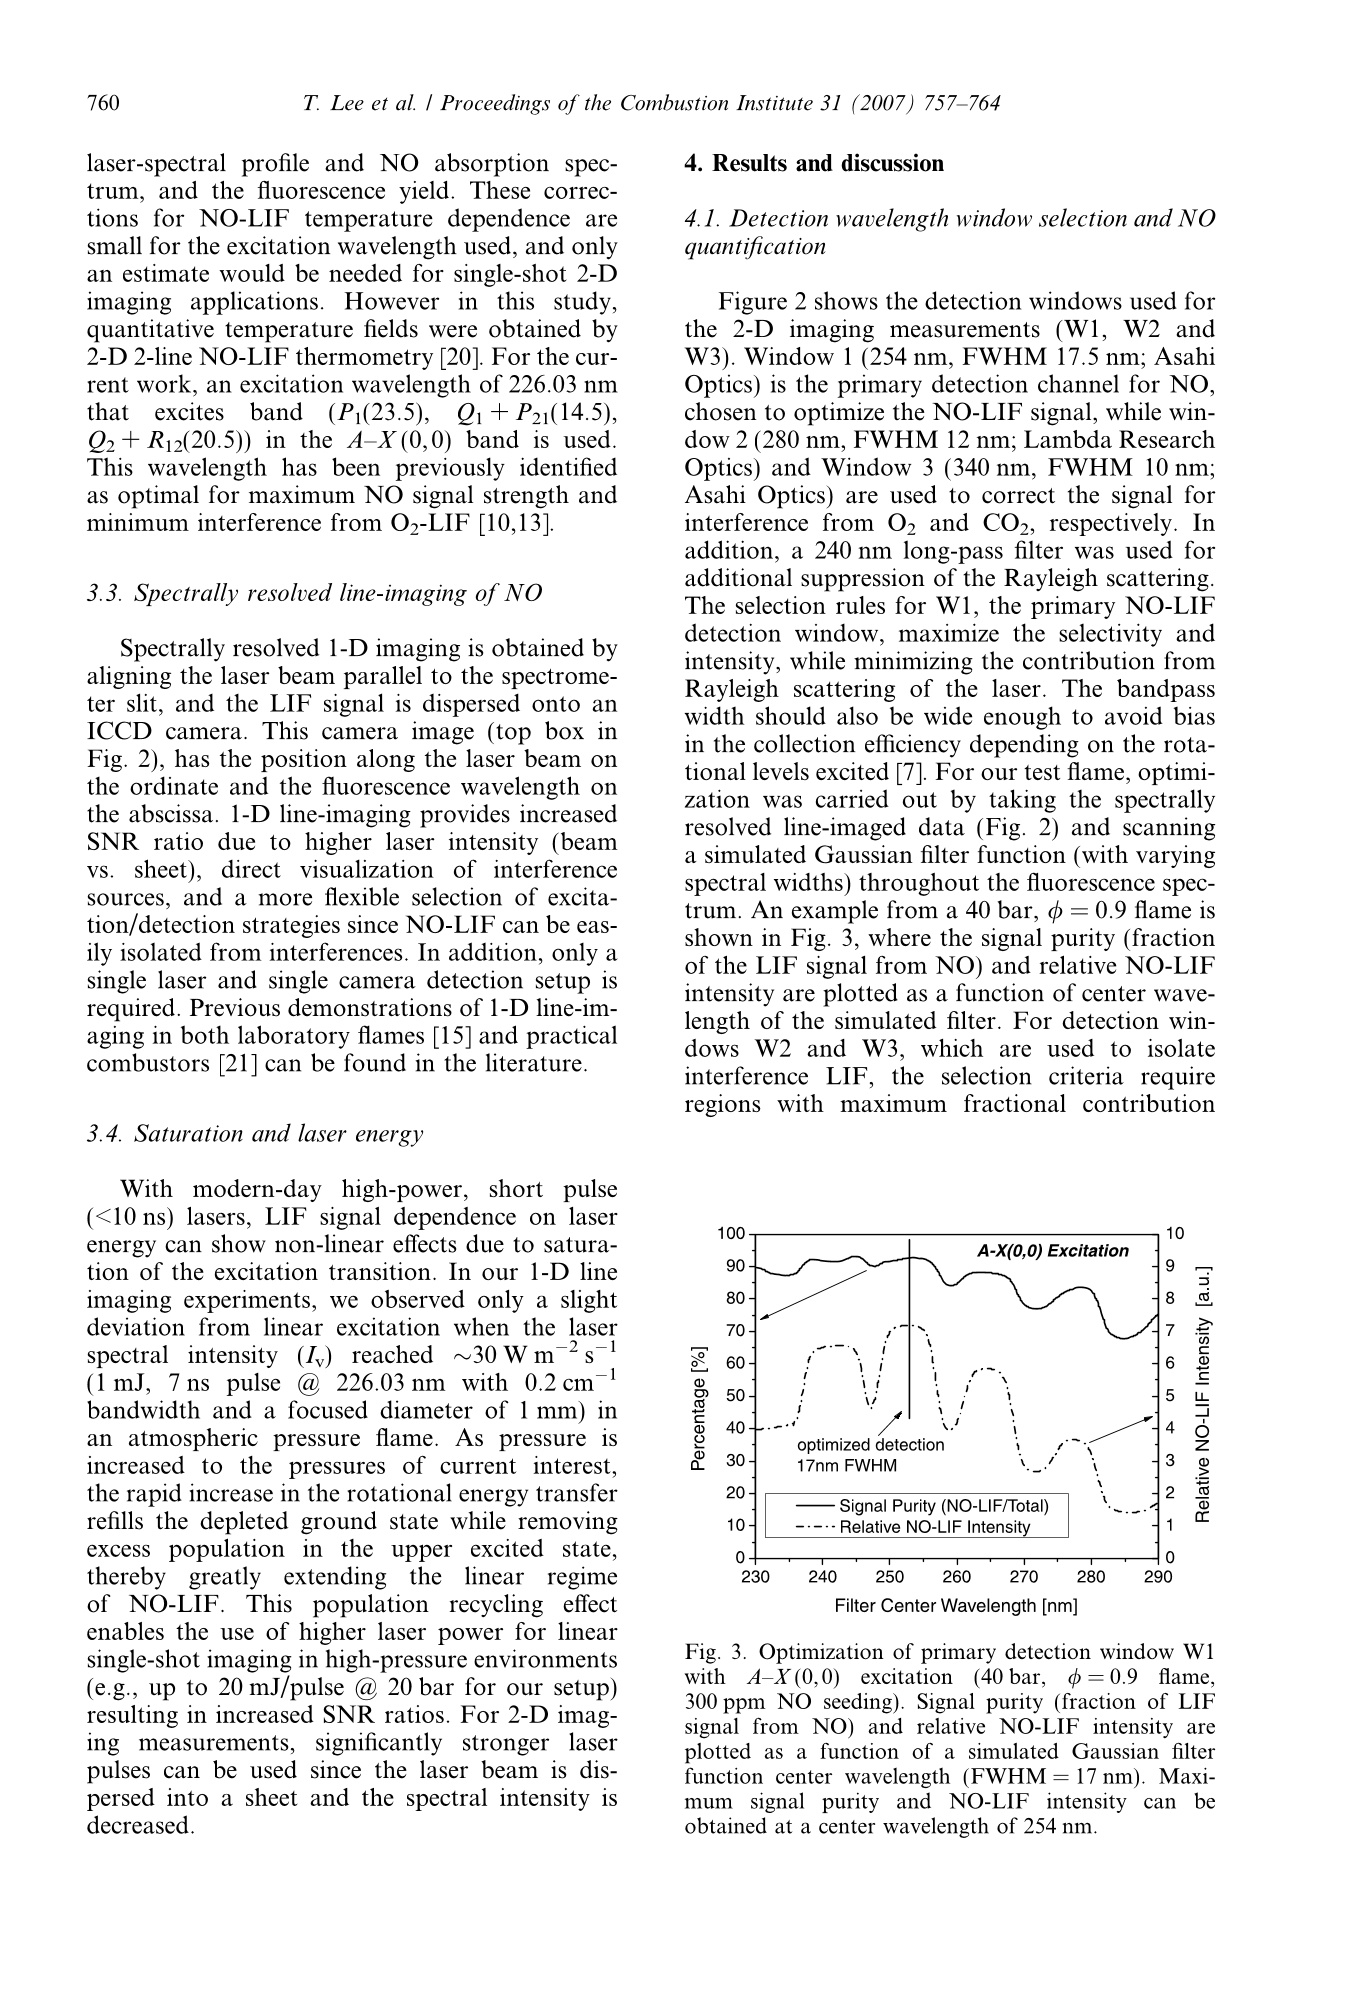
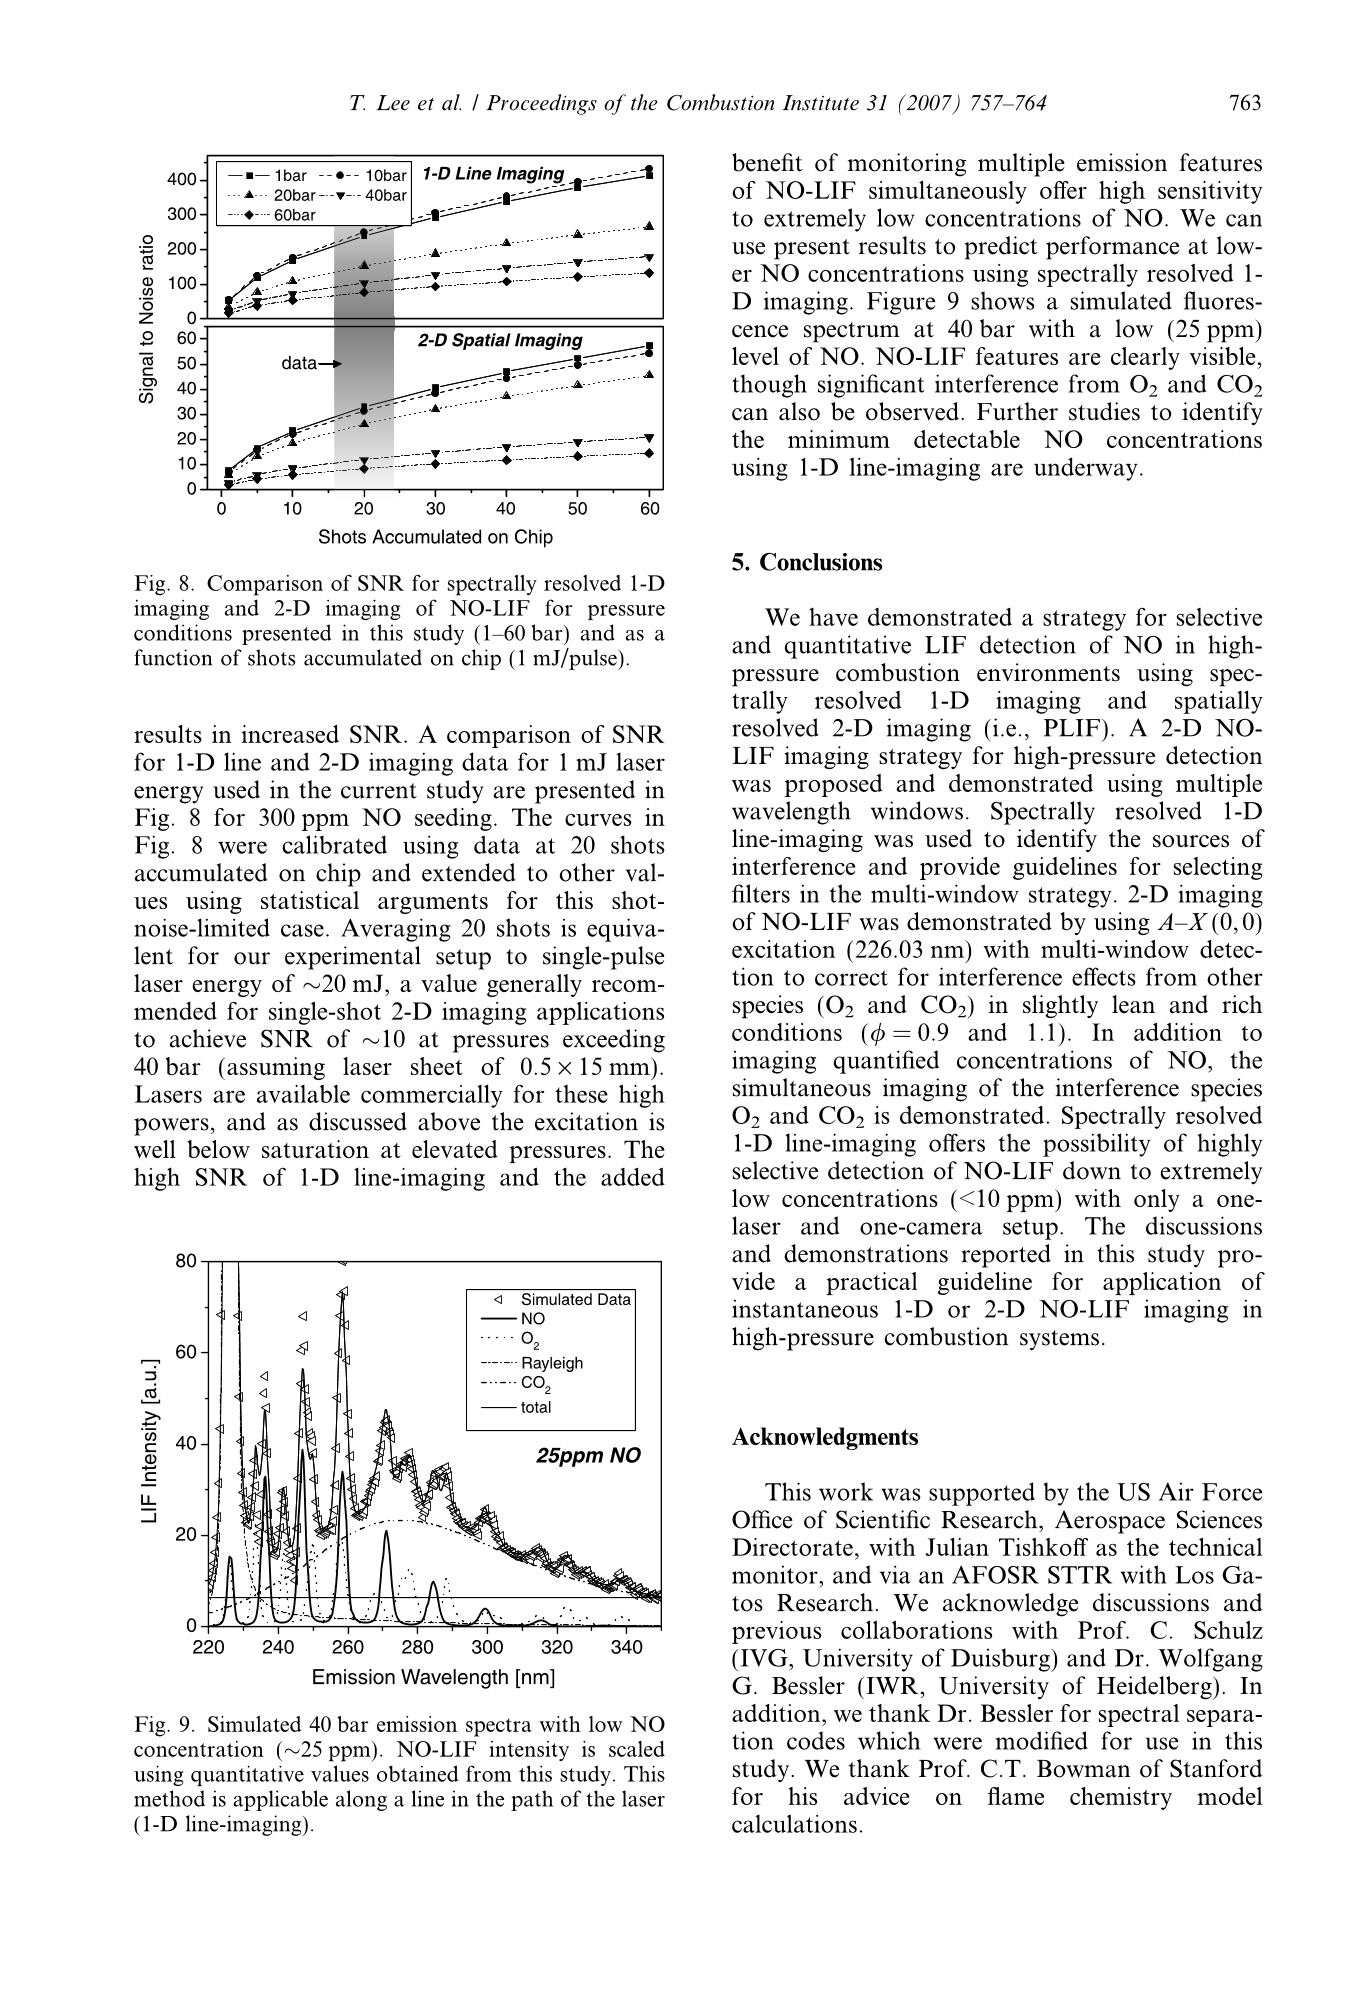
Available online at www.sciencedirect.comScienceDirectProceedings of the Combustion Institute 31 (2007) 757-764 758T. Lee et al. / Proceedings of the Combustion Institute 31 (2007)757-764 Proceedings of theCombustionInstitute www.elsevier.com/locate/proci Experimental evaluation of strategies for quantitativelaser-induced-fluorescence imaging of nitric oxidein high-pressure flames (1-60 bar) Tonghun Lee *, Jay B. Jeffries, Ronald K. Hanson Mechanical Engineering Department, Stanford University, Stanford, CA 94305, USA Abstract Nitric oxide laser-induced-fluorescence (NO-LIF) 2-D imaging measurements using a new multi-spec-tral detection strategy are reported for high-pressure flames (1-60 bar). This work builds on previousresearch that identified interference LIF from O2 and CO2 in high-pressure flames and optimized the choiceof excitation strategies as a function of application conditions. In this study, design rules are presented tooptimize the LIF detection wavelengths for quantitative 2-D NO-LIF measurements over a wide range ofpressures (1-60 bar) and temperatures. Simultaneous detection of LIF in multiple wavelength regionsenables correction of the NO signal for interference from O2 and CO2 and allows simultaneous imagingof all three species. New experiments of wavelength-resolved 1-D LIF in slightly lean (中=0.9) and slightlyrich (=1.1) methane/air flames are used to evaluate the design rules and estimate the NO detection limitsfor a wide range of flame conditions. The quantitative 2-D measurements of NO in the burnt gas are com-pared with model calculations (using GRI-Mech 3.0) versus pressure for slightly lean and slightly richilames. The discussions and demonstrations reported in this study provide a practical guideline for appli-cation of instantaneous 1-D or 2-D NO-LIF imaging strategies in high-pressure combustion systems.@ 2006 The Combustion Institute. Published by Elsevier Inc. All rights reserved. Keywords: Nitric oxide; Laser-induced fluorescence; NO reburn; Combustion diagnostics ( 1540-7489/$ - see front matter @ 2006 T h e Combustion Institute. Pu b lished by Elsevier Inc. All rights r e served.doi:10.1016/j.proci.2006.07.090 ) More importantly, the elevated pressures of com-bustion environments in most practical systemsintroduce significant complications in the applica-tion of NO-LIF, and many of these difficulties wereidentified a decade ago [9-12]. Recently, we began acomprehensive study of quantitative NO-LIF inflames up to 60 bar, leading to enhanced under-standing of high-pressure NO-LIF. In this previouswork, different excitation strategies were investigat-ed and optimized excitation wavelengths for NO-LIF were recommended for various combustionenvironments [13-15]. In the present study, we introduce a new multi-spectral detection strategy for quantitative 2-DNO-LIF imaging. While the spectral analysismethod is routinely used in bio-chemistry assaysfor complex polyatomic molecules, to our knowl-edge, this is the first application of multi-spectraldetection in combustion LIF and certainly thefirst time for NO-PLIF diagnostics. This workbuilds on the results of our previous effort, andleads to a new strategy based on the use of multi-ple detection wavelength regions for simultaneousdetermination of NO and the interference from O,and CO2 LIF. Design rules are developed andthe detection wavelength regions or “windows”are optimized, using new wavelength-resolved1-D NO-LIF experiments in slightly fuel lean(中=0.9) and slightly fuel rich (夕=1.1) meth-ane/air flames. Demonstration measurements of2-D LIF imaging are then performed to validatethe imaging strategy and estimate the NO detec-tion limits for lean and rich high-pressure flames.Ouantitative measurements of NO in these seededflames are compared with detailed chemical kinet-ics calculations as a function of pressure and stoi-chiometry, and good agreement is observed withinthe limits imposed on the calculation by the uncer-tainty in the measured temperature. 2. Experimental The apparatus used in this study has beenpreviously described [13-15] and is only brieflydiscussed here. Laminar, premixed methane/airflat-flamesat.tpressuresfrom1-60 barwerestabilized on a porous, sintered stainless matrixof 8 mm diameter. This burner was mounted ina pressurized vessel with an inner diameter of60 mm with stabilization to ±0.1 bar. Investiga-tions were conducted for 夕=0.9 and 1.1 meth-ane/air equivalence ratios.Optical access to theflame was possible via four quartz windows(Heraeus, Suprasil 2 Grade). Laser pulse energyrangedfrom0.8-1.2 mJ/pulse (7 nspulse試10 Hz withlinewidthof 0.2 cm fromaNd:YAG-pumped (Quanta Ray GCR250) fre-quency-doubled(BBO) dye laser (LAS,LDL205). For spectrally resolved 1-D line imag-ing measurements, the beam was weakly focused Fig. 1. Experimental setup for spectrally dispersed 1-Dline-imaging (upper panel, left section) and spatiallyresolved 2-D imaging (upper panel, right section). Lowerpanel shows concept of multi-window detection schemefor practical applications. (diameter =1 mm) along a line 3 mm above theburner matrix and crosses the flame horizontally(Fig.1, upper panel, left side). The pulse energywas monitored with a fast photodiode (LaVision).Fluorescence signals were collected at right anglesto the laser beam and focused with a f=105 mm,f/4.5 achromatic UV-lens (Nikon), dispersed spec-trally through an imaging spectrometer (LavisionChromex 250IS) and imaged onto an intensifiedCCD camera (LaVision Dynamight). For 2-Dimaging measurements, the laser was opticallystretched into a vertical sheet (0.5×15mm) andimaged directly using an ICCD camera with dif-ferent filter sets for suppression of Rayleigh Scat-tering and bandpass filtering (Fig. 1, upper panel,right side). The signals from 20 laser pulses wereaccumulated on chip for all measurements. Formulti-window imaging measurements, wavelengthregions were isolated with bandpass filters (dis-cussed below) and separately collected on a singlecamera. For practical 2-D imaging applicationswhere all spectral windows require simultaneousdetection, a single laser, multi-camera strategy isproposed as shown in the lower section of Fig. 1. 3. Measurement strategy 3.1. High-pressure issues with NO-LIF There are three significant complications thatarise when applying NO-LIF to high-pressurecombustion environments: (1) pressure broaden-ing and shifting of NO transitions, (2) strongattenuation of UV light and (3) interferenceLIF. Excitation features of NO broaden withincreased pressure, and for pressures greater than10 bar, it is no longer possible to excite single rotational features of the excitation spectrum dueto the spectral overlap [15]. Along withanincrease in fluorescence quenching of the NOstate, pressure broadening leads to a decrease inthe overall signal strength since the laser line-width (0.2 cm-l) is less than the broadened line-widths. Second is the strong attenuation effectof both the excitation laser light and fluorescencesignal. UV light at short wavelengths (<250 nm)isstrongly absorbed inhot post-combustiongases, due mainly to strong absorption by CO2and H2O [16,17] (CO2 being the more dominantcontributor in our wavelength range and temper-atures). This effect increases with pressure asdensities of the absorbing species increase. Final-ly, there can be significant signal interference.The B’2--X2+Schumann-Runge bands ofO2 are pervasive in the same excitation and detec-tion region and can be a major interferencesource in fuel lean and non-premixed flames[10]. Recently identified CO2 broadband emission(200-450 nm) is also a concern in high-pressureflames 「[18]. Additionally, polycyclic aromatichydrocarbon (PAH)) LIF emission can be asource of significant interference in fuel richflames. 3.2. 2-D imaging of NO using multi-wavelengthdetection Isolation of NO-LIF signal from interferencesources, mainly from LIF of hot O2 and CO isinvestigated using LIF detection in multiple wave-length windows, a novel concept in NO-LIF imag-ing. While an ultimate goal of our work is thedevelopment of a single-shot 2-D imaging strate-gy, all the data presented here are obtained byaccumulating multiple laser pulses on an ICCDcamera (20 shots/image), made possible by thesteady nature of our test flame. By averaging overmultiple laser pulses, we are able to estimate thesingle-shot LIF signals achievable using lasersabove the modest power range (0.8-1.2 mJ/pulse)of our current setup. Figure 2 shows a typicalemission spectrum of NO-LIF using1-D imagingwith A-X(0,0) band excitation, where non-linearfitting and computational simulation of NO, O2and CO2 LIF emission [19] are used to separatethe spectrum into components from NO, 02,and CO2 LIF, and the Rayleigh scattering of thelaser. It can be seen that O2 and CO, LIF areemitted throughout the entire region of interestand overlap with the spectral features of NO.Details regarding the selection criteria for thewavelength windows in Fig. 2 will be discussedlater in the Section 4. The specific steps for high-pressure 2-D LIFimage analysis are discussed. The raw images firstare corrected for spherical aberration of the col-lection lens (Lavision ‘Davis’Distortion Correc-tion Routine) and for any non-uniform energy Fig. 2. Emission spectra of NO-LIF with 226.03 nmexcitation (40 bar flame,中=0.9, 300 ppm NO seeding).Spectra were obtained by taking 1-D line-imaging (topbox). NO, O2 and CO2 emission profiles are enhancedfor clarity (bottom 3 boxes). W1, W2 and W3 indicatethe detection windows. Profiles were taken in a 1mmregion in the center of the flame. distribution of the laser sheet. For each detectionwindow, the signal at each pixel is the sum ofcon-tributions from NO, O2 and CO2 LIF. The fluo-rescence spectrum of each molecule is well-known [18,19] and provides the relative LIF signalstrength for a particular molecule in the threedetection windows. This knowledge, coupled withrelative detection efficiencies of the filters in eachwindow, allows us to solve for the NO, O2 andCO2 mole :fractions.Pixel-by-pixelsolutionenables reconstruction of the LIF images for allspecies. The images are then corrected for attenu-ation of the excitation laser light and fluorescencesignal, which is dominated by absorption fromdolhot CO2 with a small contribution from hotH2O; note absorption contributions from NOand O2 are negligible in the flames studied here.Attenuation of the laser light and fluorescencesignal are corrected on a pixel-by-pixel basis usingBeer-Lambert’s Law and absorption coefficientsknown from shock tube measurements [16] andsimple consideration of the geometry. Thesecorrections require some knowledge of the localtemperature because the CO2 and H2O absorptioncoefficients are temperature dependent and theCO2and H2O number densities are obtained usinganassumption of thermal equilibrium in thepost-flame gas. Temperature information is alsoneeded to correct for the temperature variationof the NO-LIF signalviaatthe1temperaturedependence of the laser-excitedl groundstatepopulation,tthe spectral overlap betweenthe laser-spectral profile and NO absorption spec-trum, and the fluorescence yield. These correc-tions for NO-LIF temperature dependence aresmall for the excitation wavelength used, and onlyan estimate would be needed for single-shot 2-Dimaging applications. However in this study,quantitative temperature fields were obtained by2-D 2-line NO-LIF thermometry [20]. For the cur-rent work, an excitation wavelength of 226.03 nmthat excitestbandd(Pi(23.5), gi+P21(14.5),Q2+R12(20.5)) in the A-X(0,0) band is used.This wavelength has been previously identifiedas optimal for maximum NO signal strength andminimum interference from O2-LIF [10,13]. 3.3. Spectrally resolved line-imaging ofNO Spectrally resolved 1-D imaging is obtained byaligning the laser beam parallel to the spectrome-ter slit, and the LIF signal is dispersed onto anICCD camera. This camera image (top box inFig. 2), has the position along the laser beam onthe ordinate and the fluorescence wavelength onthe abscissa. 1-D line-imaging provides increasedSNR ratio due to higher laser intensity (beamVS.sheet), direct visualization of interferencesources, and a more flexible selection of excita-tion/detection strategies since NO-LIF can be eas-ily isolated from interferences. In addition, only asingle laser and single camera detection setup isrequired. Previous demonstrations of 1-Dline-im-aging in both laboratory flames [15] and practicalcombustors [21] can be found in the literature. 3.4. Saturation and laser energy With1modern-day high-power, short pulse(<10 ns) lasers, LIF signal dependence on laserenergy can show non-linear effects due to satura-tion of the excitation transition. In our 1-D lineimaging experiments, we observed only a slightdeviation from linear excitation when the laserspectral intensity (I) reached ~30 W m-2s-l(1 mJ, 7ns pulse @ 226.03 nm with 0.2 cmbandwidth and a focused diameter of 1 mm) inan atmospheric pressure flame. As pressure isincreased to the pressures of current interest,the rapid increase in the rotational energy transferrefills the depleted ground state while removingexcess population in the upper excited state,thereby greatly extending the linear regimeof NO-LIF. This population recycling effectenables the use of higher laser power for linearsingle-shot imaging in high-pressure environments(e.g., up to 20 mJ/pulse @ 20 bar for our setup)resulting in increased SNR ratios. For 2-D imag-ing measurements, significantly stronger laserpulses can be used since the laser beam is dis-persed into a sheet and the spectral intensity isdecreased. 4.1. Detection wauelength window selection and NOquantification Figure 2 shows the detection windows used forthe 2-D imaging measurements (W1, W2 andW3). Window 1 (254 nm, FWHM 17.5 nm; AsahiOptics) is the primary detection channel for NO,chosen to optimize the NO-LIF signal, while win-dow 2 (280 nm, FWHM 12nm; Lambda ResearchOptics) and Window 3 (340 nm, FWHM 10 nm;Asahi Optics) are used to correct the signal forinterference from O2 and CO2, respectively. Inaddition, a 240 nm long-pass filter was used foradditional suppression of the Rayleigh scattering.The selection rules for W1, the primary NO-LIFdetection window, maximize the selectivity andintensity, while minimizing the contribution fromRayleigh scattering of the laser. The bandpasswidth should also be wide enough to avoid biasin the collection efficiency depending on the rota-tional levels excited [7]. For our test flame, optimi-zation was carried out by taking the spectrallyresolved line-imaged data (Fig. 2) and scanninga simulated Gaussian filter function (with varyingspectral widths) throughout the fluorescence spec-trum. An example from a 40 bar, 中=0.9 flame isshown in Fig.3, where the signal purity (fractionof the LIF signal from NO) and relative NO-LIFintensity are plotted as a function of center wave-length of the simulated filter. For detection win-dows W2 and W3, which are used to isolateinterference LIF, the selection criteria requireregions with maximum: fractional contribution Fig. 3. Optimization of primary detection window Wiwith A-X(0,0) excitation (40 bar, +=0.9fflame.300 ppm NO seeding). Signal purity (fraction of LIFsignal from NO) and relative NO-LIF intensity areplotted as a function of a simulated Gaussian filterfunction center wavelength (FWHM=17 nm). Maxi-mum signal purity and NO-LIF intensity canbeobtained at a center wavelength of 254 nm. from the specific interference species for increasedaccuracy in the correction. While the 2-D imaging measurements reportedin this paper primarily use the A-X(0,0) transi-tion at 226.03 nm, optimization of the primaryNO detection window Wi was also carried outfor excitation using the A-X(0,1) and (0,2) tran-sitions (235.873 and 247.941 nm), and the resultsare given in Table 1. Note that excitation usingA-X(0,1) and (0,2) transitions offer the possibili-ty of selecting W1 blue-shifted of the laser toavoid interference signals that occur at predomi-nantly longer wavelengths. The same values forthe detection windows W2 and W3 are recom-mended for all excitation strategies, as these win-dows are used to isolate O2 and CO2, respectively. Selection of the optimum number of detectionwavelength windows requires knowledge regard-ing the global chemistry of the combustionprocess involved. For many experimental applica-tions, single-window detection (W1) is sufficient asthe flames have minimal O2 and CO2 interferenceif the proper excitation and fluorescence wave-lengths are selected. Non-sooting flames withequivalence ratios near one or slightly richer, gen-erally exhibit negligible levels of signals from O2,and contribution from CO LIF can also beneglected for pressures less than 220 bar. Forhigh-pressure flames (≥20 bar) with lean chemis-try(<0.9), the interference from CO2 and O2requires more than one detection window for sen-sitive and accurate detection of NO. In the case ofrich flames (中>1.5) or flames with incompletecombustion of the fuel, interference from PAHand other hydrocarbons can additionally compli-cate NO-LIF measurements and will require fur-ther work to establish an appropriate detectionstrategy. Ouantification of NO-LIF intensities for 2-Dimaging often requires an additional calibrationmeasurement [22]. In practical applications suchasengine measurements,awell-characterizedflame may be inserted into the field of view fordirect calibration of NO-LIF intensities [23]. Thistype of in situ calibration involves varying theamount of seeded NO and monitoring the corre-sponding change in the intensity of NO-LIF. Pre- mixed lean flames are preferred to minimize NOreburn [22]in fuel rich-regions and to ensure thatreburn rates depend linearly on seeding amounts.For the work presented here, NO-LIF signals arecalibrated by varying the amounts of seeded NOat two different excitation wavelengths [241. 4.2. Multi-window 2-D imaging of NO Accurate 2-D NO-LIF images require correc-tions for various effects including laser and fluo-rescence signal attenuation, which vary with gastemperature. For steady laboratory flames, timeconsuming strategies such as multi-line NO-LIFfitting [24] can be used to obtain accurate 2-Dtemperature fields. For practical applications,2-line thermometry offers a rapid means to obtain2-D temperature images with relatively high preci-sion. The temperature fields used in this study areobtained via 2-D 2-line thermometry of NO-LIF(line selection, 226.03 and 225.847 nm) and areshown in Fig. 4. A detection window centered at254 nm (FWHM 17.5 nm; Asahi Optics) was usedto maximize the signal purity of the NO-LIF. Quantitative 2-D NO-LIF images obtainedfrom the multi-window detection strategy areshown in Fig. 5. The data at pressures of 1 and10 bar use a two-window (W1 and W2) detectionsince interference from CO2 is negligible underthese conditions [18]. The second window pro-vides a means to correct the raw image for theinterference of O2-LIF in slightly lean conditions(=0.9). In slightly rich conditions (=1.1),O2 is mostly consumed during the reactionand single-window (W1) detection is sufficient(NO-LIF signal selectivity > 98%) and no correc-tion is needed. For pressures of 20 bar and higher,a three-window detection strategy is used for cor-rection of the raw images for both O2 and COLIF. The additional windows allow simultaneousimages of hot CO2 andO2. The data in Fig. 6show the images of O2 and CO2 extracted fromthe interference signals for rich and lean 40 barflames (right side) along with NO images withand without these corrections (left side). It shouldbe noted that the impact of the correction on theNO intensity is not significant due to the fact that Table 1 Optimized selection for primary detection window W1 for A-X(0,0), (0,1) and (0,2) transitions Excitation (nm) Filter center 2 FWHM Emission bands NO fraction Rayleigh A-X(0,0) 226 253 17 A-X(0,2), (0,3) 0.92 A-X(0,1) 235 226 8 A-X(0,0) 0.90 Yes A-X(0,1) 235 253 17 4-X(0,2), (0,3) 0.83 Yes A-X (0,1) 235 264 17 A-X(0,3), (0,4) 0.75 A-X(0,2) 248 226 10 A-X(0,0) 0.78 A-X(0,2) 248 235 8 A-X(0,1) 0.80 Yes NO fraction, NO-LIF signal/total signal (CHa/air flame, 40 bar, 中=0.9, 300 ppm NO seeding). Fig.4. NO temperature fields from 2-D 2-line NO-LIFthermometry (line selection, 226.03 nm and 225.847 nm)for various pressures (1-60 bar) at 中=0.9. Obtained byaccumulating 20 shots on-chip and using 2-D PLIFimaging of NO-LIF. Fig. 5. Quantitative NO concentrations from multi-window 2-D NO-LIF Imaging (1-60 bar, 中=0.9 and1.1with 300 ppm NO seeding). Note that the NOconcentrations in rich flames are significantly reduced byNO reburn. the excitation wavelength used has already beenoptimized for maximum suppression of the inter-ference. The data in Fig. 5 show that for slightlylean flames (=0.9), NO concentrations increasewith pressure as predicted by the thermal andprompt NO formation mechanisms [3]. For slight-ly rich conditions (二=1.1), NO reburn due toexcess hydrocarbons in the flame causes the con-centrations to decrease with pressure. The quantitative NO LIF data allows us tocompare measurements of NO concentrations inthe burnt gases (seeded NO) with model calcula-tions. Figure 7 shows a comparison of NO con-centrations obtained from NO-LIF imaging withcomputational calculations from a 1-D flame codeusinggGRI-Mech3.0 (Chemkin Premix ffrom Fig.6. NO,O2 and CO2 concentration fields from athree-window 2-D imaging strategy applied in a 40 barflame (中=0.9 and 1,1 with 300 ppm NO seeding). ForNO, interference-corrected and uncorrected images areboth shown (left panel). LIF Intensities are calibratedusing Chemkin Premix 1-D flame calculations. Fig. 7. Comparison of NO concentrations 3 mm abovethe burner matrix with Chemkin Premix 1-D flame code(GRI-Mech 3.0) as a function of pressure and equiva-lence ratio (中=0.9 and 1.1) with 300 ppm NO seeding.Arrowhead markers show simulations using temperatureprofiles scaled ±50 K. Reaction Design). The calculation is constrainedby the measured temperature as a function ofheight above the burner to account for heat lossto the burner. The needed temperature profilesare provided by the 2-D NO-LIF thermometry(Fig.4). To demonstrate the temperature depen-dence of these calculations, the temperature pro-file is scaled ±50 K from the peak value and theresulting calculations are shown as arrowheadmarkers in Fig. 7. It can be seen from these datathat the NO concentration is much more temper-ature-dependent in a fuel-lean flame than in a richone. In lean flames the production of NO is dom-inated by the Zeldovich mechanism (otherwiseknown as thermal NO), and this mechanism hasa very large temperature dependence [25], whereasin fuel rich flames the NO concentration is domi-nated by the reburn reactions, which are much lesstemperature-dependent.Whilereaction mecha-nisms in GRI-Mech are not specifically optimizedfor use in high-pressure conditions, the simula-tions show good agreement with experimentaldata when uncertainties in the temperature profile(±50K) are considered. 4.3. Pressure dependence of NO-LIF SNR Spectrally resolved 1-D line-imaging offersunique advantages in applying single-shot detec-tion of NO-LIF to practical systems. In the cur-rent work, 1-D line-imaging measurements werecarried out for all flame pressures (1-60 bar)and stoichiometry to provide guidelines for filterselection in the multi-window detection strategiesused for 2-D measurements. These 1-D measure-ments do not require the laser beam to be spreadinto a sheet, and the higher laser energy intensity Fig. 8. Comparison of SNR for spectrally resolved 1-Dimaging and 2-Dimaging of NO-LIF for pressureconditions presented in this study (1-60bar) and as afunction of shots accumulated on chip (1mJ/pulse). results in increased SNR. A comparison of SNRfor 1-D line and 2-D imaging data for 1 mJ laserenergy used in the current study are presented inFig. 8 for 300 ppm NO seeding. The curves inFig. 8 were calibrated using data at 20 shotsaccumulated on chip and extended to other val-ues using statistical arguments for this shot-noise-limited case. Averaging 20 shots is equiva-lent for our experimental setup to single-pulselaser energy of ~20 mJ, a value generally recom-mended for single-shot 2-D imaging applicationsto achieve SNR of ~10 at pressures exceeding40 bar (assuming laser sheet of 0.5×15mm).Lasers are available commercially for these highpowers, and as discussed above the excitation iswell below saturation at elevated pressures. Thehigh SNR of 1-D line-imaging and the added Fig. 9. Simulated 40 bar emission spectra with low NOconcentration (~25 ppm). NO-LIF intensity is scaledusing quantitative values obtained from this study. Thismethod is applicable along a line in the path of the laser(1-Dline-imaging). benefit of monitoring multiple emission featuresof NO-LIF simultaneously offer high sensitivityto extremely low concentrations of NO. We canuse present results to predict performance at low-er NO concentrations using spectrally resolved 1-D imaging. Figure 9 shows a simulated fluores-cence spectrum at 40 bar with a low (25 ppm)level of NO. NO-LIF features are clearly visible,though significant interference from O2 and COcan also be observed. Further studies to identifytheminimum (detectableNO concentrationsusing 1-D line-imaging are underway. 5. Conclusions We have demonstrated a strategy for selectiveand quantitative LIF detection of NO in high-pressure combustion environments using spec-trally resolved1-D imaging andspatiallyresolved 2-D imaging (i.e., PLIF). A 2-D NO-LIF imaging strategy for high-pressure detectionwas proposed and demonstrated using multiplewavelength windows. Spectrally resolved 1-Dline-imaging was used to identify the sources ofinterference and provide guidelines for selectingfilters in the multi-window strategy. 2-D imagingof NO-LIF was demonstrated by using A-X(0,0)excitation (226.03 nm) with multi-window detec-tion to correct for interference effects from otherspecies (O2 and CO2) in slightly lean and richconditions (+=0.9 and 1.1). In additiontoimaging quantified concentrations of NO, thesimultaneous imaging of the interference speciesO2 and CO2 is demonstrated. Spectrally resolved1-D line-imaging offers the possibility of highlyselective detection of NO-LIF down to extremelylow concentrations (<10 ppm) with only a one-laser andone-camera setup. The discussionsand demonstrations reported in this study pro-vide aapractical guideline for application ofinstantaneous 1-D or 2-D NO-LIF imaging inhigh-pressure combustion systems. Acknowledgments This work was supported by the US Air ForceOffice of Scientific Research, Aerospace SciencesDirectorate, with Julian Tishkoff as the technicalmonitor, SIand via an AFOSR STTR with Los Ga-tos Research. We acknowledge discussions andprevious collaborations with Prof. C. Schulz(IVG, University of Duisburg) and Dr. WolfgangG. Bessler (IWR, University of Heidelberg). Inaddition, we thank Dr. Bessler for spectral separa-tion codes which were modified for use in thisstudy. We thank Prof. C.T. Bowman of Stanfordfor his adviceon flamechemistrymodelcalculations. ( References ) ( [1] A.C. Eckbreth, Laser Diagnostics for CombustionTemperature and Species, Gordon and Breach, Amsterdam, 1 996.5 . ) ( [2] J. Wolfrum, Proc. C ombust. Inst. 2 7 (1998) 1-41. ) ( [3] C.T. Bowman, in: C . V o velle (Ed.), Pollutants f r om Combustion, Kluwer Academic P u blishers, . The Netherlands, 2000,pp. 123-1 4 4. ) ( [4] J . Warnatz, U. Maas, R.W. D ibble, Combustion, S pringer , Berlin-Heidelberg-New York, 1997. ) ( [5] J.E . Dec , R.E . Canaan, SAE Tech. Paper S eries 900147 (1998). ) ( [6] P. Jamette, P. Desgroux, V. R icordeau, B . D e s- c hamps, S A E Tech. Pa p er Ser i es 2001-01-1926 (20 0 1). ) ( [7] C. Schulz, V. Sick , U.E. Meier, J. Heinze, W. S tricker, Appl. Opt. 38 (1999) 1434-1443. ) ( [8] P. Andresen, G . Meijer, H . Schluter, H. Voges, A .Koch, W . Hentschel, W. Oppermann, W. Rothe,Appl. Opt. 29 (1990) 2392-2404. ) ( [9] A.O. Vyrodov, J . Heinze, M. Dillman, U .E. M eier,W. Stricker, Appl. P hys. B 61 ( 1995) 409-414. ) ( [10] M.D. DiRosa, K.G. Klavuhn, R.K. Hanson, Comb. S ci. Tech. 118 (1996) 257- 2 83. ) ( [11] W.P. Patridge , M.S. Klassen, D.D. Thomsen, N .M. Laurendeau, A p pl. Opt. 3 4 (1996) 4890-4904. ) ( [12 ] D.D. Thomsen, F.F. Kuligowski, N.M. Lauren-deau, Appl. Opt. 36 (1997)3244-3252. ) ( [13] W.G. Bessler, C. S c hulz, T. Le e , J.B. Jeffries, R . K.Hanson, Appl. Opt. 41 (2002) 3547-3557. ) Comments Alan Eckbreth, Consultant, USA. Based on your work,what do you believe the single pulse, 2-D NO detectionsensitivity to be in a turbulent, 30-40 bar combustor? Reply. The 2D single-shot detection sensitivity of NOwill depend on the experimental condition (i.e., laserpower, detector efficiency and combustor conditions).For the well-defined laminar flame used in this study, wehave observed a signal-to-noise ratio of ~12 in a 40 barflame with an NO concentration of ~450 ppm. For themeasurement strategies described here and a modest in-crease in laser pulse energy, we anticipate a detection sen-sitivity of ~50 ppm or less in a 40 bar turbulent flame. Jerry Seitzman, Georgia Institute of Technology,USA. What are the issues of making quantitative NOmeasurements at high pressure due to CO and H2Oabsorption along a path where you don’t have a prioriinformation on the CO2/H2O/temperature profile alongthe laser path? Reply. Correction for UV laser and signal attenua-tion in high-pressure combustors requires at least anestimate of the CO2, H2O and temperature ([16] in thepaper), although for the excitation/detection wave-lengths used and for temperatures in typical combustionenvironments, CO2 is the dominant of the two interfer- ( [14] W.G. B e ssler, C. S c hulz, T. Le e , J.B. J ef fries, R.K. H anson, Appl. O pt. 42 (2003) 2031-2042. ) ( [15] W.G. B e ssler, C. S c hulz, T. Le e , J.B. Je f fries, R.K. H anson,Appl. Opt. 42 (2003) 4922-4936. ) ( [16] C . Schulz, J.D. K och, . D .F. D avidson. , J . .B.Jeffries, R.K. Hanson, Chem. .2 Phys. Lett. 355(2002) 82-88. ) ( [17] C. Schulz, J.B. Jeffries, D.F . Davidson,J.D. Koch, J. Wolfrum, R.K. H a nson, Pr o c. Combust. Inst. 29 (2002)2725-2742. ) ( [18] W.G. B e ssler, C. S c hulz, T. Lee, J. B . Je f fries, R.K.Hanson, Chem. Phys. Lett. 375 (2003) 344-349. ) ( [19] W.G. B essler, C. Schulz, V. Sick, J.W. Daily, A versatile modeling t ool for nitric oxide LIF spectra. 3rd Joint Meeting US S e c. Combust. In s t., Chicago (), 2003. ) [20] M. Tamura, J. Luque, J.E. Harrington, P.A. Berg,G.P. Smith, J.B. Jeffries, D.R. Crosley, Appl. Phys.B 66(1998) 503-510. ( [21] F . Hildenbrand, C. Schulz,J. W olfrum, F. Keller, E.Wagner, Proc. Combust. I n st. 28 ( 2000) 1137- 1 144. ) ( [22] P.A. B erg, G.P. Smith, J.B. Jeffries, D . R. Crosley, P roc. Combust. I n st. 2 7 ( 1998) 1 377-1384. ) ( [24] T. Lee, W.G. B essler, H. Kronemayer, C . S c hulz, J .B.Jeffries, Appl. Opt. 44 (2005)6718-6728. ) ( [25] Y. Zeldovich, Acta Physicochimica U SSR 21 (1946) 577-628. ) ing species (>95%). This attenuation correction only re-quires an estimate of the temperature and the CO2concentration for relatively accurate (10%) corrections(remember the CO2 absorption cross section increaseswith temperature). In addition, when multi-spectraldetection is available, additional spectral regions whichare optimized for CO2 can provide a measurement ofthe CO and this information can be used to estimatethe concentration of CO,. Katharina Kohse-Heinghaus,(Uniursitat Bielefeld,Germany. With respect to your choice of spectral regionsfor a multi-wavelength detection, would your study sug-gest a different optimization for applications in gas tur-bines or in engines, and how much is an effect ofequivalence ratio versus that of pressure? Reply. For engines and gas turbines which operatefuel-lean well, the optimization presented here should bequite good. For rich operating systems or those with strat-ified operation, emission spectra of the combustion gasesshould be examined (i.e., 1-D spectrally dispersed lineimaging) after which additional optimization may be use-ful. It should also be noted that for the latter case, addi-tional interference from PAHs or other compounds canbe anticipated in which case alternative optimization oraddition of even more spectral regions may be required.
确定


还剩6页未读,是否继续阅读?

产品配置单


北京欧兰科技发展有限公司为您提供《火焰,氮氧化物中氮氧化物浓度检测方案(流量计)》,该方案主要用于其他中氮氧化物浓度检测,参考标准--,《火焰,氮氧化物中氮氧化物浓度检测方案(流量计)》用到的仪器有PLIF平面激光诱导荧光火焰燃烧检测系统、时间分辨平面激光诱导荧光测量系统、德国LaVision PIV/PLIF粒子成像测速场仪
推荐专场


相关方案
更多
该厂商其他方案
更多