


本文给出了用时间分辨立体PIV(TRSPIV)实验解决实验室尺度内混合器中的瞬态流场结构问题。研究了漩涡结构的时间演化规律。
方案详情

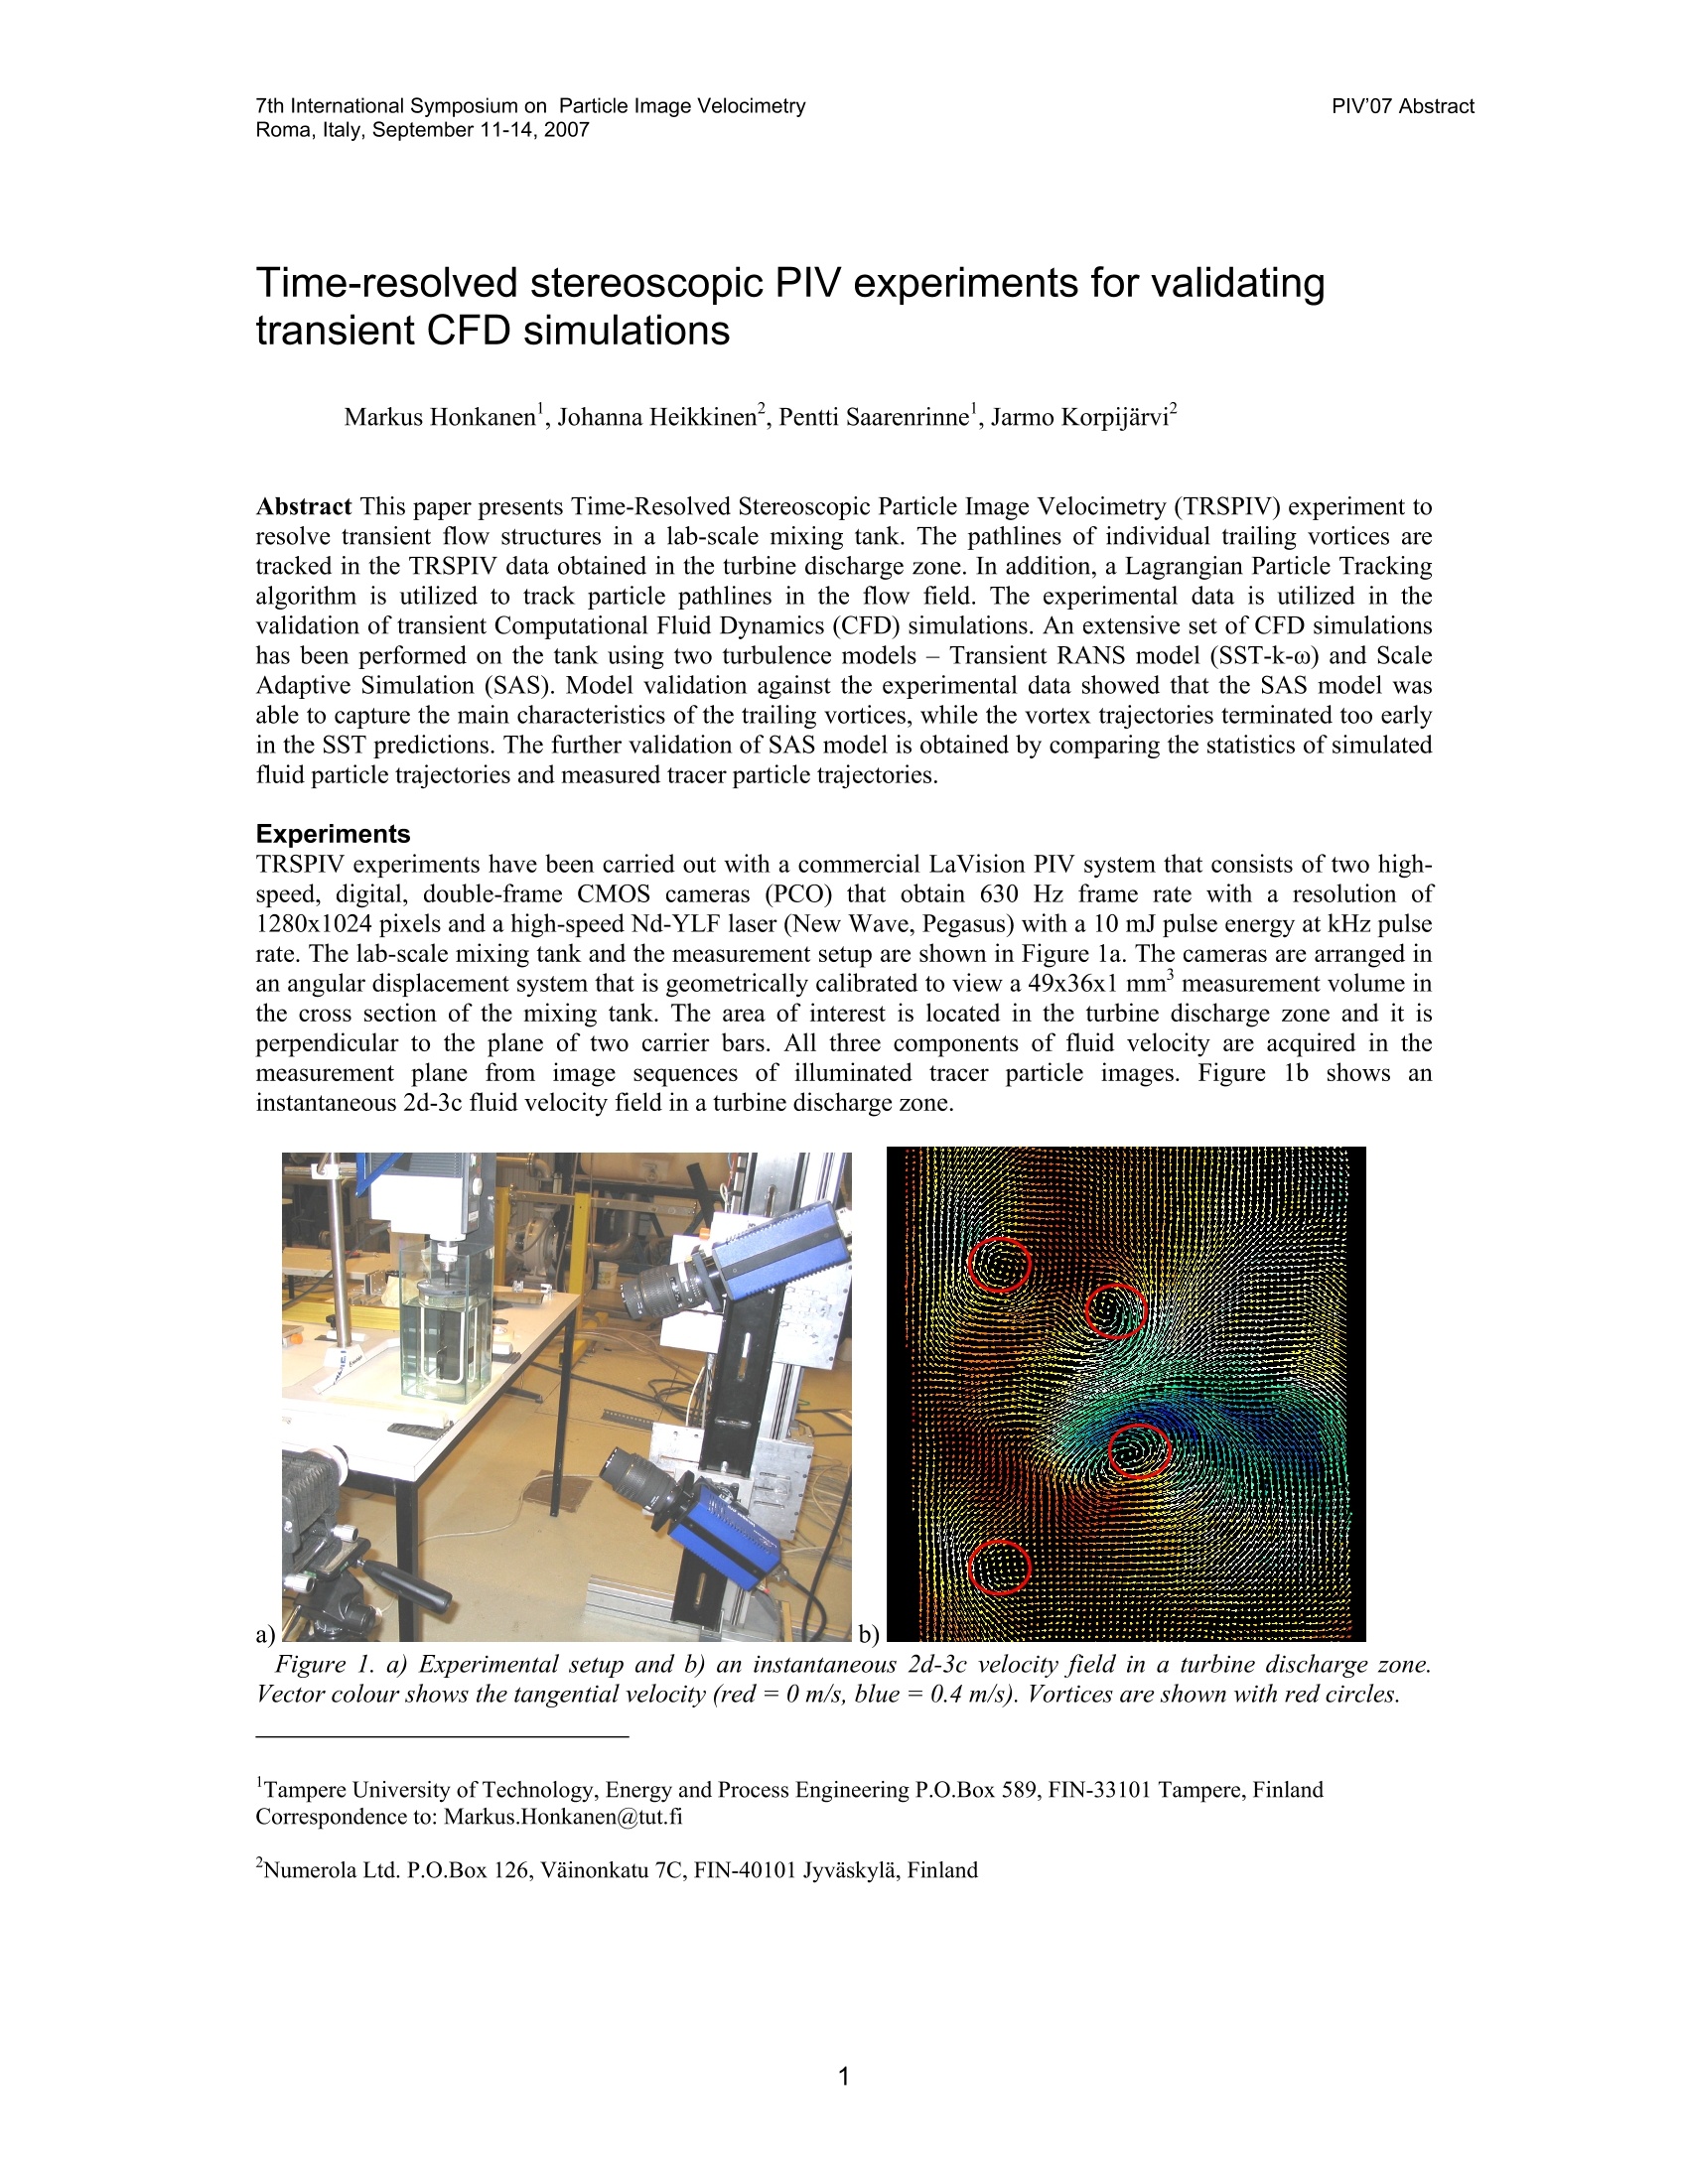
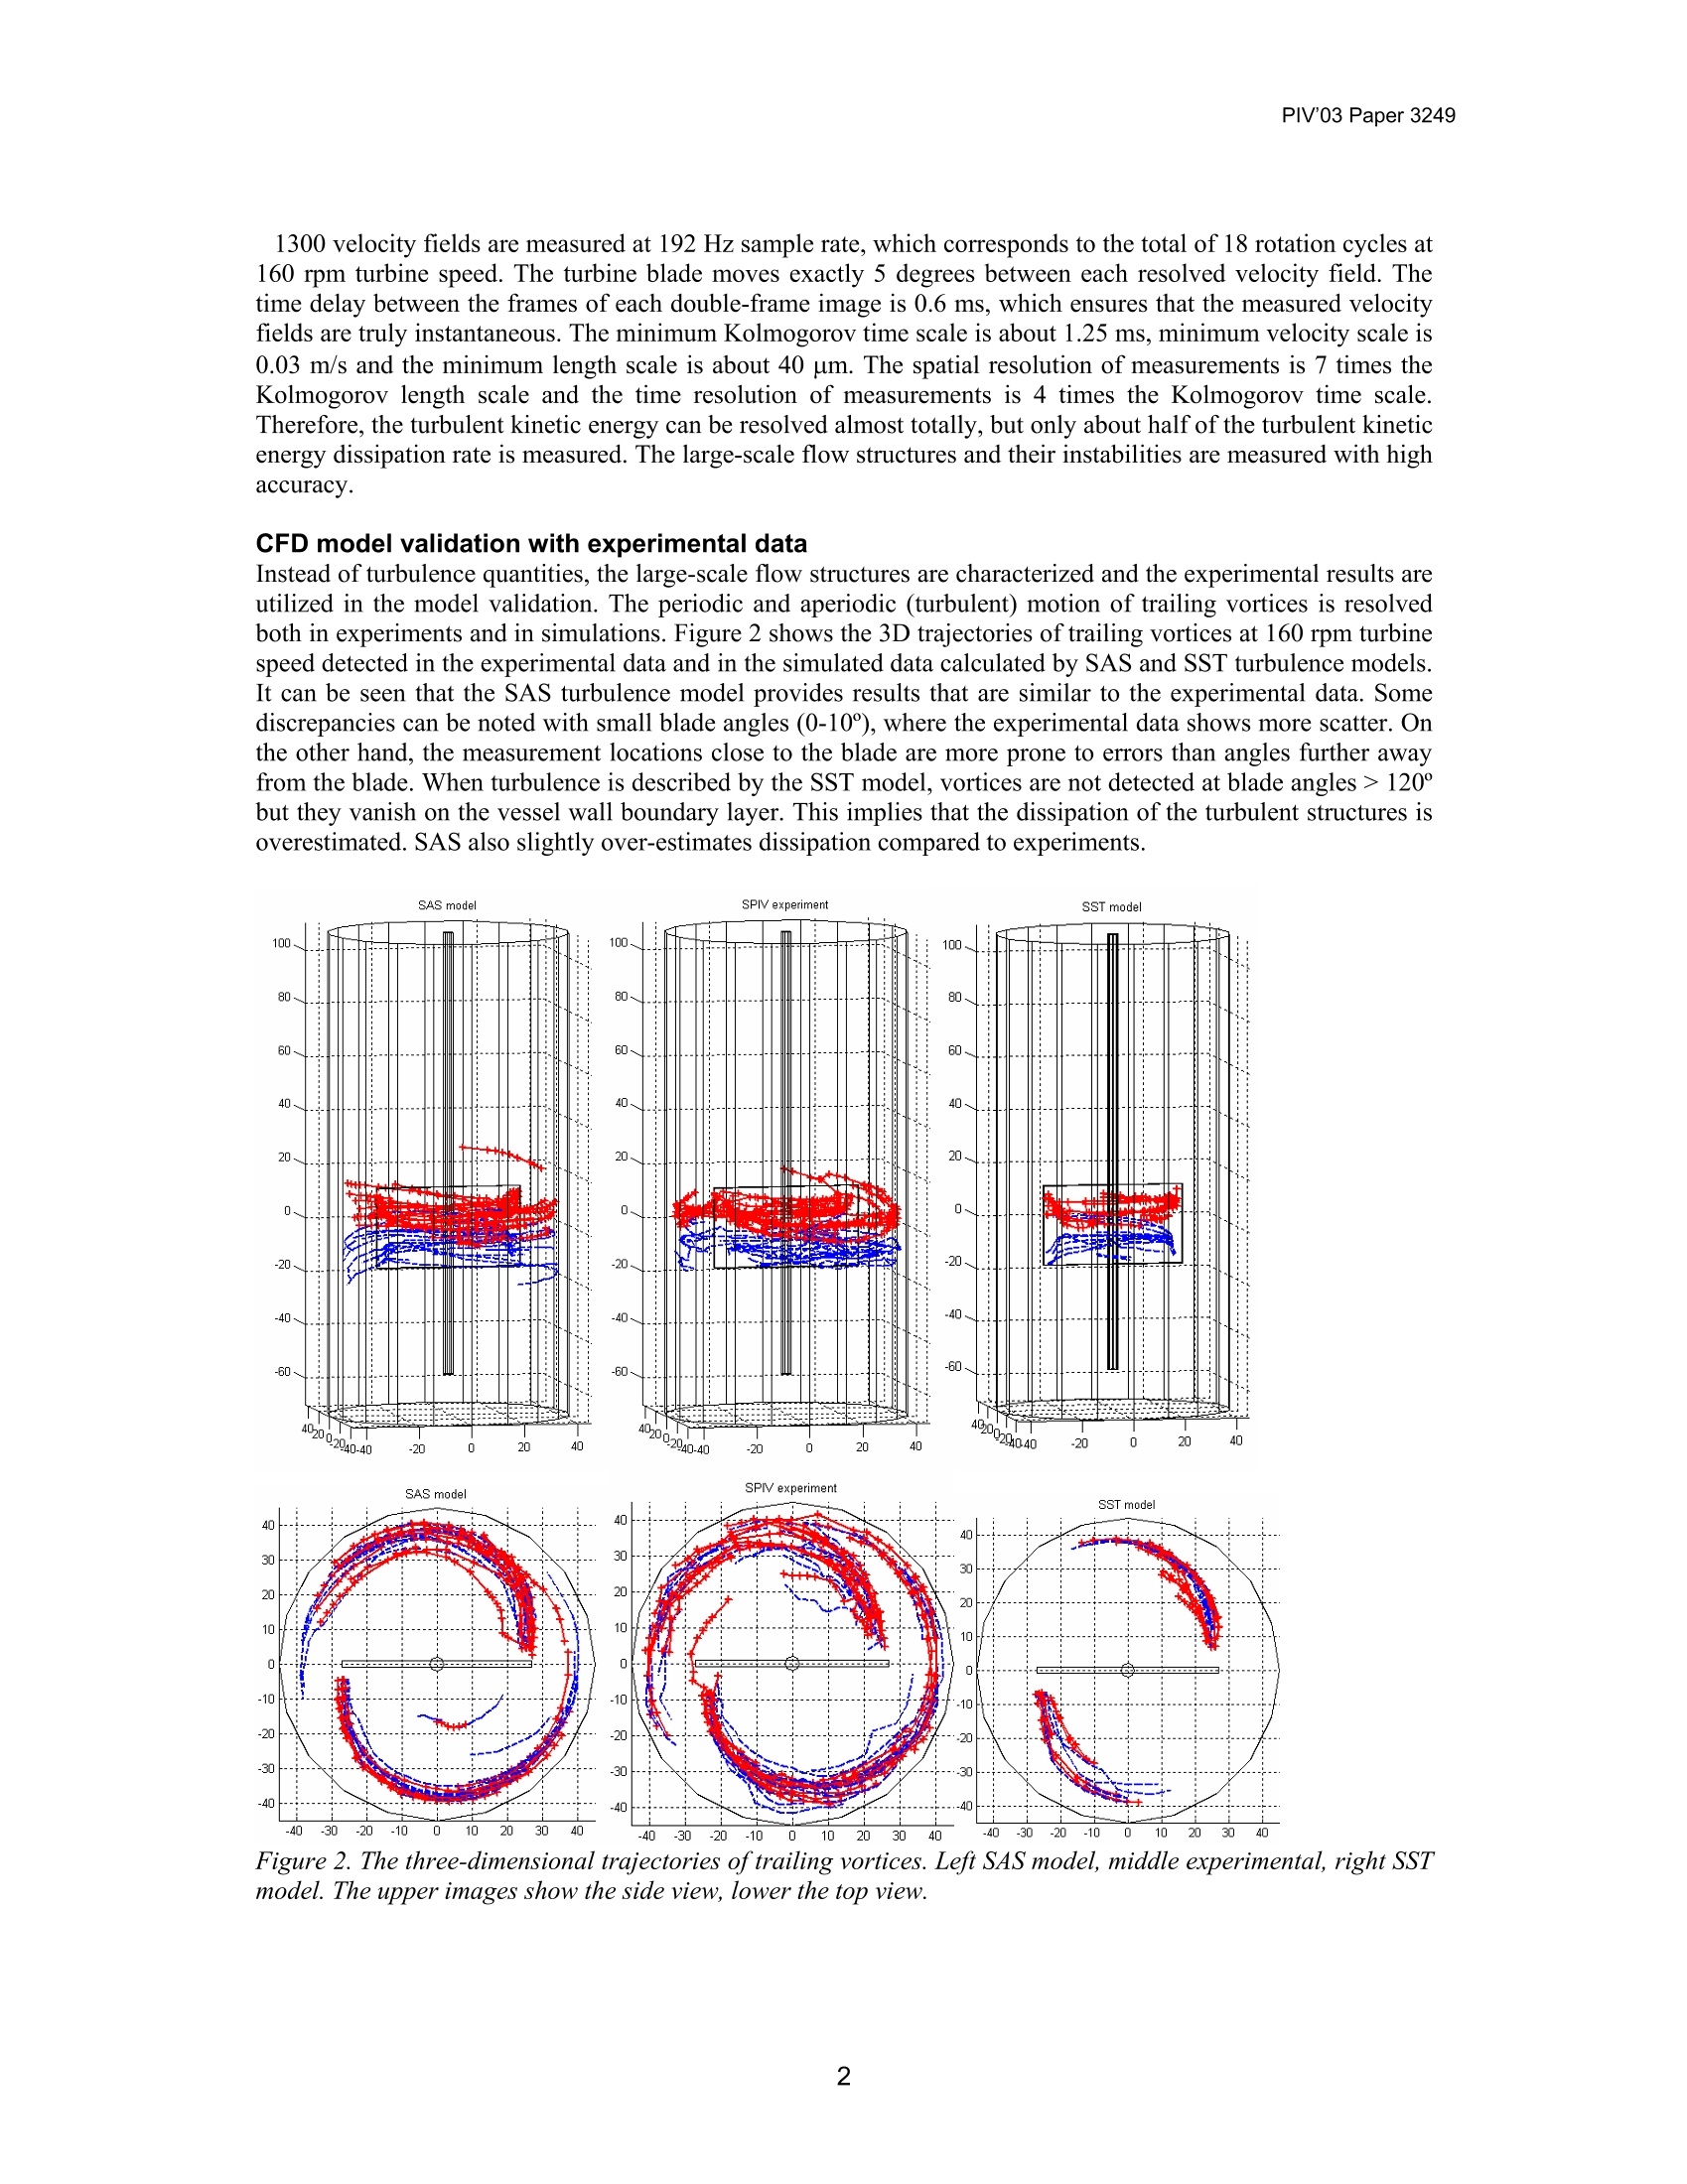
PIV'07 Abstract7th International Symposium on Particle Image VelocimetryRoma, Italy, September 11-14,2007 PIV'03 Paper 3249 Time-resolved stereoscopic PIV experiments for validatingtransient CFD simulations Markus Honkanen , Johanna Heikkinen , Pentti Saarenrinne , Jarmo Korpijarvi Abstract This paper presents Time-Resolved Stereoscopic Particle Image Velocimetry (TRSPIV) experiment toresolve transient flow structures in a lab-scale mixing tank. The pathlines of individual trailing vortices aretracked in the TRSPIV data obtained in the turbine discharge zone. In addition, a Lagrangian Particle Trackingalgorithm is utilized to track particle pathlines in the flow field. The experimental data is utilized in thevalidation of transient Computational Fluid Dynamics (CFD) simulations. An extensive set of CFD simulationshas been performed on the tank using two turbulence models - Transient RANS model (SST-k-ω) and ScaleAdaptive Simulation (SAS). Model validation against the experimental data showed that the SAS model wasable to capture the main characteristics of the trailing vortices, while the vortex trajectories terminated too earlyin the SST predictions. The further validation of SAS model is obtained by comparing the statistics of simulatedfluid particle trajectories and measured tracer particle trajectories. Experiments TRSPIV experiments have been carried out with a commercial LaVision PIV system that consists of two high-speed, digital, double-frame CMOS cameras (PCO) that obtain 630 Hz frame rate with a resolution of1280x1024 pixels and a high-speed Nd-YLF laser (New Wave, Pegasus) with a 10 mJ pulse energy at kHz pulserate. The lab-scale mixing tank and the measurement setup are shown in Figure 1a. The cameras are arranged inan angular displacement system that is geometrically calibrated to view a 49x36x1 mm’measurement volume inthe cross section of the mixing tank. The area of interest is located in the turbine discharge zone and it isperpendicular to the plane of two carrier bars. All three components of fluid velocity are acquired in themeasurement plane from image sequences of illuminated tracer particle images. Figure 1b shows aninstantaneous 2d-3c fluid velocity field in a turbine discharge zone. a) b) Figure 1. a) Experimental setup and b) an instantaneous 2d-3c velocity field in a turbine discharge zone.Vector colour shows the tangential velocity (red=0 m/s, blue =0.4 m/s). Vortices are shown with red circles. ( "Tampere University of Technology, Energy and Process Engineering P.O.Box 5 89, F IN-33101 Tampere, FinlandCorrespondence to: Markus.Honkanen@tut.fi ) 1300 velocity fields are measured at 192 Hz sample rate, which corresponds to the total of 18 rotation cycles at160 rpm turbine speed. The turbine blade moves exactly 5 degrees between each resolved velocity field. Thetime delay between the frames of each double-frame image is 0.6 ms, which ensures that the measured velocityfields are truly instantaneous. The minimum Kolmogorov time scale is about 1.25 ms, minimum velocity scale is0.03 m/s and the minimum length scale is about 40 um. The spatial resolution of measurements is 7 times theKolmogorov length scale and the time resolution of measurements is 4 times the Kolmogorov time scale.Therefore, the turbulent kinetic energy can be resolved almost totally, but only about half of the turbulent kineticenergy dissipation rate is measured. The large-scale flow structures and their instabilities are measured with highaccuracy. CFD model validation with experimental data Instead of turbulence quantities, the large-scale flow structures are characterized and the experimental results areutilized in the model validation. The periodic and aperiodic (turbulent) motion of trailing vortices is resolvedboth in experiments and in simulations. Figure 2 shows the 3D trajectories of trailing vortices at 160 rpm turbinespeed detected in the experimental data and in the simulated data calculated by SAS and SST turbulence models.It can be seen that the SAS turbulence model provides results that are similar to the experimental data. Somediscrepancies can be noted with small blade angles (0-10°), where the experimental data shows more scatter. Onthe other hand, the measurement locations close to the blade are more prone to errors than angles further awayfrom the blade. When turbulence is described by the SST model, vortices are not detected at blade angles> 120°but they vanish on the vessel wall boundary layer. This implies that the dissipation of the turbulent structures isoverestimated. SAS also slightly over-estimates dissipation compared to experiments. Figure 2. The three-dimensional trajectories oftrailing vortices. Left SAS model, middle experimental, right SSTmodel. The upper images show the side view, lower the top view. Numerola Ltd.P.O.Box Vainonkatu C, FIN-Jyvaskyla, Finland
确定
还剩1页未读,是否继续阅读?

产品配置单


北京欧兰科技发展有限公司为您提供《流体中速度场检测方案(粒子图像测速)》,该方案主要用于其他中速度场检测,参考标准--,《流体中速度场检测方案(粒子图像测速)》用到的仪器有德国LaVision PIV/PLIF粒子成像测速场仪、时间分辨粒子成像测速系统(TR-PIV)、Imager sCMOS PIV相机
推荐专场


相关方案
更多
该厂商其他方案
更多