


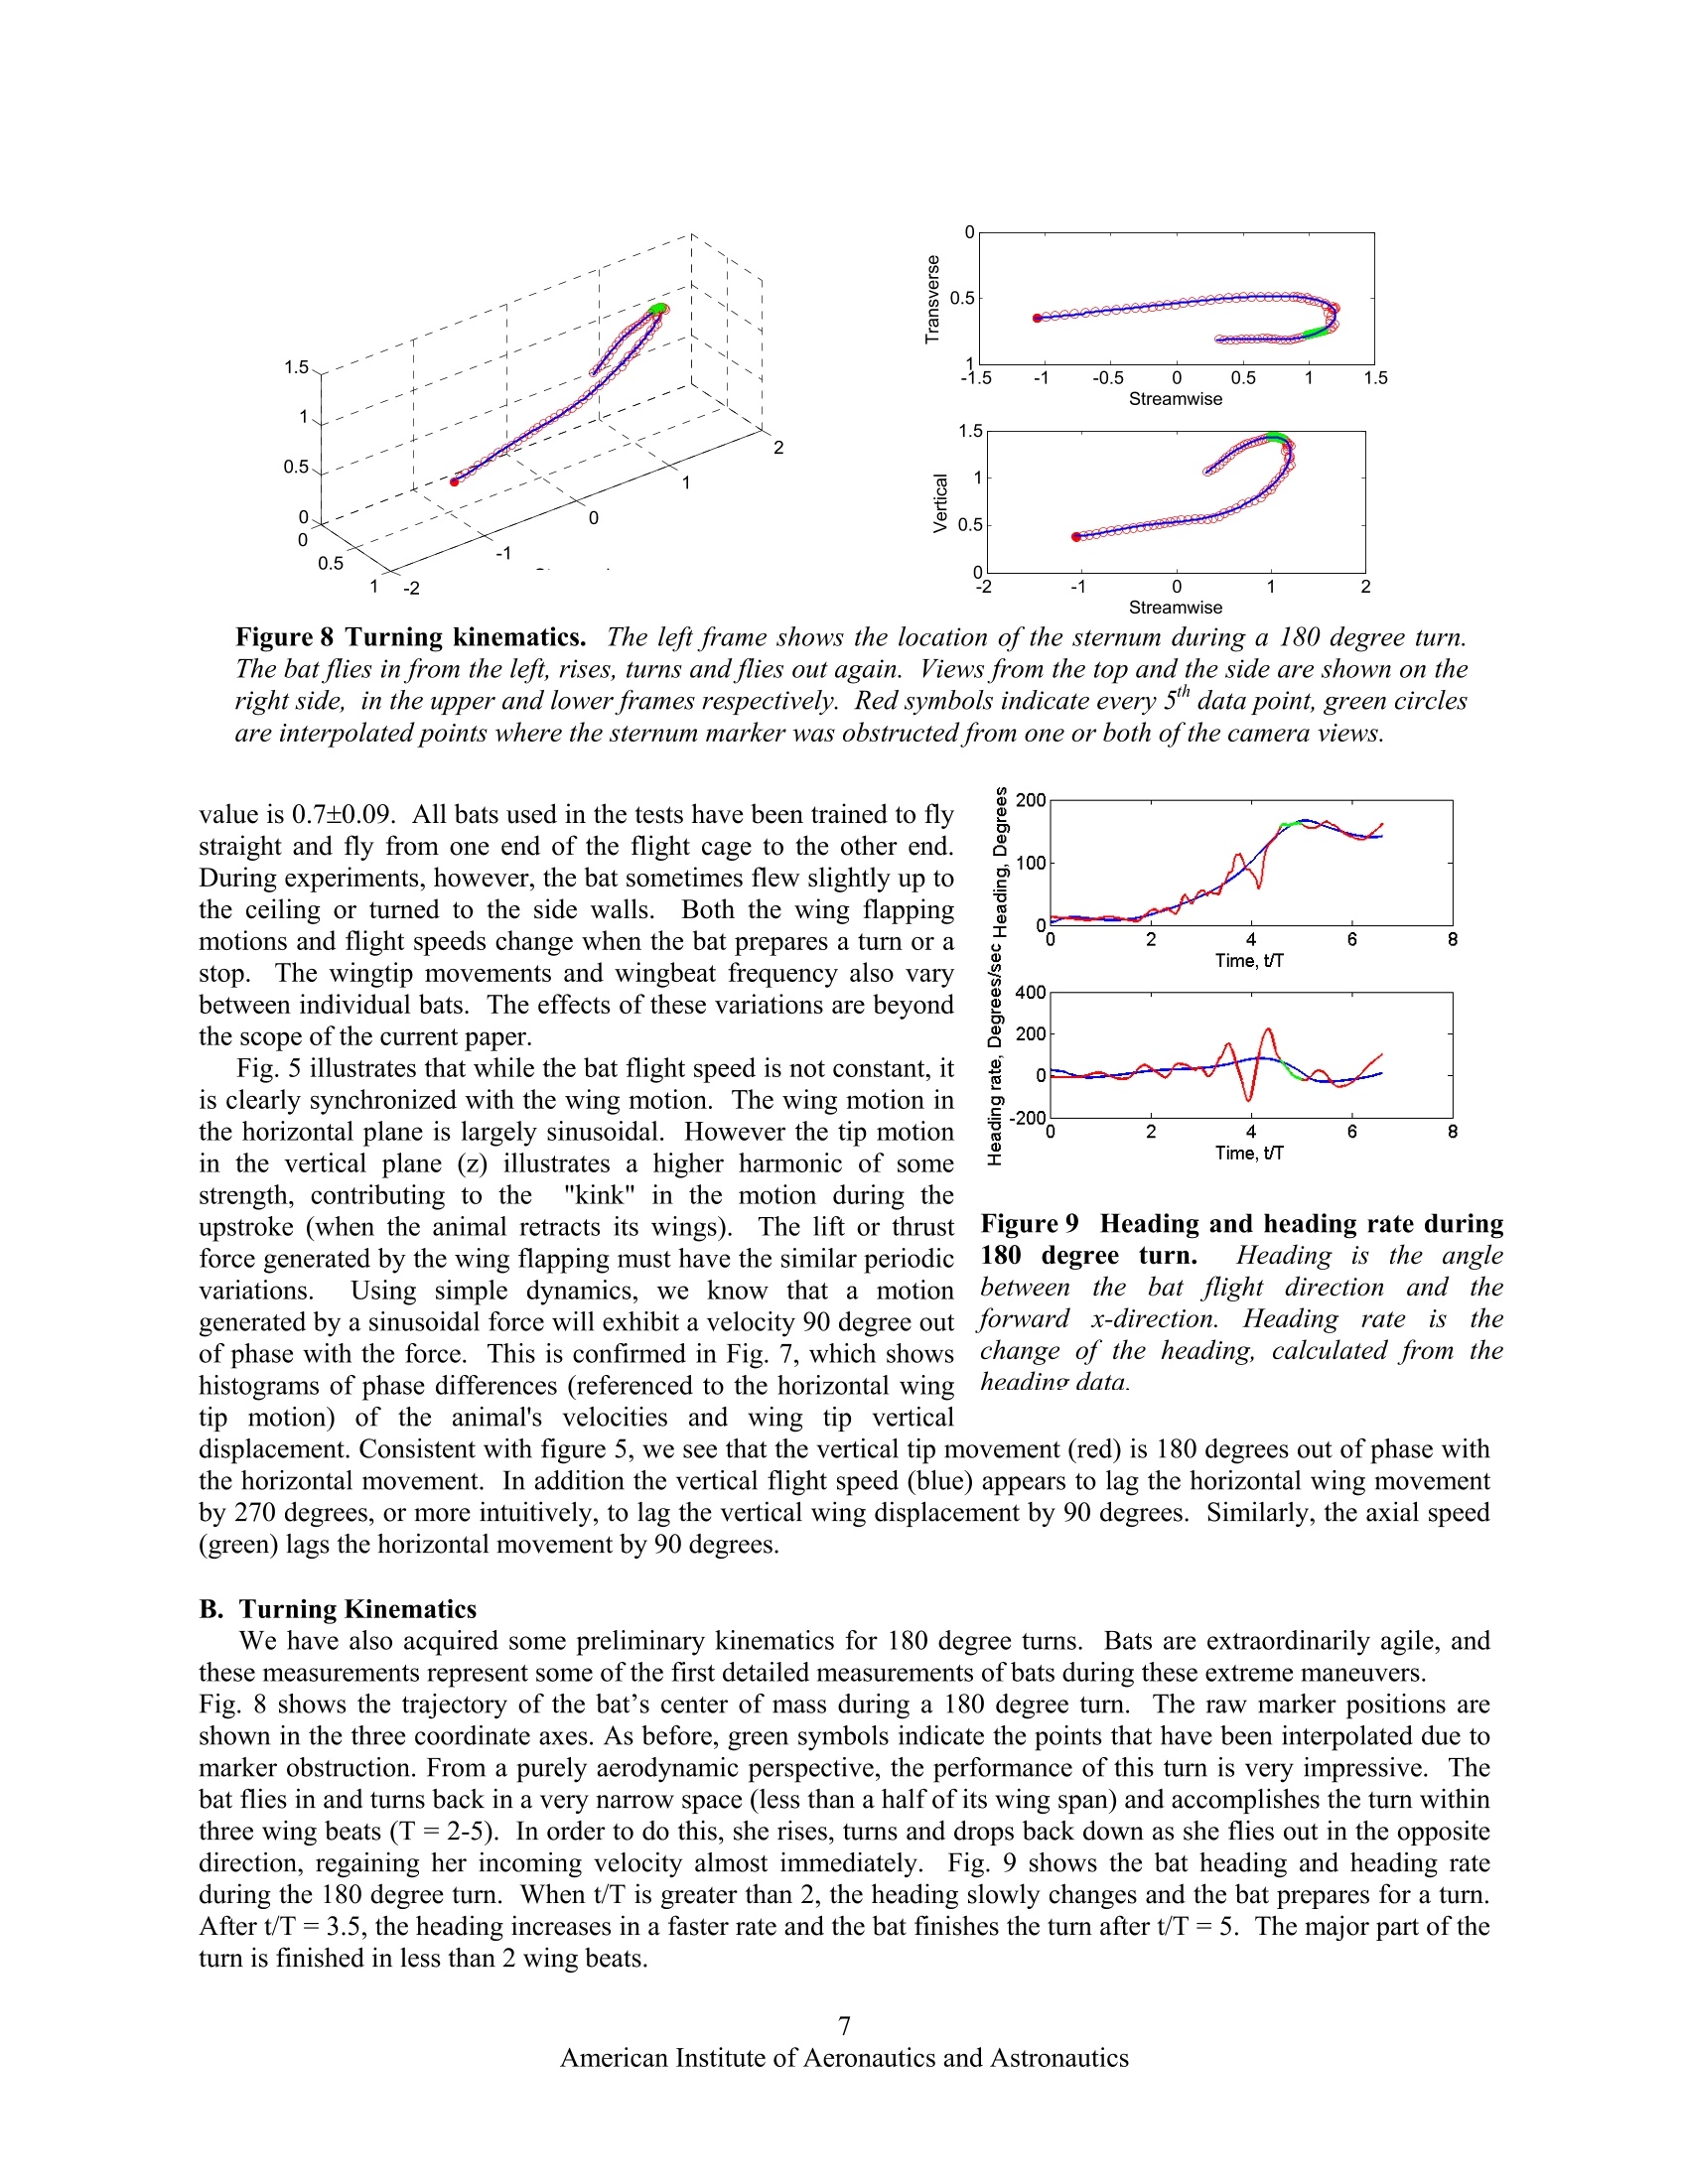
方案详情
文
给出了蝙蝠飞行的实验测量结果。包括直线和回转飞行时的运动特性高帧频记录,以及蝙蝠飞行方向后部尾流漩涡的测量。
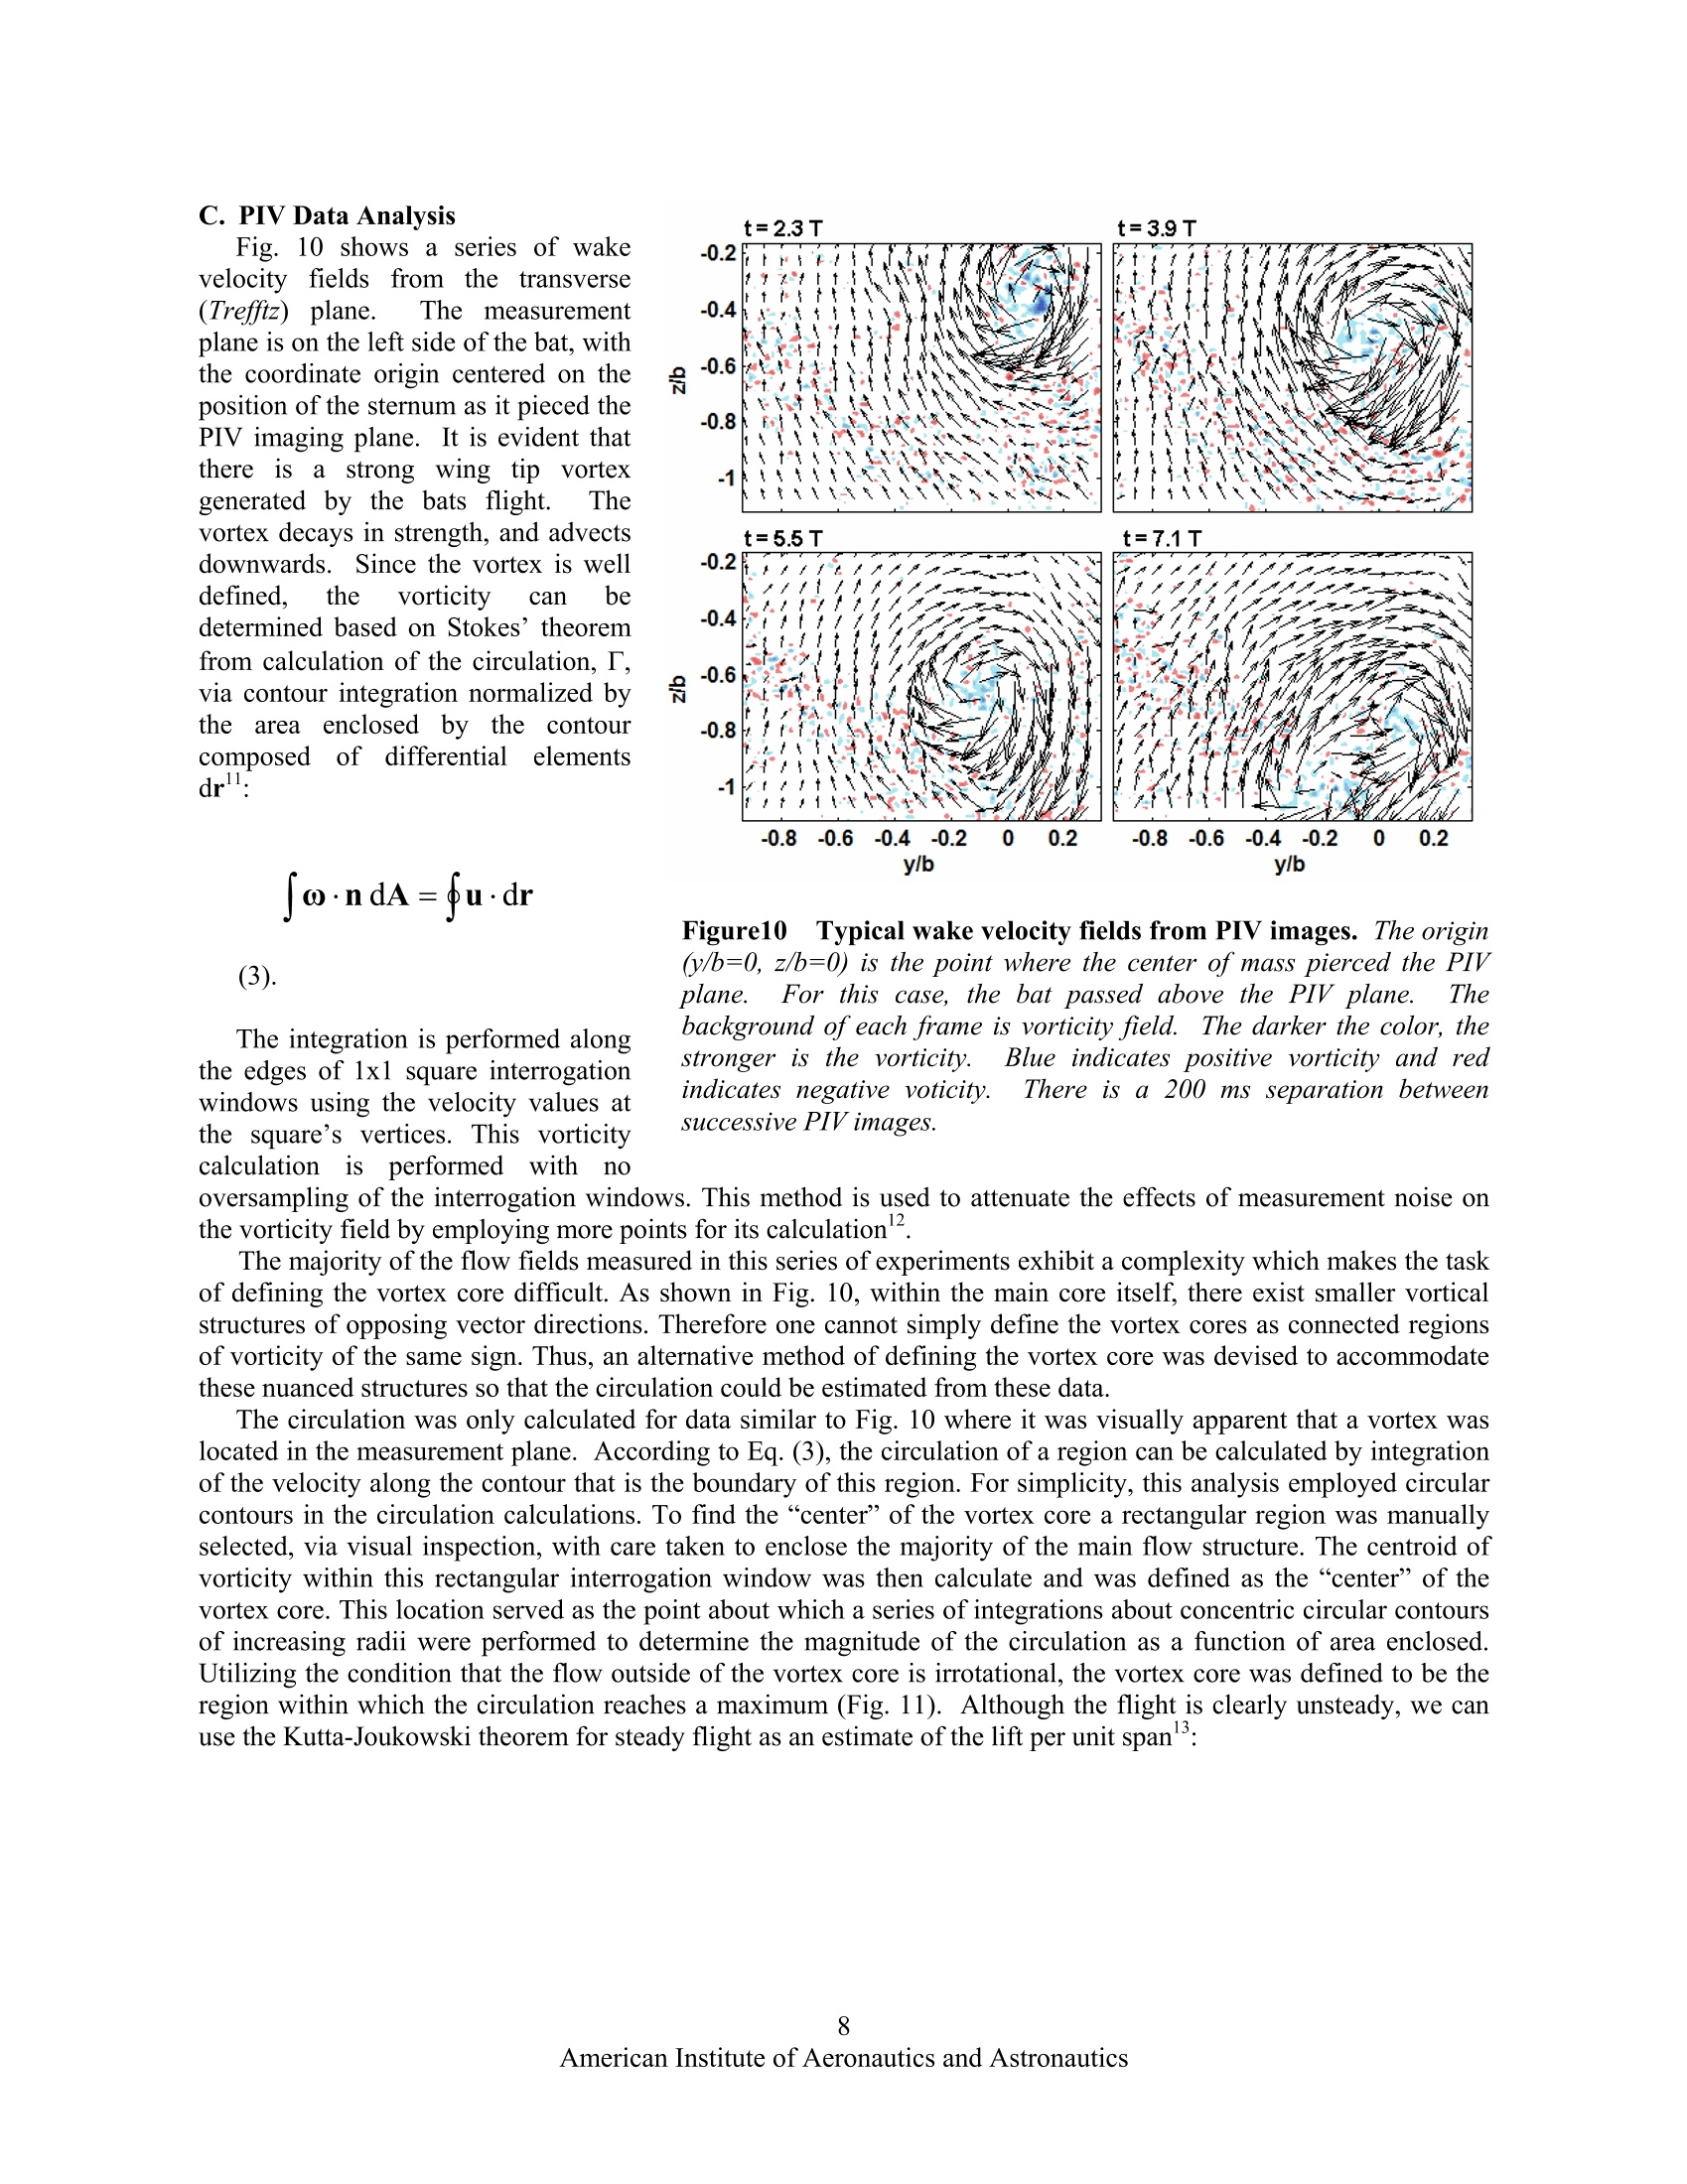
方案详情

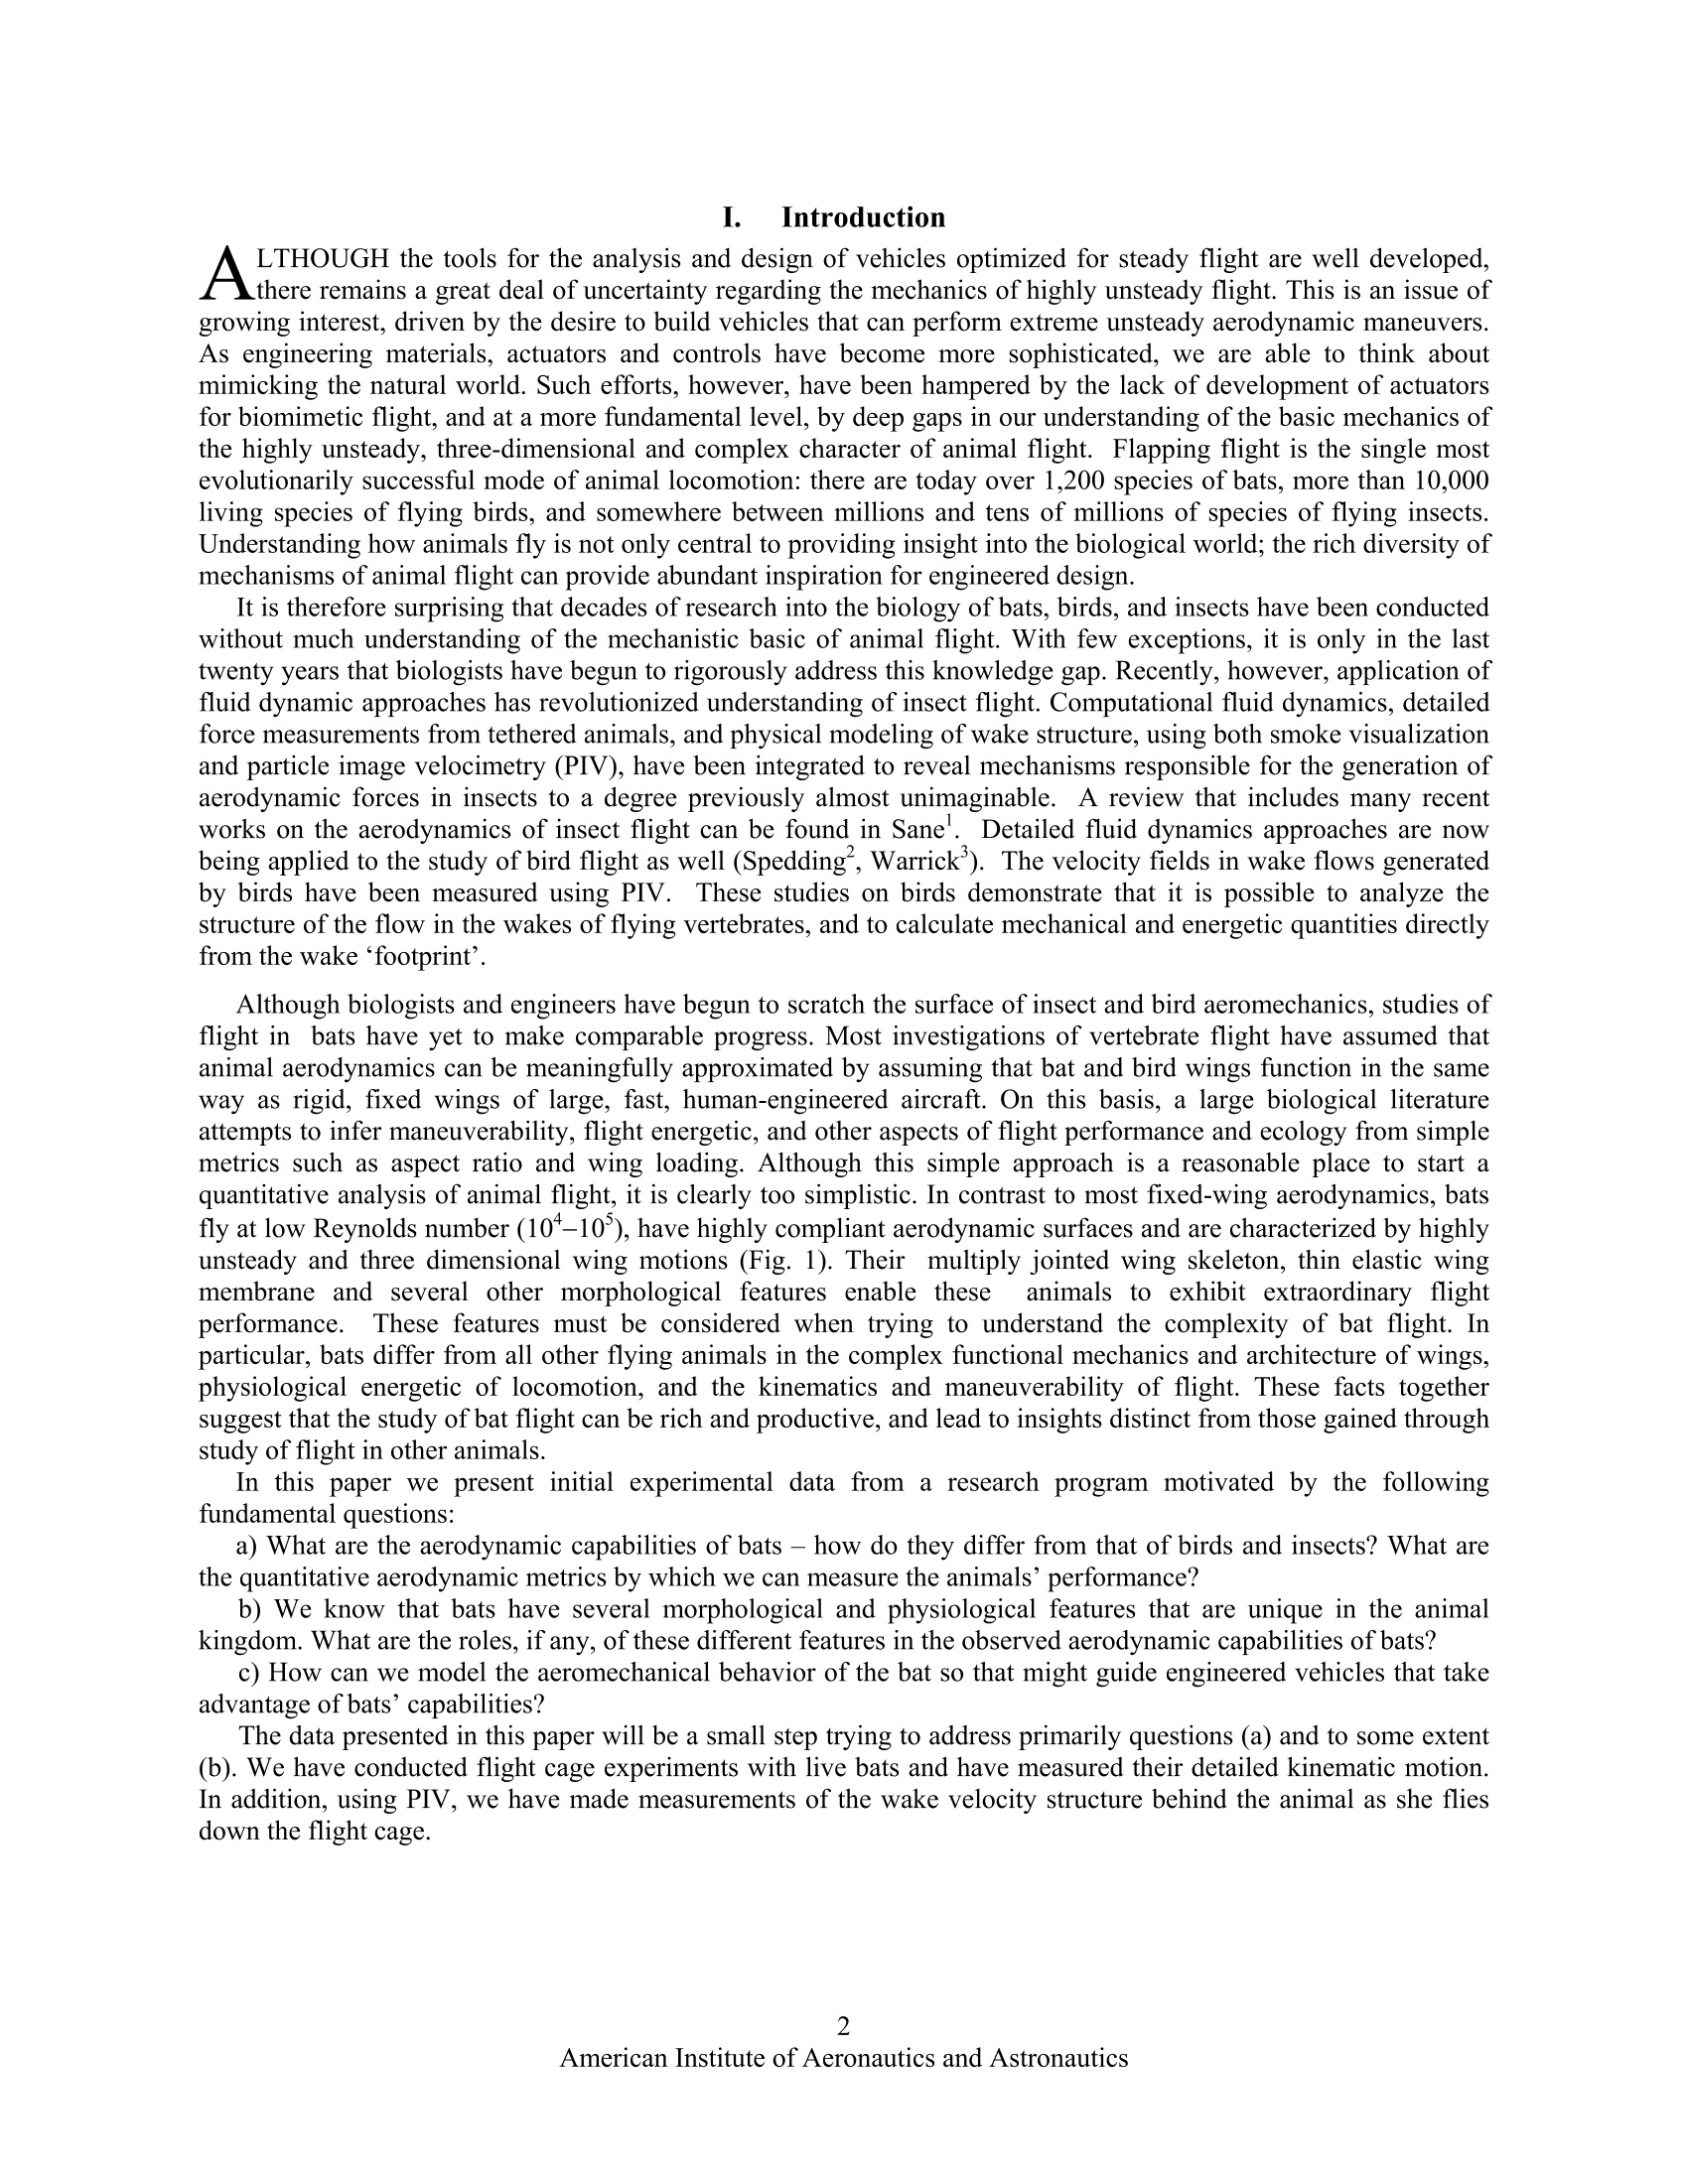
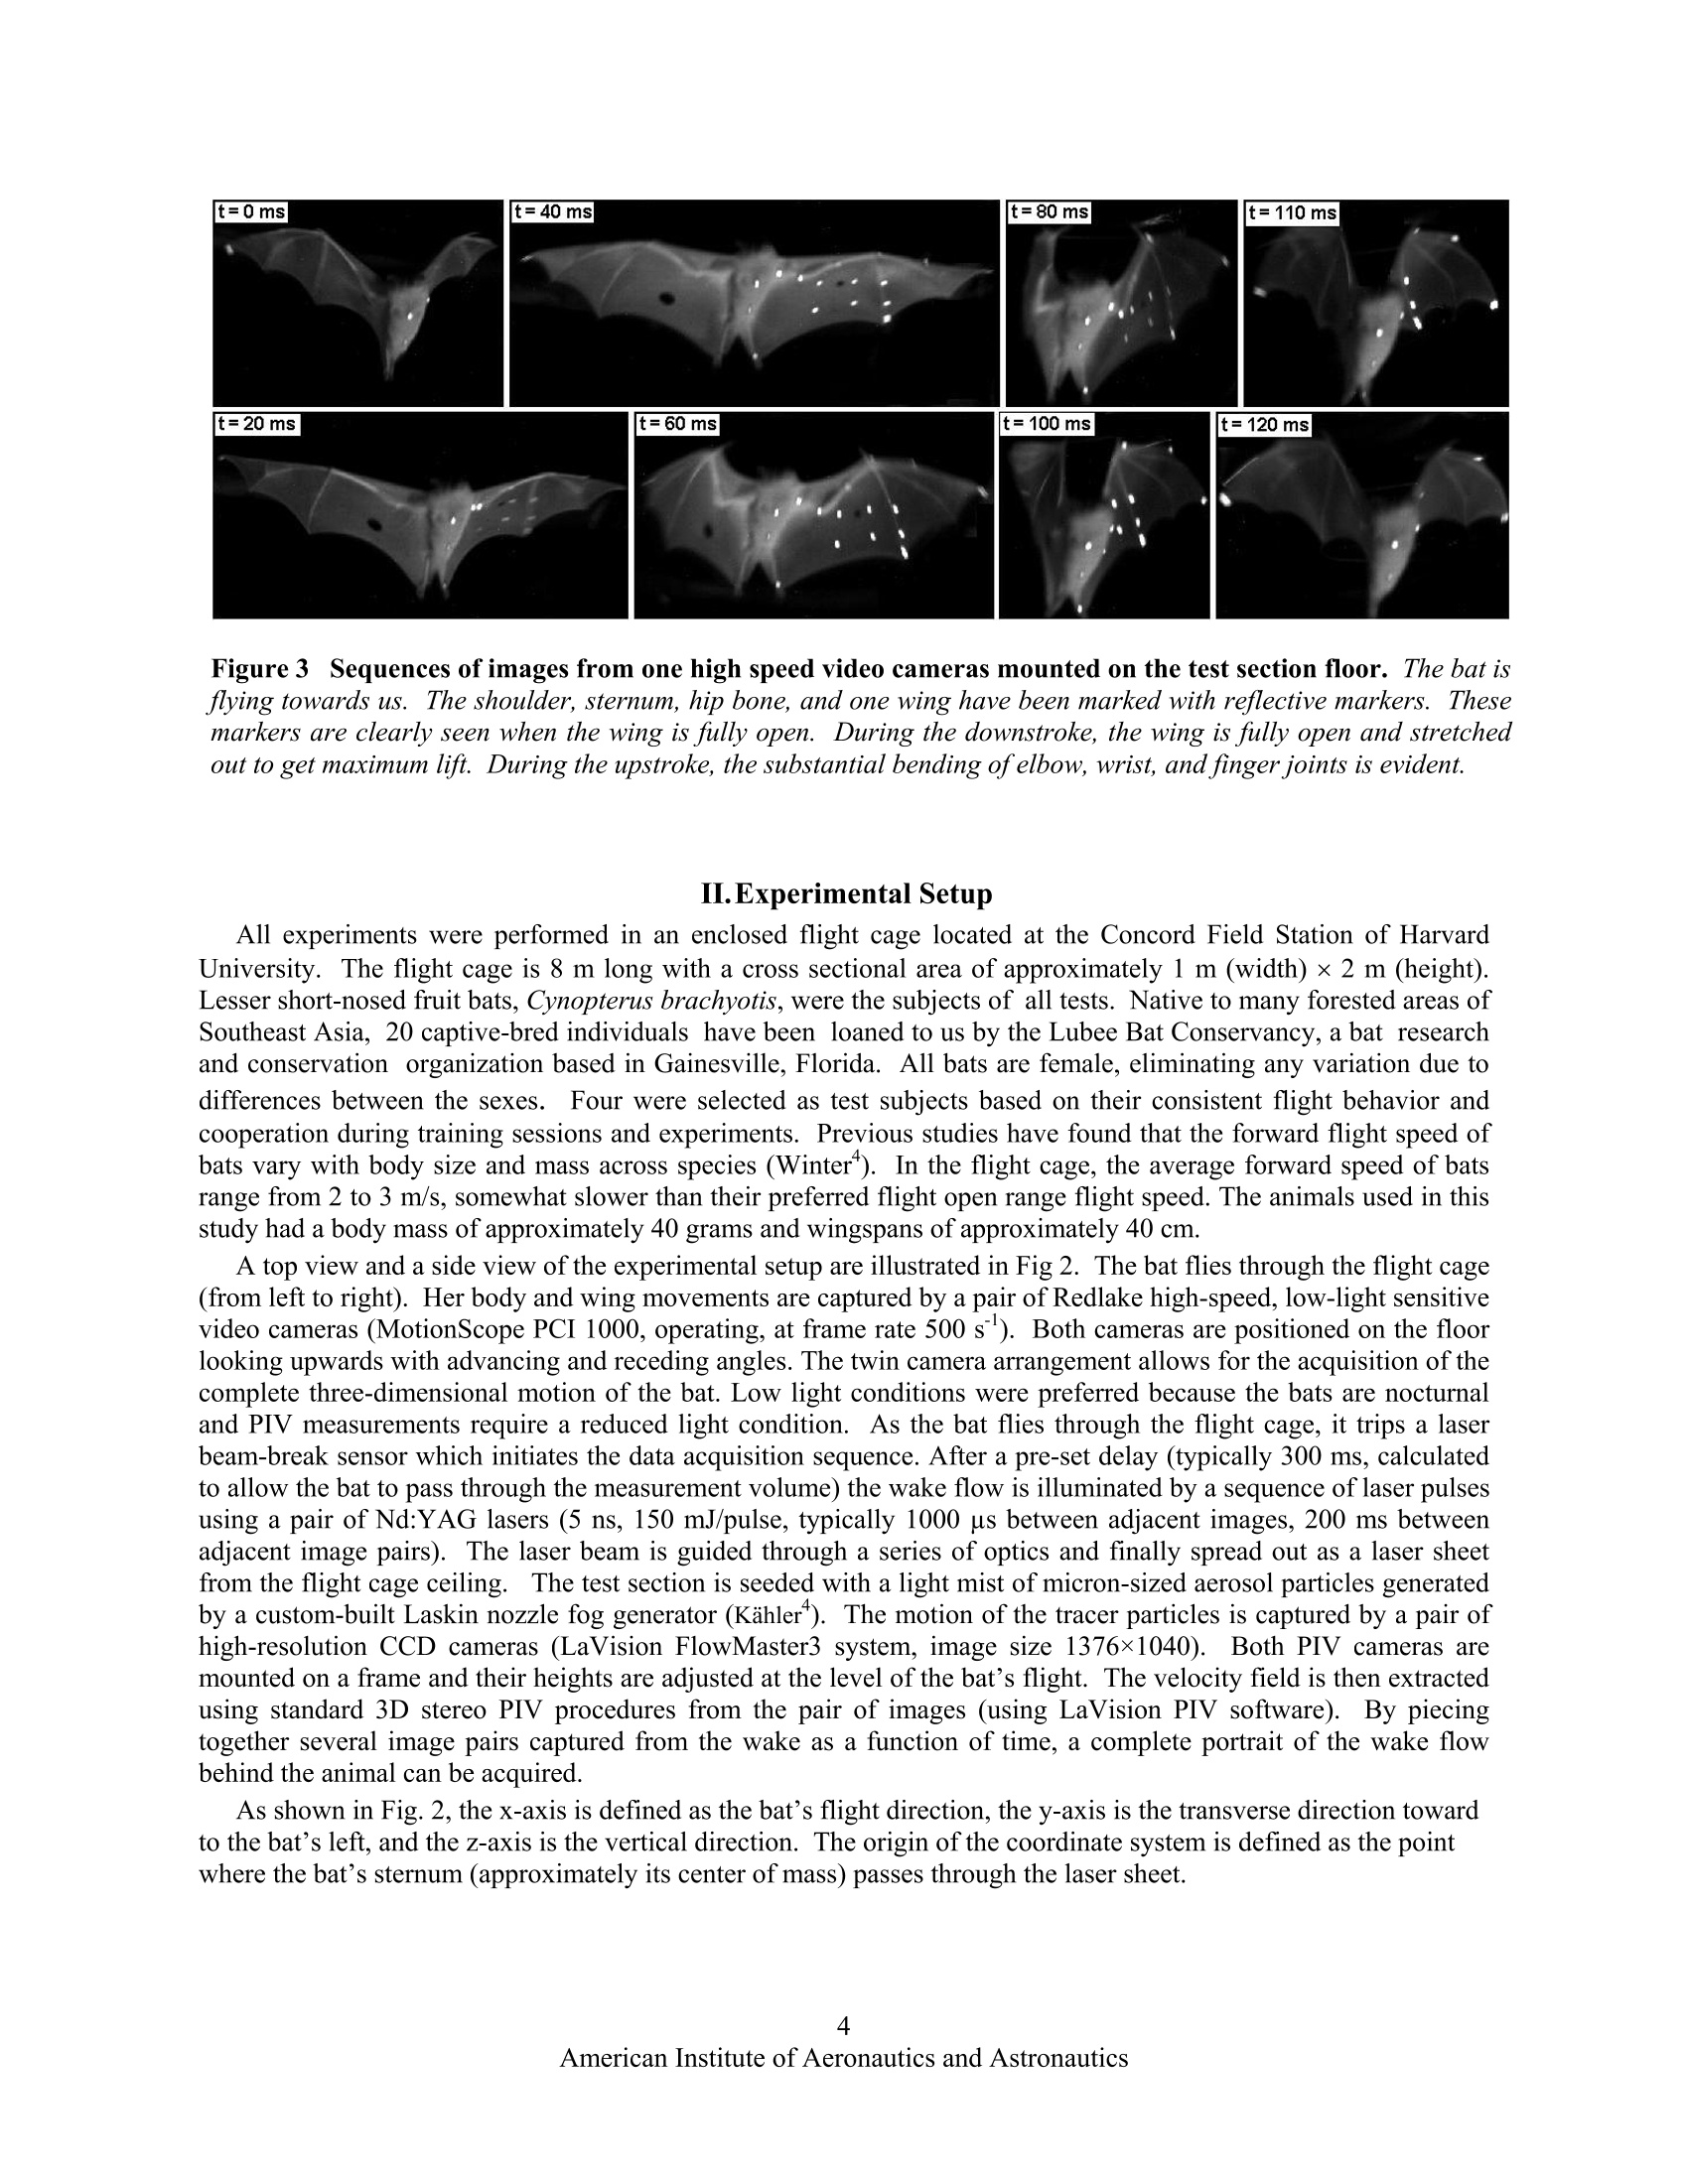
AIAA 2006-286536th AIAA Fluid Dynamics Conference and Exhibit5-8 June 2006, San Francisco, California Direct Measurements of theKinematics and Dynamics of Bat Flight Xiaodong Tian, Jose Iriarte , Kevin Middleton, Ricardo Galvao , Emily Israeli, Abigail Roemer, Allyce Sullivan", Arnold Song, Sharon Swartz** and Kenneth Breuer’ Brown University, Providence, RI 02912 Experimental measurements on the flight of bats are presented. High speed stereokinematic motion during straight and turning flight, as well as measurements of the wakevelocity field behind the bat are presented. The kinematic data reveals that, at the relativelyslow flight speeds considered, that the wing motion is quite complex, including a sharpretraction of the wing during the upstroke and a broad sweep of the fully extended wingduring the downstroke. The data also indicates that the bat flight speed and elevation arenot constant but oscillate, synchronized with the movement of the wing in both thehorizontal and vertical planes. PIV measurements in the transverse (Treffz) plane of thewake velocities indicate a complex wake vortex structure dominated by a strong wingtipvortex shed from either the wing tip (during the downstroke) and perhaps from moreproximal joint during the upstroke. Data synthesis of several discrete realizations suggest a"cartoon" of the wake structure during the entire wing beat cycle although a considerableamount of work remains to be done to confirm and amplify on these results. Nomenclature Postdoctoral Researcher, Division of Engineering ' Graduate Student, Department of Ecology and Evolutionary Biology Postdoctoral Researcher, Department of Ecology and Evolutionary Biology # Undergraduate Student, Division of Engineering & Undergraduate Student, Department of Ecology and Evolutionary Biology ’ Graduate Student, Division of Engineering. **Associate Professor, Department of Ecology and Evolutionary Biology Associate Professor, Division of Engineering, Engineering, Box D, Brown University, Providence RI 02912. Tel:401.863.2870; (fax) 401.863.9028; Email: kbreuer@brown.edu (Corresponding Author) Introduction LTHOUGH the tools for the analysis and design of vehAicles optimized for steady flight are well developed,there remains a great deal of uncertainty regarding the mechanics of highly unsteady flight. This is an issue ofgrowing interest, driven by the desire to build vehicles that can perform extreme unsteady aerodynamic maneuvers.As engineering materials, actuators and controls have become more sophisticated, we are able to think aboutmimicking the natural world. Such efforts, however, have been hampered by the lack of development of actuatorsfor biomimetic flight, and at a more fundamental level, by deep gaps in our understanding of the basic mechanics ofthe highly unsteady, three-dimensional and complex character of animal flight. Flapping flight is the single mostevolutionarily successful mode of animal locomotion: there are today over 1,200 species of bats, more than 10,000living species of flying birds, and somewhere between millions and tens of millions of species of flying insects.Understanding how animals fly is not only central to providing insight into the biological world; the rich diversity ofmechanisms of animal flight can provide abundant inspiration for engineered design. It is therefore surprising that decades of research into the biology of bats, birds, and insects have been conductedwithout much understanding of the mechanistic basic of animal flight. With few exceptions, it is only in the lasttwenty years that biologists have begun to rigorously address this knowledge gap. Recently, however, application offluid dynamic approaches has revolutionized understanding of insect flight. Computational fluid dynamics, detailedforce measurements from tethered animals, and physical modeling of wake structure, using both smoke visualizationand particle image velocimetry (PIV), have been integrated to reveal mechanisms responsible for the generation ofaerodynamic forces in insects to a degree previously almost unimaginable. A review that includes many recentworks on the aerodynamics of insect flight can be found in Sane. Detailed fluid dynamics approaches are nowbeing applied to the study of bird flight as well (Spedding’, Warrick’). The velocity fields in wake flows generatedby birds have been measured using PIV. These studies on birds demonstrate that it is possible to analyze thestructure of the flow in the wakes of flying vertebrates, and to calculate mechanical and energetic quantities directlyfrom the wake‘footprint'. Although biologists and engineers have begun to scratch the surface of insect and bird aeromechanics, studies offlight in bats have yet to make comparable progress. Most investigations of vertebrate flight have assumed thatani al aaerodynamics can be meaningfully approximated by assuming that bat and bird wings function in the sameway as rigid, fixed wings of large, fast, human-engineered aircraft. On this basis, a large biological literatureattempts to infer maneuverability, flight energetic, and other aspects of flight performance and ecology from simplemetrics such as aspect ratio and wing loading. Although this simple approach is a reasonable place to start aquantitative analysis of animal flight, it is clearly too simplistic. In contrast to most fixed-wing aerodynamics, batsfly at low Reynolds number (10*-10), have highly compliant aerodynamic surfaces and are characterized by highlyunsteady and three dimensional wing motions (Fig. 1).Their multiply jointed wing skeleton, thin elastic wingmembrane and several other morphological features enable these animals to exhibit extraordinary flightperformance.t.These features must be considered when trying to understand the complexity of bat flight. Inparticular, bats differ from all other flying animals in the complex functional mechanics and architecture of wings,physiological energetic of locomotion, and the kinematics and maneuverability of flight. These facts togethersuggest that the study of bat flight can be rich and productive, and lead to insights distinct from those gained throughstudy of flight in other animals. In this paper we present initial experimental data from a research program motivated by the followingfundamental questions: a) What are the aerodynamic capabilities of bats - how do they differ from that of birds and insects? What arethe quantitative aerodynamic metrics by which we can measure the animals'performance? b) We know that bats have several morphological and physiological features that are unique in the animalkingdom. What are the roles, if any, of these different features in the observed aerodynamic capabilities of bats? c) How can we model the aeromechanical behavior of the bat so that might guide engineered vehicles that takeadvantage of bats’capabilities? The data presented in this paper will be a small step trying to address primarily questions (a) and to some extent(b). We have conducted flight cage experiments with live bats and have measured their detailed kinematic motion.In addition, using PIV, we have made measurements of the wake velocity structure behind the animal as she fliesdown the flight cage. Figure 1 A bat (Cynopterus brachyotis) in flight. (a) Beginning ofdownstroke, head forward, tail backward,the whole body is stretched and lined up in a straight line.(b) Middle of downstroke, the wing is highlycambered. (c) End of downstorke (also beginning ofupstroke), the wing is still cambered. A large part of thewing is in front ofthe head and the wing is going to be withdrawn to its body.(d) Middle ofupstroke, the wing isfolded towards the body. Figure2 Schematic of the experimental setup for the measurement in the transverse (Trefftz)plane. The bat flies from left to right and triggers the acquisition sequence by triggering a beam-breaksensor. The wake is imaged in a plane behind the animal, after she has passed through. Figure 3Sequences of images from one high speed video cameras mounted on the test section floor. The bat isflying towards us. The shoulder, sternum, hip bone, and one wing have been marked with reflective markers. Thesemarkers are clearly seen when the wing is fully open. During the downstroke, the wing is fully open and stretchedout to get maximum lift. During the upstroke, the substantial bending ofelbow, wrist, and finger joints is evident. II.Experimental Setup All experiments were performed in an enclosed flight cage located at the Concord Field Station of HarvardUniversity. The flight cage is 8 m long with a cross sectional area of approximately 1 m (width) ×2 m (height).Lesser short-nosed fruit bats, Cynopterus brachyotis, were the subjects of all tests. Native to many forested areas ofSoutheast Asia, 20 captive-bred individuals have been loaned to us by the Lubee Bat Conservancy, a bat researchand conservation organization based in Gainesville, Florida. All bats are female, eliminating any variation due todifferences between the sexes.Four were selected as test subjects based on their consistent flight behavior andcooperation during training sessions and experiments. Previous studies have found that the forward flight speed ofbats vary with body size and mass across species (Winter). In the flight cage, the average forward speed of batsrange from 2 to 3 m/s, somewhat slower than their preferred flight open range flight speed. The animals used in thisstudy had a body mass of approximately 40 grams and wingspans of approximately 40 cm. A top view and a side view of the experimental setup are illustrated in Fig 2. The bat flies through the flight cage(from left to right). Her body and wing movements are captured by a pair of Redlake high-speed, low-light sensitivevideo cameras (MotionScope PCI 1000, operating, at frame rate 500 s). Both cameras are positioned on the floorlooking upwards with advancing and receding angles. The twin camera arrangement allows for the acquisition of thecomplete three-dimensional motion of the bat. Low light conditions were preferred because the bats are nocturnaland PIV measurements require a reduced light condition. As the bat flies through the flight cage, it trips a laserbeam-break sensor which initiates the data acquisition sequence. After a pre-set delay (typically 300 ms, calculatedto allow the bat to pass through the measurement volume) the wake flow is illuminated by a sequence of laser pulsesusing a pair of Nd:YAG lasers (5 ns, 150 mJ/pulse, typically 1000 us between adjacent images, 200 ms betweenadjacent image pairs). The laser beam is guided through a series of optics and finally spread out as a laser sheetfrom the flight cage ceiling. The test section is seeded with a light mist of micron-sized aerosol particles generatedby a custom-built Laskin nozzle fog generator (Kahler). The motion of the tracer particles is captured by a pair ofhigh-resolution CCD cameras (LaVision FlowMaster3 system, image size 1376×1040). Both PIV cameras aremounted on a frame and their heights are adjusted at the level of the bat’s flight. The velocity field is then extractedusing standard 3D stereo PIV procedures from the pair of images (using LaVision PIV software).By piecingtogether several image pairs captured from the wake as a function of time, a complete portrait of the wake flowbehind the animal can be acquired. As shown in Fig. 2, the x-axis is defined as the bat’s flight direction, the y-axis is the transverse direction towardto the bat’s left, and the z-axis is the vertical direction. The origin of the coordinate system is defined as the pointwhere the bat’s sternum (approximately its center of mass) passes through the laser sheet. A. Straight Flight Kinematics Fig. 3 shows eight images taken from one of thehigh-speed camera sequences. The bat has beenmarked using reflective tags to key locations on thebats body and some of the wing joints. The sequencesrecord one whole wing beat. From the video record,one can clearly see the highly articulated motion of thebat, in complete contrast to the relatively simpleflapping motion of the birds and insects. More thantwo dozens independently controlled joints in the wing(Swartz, Vaughan) and highly deforming bones(Swartzenable the bat to fly at either positive ornegative angle of attack, dynamically change wingcamber, and create complex 3D wing topology toachieve extraordinary flight performance. Postprocessing of the high speed videos (using customwritten MATLAB software) yields the unsteady three-dimensional motion of the entire wing-body system.Fig. 4 shows one example of such a result on wingtipmovements relative to the sternum. The red symbolsare those measured from the stereo video record whilethe green symbols on the orbit indicate points thathave been interpolated due to obstruction of themarker point. The top view indicates that the wingtipoutlines a circle during the downstroke,similar tothat of birds and insects. During upstroke, however,the wingtip path is a complex curve. The wingtip isfirst brought very close to the body. It is thenextended away from the body, and at the end of theupstroke it is slightly moved toward the body again.The side view shows the wingtip moves diagonallyfrom behind the sternum toward the head and from Figure 4 An example of wing tip motion. Shown are atop view (streamwise versus transverse position) and sideview (streamwise versus vertical position) of the leftwingtip position for a single run, and a diagrammaticdepiction of the wingtip motion represented by the plots.The red circles indicate the data obtained from reflectivemarkers. The green dots are data by interpolating becauseof the markers are not visible. The blue dots represent theposition of the sternum. The diagrams of the bat representthe related position and direction of movement of thewingtip shown in the plots. above the sternum to below the sternum during downstroke. The wingtip position is above the sternum for mtheajority of the wing beat. Both views show the wingtip position changes more abruptly as the bat begins thedownstroke and starts to extend the wing away from the body. The transverse path of the wingtip is smootherduring both the downstroke and upstroke than the vertical path because the digitizing uncertainty in verticaldirection is higher. The time course of typical wing tip movement relative to the center of mass is shown in Fig. 5a. Fig. 5b showsthe bat’s flight speeds in forward and vertical directions. The original data obtained from videos are sternumpositions varying with time. The flight speeds are calculated by taking the derivative of the sternum position. Thederivative is calculated by fitting a quadratic polynomial using a local template (a size of 15 points was selected inthis paper.) The wingbeat frequency and amplitude were derived from fitting a harmonic sine series to the wingtip positions: where F is the overall wing tip position, C and B are two constants representing the linear trend (for example if theanimal is ascending or descending during the acquisition), t is time, N is the number of Fourier modes, A; isamplitude of each mode, w is the wing flapping frequency f=,and d is2兀 the phase offset. Note that a single frequency is used for all the Fourier modes although each mode is allowed a unique amplitude and phase. Theoptimal number of Fourier modes, N, was determined by fitting errors. The error was defined as the root-mean- (a) Wingtip positions (b) Flight speeds of the bat Figure 5Typical kinematics from bat flight measurements. The left frame shows vertical and forward wing tippositions relative to the center of mass while the right frame shows the bat flight vertical and forward speeds. Thered circles and blue squares are the original data. The solid lines are fitting lines based on Eq. 1. We’re missingunits on the v axes- Phase difference, degree Figure 6 Strouhal numbers, calculated from thekinematic data based on the vertical wingtip amplitudeand halfwingspan, respectively. fA/U is centered around0.25 which falls within the range of 0.2 < St <0.4 givenby Taylor et al for cruising flight.. fb/U is centeredaround 0.7, which means in every wingbeat the bat flies adistance ofb/0.7. Figure 7 Phase relationships. Wing tip verticalmovement (red), vertical flight speed (blue), andforward flight speed (green), all relative to the wingtip horizontal movement. The phase shift in wing tipvertical movement is about -180 degrees. It is -90degrees and -270 degrees in the forward speed andvertical speed, respectively. square deviation between the experimental data and the analytical fit. Typically, this error decreased fromapproximately 5% of the peak-to-peak amplitude (N=1) to less than 1% (N>4). N=4 was used for all fittingpresented here. Using this technique, wing beat frequencies ranged between 7.8 Hz and 10.2 Hz over a total of 67 runs, with anaverage of 8.81±0.45 Hz. The Strouhal number is often used to describe the wing kinematics of flying animals: where St is Strouhal number, Ais amplitude of the wing tip vertical movement which is a half of the distancebetween the lowest and highest wing tip position, b is the half wingspan, U is mean forward speed. Fig. 6 shows thehistogram of Strouhal number. The Strouhal number based on wing amplitude, fA/U, ranges from 0.14 to 0.44 withamean value is 0.25±0.07. The Strouhal number based on half-span, fb/U, ranges from 0.54 to 1.17 with a mean Figure 8 Turning kinematics. The left frame shows the location ofthe sternum during a 180 degree turn.The bat flies in from the left, rises, turns and flies out again. Views from the top and the side are shown on theright side, in the upper and lower frames respectively. Red symbols indicate every 5" data point, green circlesare interpolated points where the sternum marker was obstructed from one or both of the camera views. value is 0.7±0.09. All bats used in the tests have been trained to flystraight and fly from one end of the flight cage to the other end.During experiments, however, the bat sometimes flew slightly up tothe ceiling or turned to the side walls. Both the wing flappingmotions and flight speeds change when the bat prepares a turn or astop. The wingtip movements and wingbeat frequency also varybetween individual bats. The effects of these variations are beyondthe scope of the current paper. Fig. 5 illustrates that while the bat flight speed is not constant, itis clearly synchronized with the wing motion. The wing motion inthe horizontal plane is largely sinusoidal. However the tip motionin the vertical plane (z) illustrates a higher harmonic of somestrength, contributing to the "kink" in the motion during theupstroke (when the animal retracts its wings). The lift or thrusttforce generated by the wing flapping must have the similar periodicvariations.S.Using simple dynamics, we know that a motiongenerated by a sinusoidal force will exhibit a velocity 90 degree outtof phase with the force. This is confirmed in Fig. 7, which showshistograms of phase differences (referenced to the horizontal wingtip motion) of the animal's velocities and wing tip verticaldisplacement. Consistent with figure 5, we see that the vertical tip movement (red) is 180 degrees out of phase withthe horizontal movement. In addition the vertical flight speed (blue) appears to lag the horizontal wing movementby 270 degrees, or more intuitively, to lag the vertical wing displacement by 90 degrees. Similarly, the axial speed Figure 9 Heading and heading rate during1l180)cdegree turn. Heading,1isthe anglebetweenthe bat flight directionandforward x-direction. Heading rateeischange of the heading, calculated from theheading data. (green) lags the horizontal movement by 90 degrees. B. Turning Kinematics We have also acquired some preliminary kinematics for 180 degree turns. Bats are extraordinarily agile, andthese measurements represent some of the first detailed measurements of bats during these extreme maneuvers.Fig. 8 shows the trajectory of the bat’s center of mass during a 180 degree turn. The raw marker positions areshown in the three coordinate axes. As before, green symbols indicate the points that have been interpolated due tomarker obstruction. From a purely aerodynamic perspective, the performance of this turn is very impressive. Thebat flies in and turns back in a very narrow space (less than a half of its wingspan) and accomplishes the turn withinthree wing beats (T=2-5). In order to do this, she rises, turns and drops back down as she flies out in the oppositedirection, regaining her incoming velocity almost immediately. Fig. 9 shows the bat heading and heading rateduring the 180 degree turn. When t/T is greater than 2, the heading slowly changes and the bat prepares for a turn.After t/T=3.5, the heading increases in a faster rate and the bat finishes the turn after t/T=5. The major part of theturn is finished in less than 2 wing beats. C. PIV Data Analysis Fig. 10 shows a series of wakevelocity fields from thee transverse(Trefftz) plane..The measurementplane is on the left side of the bat, withthe coordinate origin centered on theposition of the sternum as it pieced thePIV imaging plane. It is evident thatthere isa strong wing tip vortexgenerated by the bats flight. Thevortex decays in strength, and advectsdownwards. Since the vortex is welldefined.the vorticity can bedetermined based on Stokes’theoremfrom calculation of the circulation,T,via contour integration normalized bytheaareaeenclosed by thecontourcomposeddof differential elementsdrll: (3). The integration is performed alongthe edges of 1x1 square interrogationwindows using the velocity values atthe square’ss vveerrttiicces. Thisvorticitycalculationissperformedwithno Figure10Typical wake velocity fields from PIV images. The origin(y/b=0, z/b=0) is the point where the center of mass pierced the PIVplane. EFor this case, the bat passed above the PIV plane. Thebackground of each frame is vorticity field. The darker the color, thestronger is the vorticity. Blue indicates positive vorticity and redindicates negative voticity. There is a 200 ms separation betweensuccessive PIV images. oversampling of the interrogation windows. This method is used to attenuate the effects of measurement noise onthe vorticity field by employing more points for its calculation. The majority of the flow fields measured in this series of experiments exhibit a complexity which makes the taskof defining the vortex core difficult. As shown in Fig. 10, within the main core itself, there exist smaller vorticalstructures of opposing vector directions. Therefore one cannot simply define the vortex cores as connected regionsof vorticity of the same sign. Thus, an alternative method of defining the vortex core was devised to accommodatethese nuanced structures so that the circulation could be estimated from these data. The circulation was only calculated for data similar to Fig. 10 where it was visually apparent that a vortex waslocated in the measurement plane. According to Eq. (3), the circulation of a region can be calculated by integrationof the velocity along the contour that is the boundary of this region. For simplicity, this analysis employed circularcontours in the circulation calculations. To find the“center"of the vortex core a rectangular region was manuallyselected, via visual inspection, with care taken to enclose the majority of the main flow structure. The centroid ofvorticity within this rectangular interrogation window was then calculate and was defined as the “center” of thevortex core. This location served as the point about which a series of integrations about concentric circular contoursof increasing radii were performed to determine the magnitude of the circulation as a function of area enclosed.Utilizing the condition that the flow outside of the vortex core is irrotational, the vortex core was defined to be theregion within which the circulation reaches a maximum (Fig. 11). Although the flight is clearly unsteady, we canuse the Kutta-Joukowski theorem for steady flight as an estimate of the lift per unit span : Figure 11 Circulation inside tip vortex. Thecirculation rises through11thee vortex core beforereaching an approximately constant value of0.25. Figure 12 Schematic reconstruction of wakegeometry. Wake images are at constant distancedownstream ofthe bat. The darker the vortex color, thestronger is the vorticity. Where L is lift per unit span, p is air density. Based on the maximum circulation calculated here, the total lift canbe approximately estimated as 0.24 N, which, at the measured flight speed (2 m/s) should be able to support a massof 25 gram. This is comparable to, but underestimates, the measured mass (~40g), but is, at least, in the rightneighborhood, considering the simplicity of this argument. Clearly more detailed measures of the circulation and itsrelationship to the true momentum balance need to be performed, although this is not possible with the slow rate ofvelocity field acquisition (5Hz, or every two wing beats) that was available to us for this first set of experiments. Each PIV acquisition sequence is, however, accompanied by the complete kinematic history of the flight. Thisenables features identified in the wake structure to be associated with specific wing/body motions. It is a challengeto couple the PIV and 3D kinematic data becauserunsdiffer in flight speed and trajectory. To achievemeaningful data synthesis, we first adjust the coordinate origin and normalize velocity. As mentioned earlier, thecoordinate origin is defined as the point where the center of mass passes the PIV plane. The velocity field is thennon-dimensionalized by the flight speed associated with each particular acquisition. Each run is then rearranged andcollated based on the wing beat phase angle. In this manner, we are able to determine the location of the vortex corerelative to the bat as well as the relative wing location with respect to the wingbeat cycle as it moves through thePIV plane. Accordingly, we can reconstruct a "cartoon" of the wake shed by the bat as it moves through itswingbeat. Our first attempt at this reconstruction is shown in Fig. 12, although it should be emphasized that this ishindered by a rather small set of realizations available in the ensemble. The main trailing vortex structuresdeposited by the bat on the downstroke closely follow the wingtip trace as one might expect. But, in the case of theupstroke the vortices shed appear to fall outside of the wingtip trace. On the upstroke, the animal folds its wings intowards the body to the point where the wingtips may no longer be the outermost extension of the bat. Therefore, thewake pattern suggests that these upstrokevortices are most likely shed from another location along the folded wing,possibly the wrist joint. More work is needed to validate and to amplify on this proposed wake pattern.1. IV7.. Conclusions Experiments have been performed to capture the coupled kinematics and wake velocities of bats.TThekinematics data reveal that, at the relatively low flight speeds considered here, that the bat has unique (I think‘rather unique’is like ‘somewhat pregnant’!) flight characteristics, quite distinct from those observed in both insectand vertebrate flight, including a quite dramatic drawing-in of the wing during the upstroke compared to the fully-extended sweep that characterizes the downstroke. In some respects it is almost like the animal is "rowing" ratherthan flying! Measurements have also characterized maneuvering flight, in particular a 180 degree turn which the batexecutes in an extraordinarily compact and fast manner, exhibiting turn rates exceeding 200 degrees/sec. The kinematic data also show that the bat flight speed and elevation are not constant, but are closely synchronized withwing horizontal and vertical motion. The PIV data, though preliminary, indicate strong wing vortices and a complexvortical wake structure, although these need to be verified and explored further. Preliminary wake geometry issuccessfully reconstructed. The experiments presented in this paper represent the first detailed measurements on both kinematics and wakevelocities of bats and while encouraging, are still lacking in both quantity and quality. Improvements in theequipment (higher resolution high-speed cameras, higher frequency PIV system, etc.) are currently beingimplemented, and further experiments will yield more insights into the abilities and underlying biomechanics thatthese animals exhibit. Acknowledgments All experiments were conducted at the Concord Field Station (CFS) at Harvard University and we express ourthanks to the CFS staff, especially Andy Biewener, the director of CFS, for his support. We are also most grateful toDr Ty Hedrick for his assistance, and for the use of his kinematics digitizing code. The work is supported by the AirForce Office of Scientific Research (AFOSR), monitored by Dr.R. Jeffries and W. Larkin, NSF, and the BrownUniversity UTRA program. References Sane, S.P.,“The aerodynamics of insect flight,” The Journal ofExperimental Biology, Vol. 206, 2003,pp. 4191-4208.Spedding, G.R, Hedenstron, A., and Rosen, M., “A family of vortex wakes generated by a thrush nightinggale in free flight over its entire range of flight speeds,” The Journal ofExperimental Biology, Vol. 206, 2003,pp.2313-2344. Warrick, D.R., Tobalske, B.W., and Powers, D.R.,“Aerodynamics of the hovering hummingbird,”Nature, Vol. 435, 2005,pp. 1094-1097 “Winter, Y.,“Flight speed and body mass of nectar-feeding bats (Glossophaginae) during foraging”. Journal of ExperimentalBiology, Vol. 202, pp. 1917-1930. Swartz, S.M., “Allometric patterning in the limb skeleton of bats: implications for the mechanics and energetics of poweredflight,"J. Morph., Vol. 234, 1997, pp. 277-294. Vaughan, T.A.,“The skeletal system, in The Biology of Bats,"W.A. Wimsatt, Editor, Academic Press, New York, 1970, pp.98-139 'Swartz, S.M., Bennett, M.B., and Carrier, D.R., “Wing bone stresses in free flying bats and the evolution of skeletal designfor flight,"Nature, Vol. 359, 1992, pp. 726-729 *Swartz, S.M., et al., “Bones built to bend: In vivo loading in the distal wing of fruit bats,” Amer. Zool., Vol. 33, 1993, pp.75A "Swartz, S.M., Bishop, K.L., Ismael-Aguirrre, M.-F.,“,”Akbar, Z., Dynamic complexity ofwing form in bats: implicationsfor flight performance, in Functional and evolutionary ecology of bats McCracken, G., and Kunz, T.H., Editors, OxfordUniversity Press, Oxford,2005 Taylor G.K., Nudds, R.L., Thomas, A.L.R.,“Flying and swimming animals cruise at a Strouhal number tuned for highpower efficiency,”Nature, Vol. 425,No. 16, 2003,pp. 707-711. Batchelor, G.K., An Introduction to Fluid Dynamics, Cambridge University Press, Cambridge,England, UK, 1967.Raffel,M., Willert, C.E., and Kompenhans, J., Particle Image Velocimetry: a Practical Guide, Springer-Verlag, New York,1998. John Anderson, Fundamentals of Aerodynamics, McGraw-Hill Book Company, New York, 1984. American Institute of Aeronautics and AstronauticsCopyright C by Kenneth Breuer. Published by the American Institute of Aeronautics and Astronautics, Inc., with permission. merican Institute of Aeronautics and Astronautics
确定


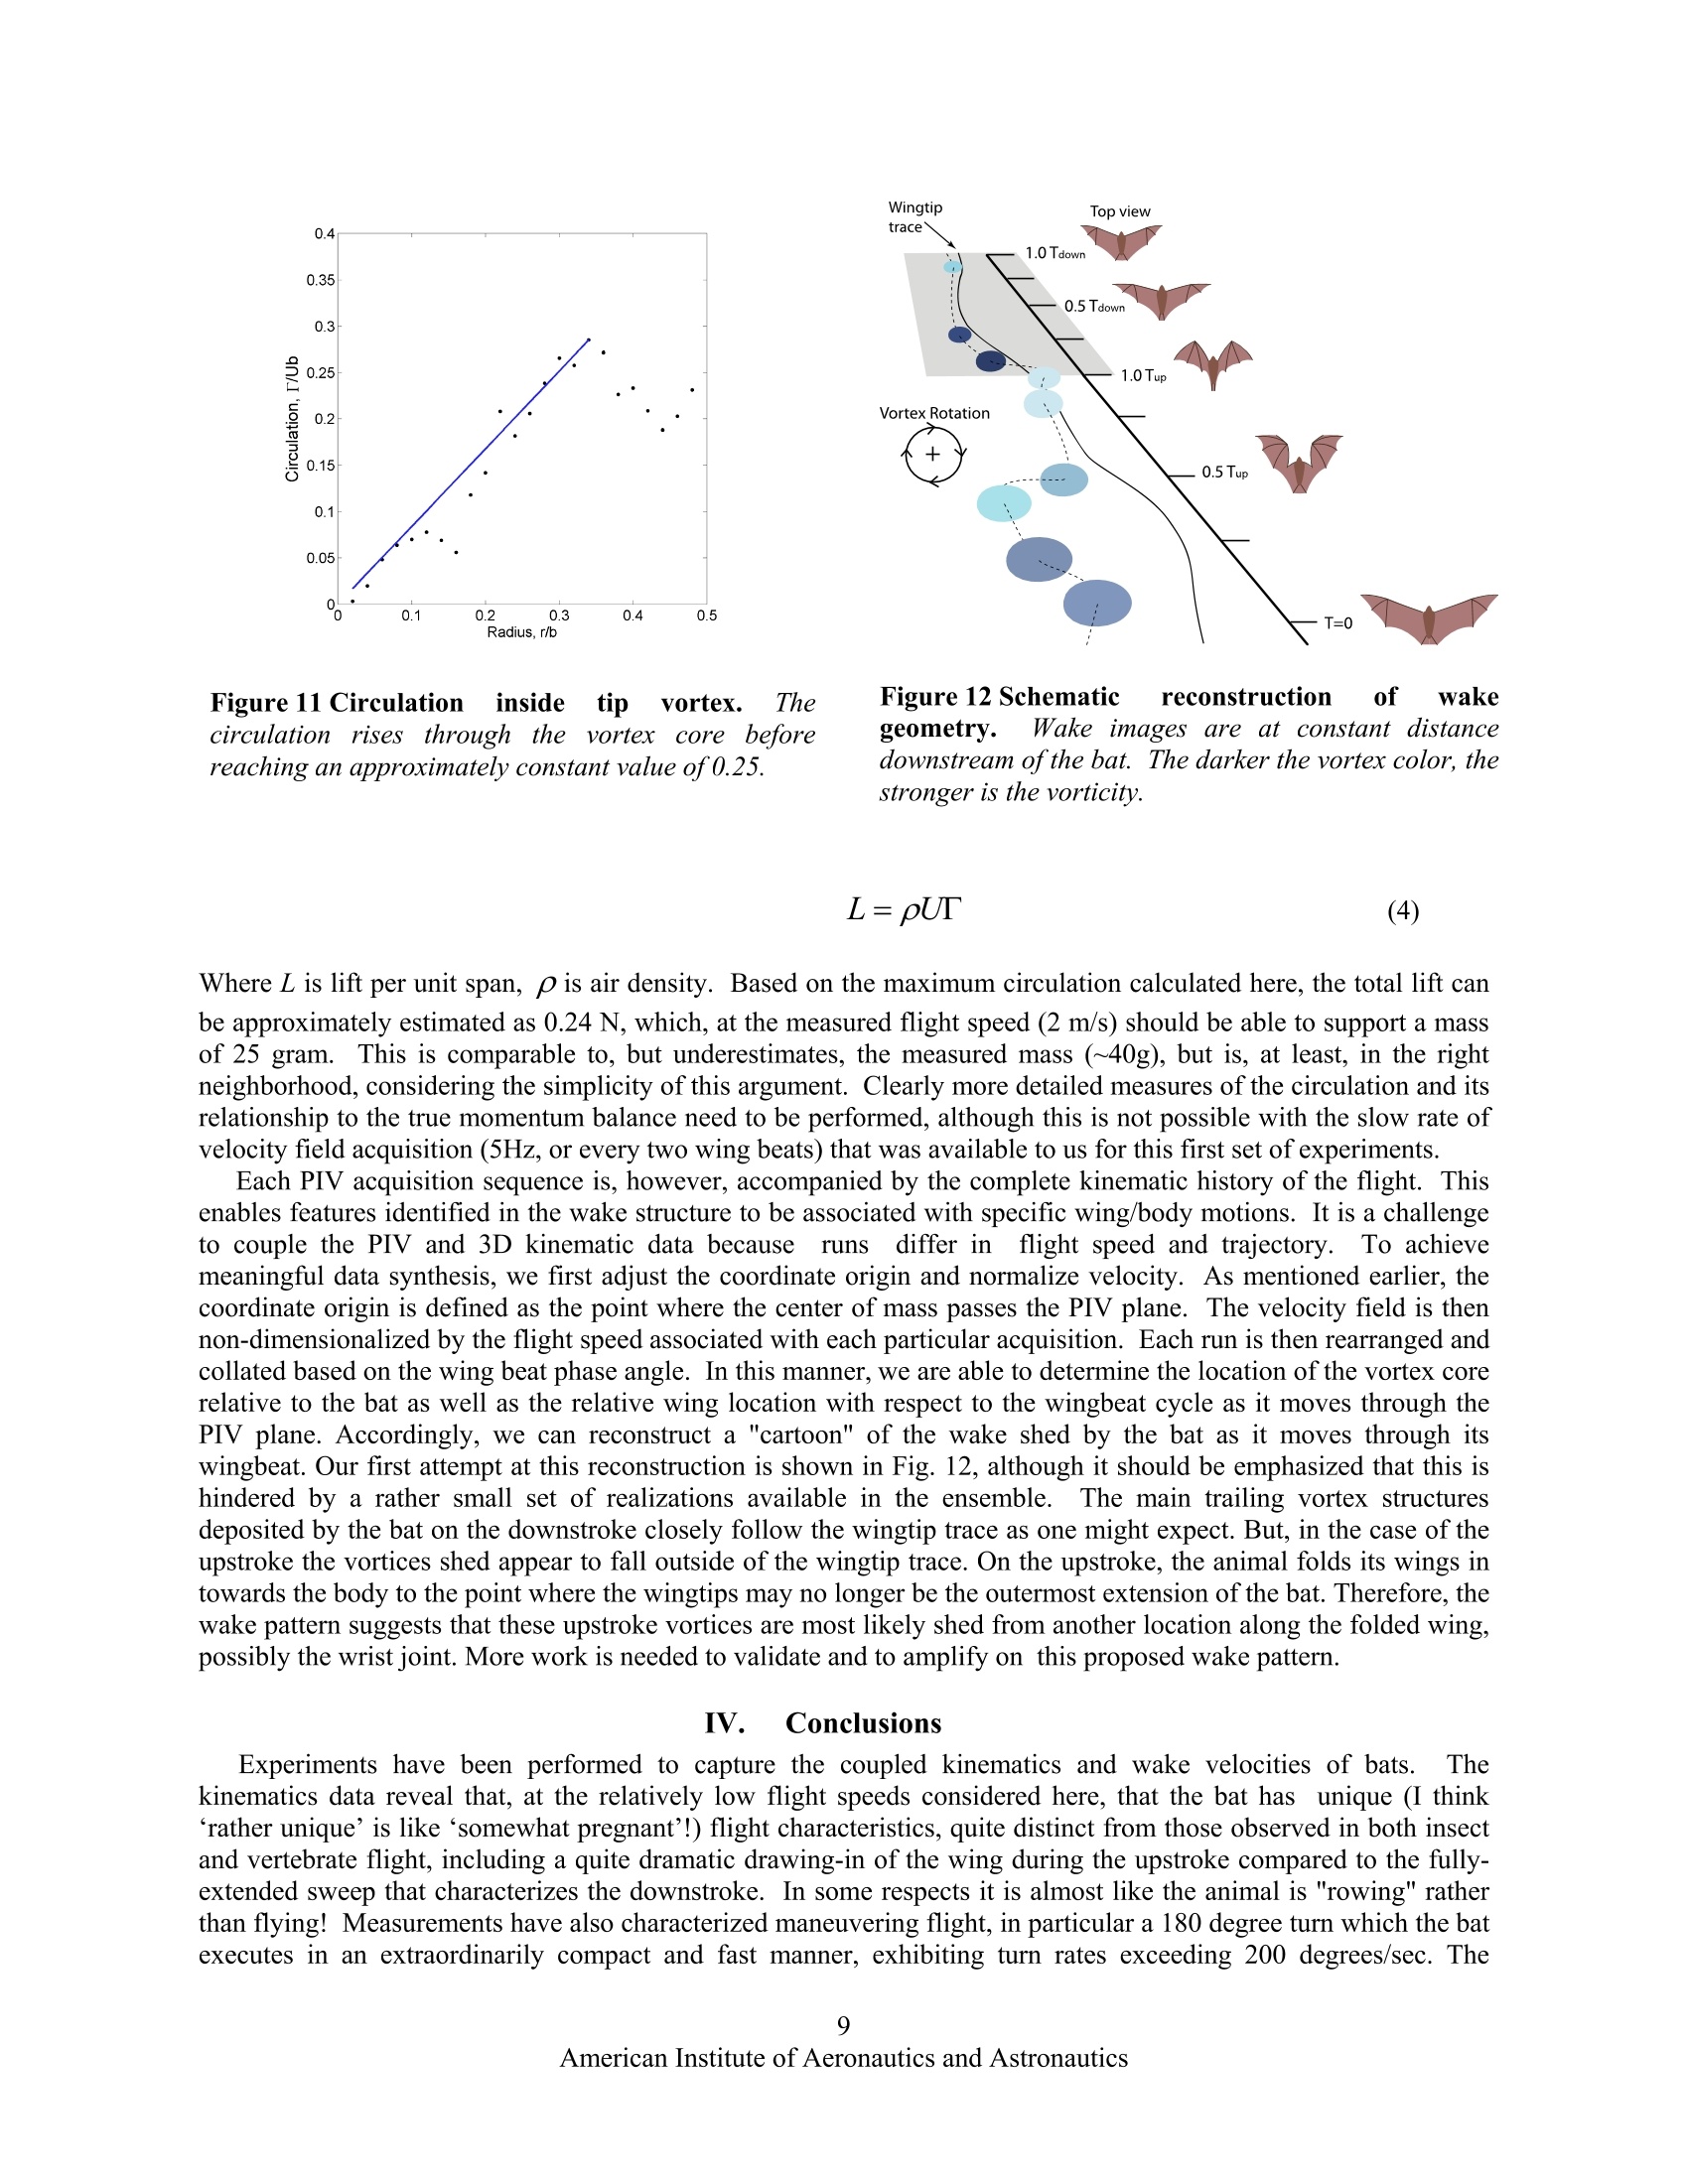

还剩8页未读,是否继续阅读?

产品配置单

北京欧兰科技发展有限公司为您提供《空气流体,蝙蝠飞行中速度矢量场检测方案(粒子图像测速)》,该方案主要用于其他中速度矢量场检测,参考标准--,《空气流体,蝙蝠飞行中速度矢量场检测方案(粒子图像测速)》用到的仪器有德国LaVision PIV/PLIF粒子成像测速场仪
推荐专场


相关方案
更多
该厂商其他方案
更多