


In an oscillation shear experiment, the material is subjected to either a sinusoidal strain or stress and the corresponding response is measured. The ratio of the output and input signals is referred to as the transfer function or material function (Figure 1). When a sinusoidal deformation or deformation rate is applied, the material’s response is the stress. The resulting material function is either the modulus or the viscosity; if a stress is applied and the strain measured, the material function is the compliance.
方案详情

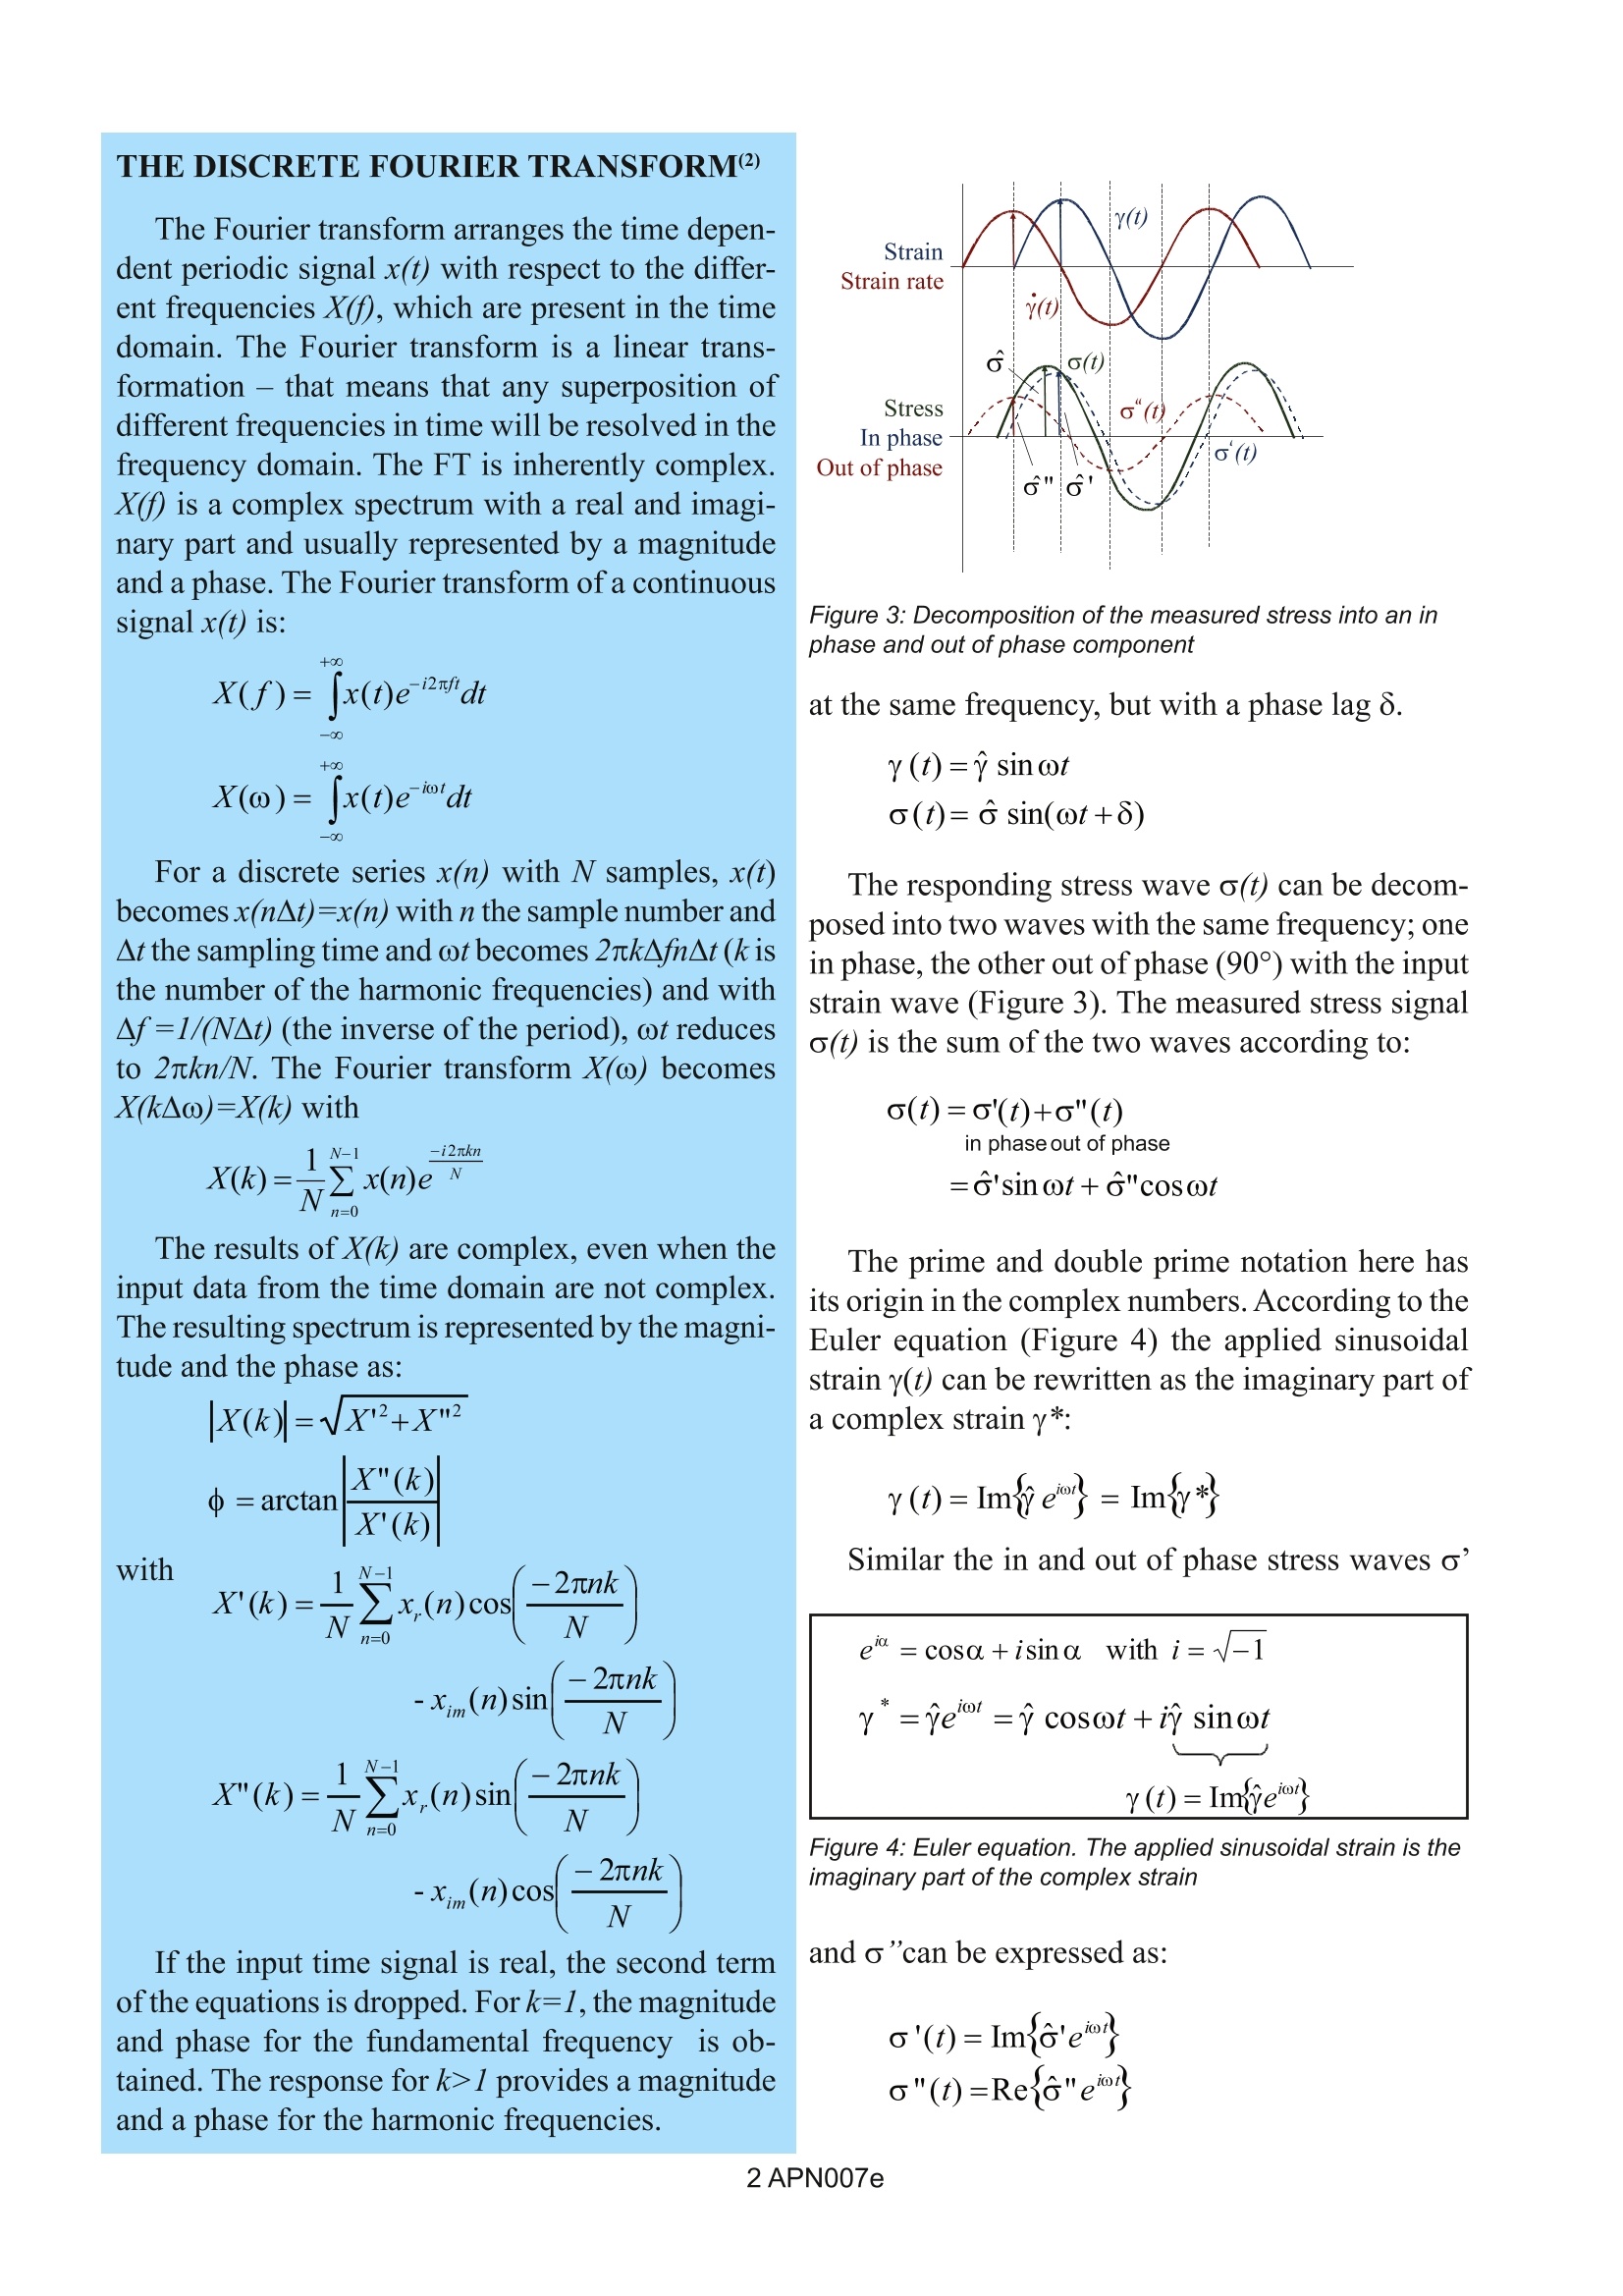
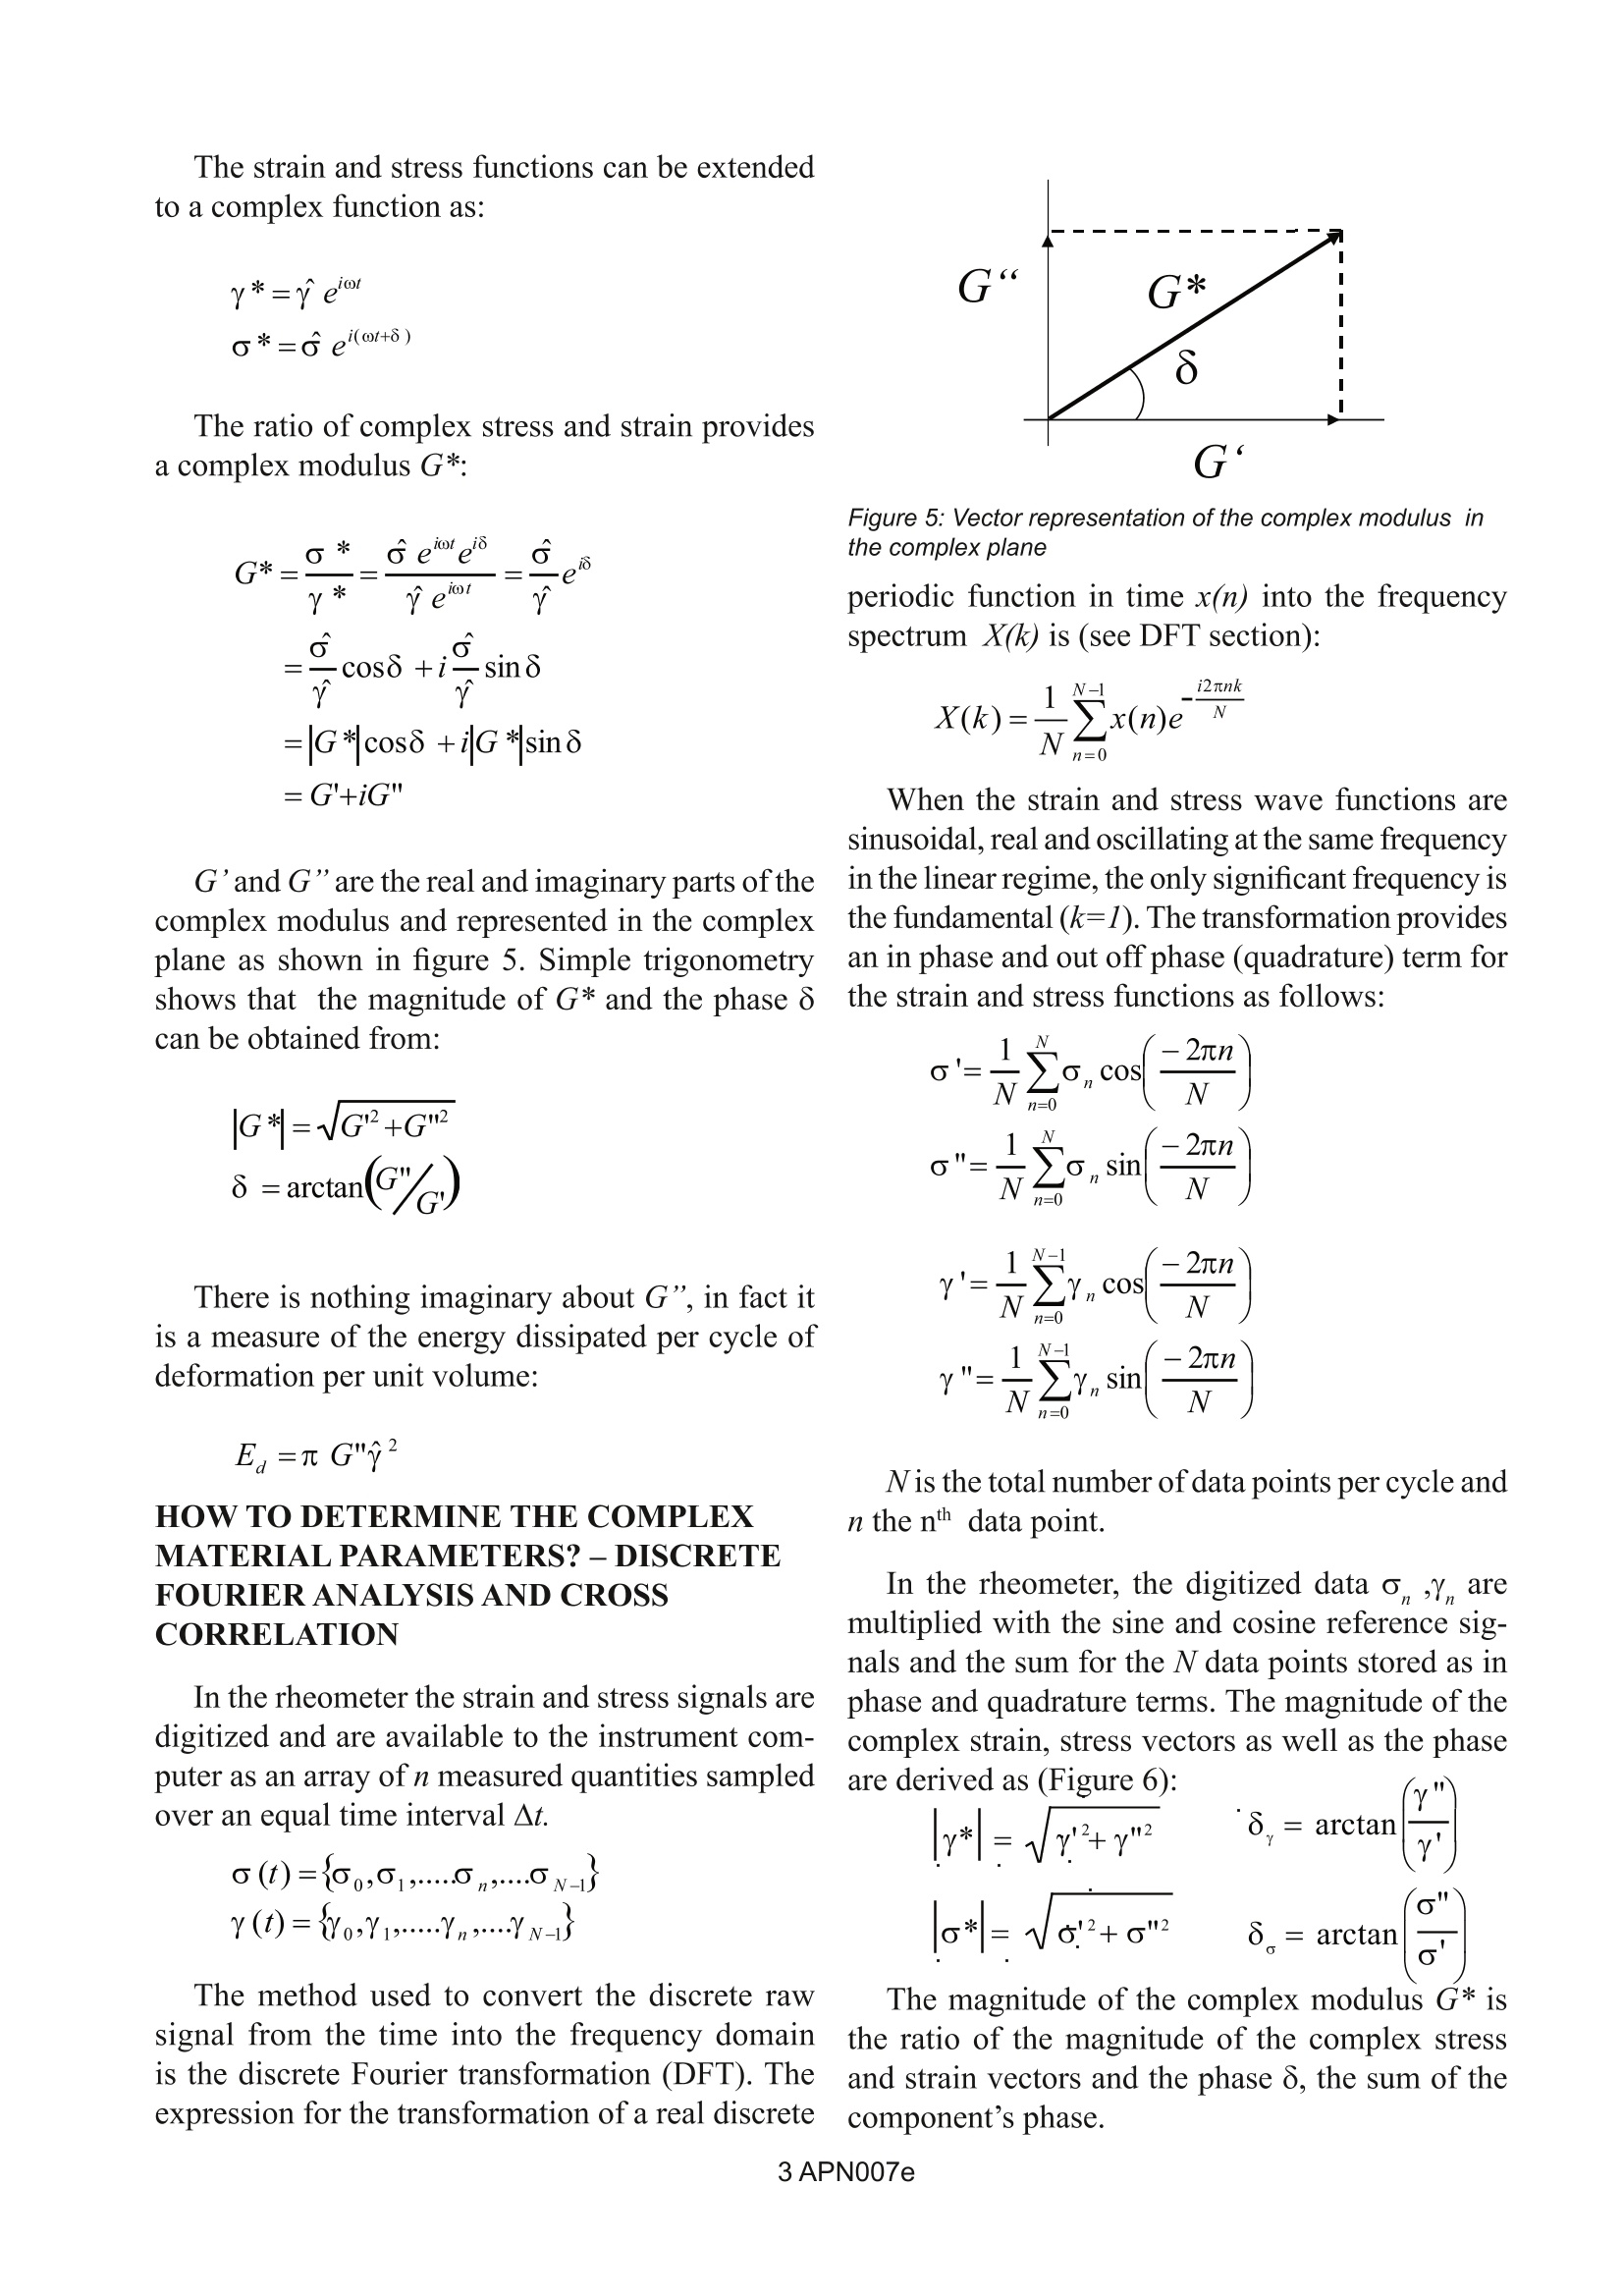
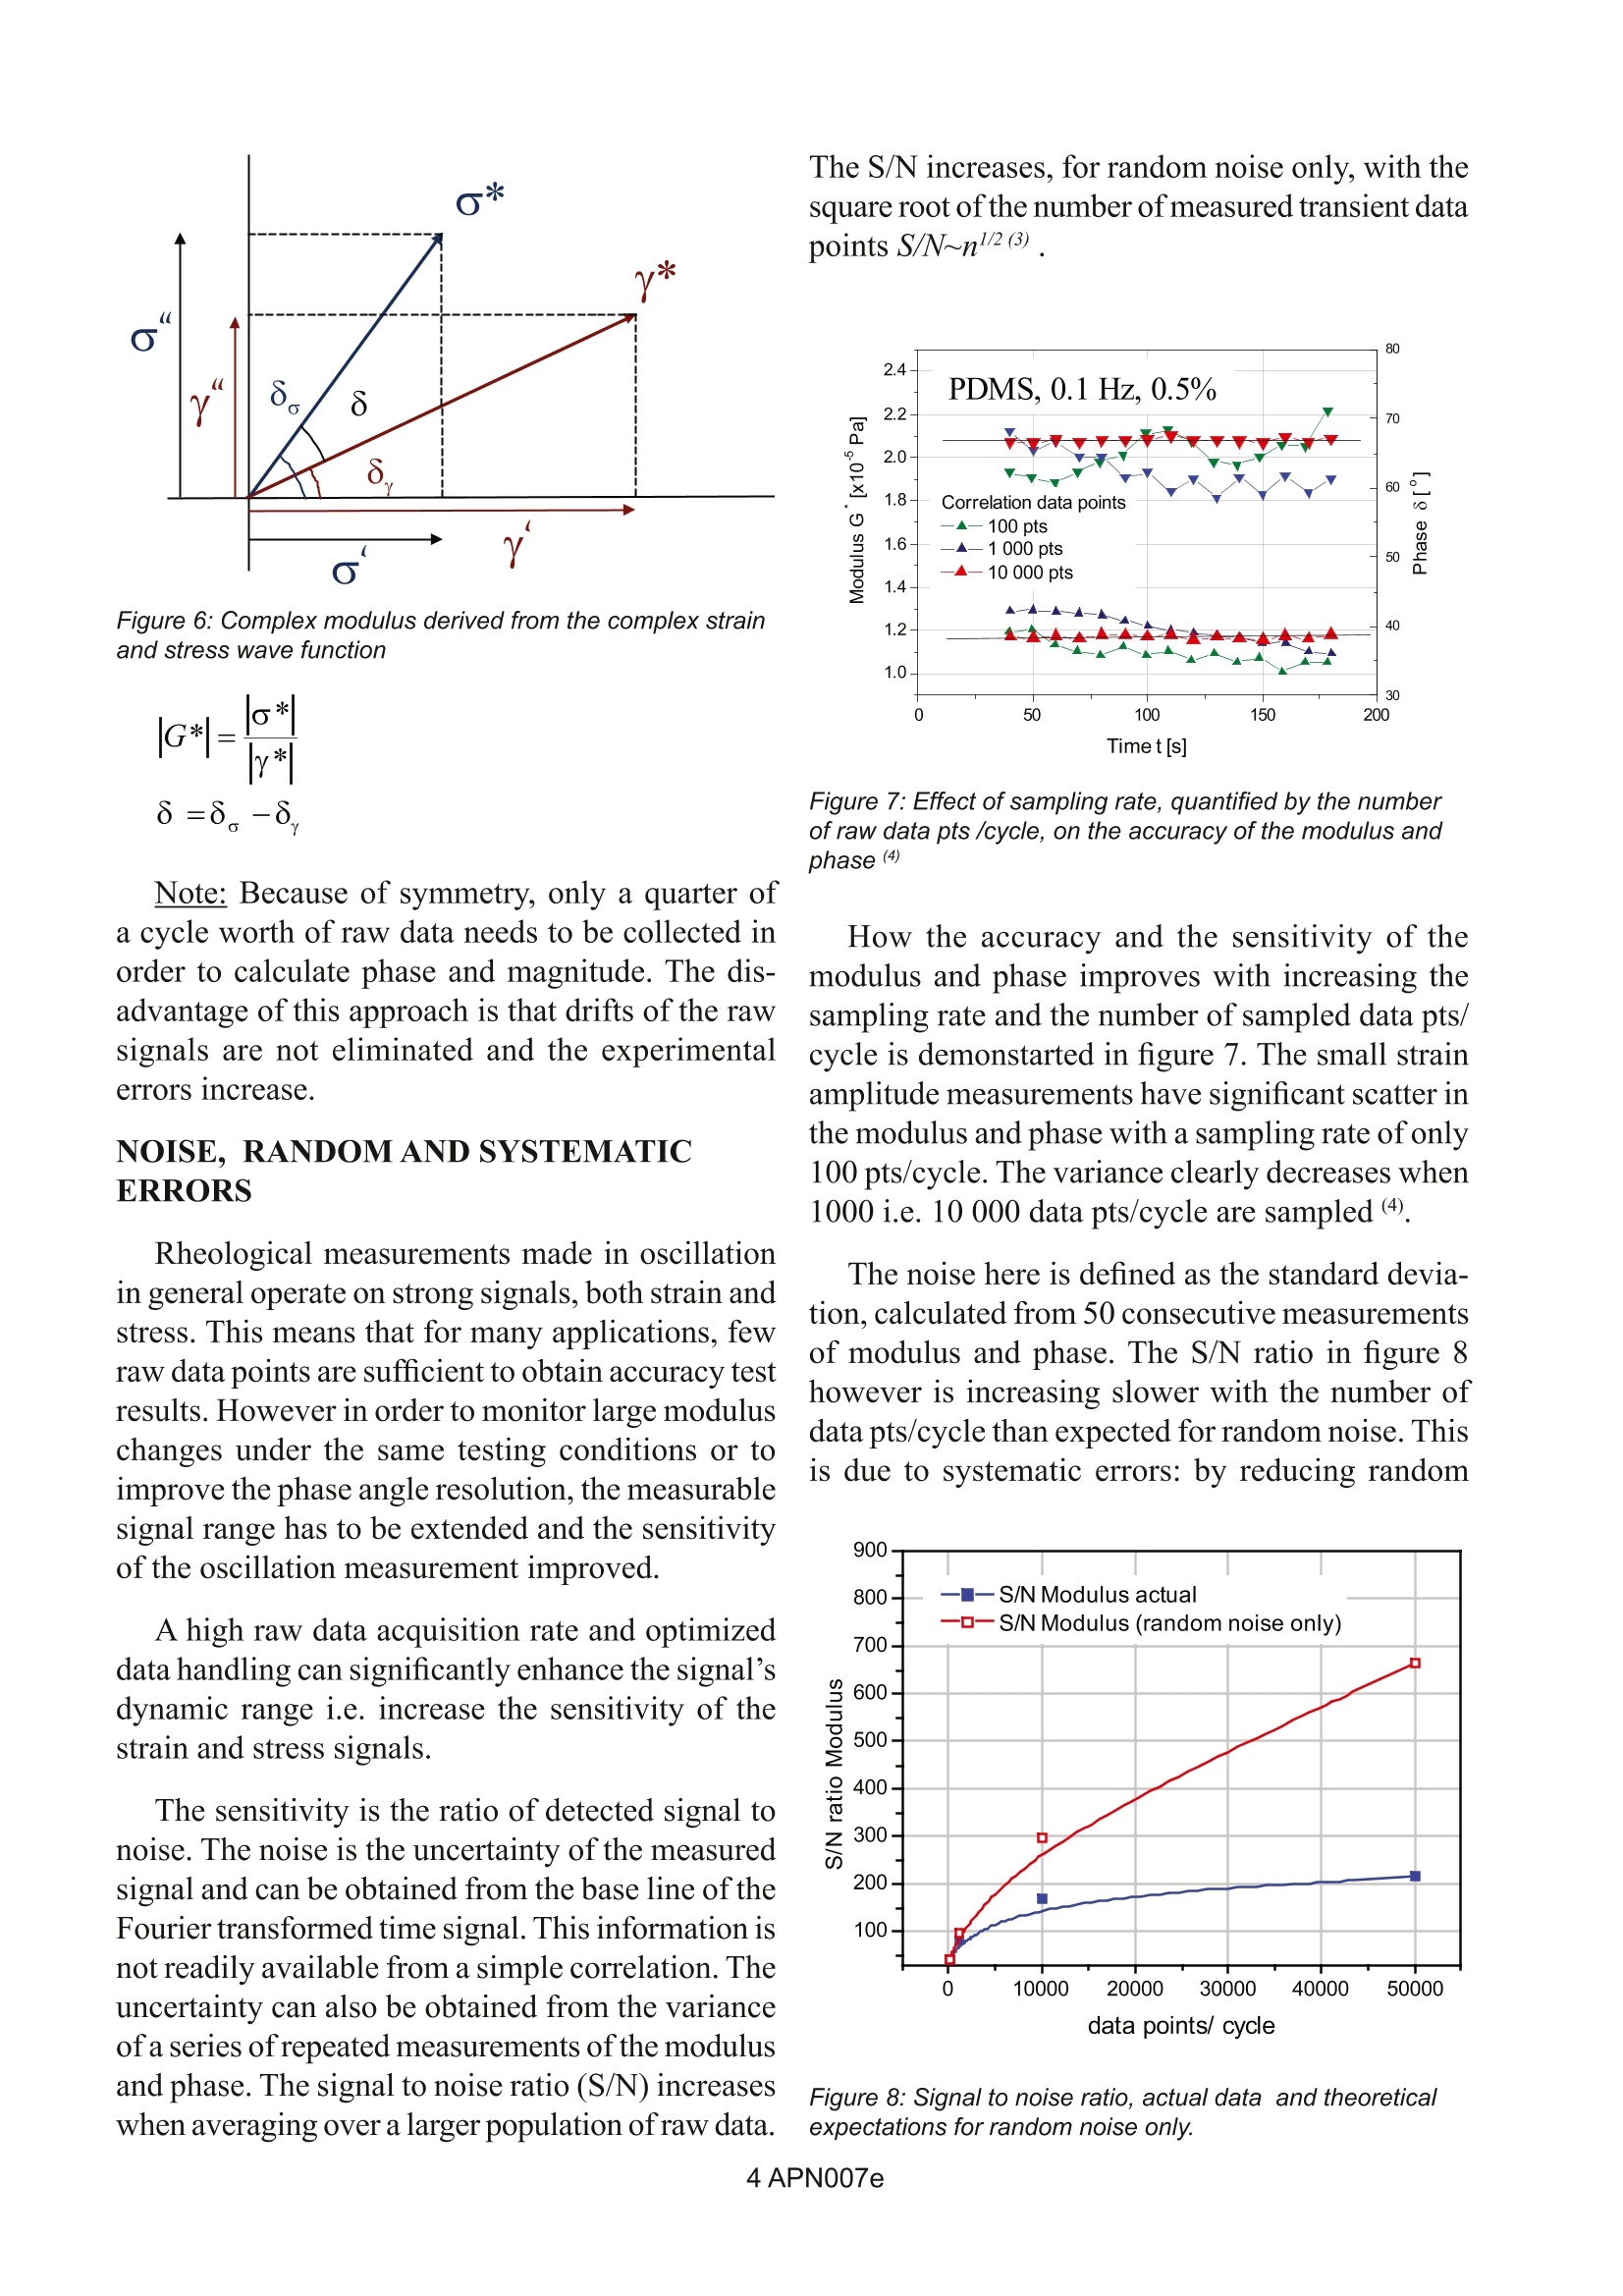
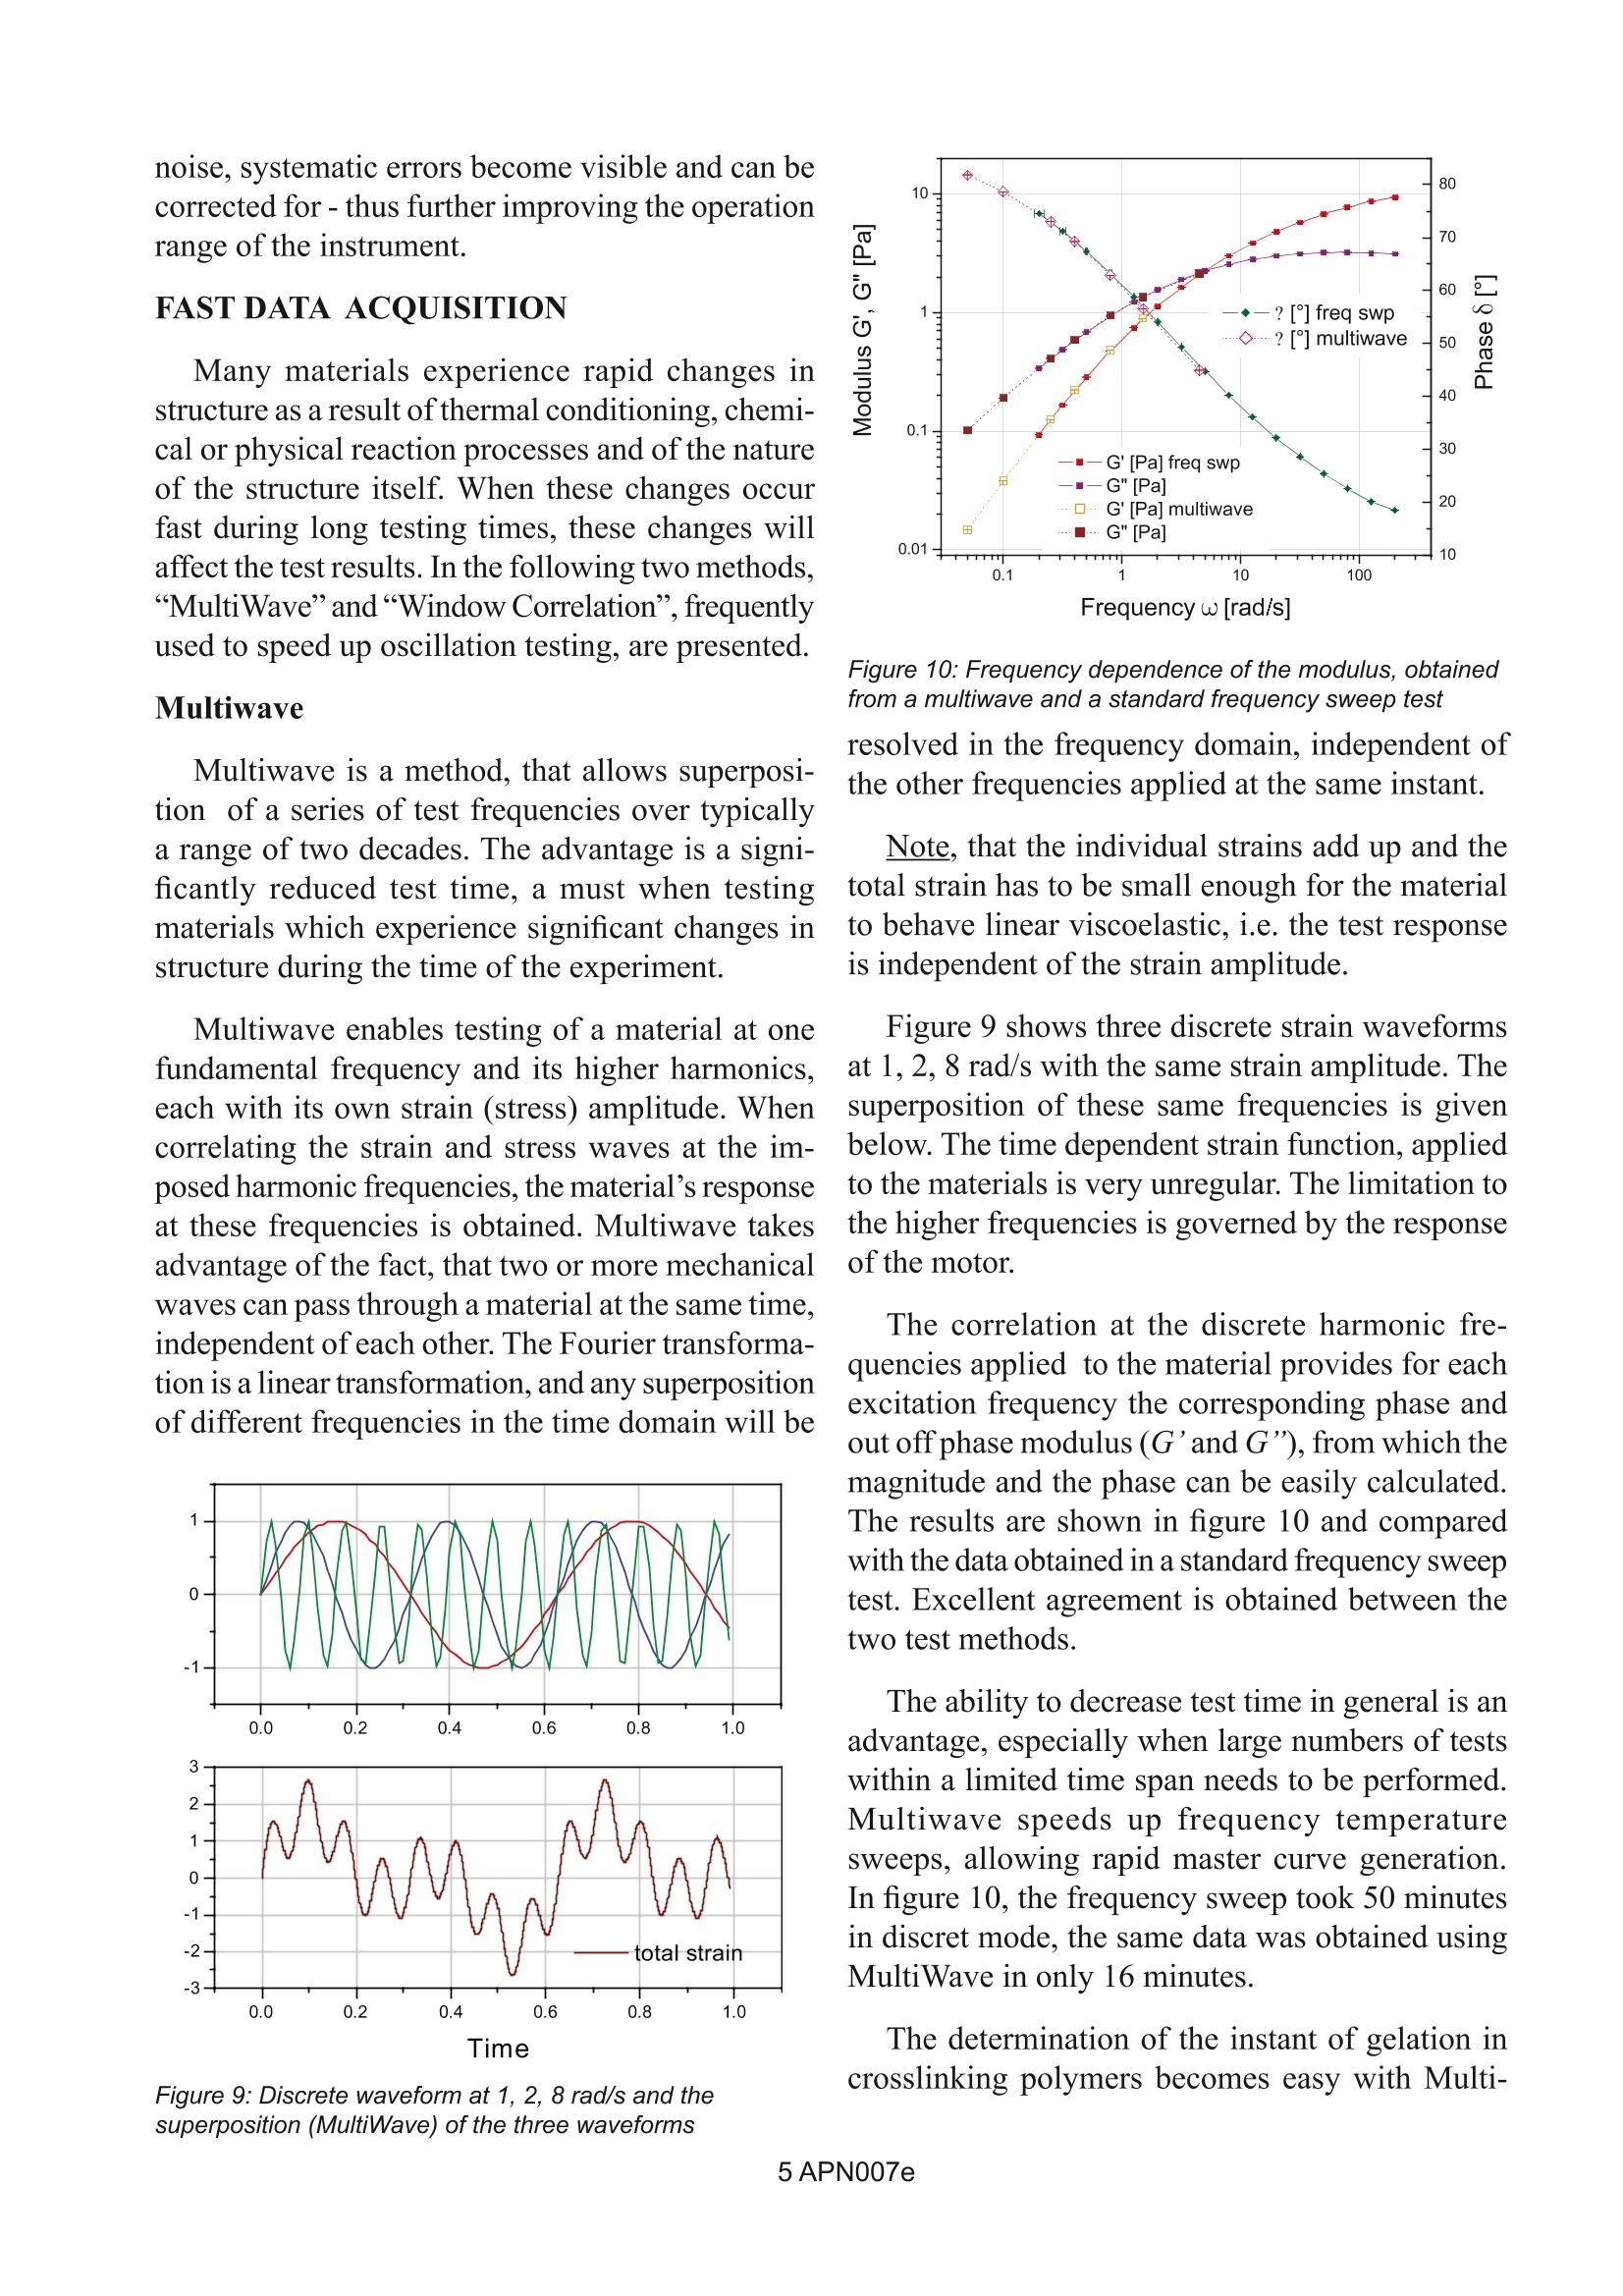
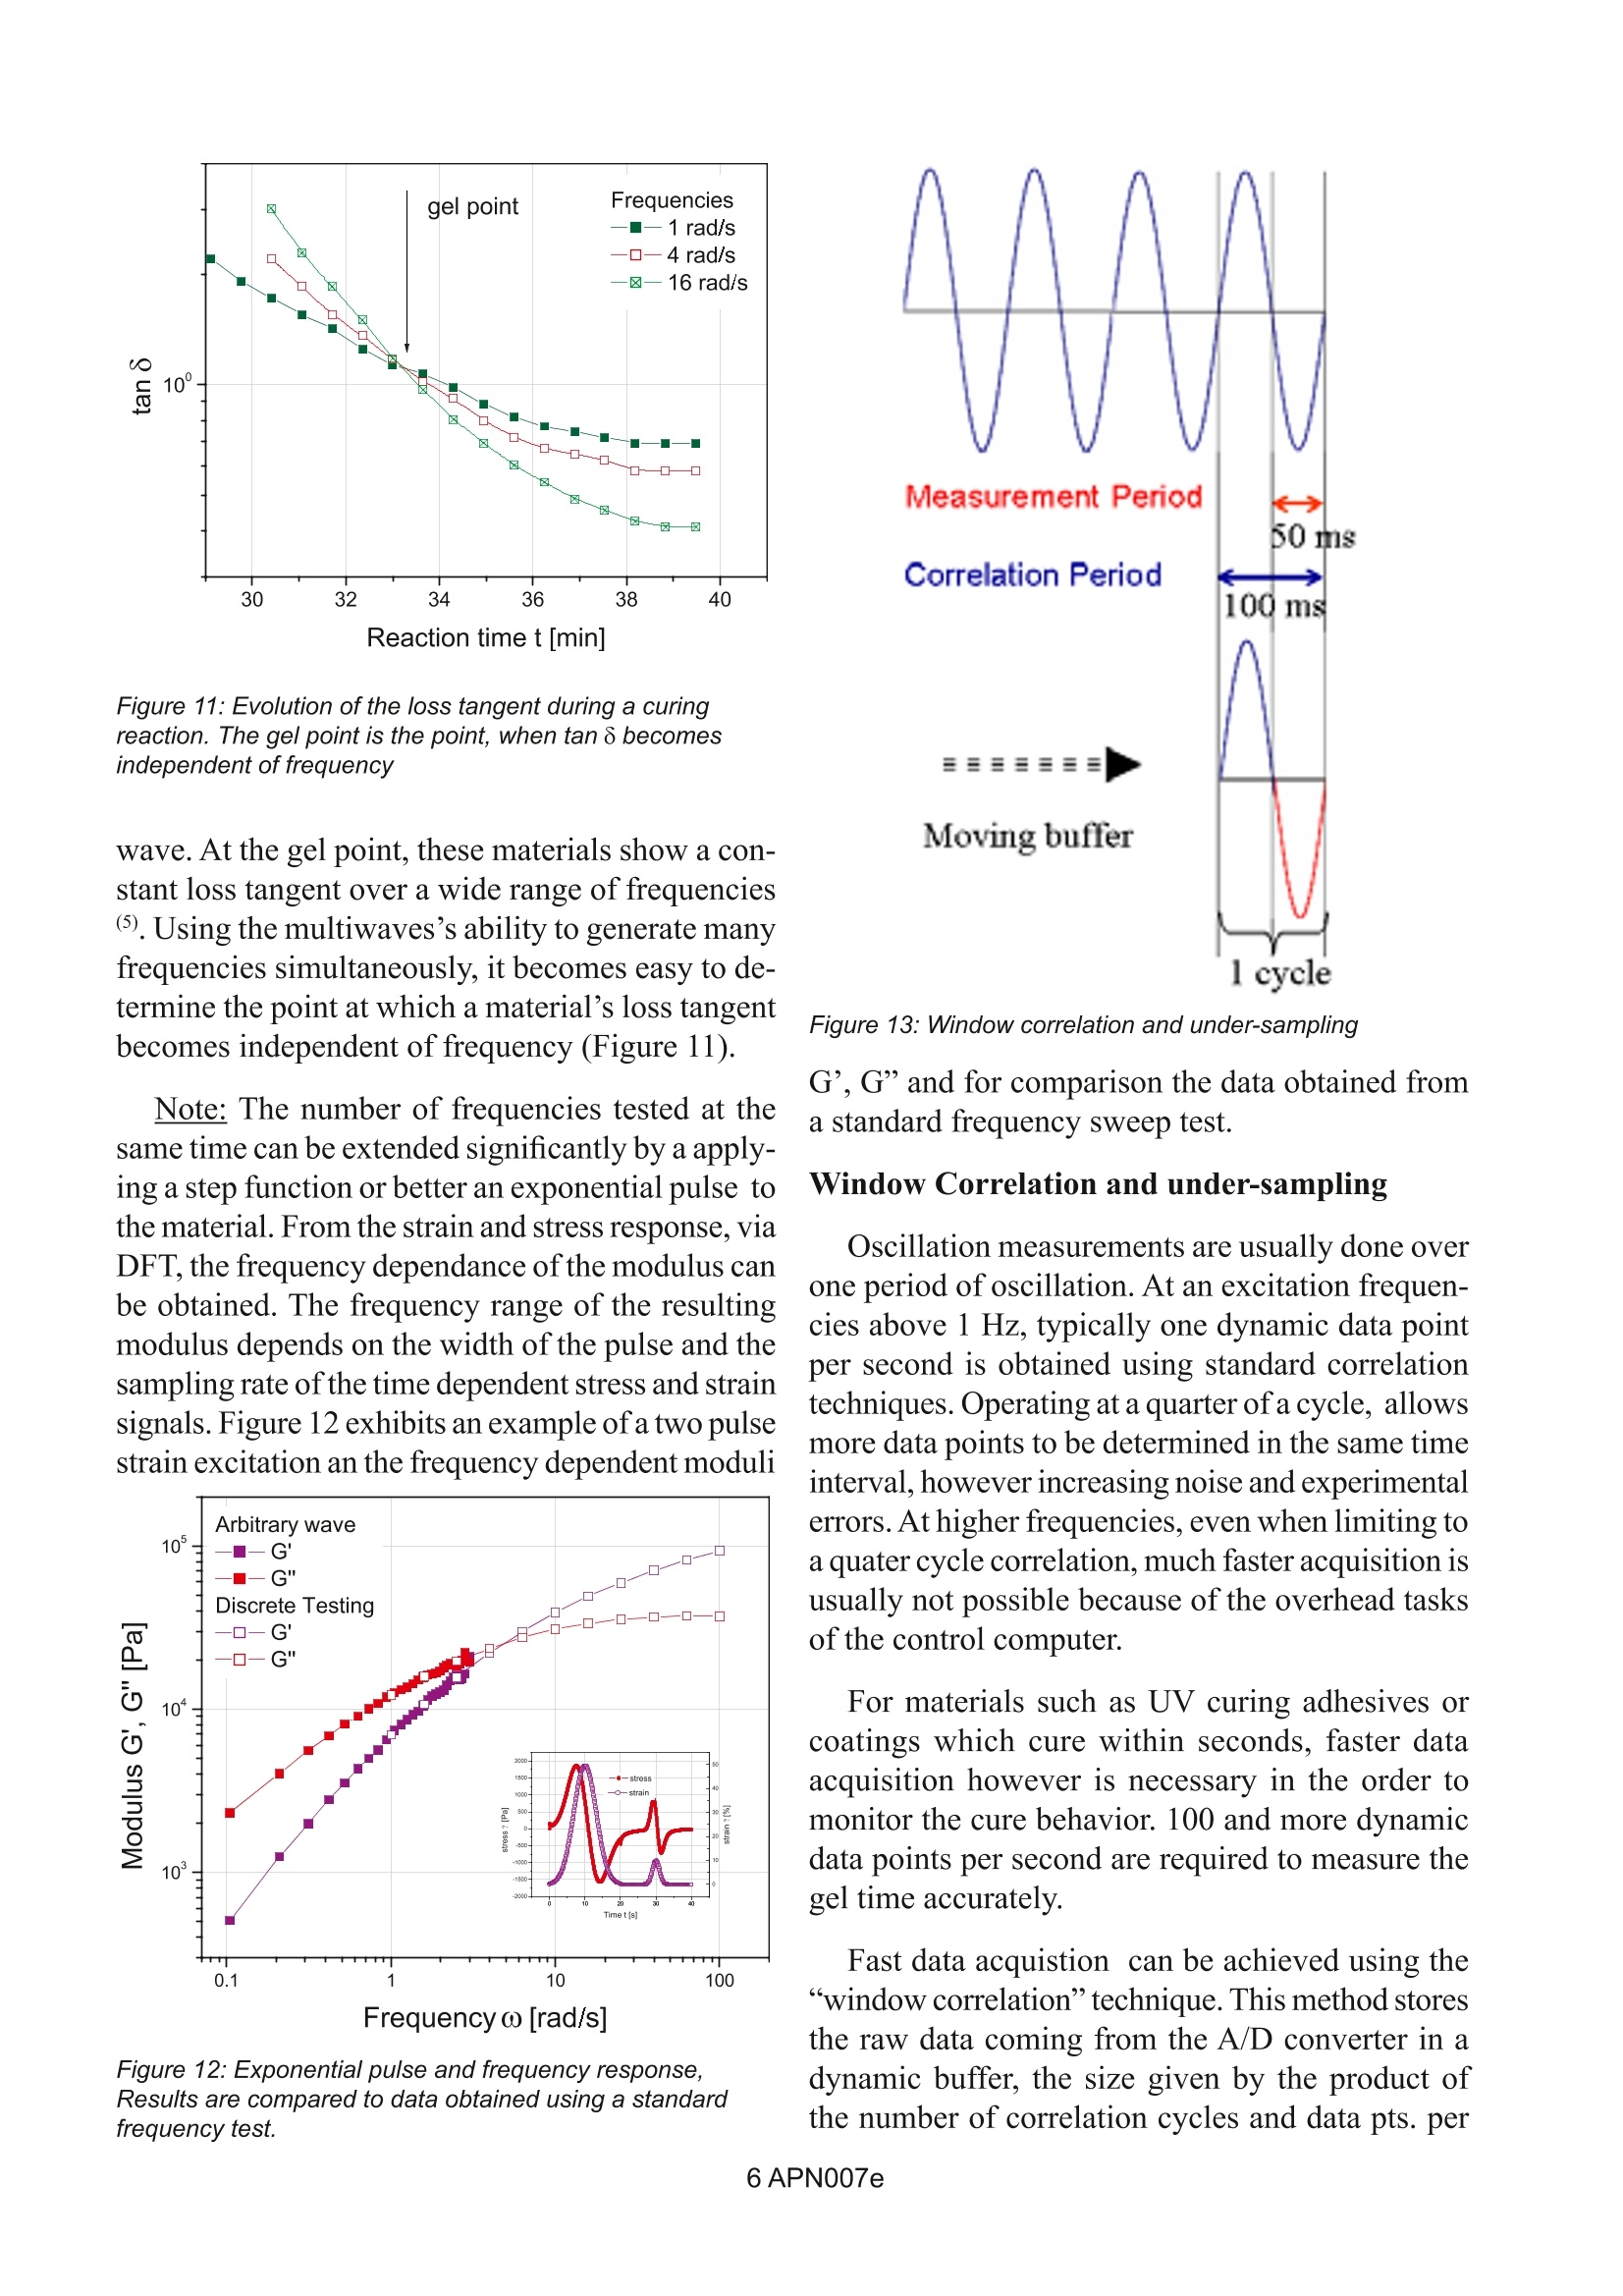
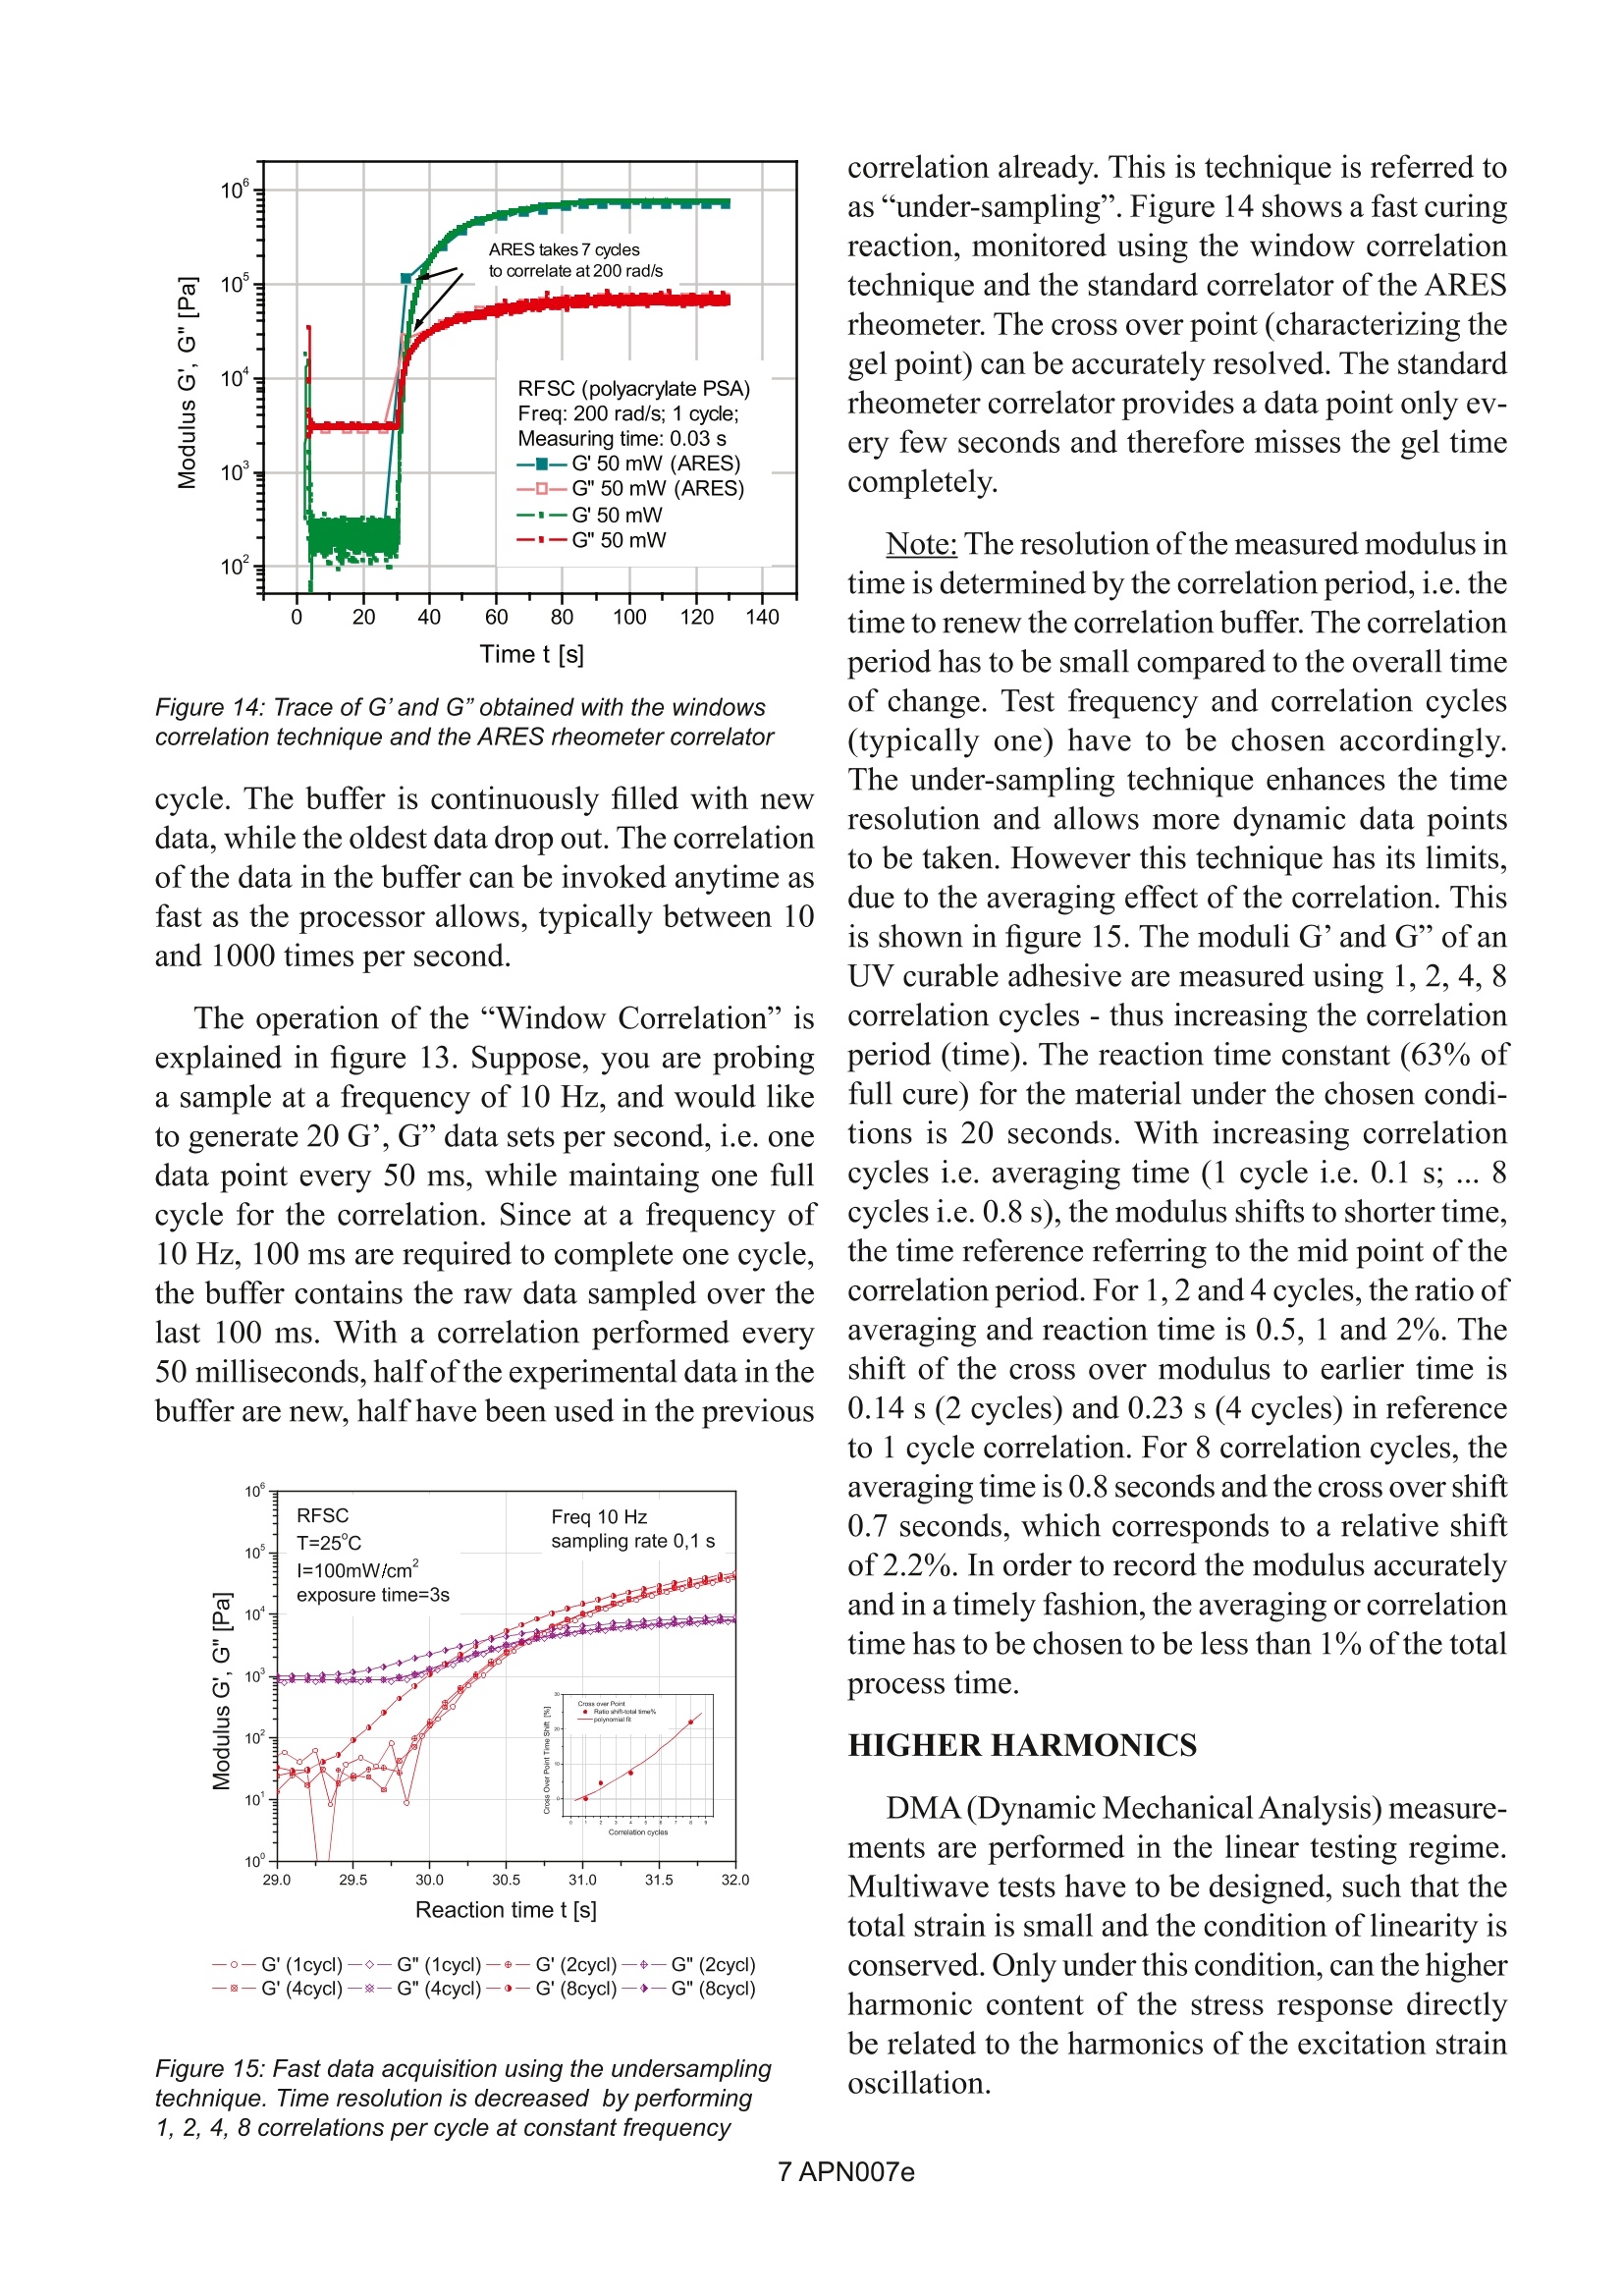
APN007 Measuring and Evaluating Oscillation Data A. Franck, TA Instruments Germany Keywords: Discrete Fourier Transformation, Fast Data Sampling, Higher harmonics, Experimental noise, Oscillation,DMA,Multiwave, Fourier Rheology,Harmonics In an oscillation shear experiment, the materialis subjected to either a sinusoidal strain or stressand the corresponding response is measured. Theratio of the output and input signals is referred toas the transfer function or material function (Figure1). When a sinusoidal deformation or deformationrate is applied, the material's response is the stress.The resulting material function is either the modulusor the viscosity; if a stress is applied and the strainmeasured, the material function is the compliance. In an oscillation experiment, the excitation andthe response signals are sinusoidal in the time do-main. The parameters describing the material’s be-havior are complex in the frequency domain and arerepresented by the storage and loss modulus, or themagnitude of the modulus and the loss tangent. It is not a necessity to know the details of howthe final results in a rheometer are derived from theraw experimental data in the time domain in order Figure 1: Material functions are defined based on the inputand ouput signals. Figure 2: Sinusoidal shear train applied to a material to apply rheology in material testing, however thisknowledge provides insight into the physical mean-ing of the measured dynamic material parametersand the limitations of the measurement. Usually materials are analyzed in the so-called“linear region” at steady state. Under these condi-tions, the material's response to a sinusoidal exci-tation is also sinusoidal with the same frequency.The ratio of the amplitudes of the output and inputfunctions and the relative offset of the two sinusoi-dal waves fully describe the material's behaviour.In the linear regime, the rheological material func-tions are only dependent on frequency at constanttemperature. CONVERTING TIME DEPENDENT STRAINAND STRESS TO G'AND G(1) During an oscillation test, a sinusoidal strain (orstress) is forced onto a material (Figure2) and withina few cycles or less, the responding stress (or strain)will oscillate along with the input strain sinusoidally THE DISCRETE FOURIERTRANSFORM(2 The Fourier transform arranges the time depen-dent periodic signal x(t) with respect to the differ-ent frequencies X(f), which are present in the timedomain. The Fourier transform is a linear trans-formation - that means that any superposition ofdifferent frequencies in time will be resolved in thefrequency domain. The FT is inherently complex.X(f) is a complex spectrum with a real and imagi-nary part and usually represented by a magnitudeand a phase. The Fourier transform of a continuoussignal x(t) is: For a discrete series x(n) with N samples, x(t)becomesx(nAt)=x(n) with n the sample number andAt the sampling time and ωt becomes 2rkAfnAt(kisthe number of the harmonic frequencies) and withAf=1/(NAt) (the inverse of the period), ot reducesto 2rkn/N. The Fourier transform X(ω) becomesX(kAω)=X(k) with The results of X(k) are complex, even when theinput data from the time domain are not complex.The resulting spectrum is represented by the magni-tude and the phase as: with -x(n)cos - (-2元nk N If the input time signal is real, the second termof the equations is dropped. Fork=1, the magnitudeand phase for the fundamental frequency is ob-tained. The response for k>l provides a magnitudeand a phase for the harmonic frequencies. Figure 3: Decomposition of the measured stress into an inphase and out of phase component at the same frequency, but with a phase lag 8. The responding stress wave o(t) can be decom-posed into two waves with the same frequency; onein phase, the other out of phase (90°) with the inputstrain wave (Figure 3). The measured stress signalo(t) is the sum of the two waves according to: The prime and double prime notation here hasits origin in the complex numbers. According to theEuler equation (Figure 4) the applied sinusoidalstrain y(t) can be rewritten as the imaginary part ofa complex strain y*: Similar the in and out of phase stress waves o’ Figure 4: Euler equation. The applied sinusoidal strain is theimaginary part of the complex strain and o”can be expressed as: The strain and stress functions can be extendedto a complex function as: The ratio of complex stress and strain providesa complex modulus G*: G'and G"are the real and imaginary parts ofthecomplex modulus and represented in the complexplane as shown in figure 5. Simpletrigonometryshows that the magnitude of G* and the phase 8can be obtained from: There is nothing imaginary about G”, in fact itis a measure of the energy dissipated per cycle ofdeformation per unit volume: HOW TO DETERMINE THE COMPLEXMATERIAL PARAMETERS?-DISCRETEFOURIERANALYSIS AND CROSSCORRELATION In the rheometer the strain and stress signals aredigitized and are available to the instrument com-puter as an array of n measured quantities sampledover an equal time interval At. The method used to convert the discrete rawsignal from the time into the frequency domainis the discrete Fourier transformation (DFT). Theexpression for the transformation of a real discrete Figure 5:Vector representation of the complex modulus inthe complex plane periodic function in time x(n) into the frequencyspectrum X(k) is (see DFT section): When the strain and stress wave functions aresinusoidal, real and oscillating at the same frequencyin the linear regime, the only significant frequency isthe fundamental(k=1). The transformation providesan in phase and out off phase (quadrature) term forthe strain and stress functions as follows: N is the total number of data points per cycle andn the nh data point. In the rheometer, the digitized data oY aremultiplied with the sine and cosine reference sig-nals and the sum for the N data points stored as inphase and quadrature terms. The magnitude of thecomplex strain, stress vectors as well as the phaseare derived as (Figure 6): The magnitude of the complex modulus G* isthe ratio of the magnitude of the complex stressand strain vectors and the phase 8, the sum of thecomponent’s phase. Figure 6: Complex modulus derived from the complex strainand stress wave function Note: Because of symmetry, only a quarter ofa cycle worth of raw data needs to be collected inorder to calculate phase and magnitude. The dis-advantage of this approach is that drifts of the rawsignals are not eliminated and the experimentalerrors increase. NOISE, RANDOM AND SYSTEMATICERRORS Rheological measurements made in oscillationin general operate on strong signals, both strain andstress.This means that for many applications, fewraw data points are sufficient to obtain accuracy testresults. However in order to monitor large moduluschanges under the same testing conditions or toimprove the phase angle resolution, the measurablesignal range has to be extended and the sensitivityof the oscillation measurement improved. A high raw data acquisition rate and optimizeddata handling can significantly enhance the signal’sdynamic range i.e. increase the sensitivity of thestrain and stress signals. The sensitivity is the ratio of detected signal tonoise. The noise is the uncertainty of the measuredsignal and can be obtained from the base line of theFourier transformed time signal. This information isnot readily available from a simple correlation. Theuncertainty can also be obtained from the varianceof a series ofrepeated measurements of the modulusand phase. The signal to noise ratio (S/N) increaseswhen averaging over a larger population of raw data. The S/N increases, for random noise only, with thesquare root ofthe number of measured transient datapoints S/N~n1/2(3) Figure 7: Effect of sampling rate, quantified by the numberof raw data pts /cycle, on the accuracy of the modulus andphase (4) How the accuracy and the sensitivity of themodulus and phase improves with increasing thesampling rate and the number of sampled data pts/cycle is demonstarted in figure 7. The small strainamplitude measurements have significant scatter inthe modulus and phase with a sampling rate of only100 pts/cycle. The variance clearly decreases when1000 i.e. 10 000 data pts/cycle are sampled (4) The noise here is defined as the standard devia-tion, calculated from 50 consecutive measurementsof modulus and phase. The S/N ratio in figure 8however is increasing slower with the number ofdata pts/cycle than expected for random noise. Thisis due to systematic errors: by reducing random Figure 8: Signal to noise ratio, actual data and theoreticalexpectations for random noise only. noise, systematic errors become visible and can becorrected for - thus further improving the operationrange of the instrument. FAST DATA ACQUISITION Many materials experience rapid changes instructure as a result of thermal conditioning, chemi-cal or physical reaction processes and of the natureof the structure itself. When these changes occurfast during long testing times, these changes willaffect the test results. In the following two methods,“Multi Wave”and“Window Correlation”, frequentlyused to speed up oscillation testing, are presented. Multiwave Multiwave is a method, that allows superposi-tion of a series of test frequencies over typicallya range of two decades. The advantage is a signi-ficantly reduced test time, a must when testingmaterials which experience significant changes instructure during the time of the experiment. Multiwave enables testing of a material at onefundamental frequency and its higher harmonics,each with its own strain (stress) amplitude. Whencorrelating the strain and stress waves at the im-posed harmonic frequencies, the material’s responseat these frequencies is obtained. Multiwave takesadvantage of the fact, that two or more mechanicalwaves can pass through a material at the same time,independent of each other. The Fourier transforma-tion is a linear transformation, and any superpositionof different frequencies in the time domain will be Figure 9: Discrete waveform at 1, 2, 8 rad/s and thesuperposition (MultiWave) of the three waveforms Figure 10: Frequency dependence of the modulus, obtainedfrom a multiwave and a standard frequency sweep testresolved in the frequency domain, independent ofthe other frequencies applied at the same instant. Note, that the individual strains add up and thetotal strain has to be small enough for the materialto behave linear viscoelastic, i.e. the test responseis independent of the strain amplitude. Figure 9 shows three discrete strain waveformsat 1, 2, 8 rad/s with the same strain amplitude. Thesuperposition of these same frequencies is givenbelow. The time dependent strain function, appliedto the materials is very unregular. The limitation tothe higher frequencies is governed by the responseof the motor. The correlation at the discrete harmonic fre-quencies applied to the material provides for eachexcitation frequency the corresponding phase andout off phase modulus (G'and G”), from which themagnitude and the phase can be easily calculated.The results are shown in figure 10 and comparedwith the data obtained in a standard frequency sweeptest. Excellent agreement is obtained between thetwo test methods. The ability to decrease test time in general is anadvantage, especially when large numbers of testswithin a limited time span needs to be performed.Multiwave speeds up frequency temperaturesweeps, allowing rapid master curve generation.In figure 10, the frequency sweep took 50 minutesin discret mode, the same data was obtained usingMultiWave in only 16 minutes. The determination of the instant of gelation incrosslinking polymers becomes easy with Multi- Figure 11: Evolution of the loss tangent during a curingreaction. The gel point is the point, when tan 8 becomesindependent of frequency wave. At the gel point, these materials show a con-stant loss tangent over a wide range of frequencies(). Using the multiwaves’s ability to generate manyfrequencies simultaneously, it becomes easy to de-termine the point at which a material’s loss tangentbecomes independent of frequency (Figure 11). Note: The number of frequencies tested at thesame time can be extended significantly by a apply-ing a step function or better an exponential pulse tothe material. From the strain and stress response, viaDFT, the frequency dependance of the modulus canbe obtained. The frequency range of the resultingmodulus depends on the width of the pulse and thesampling rate of the time dependent stress and strainsignals. Figure 12 exhibits an example of a two pulsestrain excitation an the frequency dependent moduli Figure 12: Exponential pulse and frequency response,Results are compared to data obtained using a standardfrequency test. Figure 13: Window correlation and under-sampling G’, G”and for comparison the data obtained froma standard frequency sweep test. Window Correlation and under-sampling Oscillation measurements are usually done overone period of oscillation. At an excitation frequen-cies above 1 Hz, typically one dynamic data pointper second is obtained using standard correlationtechniques. Operating at a quarter of a cycle, allowsmore data points to be determined in the same timeinterval, however increasing noise and experimentalerrors. At higher frequencies, even when limiting toa quater cycle correlation, much faster acquisition isusually not possible because of the overhead tasksof the control computer. For materials such as UV curing adhesives orcoatings which cure within seconds, faster dataacquisition however is necessary in the order tomonitor the cure behavior. 100 and more dynamicdata points per second are required to measure thegel time accurately. Fast data acquistion can be achieved using the“window correlation"technique. This method storesthe raw data coming from the A/D converter in adynamic buffer, the size given by the product ofthe number of correlation cycles and data pts. per Figure 14: Trace of G'and G"obtained with the windowscorrelation technique and the ARES rheometer correlator cycle. The buffer is continuously filled with newdata, while the oldest data drop out. The correlationof the data in the buffer can be invoked anytime asfast as the processor allows, typically between 10and 1000 times per second. The operation of the “Window Correlation”isSexplained in figure 13. Suppose, you are probinga sample at a frequency of 10 Hz, and would liketo generate 20 G’,G"data sets per second,i.e. onedata point every 50 ms, while maintaing one fullcycle for the correlation. Since at a frequency of(10 Hz, 100 ms are required to complete one cycle,the buffer contains the raw data sampled over thelast 100 ms. With a correlation performed every50 milliseconds, half of the experimental data in thebuffer are new, half have been used in the previous Figure 15: Fast data acquisition using the undersamplingtechnique. Time resolution is decreased by performing1, 2, 4, 8 correlations per cycle at constant frequency correlation already. This is technique is referred toas“under-sampling”. Figure 14 shows a fast curingreaction, monitored using the window correlationtechnique and the standard correlator of the ARESrheometer. The cross over point (characterizing thegel point) can be accurately resolved. The standardrheometer correlator provides a data point only ev-ery few seconds and therefore misses the gel timecompletely. Note: The resolution of the measured modulus intime is determined by the correlation period, i.e. thetime to renew the correlation buffer. The correlationperiod has to be small compared to the overall timeof change. Test frequency and correlation cycles(typically one) have to be chosen accordingly.The under-sampling technique enhances the timeresolution and allows more dynamic data pointsto be taken. However this technique has its limits,due to the averaging effect of the correlation. Thisis shown in figure 15. The moduli G’and G”of anUV curable adhesive are measured using 1, 2, 4, 8correlation cycles - thus increasing the correlationperiod (time). The reaction time constant (63% offull cure) for the material under the chosen condi-tions is 20 seconds. With increasing correlationcycles i.e. averaging time (1cycle i.e. 0.1 s; ... 8cycles i.e. 0.8 s), the modulus shifts to shorter time,the time reference referring to the mid point of thecorrelation period. For 1, 2 and 4 cycles, the ratio ofaveraging and reaction time is 0.5, 1 and 2%. Theshift of the cross over modulus to earlier time is0.14 s (2 cycles) and 0.23 s (4 cycles) in referenceto 1 cycle correlation. For 8 correlation cycles, theaveraging time is 0.8 seconds and the cross over shift0.7 seconds, which corresponds to a relative shiftof2.2%. In order to record the modulus accuratelyand in a timely fashion, the averaging or correlationtime has to be chosen to be less than 1% of the totalprocess time. HIGHER HARMONICS DMA (Dynamic Mechanical Analysis) measure-ments are performed in the linear testing regime.Multiwave tests have to be designed, such that thetotal strain is small and the condition of linearity isconserved. Only under this condition, can the higherharmonic content of the stress response directlybe related to the harmonics ofthe excitation strainoscillation. Figure 16: Non linear stress reponse to a sinusoidal strainexcitation If the input strain amplitude exceeds a criticalvalue, the response of the material to a sinusoidaloscillation is not a simple sine wave anymore, i.e.the material behaves non linear (Figure 16). The non linear response of the material showsas a non symetric distorsion of the respondingwave form and can be described by a series ofoddharmonics. The highest harmonic frequency, which can beresolved is the Nyquist frequency and depends onthe raw data sampling rate as with n the number of sampled discrete data pointsduring a periodT). When 100 data points per cycleare sampled at an oscillation of 1Hz, for example,the Nyquist frequency is 50 Hz. The higher thesampling rate, the higher the the Nyquist frequencyor spectral resolution. Figure 16 shows the stress response ofa cosmetic Figure 17: Linear Non linear stress reponse to a sinusoidalstrain excitation with strain amplitude lotion to a sinusoidal strain excitation for differentstrain amplitudes. With increasing strain, the mate-rial behaves more and more non-linear, which showsin the distorsion of the stress response. Note: While in the linear regime, a steady stateoscillation establishes fast, it takes usually severalcycles to establish steady state conditions duringnon linear testing.Also is it important to select theshear geometry carefully to avoid edge effects (8). Using DFT, the stress response can formaly bedescribed by the higher harmonic content in termsof magnitude and phase. Typically, the magnitudeof the harmonics of the stress response is normal-ized with the magnitude of the fundamental and thephase and scaled to the cosine of the fundamentalof the stress response. g2 Figure 17 shows the evolution of the magnitudeof the the 3rd harmonic as a function of the strainamplitude for the cosmetic lotion. For small strain,the measured moduli G'and G"are strain inde-pen-dent and all harmonics are zero. With the modulusdecreasing beyond a strain amplitude of 1%, the 3mdharmonic grows to reach a contribution of 30% ofthe fundamental at higher strain amplitude. CONCLUSION The discrete Fourier transformation (DFT) is apowerfull method to analyze oscillation data and tocalculate the complex material parameters such asthe storage (G)and loss (G”) modulus. Variationsofcorrelatioon conditions as well as the analysis ofthe harminic content allow 1- increase of accuracyand sensitivity of the obtained results,-2 super-position of different frequencies for faster testingover wide frequency ranges,3 -monitoring of fastchanging systems and 4 - quantitative descriptionof the non linear behavior REFERENCES 1.Macosko C.W.“Rheology, principles, measurements and applica-tions", Wiley-VCH, 1994 2. reference Fourier transformation 3. Wilhelm M., Macromol..Mater.Eng., 287, 83 (2002) 4. Franck, A. Proceedings XIVth Int’l Congress on Rheology, RE29,Seoul. Korea, 2004 5.Chambon, F., J.Rheol.31,8 (1987) 6.Chen T.,Yao M., Ulbrich R., Franck A.,“Rheological testing of UVcuring materials”presented at 77th annual meeting SOR, VancouverOct. 2005 7. Skoog; D.A.; Leary, J.J."Principles of Instrumental Analysis”, Saun-ders College Publishung, Fort Worth, 1992 8. Friedrich, C. private communication APN In an oscillation shear experiment, the material is subjected to either a sinusoidal strain or stress and the corresponding response is measured. The ratio of the output and input signals is referred to as the transfer function or material function (Figure 1). When a sinusoidal deformation or deformation rate is applied, the material’s response is the stress. The resulting material function is either the modulus or the viscosity; if a stress is applied and the strain measured, the material function is the compliance.
确定


还剩6页未读,是否继续阅读?

产品配置单
TA仪器为您提供《震荡数据中测量和分析检测方案(动态热机械)》,该方案主要用于其他中测量和分析检测,参考标准--,《震荡数据中测量和分析检测方案(动态热机械)》用到的仪器有TA仪器Discovery 流变仪
推荐专场
相关方案
更多