


方案详情
文
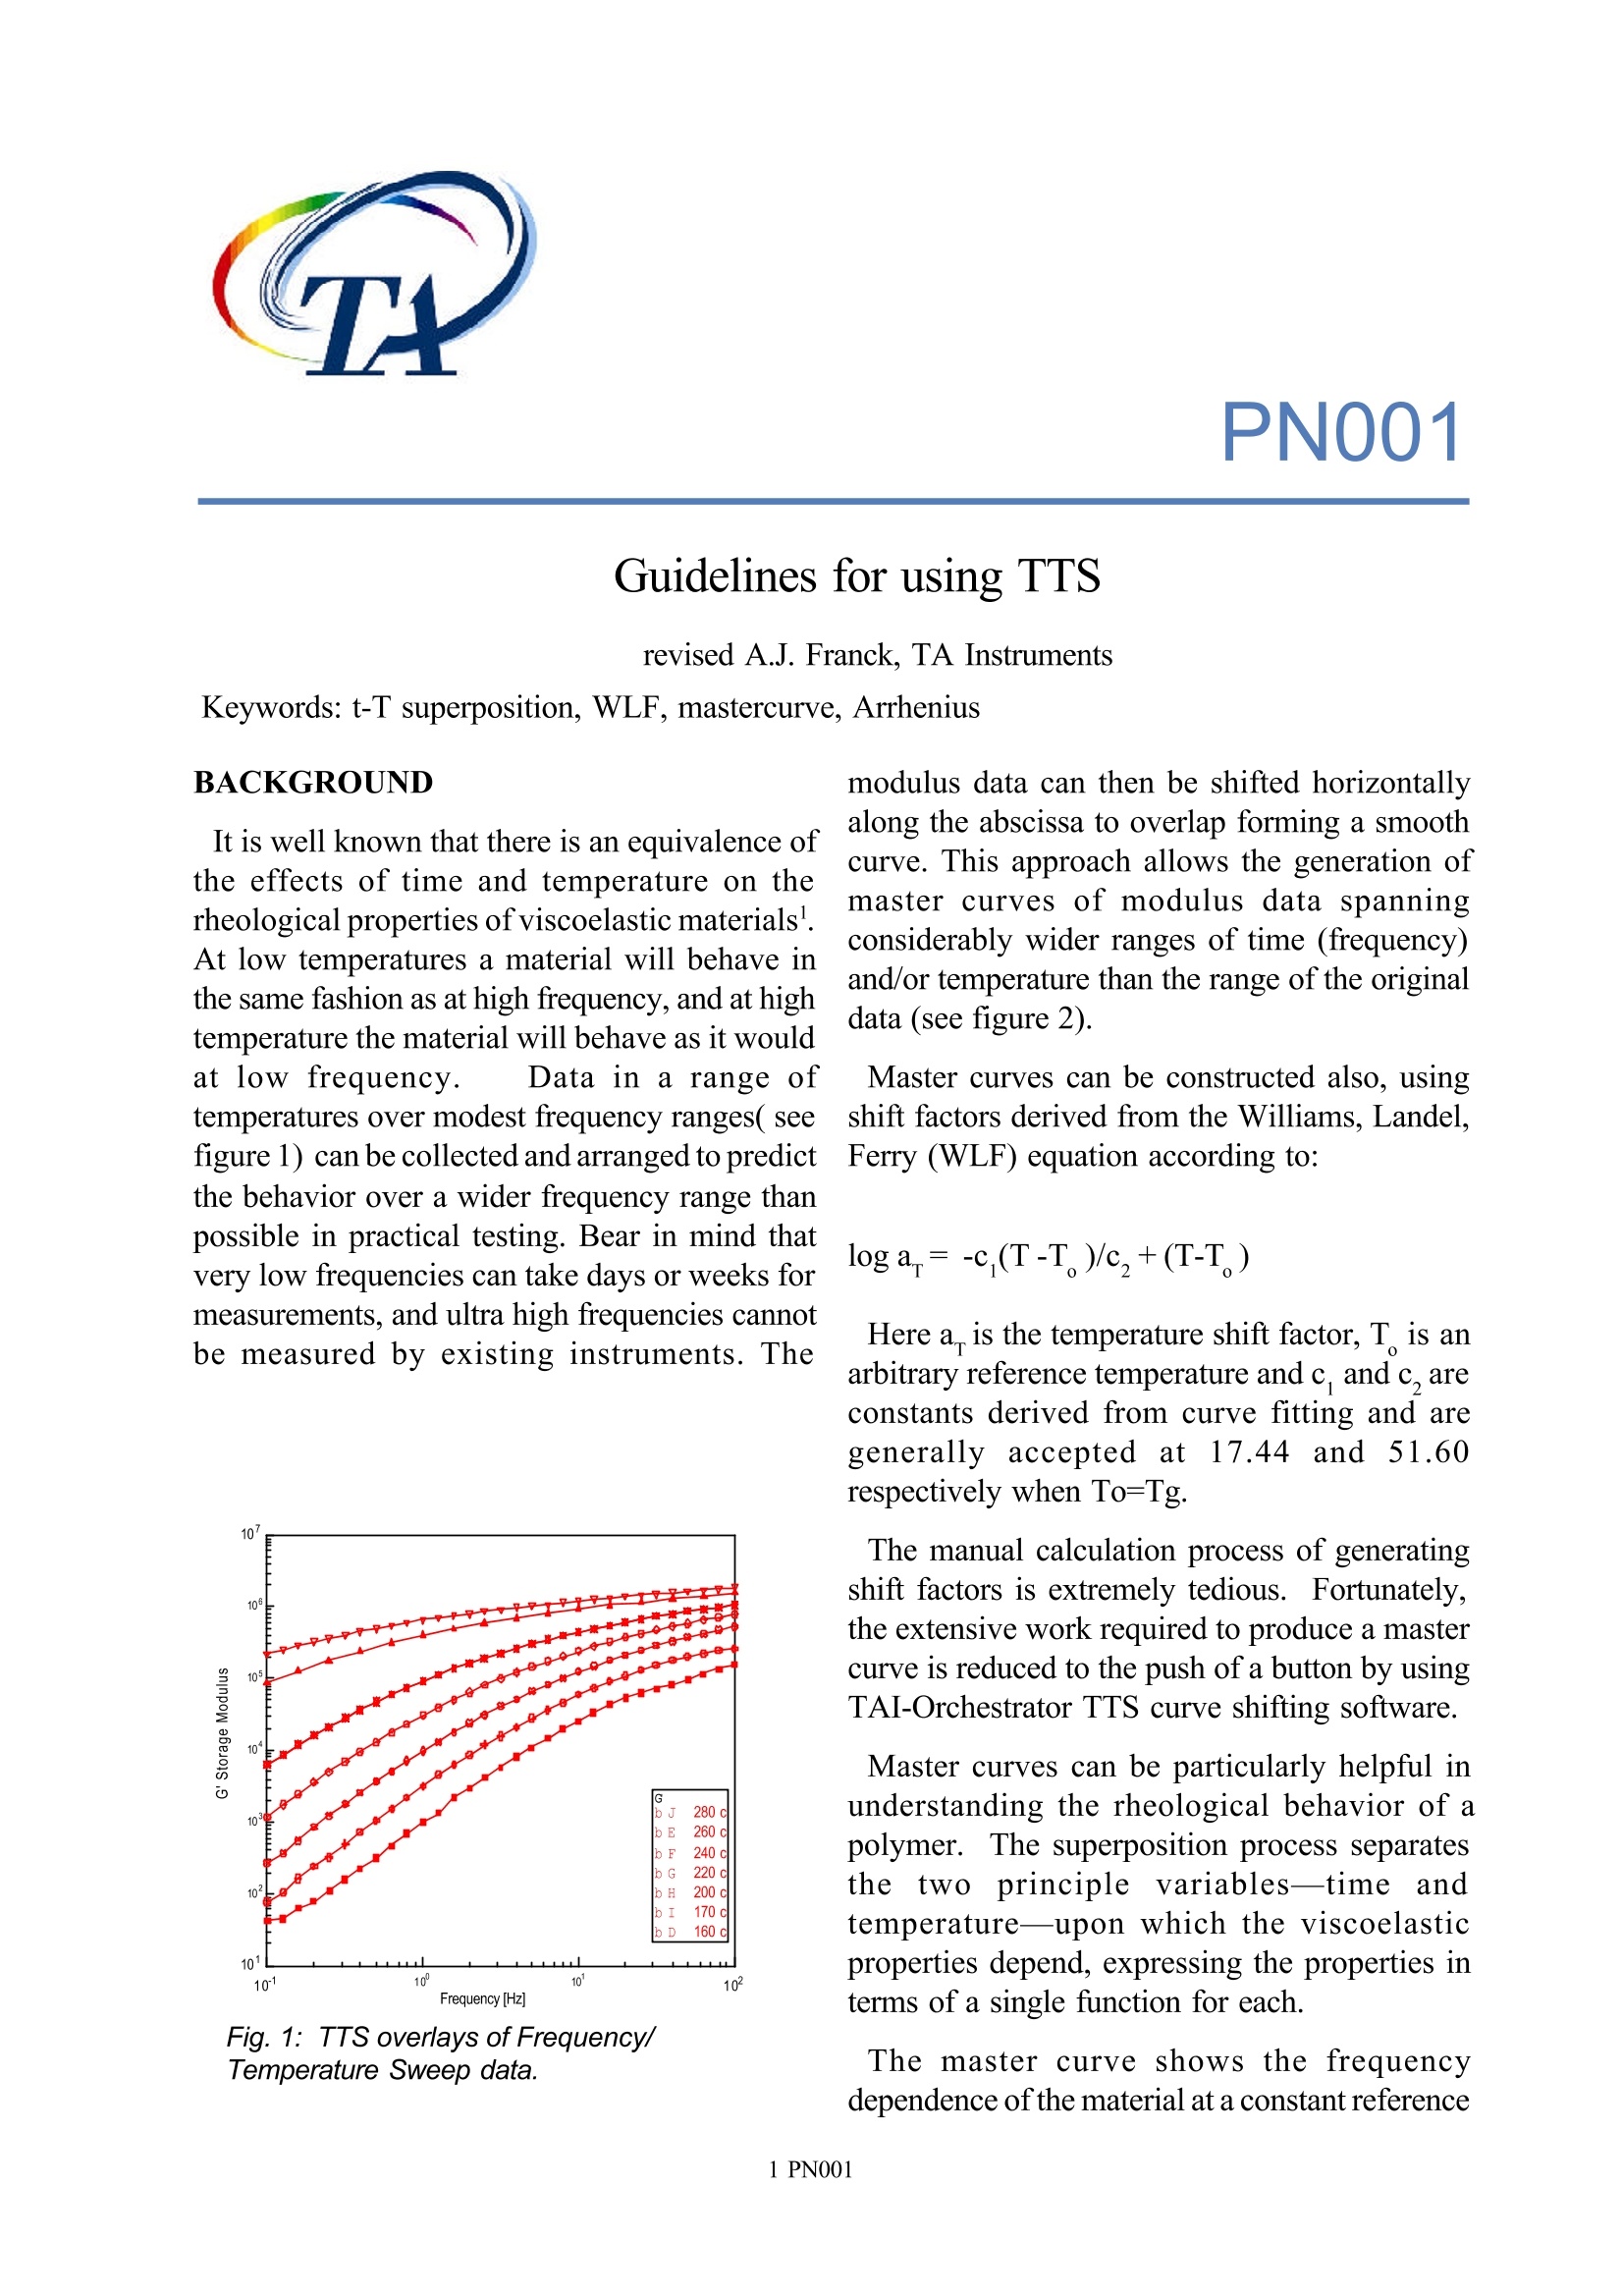
It is well known that there is an equivalence of the effects of time and temperature on the rheological properties of viscoelastic materials1. At low temperatures a material will behave in the same fashion as at high frequency, and at high temperature the material will behave as it would at low frequency. Data in a range of temperatures over modest frequency ranges( see figure 1) can be collected and arranged to predict the behavior over a wider frequency range than possible in practical testing. Bear in mind that very low frequencies can take days or weeks for measurements, and ultra high frequencies cannot be measured by existing instruments. The modulus data can then be shifted horizontally along the abscissa to overlap forming a smooth curve. This approach allows the generation of master curves of modulus data spanning considerably wider ranges of time (frequency) and/or temperature than the range of the original data (see figure 2).
方案详情

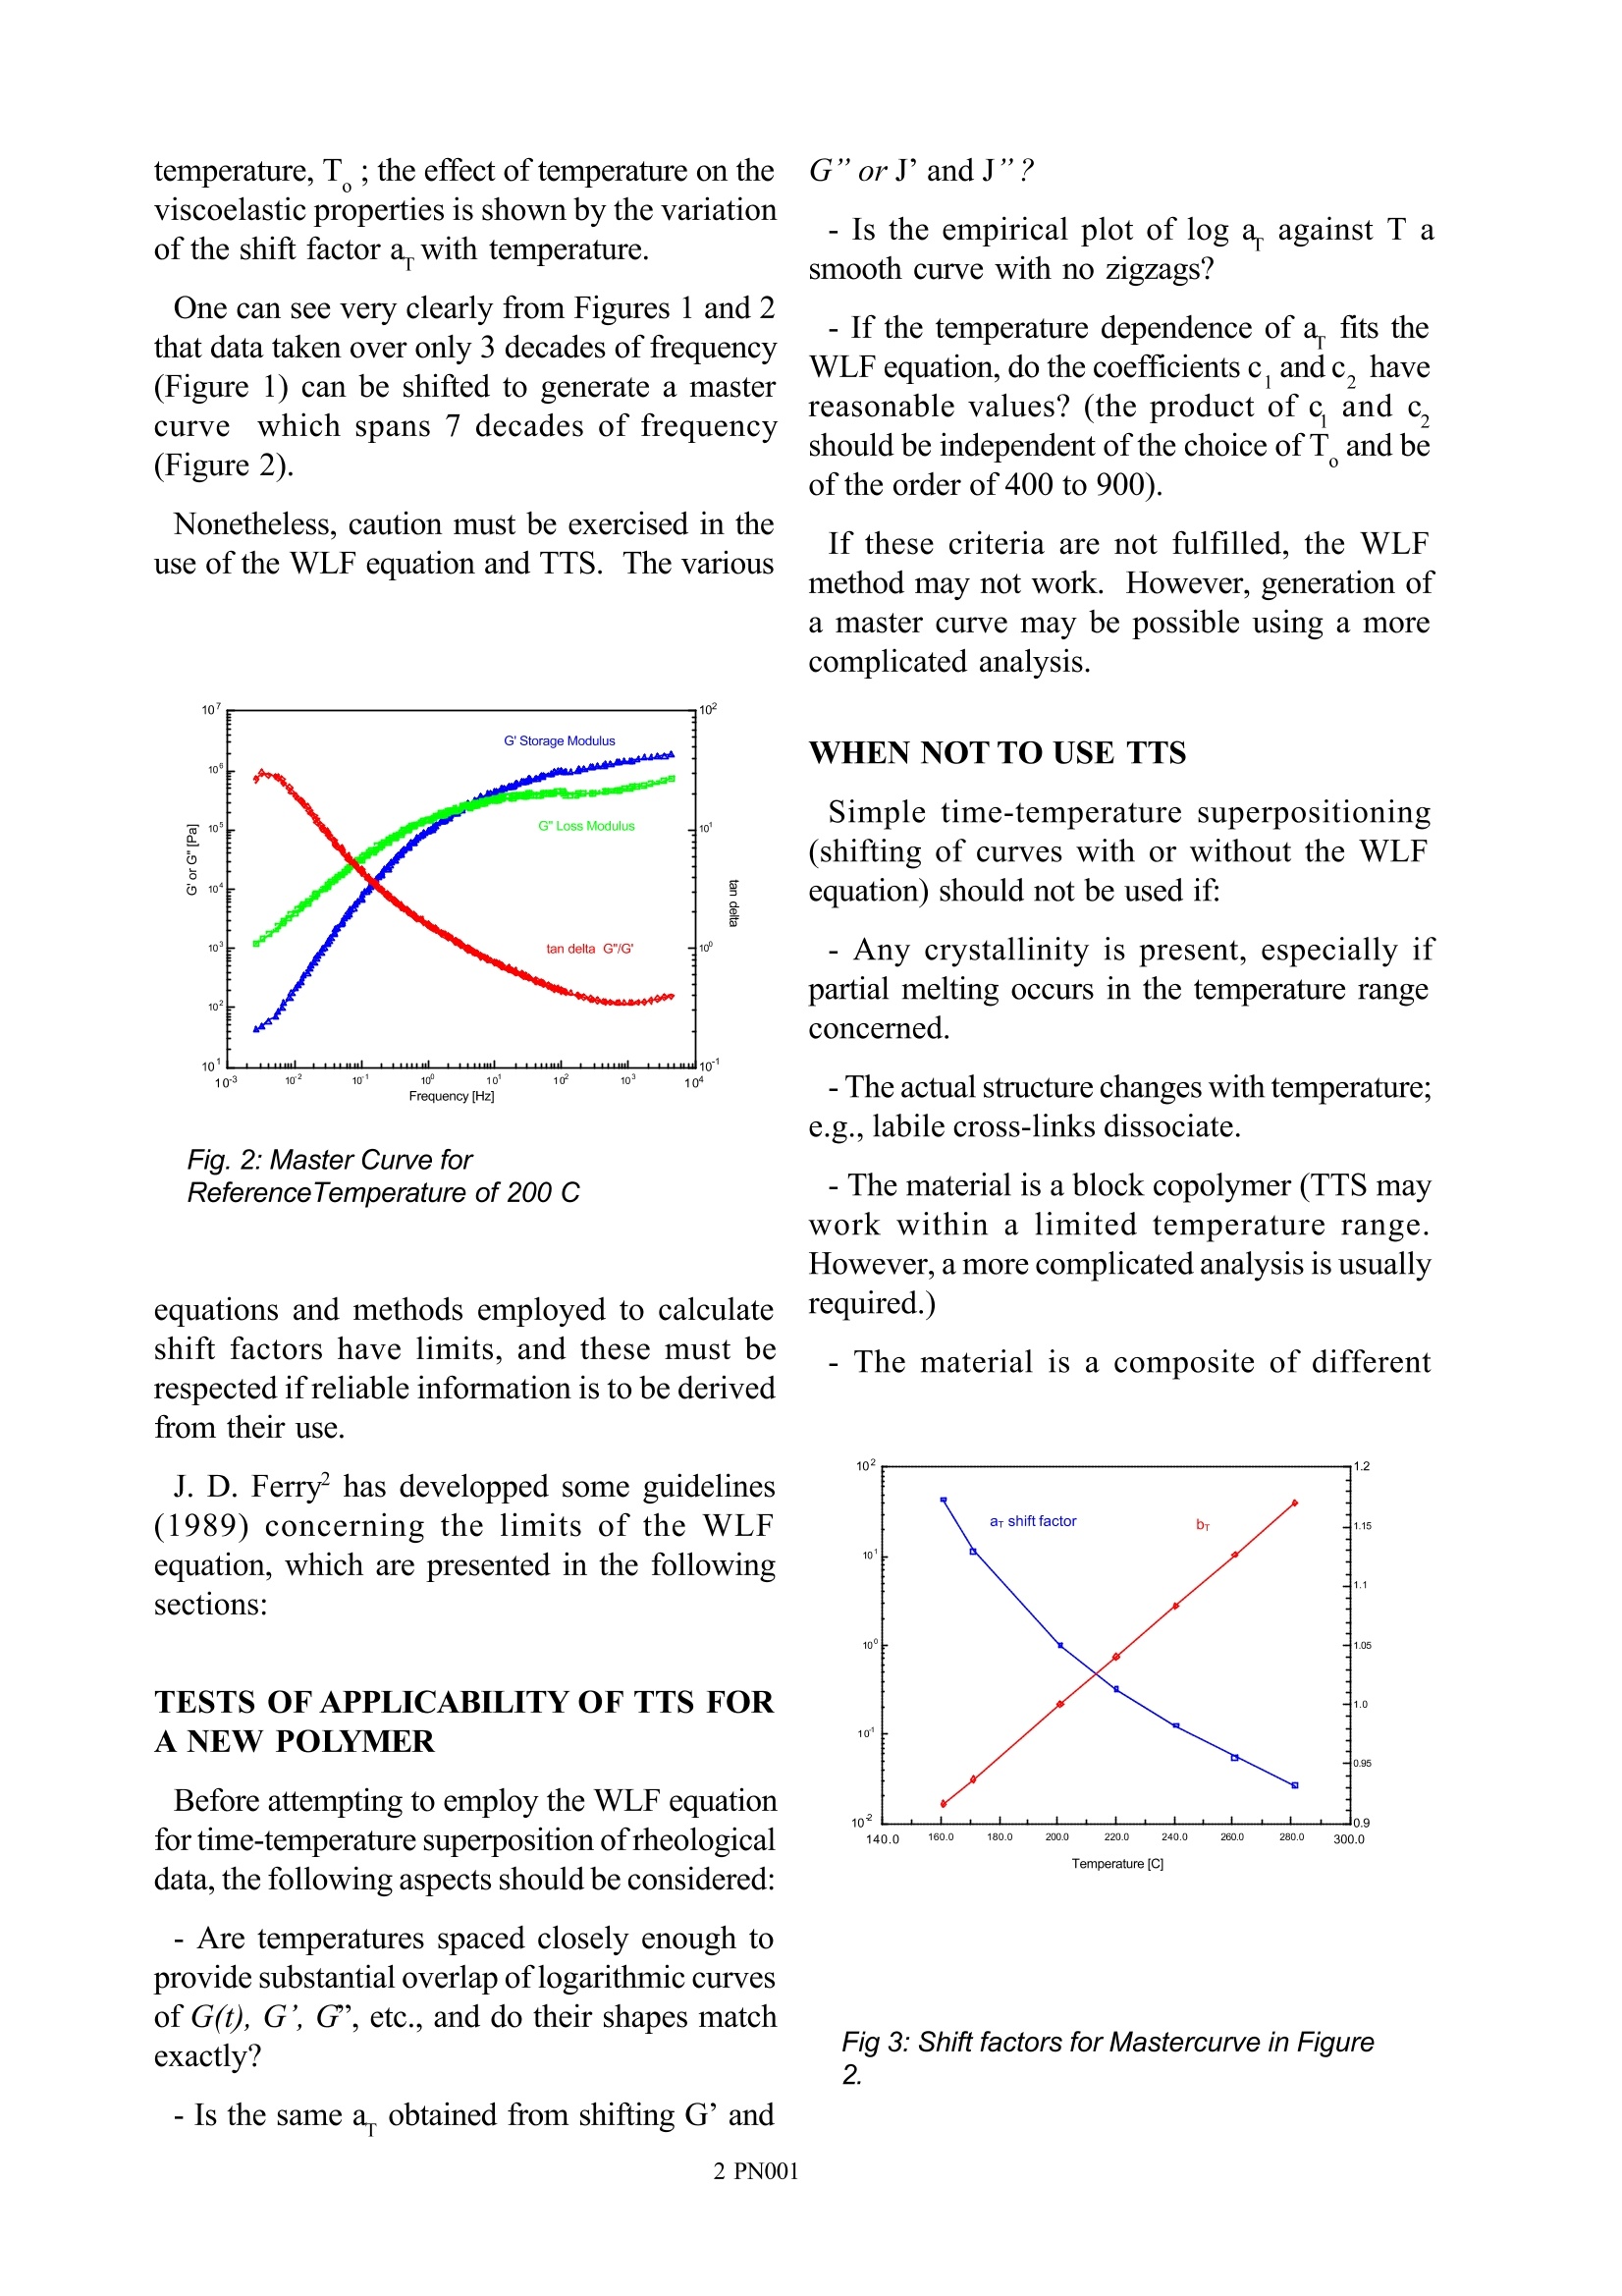
PN001 Guidelines for using TTS revised A.J. Franck, TA Instruments Keywords: t-T superposition, WLF, mastercurve, Arrhenius BACKGROUND It is well known that there is an equivalence ofthe effects of time and temperature on therheological properties of viscoelastic materials.At low temperatures a material will behave inthe same fashion as at high frequency, and at hightemperature the material will behave as it wouldat low frequency. Data in a range oftemperatures over modest frequency ranges( seefigure 1) can be collected and arranged to predictthe behavior over a wider frequency range thanpossible in practical testing. Bear in mind thatvery low frequencies can take days or weeks formeasurements, and ultra high frequencies cannotbe measured by existing instruments. The Fig. 1: TTS overlays of Frequency/Temperature Sweep data. modulus data can then be shifted horizontallyalong the abscissa to overlap forming a smoothcurve. This approach allows the generation ofmaster curves of modulus data spanningconsiderably wider ranges of time (frequency)and/or temperature than the range of the originaldata (see figure 2). Master curves can be constructed also, usingshift factors derived from the Williams, Landel,Ferry (WLF) equation according to: Here a is the temperature shift factor, T is anarbitrary reference temperature and c, and c, areconstants derived from curve fitting and aregenerally accepted at17.44and51.60respectively when To=Tg. The manual calculation process of generatingshift factors is extremely tedious. Fortunately,the extensive work required to produce a mastercurve is reduced to the push of a button by usingTAI-Orchestrator TTS curve shifting software. Master curves can be particularly helpful inunderstanding the rheological behavior of apolymer. The superposition process separatesthe twoprinciple variables-titemperature-upon which the viscoelasticproperties depend, expressing the properties interms of a single function for each. The master curve shows the frequencydependenceof the material at a constant reference temperature, T; the effect of temperature on theviscoelastic properties is shown by the variationof the shift factor a with temperature. One can see very clearly from Figures 1 and 2that data taken over only 3 decades of frequency(Figure 1) can be shifted to generate a mastercurvewhich spans 7 decades of frequency(Figure 2). Nonetheless, caution must be exercised in theuse of the WLF equation and TTS. The various Fig. 2: Master Curve forReferenceTemperature of 200 C equations and methods employed to calculateshift factors have limits, and these must berespected ifreliable information is to be derivedfrom their use. J. D. Ferryhas developped some guidelines(1989) concerning the limits of the WLFequation, which are presented in the followingsections: TESTS OF APPLICABILITY OF TTS FORA NEW POLYMER Before attempting to employ the WLF equationfor time-temperature superposition of rheologicaldata, the following aspects should be considered: - Are temperatures spaced closely enough toprovide substantial overlap of logarithmic curvesof G(t), G, G, etc., and do their shapes matchexactly? - Is the same a. obtained from shifting G’and G”orJ’andJ”? - Is the empirical plot of log a. against T asmooth curve with no zigzags? -If the temperature dependence of a fits theWLF equation, do the coefficients c, andc, havereasonable values? (the product ofc and c,should be independent of the choice ofT and beof the order of 400 to 900). If these criteria are not fulfilled, the WLFmethod may not work. However, generation ofa master curve may be possible using a morecomplicated analysis. WHEN NOTTO USE TTS Simple time-temperature superpositioning(shifting of curves with or without the WLFequation) should not be used if: - Any crystallinity is present, especially ifpartial melting occurs in the temperature rangeconcerned. -The actual structure changes with temperature;e.g., labile cross-links dissociate. -The material is a block copolymer (TTS maywork within a limited temperature range.However, a more complicated analysis is usuallyrequired.) - The material is a composite of different Fig 3: Shift factors for Mastercurve in Figure2. polymers. -Viscoelastic mechanisms other than config-urational changes of the polymer backboneoccur; e.g., side-group motions, especially nearTg. WHEN NOT TO USE THE WLFEQUATION (EVEN IF TTS APPEARS TOWORK) The WLF equation should not be used for TTSin the following circumstances: -IfT> Tg +100°, or if T < Tg and the polymeris not elastomeric, the Arrhenius form (seebelow) is usually better. - If the temperature range is small, then c andc, cannot be calculated precisely and theArrhenius form is a satisfactory approximation.The Arrhenius form is: where Ea is the apparent activation energy. By following these simple guidelines, themaster curves generated by TAI-Orchestrator’sTTS curve shifting software will offer anexcellent representation of material behaviorover a wide range of times and frequencies withinthe confines of standard laboratory testing. REFERENCES 1. AN005 Generating mastercurves;TAIproductn note 2. Ferry,J.D., Viscoelastic Properties ofPolymers PN It is well known that there is an equivalence of the effects of time and temperature on the rheological properties of viscoelastic materials1. At low temperatures a material will behave in the same fashion as at high frequency, and at high temperature the material will behave as it would at low frequency. Data in a range of temperatures over modest frequency ranges( see figure 1) can be collected and arranged to predict the behavior over a wider frequency range than possible in practical testing. Bear in mind that very low frequencies can take days or weeks for measurements, and ultra high frequencies cannot be measured by existing instruments. The modulus data can then be shifted horizontally along the abscissa to overlap forming a smooth curve. This approach allows the generation of master curves of modulus data spanning considerably wider ranges of time (frequency) and/or temperature than the range of the original data (see figure 2).
确定
还剩1页未读,是否继续阅读?

产品配置单
TA仪器为您提供《材料中流变特性检测方案(流变仪)》,该方案主要用于其他中流变特性检测,参考标准--,《材料中流变特性检测方案(流变仪)》用到的仪器有TA仪器Discovery流变仪
推荐专场
相关方案
更多
该厂商其他方案
更多