


震荡中的流变测量无论在应力还是应变通常都会形成强烈的信号。随着材料复杂度的增加,在样本测试中更加需要能够覆盖广泛范围的样品弹性模量(个和应力及应变)。对于动态范围由于106的,必须消除随机噪声和系统误差修正,以确保准确的结果。高速数据采集与灵活的相关技术结合,以提高低端性能流变仪。
方案详情

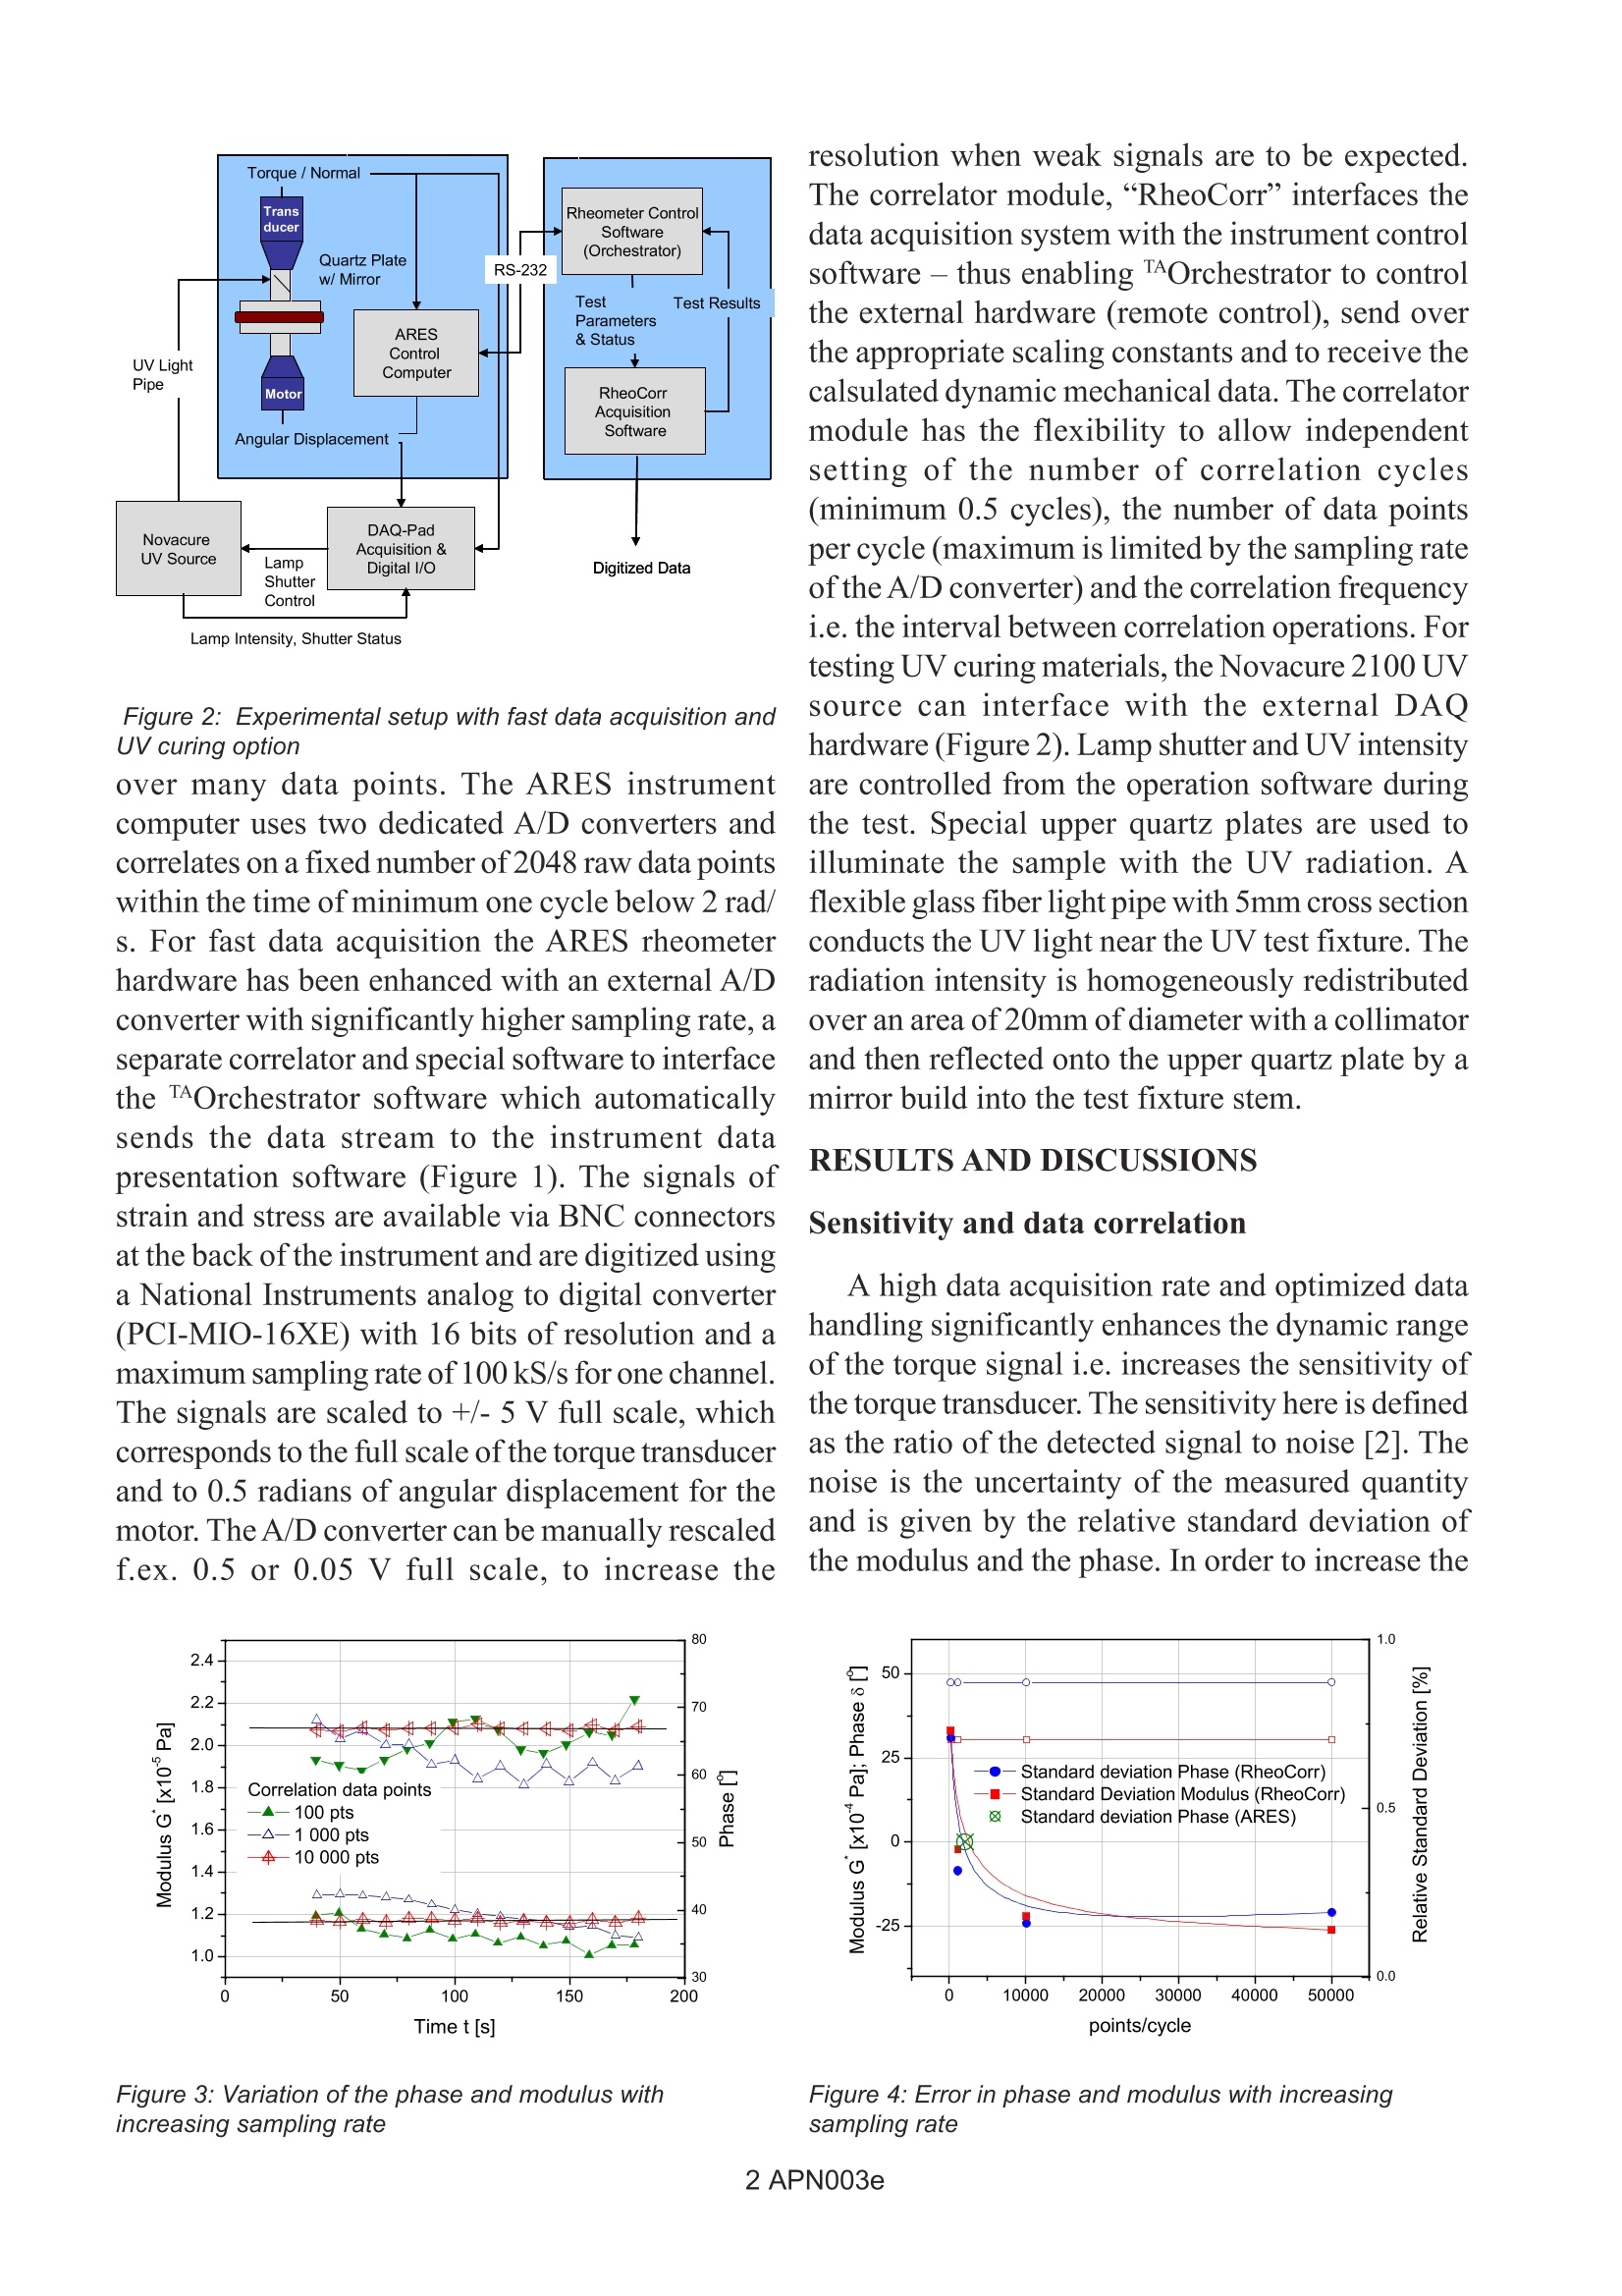
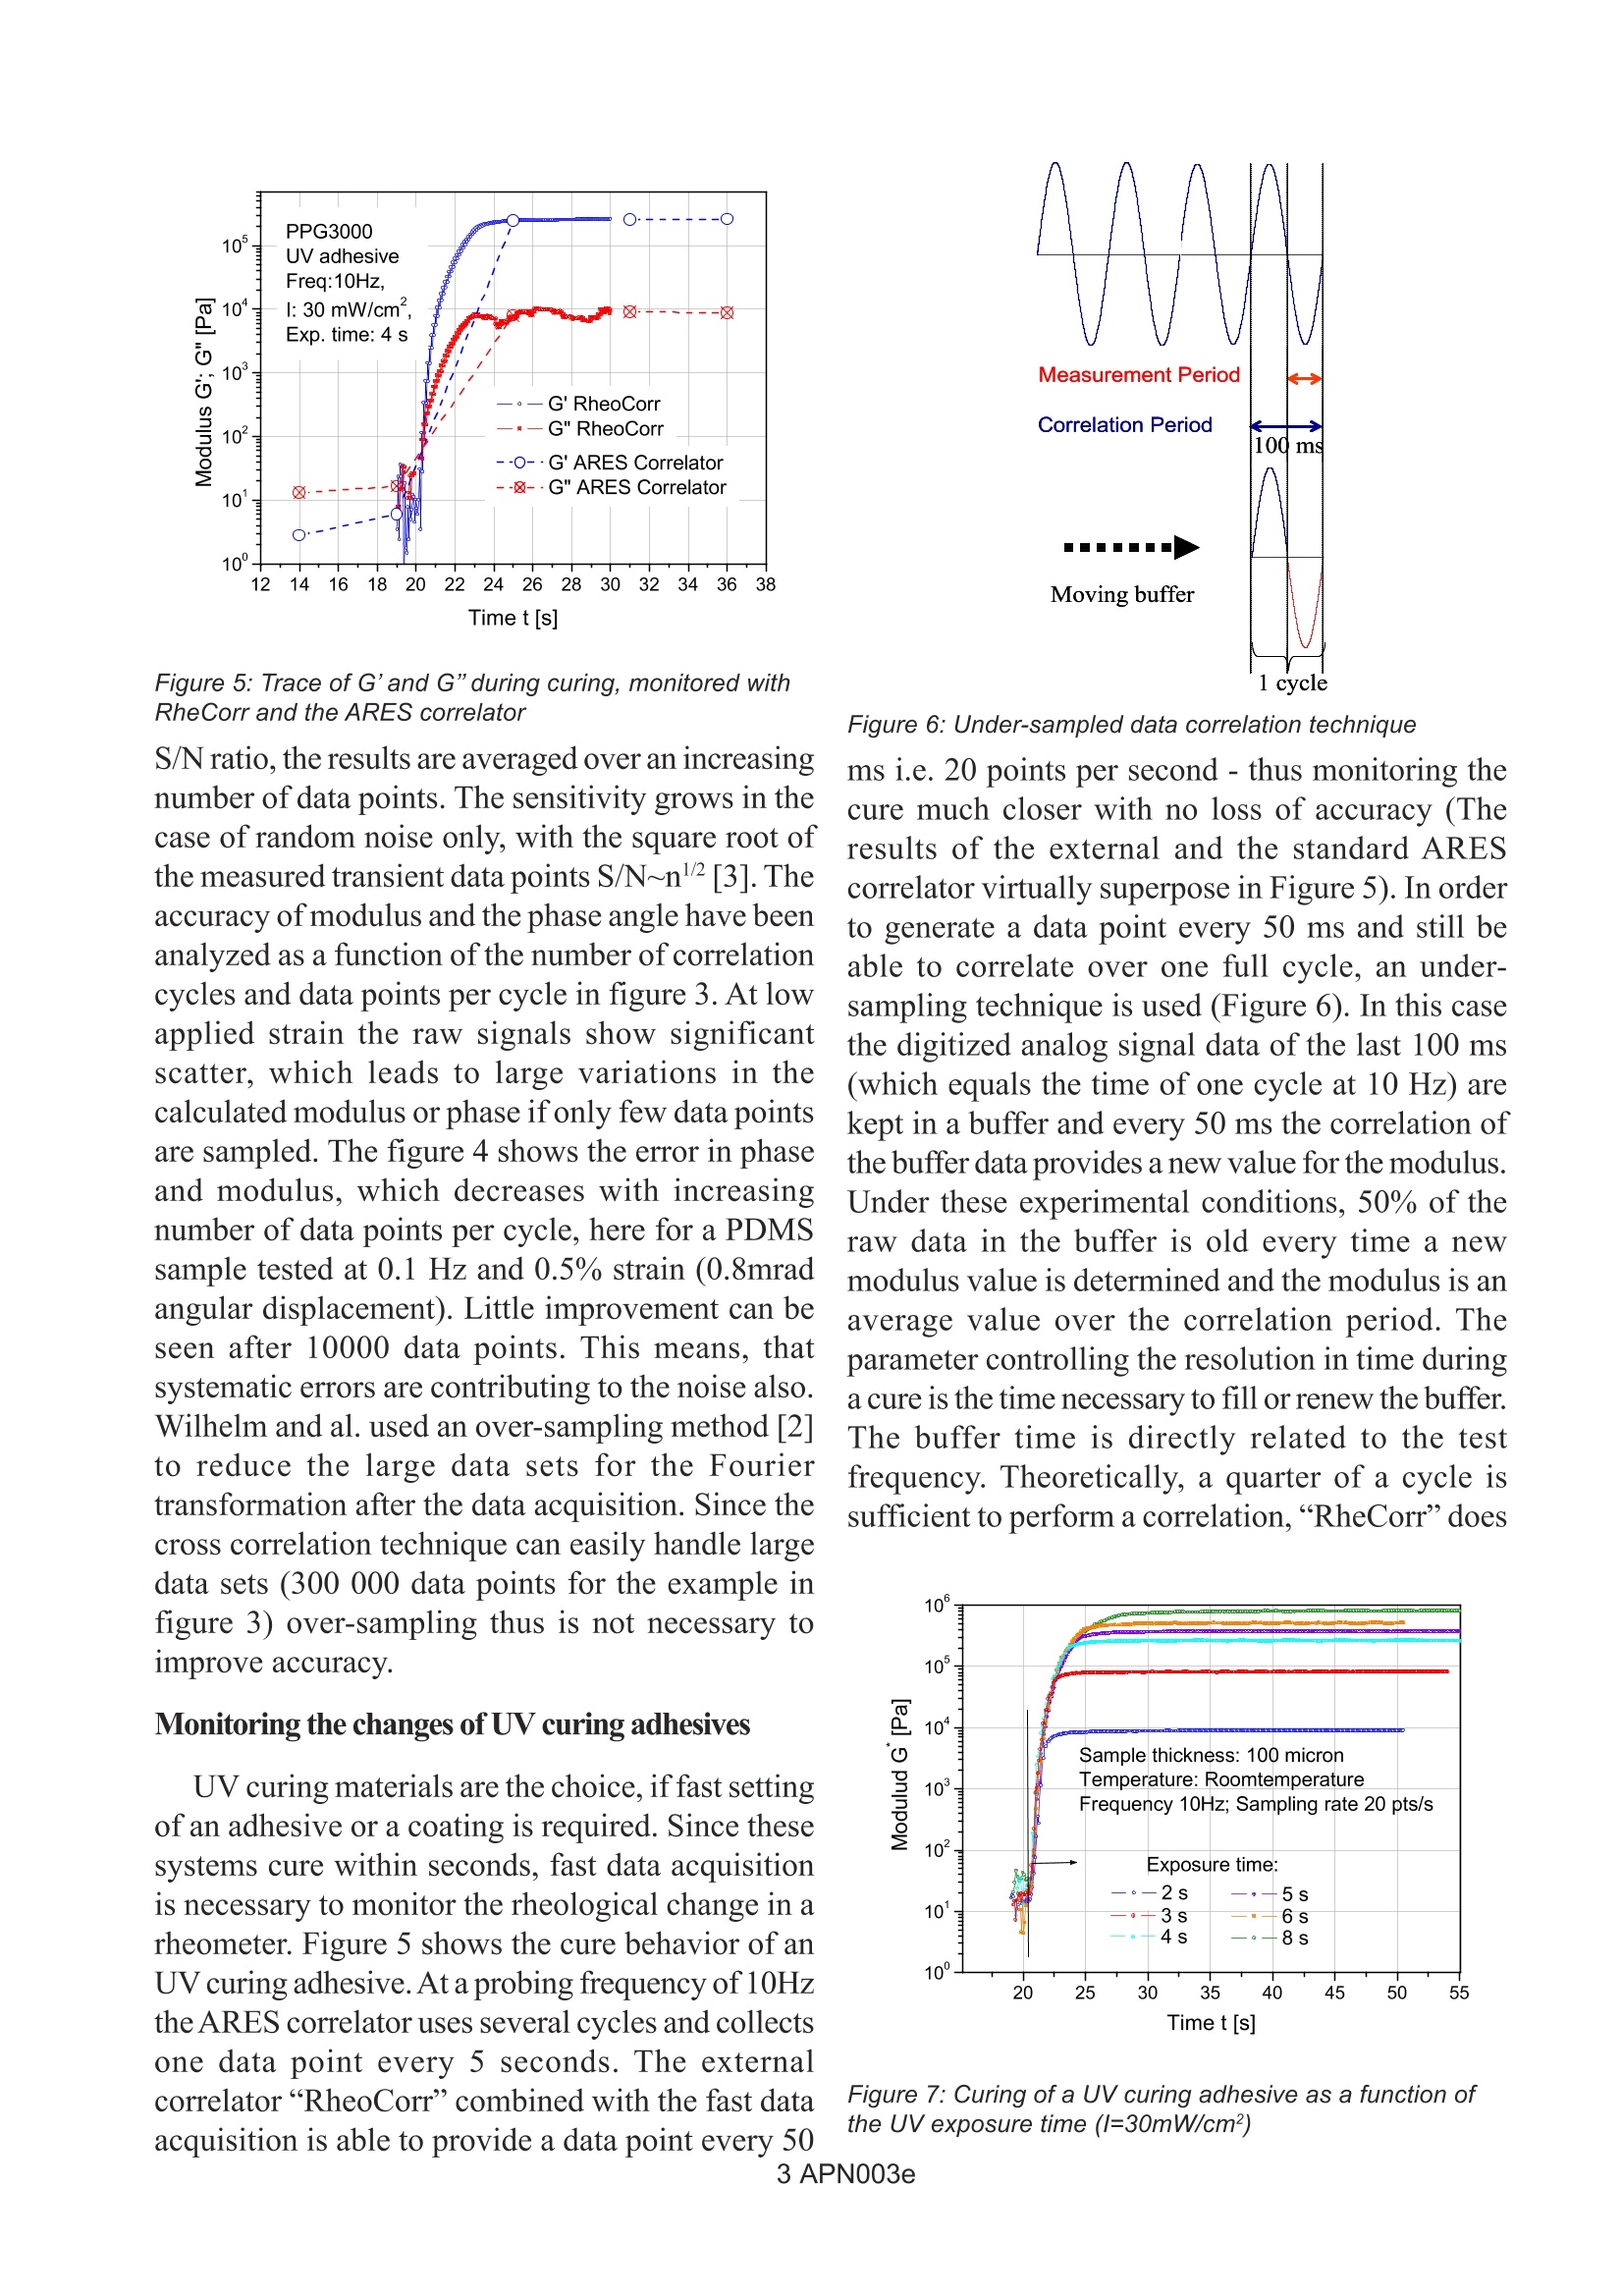
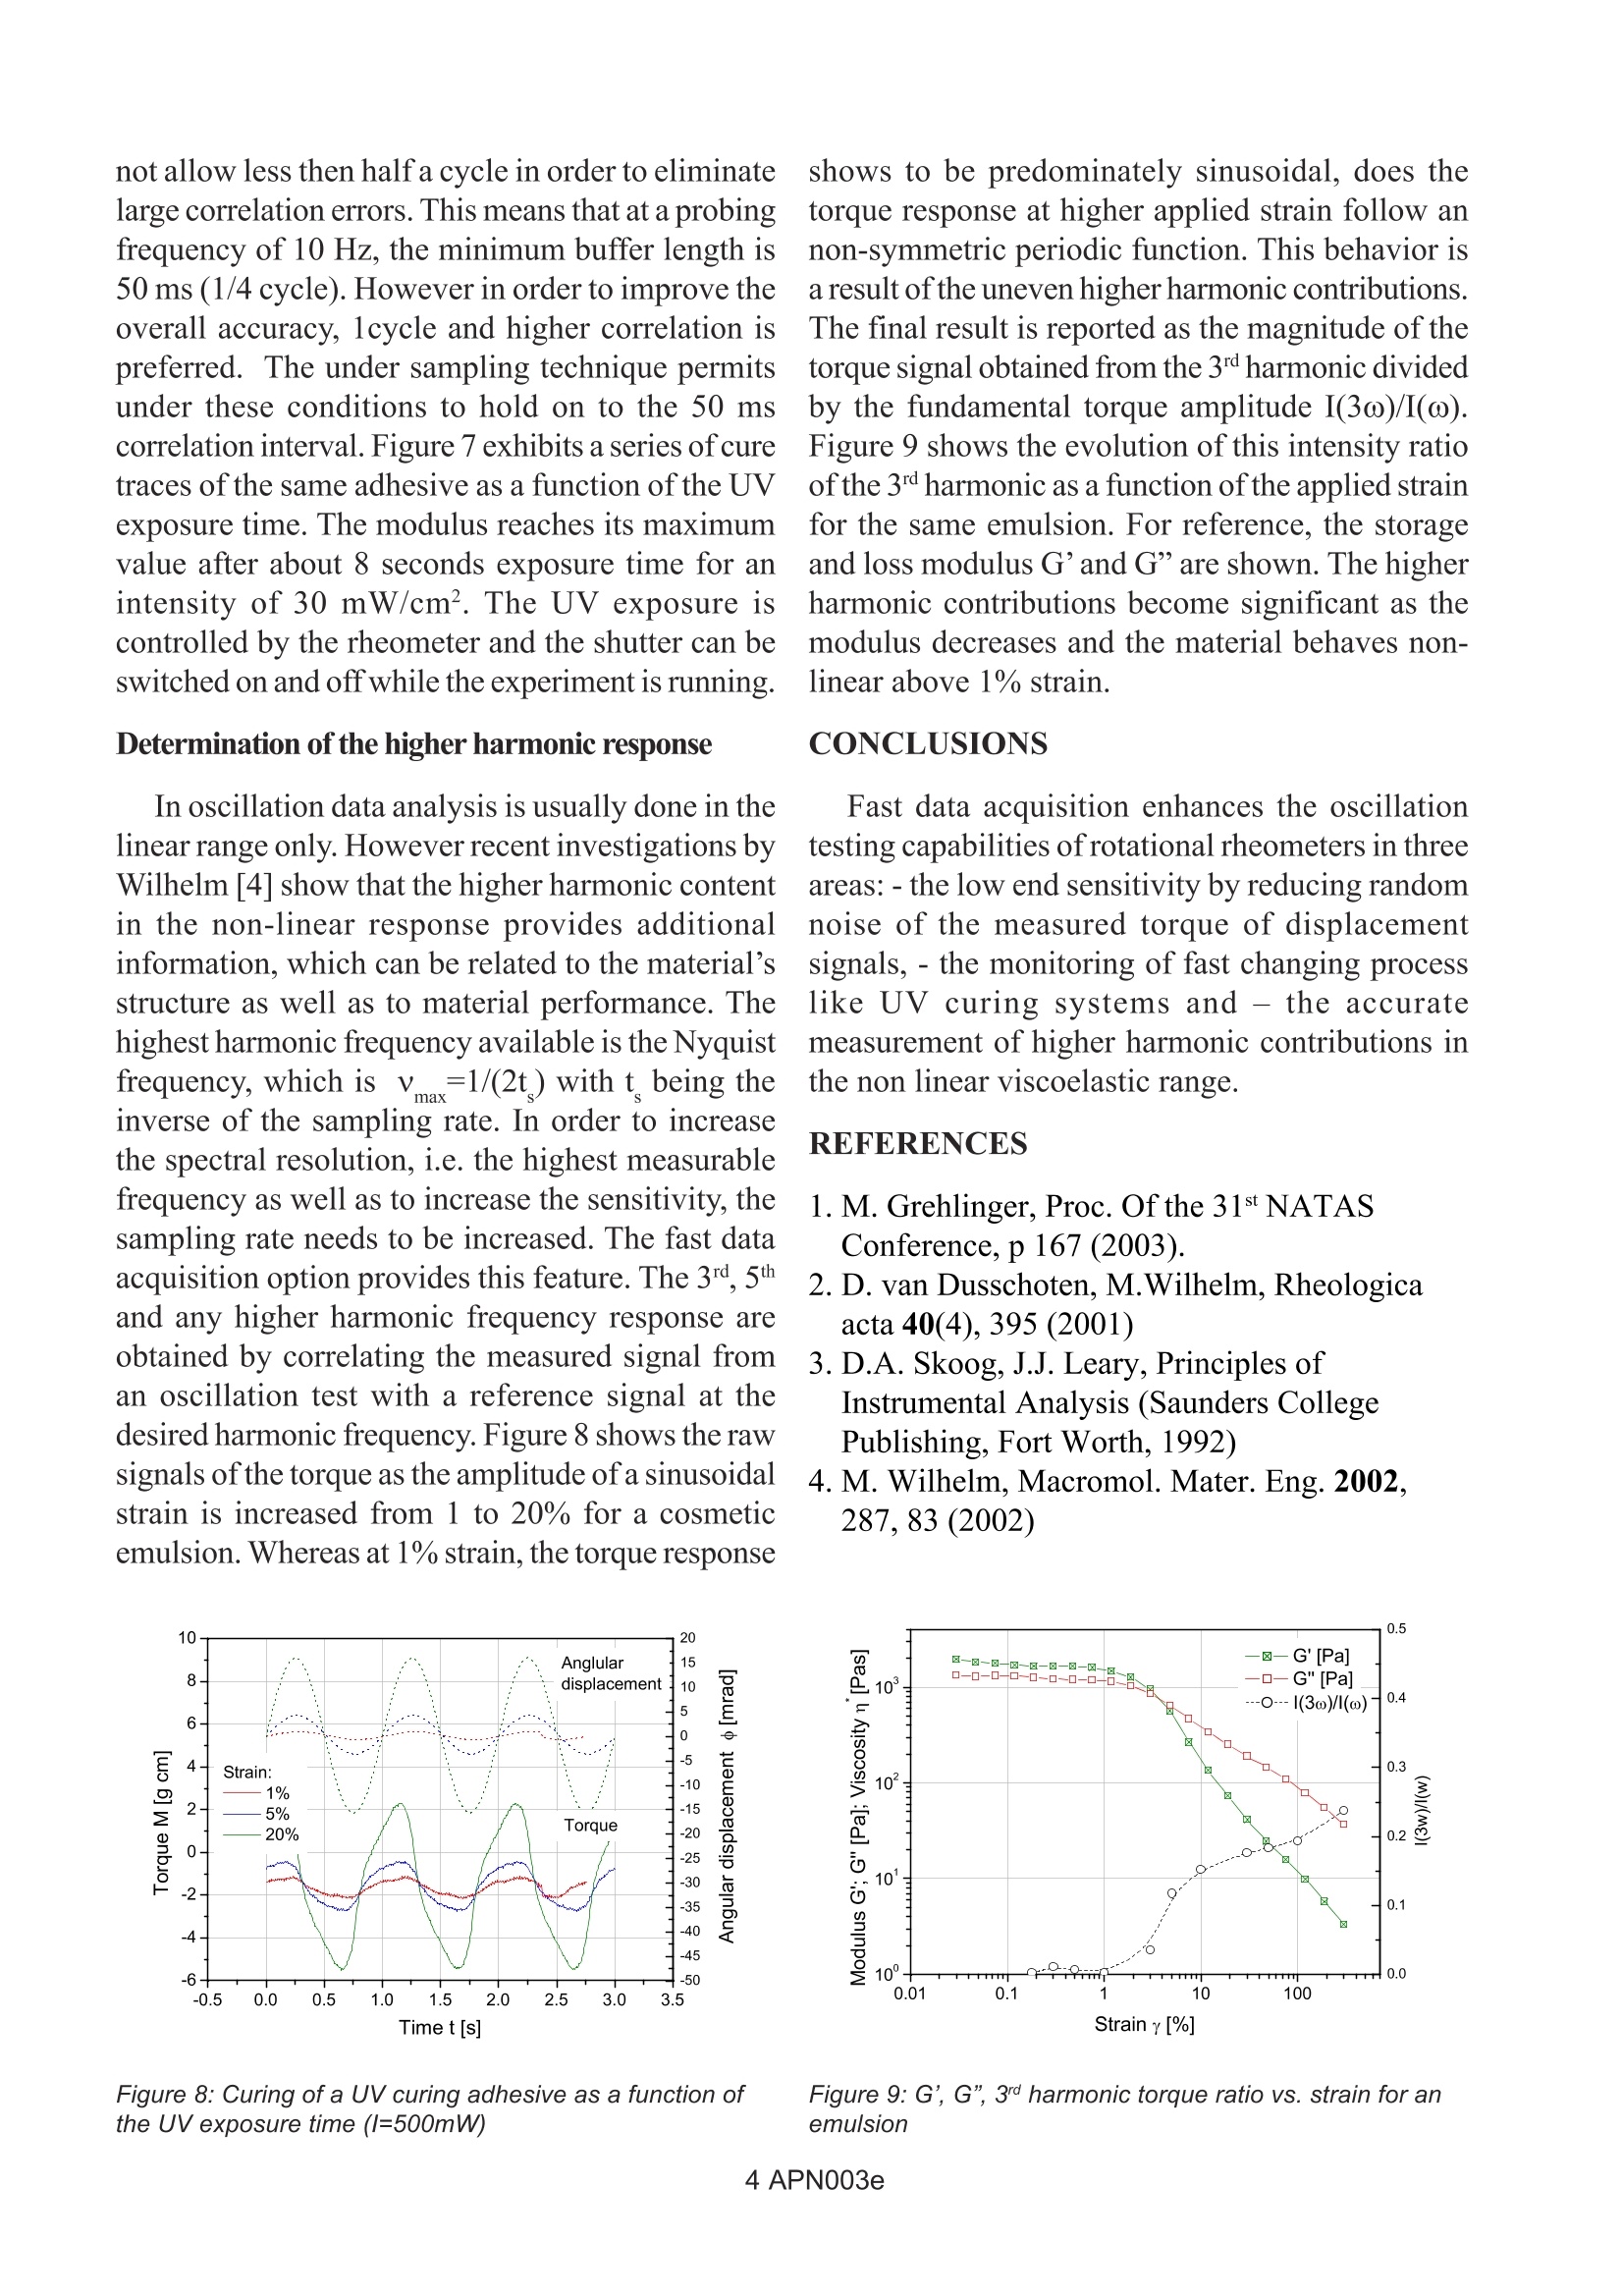
APN003 Benefit of Fast Data Acquisition during Rheological Measurements A. Franck, TA Instruments Germany Keywords: Cross Correlation, Fast data sampling, Fourier transform, UV curing, Rheological measurements made in oscillationin general operate on strong signals, both stress andstrain. With increasing complexity of materials, theneed exists to cover wide ranges in sample modulus(and hence stress and strain) during a singlemeasurement. For dynamic ranges better than 10°,random noise has to be eliminated and systematicerrors corrected in order to insure accurate results.Fast data acquisition combined with a flexiblecorrelation technique is required to improve the lowend performance of an oscillatory rheometer. Theharmonic analysis of large strain amplitudeoscillation tests is becoming a very useful techniqueto characterize subtle differences in materials’structure. A fast data acquisition is a must for theedetermination of magnitude and phase ofthe higher江harmonic response in a non linear oscillation test.UV curable adhesives and coatings change from alow viscosity fluid to an elastic solid within seconds.Fast data sampling associated with a flexiblewindow correlation method can provide up to 100data points per second - thus allowing an accuratemonitoring of rapid changing processes. Figure 1: External fast data acquisition option INTRODUCTION eI c( Fast data sampling is not a requirement forstandard rheological testing because the rheometerinertia limits the measurement to a range above0.01s in transient or below 100Hz in oscillation. Themeasured signals usually are strong and biggerthan random noise. The advanced rheologicalcharacterization of complex fluids or rapidlychanging material systems however requires fasterdata acquisition to increase the dynamic range ofthe torque sensor or to be able to monitor rapidrheological changes. In the following the need forrapid data acquisition in oscillation is demonstratedto: a) reduce random noise and thus increasing thedynamic range of the rheometer, b) monitor therheological changes of UV curable adhesives andc) do higher harmonic analysis in the non-linearoscillation regime. EXPERIMENTAL The measurement of dynamic mechanicalproperties from the transient stress and strain signalsinvolves the calculation of the magnitude of eachof these sinusoidal signals and their respectivephase. In commercial rheometers, the techniquesused are either a discrete Fourier transform or a crosscorrelation algorithm. In the case of the crosscorrelation, the incoming stress and strain signalsare correlated against two reference sine waves ofthe same frequency that are shifted in phase by 90°from each other [1]. For the determination of thehigher harmonics, the reference waves operate atthe desired multiple of the fundamental frequencye.g. the third multiple for the third harmonic. Thecorrelation algorithm provides excellent noiserejection, particularly if the results are integrated Figure 2: Experimental setup with fast data acquisition and UV curing optionover many data points. The ARES instrumentcomputer uses two dedicated A/D converters andcorrelates on a fixed number of 2048 raw data pointswithin the time of minimum one cycle below 2 rad/s. For fast data acquisition the ARES rheometerrhardware has been enhanced with an external A/Dconverter with significantly higher sampling rate, aseparate correlator and special software to interfacethe TAOrchestrator software which automaticallysends the data stream to the instrument datapresentation software (Figure 1). The signals ofstrain and stress are available via BNC connectorsat the back of the instrument and are digitized usinga National Instruments analog to digital converter(PCI-MIO-16XE) with 16 bits of resolution and amaximum sampling rate of 100 kS/s for one channel.The signals are scaled to +/- 5 V full scale, whichcorresponds to the full scale of the torque transducerand to 0.5 radians of angular displacement for themotor. The A/D converter can be manually rescaledf.ex. 0.5 or 0.05 V full scale, to increase the Figure 3: Variation of the phase and modulus withincreasing sampling rate resolution when weak signals are to be expected.The correlator module,“RheoCorr”interfaces thedata acquisition system with the instrument controlsoftware-thus enabling TAOrchestrator to controlthe external hardware (remote control), send overthe appropriate scaling constants and to receive thecalsulated dynamic mechanical data. The correlatormodule has the flexibility to allow independentsetting of the number of correlation cycles(minimum 0.5 cycles), the number of data pointsper cycle (maximum is limited by the sampling rateof the A/D converter) and the correlation frequencyi.e. the interval between correlation operations. Fortesting UV curing materials, the Novacure 2100 UVsource can interface with the external DAQhardware (Figure 2). Lamp shutter and UV intensityare controlled from the operation software duringthe test. Special upper quartz plates are used toIIYilluminate the sample with the UV radiation. Aflexible glass fiber light pipe with 5mm cross sectionconducts the UV light near the UV test fixture. Theradiation intensity is homogeneously redistributedover an area of 20mm of diameter with a collimatorand then reflected onto the upper quartz plate by amirror build into the test fixture stem. ar e RESULTS AND DISCUSSIONSSensitivity and data correlation A high data acquisition rate and optimized datahandling significantly enhances the dynamic rangeof the torque signal i.e. increases the sensitivity ofthe torque transducer. The sensitivity here is definedas the ratio of the detected signal to noise [2]. Thenoise is the uncertainty of the measured quantityand is given by the relative standard deviation ofthe modulus and the phase. In order to increase the Figure 4: Error in phase and modulus with increasingsampling rate Figure 5: Trace of G'and G"during curing, monitored withRheCorr and the ARES correlator S/N ratio, the results are averaged over an increasingnumber of data points. The sensitivity grows in thecase of random noise only, with the square root ofthe measured transient data points S/N~n2 [3]. Theaccuracy of modulus and the phase angle have beenanalyzed as a function of the number of correlationcycles and data points per cycle in figure 3. At lowapplied strain the raw signals show significantscatter, which leads to large variations in thecalculated modulus or phase if only few data pointsare sampled. The figure 4 shows the error in phaseand modulus, which decreases with increasingnumber of data points per cycle, here for a PDMSsample tested at 0.1 Hz and 0.5% strain (0.8mradangular displacement). Little improvement can beseen after 10000 data points. This means, thatsystematic errors are contributing to the noise also.Wilhelm and al. used an over-sampling method [2]to reduce the large data sets for the Fouriertransformation after the data acquisition. Since thecross correlation technique can easily handle largedata sets (300 000 data points for the example infigure 3) over-sampling thus is not necessary toimprove accuracy. Monitoring the changes of UV curing adhesives UV curing materials are the choice, if fast settingof an adhesive or a coating is required. Since thesesystems cure within seconds, fast data acquisitionis necessary to monitor the rheological change in arheometer. Figure 5 shows the cure behavior of anUV curing adhesive. At a probing frequency of 10HztheARES correlator uses several cycles and collectsone data point every 5 seconds. The externalcorrelator“RheoCorr”combined with the fast dataacquisition is able to provide a data point every 50 Figure 6: Under-sampled data correlation technique ms i.e. 20 points per second - thus monitoring thecure much closer with no loss of accuracy (Theresults of the external and the standard AREScorrelator virtually superpose in Figure5). In orderto generate a data point every 50 ms and still beable to correlate over one full cycle, an under-sampling technique is used (Figure 6). In this casethe digitized analog signal data of the last 100 ms(which equals the time of one cycle at 10 Hz) arekept in a buffer and every 50 ms the correlation ofthe buffer data provides a new value for the modulus.Under these experimental conditions, 50% of theraw data in the buffer is old every time a newmodulus value is determined and the modulus is anaverage value over the correlation period. Theparameter controlling the resolution in time duringa cure is the time necessary to fill or renew the buffer.The buffer time is directly related to the testfrequency. Theoretically, a quarter of a cycle issufficient to perform a correlation,“RheCorr”does not allow less then half a cycle in order to eliminatelarge correlation errors. This means that at a probingfrequency of 10 Hz, the minimum buffer length is50 ms (1/4 cycle). However in order to improve theoverall accuracy, 1cycle and higher correlation ispreferred. The under sampling technique permitsunder these conditions to hold on to the 50 mscorrelation interval. Figure 7 exhibits a series ofcuretraces of the same adhesive as a function of the UVexposure time. The modulus reaches its maximumvalue after about 8 seconds exposure time for anintensity of 30 mW/cm². The UV exposure iscontrolled by the rheometer and the shutter can beswitched on and off while the experiment is running. Determination of the higher harmonic response In oscillation data analysis is usually done in thelinearrange only. However recent investigations byWilhelm [4] show that the higher harmonic contentin the non-linear response provides additionalinformation, which can be related to the material’sstructure as well as to material performance. Thehighest harmonic frequency available is the Nyquistfrequency, which is v=1/(2t) with t being theinverse of the sampling rate. In order to increasethe spectral resolution, i.e. the highest measurablefrequency as well as to increase the sensitivity, thesampling rate needs to be increased. The fast dataacquisition option provides this feature. The 3rd, 5thand any higher harmonic frequency response areobtained by correlating the measured signal froman oscillation test with a reference signal at thedesired harmonic frequency. Figure 8 shows the rawsignals of the torque as the amplitude of a sinusoidalstrain is increased from 1 to 20% for a cosmeticemulsion. Whereas at 1% strain, the torque response Figure 8: Curing of a UV curing adhesive as a function ofthe UV exposure time (/=500mW) shows to be predominately sinusoidal, does thetorque response at higher applied strain follow annon-symmetric periodic function. This behavior isa result of the uneven higher harmonic contributions.The final result is reported as the magnitude of thetorque signal obtained from the 3rd harmonic dividedby the fundamental torque amplitude I(3ω)/I(ω).Figure 9 shows the evolution of this intensity ratioofthe 3d harmonic as a function ofthe applied strainfor the same emulsion. For reference, the storageand loss modulus G'and G" are shown. The higherharmonic contributions become significant as themodulus decreases and the material behaves non-linear above 1% strain. CONCLUSIONS Fast data acquisition enhances the oscillationtesting capabilities of rotational rheometers in threeareas: - the low end sensitivity by reducing randomnoise of the measured torque of displacementsignals,-the monitoring of fast changing processlike UV curing systems and -the accuratemeasurement of higher harmonic contributions inthe non linear viscoelastic range. REFERENCES 1. M. Grehlinger, Proc. Of the 31st NATASConference,p 167 (2003). 2. D. van Dusschoten, M.Wilhelm, Rheologicaacta 40(4),395 (2001) 3. D.A. Skoog, J.J. Leary, Principles ofInstrumental Analysis (Saunders CollegePublishing, Fort Worth, 1992) 4. M. Wilhelm, Macromol. Mater. Eng. 2002,287, 83 (2002) Figure 9: G, G”,3rd harmonic torque ratio vs. strain for anemulsion APN Rheological measurements made in oscillation in general operate on strong signals, both stress and strain. With increasing complexity of materials, the need exists to cover wide ranges in sample modulus (and hence stress and strain) during a single measurement. For dynamic ranges better than 106, random noise has to be eliminated and systematic errors corrected in order to insure accurate results. Fast data acquisition combined with a flexible correlation technique is required to improve the low end performance of an oscillatory rheometer. The harmonic analysis of large strain amplitude oscillation tests is becoming a very useful technique to characterize subtle differences in materials’ structure. A fast data acquisition is a must for the determination of magnitude and phase of the higher harmonic response in a non linear oscillation test. UV curable adhesives and coatings change from a low viscosity fluid to an elastic solid within seconds. Fast data sampling associated with a flexible window correlation method can provide up to 100 data points per second – thus allowing an accurate monitoring of rapid changing processes.
确定

还剩2页未读,是否继续阅读?

产品配置单
TA仪器为您提供《材料(流变测量)中高速数据采集检测方案(流变仪)》,该方案主要用于其他中高速数据采集检测,参考标准--,《材料(流变测量)中高速数据采集检测方案(流变仪)》用到的仪器有TA仪器Discovery 流变仪
推荐专场
相关方案
更多
该厂商其他方案
更多