


方案详情
文
在当今日益激烈的竞争环境下,高性能先进材料的开发尤为重要。许多材料制造商不在专注于单一产品领域,而是越来越趋向于多元化。以至于现在开发研究实验室经常研究一系列有明显的不同物理和化学性质的材料。因为这个原因,分析仪器必须非常灵活,它必须能够容纳存在各种各样的物理状态的样品且不影响其灵敏度和重现性。动态力学分析(DMA)也不例外,本文将讨论使用DMA测量系列材料的粘弹性特征,包括液体、聚脂薄膜、乳胶、预浸料坯和复合材料。
方案详情

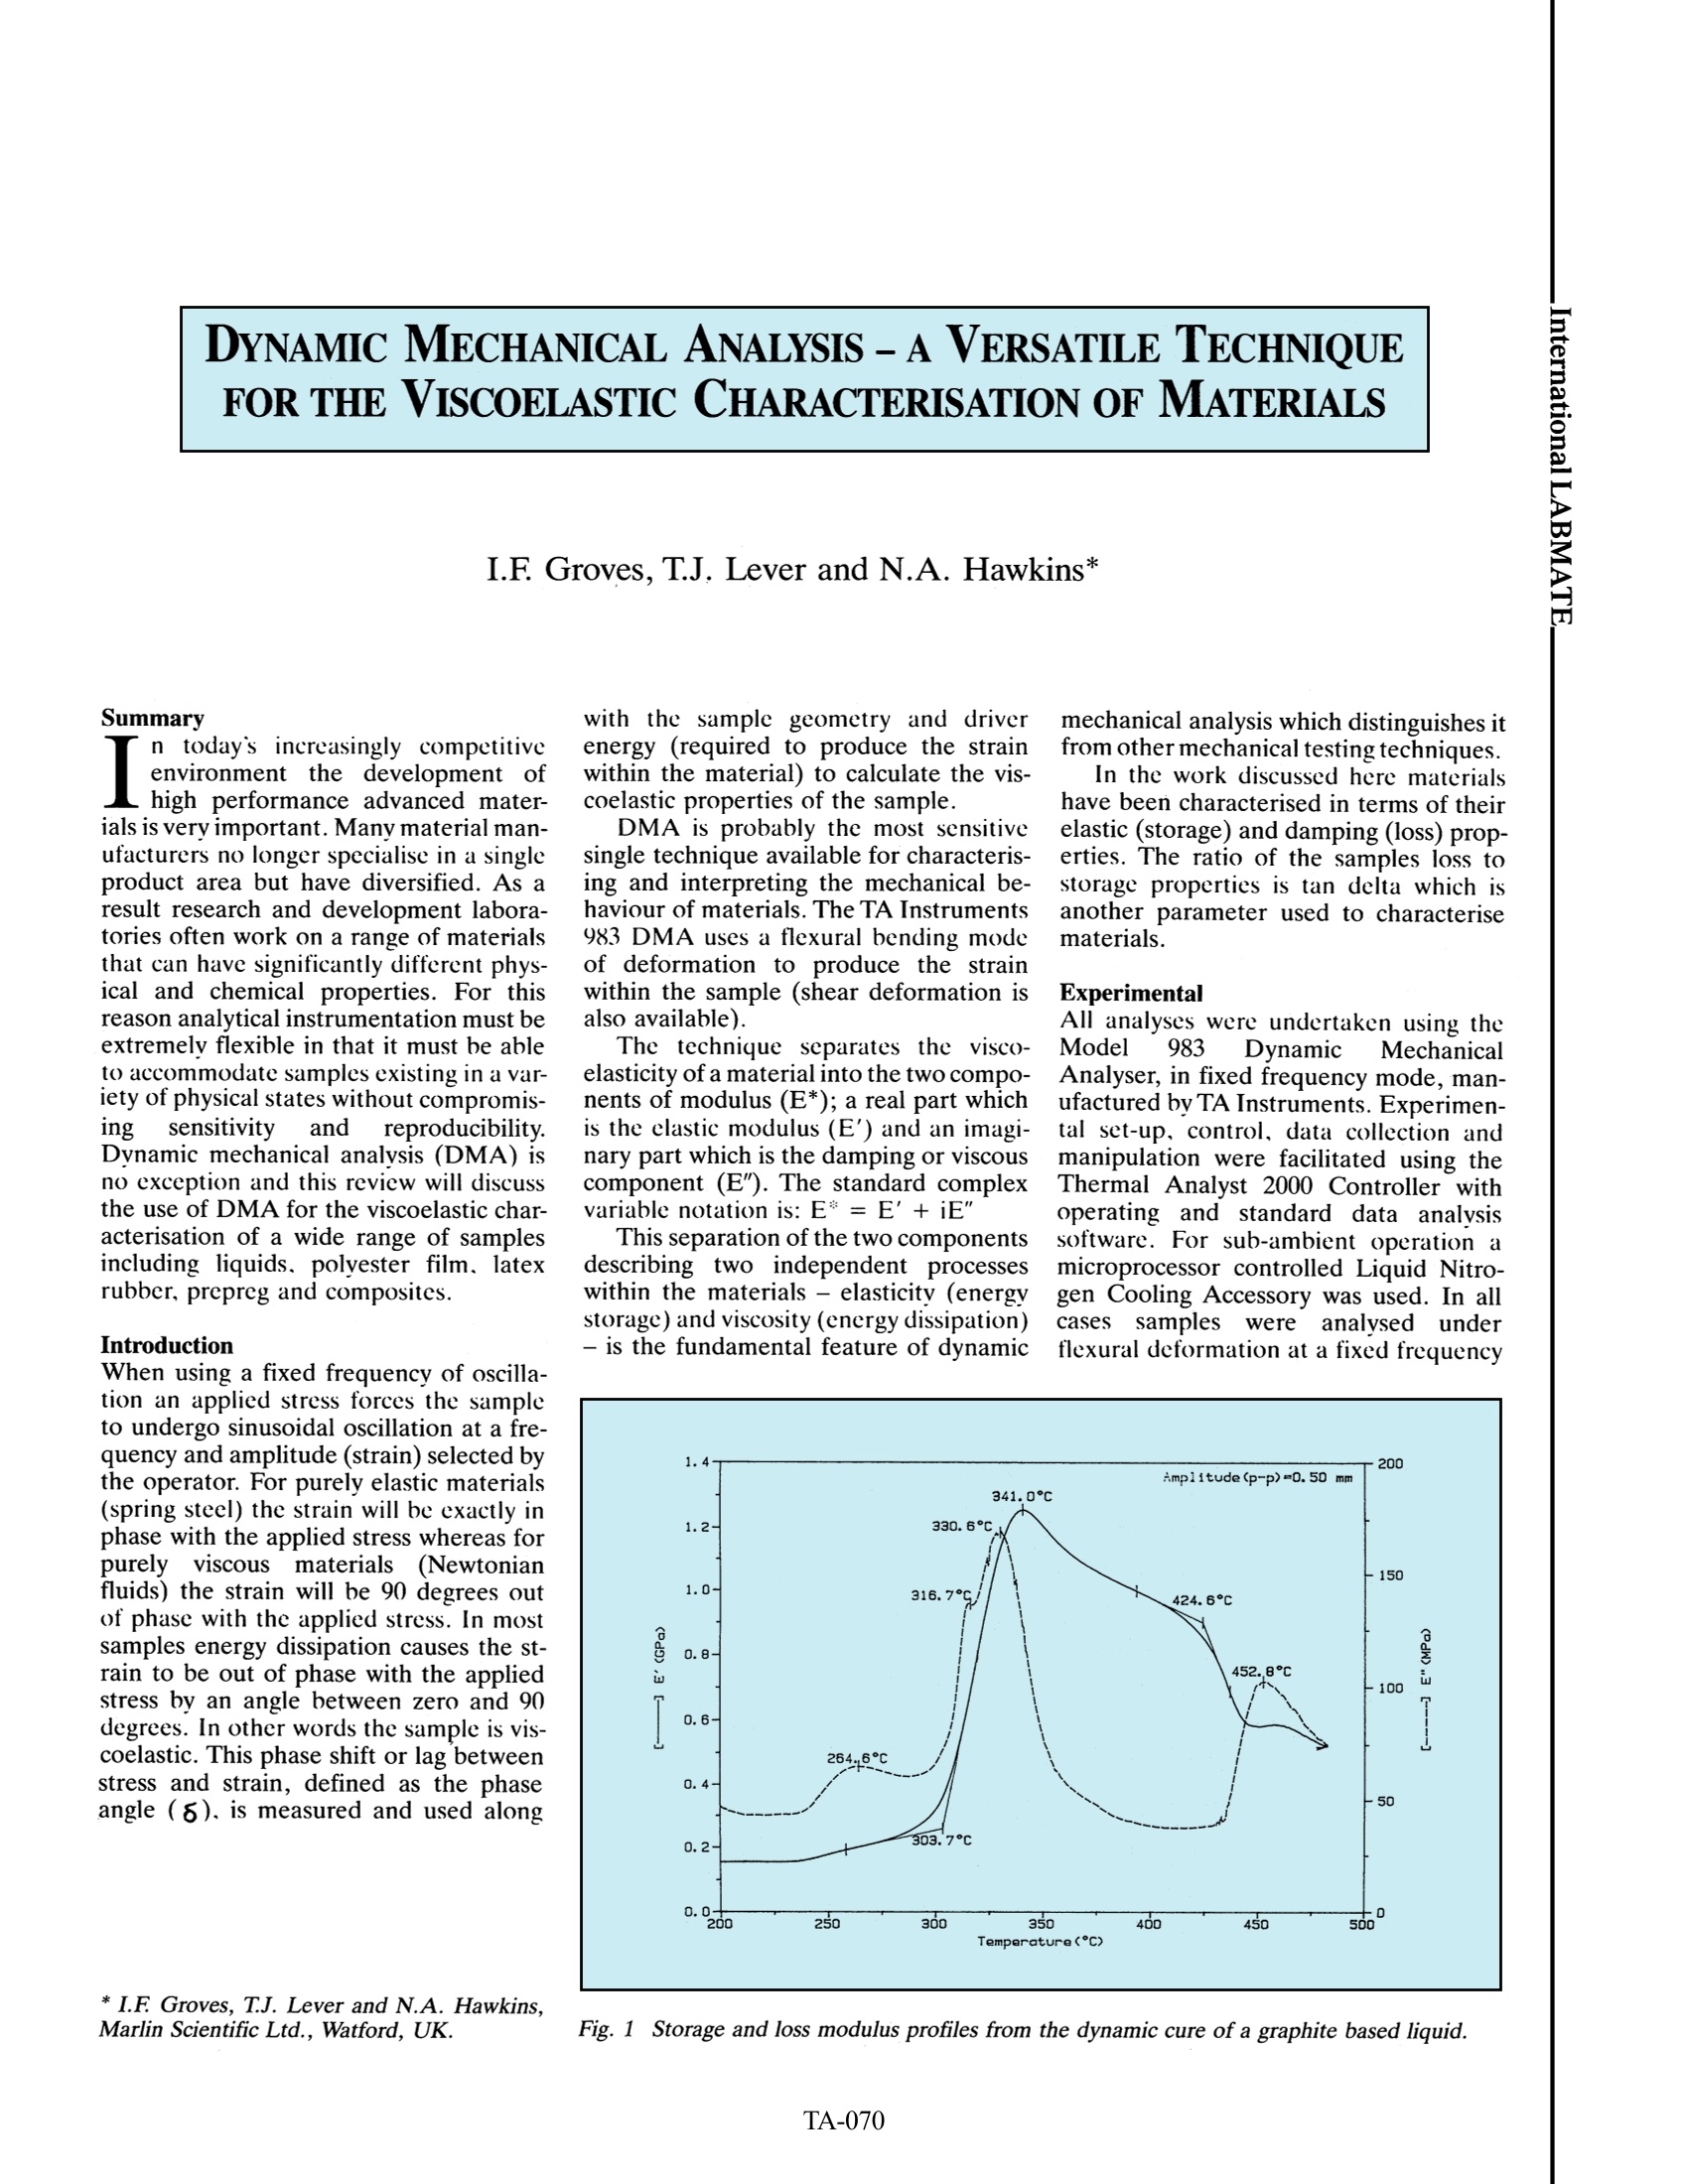
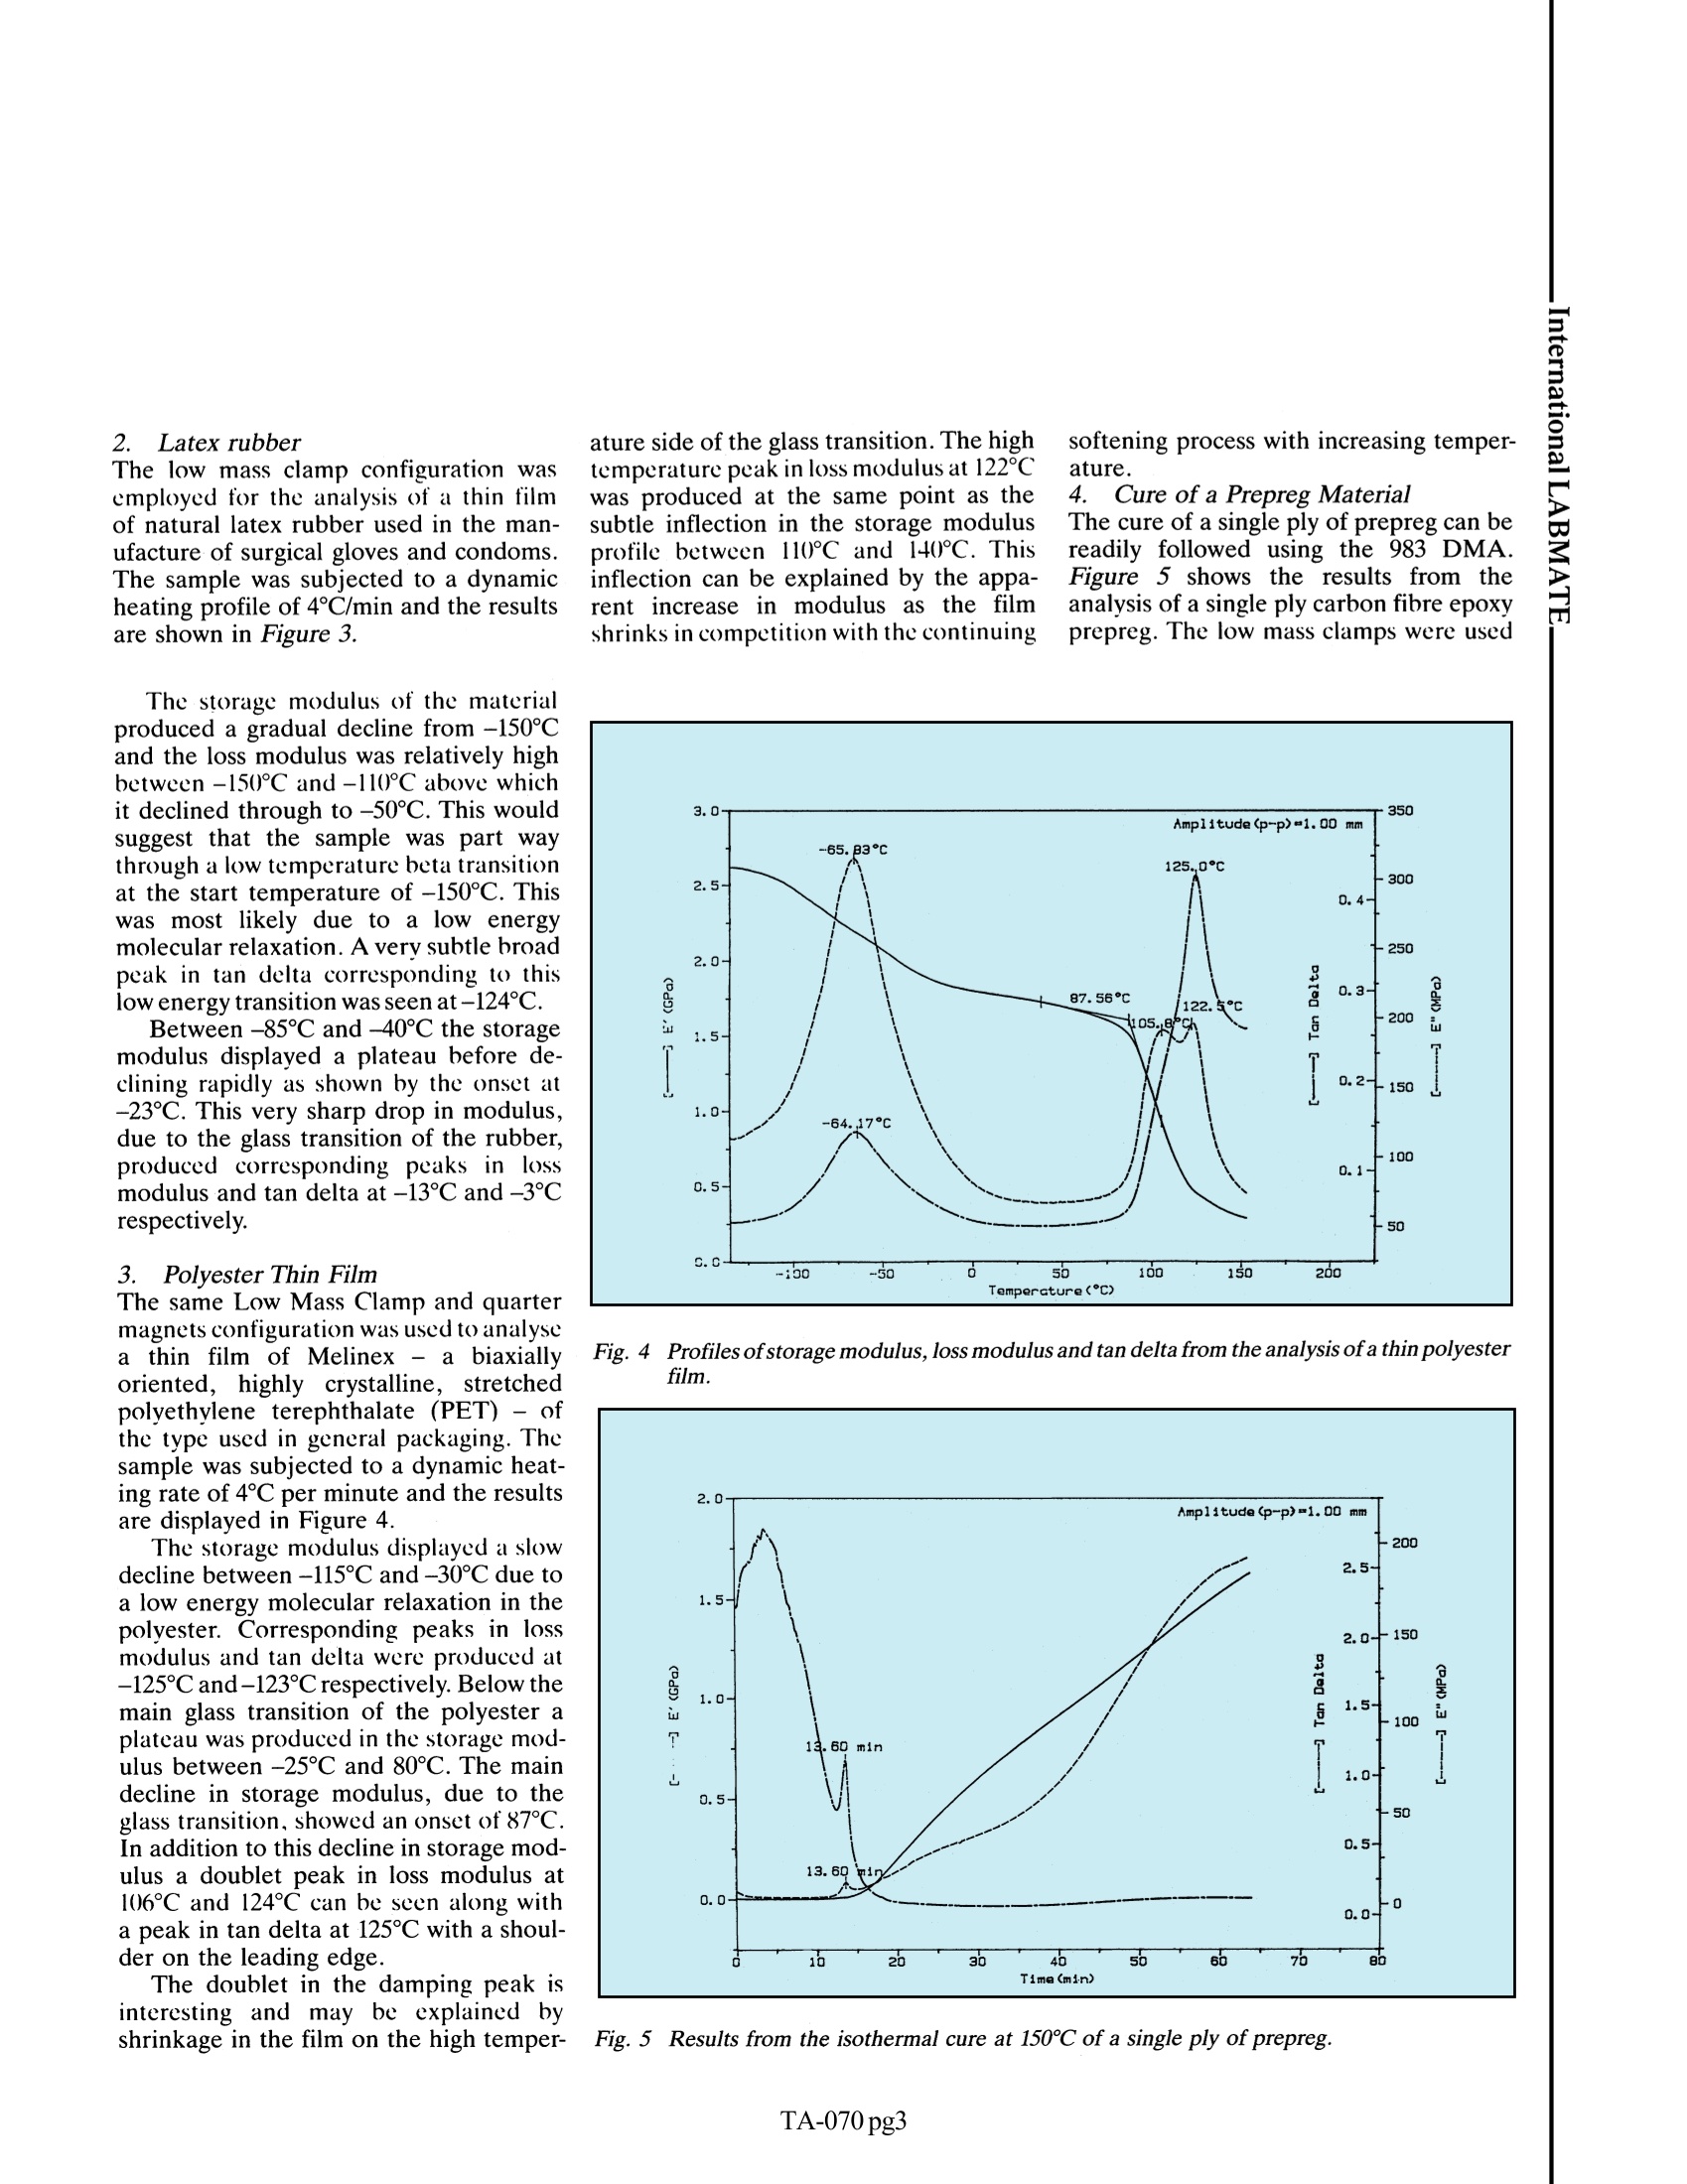
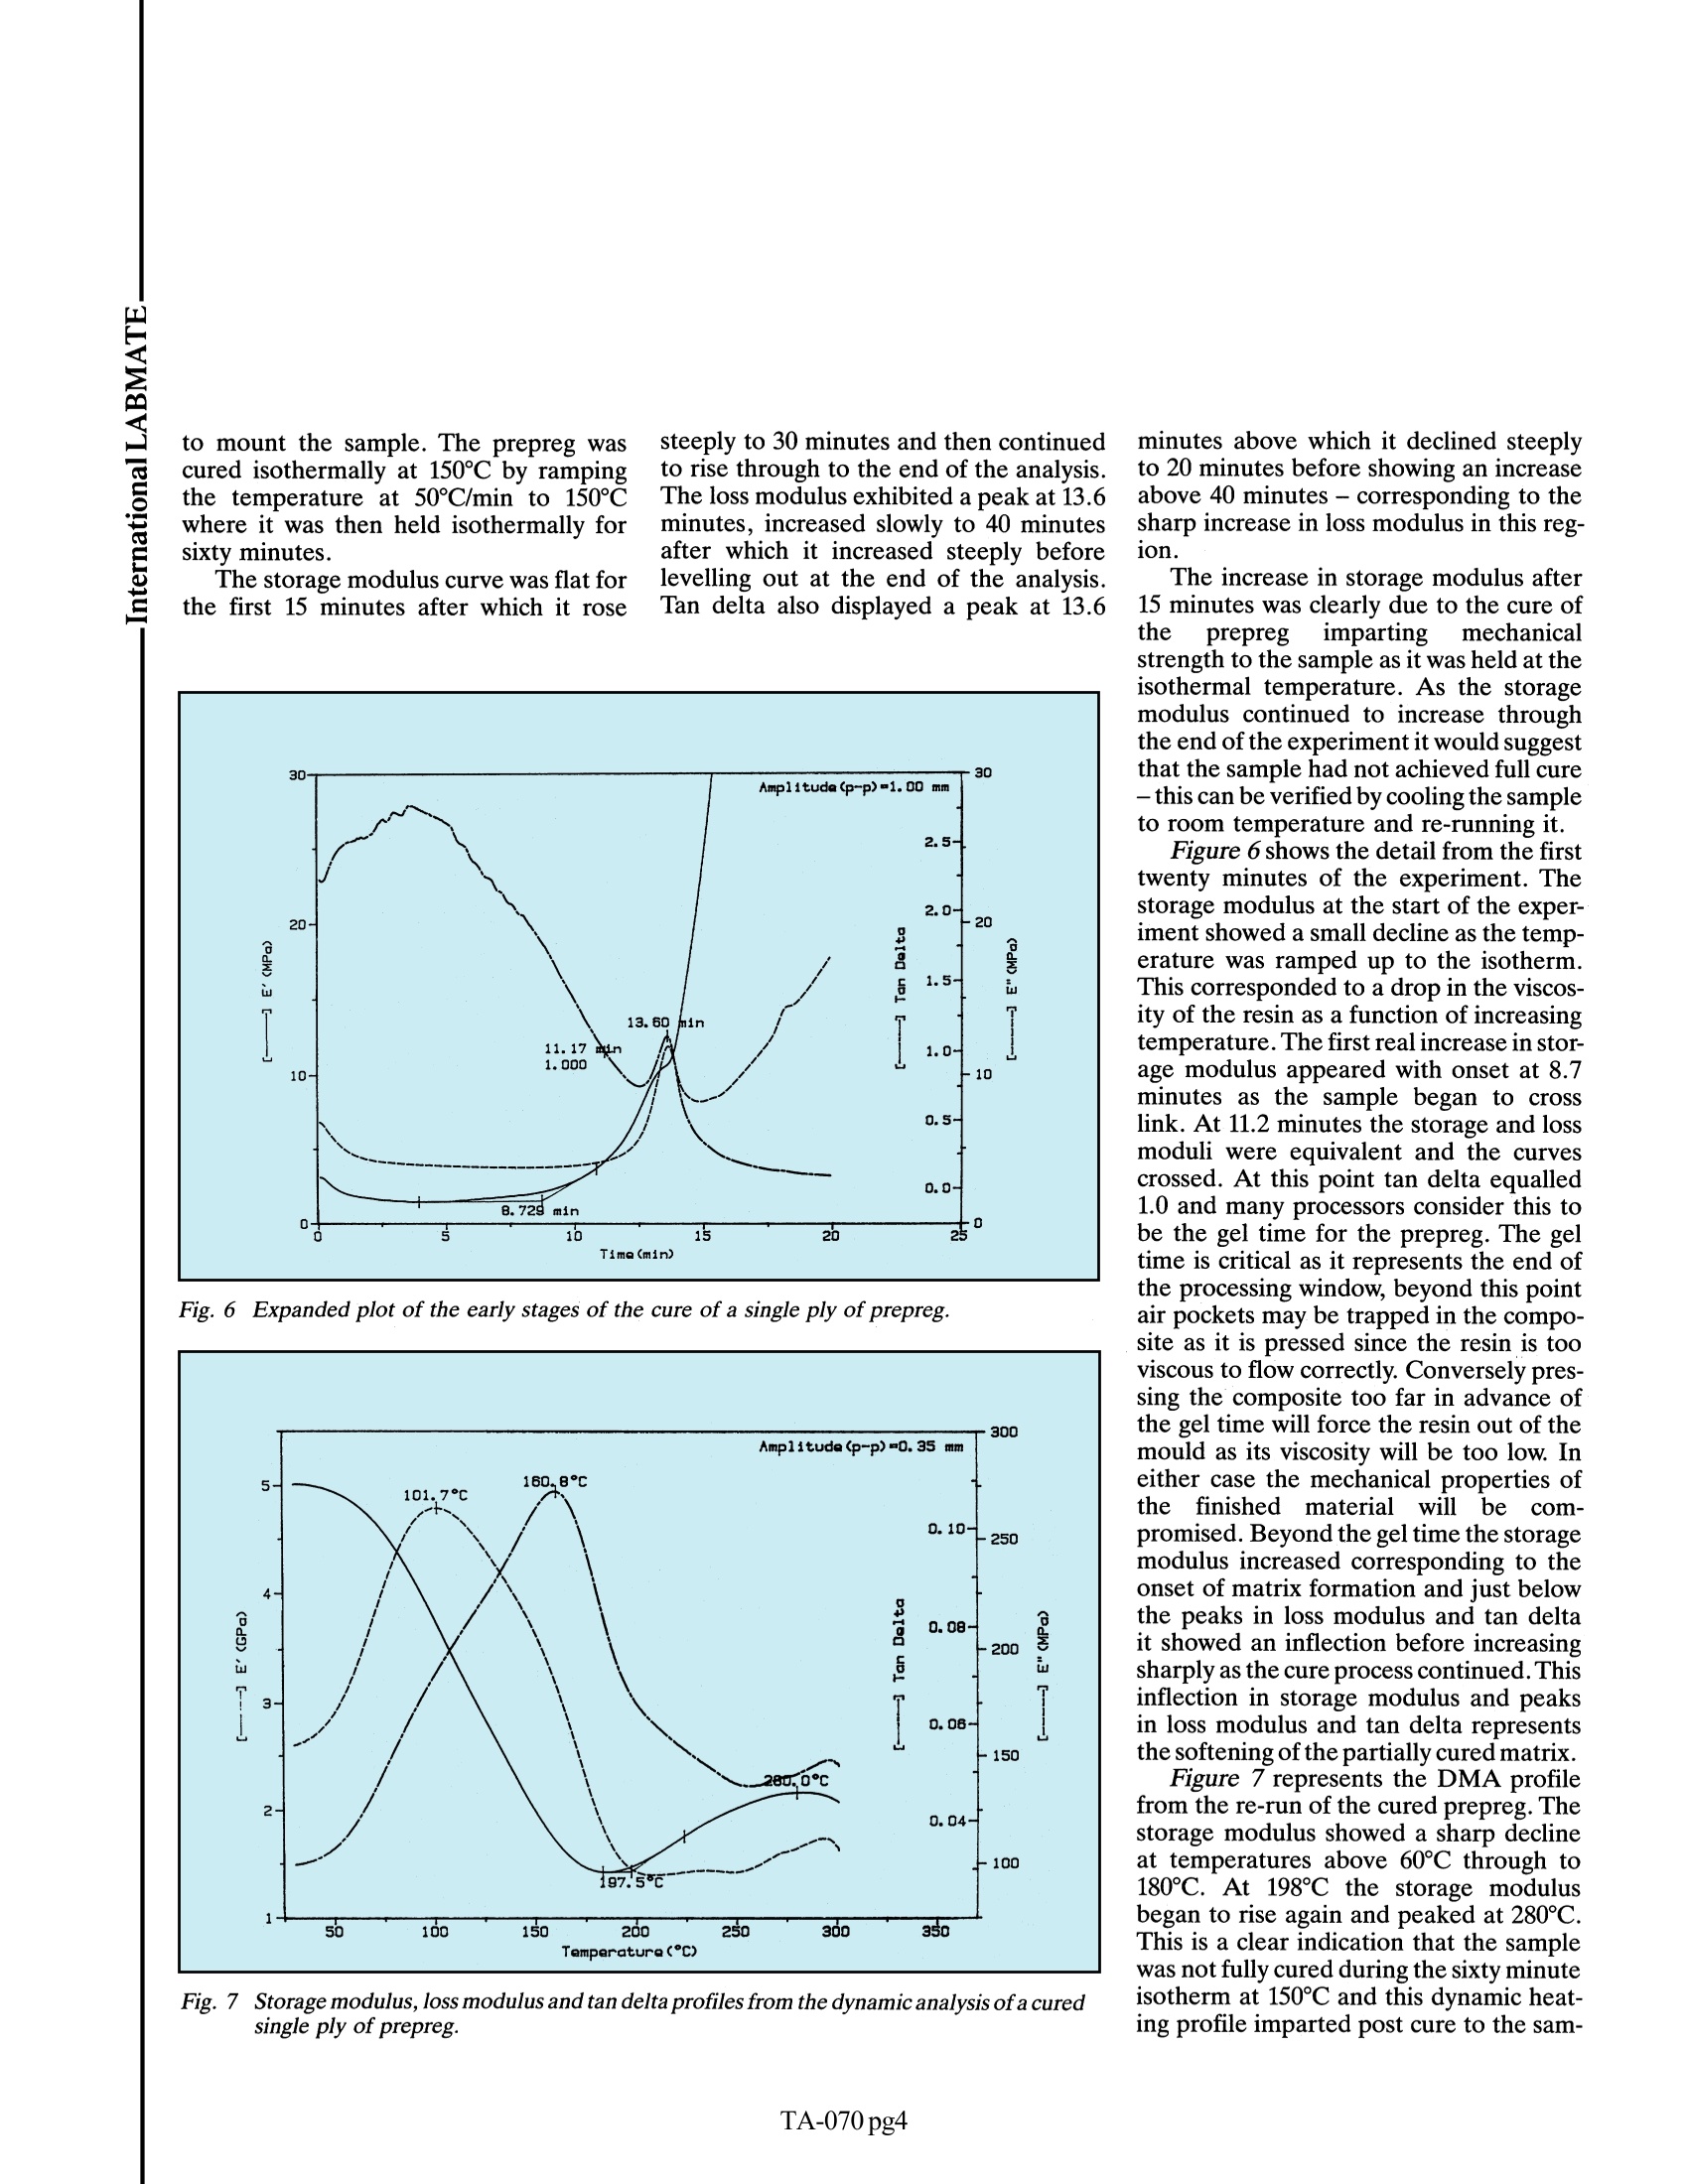
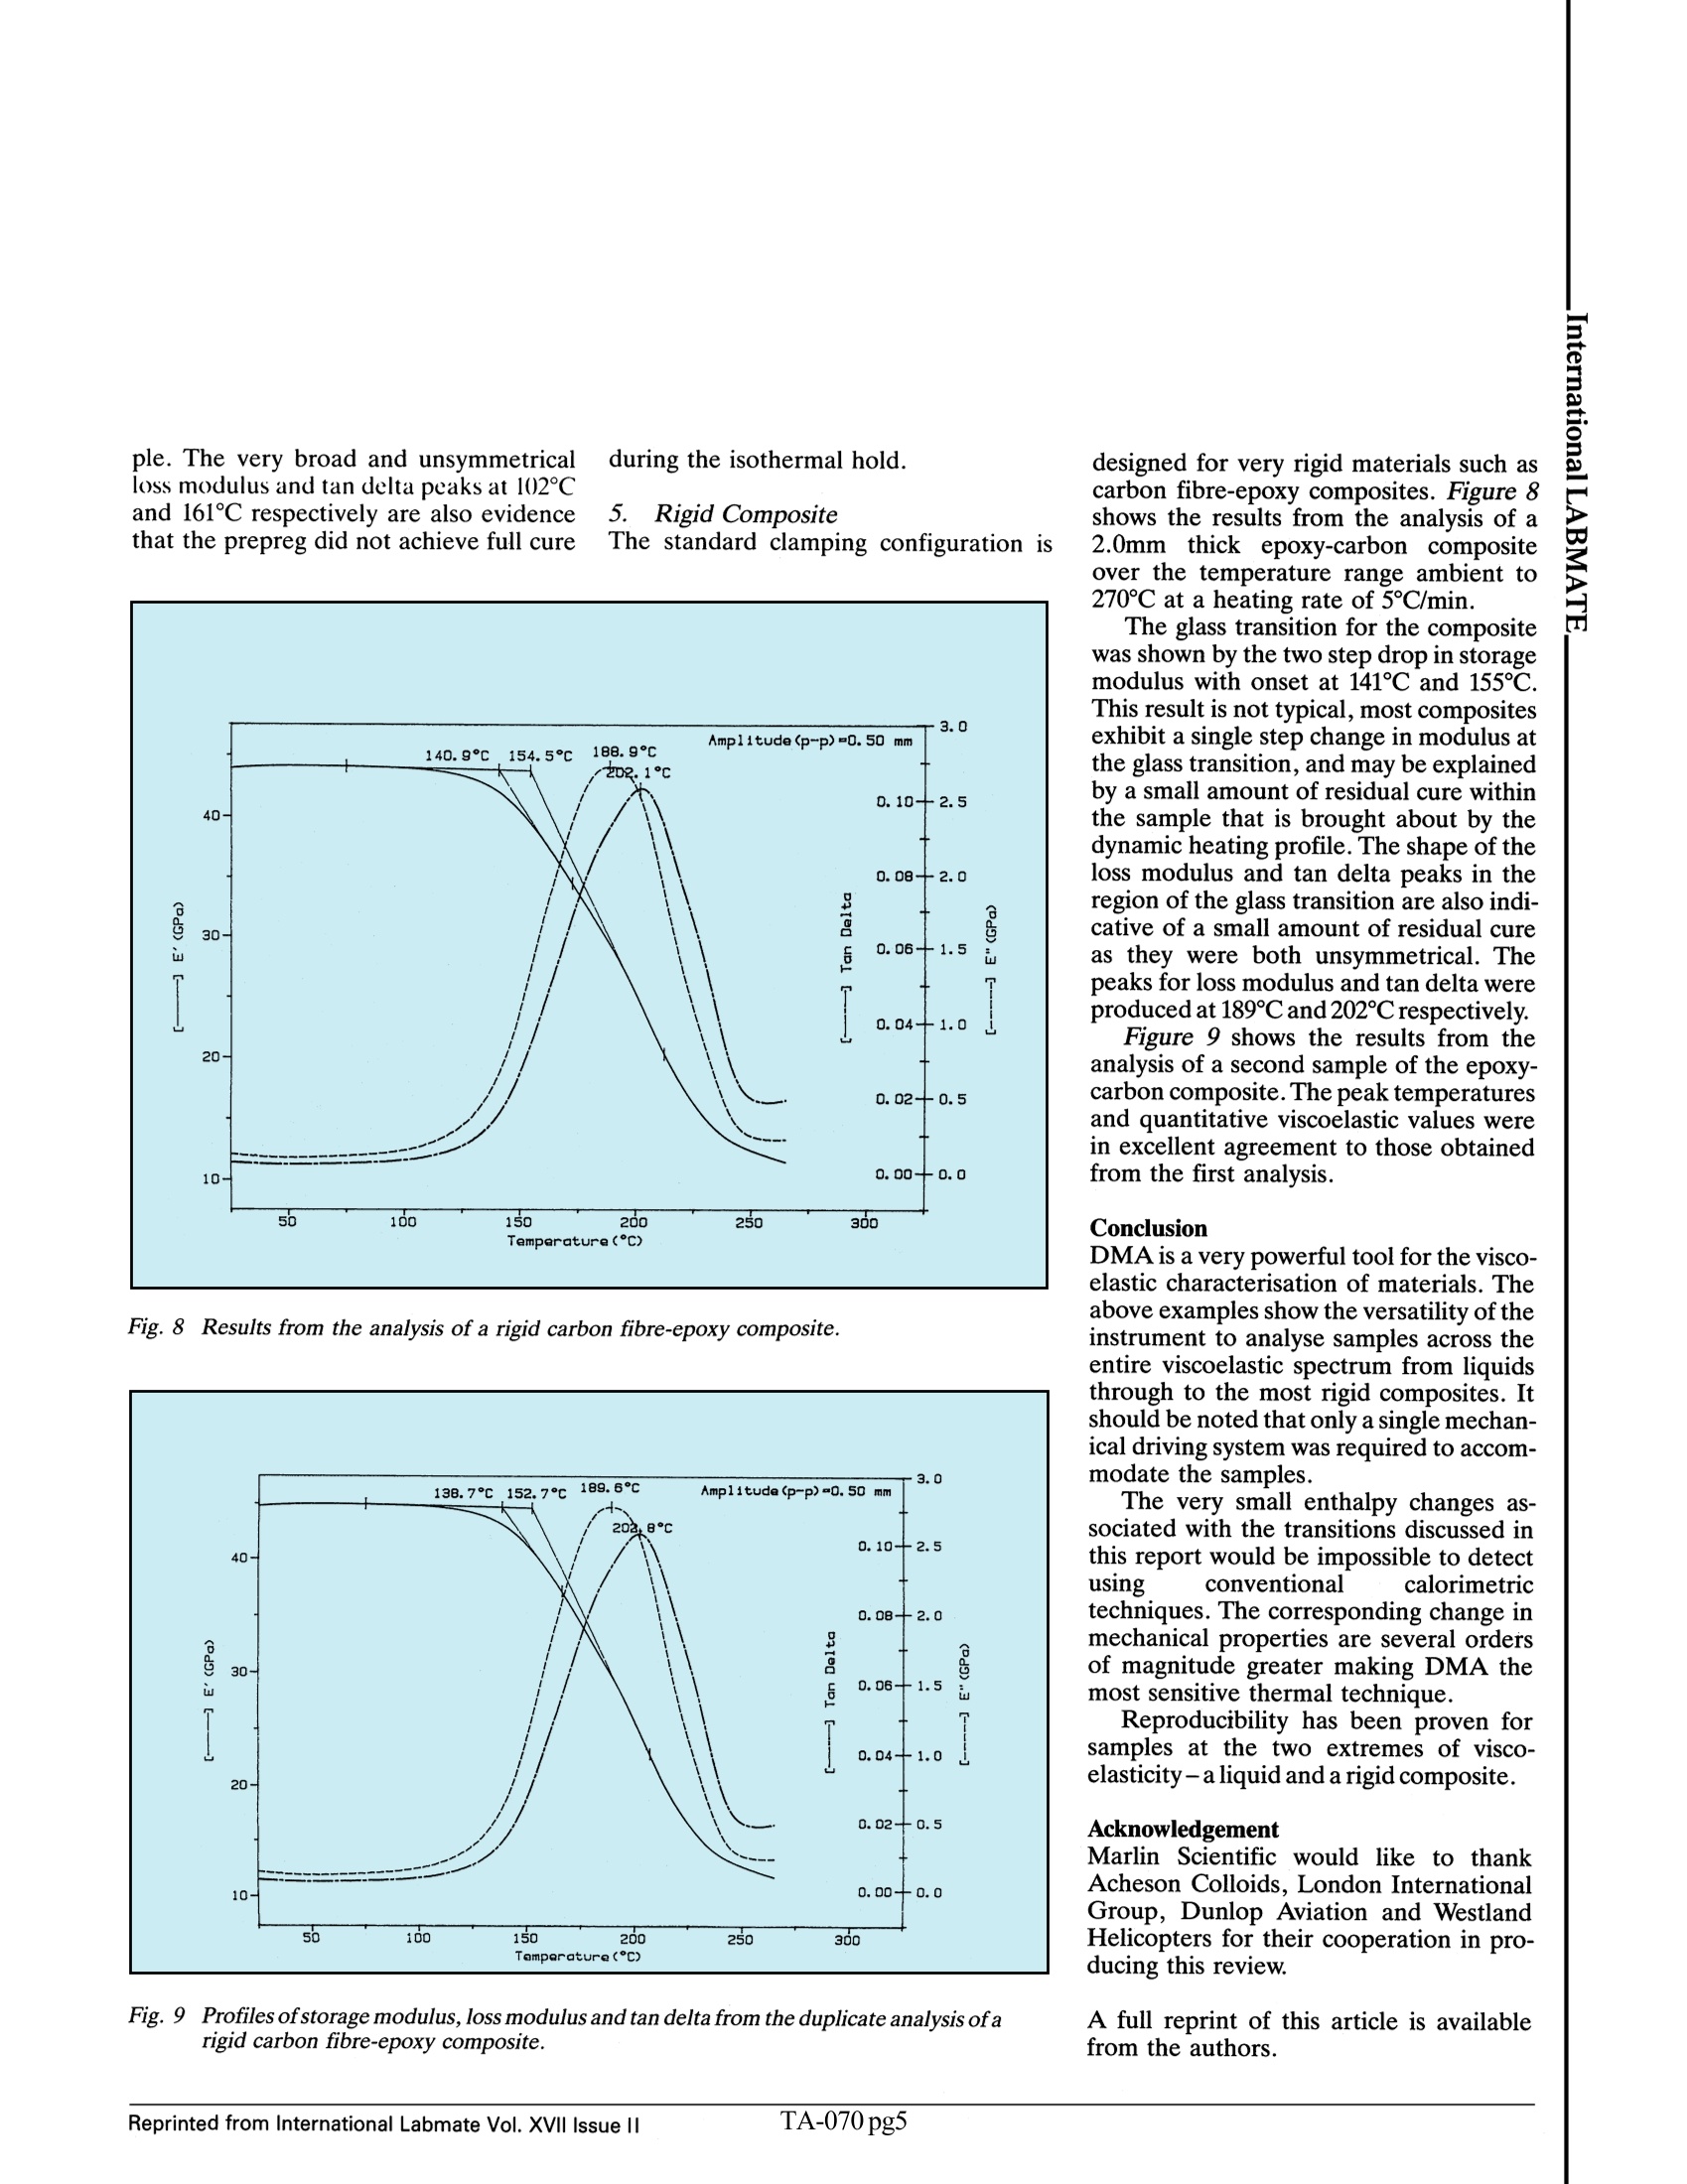
DYNAMIC MECHANICAL ANALYSIS-A VERSATILE TECHNIQUEFOR THE VISCOELASTIC CHARACTERISATION OF MATERIALS I.F. Groves,T.J. Lever and N.A. Hawkins* Summary n today’s increasingly competitiveenvironment the development ofhigh performance advanced mater-ials is very important. Many material man-ufacturers no longer specialise in a singleproduct area but have diversified. As aresult research and development labora-tories often work on a range of materialsthat can have significantly different phys-ical and chemical properties. For thisreason analytical instrumentation must beextremely flexible in that it must be ableto accommodate samples existing in a var-iety of physical states without compromis-ing sensitivity and reproducibility.Dynamic mechanical analysis (DMA) isno exception and this review will discussthe use of DMA for the viscoelastic char-acterisation of a wide range of samplesincluding liquids. polyester film. latexrubber, prepreg and composites. Introduction When using a fixed frequency of oscilla-tion an applied stress forces the sampleto undergo sinusoidal oscillation at a fre-quency and amplitude (strain) selected bythe operator. For purely elastic materials(spring steel) the strain will be exactly inphase with the applied stress whereas forpurely viscous materials (Newtonianfluids) the strain will be 90 degrees outof phase with the applied stress. In mostsamples energy dissipation causes the st-rain to be out of phase with the appliedstress by an angle between zero and 90degrees. In other words the sample is vis-coelastic. This phase shift or lag betweenstress and strain, defined as the phaseangle (6). is measured and used along with the sample geometry and driverenergy (required to produce the strainwithin the material) to calculate the vis-coelastic properties of the sample. DMA is probably the most sensitivesingle technique available for characteris-ing and interpreting the mechanical be-haviour of materials. The TA Instruments983 DMA uses a flexural bending modeof deformation to produce the strainwithin the sample (shear deformation isalso available). The technique separates the visco-elasticity of a material into the two compo-nents of modulus (E*); a real part whichis the elastic modulus (E') and an imagi-nary part which is the damping or viscouscomponent (E"). The standard complexvariable notation is: E*= E'+ iE" This separation of the two componentsdescribing two independent processeswithin the materials - elasticity (energystorage) and viscosity (energy dissipation)- is the fundamental feature of dynamic mechanical analysis which distinguishes itfrom other mechanical testing techniques. In the work discussed here materialshave been characterised in terms of theirelastic (storage) and damping (loss) prop-erties. The ratio of the samples loss tostorage properties is tan delta which isanother parameter used to characterisematerials. Experimental All analyses were undertaken using theModel 983 Dynamic MechanicalAnalyser, in fixed frequency mode, man-ufactured by TA Instruments. Experimen-tal set-up, control, data collection andmanipulation were facilitated using theThermal Analyst 2000 Controller withoperating and standard data analysissoftware. For sub-ambient operation amicroprocessor controlled Liquid Nitro-gen Cooling Accessory was used. In allcases samples wereanalysed underflexural deformation at a fixed frequency sensitive to damping), and the two timedependent modes of Stress Relaxationand Creep which monitor a material’s abil-ity to withstand loading and deformationinfluences. Thus complete viscoelastic It should be noted that along with theFixed Frequency mode of operation dis-cussed here, the 983 DMA can also oper-ate in Resonant Frequency mode (more Fig. 2 Results from the duplicate analysis of a graphite based liquid. Fig. 3 Storage modulus, loss modulus and tan delta profiles from the dynamic analysis of a thinlatex film. characterisation is possible within thesingle instrument. Results 1. Liquid Curing Systems Figure 1 shows the results from theanalysis of a graphite based liquid used inthe coating of metals. The liquid wasapplied to a glass braid and clamped inthe vertical plane using low mass clampsspecifically designed for the analysis oflow modulus and thin film materials.Thisflexural mode of deformation is lesssevere than shear and eliminates anybuckling of the sample. Using quarter sizemagnets in the electromagnetic motorgives improved signal to noise responsefrom the mechanical drive assembly. Adynamic temperature ramp of 5℃/minwas used. Below 200℃ the sample was a very lowviscosity liquid and the only mechanicalcontribution to the system was from theglass braid support cloth. At around235℃the sample began to cure as shown by thegentle increase in storage modulus. Above304℃ there was a significant increase instorage modulus corresponding to therapid increase in cross link density as cureproceeded. The storage modulus for thesample reached a maximum at 341℃ andslowly declined to 425℃ beyond which itdisplayed a precipitous drop correspond-ing to decomposition within the sample. The loss modulus displayed a peak at265C as the sample began to cure (thiscould be attributable to the gel point). Asubtle peak in loss modulus was seen at317℃ corresponding to the point ofgreatest rate of change in storage mod-ulus. The loss modulus peaked at 331℃,declined rapidly to 360℃, levelled off to430℃ and then peaked at 453℃ whichcorresponded to the decomposition. The reproducibility of the technique isrepresented in Figure 2. The analysis of asecond sample of the same material pro-duced results with a very similar profileto those discussed above and with temper-atures of the various thermal events withina few degrees of each other. It is importantto note that in both of the above analysesthe viscoelastic properties cannot be con-sidered quantitative due to the contribu-tion of the glass braid and the fact thatthe liquid sample cannot be appliedevenly. The examples do show howeverthe value of the technique to monitor thecure profile of liquid samples. 2. Latex rubber The low mass clamp configuration wasemployed for the analysis of a thin filmof natural latex rubber used in the man-ufacture of surgical gloves and condoms.The sample was subjected to a dynamicheating profile of 4℃/min and the resultsare shown in Figure 3. The storage modulus of the materialproduced a gradual decline from -150℃and the loss modulus was relatively highbetween -150℃ and -110°℃ above whichit declined through to -50℃. This wouldsuggest that the sample was part waythrough a low temperature beta transitionat the start temperature of -150°℃. Thiswas most likely due to a low energymolecular relaxation. A verv subtle broadpeak in tan delta corresponding to thislowenergy transition was seen at -124℃. Between -85℃ and -40℃ the storagemodulus displayed a plateau before de-clining rapidly as shown by the onset at-23℃. This very sharp drop in modulus,due to the glass transition of the rubber,produced corresponding peaks in lossmodulus and tan delta at-13℃and-3℃respectively. 3. Polyester Thin Film The same Low Mass Clamp and quartermagnets configuration was used to analysea thin film of Melinex - abiaxiallyoriented, highly crystalline, stretchedpolyethylene terephthalate (PET) - ofthe type used in general packaging. Thesample was subjected to a dynamic heat-ing rate of 4℃ per minute and the resultsare displayed in Figure 4. The storage modulus displayed a slowdecline between-115°C and-30°C due toa low energy molecular relaxation in thepolyester. Corresponding peaks in lossmodulus and tan delta were produced at-125C and-123℃respectively. Below themain glass transition of the polyester aplateau was produced in the storage mod-ulus between-25℃ and 80°C. The maindecline in storage modulus, due to theglass transition, showed an onset of 87°℃.In addition to this decline in storage mod-ulus a doublet peak in loss modulus at106℃ and 124℃ can be seen along witha peak in tan delta at 125℃ with a shoul-der on the leading edge.0. The doublet in the damping peak isinteresting and may be explained byshrinkage in the film on the high temper- ature side of the glass transition. The hightemperature peak in loss modulus at 122°℃was produced at the same point as thesubtle inflection in the storage modulusprofile between 110C and 140C. Thisinflection can be explained by the appa-rent increase in modulus as the filmshrinks in competition with the continuing softening process with increasing temper-ature. 4. Cure of a Prepreg Material The cure of a single ply of prepreg can bereadily followed using the 983 DMA.Figure 5 shows the results from theanalysis of a single ply carbon fibre epoxyprepreg. The low mass clamps were used Fig. 441Profiles of storage modulus,loss modulus and tan delta from the analysis of a thin polyesterfilm. to mount the sample. The prepreg wascured isothermally at 150℃ by rampingthe temperature at 50℃/min to 150℃where it was then held isothermally forsixty minutes. The storage modulus curve was flat forthe first 15 minutes after which it rose steeply to 30 minutes and then continuedto rise through to the end of the analysis.The loss modulus exhibited a peak at 13.6minutes, increased slowly to 40 minutesafter which it increased steeply beforelevelling out at the end of the analysis.Tan delta also displayed a peak at 13.6 Fig. 6 Expanded plot of the early stages of the cure of a single ply of prepreg. Fig. 7 Storage modulus, loss modulus and tan delta profiles from the dynamic analysis of a curedsingle ply of prepreg. minutes above which it declined steeplyto 20 minutes before showing an increaseabove 40 minutes -corresponding to thesharp increase in loss modulus in this reg-ion. The increase in storage modulus after15 minutes was clearly due to the cure ofthe prepreg impartingmechanicalstrength to the sample as it was held at theisothermal temperature. As the storagemodulus continued to increase throughthe end of the experiment it would suggestthat the sample had not achieved full cure-this can be verified by cooling the sampleto room temperature and re-running it. Figure 6 shows the detail from the first twenty minutes of the experiment. Thestorage modulus at the start of the exper-iment showed a small decline as the temp-erature was ramped up to the isotherm.This corresponded to a drop in the viscos-ity of the resin as a function of increasingtemperature. The first real increase in stor-age modulus appeared with onset at 8.7489minutes as the sample began to crosslink. At 11.2 minutes the storage and lossmoduli were equivalent and the curvescrossed. At this point tan delta equalled1.0 and many processors consider this tobe the gel time for the prepreg. The geltime is critical as it represents the end ofthe processing window, beyond this pointair pockets may be trapped in the compo-site as it is pressed since the resin is tooviscous to flow correctly. Conversely pres-sing the composite too far in advance ofthe gel time will force the resin out of themould as its viscosity will be too low. Ineither case the mechanical properties ofthefinished material! will becom-promised. Beyond the gel time the storagemodulus increased corresponding to theonset of matrix formation and just belowthe peaks in loss modulus and tan deltait showed an inflection before increasingsharply as the cure process continued. Thisinflection in storage modulus and peaksin loss modulus and tan delta representsthe softening of the partially cured matrix. Figure 7 represents the DMA profilefrom the re-run of the cured prepreg. Thestorage modulus showed a sharp declineat temperatures above 60℃ through to180℃. At 198℃ the storage modulusbegan to rise again and peaked at 280℃.This is a clear indication that the samplewas not fully cured during the sixty minuteisotherm at 150℃ and this dynamic heat-ing profile imparted post cure to the sam- ple. The very broad and unsymmetricalloss modulus and tan delta peaks at 102℃and 161C respectively are also evidencethat the prepreg did not achieve full cure 5.Rigid CompositeThe standard clamping configuration is Fig. 8 Results from the analysis of a rigid carbon fibre-epoxy composite. Fig. 9 Profiles of storage modulus, loss modulus and tan delta from the duplicate analysis of arigid carbon fibre-epoxy composite. designed for very rigid materials such ascarbon fibre-epoxy composites. Figure 8shows the results from the analysis of a2.0mm thick epoxy-carbon compositeover the temperature range ambient to270℃ at a heating rate of 5℃/min. The glass transition for the compositewas shown by the two step drop in storagemodulus with onset at 141℃ and 155℃.This result is not typical, most compositesexhibit a single step change in modulus atthe glass transition, and may be explainedby a small amount of residual cure withinthe sample that is brought about by thedynamic heating profile. The shape of theloss modulus and tan delta peaks in theregion of the glass transition are also indi-cative of a small amount of residual cureas they were both unsymmetrical. Thepeaks for loss modulus and tan delta wereproduced at 189℃ and 202C respectively. Figure 9 shows the results from theanalysis of a second sample of the epoxy-carbon composite. The peak temperaturesand quantitative viscoelastic values werein excellent agreement to those obtainedfrom the first analysis. Conclusion DMA is a very powerful tool for the visco-elastic characterisation of materials. Theabove examples show the versatility oftheinstrument to analyse samples across theentire viscoelastic spectrum from liquidsthrough to the most rigid composites. Itshould be noted that only a single mechan-ical driving system was required to accom-modate the samples. The very small enthalpy changes as-sociated with the transitions discussed inthis report would be impossible to detectusing conventional calorimetrictechniques. The corresponding change inmechanical properties are several ordersof magnitude greater making DMA themost sensitive thermal technique. Reproducibility has been proven forsamples at the two extremes of visco-elasticity-aliquid and a rigid composite. Acknowledgement Marlin Scientific would like to thankAcheson Colloids, London InternationalGroup, Dunlop Aviation and WestlandHelicopters for their cooperation in pro-ducing this review. A full reprint of this article is availablefrom the authors. TA- TA-g In today’s increasingly competitive environment the development of high performance advanced materials is very important. Many material manufacturers no longer specialize in a single product area but have diversified. As a result research and development laboratories often work on a range of materials that can have significantly different physical and chemical properties. For this reason analytical instrumentation must be extremely flexible in that it must be able to accommodate samples existing in a variety of physical states without compromising sensitivity and reproducibility. Dynamic mechanical analysis (DMA) is no exception and this review will discuss the use of DMA for the viscoelastic characterization of a wide range of samples including liquids, polyester film, latex rubber, prepreg and composites.
确定

还剩3页未读,是否继续阅读?

产品配置单
TA仪器为您提供《材料(动态力学分析)中黏弹表征检测方案(流变仪)》,该方案主要用于其他中黏弹表征检测,参考标准--,《材料(动态力学分析)中黏弹表征检测方案(流变仪)》用到的仪器有TA仪器Discovery流变仪
推荐专场
相关方案
更多
该厂商其他方案
更多