


方案详情
文
分析流变学是确定材料微观结构从而测量粘弹性响应的学科。分析流变学是分析化学在相同意义上与其他作为其他分析方法基础上的流变性能测试的延伸。固有粘度分析技术是一种分析流变学。分析流变学可适用于任何材料系统的流变响应,这种响应很大程度上取决于微观结构分析。?
方案详情

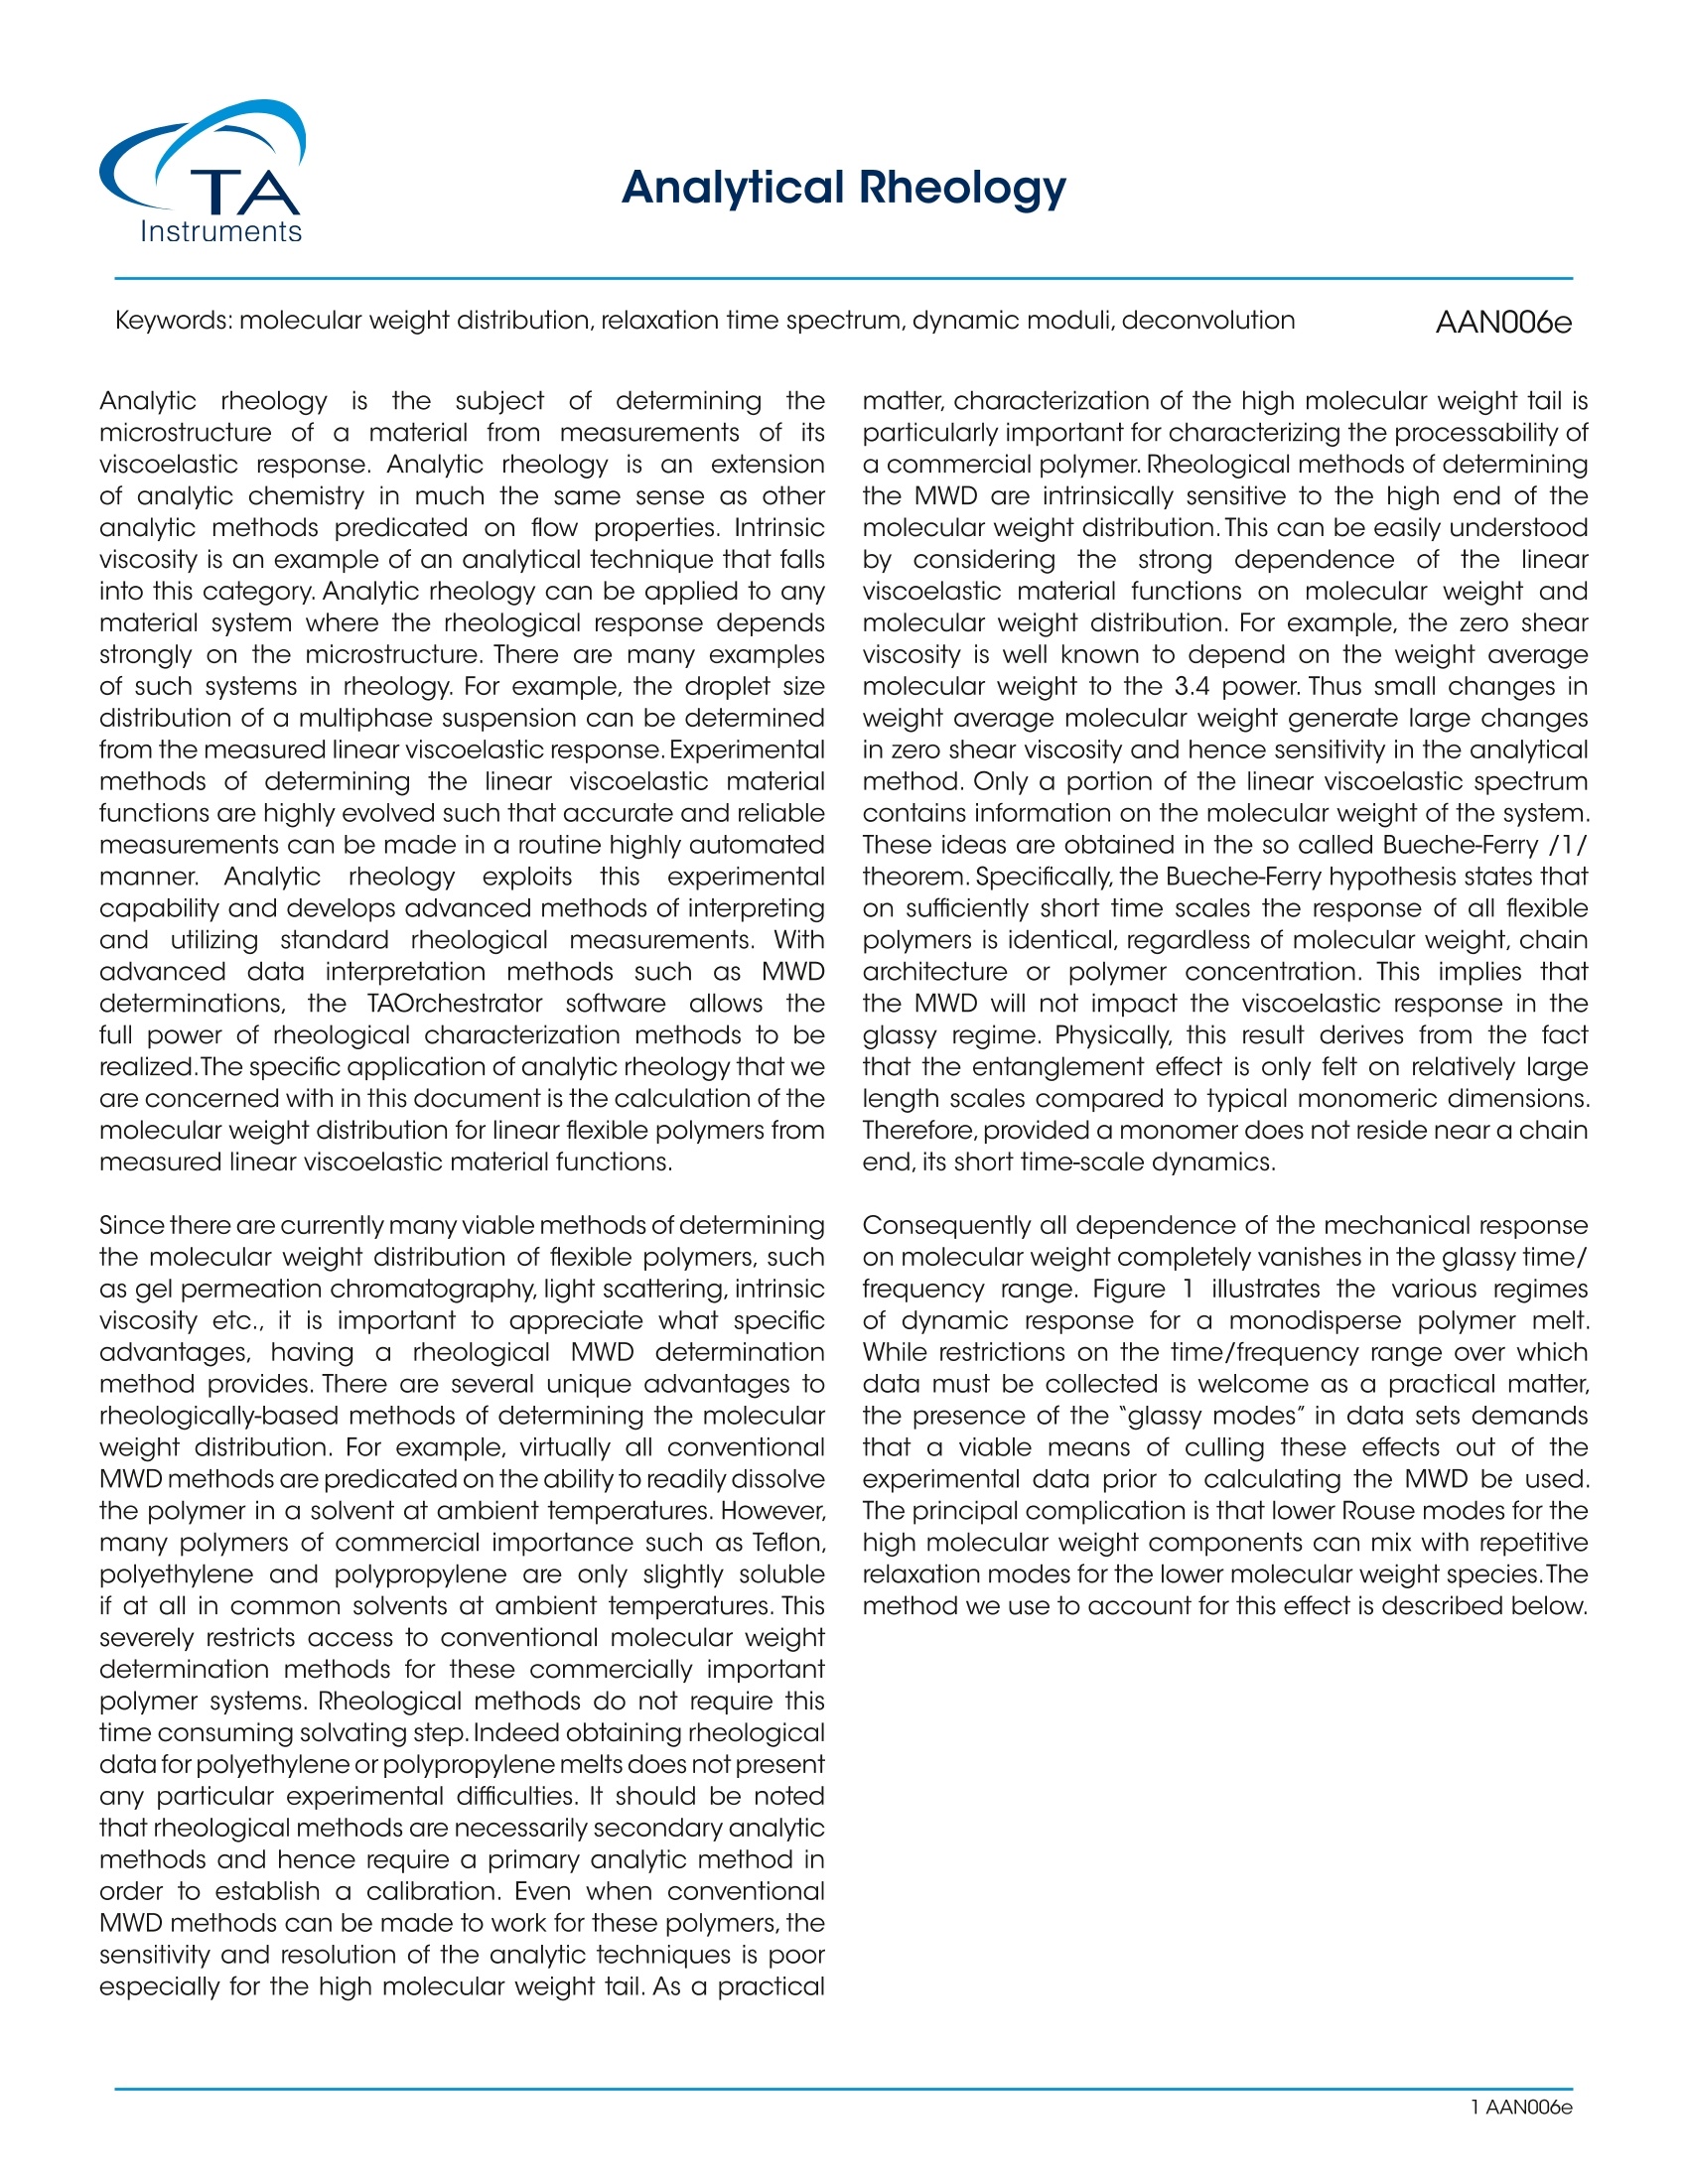
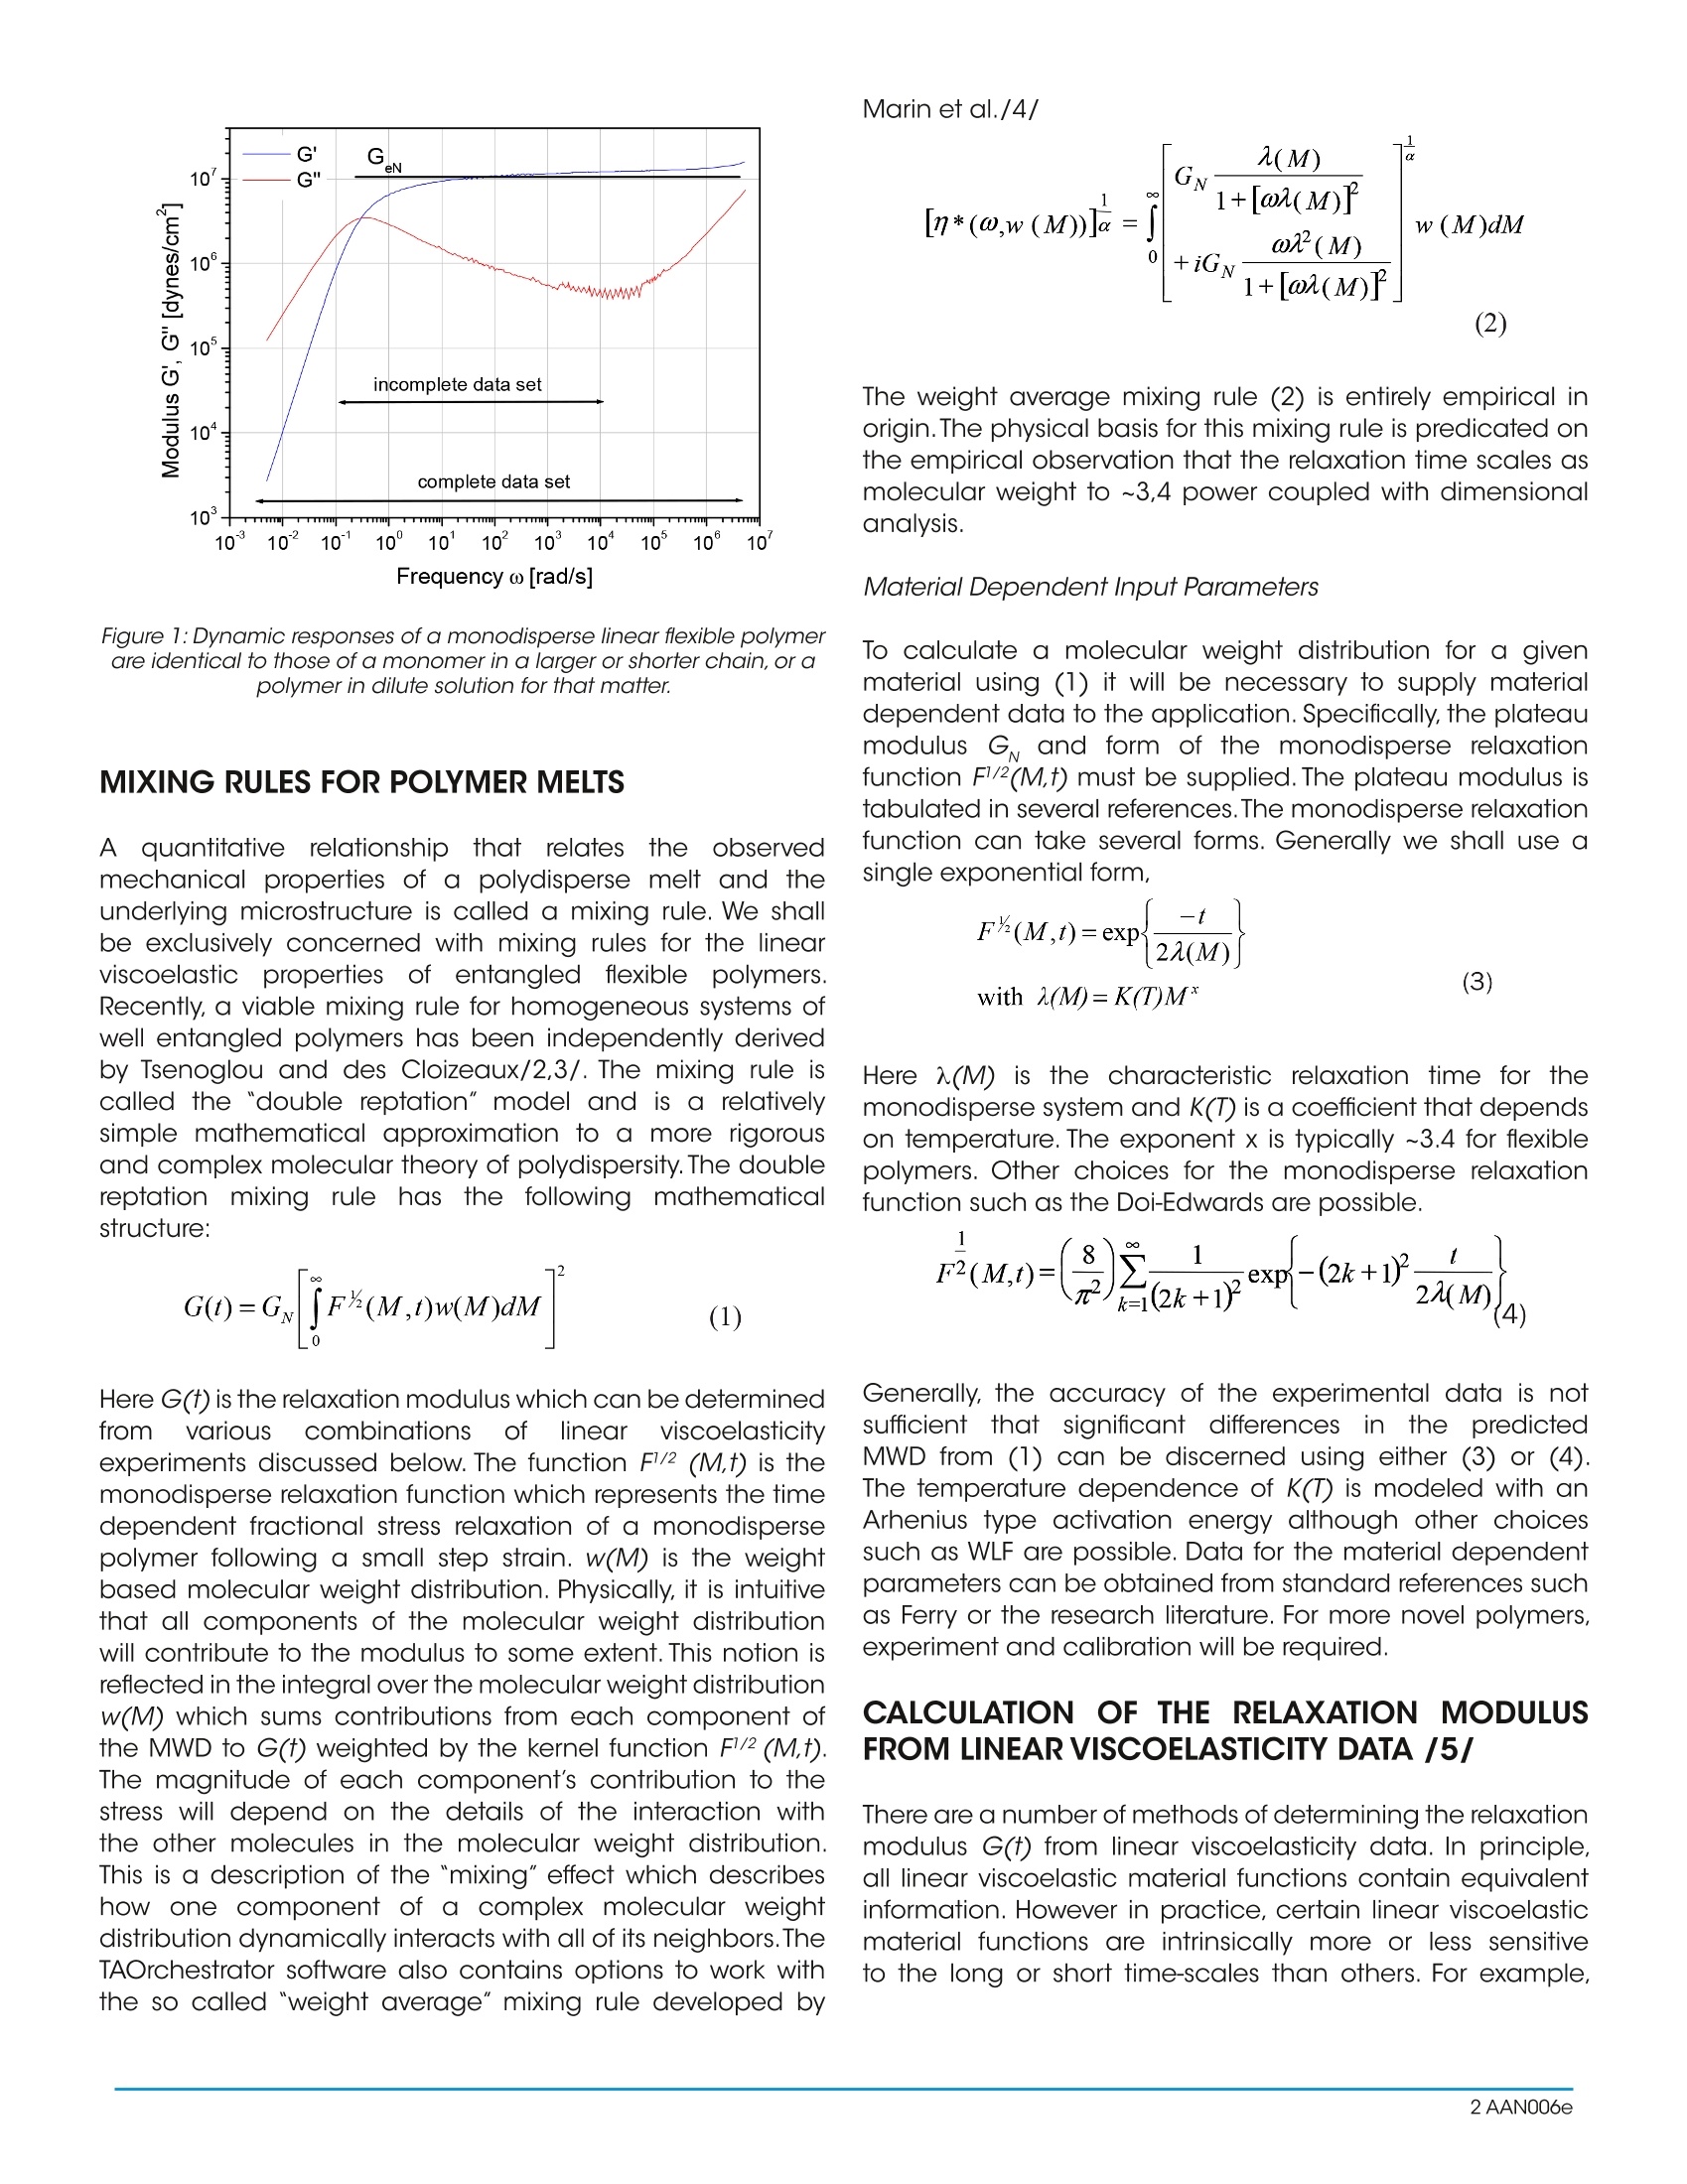
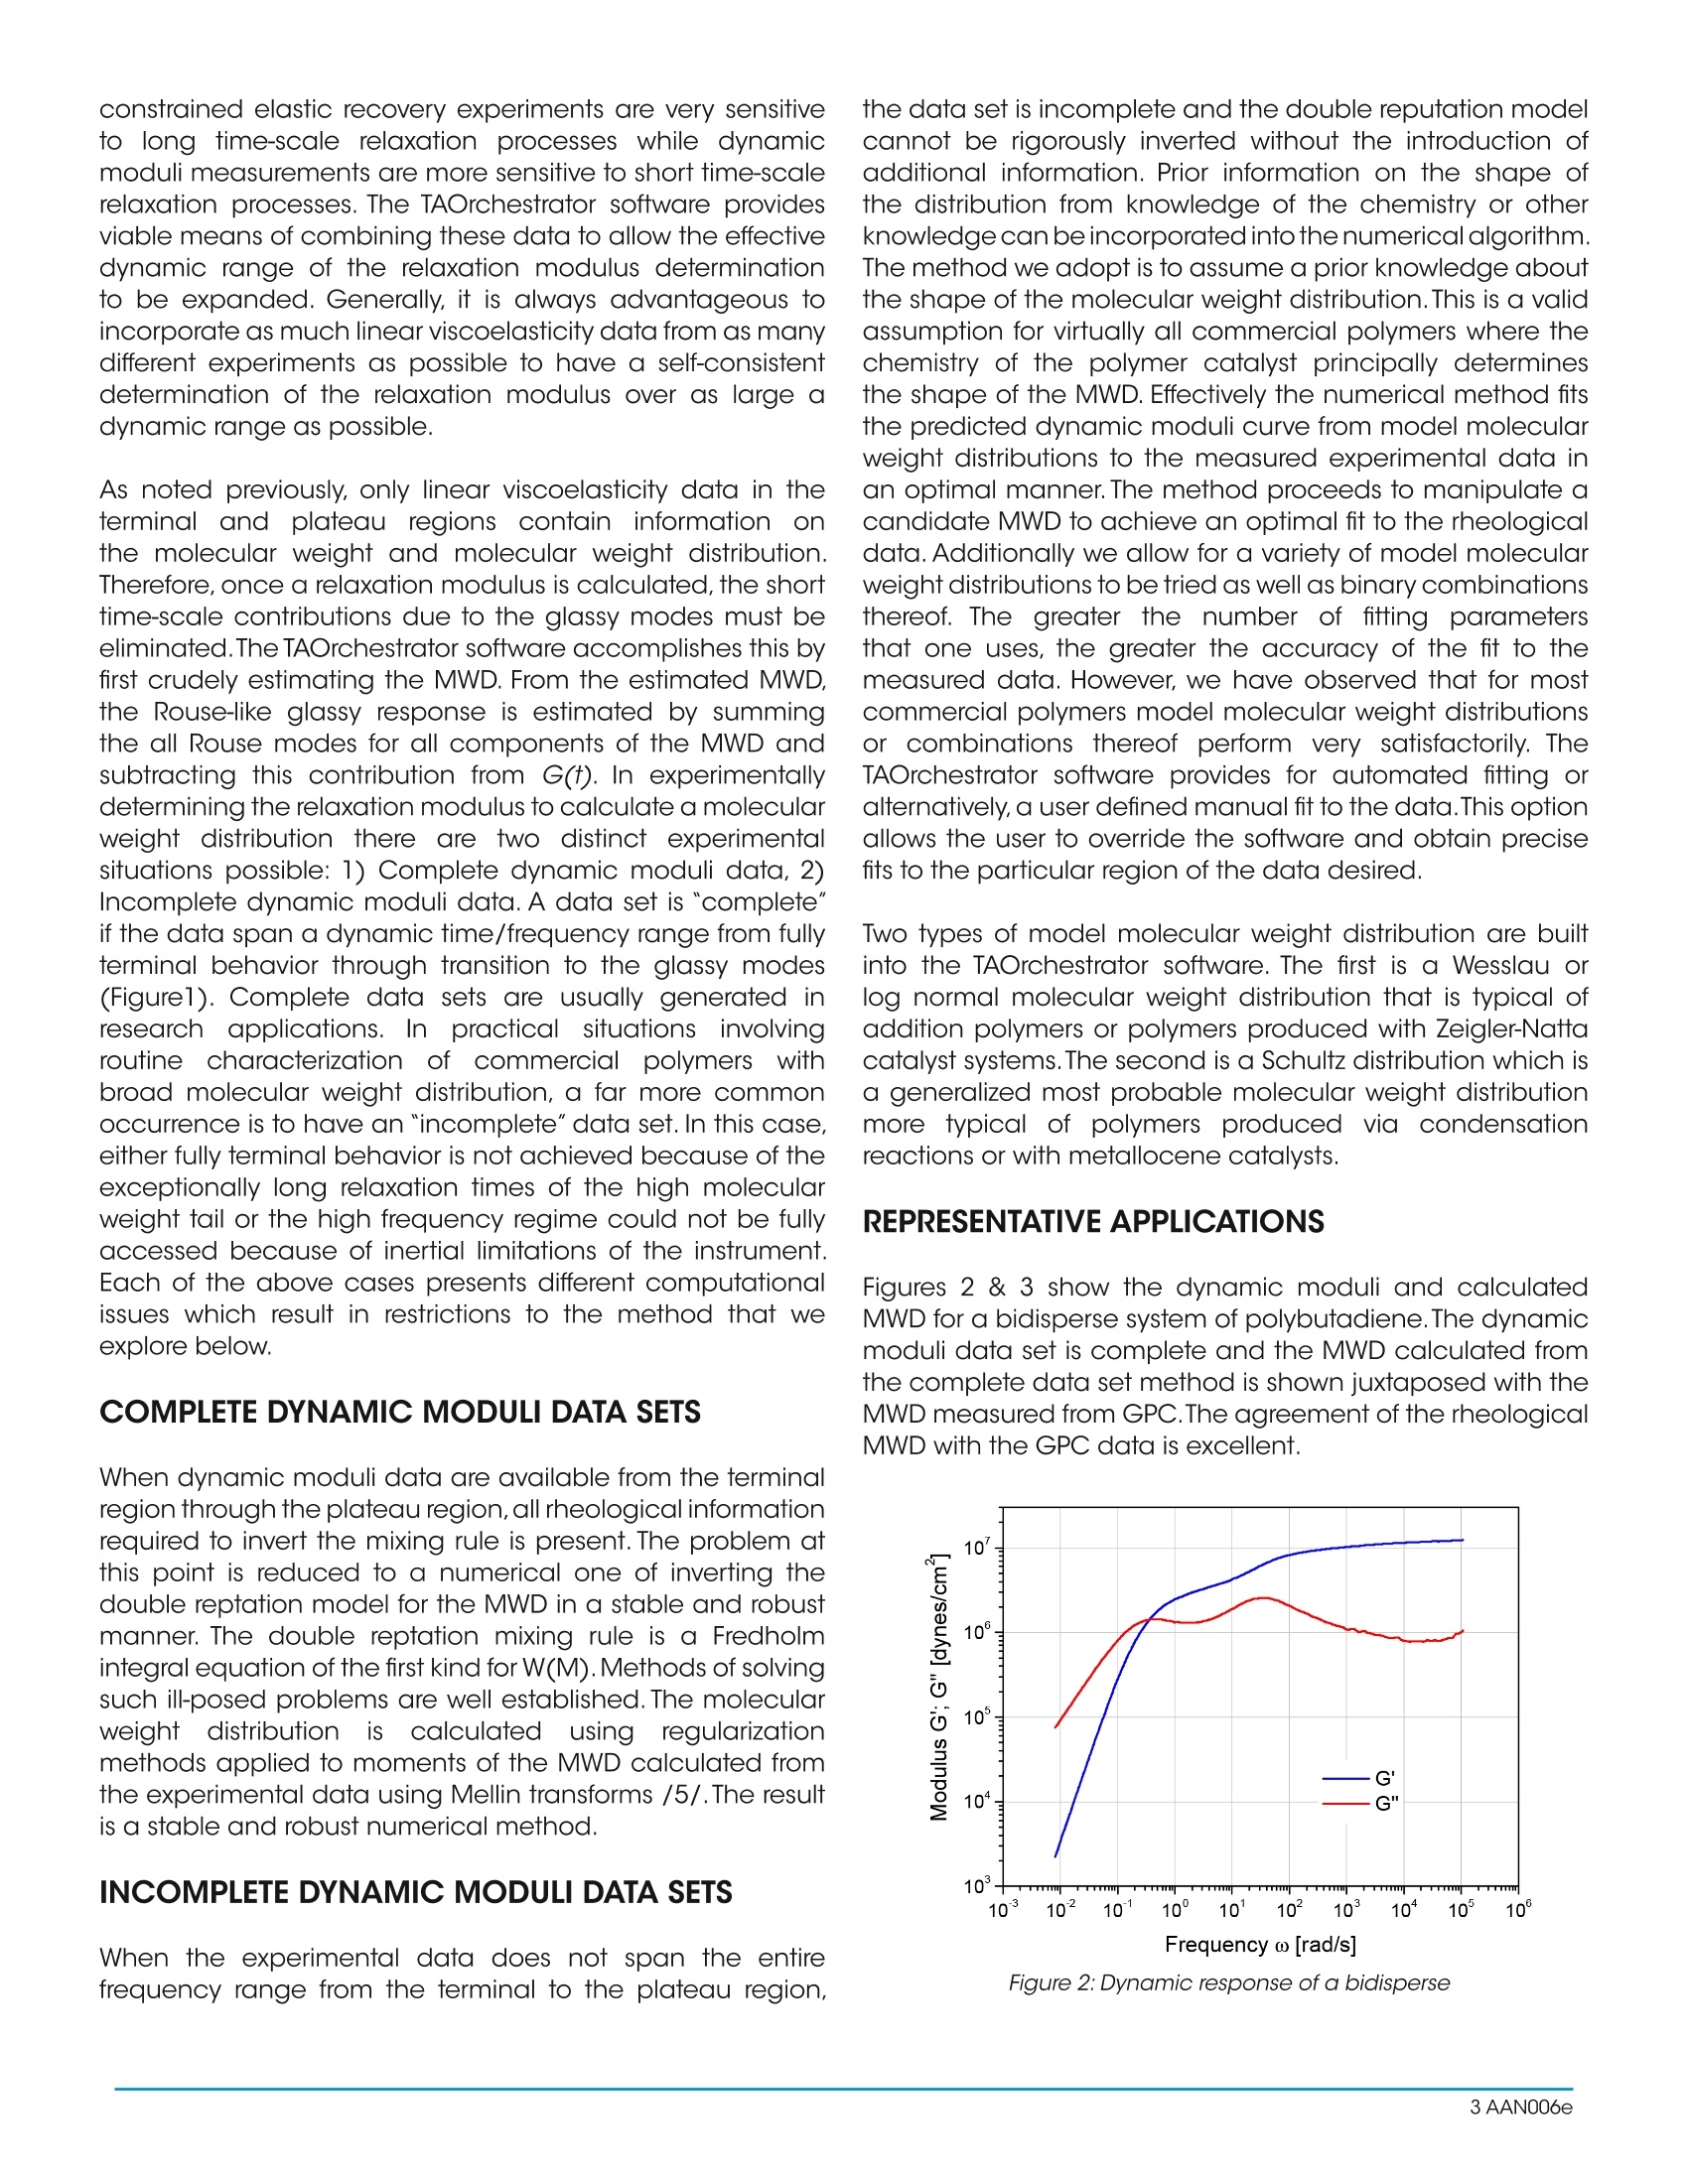
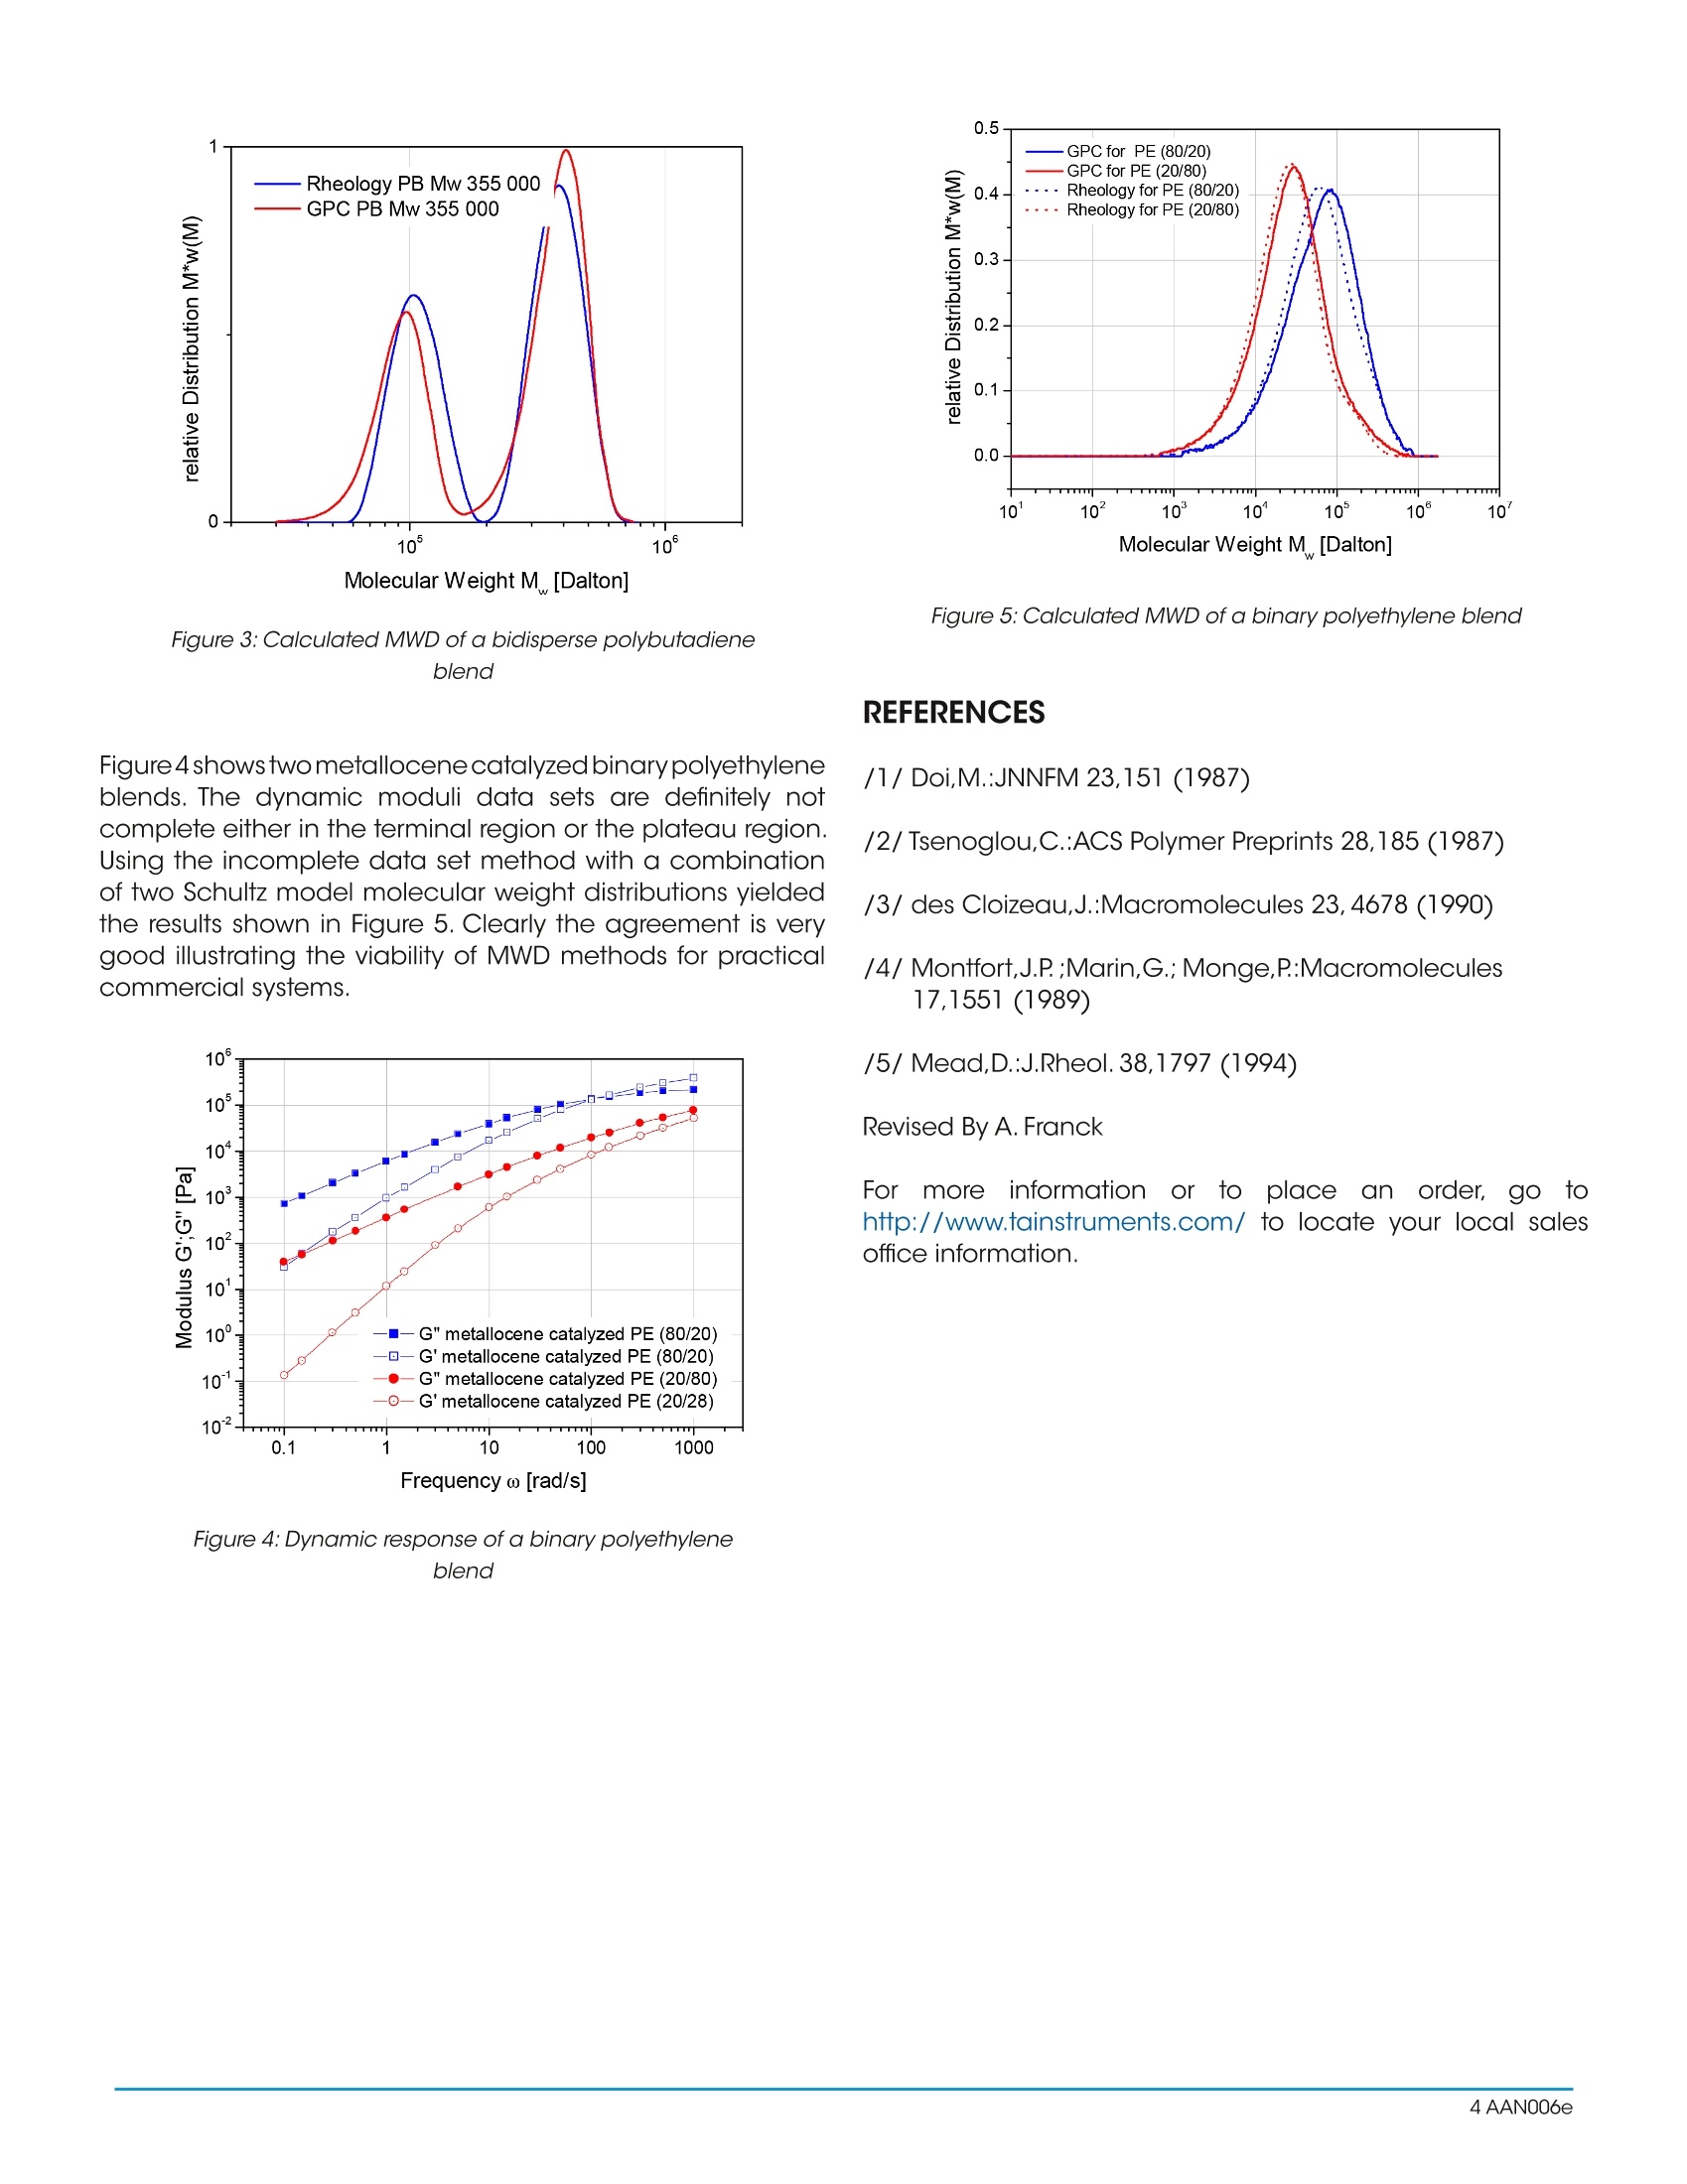
Analytical RheologyAAN006e Keywords: molecular weight distribution, relaxation time spectrum, dynamic moduli, deconvolution Analytic rheologyyisthe subject of determining themicrostructure of a material from measurements of itsviscoelastic response. Analytic rheology is an extensionof analytic chemistry in much the same sense as otheranalytic methods predicated on flow properties. Intrinsicviscosity is an example of an analytical technique that fallsinto this category. Analytic rheology can be applied to anymaterial system where the rheological response dependsstrongly on the microstructure. There are many examplesof such systems in rheology. For example, the droplet sizedistribution of a multiphase suspension can be determinedfrom the measured linear viscoelastic response.Experimentalmethods of determining the linear viscoelastic materialfunctions are highly evolved such that accurate and reliablemeasurements can be made in a routine highly automatedmanner. Analytic rheology exploitstSthisIsexperimentalcapability and develops advanced methods of interpretingand utilizing standard rheological measurements. 'Withadvanced data interpretation methods such as MWDdeterminations, the TAOrchestrator software allowsi fthefull power of rheological characterization methods to berealized.The specific application of analytic rheology that weare concerned with in this document is the calculation of themolecular weight distribution for linear flexible polymers frommeasured linear viscoelastic material functions. Since there are currently many viable methods of determiningthe molecular weight distribution of flexible polymers, suchas gel permeation chromatography, light scattering, intrinsicviscosity etc., it is important to appreciate what specificadvantages, having a rheological MWD determinationmethod provides. There are several unique advantages torheologically-based methods of determining the molecularweight distribution. For example, virtually all conventionalMWD methods are predicated on the ability to readily dissolvethe polymer in a solvent at ambient temperatures. However,many polymers of commercial importance such as Teflon,polyethylene and polypropylene are only slightly solubleif at all in common solvents at ambient temperatures. Thisseverely restricts access to conventional molecular weightdetermination methods for these commercially importantpolymer systems. Rheological methods do not require thistime consuming solvating step.Indeed obtaining rheologicaldata for polyethylene or polypropylene melts does not presentany particular experimental difficulties. It should be notedthat rheological methods are necessarily secondary analyticmethods and hence require a primary analytic method inorder to establish a calibration. Even when conventionalMWD methods can be made to work for these polymers, thesensitivity and resolution of the analytic techniques is poorespecially for the high molecular weight tail. As a practical matter, characterization of the high molecular weight tail isparticularly important for characterizing the processability ofa commercial polymer.Rheological methods of determiningthe MWD are intrinsically sensitive to the high end of themolecular weight distribution. This can be easily understoodby considering the strong dependence of the linearviscoelastic material functions on molecular weight andmolecular weight distribution. For example, the zero shearviscosity is well known to depend on the weight averagemolecular weight to the 3.4 power. Thus small changes inweight average molecular weight generate large changesin zero shear viscosity and hence sensitivity in the analyticalmethod. Only a portion of the linear viscoelastic spectrumcontains information on the molecular weight of the system.These ideas are obtained in the so called Bueche-Ferry /1/theorem. Specifically, the Bueche-Ferry hypothesis states thaton sufficiently short time scales the response of all flexiblepolymers is identical, regardless of molecular weight, chainarchitecture or polymer concentration. This implies thatthe MWD will not impact the viscoelastic response in theglassy regime. Physically, this result derives from the factthat the entanglement effect is only felt on relatively largelength scales compared to typical monomeric dimensions.Therefore, provided a monomer does not reside near a chainend, its short time-scale dynamics. Consequently all dependence of the mechanical responseon molecular weight completely vanishes in the glassy time/frequency range. Figure 1 illustrates the various regimesof dynamic response for a monodisperse polymer melt.While restrictions on the time/frequency range over whichdata must be collected is welcome as a practical matter,the presence of the glassy modes"in data sets demandsthat a viable means of culling these effects out of theexperimental data prior to calculating the MWD be used.The principal complication is that lower Rouse modes for thehigh molecular weight components can mix with repetitiverelaxation modes for the lower molecular weight species.Themethod we use to account for this effect is described below. Figure 1: Dynamic responses of a monodisperse linear flexible polymerare identical to those of a monomer in a larger or shorter chain, orapolymer in dilute solution for that matter. MIXING RULES FOR POLYMER MELTS Aquantitative relationship that relatesthe observedmechanical properties of a polydisperse melt and theunderlying microstructure is called a mixing rule. We shallbe exclusively concerned with mixing rules for the linearviscoelastic properties of entangledflexible polymers.Recently, a viable mixing rule for homogeneous systems ofwell entangled polymers has been independently derivedby Tsenoglou and des Cloizeaux/2,3/. The mixing rule iscalled the "double reptation" model and is a relativelysimple mathematical approximation to a more rigorousand complex molecular theory of polydispersity.The doublereptation mixing rule hasthe following mathematicalstructure: Here G(t) is the relaxation modulus which can be determinedfrom variousCcombinationsof lliinear viscoelasticityexperiments discussed below. The function F1/2 (M,t) is themonodisperse relaxation function which represents the timedependent fractional stress relaxation of a monodispersepolymer following a small step strain.w(M) is the weightbased molecular weight distribution. Physically, it is intuitivethat all components of the molecular weight distributionwill contribute to the modulus to some extent. This notion isreflected in the integral over the molecular weight distributionw(M) which sums contributions from each component ofthe MWD to G(t) weighted by the kernel function F/2(M,t).The magnitude of each component’s contribution to thestress will depend on the details of the interaction withthe other molecules in the molecular weight distribution.1.This is a description of the "mixing" effect which describeshow one component of a complex molecular weightdistribution dynamically interacts with all of its neighbors.TheTAOrchestrator software also contains options to work withthe so called "weight average" mixing rule developed by Marin et al./4/ The weight average mixing rule (2) is entirely empirical inorigin. The physical basis for this mixing rule is predicated onthe empirical observation that the relaxation time scales asmolecular weight to ~3,4 power coupled with dimensionalanalysis. Material Dependent Input Parameters To calculate a molecular weight distribution for a givenmaterial using (1)) Iift Wwill be necessary to supply materialdependent data to the application. Specifically, the plateaumodulus G and form of the monodisperse relaxationfunction F1/2(M,t) must be supplied. The plateau modulus istabulated in several references.The monodisperse relaxationfunction can take several forms. Generally we shall use asingle exponential form, Here A(M) is the characteristic relaxation time for themonodisperse system and K(T) is a coefficient that dependson temperature. The exponent x is typically ~3.4 for flexiblepolymers. Other choices for the monodisperse relaxationfunction such as the Doi-Edwards are possible. 172F2(M,t)=22G(t)=GyF(M,t)w(M)dM2(1)1(M),(4) Generally, the accuracy of the experimental data is notsufficient that significant differencesSirinthe predictedMWD from (1) can be discerned using either (3) or (4).The temperature dependence of K(T) is modeled with anArhenius type activation energy although other choicessuch as WLF are possible. Data for the material dependentparameters can be obtained from standard references suchas Ferry or the research literature. For more novel polymers,experiment and calibration will be required. CALCULATION OF THE RELAXATIONMODULUSFROM LINEAR VISCOELASTICITY DATA /5/ There are a number of methods of determining the relaxationmodulus G(t) from linear viscoelasticity data. In principle,all linear viscoelastic material functions contain equivalentinformation. However in practice, certain linear viscoelasticmaterial functions are intrinsically more or less sensitiveto the long or short time-scales than others. For example, constrained elastic recovery experiments are very sensitiveto long time-scale relaxation processes while dynamicmoduli measurements are more sensitive to short time-scalerelaxation processes. The TAOrchestrator software providesviable means of combining these data to allow the effectivedynamic range of the relaxation modulus determinationto be expanded. Generally, it is always advantageous toincorporate as much linear viscoelasticity data from as manydifferent experiments as possible to have a self-consistentdetermination of the relaxation modulus over as large adynamic range as possible. As noted previously, only linear viscoelasticity data in theterminal andl plateau regions contain information onthe molecular weight and molecular weight distribution.Therefore, once a relaxation modulus is calculated,the shorttime-scale contributions due to the glassy modes must beeliminated.The TAOrchestrator software accomplishes this byfirst crudely estimating the MWD. From the estimated MWD,the Rouse-like glassy response is estimated by summingthe all Rouse modes for all components of the MWD andsubtracting this contribution from G(t). In experimentallydetermining the relaxation modulus to calculate a molecularweight distribution there are two distinct experimentalsituations possible: 1) Complete dynamic moduli data, 2)Incomplete dynamic moduli data. A data set is "complete"if the data span a dynamic time/frequency range from fullyterminal behavior through transition to the glassy modes(Figure1). Complete data sets are usually generated inresearch applications. In practical situations involvingroutine characterization of commercial polymers withbroad molecular weight distribution, a far more commonoccurrence is to have an "incomplete" data set. In this case,either fully terminal behavior is not achieved because of theexceptionally long relaxation times of the high molecularweight tail or the high frequency regime could not be fullyaccessed because of inertial limitations of the instrument.Each of the above cases presents different computationalissues which result in restrictions to the method that weexplore below. COMPLETE DYNAMIC MODULI DATA SETS When dynamic moduli data are available from the terminalregion through the plateau region, all rheological informationrequired to invert the mixing rule is present. The problem atthis point is reduced to a numerical one of inverting thedouble reptation model for the MWD in a stable and robustmanner. The double reptation mixing rule is a Fredholmintegral equation of the first kind for W(M). Methods of solvingsuch ill-posed problems are well established. The molecularweight distributionis1Scalculatedusing regularizationmethods applied to moments of the MWD calculated fromthe experimental data using Mellin transforms /5/. The resultis a stable and robust numerical method. INCOMPLETE DYNAMIC MODULI DATA SETS When the experimental data does not span the entirefrequency range from the terminal to the plateau region, the data set is incomplete and the double reputation modelcannot be rigorously inverted without the introduction ofadditional information. Prior information on the shape ofthe distribution from knowledge of the chemistry or otherknowledge can be incorporated into the numerical algorithm.The method we adopt is to assume a prior knowledge aboutthe shape of the molecular weight distribution.This is a validassumption for virtually all commercial polymers where thechemistry of the polymer catalyst principally determinesthe shape of the MWD. Effectively the numerical method fitsthe predicted dynamic moduli curve from model molecularweight distributions to the measured experimental data inan optimal manner. The method proceeds to manipulate acandidate MWD to achieve an optimal fit to the rheologicaldata. Additionally we allow for a variety of model molecularweight distributions to be tried as well as binary combinationsthereof. The greater the number of fitting parametersthat one uses, the greater the accuracy of the fit to themeasured data. However, we have observed that for mostcommercial polymers model molecular weight distributionsor combinations thereof perform very satisfactorily. TheTAOrchestrator software provides for automated fitting oralternatively, a user defined manual fit to the data.This optionallows the user to override the software and obtain precisefits to the particular region of the data desired. Two types of model molecular weight distribution are builtinto the TAOrchestrator software. The first is a Wesslau orlog normal molecular weighl0gt distribution that is typical ofaddition polymers or polymers produced with Zeigler-Nattacatalyst systems.The second is a Schultz distribution which isa generalized most probable molecular weight distributionmore typical of polymers produced via condensationreactions or with metallocene catalysts. REPRESENTATIVE APPLICATIONS Figures 2 & 3 show the dynamic moduli and calculatedMWD for a bidisperse system of polybutadiene.The dynamicmoduli data set is complete and the MWD calculated fromthe complete data set method is shown juxtaposed with theMWD measured from GPC.The agreement of the rheologicalMWD with the GPC data is excellent. Figure 2: Dynamic response of a bidisperse Figure 3:Calculated MWD of a bidisperse polybutadieneblend Figure4shows twometallocene catalyzed binary polyethyleneblends. The dynamic moduli data sets are definitely notcomplete either in the terminal region or the plateau region.Using the incomplete data set method with a combinationof two Schultz model molecular weight distributions yieldedthe results shown in Figure 5. Clearly the agreement is verygood illustrating the viability of MWD methods for practicalcommercial systems. Figure 4: Dynamic response of a binary polyethyleneblend Figure 5: Calculated MWD of a binary polyethylene blend ( REFERENCES ) /1/ Doi,M.:JNNFM 23,151 (1987) /2/ Tsenoglou,C.:ACS Polymer Preprints 28,185 (1987) /3/ des Cloizeau,J.:Macromolecules 23,4678 (1990) /4/Montfort,J.P. ;Marin,G.; Monge,P:Macromolecules17,1551 (1989) /5/ Mead,D.:J.Rheol. 38,1797 (1994) Revised By A. Franck For moreinformation or to place an order, go tohttp://www.tainstruments.com/ to locate your local salesoffice information. AAN Analytic rheology is the subject of determining the microstructure of a material from measurements of its viscoelastic response. Analytic rheology is an extension of analytic chemistry in much the same sense as other analytic methods predicated on flow properties. Intrinsic viscosity is an example of an analytical technique that falls into this category. Analytic rheology can be applied to any material system where the rheological response depends strongly on the microstructure. There are many examples of such systems in rheology. For example, the droplet size distribution of a multiphase suspension can be determined from the measured linear viscoelastic response. Experimental methods of determining the linear viscoelastic material functions are highly evolved such that accurate and reliable measurements can be made in a routine highly automated manner. Analytic rheology exploits this experimental capability and develops advanced methods of interpreting and utilizing standard rheological measurements. With advanced data interpretation methods such as MWD determinations, the TAOrchestrator software allows the full power of rheological characterization methods to be realized. The specific application of analytic rheology that we are concerned with in this document is the calculation of the molecular weight distribution for linear flexible polymers from measured linear viscoelastic material functions.
确定
还剩2页未读,是否继续阅读?

TA仪器为您提供《材料中材料粘弹性检测方案(流变仪)》,该方案主要用于其他中材料粘弹性检测,参考标准--,《材料中材料粘弹性检测方案(流变仪)》用到的仪器有
相关方案
更多
该厂商其他方案
更多