


方案详情
文
本文中介绍了通过调节盐浓度对蛋白质吸水和脱水的变化,耗散值和频率值的改变来解读蛋白质结构的变化。通过结合椭偏仪,检测含水百分比也成为了可能。
方案详情

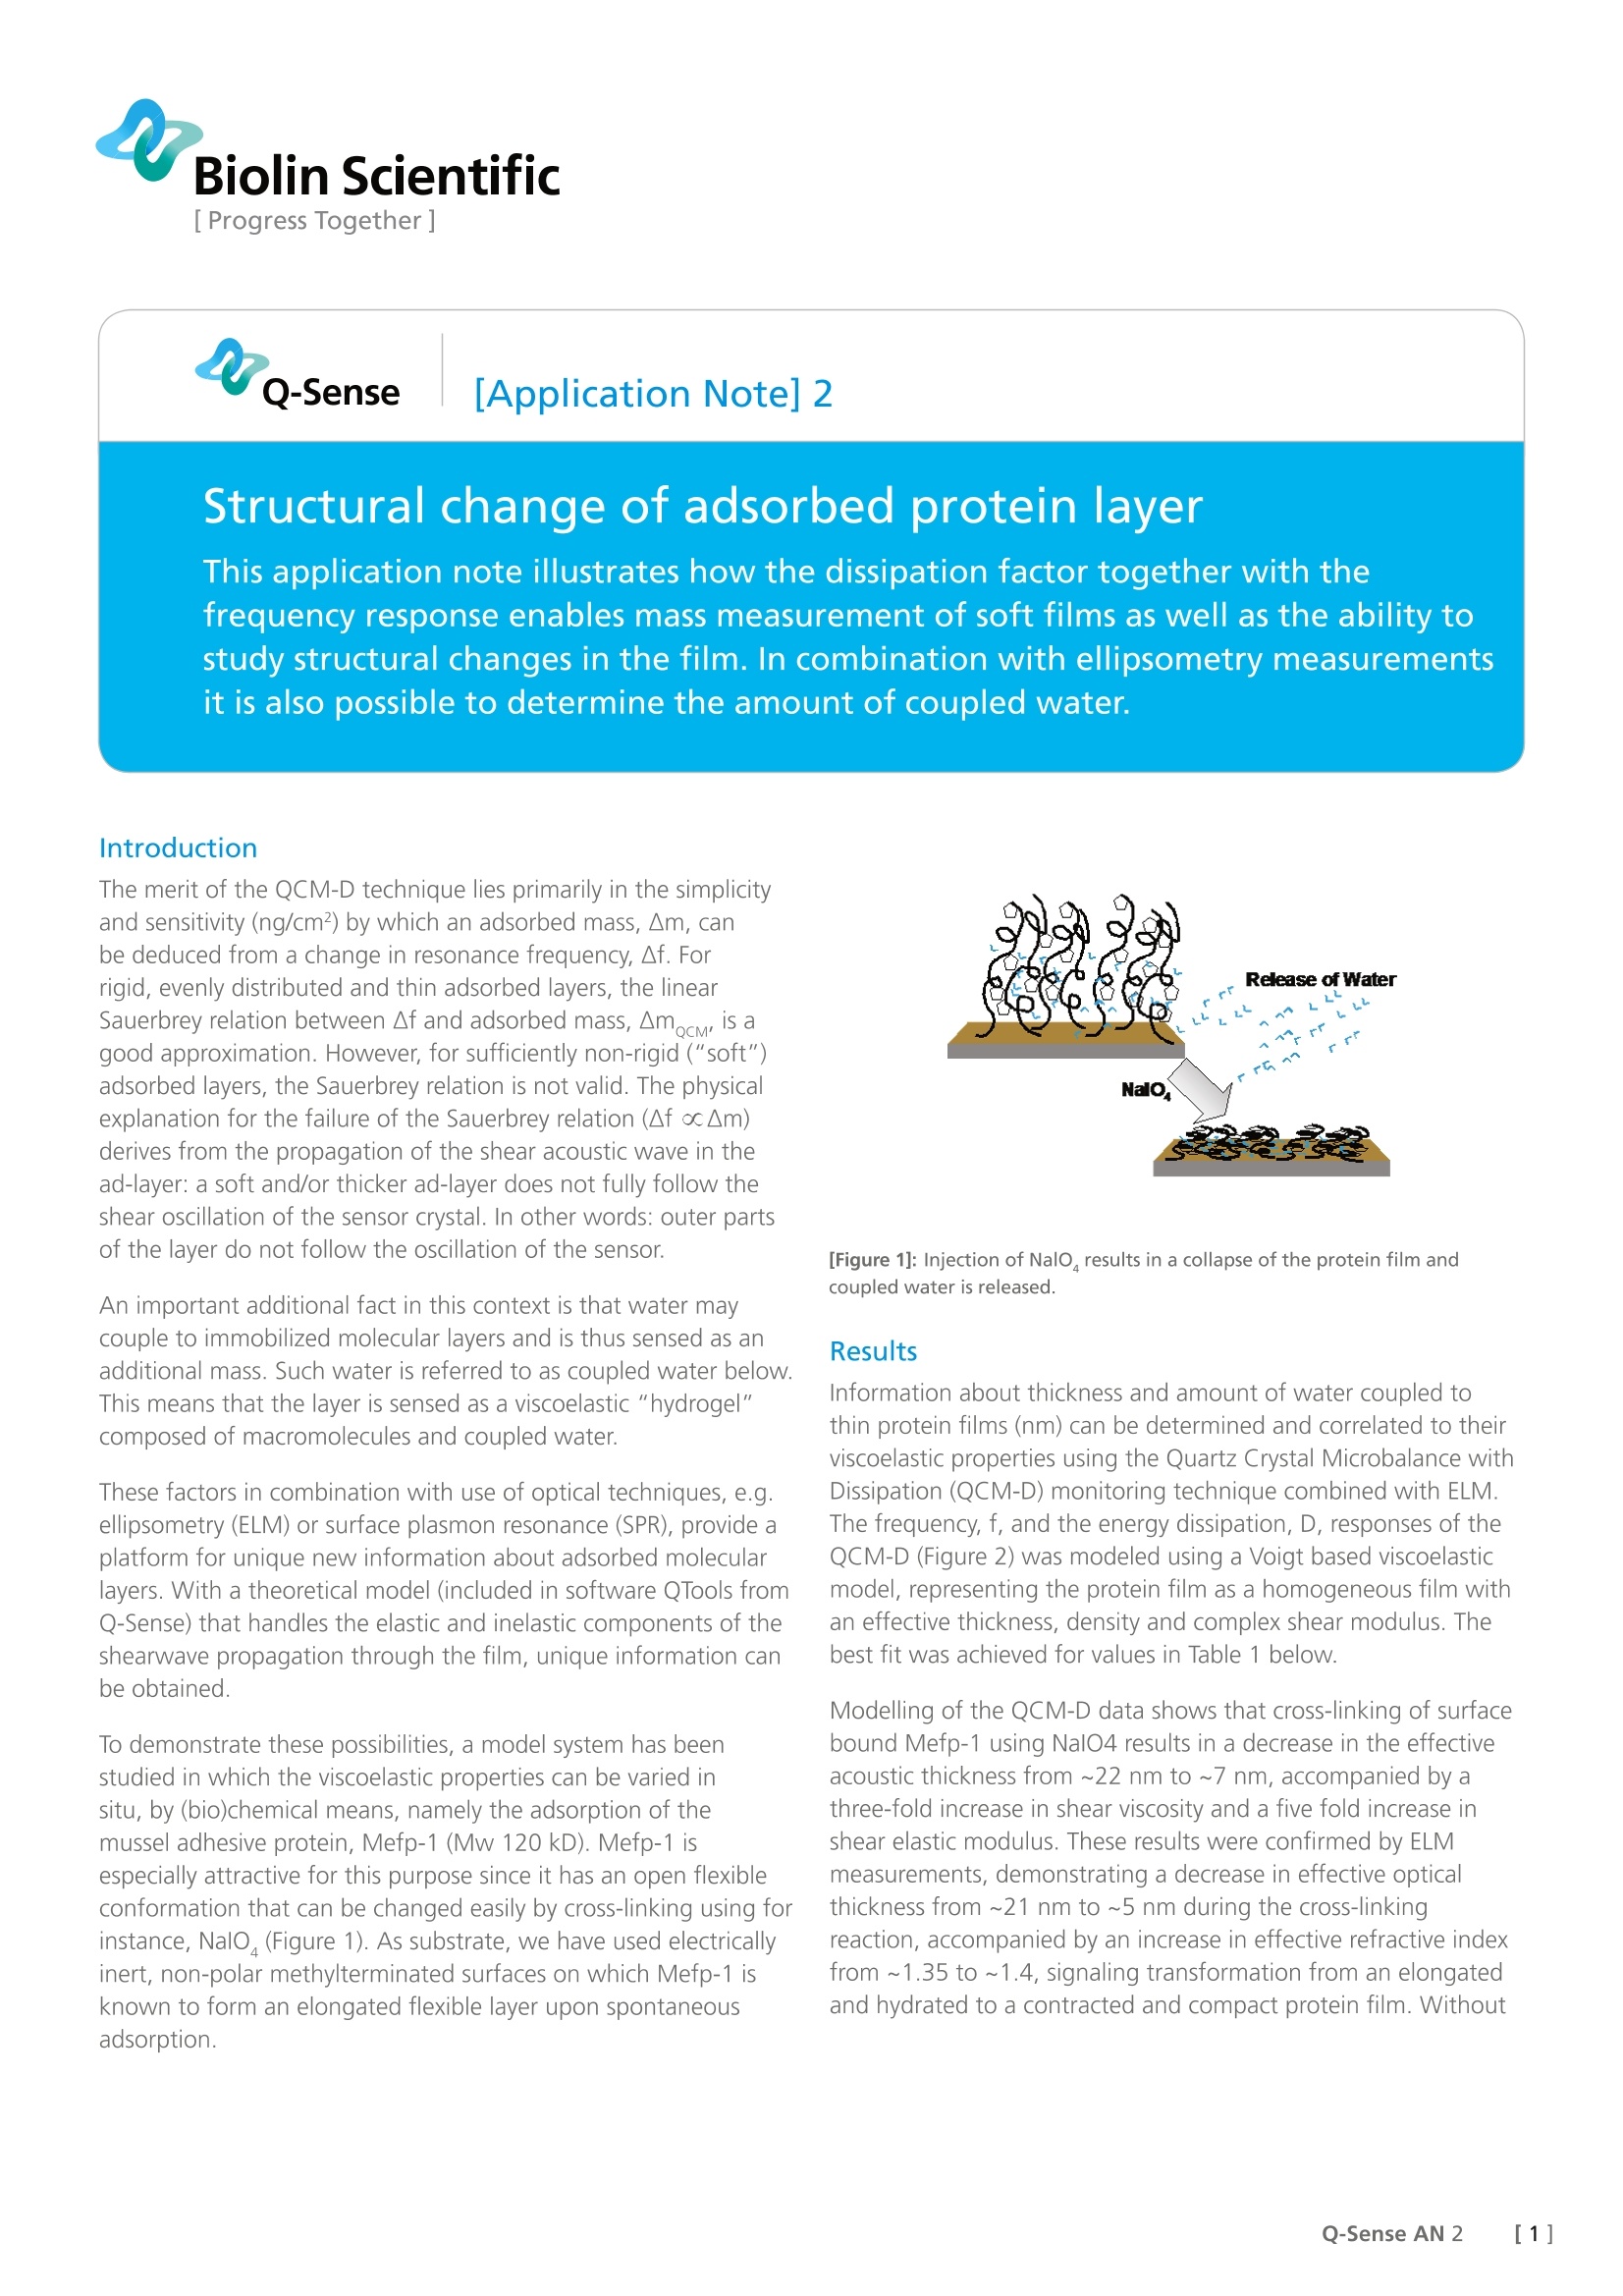
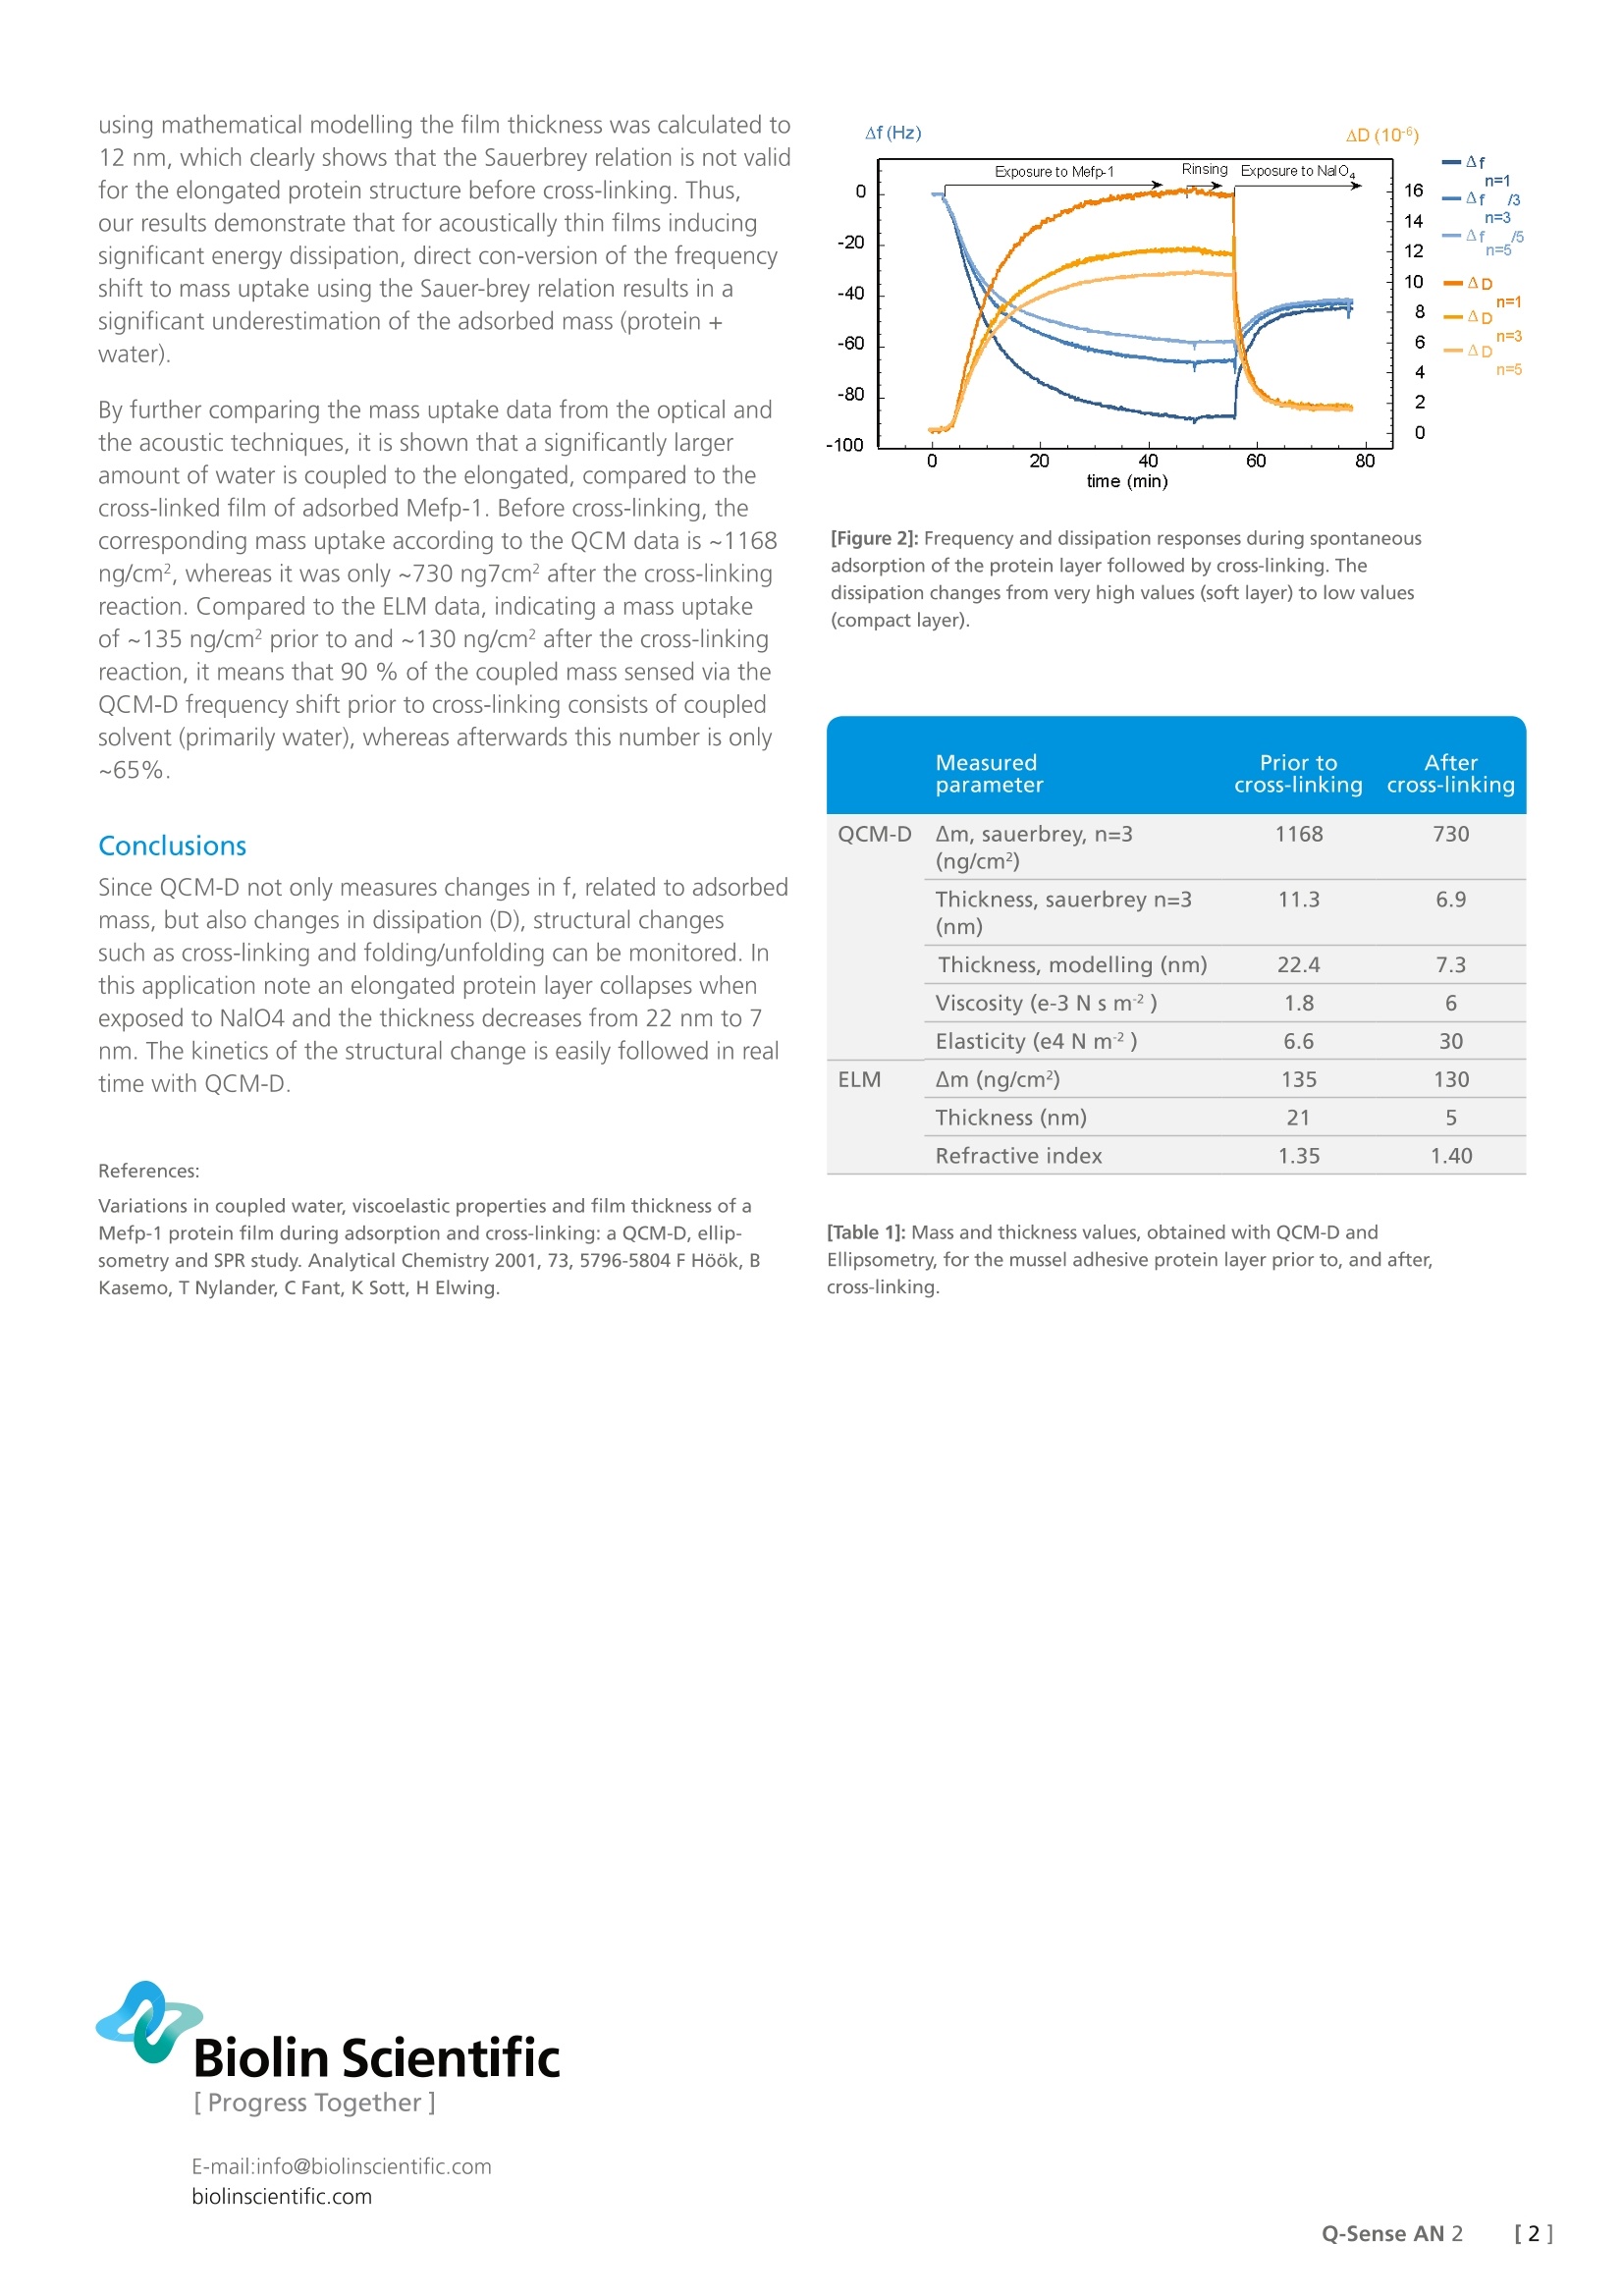
Biolin Scientific[ Progress Together] [Application Note] 2 Structural change of adsorbed protein layer This application note illustrates how the dissipation factor together with the frequency response enables mass measurement of soft films as well as the ability tostudy structural changes in the film. In combination with ellipsometry measurements it is also possible to determine the amount of coupled water. Introduction The merit of the QCM-D technique lies primarily in the simplicityand sensitivity (ng/cm²) by which an adsorbed mass, Am, canbe deduced from a change in resonance frequency, Af. Forrigid, evenly distributed and thin adsorbed layers, the linearSauerbrey relation between Af and adsorbed mass, ▲mocm, is agood approximation. However, for sufficiently non-rigid ("soft")adsorbed layers, the Sauerbrey relation is not valid. The physicalexplanation for the failure of the Sauerbrey relation (Af ocAm)derives from the propagation of the shear acoustic wave in thead-layer: a soft and/or thicker ad-layer does not fully follow theshear oscillation of the sensor crystal. In other words: outer partsof the layer do not follow the oscillation of the sensor. An important additional fact in this context is that water maycouple to immobilized molecular layers and is thus sensed as anadditional mass. Such water is referred to as coupled water below.This means that the layer is sensed as a viscoelastic "hydrogel"composed of macromolecules and coupled water. These factors in combination with use of optical techniques, e.g.ellipsometry (ELM) or surface plasmon resonance (SPR), provide aplatform for unique new information about adsorbed molecularlayers. With a theoretical model (included in software QTools fromQ-Sense) that handles the elastic and inelastic components of theshearwave propagation through the film, unique information canbe obtained. To demonstrate these possibilities, a model system has beenstudied in which the viscoelastic properties can be varied insitu, by (bio)chemical means, namely the adsorption of themussel adhesive protein, Mefp-1 (Mw 120 kD). Mefp-1 isespecially attractive for this purpose since it has an open flexibleconformation that can be changed easily by cross-linking using forinstance, NalO (Figure 1). As substrate, we have used electricallyinert, non-polar methylterminated surfaces on which Mefp-1 isknown to form an elongated flexible layer upon spontaneousadsorption. [Figure 1]: Injection of Nalo results in a collapse of the protein film andcoupled water is released. Results Information about thickness and amount of water coupled tothin protein films (nm) can be determined and correlated to theirviscoelastic properties using the Quartz Crystal Microbalance withDissipation (QCM-D) monitoring technique combined with ELM.The frequency, f, and the energy dissipation, D, responses of theQCM-D (Figure 2) was modeled using a Voigt based viscoelasticmodel, representing the protein film as a homogeneous film withan effective thickness, density and complex shear modulus. Thebest fit was achieved for values in Table 1 below. Modelling of the QCM-D data shows that cross-linking of surfacebound Mefp-1 using NalO4 results in a decrease in the effectiveacoustic thickness from ~22 nm to ~7 nm, accompanied by athree-fold increase in shear viscosity and a five fold increase inshear elastic modulus. These results were confirmed by ELMmeasurements, demonstrating a decrease in effective opticalthickness from ~21 nm to ~5 nm during the cross-linkingreaction, accompanied by an increase in effective refractive indexfrom ~1.35 to ~1.4, signaling transformation from an elongatedand hydrated to a contracted and compact protein film. Without using mathematical modelling the film thickness was calculated to12 nm, which clearly shows that the Sauerbrey relation is not validfor the elongated protein structure before cross-linking.Thus,our results demonstrate that for acoustically thin films inducingsignificant energy dissipation, direct con-version of the frequencyshift to mass uptake using the Sauer-brey relation results in asignificant underestimation of the adsorbed mass (protein+water). By further comparing the mass uptake data from the optical andthe acoustic techniques, it is shown that a significantly largeramount of water is coupled to the elongated, compared to thecross-linked film of adsorbed Mefp-1. Before cross-linking, thecorresponding mass uptake according to the QCM data is ~1168ng/cm², whereas it was only ~730 ng7cm² after the cross-linkingreaction. Compared to the ELM data, indicating a mass uptakeof ~135 ng/cm² prior to and ~130 ng/cm² after the cross-linkingreaction, it means that 90 % of the coupled mass sensed via theQCM-D frequency shift prior to cross-linking consists of coupledsolvent (primarily water), whereas afterwards this number is only~65%. Since QCM-D not only measures changes in f, related to adsorbedmass, but also changes in dissipation (D), structural changessuch as cross-linking and folding/unfolding can be monitored. Inthis application note an elongated protein layer collapses whenexposed to Nal4 and the thickness decreases from 22 nm to 7nm. The kinetics of the structural change is easily followed in realtime with QCM-D. References: Variations in coupled water, viscoelastic properties and film thickness of aMefp-1 protein film during adsorption and cross-linking: a QCM-D, ellip-sometry and SPR study. Analytical Chemistry 2001, 73, 5796-5804 F Hook, BKasemo, T Nylander, C Fant, K Sott, H Elwing. [Figure 2]: Frequency and dissipation responses during spontaneousadsorption of the protein layer followed by cross-linking. Thedissipation changes from very high values (soft layer) to low values(compact layer). Measured Prior to After QCM-D parameter cross-linking cross-linking Am,sauerbrey, n=3 1168 730 (ng/cm²) (nm) Thickness, sauerbrey n=3 11.3 6.9 Thickness,modelling (nm) 22.4 7.3 Viscosity (e-3 N s m²) 1.8 6 ELM Elasticity(e4Nm) 6.6 30 Am (ng/cm²) 135 130 Thickness (nm) 21 5 Refractive index 1.35 1.40 [Table 1]: Mass and thickness values, obtained with QCM-D andEllipsometry, for the mussel adhesive protein layer prior to, and after,cross-linking. [Q-Sense AN E-mail:info@biolinscientific.combiolinscientific.com[]Q-Sense AN
确定
还剩1页未读,是否继续阅读?

产品配置单


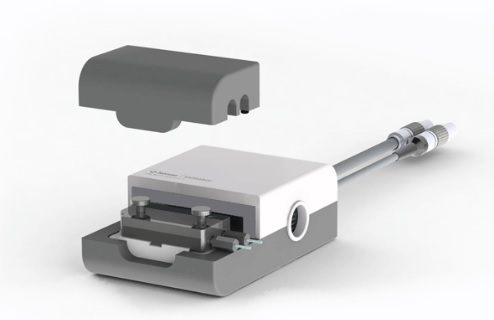
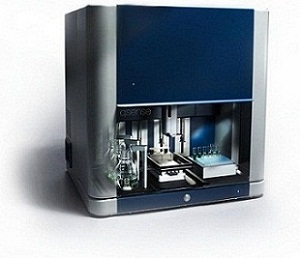
瑞典百欧林科技有限公司为您提供《使用QCM-D技术检测蛋白质构型变化》,该方案主要用于其他中--检测,参考标准--,《使用QCM-D技术检测蛋白质构型变化》用到的仪器有QSense卓越版四通道石英晶体微天平、QSense Explorer扩展版石英晶体微天平、QSense全自动八通道石英晶体微天平
推荐专场


相关方案
更多
该厂商其他方案
更多