


方案详情
文
为了增进对磷脂双分子层在表面铺展,分子在表面吸附的理解。本文采用了三种不同的研究仪器:QCM-D, SPR和AFM来对磷脂双分子层在二氧化硅表面的吸附进行了研究。
方案详情

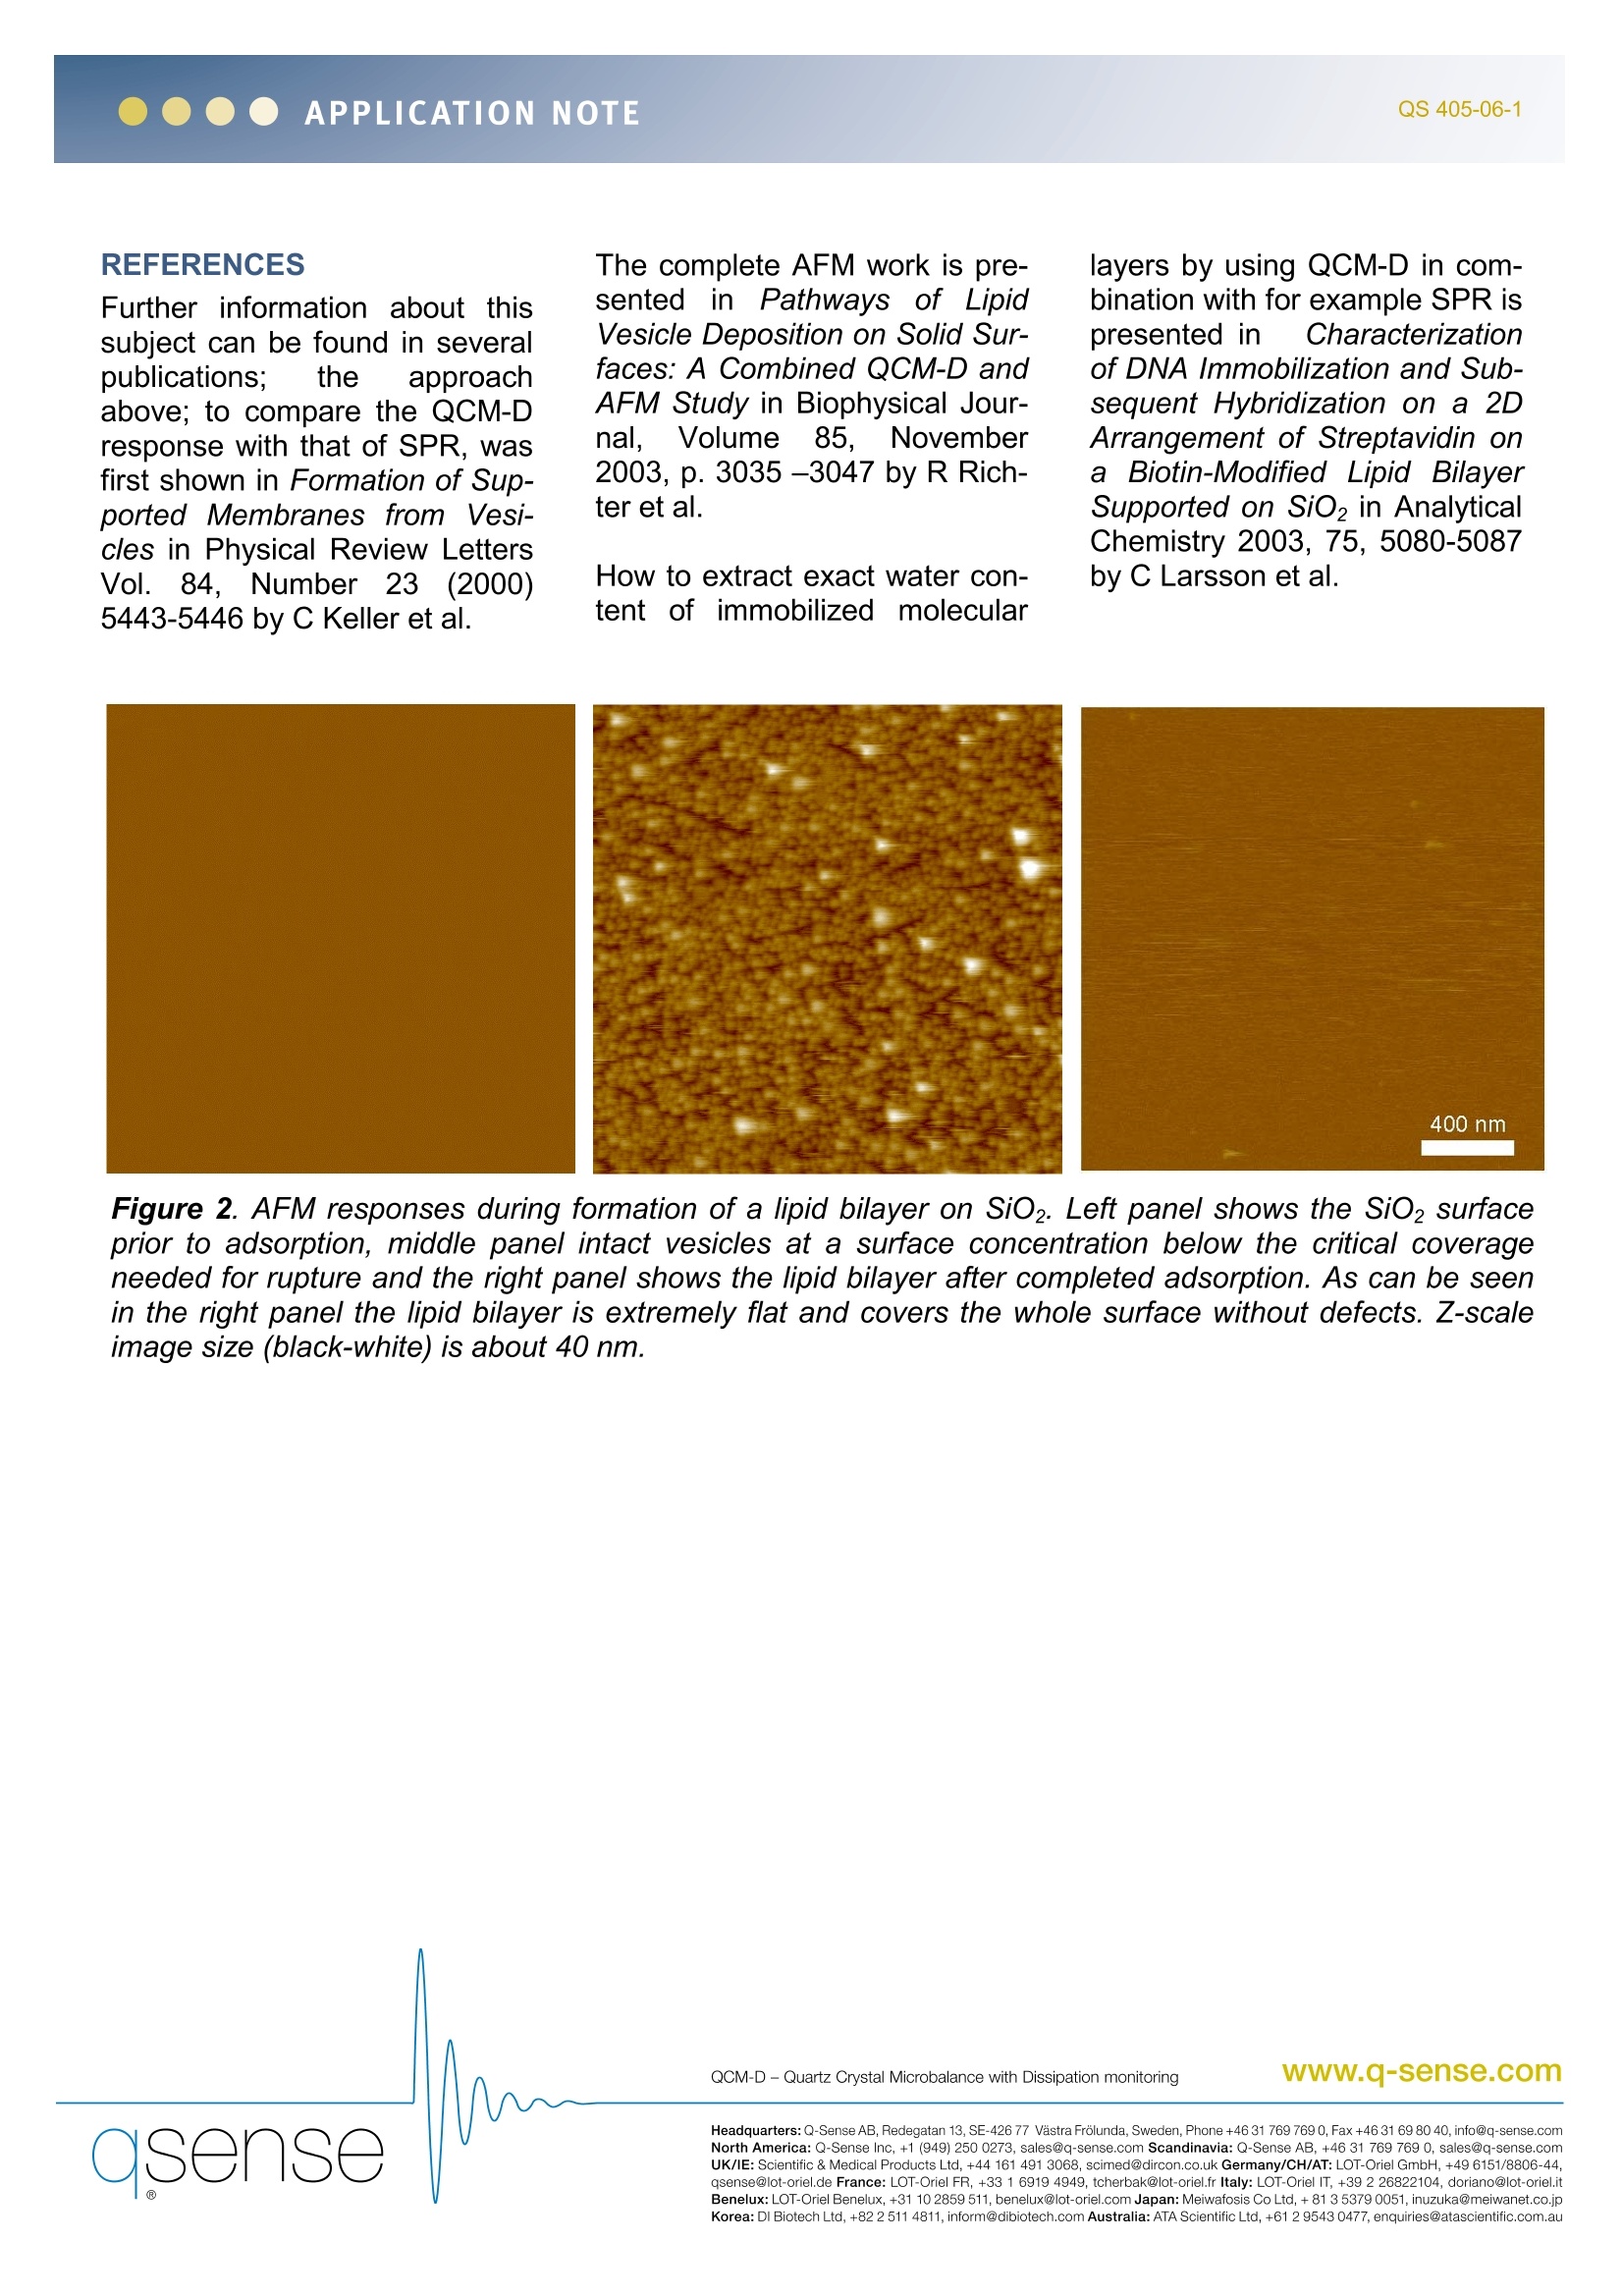
APPLICATIONNOTEQS 405-06-1 www.q-sense.comQCM-D- Quartz Crystal Microbalance with Dissipation monitoring LIPID BILAYER FORMATION; A COMPARISON BETWEEN QCM-D,SPR AND AFM INTRODUCTION In order to increase the under-standing of molecular adsorp-tion or interaction studies, manylaboratories use a multiple tech-nique approach. Belowitisshown how QCM-D, SPR andAFM have been used to under-stand the formation of lipid bi-layers on SiO2 surfaces. RESULTS Keller et al. have shown thatlipid vesicles exposed to a sur-face, form different structures:monolayer, bilayer or intactvesicles, depending ontheproperties of the surface. It isknown that vesicles form a bi-layer on a SiO2 (very hydro-philic) surface. However, verylittle was known of how this bi-layer was formed. SPR meas-urements showed a monotonicincrease of lipids on the surfacebutQCM-D)measurementsshowed that the total adsorbedmass reaches a peak and thenlevels off to a level closely cor-responding to the theoreticalmass of a lipid bilayer (see Fig-ure 1). The QCM-D dissipationsignal shows a marked peakand then almost returns to zeroindicating a significant phasetransition in the adsorbed layer.Keller et al. therefore concludedthat the vesicles initially adsorbintact and do not rupture andform a bilayer until a critical sur-face concentration is reached.The difference in QCM-D andSPRmass was attributedtowater trapped inside and be-tween adsorbed vesicles. UsinaQCM-D and SPR in parallel thusaives a detailed understanding working with surface science touse multiple techniques to un-derstand molecular processestaking place on different sur-faces. QCM-D and SPR to-gether gives the possibility toextract the water content of mo-lecular films and recently,simple way of extracting theexact water content of adsorbedmolecular layers has beengiven. Both techniques presentreal time data. AFM is an excel-lent technique to reveal at themolecular level how moleculeshave adsorbed and/or clusteredat the surface which comple-ments the real-time mass dataachieved by QCM-D/SPR andthe overall structural propertiesof adsorbed layers acquired byQCM-D. Figure 1. QCM-D and SPR responses during formation of a lipidbilayer. Since QCM-D senses coupled water, the phase transitionfrom intact vesicles to a lipid bilayer is clearly seen as a decrease inmass (release of water). SPR shows additional mass as more lipidmolecules adsorbs directly to the surface of the SPR chip. Simulta-neously the dissipation of the crystal increases when intact vesiclesadsorb in the beginning of the adsorption. The dissipation at the endis close to its original values since the lipid bilayer is thin and closelypacked. REFERENCES Further information about thissubject can be found in severalpublications: the 2approachabove; to compare the QCM-Dresponse with that of SPR, wasfirst shown in Formation of Sup-ported Membranes from Vesi-cles in Physical Review LettersVol. 84,r,Number233(2000)5443-5446 by C Keller et al. The complete AFM work is pre-sented in Pathways of LipidVesicle Deposition on Solid Sur-faces: A Combined QCM-D andAFM Study in Biophysical Jour-nal,. Volume85, November2003, p. 3035 -3047 by R Rich-ter et al. layers by using QCM-D in com-bination with for example SPR ispresented innCharacterizationofDNA Immobilization and Sub-sequent Hybridization on a 2DArrangement of Streptavidin ona Biotin-Modified Lipid BilayerSupported on SiO2 in AnalyticalChemistry 2003,75,5080-5087by C Larsson et al. How to extract exact water con-tent of immobilized molecular 400nm Figure 2. AFM responses during formation of a lipid bilayer on SiO. Left panel shows the SiO surfaceprior to adsorption, middle panel intact vesicles at a surface concentration below the critical coverageneeded for rupture and the right panel shows the lipid bilayer after completed adsorption. As can be seenin the right panel the lipid bilayer is extremely flat and covers the whole surface without defects. Z-scaleimage size (black-white) is about 40 nm. ( H eadquarters:Q-Sense A B,Red e gatan 13, S E- 4 2 6 77 V as t ra Fro l un d a, Sweden, Ph o n e +46 31 76 9 7690,Fax + 4 6 31 69 8 0 40, i nfo@q- s ense. c om North America: Q-Sense I n c, + 1 (949) 250 0273, sales@q - se n se . com S candinavia: Q - S en s e A B, + 46 31 769 769 0, s ales@q- s en s e.com ) ( U K/IE: Scientific &Medical P roducts L td, +44 1 6 1 4 91 3 068, s cimed@dircon.co.uk Germany/CH/AT: LOT-Oriel Gm b H, +49 6151/8 8 06- 4 4, q sense@lot - oriel.de France:LOT- O rie l FR, +3 3 1 6919 4949 , tc h erbak@lot-oriel.fr It a ly: LOT-Oriel IT, + 39 2 2 6 8 22104, doriano@lot-or i el.it Benelux: LOT-O r iel Bene l ux, + 31 1 0 2859 511, b enel u x@lot-o r i e l. c om Japan: Meiwafosis Co Ltd , + 8 1 3 5 379 0051, in u zuka@meiwanet.co.j p ) ( Korea: D I B iotech Ltd, +82 2 5 1 1 4 8 11, i n f o rm@ d ibiot e c h .com Australia: ATA Scientific Ltd, +61 295 4 30477, enquiries@ a ta s cientific.com.au )
确定

还剩1页未读,是否继续阅读?

产品配置单


瑞典百欧林科技有限公司为您提供《通过QCM-D, SPR, AFM对比检测磷脂双分子层的形成》,该方案主要用于其他中--检测,参考标准--,《通过QCM-D, SPR, AFM对比检测磷脂双分子层的形成》用到的仪器有QSense卓越版四通道石英晶体微天平、QSense Explorer扩展版石英晶体微天平、QSense全自动八通道石英晶体微天平
推荐专场


相关方案
更多
该厂商其他方案
更多