


方案详情
文
Three-dimensional gradients of the hydroxyl radical (OH) concentration were measured in a premixed, lean natural
gas / air flame by simultaneous laser induced fluorescence imaging (LIF) in a crossed-light-sheet confguration and
one-dimensionally resolved Raman scattering. The technique is applied to measurements in a turbulent bluff-body
flame with the aim to investigate correlations between species concentration gradients and local concentrations.
方案详情

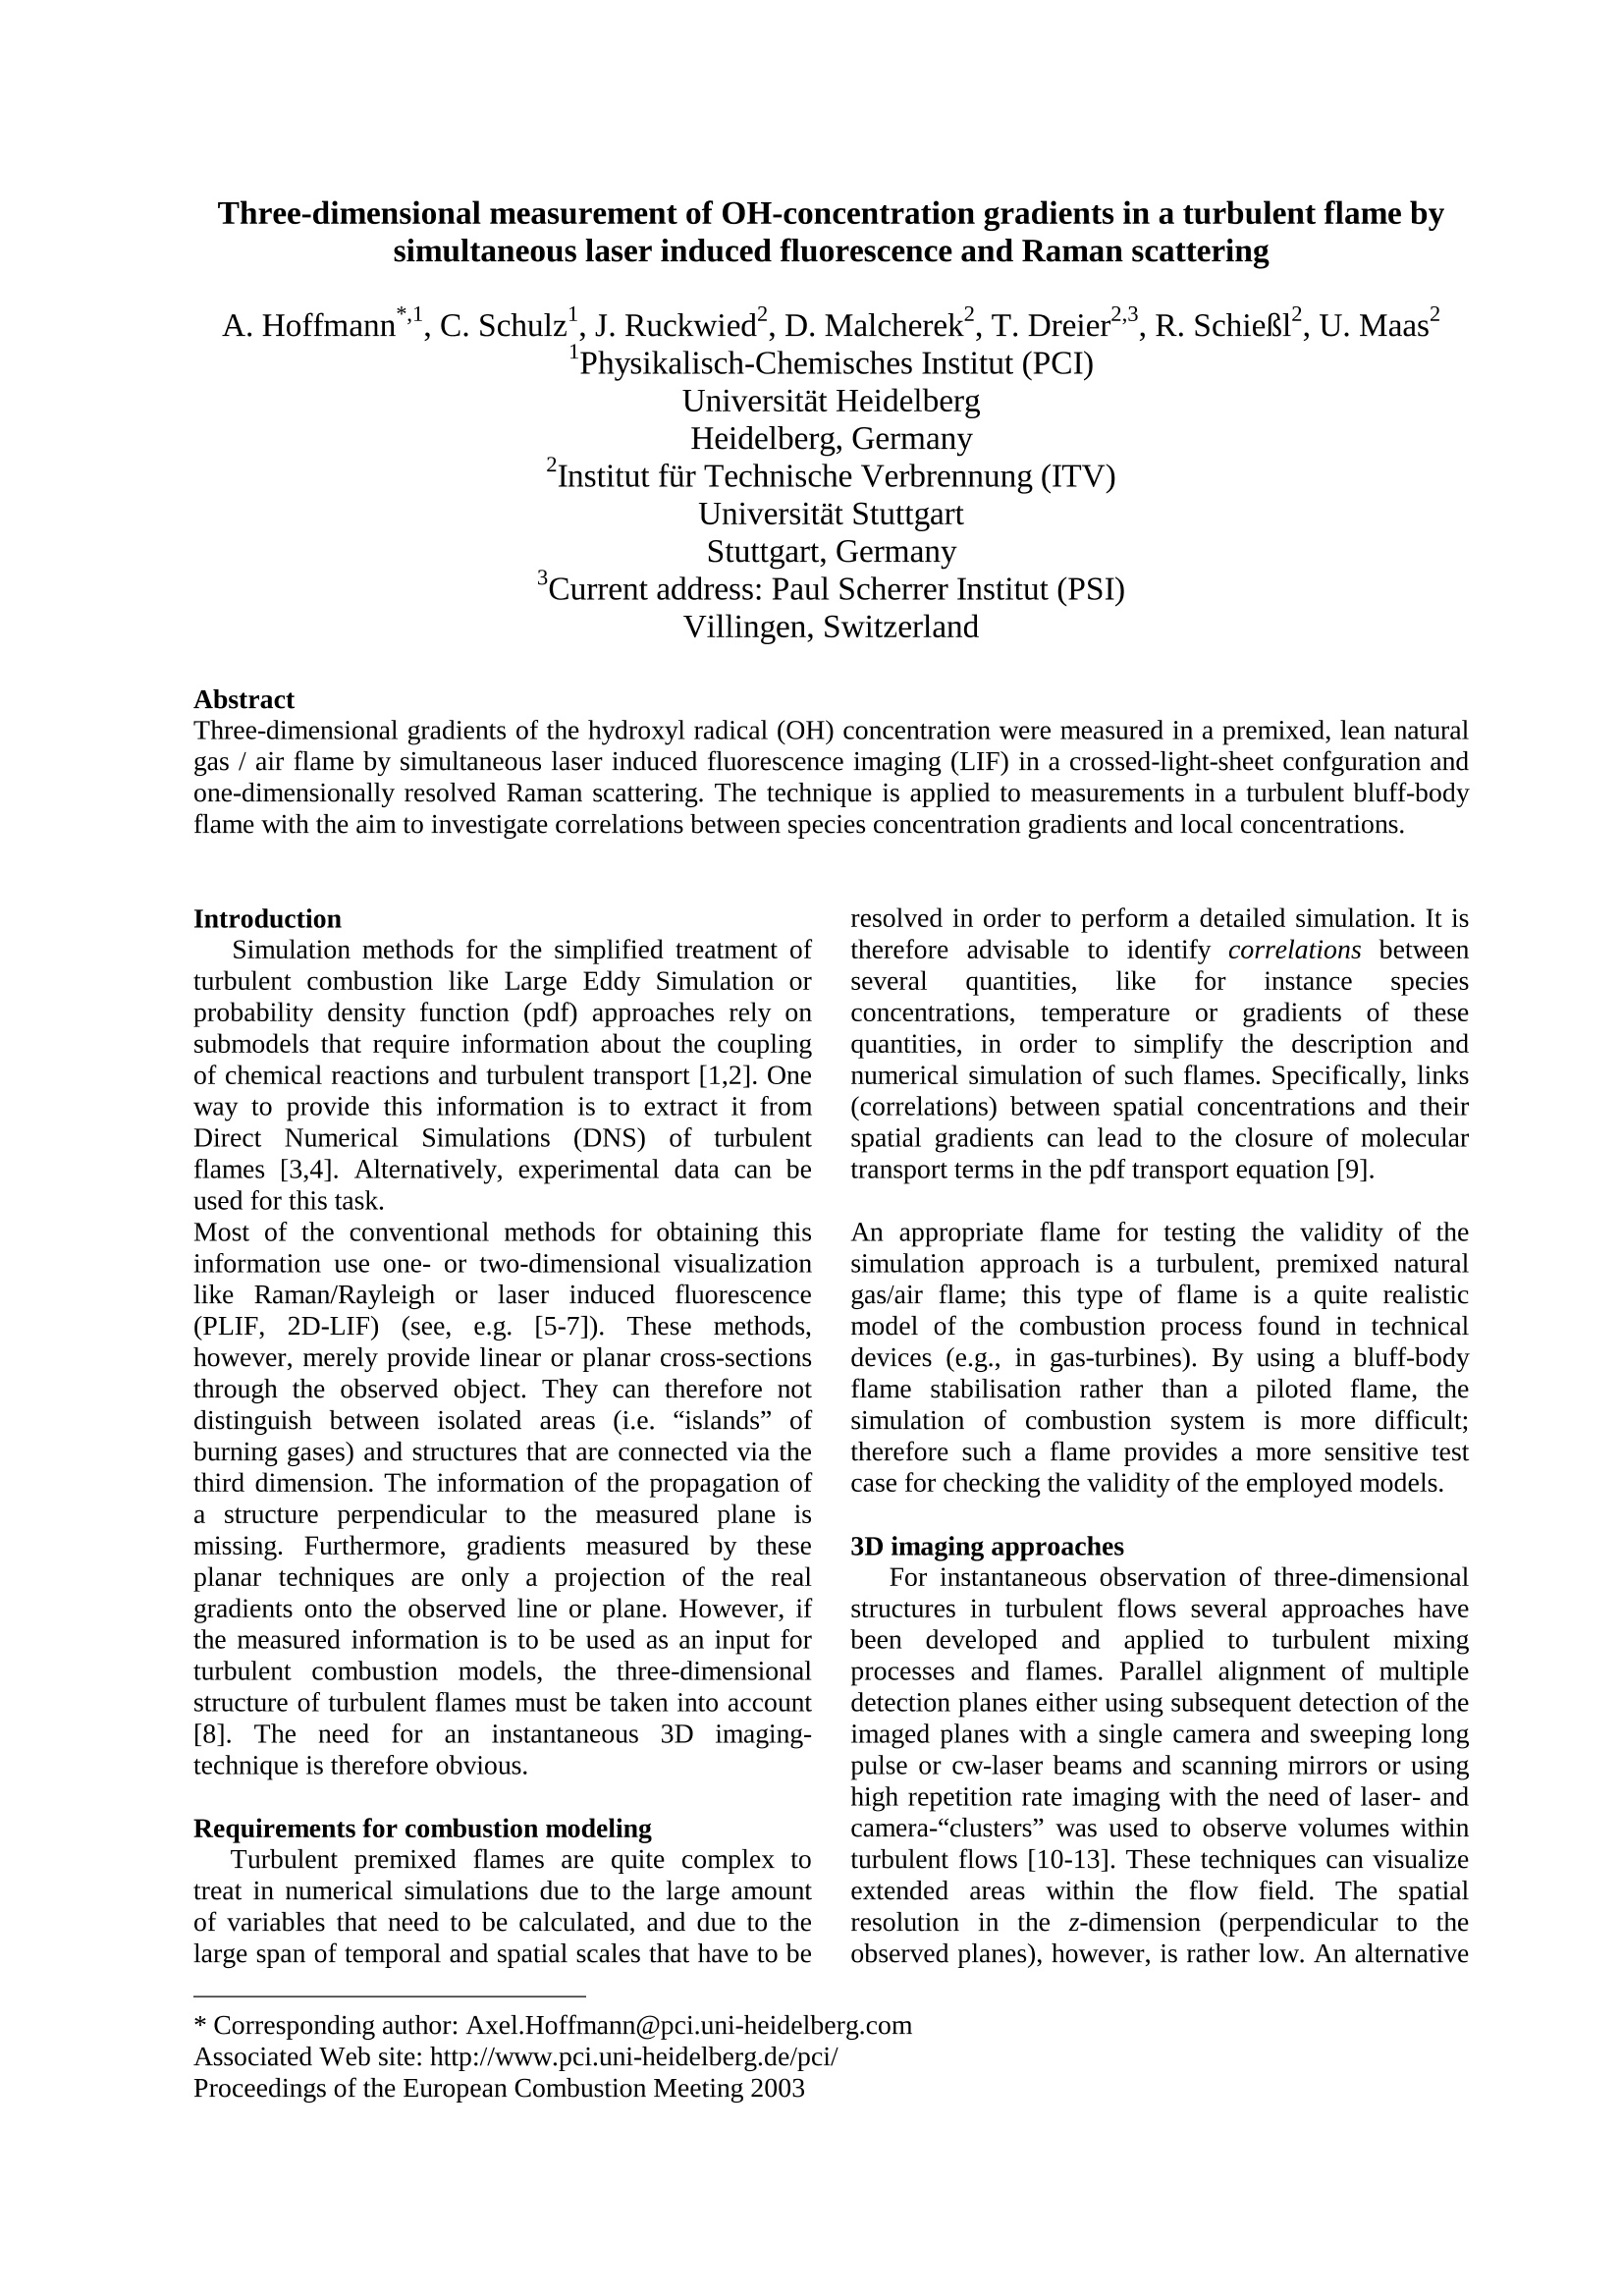
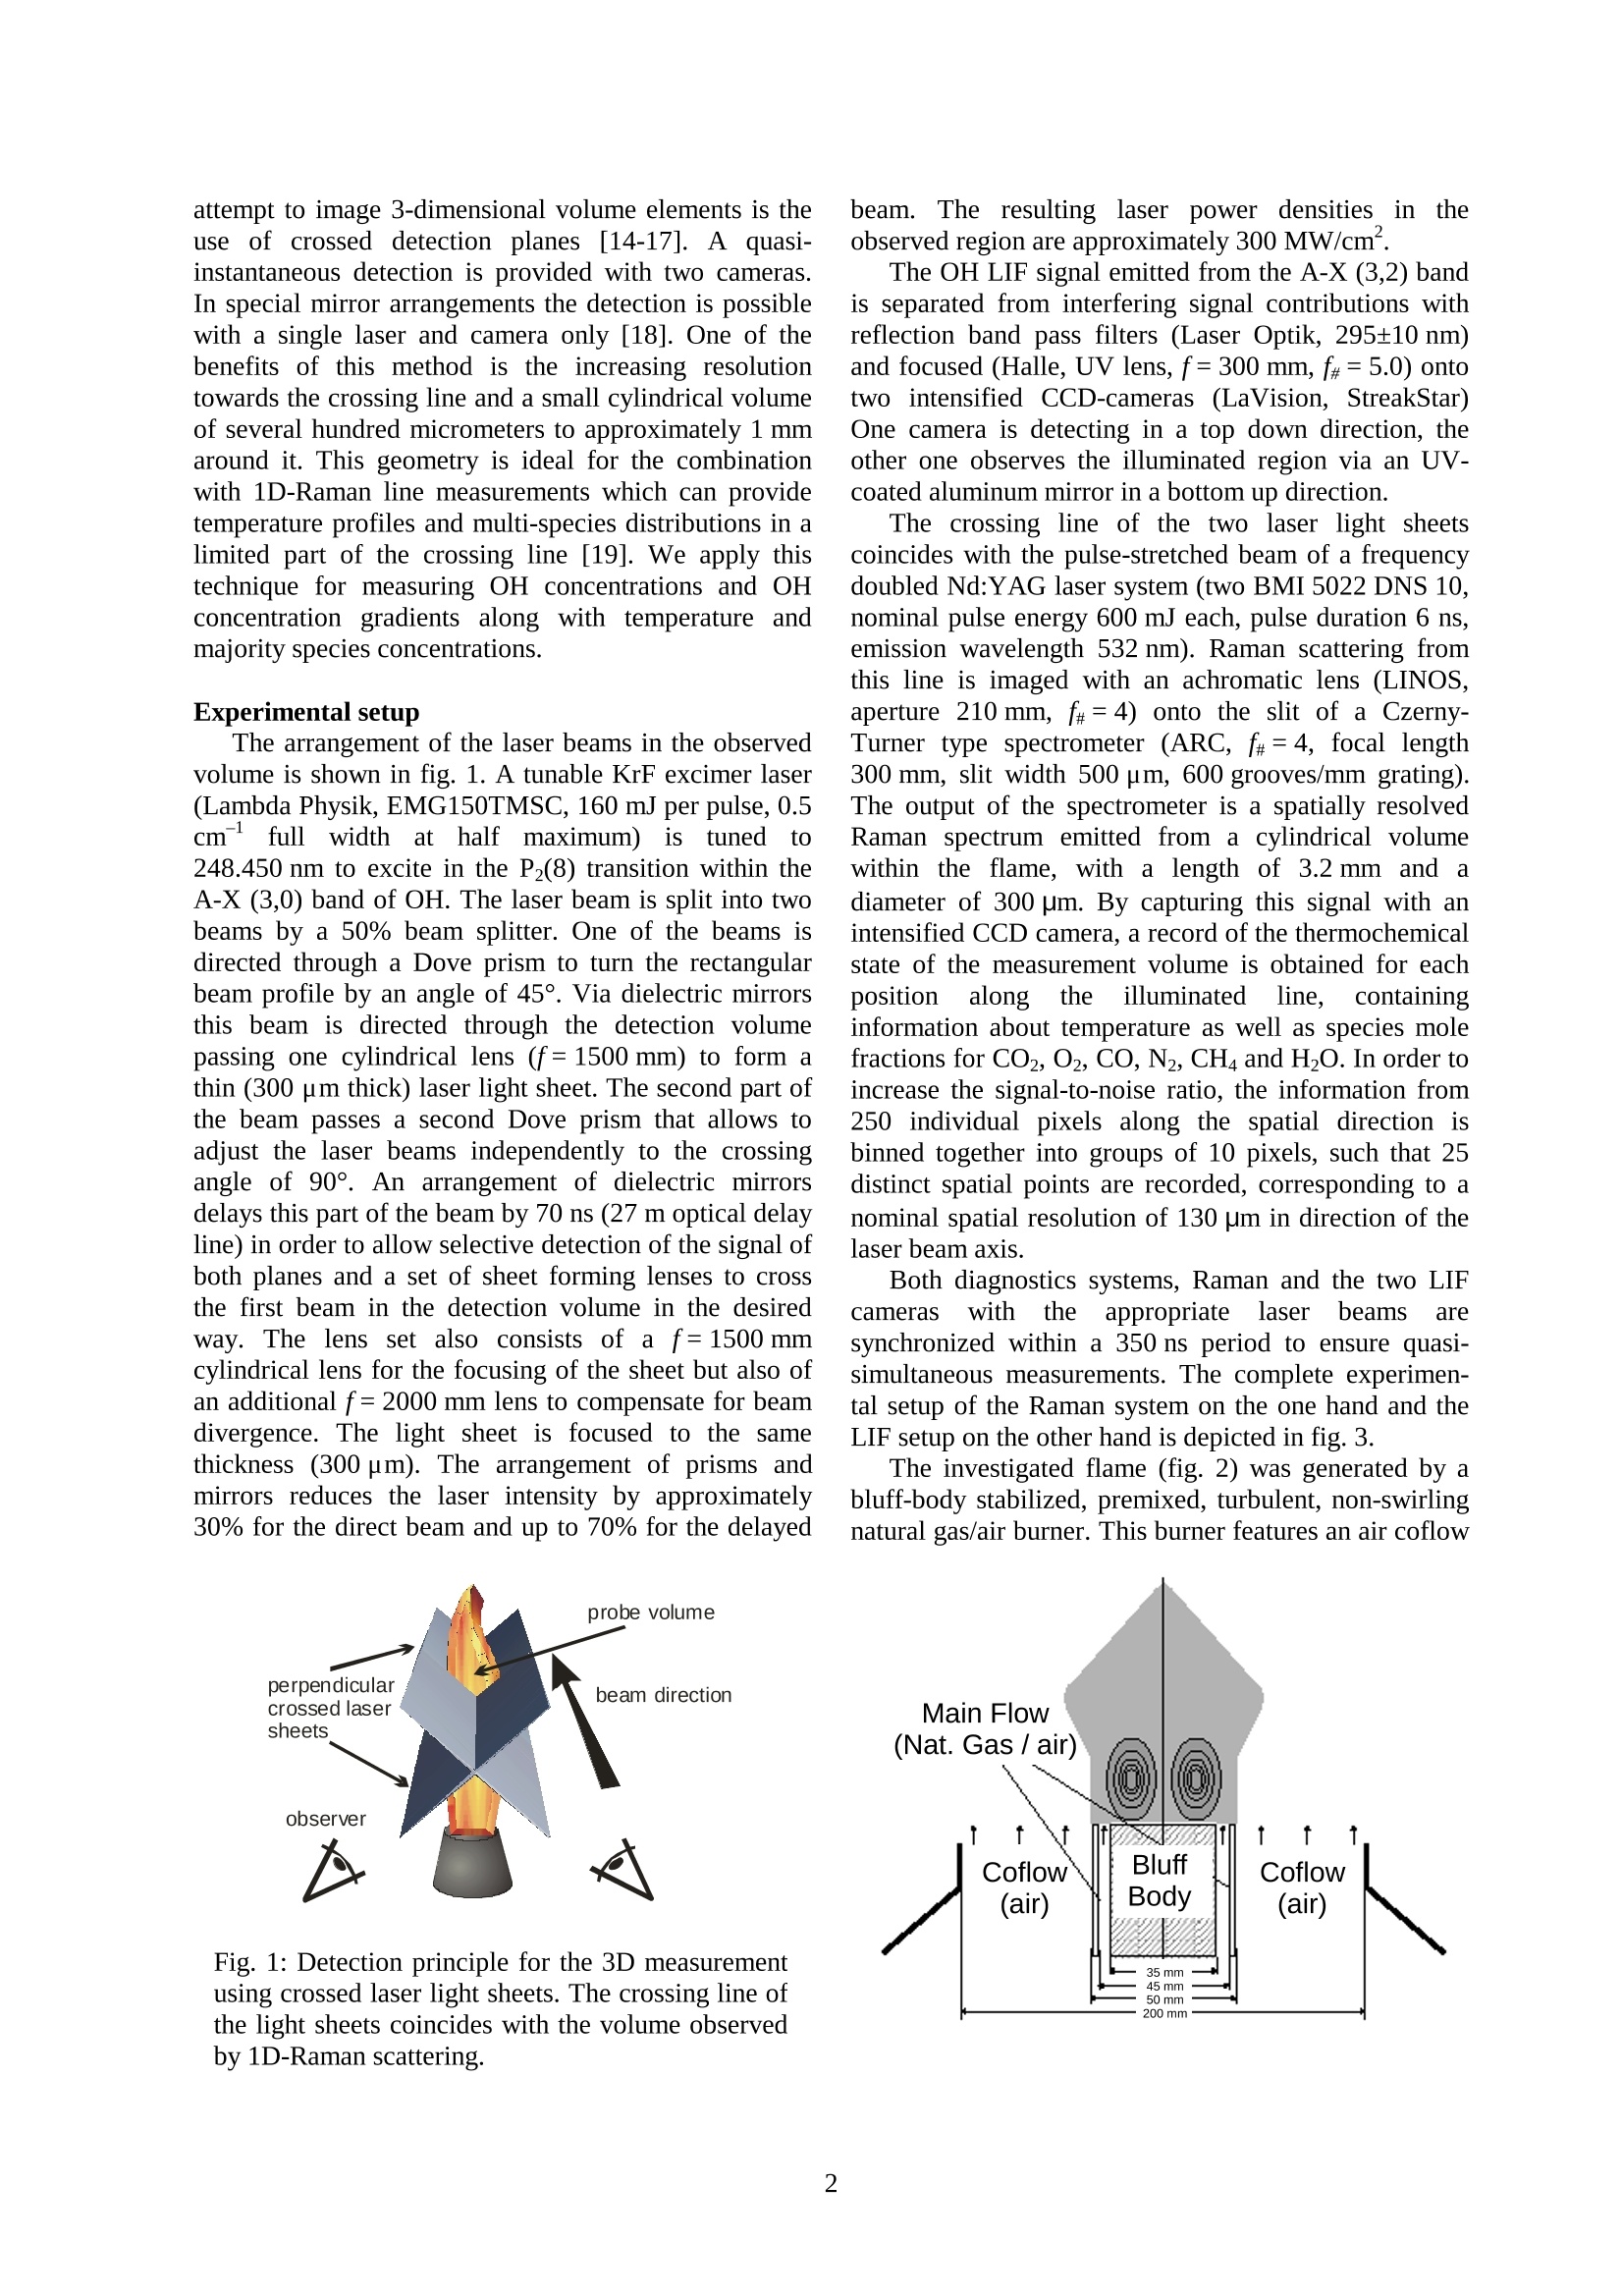
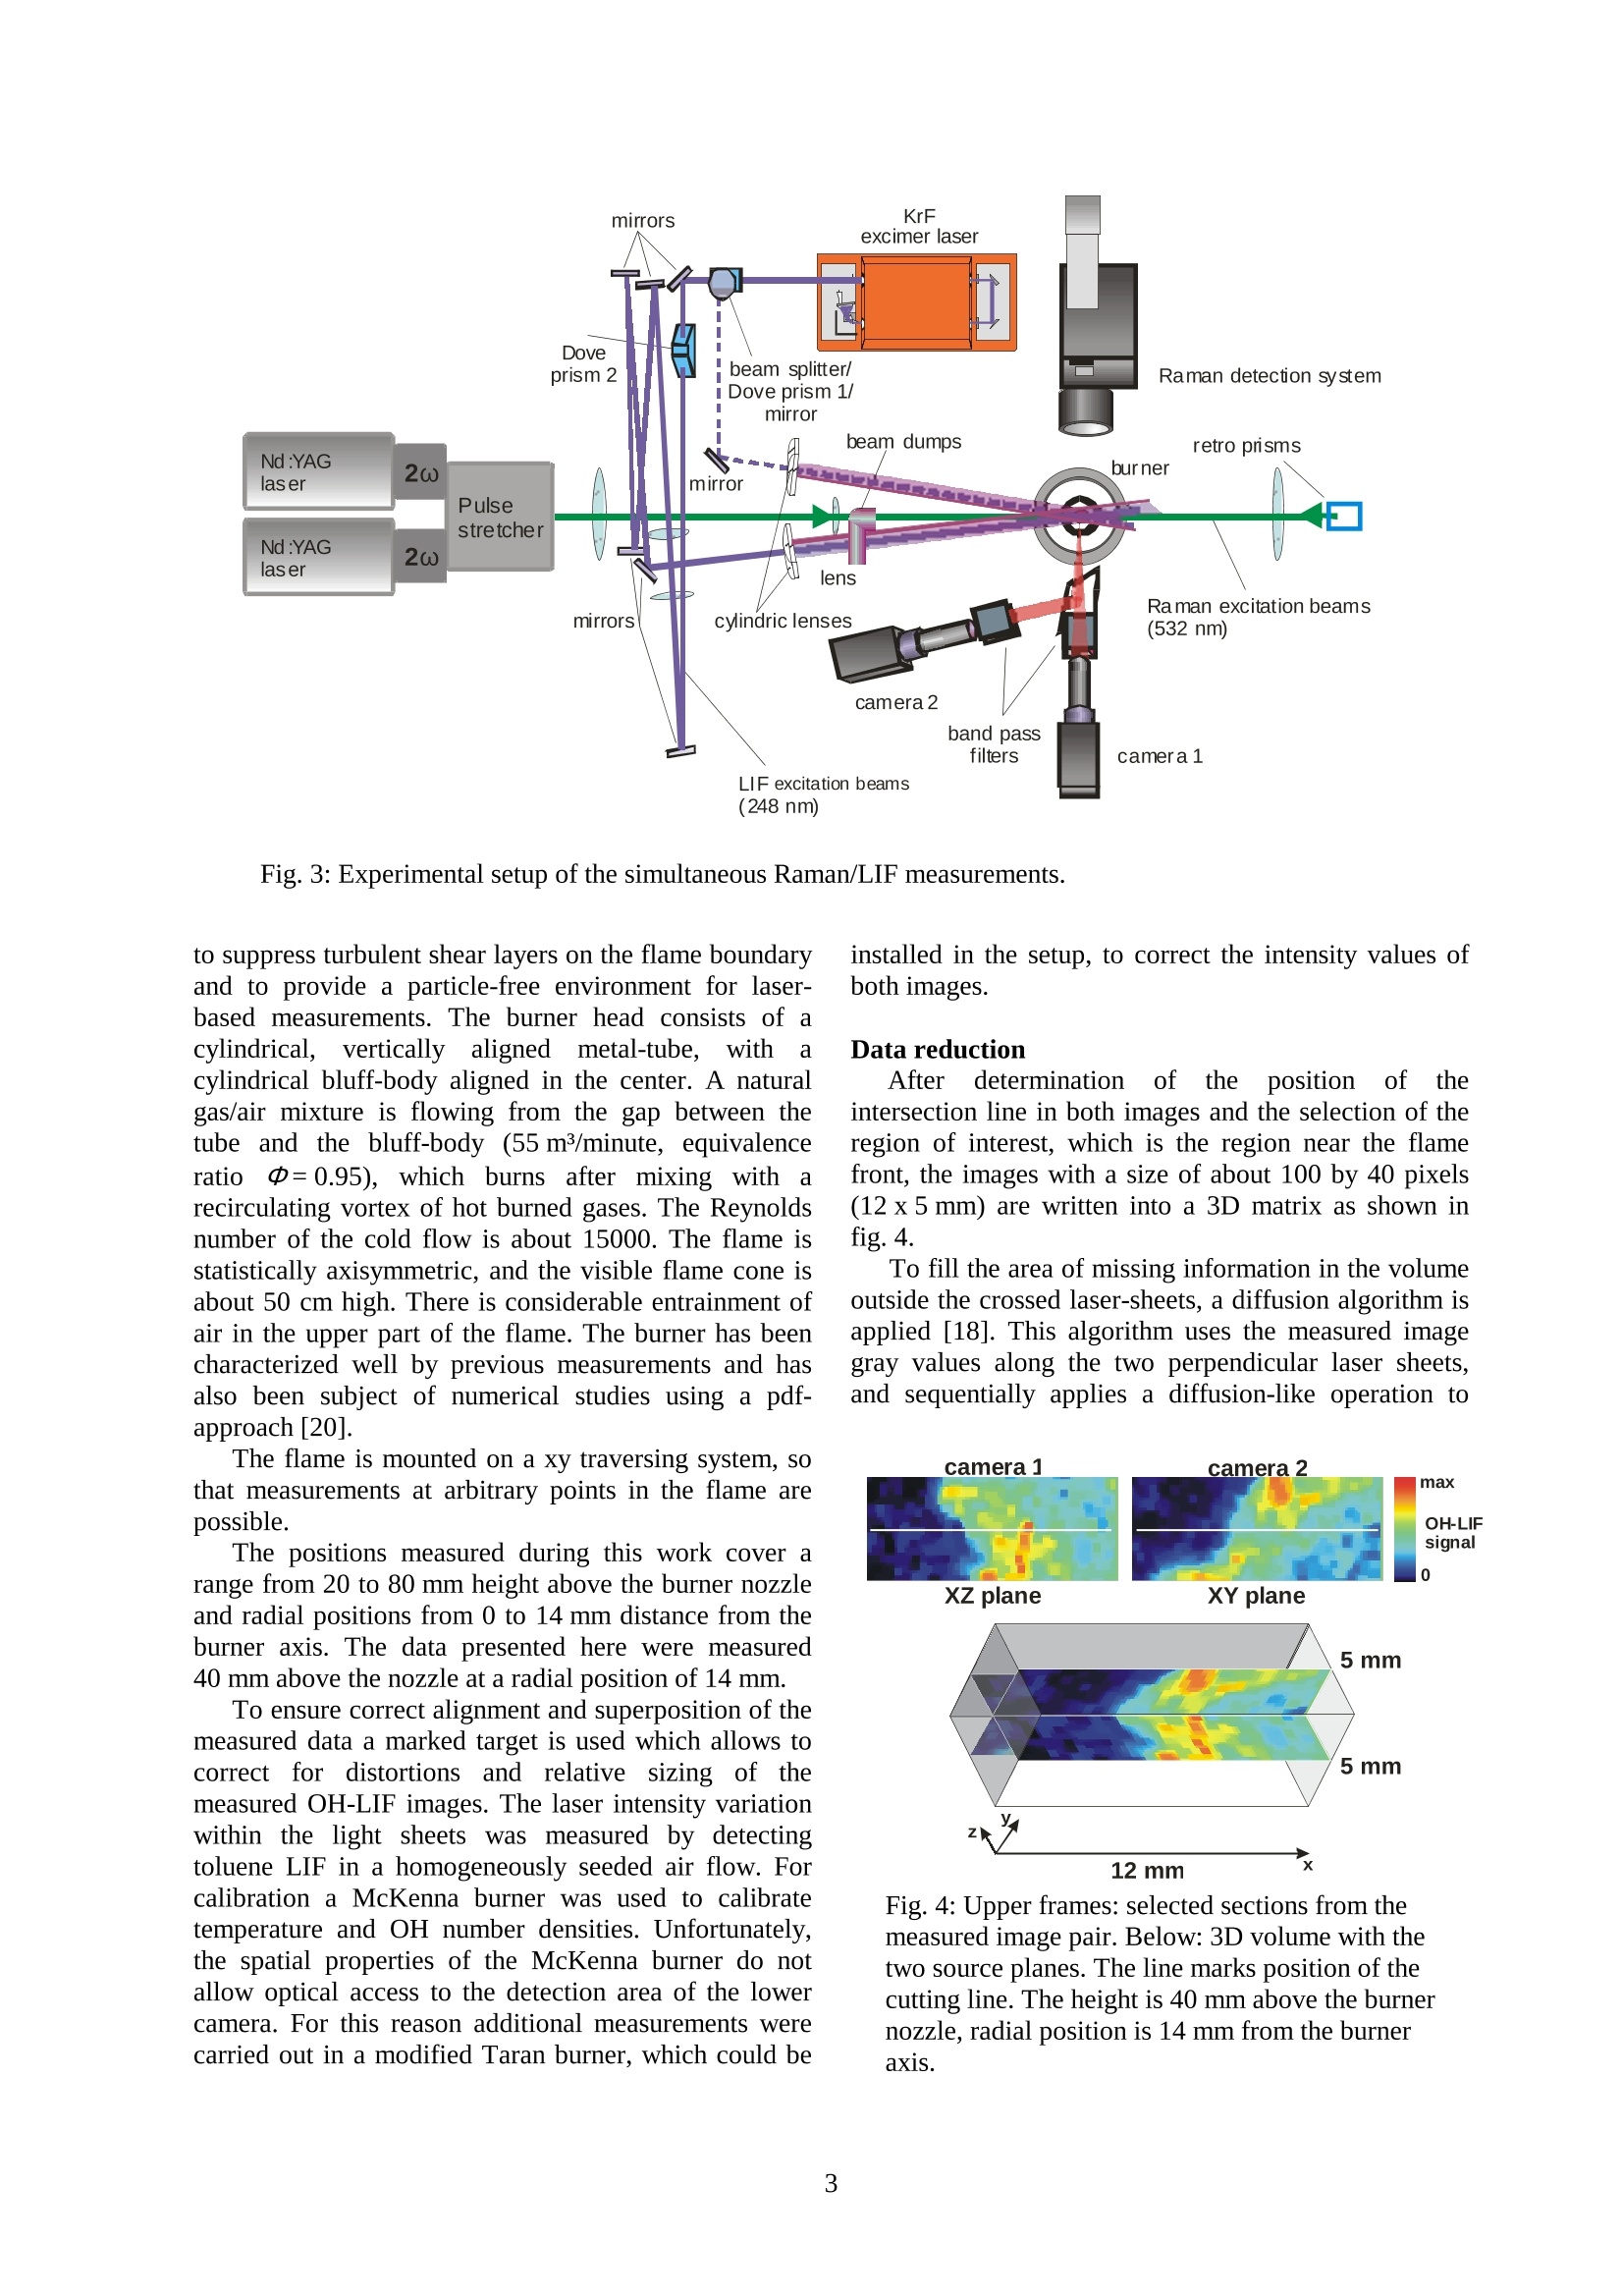
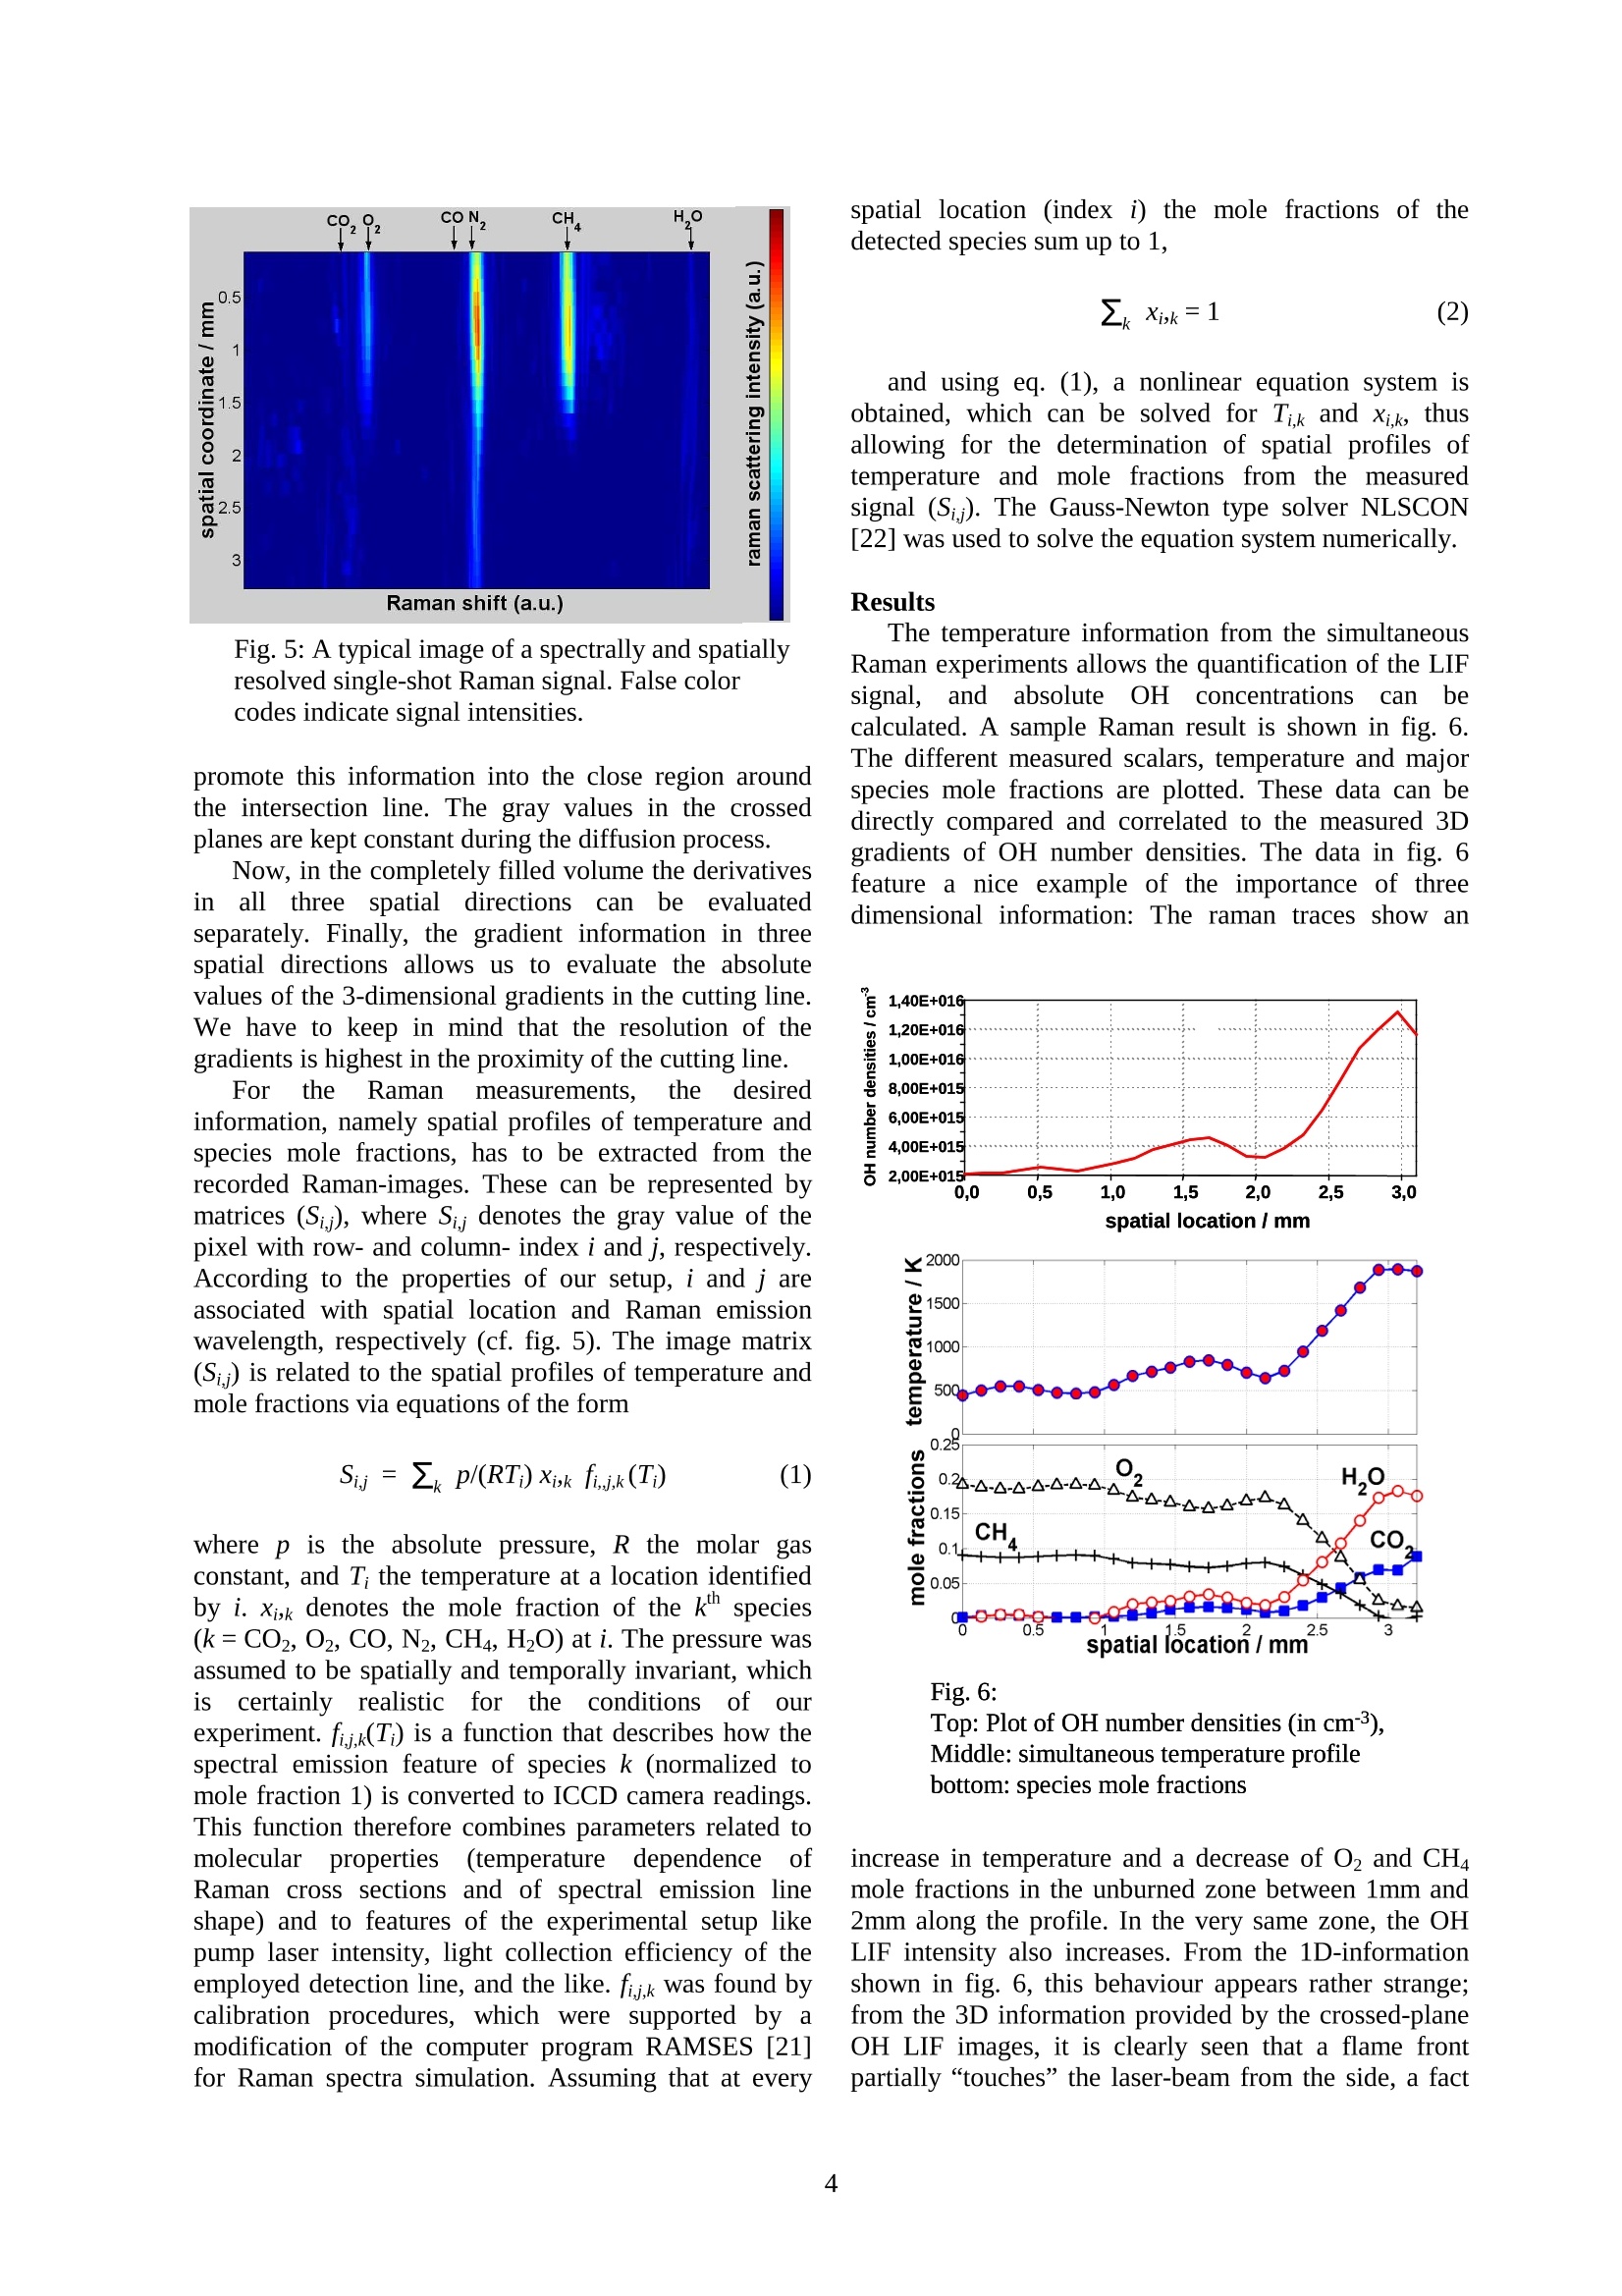
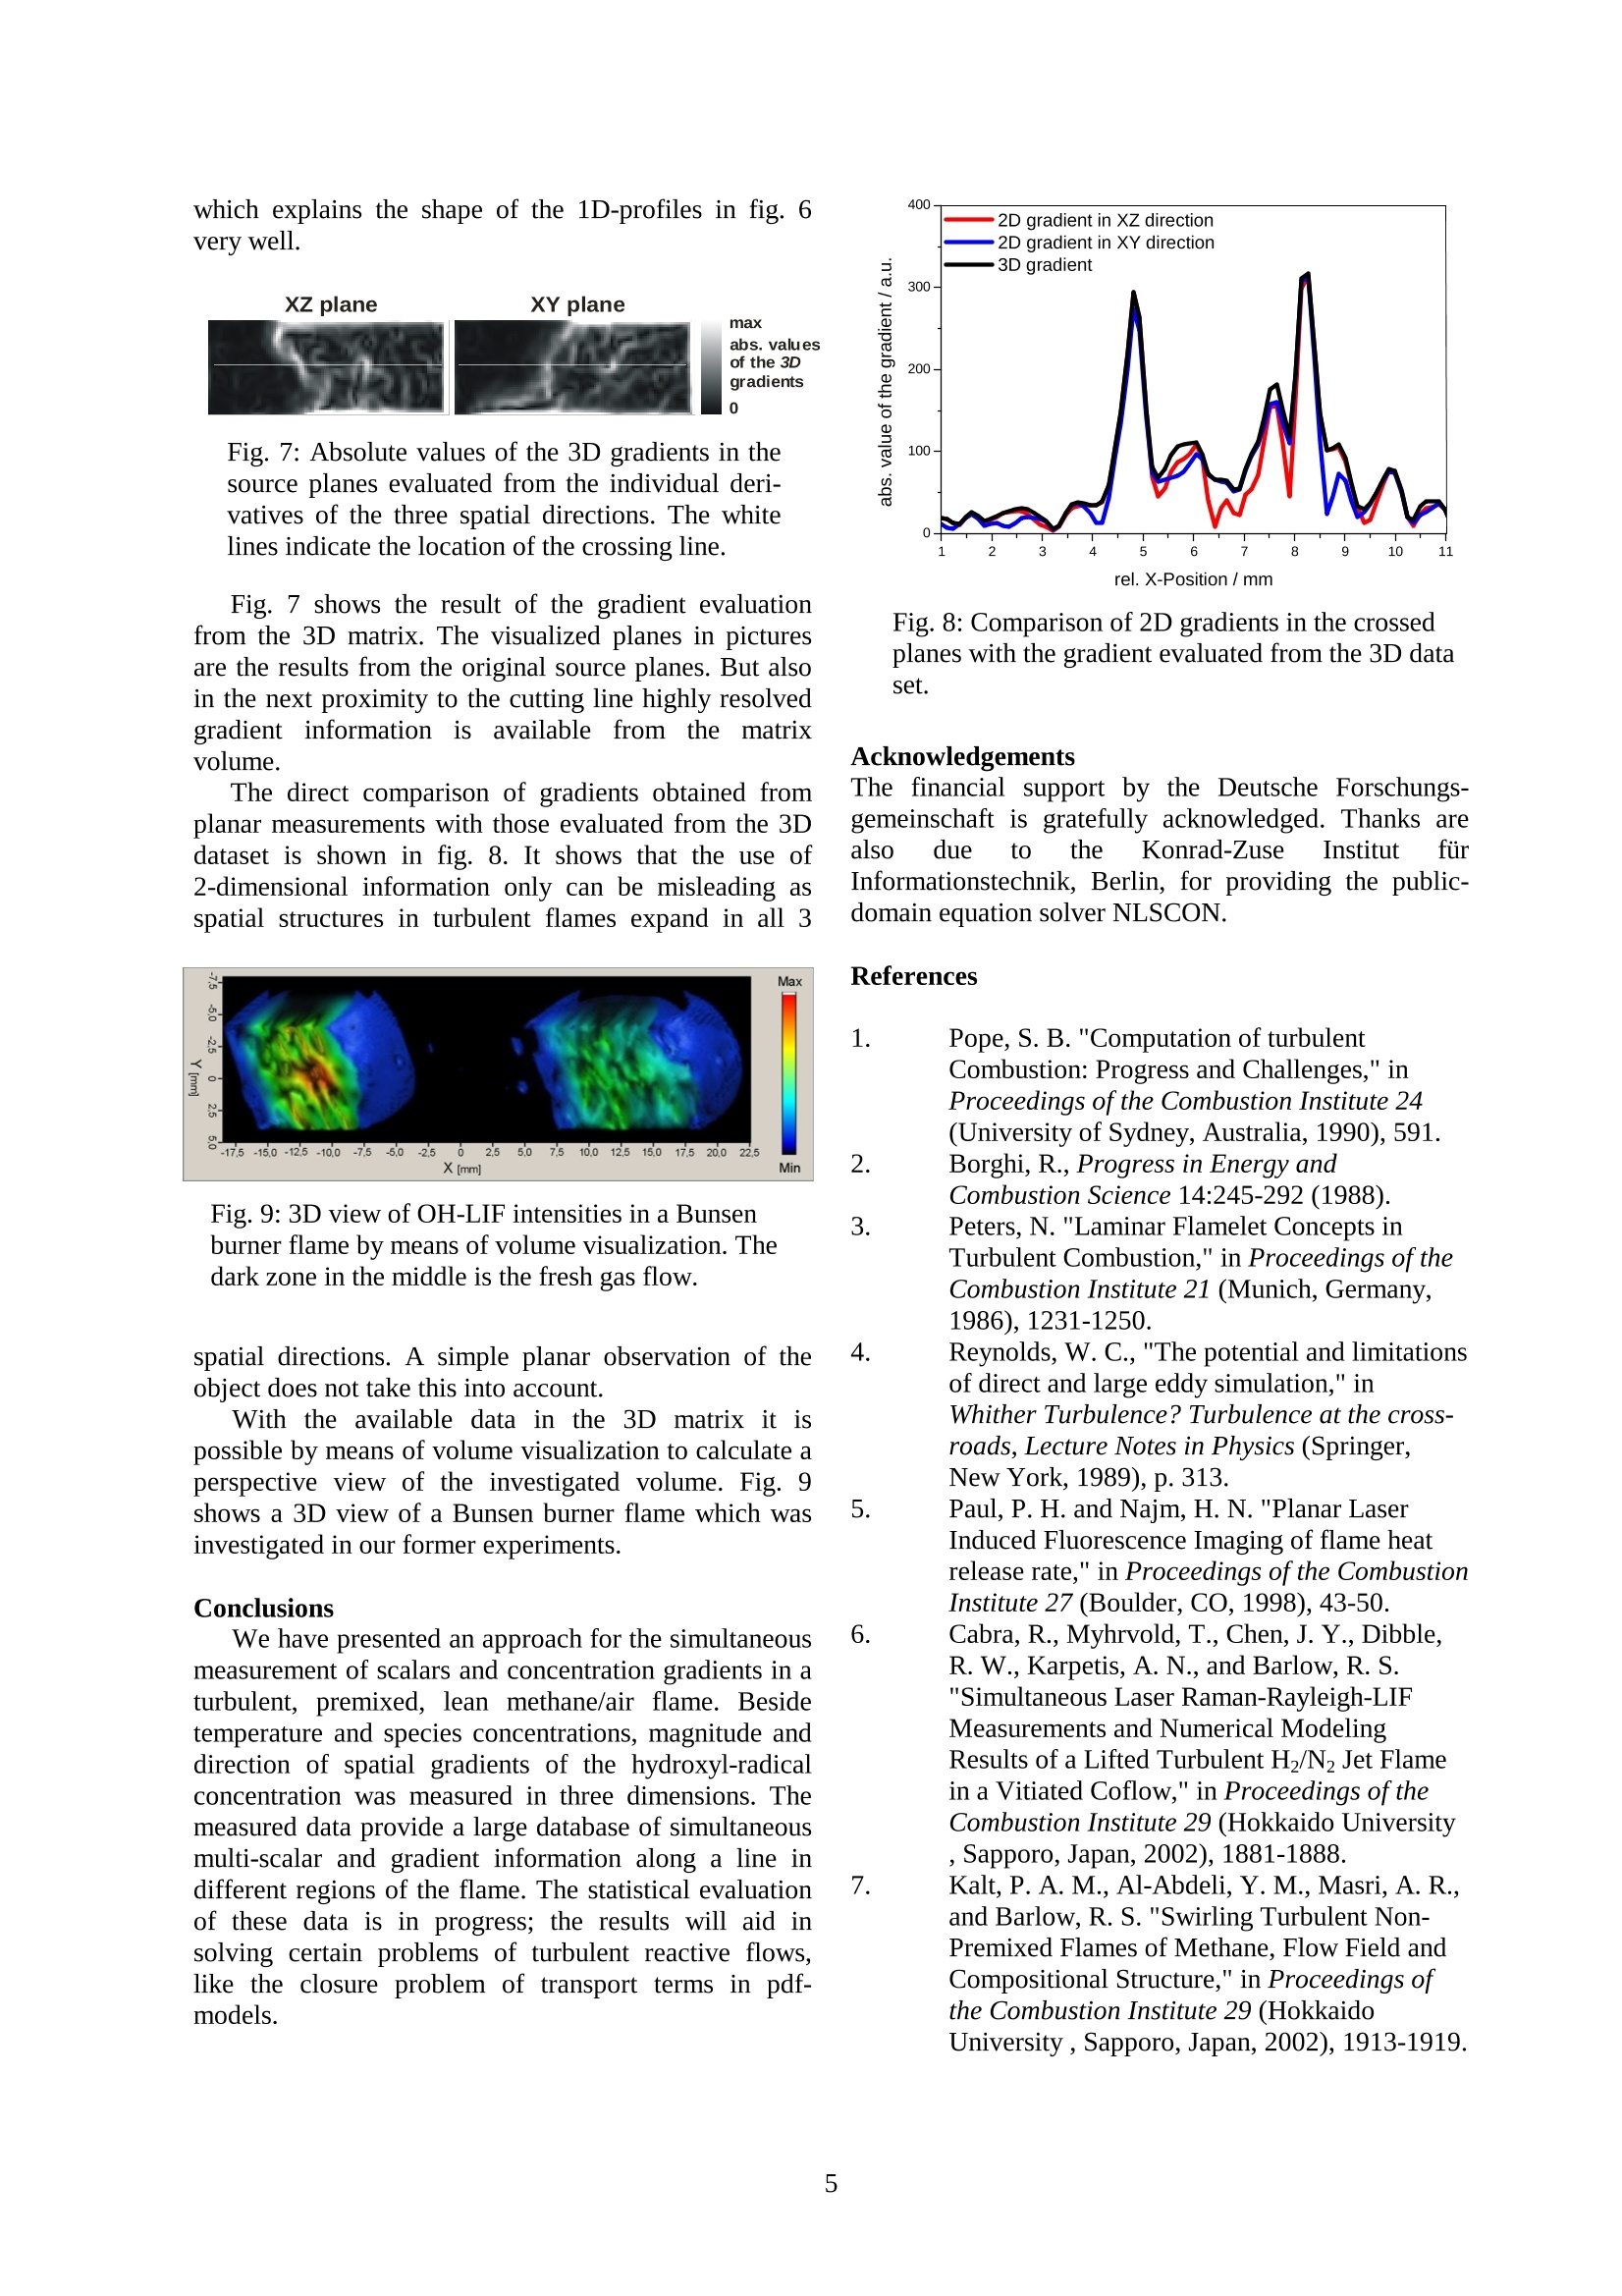
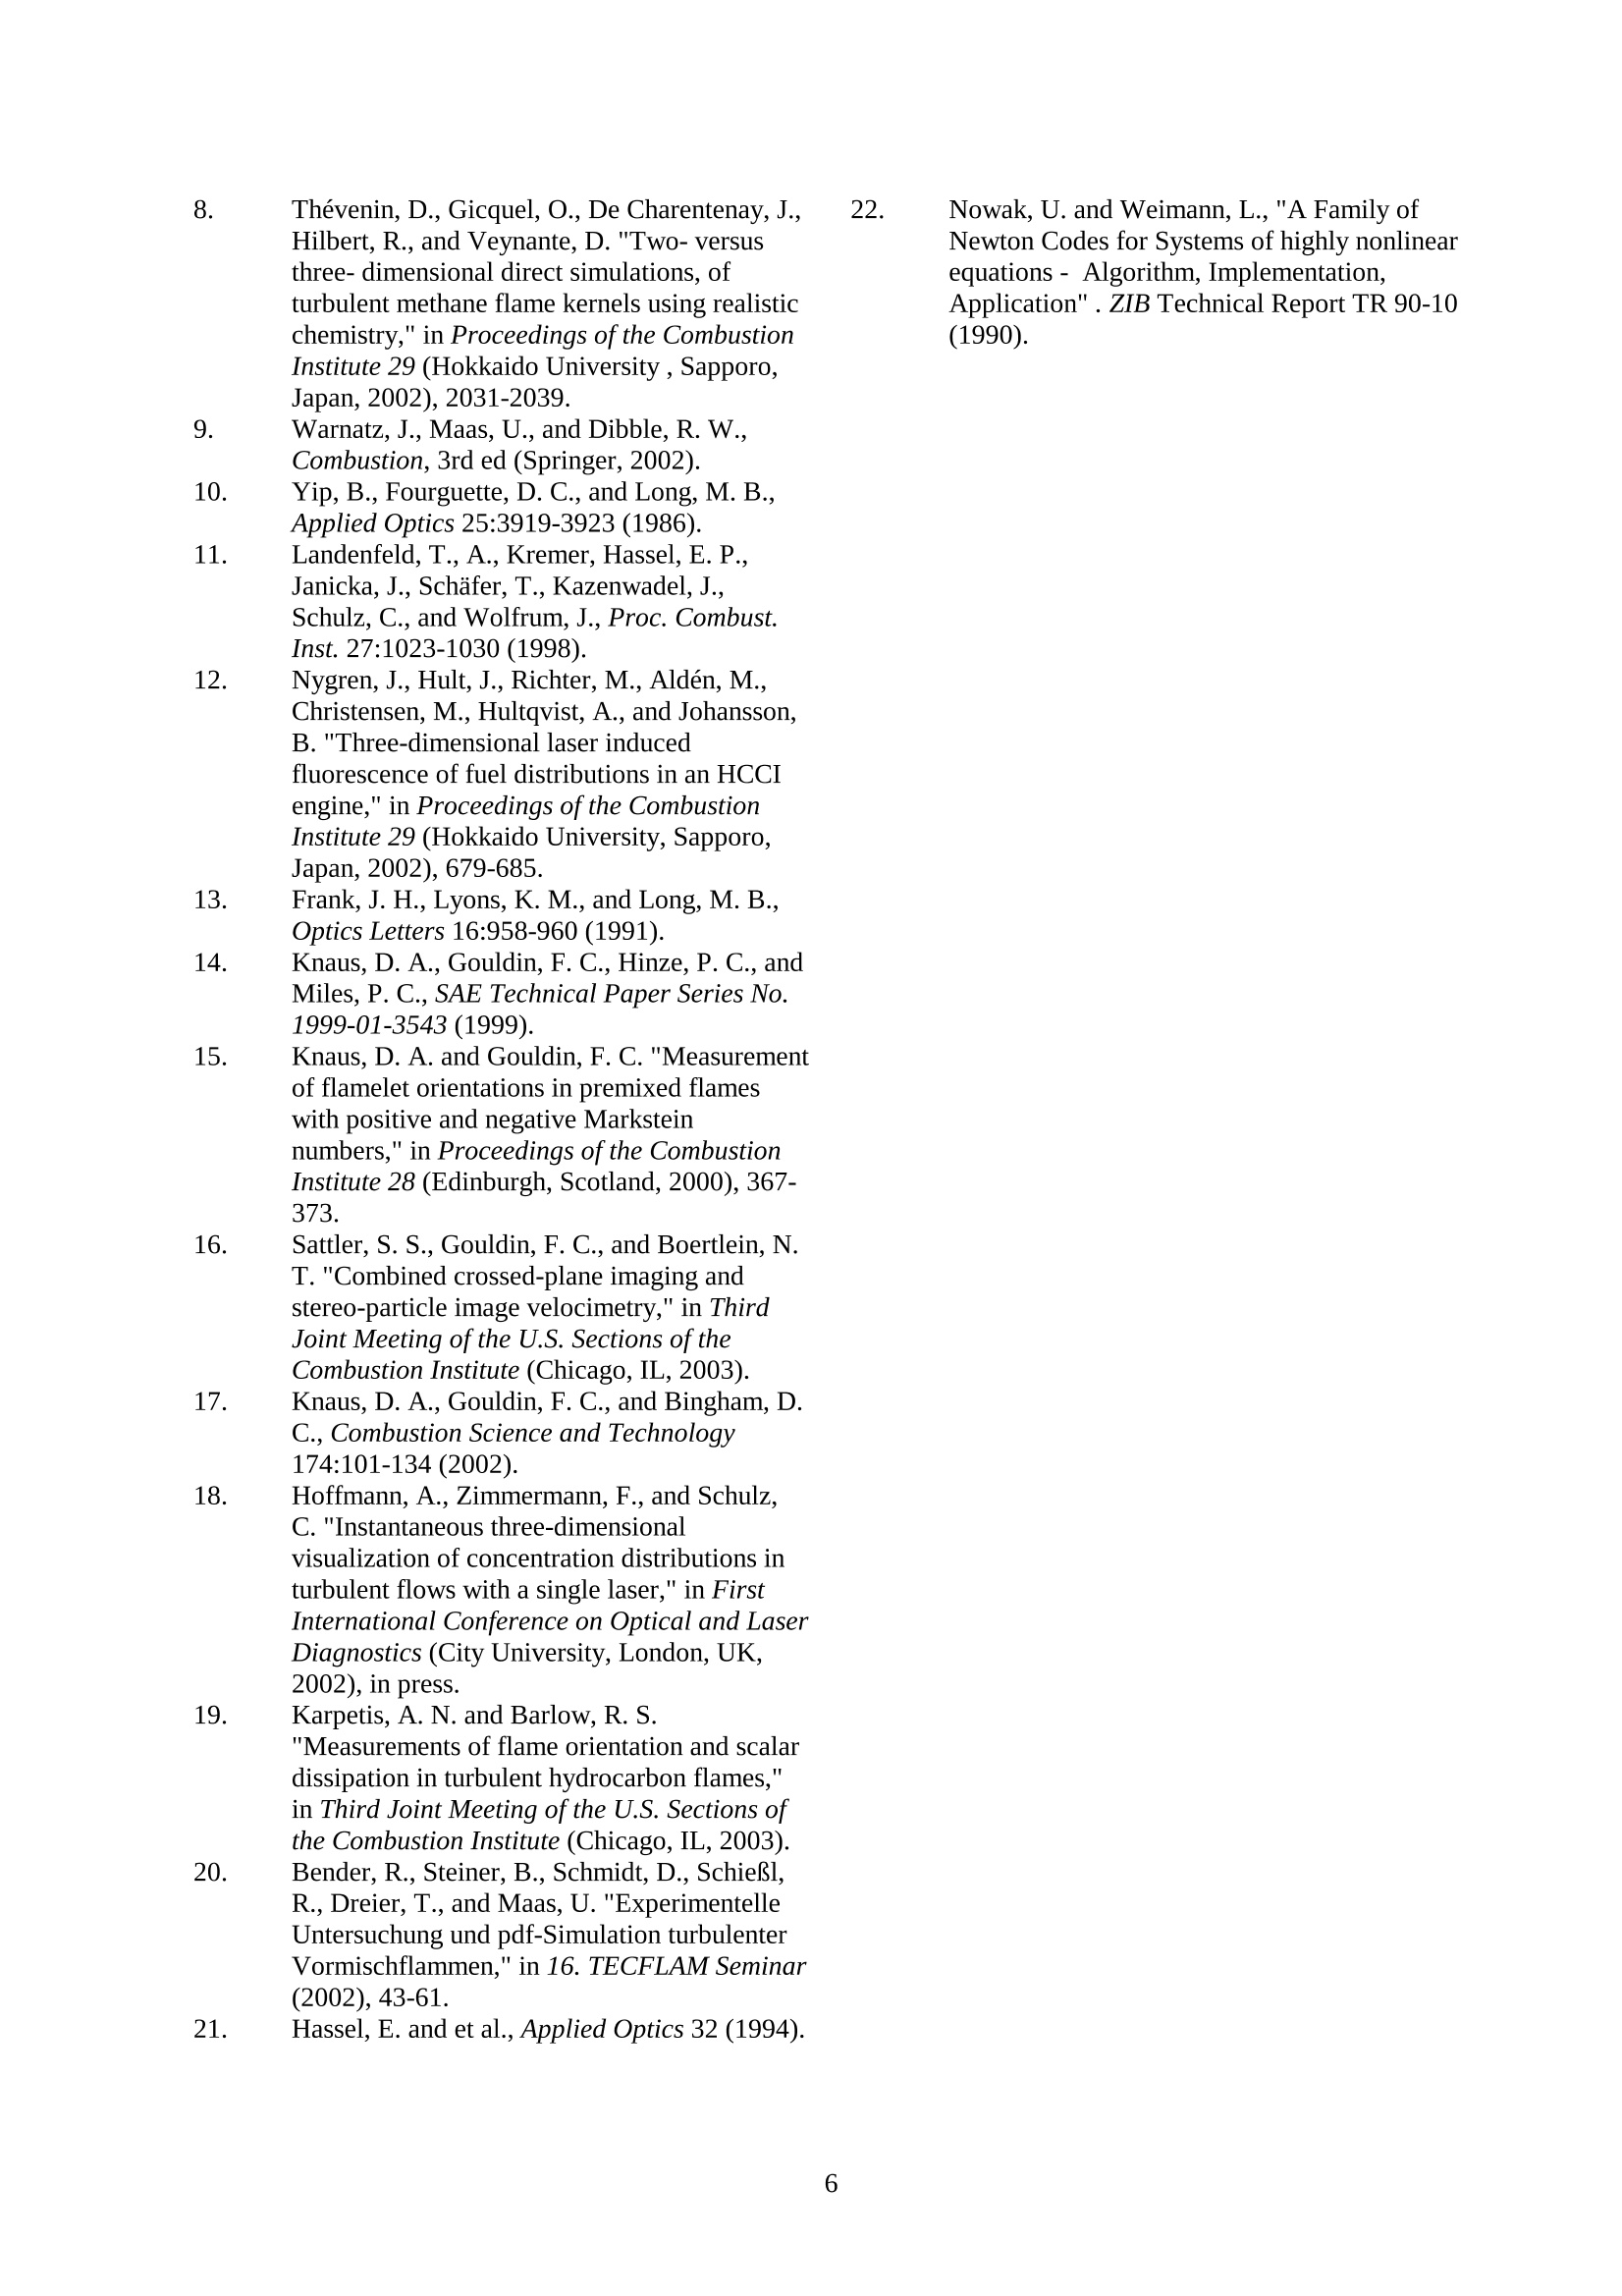
Three-dimensional measurement of OH-concentration gradients in a turbulent flame bysimultaneous laser induced fluorescence and Raman scattering A. Hoffmann*,c. Schulz', J. Ruckwied, D. Malcherek’, T. Dreier3, R. SchieBl, U. Maas’ Physikalisch-Chemisches Institut (PCI) Universitat Heidelberg Heidelberg, Germany Institut fiir Technische Verbrennung (ITV) Universitat Stuttgart Stuttgart, Germany Current address: Paul Scherrer Institut (PSI) Villingen, Switzerland Abstract Three-dimensional gradients of the hydroxyl radical (OH) concentration were measured in a premixed, lean naturalgas / air flame by simultaneous laser induced fluorescence imaging (LIF) in a crossed-light-sheet confguration andone-dimensionally resolved Raman scattering. The technique is applied to measurements in a turbulent bluff-bodyflame with the aim to investigate correlations between species concentration gradients and local concentrations. Introduction Simulation methods for the simplified treatment ofturbulent combustion like Large Eddy Simulation orprobability density function (pdf) approaches rely onsubmodels that require information about the couplingof chemical reactions and turbulent transport [1,2]. Oneway to provide this information is to extract it fromDirect Numerical Simulations(DNS)of turbulentflames [3,4]. Alternatively, experimental data can beused for this task. Most of the conventional methods for obtaining thisinformation use one- or two-dimensional visualizationlike Raman/Rayleigh or laser induced fluorescence(PLIF,2D-LIF)) (see, e.g. [5-7]). These methods,however, merely provide linear or planar cross-sectionsthrough the observed object. They can therefore notdistinguish between isolated areas (i.e.e.“islands”ofburning gases) and structures that are connected via thethird dimension. The information of the propagation ofa structure perpendicular to the measured plane ismissing. Furthermore, gradients measured by theseplanar techniques are only a projection of the realgradients onto the observed line or plane. However, ifthe measured information is to be used as an input forturbulent combustion models, the three-dimensionalstructure of turbulent flames must be taken into account[8]. The need for an:instantaneous3D imaging-technique is therefore obvious. Requirements for combustion modeling Turbulent premixed flames are quite complex totreat in numerical simulations due to the large amountof variables that need to be calculated, and due to thelarge span of temporal and spatial scales that have to be resolved in order to perform a detailed simulation. It istherefore advisable to identify correlations betweenSeveral quantities, like for instance speciesconcentrations,ttemperaturee orgradientsof thesequantities, in order to simplify the description andnumerical simulation of such flames. Specifically, links(correlations) between spatial concentrations and theirspatial gradients can lead to the closure of moleculartransport terms in the pdf transport equation [9]. An appropriate flame for testing the validity of thesimulation approach is a turbulent, premixed naturalgas/air flame; this type of flame is a quite realisticmodel of the combustion process found in technicaldevices (e.g., in gas-turbines). By using a bluff-bodyflame stabilisation rather than a piloted flame, thesimulation of combustion system is more difficult;therefore such a flame provides a more sensitive testcase for checking the validity of the employed models. 3D imaging approaches For instantaneous observation of three-dimensionalstructures in turbulent flows several approaches havebeenndevelopedl andappliedtototturbulentmixingprocesses and flames. Parallel alignment of multipledetection planes either using subsequent detection of theimaged planes with a single camera and sweeping longpulse or cw-laser beams and scanning mirrors or usinghigh repetition rate imaging with the need of laser- andcamera-“clusters” was used to observe volumes withinturbulent flows [10-13]. These techniques can visualizeextended areaswithin the flow field. The spatialresolution in the z-dimension (perpendicular to theobserved planes), however, is rather low. An alternative ( *Corresponding author: Axel.Hoffmann@pci.uni-heidelberg.com Associated Web site: http://www.pci.uni-heidelberg.de/pci/ ) ( Proceedings of the European Combustion Meeting 2003 ) attempt to image 3-dimensional volume elements is theuse of crossed detection planes [14-17]. A quasi-instantaneous detection is provided with two cameras.In special mirror arrangements the detection is possiblewith a single laser and camera only [18]. One of thebenefits of this method is the increasing resolutiontowards the crossing line and a small cylindrical volumeof several hundred micrometers to approximately 1 mmaround it. This geometry is ideal for the combinationwith 1D-Raman line measurements which can providetemperature profiles and multi-species distributions in alimited part of the crossing line [19]. We apply thistechnique for measuring OH concentrations and OHconcentration gradients alonggwith temperature andmajority species concentrations. Experimental setup The arrangement of the laser beams in the observedvolume is shown in fig. 1. A tunable KrF excimer laser(Lambda Physik, EMG150TMSC,160 mJ per pulse, 0.5cmfullwidthathalf maximum)is tunedto248.450 nm to excite in the P2(8) transition within theA-X (3,0) band of OH. The laser beam is split into twobeams by a 50% beam splitter. One of the beams isdirected through a Dove prism to turn the rectangularbeam profile by an angle of 45°.Via dielectric mirrorsthis beam is directed through the detection volumepassing one cylindrical lens (f=1500 mm) to form athin (300 um thick) laser light sheet. The second part ofthe beam passes a second Dove prism that allows toadjust the laser beams independently to the crossingangle of 90°. An arrangement of dielectric mirrorsdelays this part of the beam by 70 ns (27 m optical delayline) in order to allow selective detection of the signal ofboth planes and a set of sheet forming lenses to crossthe first beam in the detection volume in the desiredway. The lens set also consists of a f=1500 mmcylindrical lens for the focusing of the sheet but also ofan additional f=2000 mm lens to compensate for beamdivergence. The light sheet is focused to the samethickness (300um). The arrangement of prisms andmirrors reduces the laser intensity by approximately30% for the direct beam and up to 70% for the delayed Fig. 1: Detection principle for the 3D measurementusing crossed laser light sheets. The crossing line ofthe light sheets coincides with the volume observedby 1D-Raman scattering. beam.. The resulting laser power densities in ttheobserved region are approximately 300 MW/cm . The OH LIF signal emitted from the A-X (3,2) bandis separated from interfering signal contributions withreflection band pass filters (Laser Optik, 295±10 nm)and focused (Halle, UV lens, f=300 mm,f#=5.0) ontotwo intensified CCD-cameras (LaVision, StreakStar)One camera is detecting in a top down direction, theother one observes the illuminated region via an UV-coated aluminum mirror in a bottom up direction. The crossing line of the two laser light sheetscoincides with the pulse-stretched beam of a frequencydoubled Nd:YAG laser system (two BMI 5022 DNS 10,nominal pulse energy 600 mJ each, pulse duration 6 ns,emission wavelength 532 nm). Raman scattering fromthis line is imaged with an achromatic lens (LINOS,aperture 210 mm, f#=4) onto the slit of a Czerny-Turner type spectrometer (ARC, f#=4, focal length300 mm, slit width 500 um, 600 grooves/mm grating).The output of the spectrometer is a spatially resolvedRaman spectrum emitted from a cylindrical volumewithin the flame, with a length of 3.2 mm and adiameter of 300 pm. By capturing this signal with anintensified CCD camera, a record ofthe thermochemicalstate of the measurement volume is obtained for eachpositionnalong theilluminated line,,containinginformation about temperature as well as species molefractions for CO2, O2, CO, N2, CH4 and H2O. In order toincrease the signal-to-noise ratio, the information from250 individual pixels along the spatial direction isbinned together into groups of 10 pixels, such that 25distinct spatial points are recorded, corresponding to anominal spatial resolution of 130 um in direction of thelaser beam axis. Both diagnostics systems, Raman and the two LIFcamerasiswiththeappropriate Ilaserr beams aresynchronized within a 350ns period to ensure quasi-simultaneous measurements. The complete experimen-tal setup of the Raman system on the one hand and theLIF setup on the other hand is depicted in fig. 3. The investigated flame (fig. 2) was generated by abluff-body stabilized, premixed, turbulent, non-swirlingnatural gas/air burner. This burner features an air coflow Fig. 3: Experimental setup of the simultaneous Raman/LIF measurements. to suppress turbulent shear layers on the flame boundaryand to provide a particle-free environment for laser-based measurements. The burner head consists of acylindrical,vertically aligned metal-tube,with acylindrical bluff-body aligned in the center. A naturalgas/air mixture is flowing from the gap between thetube and the bluff-body (55m’/minute, equivalenceratio D=0.95),which burns after mixing with arecirculating vortex of hot burned gases. The Reynoldsnumber of the cold flow is about 15000. The flame isstatistically axisymmetric, and the visible flame cone isabout 50 cm high. There is considerable entrainment ofair in the upper part of the flame. The burner has beencharacterized well by previous measurements and hasalso been subject of numerical studies using a pdf-approach [20]. The flame is mounted on a xy traversing system, sothat measurements at arbitrary points in the flame arepossible. The positions measured during this work cover arange from 20 to 80 mm height above the burner nozzleand radial positions from 0 to 14 mm distance from theburner axis. The data presented here were measured40 mm above the nozzle at a radial position of 14 mm. To ensure correct alignment and superposition of themeasured data a marked target is used which allows tocorrectfor distortions and1 relative sizing of themeasured OH-LIF images. The laser intensity variationwithin the light sheetsSVwas measured by detectingtoluene LIF in a homogeneously seeded air flow. Forcalibration a McKenna burner was used to calibratetemperature and OH number densities. Unfortunately,the spatial properties of the Mckenna burner do notallow optical access to the detection area of the lowercamera. For this reason additional measurements werecarried out in a modified Taran burner, which could be installed in the setup, to correct the intensity values ofboth images. Data reduction After ideterminationofttheposition oftheintersection line in both images and the selection of theregion of interest, which is the region near the flamefront, the images with a size of about 100 by 40 pixels(12 x 5 mm) are written into a 3D matrix as shown infig.4. To fill the area of missing information in the volumeoutside the crossed laser-sheets, a diffusion algorithm isapplied [18]. This algorithm uses the measured imagegray values along the two perpendicular laser sheets,and sequentially applies a diffusion-like operation to 12 mm Fig. 4: Upper frames: selected sections from themeasured image pair. Below: 3D volume with thetwo source planes. The line marks position of thecutting line. The height is 40 mm above the burnernozzle, radial position is 14 mm from the burneraxis. Fig. 5: A typical image of a spectrally and spatiallyresolved single-shot Raman signal. False color.codes indicate signal intensities. promote this information into the close region aroundthe intersection line. The gray values in the crossedplanes are kept constant during the diffusion process. Now, in the completely filled volume the derivativesinalll threespatialddirections can beevaluatedseparately. Finally, the gradient information in threespatial directions allows us to evaluate the absolutevalues of the 3-dimensional gradients in the cutting line.We have to keep in mind that the resolution of thegradients is highest in the proximity of the cutting line. Fortthe Raman measurements.S, the desiredinformation, namely spatial profiles of temperature andspecies mole fractions, has to be extracted from therecorded Raman-images. These can be represented bymatrices (S), where Si denotes the gray value of thepixel with row- and column- index i and j, respectively.According to the properties of our setup,i and j areassociated with spatial location and Raman emissionwavelength, respectively (cf. fig.5). The image matrix(S,) is related to the spatial profiles of temperature andmole fractions via equations of the form where p is the absolute pressure, R the molar gasconstant, and T; the temperature at a location identifiedby i. Xik denotes the mole fraction of the k" species(k=CO2,O2, CO, N2, CH4, H2O) at i. The pressure wasassumed to be spatially and temporally invariant, whichis certainly realisticforr the conditionsofourexperiment.fu(T) is a function that describes how thespectral emission feature of species k (normalized tomole fraction 1) is converted to ICCD camera readings.This function therefore combines parameters related tomolecularriproperties (temperaturedependenceofRaman cross sections and of spectral emission lineshape) and to features of the experimental setup likepump laser intensity, light collection efficiency of theemployed detection line, and the like. fij,k was found bycalibration procedures, which were supported by amodification of the computer program RAMSES [21]for Raman spectra simulation. Assuming that at every spatial location (index i) the mole fractions of thedetected species sum up to 1, and using eq. (1), a nonlinear equation system isobtained, which can be solved for Tik and xik, thusallowing for the determination of spatial profiles oftemperature and mole fractions from the measuredsignal (S). The Gauss-Newton type solver NLSCON[22] was used to solve the equation system numerically. Results The temperature information from the simultaneousRaman experiments allows the quantification of the LIFsignal, andabsolute OH concentrationscanbecalculated. A sample Raman result is shown in fig. 6.The different measured scalars, temperature and majorspecies mole fractions are plotted. These data can bedirectly compared and correlated to the measured 3Dgradients of OH number densities. The data in fig. 6feature a nice example of the importance of threedimensional information: The raman traces show an Fig.6: Top: Plot of OH number densities (in cm), Middle: simultaneous temperature profile bottom: species mole fractions increase in temperature and a decrease of O2 and CHmole fractions in the unburned zone between 1mm and2mm along the profile. In the very same zone, the OHLIF intensity also increases. From the 1D-informationshown in fig. 6, this behaviour appears rather strange;from the 3D information provided by the crossed-planeOH LIF images, it is clearly seen that a flame frontpartially “touches"the laser-beam from the side, a fact which explains the shape of the 1D-profiles in fig. 6very well. Fig. 7: Absolute values of the 3D gradients in thesource planes evaluated from the individual deri-vatives of the three spatial directions. The whitelines indicate the location of the crossing line. Fig. 7 shows the result of the gradient evaluationfrom the 3D matrix. The visualized planes in picturesare the results from the original source planes. But alsoin the next proximity to the cutting line highly resolvedgradient information isavailable from the matrixvolume. The direct comparison of gradients obtained fromplanar measurements with those evaluated from the 3Ddataset is shown in fig. 8. It shows that the use of2-dimensional information only can be misleading asspatial structures in turbulent flames expand in all 3 Fig. 9: 3D view of OH-LIF intensities in a Bunsenburner flame by means of volume visualization. Thedark zone in the middle is the fresh gas flow. spatial directions. A simple planar observation of theobject does not take this into account. With the available data in the 3D matrix it ispossible by means of volume visualization to calculate aperspective view of the investigated volume. Fig. 9shows a 3D view of a Bunsen burner flame which wasinvestigated in our former experiments. Conclusions We have presented an approach for the simultaneousmeasurement of scalars and concentration gradients in aturbulent, premixed, lean methane/air flame. Besidetemperature and species concentrations, magnitude anddirection of spatial gradients of the hydroxyl-radicalconcentration was measured in three dimensions. Themeasured data provide a large database of simultaneousmulti-scalar and gradient information along a line indifferent regions of the flame. The statistical evaluationof these data is in progress; the results will aid insolving certain problems of turbulent reactive flows,like the closure problem of transport terms in pdf-models. Fig. 8: Comparison of 2D gradients in the crossedplanes with the gradient evaluated from the 3D dataset. Acknowledgements The financial support by the Deutsche Forschungs-gemeinschaft is gratefully acknowledged. Thanks arealso due toiothleeKonrad-Zuse Institut firInformationstechnik, Berlin, for providing the public-domain equation solver NLSCON. References Pope, S. B. "Computation of turbulentCombustion: Progress and Challenges,"inProceedings of the Combustion Institute 24(University of Sydney, Australia, 1990), 591. 2. Borghi, R., Progress in Energy and ( Combustion Science 14:245-292(1988). ) 3. Peters, N. "Laminar Flamelet Concepts inTurbulent Combustion," in Proceedings oftheCombustion Institute 21 (Munich, Germany,1986),1231-1250. 4. Reynolds, W. C., "The potential and limitationsof direct and large eddy simulation," inWhither Turbulence? Turbulence at the cross-roads, Lecture Notes in Physics (Springer,New York, 1989), p.313. 5. Paul, P. H. and Najm, H. N."Planar LaserInduced Fluorescence Imaging of flame heatrelease rate," in Proceedings of the CombustionInstitute 27 (Boulder,CO, 1998), 43-50. 6. Cabra, R., Myhrvold,T., Chen, J. Y., Dibble,R. W., Karpetis, A. N., and Barlow, R. S."Simultaneous Laser Raman-Rayleigh-LIFMeasurements and Numerical ModelingResults of a Lifted Turbulent H2/N2 Jet Flamein a Vitiated Coflow," in Proceedings of theCombustion Institute 29 (Hokkaido University,Sapporo, Japan, 2002), 1881-1888. 7. Kalt, P. A. M.,Al-Abdeli, Y. M., Masri, A. R.,and Barlow, R. S. "Swirling Turbulent Non-Premixed Flames of Methane, Flow Field andCompositional Structure," in Proceedings ofthe Combustion Institute 29 (HokkaidoUniversity, Sapporo, Japan, 2002),1913-1919. 8. Thevenin, D., Gicquel, O., De Charentenay,J.,Hilbert, R., and Veynante, D. "Two- versusthree- dimensional direct simulations, ofturbulent methane flame kernels using realisticchemistry," in Proceedings ofthe CombustionInstitute 29 (Hokkaido University, Sapporo,Japan, 2002), 2031-2039. 9. . Warnatz, J., Maas, U., and Dibble, R. W..Combustion, 3rd ed (Springer,2002). 10. Yip, B., Fourguette, D. C., and Long,M. B.,Applied Optics 25:3919-3923 (1986). 11. Landenfeld,T., A., Kremer, Hassel, E. P.Janicka, J., Schafer, T., Kazenwadel,J.,Schulz, C., and Wolfrum, J., Proc. Combust.Inst.27:1023-1030(1998). 12. Nygren, J., Hult, J., Richter, M., Alden, M.,Christensen, M., Hultqvist, A., and Johansson,B. "Three-dimensional laser inducedfluorescence of fuel distributions in an HCCIengine," in Proceedings ofthe CombustionInstitute 29 (Hokkaido University, Sapporo,Japan,2002),679-685. 13. Frank, J. H., Lyons, K. M., and Long, M. B.,Optics Letters 16:958-960 (1991). 14. Knaus, D. A., Gouldin, F. C., Hinze, P. C., andMiles, P. C., SAE Technical Paper Series No.1999-01-3543 (1999). 15. Knaus, D. A. and Gouldin, F. C."Measurementof flamelet orientations in premixed flameswith positive and negative Marksteinnumbers," in Proceedings of the CombustionInstitute 28 (Edinburgh, Scotland, 2000), 367-373. 16. Sattler, S. S., Gouldin, F. C., and Boertlein, N.T."Combined crossed-plane imaging andstereo-particle image velocimetry," in ThirdJoint Meeting ofthe U.S. Sections oftheCombustion Institute (Chicago, IL,2003). 17. Knaus,D. A., Gouldin, F. C., and Bingham, D.C., Combustion Science and Technology174:101-134 (2002). 18. Hoffmann, A., Zimmermann, F., and Schulz,C. "Instantaneous three-dimensionalvisualization of concentration distributions inturbulent flows with a single laser," in FirstInternational Conference on Optical and LaserDiagnostics (City University,London, UK,2002), in press. 19. Karpetis, A. N. and Barlow, R. S."Measurements of flame orientation and scalardissipation in turbulent hydrocarbon flames,"in Third Joint Meeting ofthe U.S. Sections ofthe Combustion Institute (Chicago, IL,2003). 20. Bender, R., Steiner, B., Schmidt,D., SchieBl,R., Dreier, T., and Maas, U. "ExperimentelleUntersuchung und pdf-Simulation turbulenterVormischflammen," in 16. TECFLAM Seminar(2002),43-61. 21. Hassel, E. and et al., Applied Optics 32 (1994). ( 22. Nowak, U. and Weimann, L., "A Family ofNewton Codes for Systems of highly nonlinearequations-Algorithm, Implementation,Application". ZIB T echnical Report TR 90-10 ( 1 990). )
确定
还剩4页未读,是否继续阅读?

产品配置单


北京欧兰科技发展有限公司为您提供《燃烧,火焰中浓度,羟基,OH,温度,痕量成分,富含成分检测方案(流量计)》,该方案主要用于其他中浓度,羟基,OH,温度,痕量成分,富含成分检测,参考标准--,《燃烧,火焰中浓度,羟基,OH,温度,痕量成分,富含成分检测方案(流量计)》用到的仪器有PLIF平面激光诱导荧光火焰燃烧检测系统、德国LaVision PIV/PLIF粒子成像测速场仪、Imager sCMOS PIV相机
推荐专场


相关方案
更多
该厂商其他方案
更多