


方案详情
文
When air is blown from a slot directly upstream of a flap, the flow over the flap can bear large adverse
pressure gradients without separation. This effect is used to design high-lift airfoils with low momentum
coefficients of blowing. For experimental assessment of these airfoils a rectangular wing with an aspect
ratio of 4.3 was built. The flow around the model in a low speed wind tunnel is analysed using pressure
measurements and long distance microscopic particle image velocimetry. To measure the velocity in the
vicinity of the slot and next to the surface of the flap the jet is seeded with particles. For Reynolds
numbers of about Re = 1 · 106 the dimensionless momentum coefficient of the jet and the angle of attack
of the airfoil are varied. Numerical simulations of the three-dimensional flow around the circulation
control airfoil in the wind tunnel are compared to the experimental data. Good agreement is observed
in terms of pressure distributions and velocity profiles.
方案详情

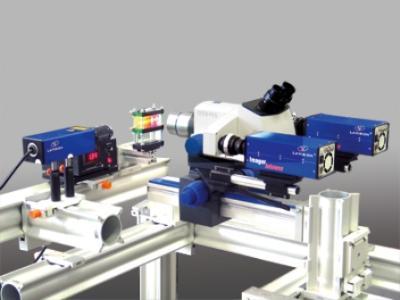
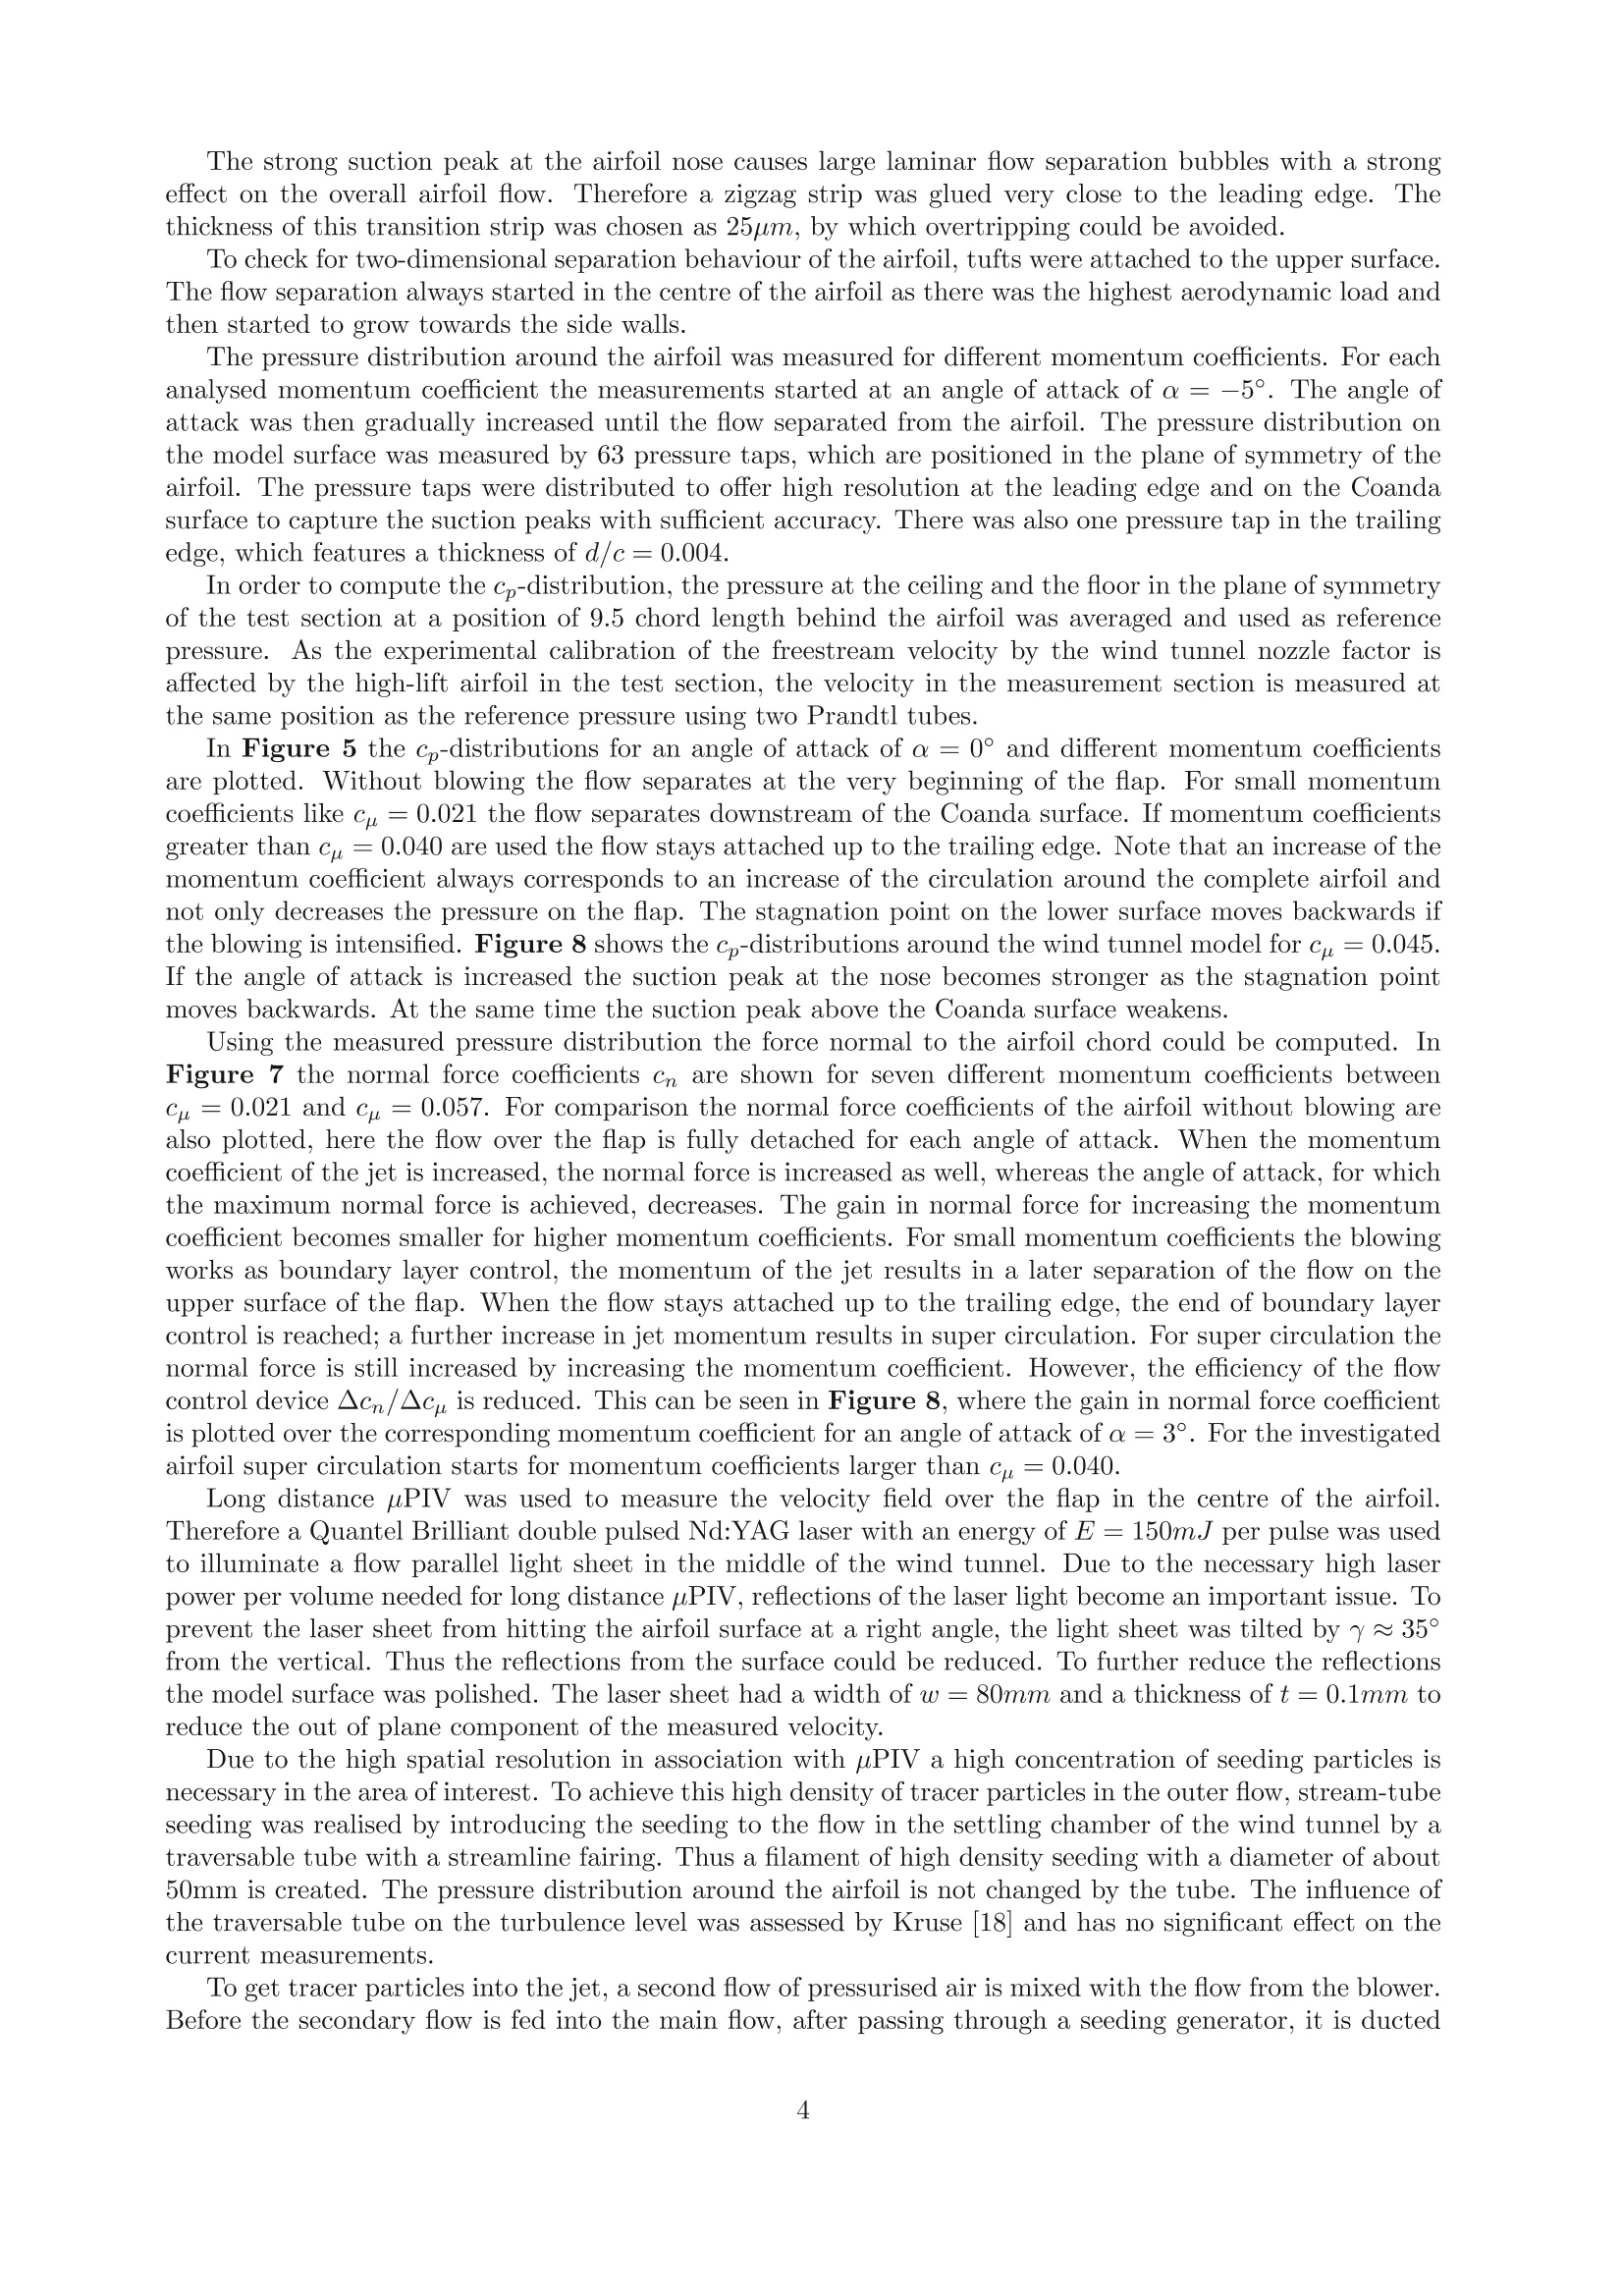
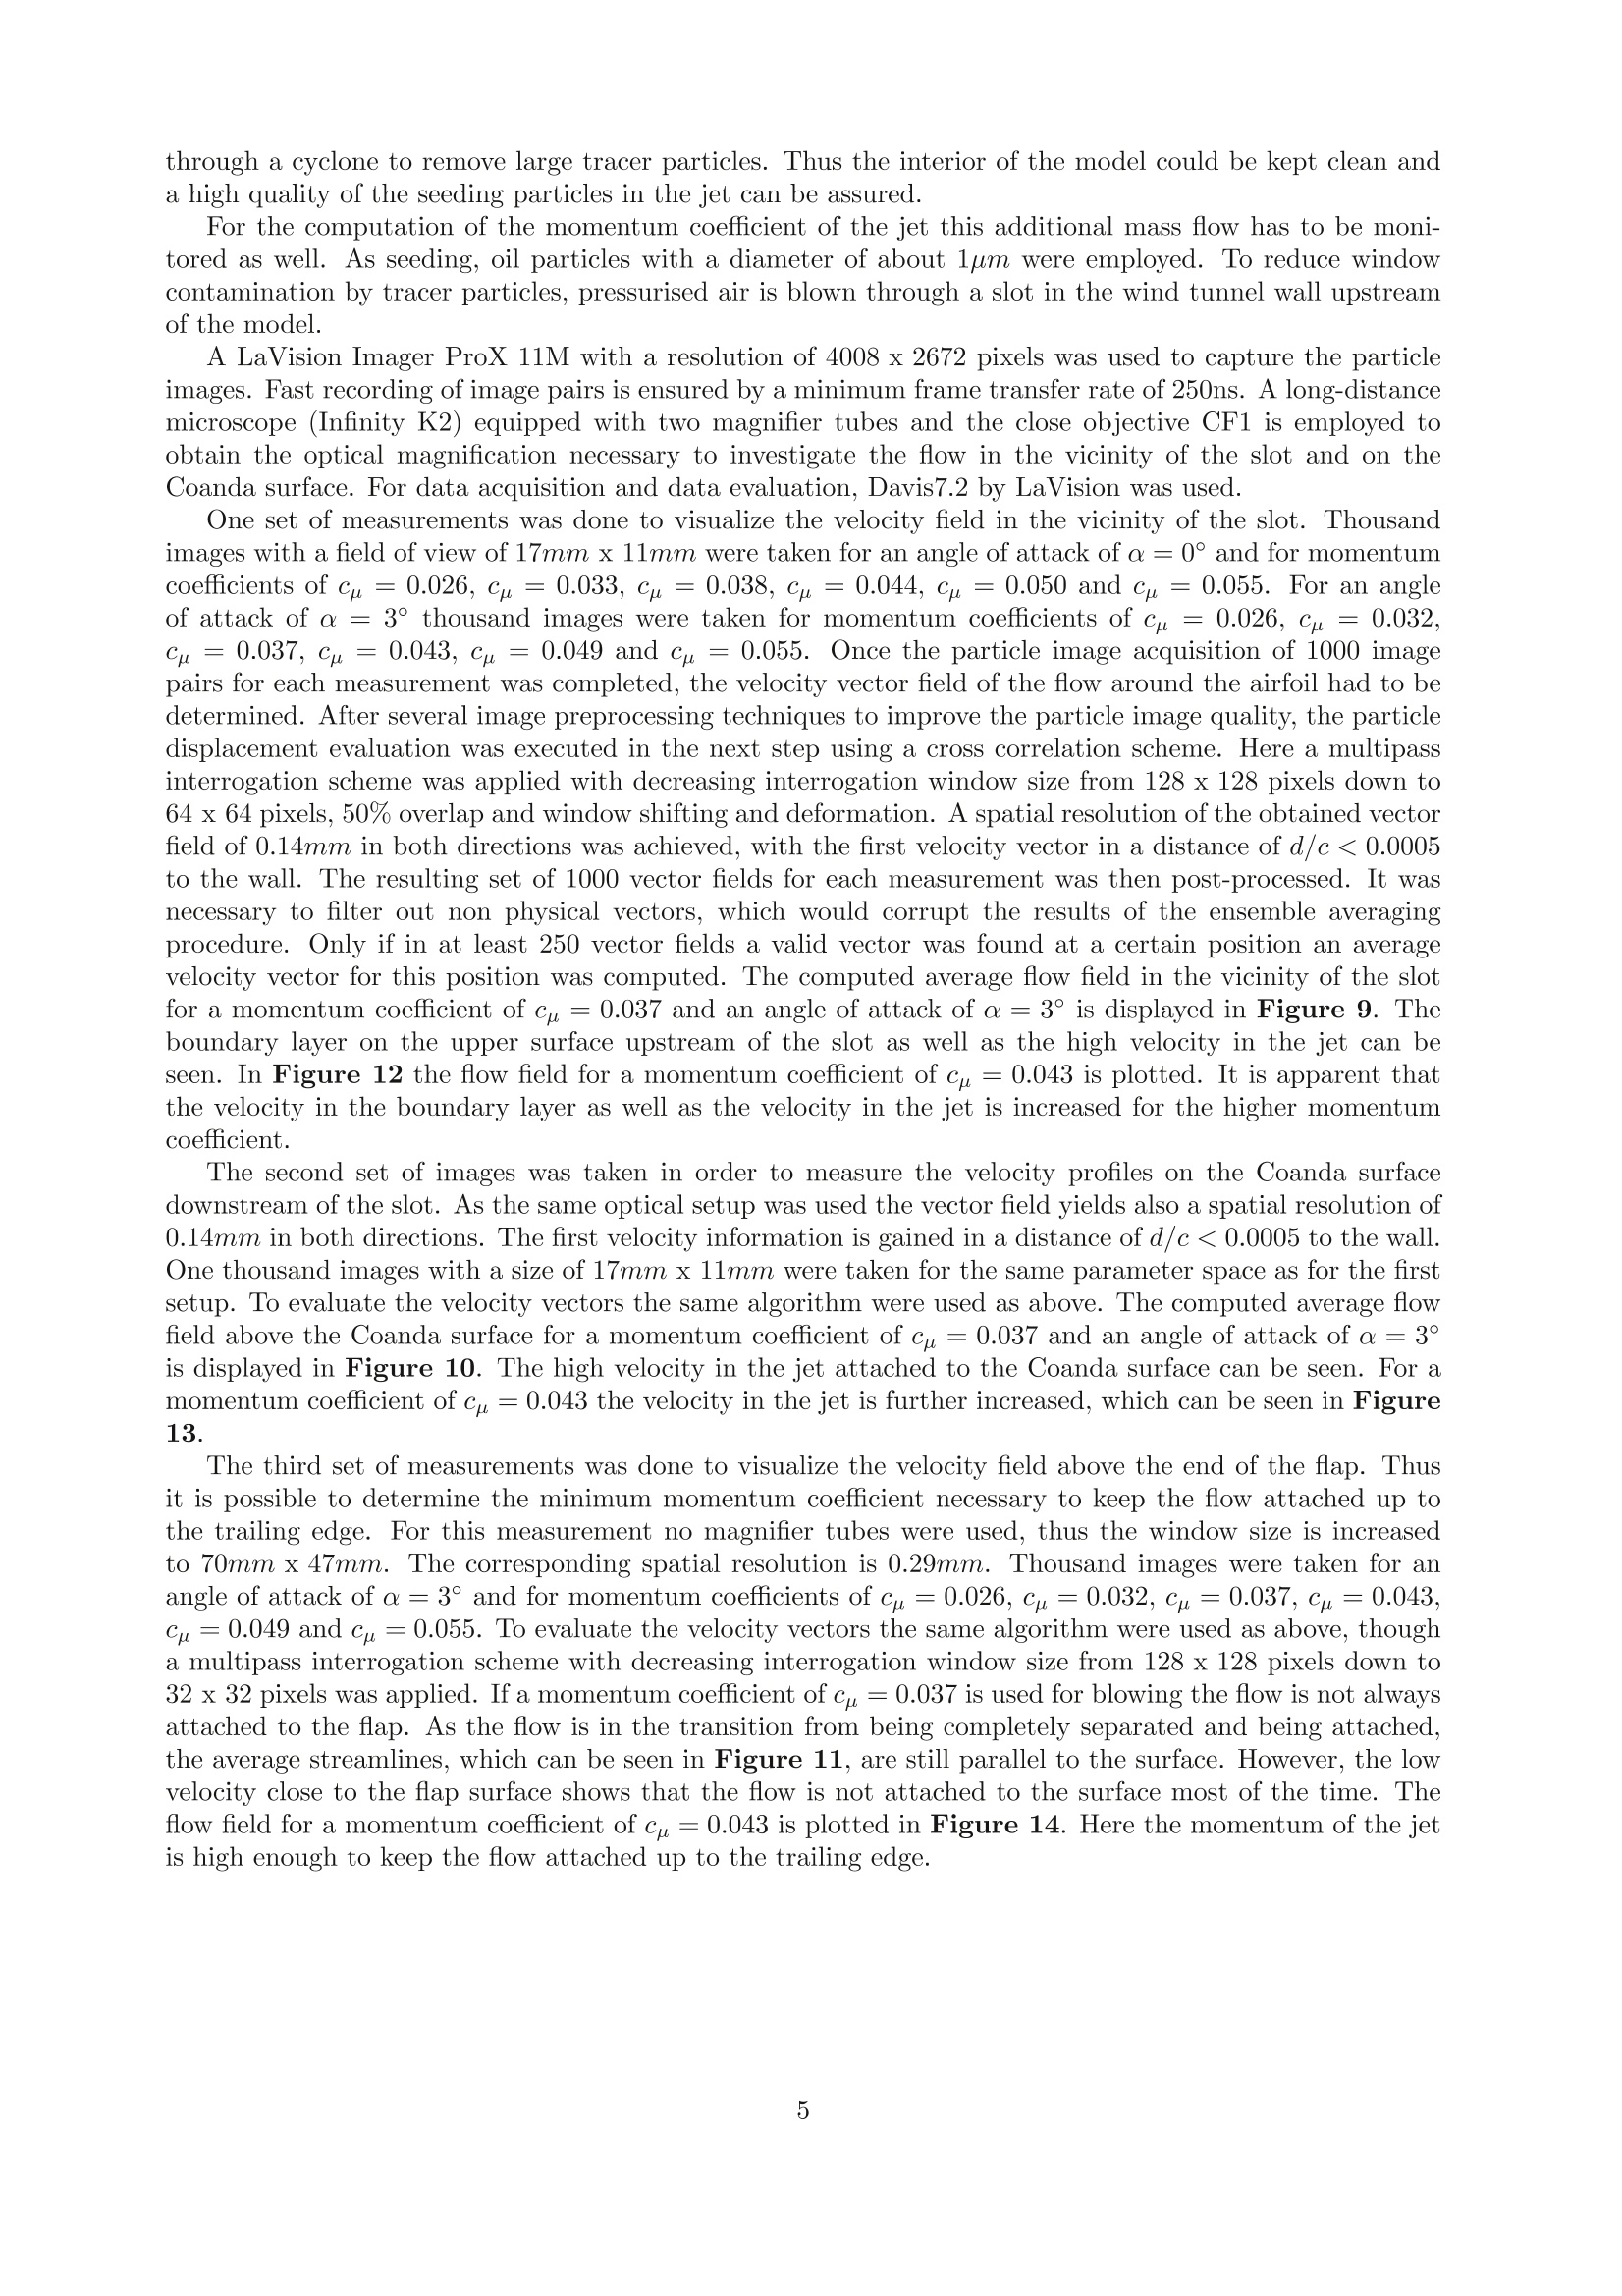
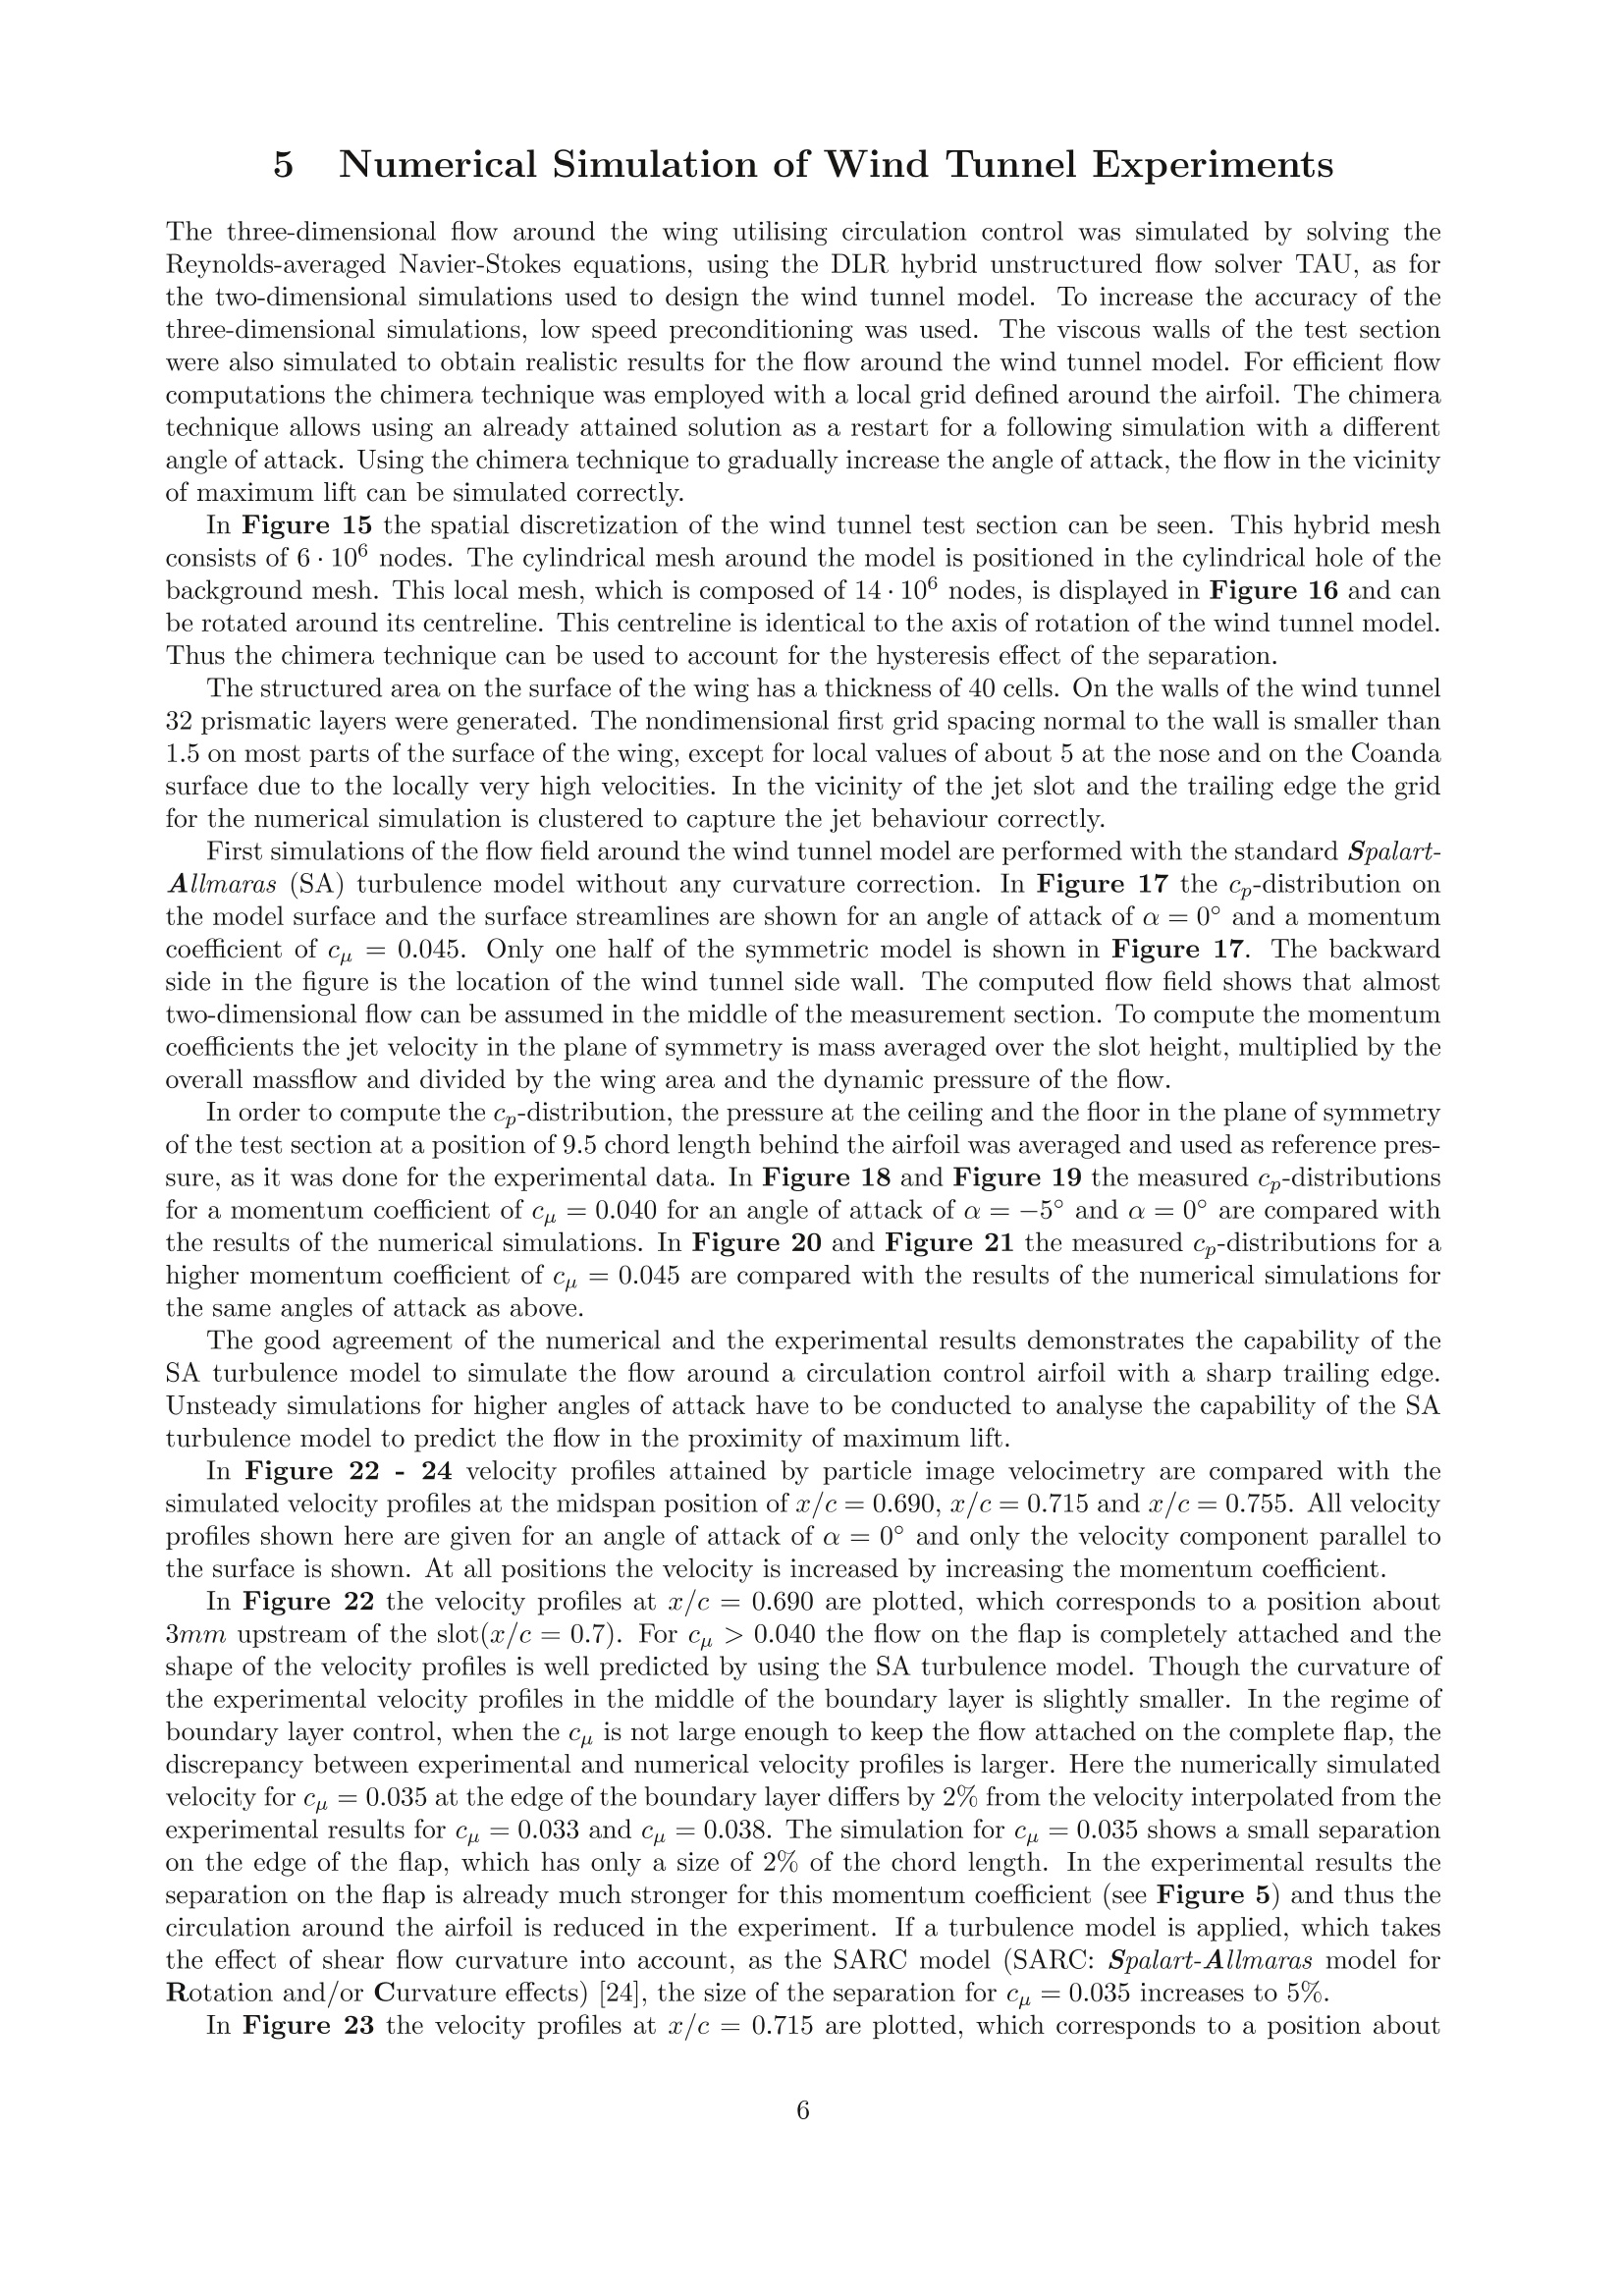
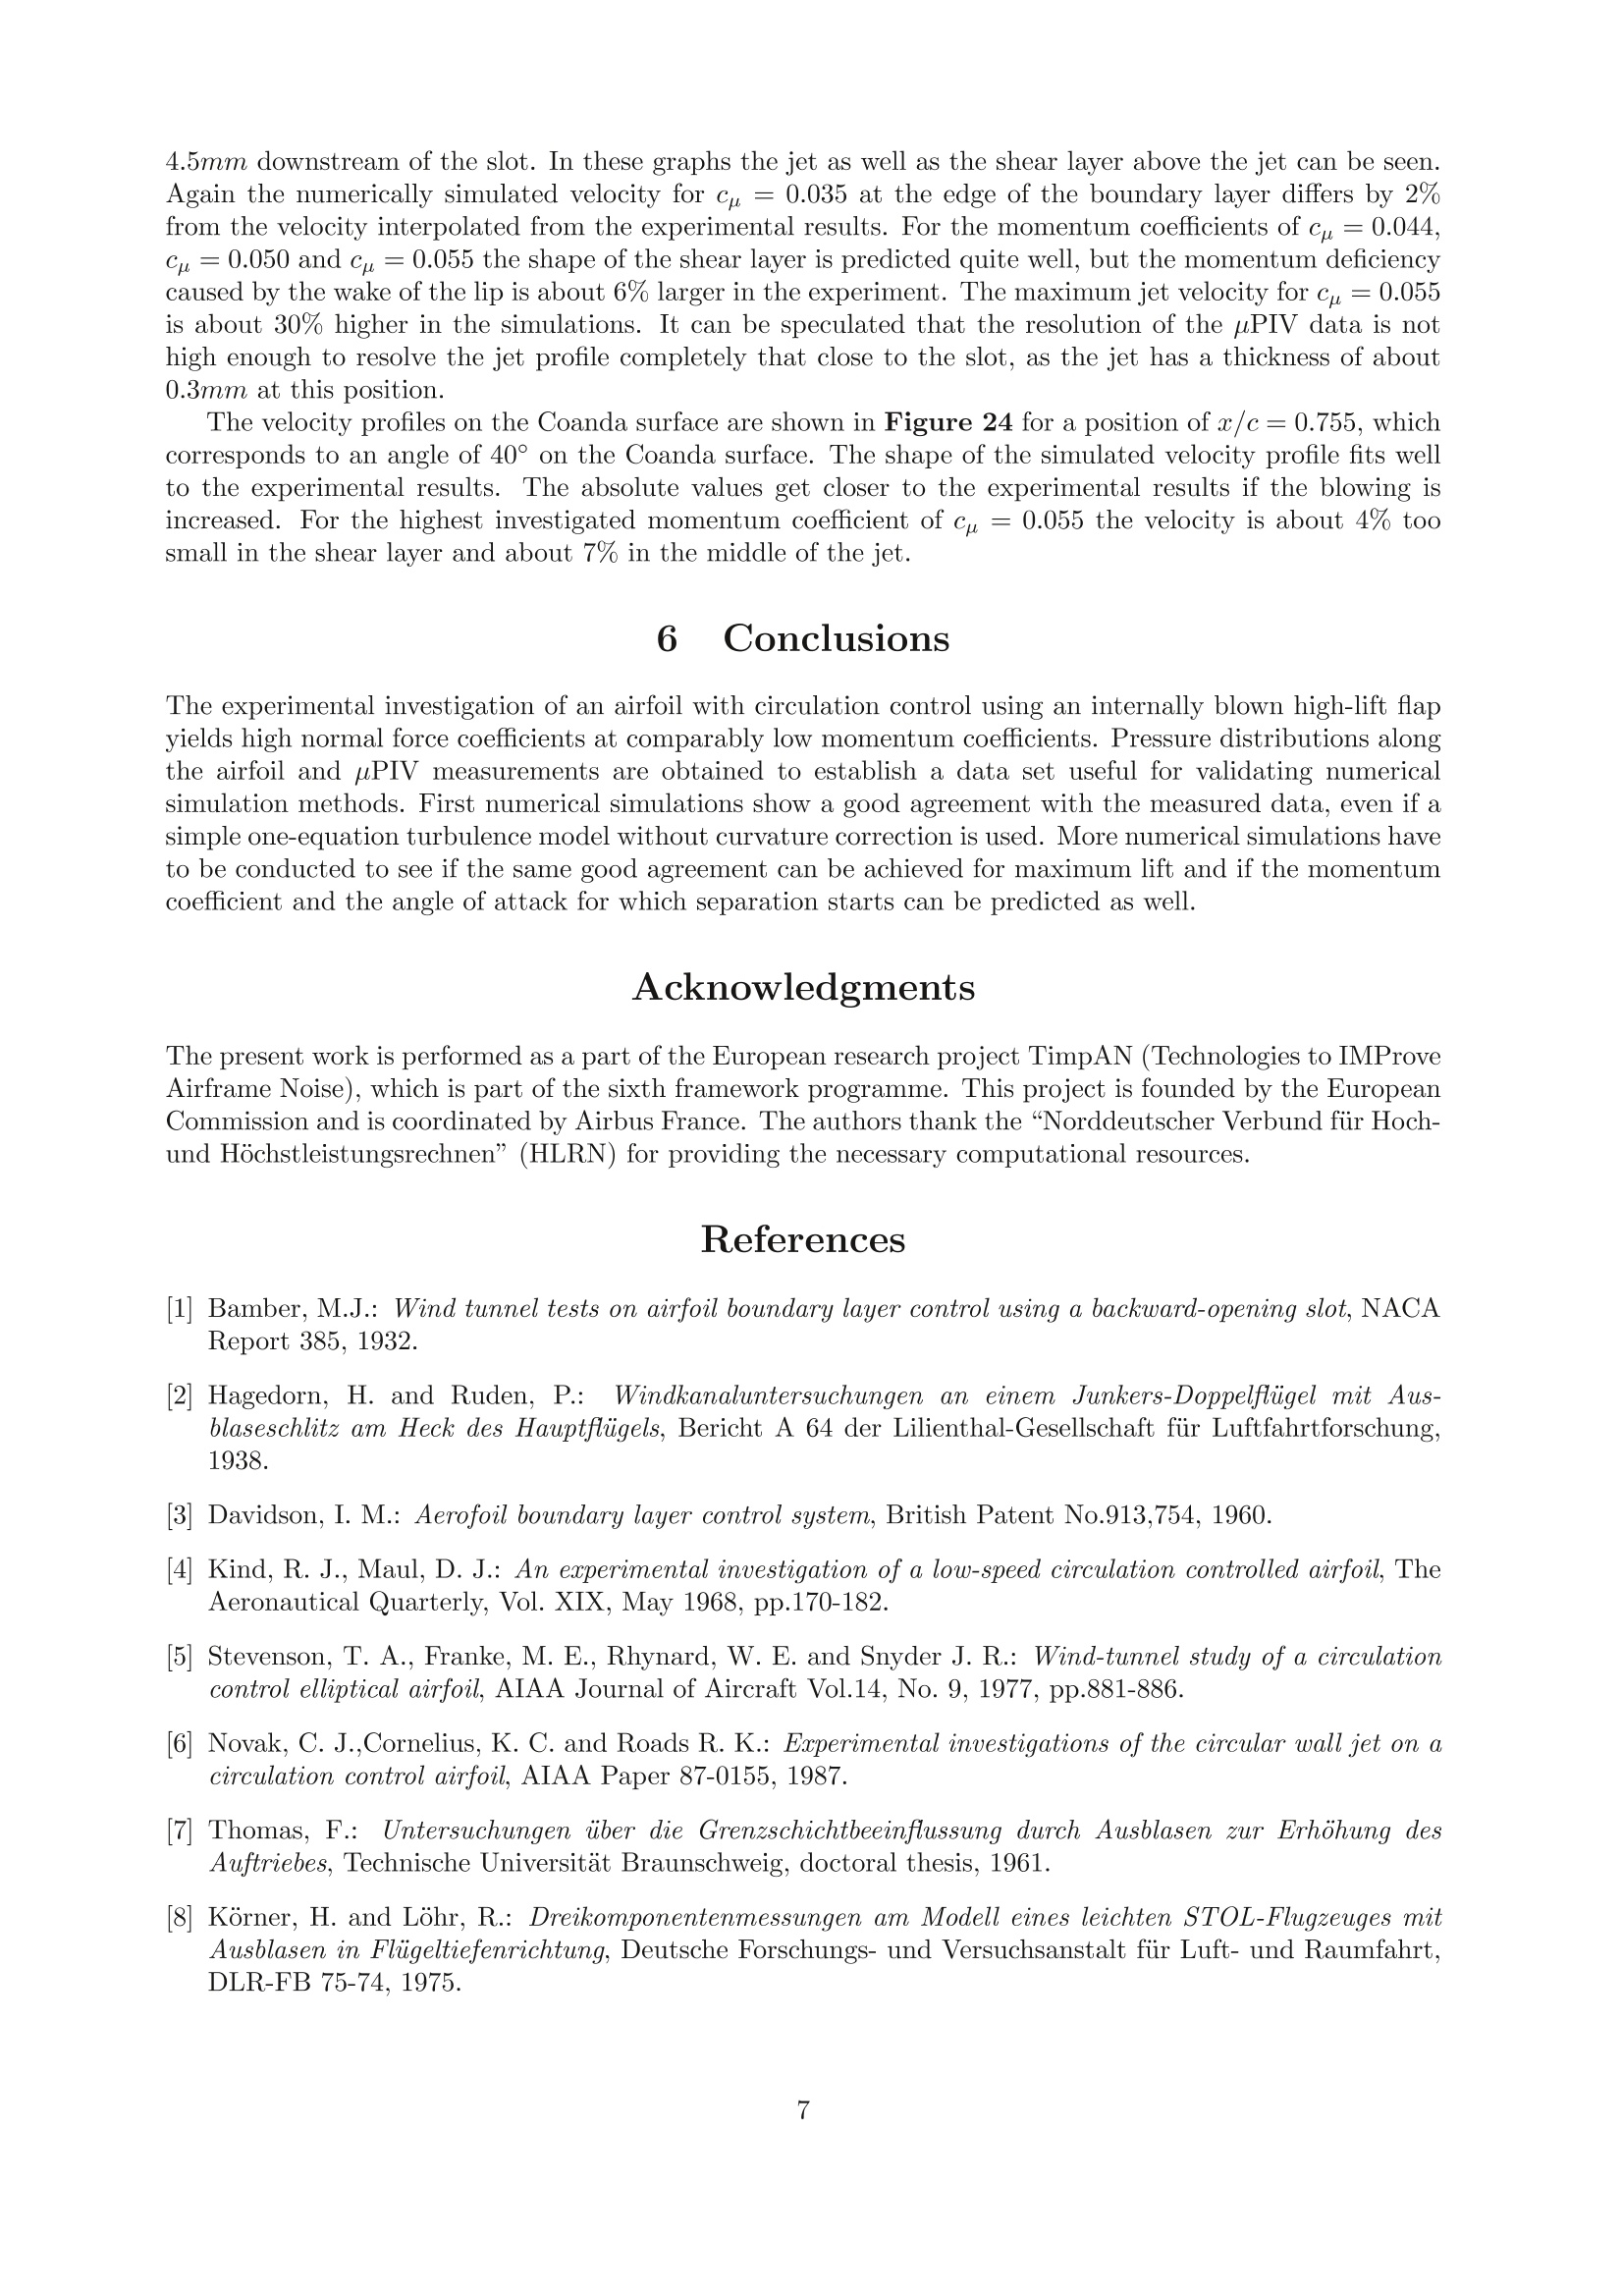
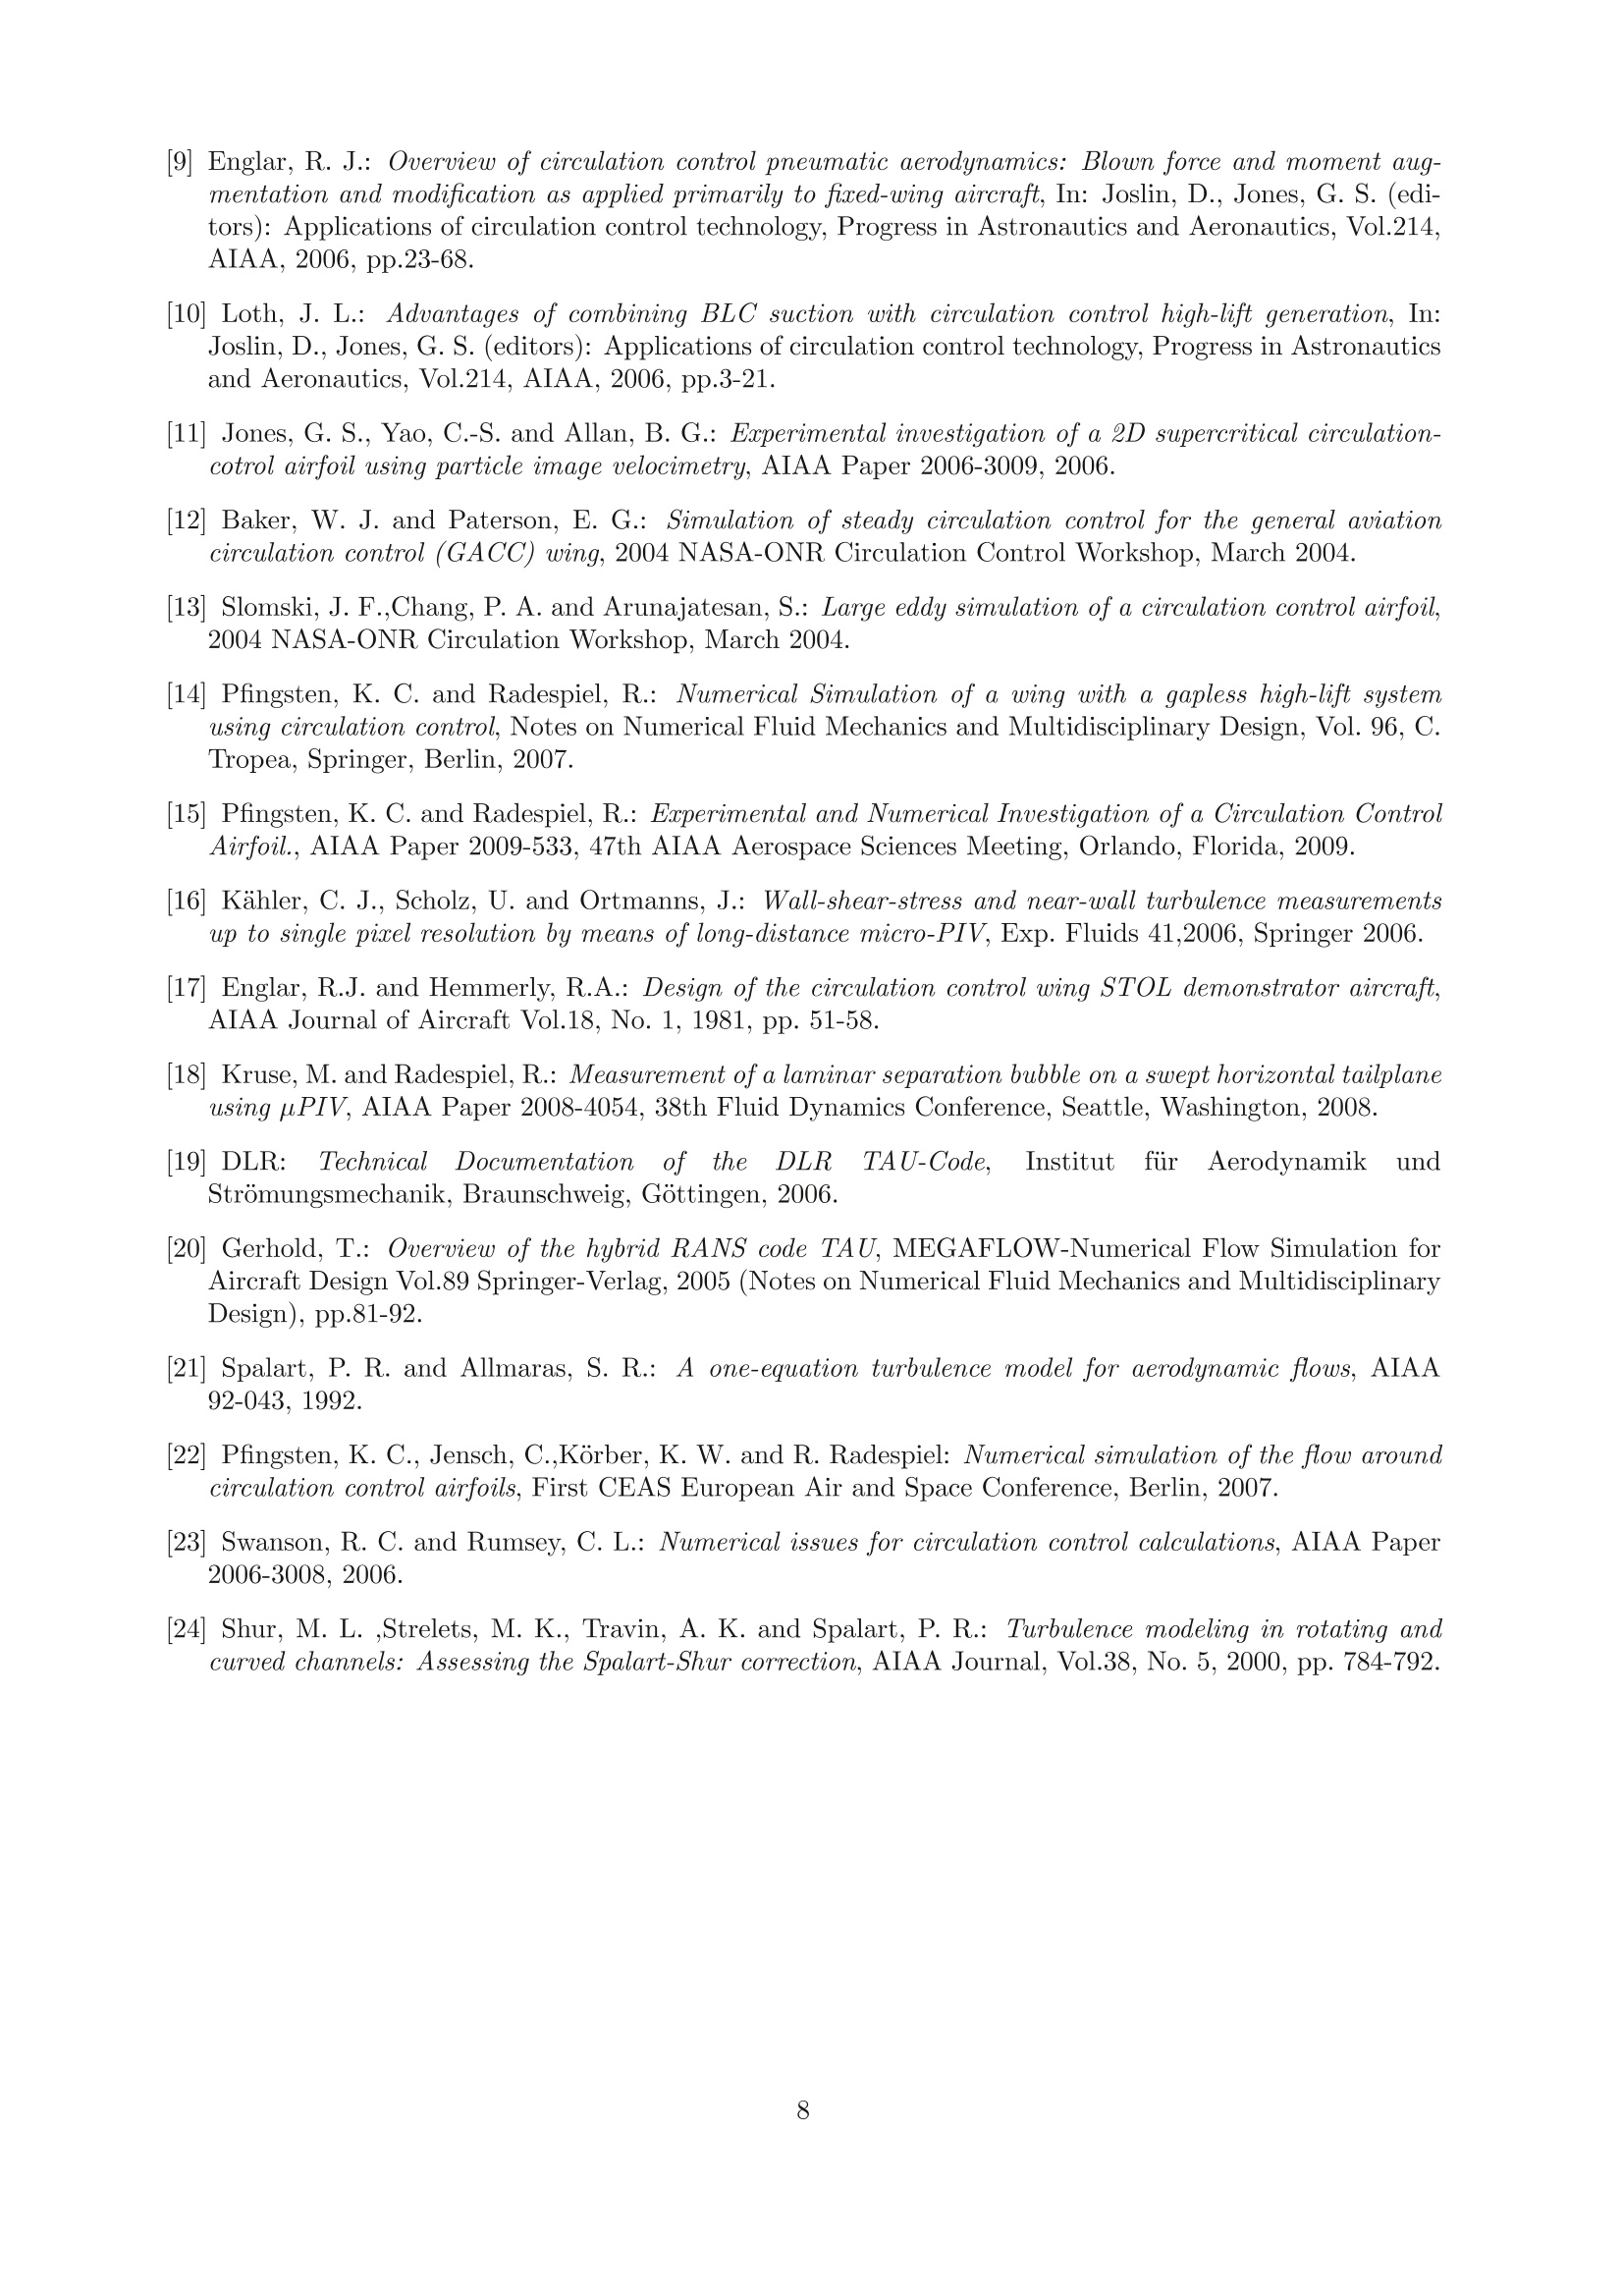
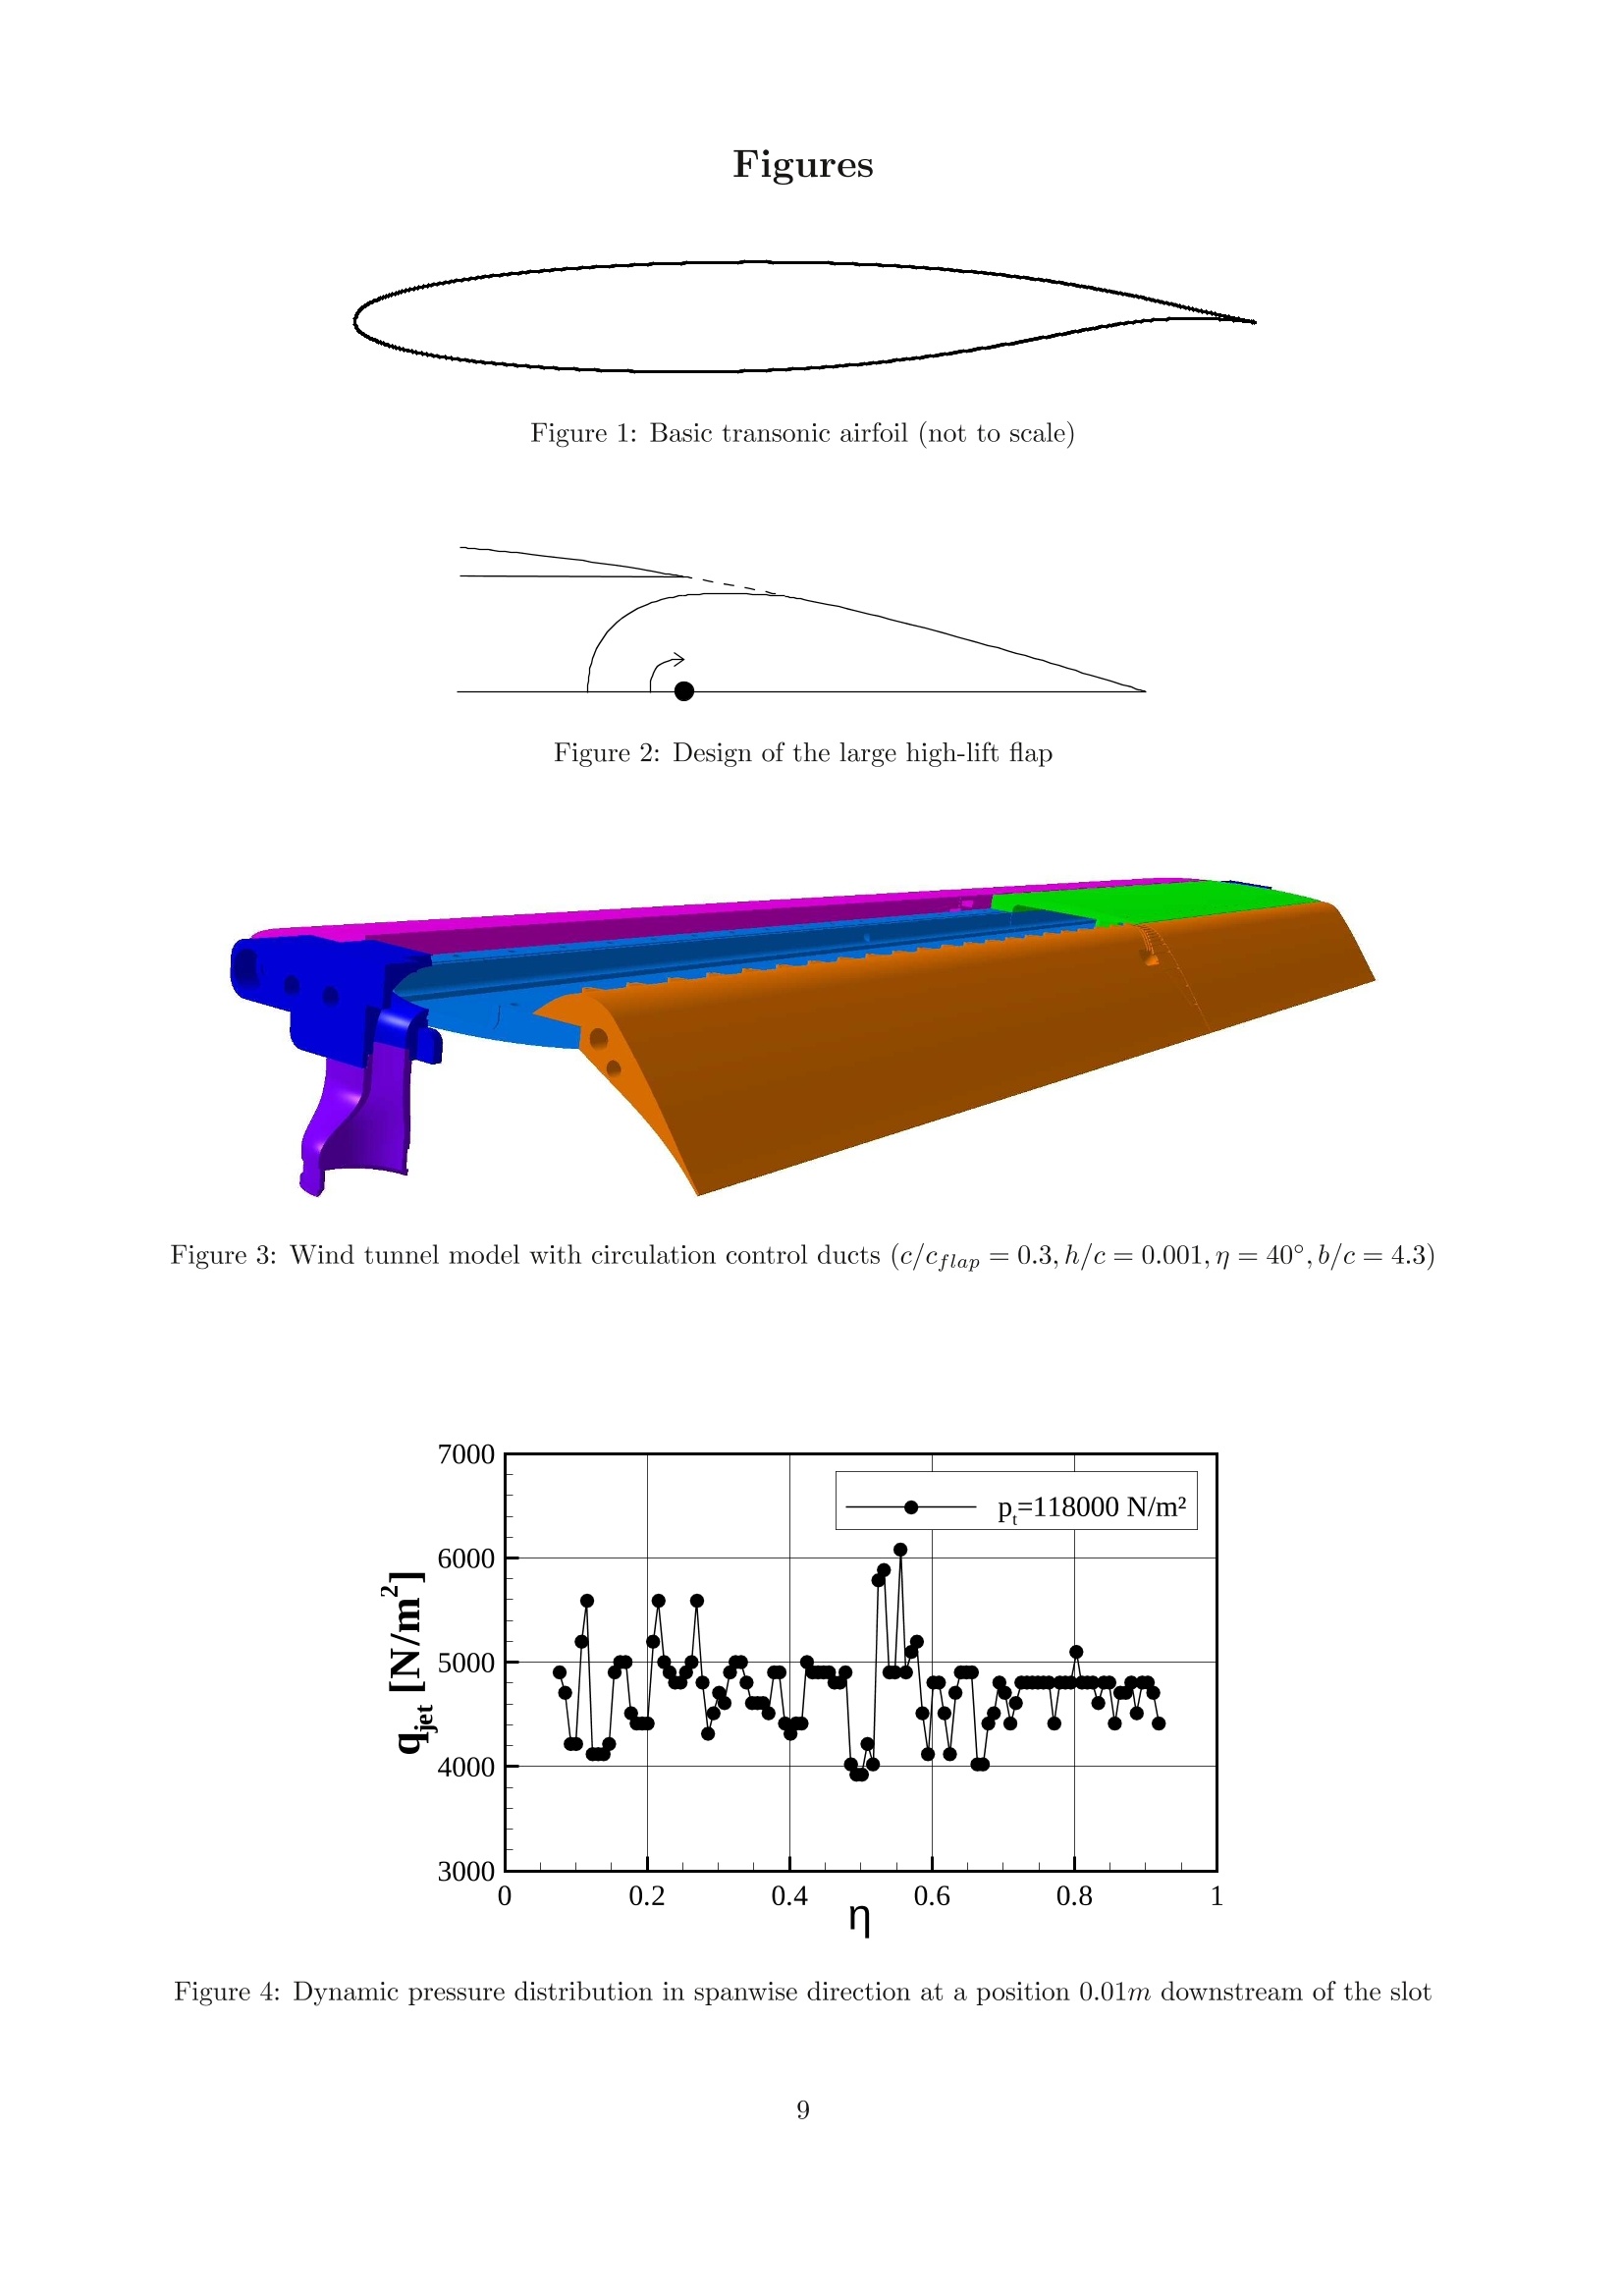
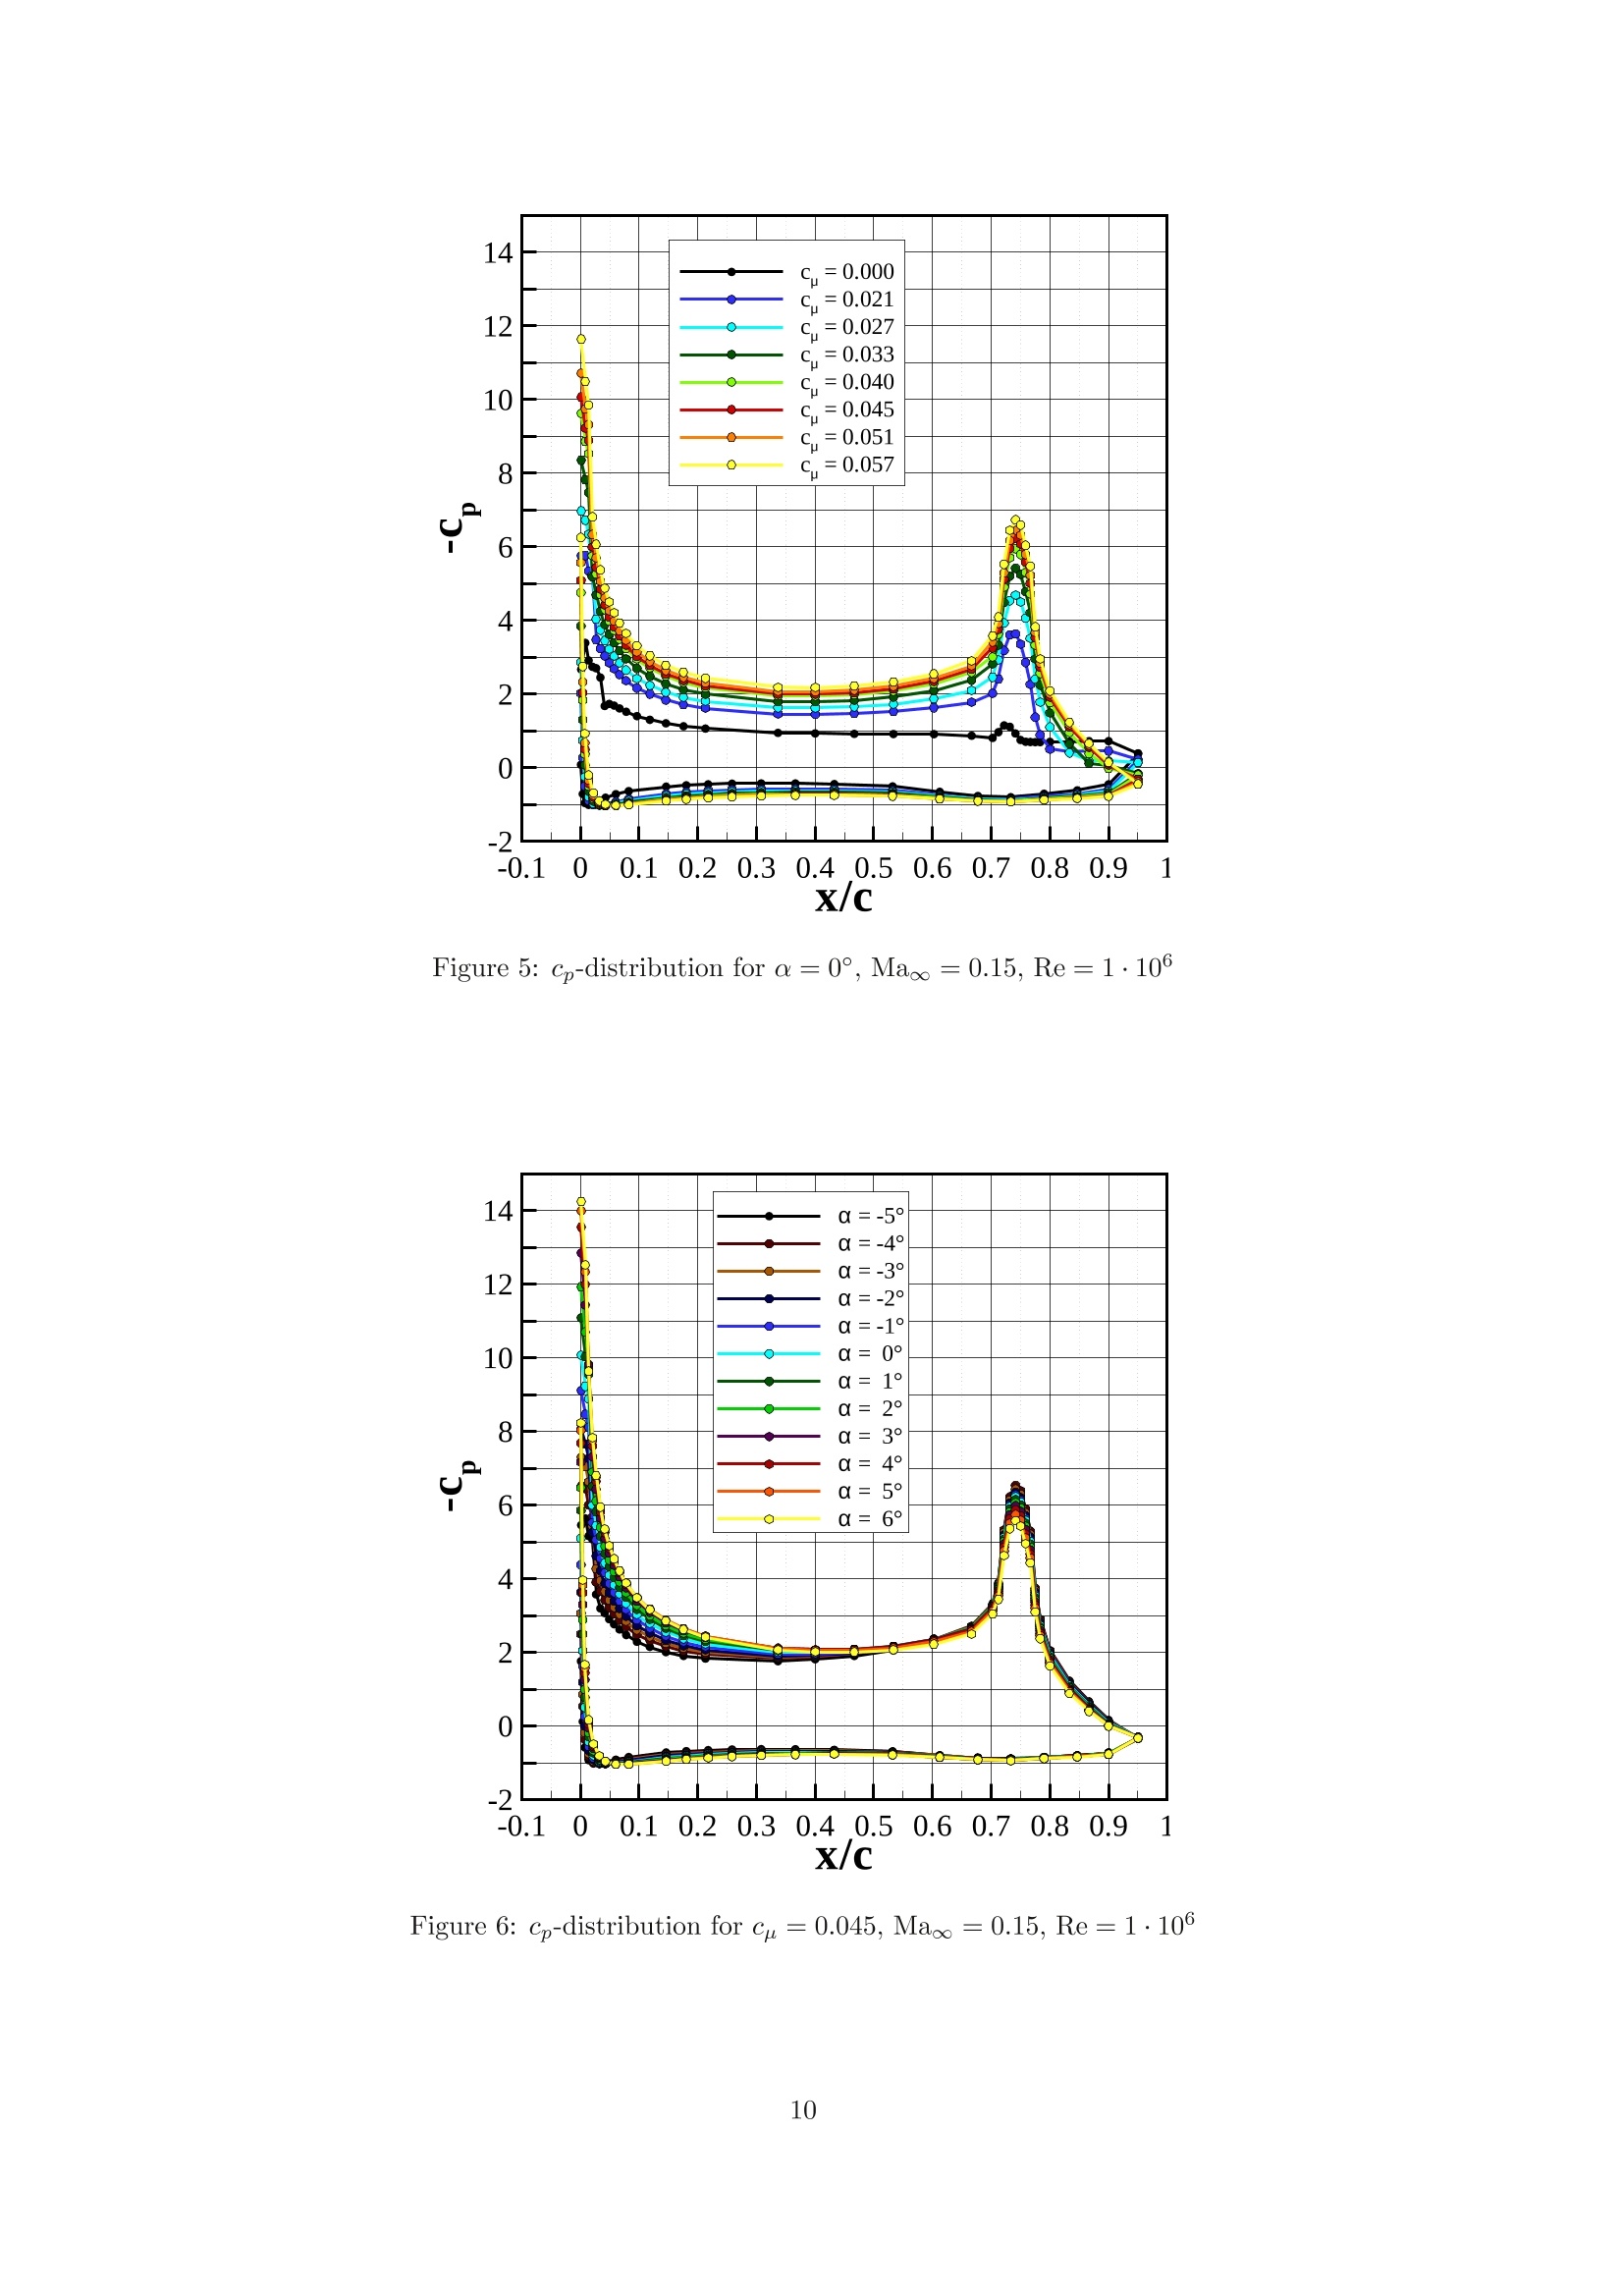
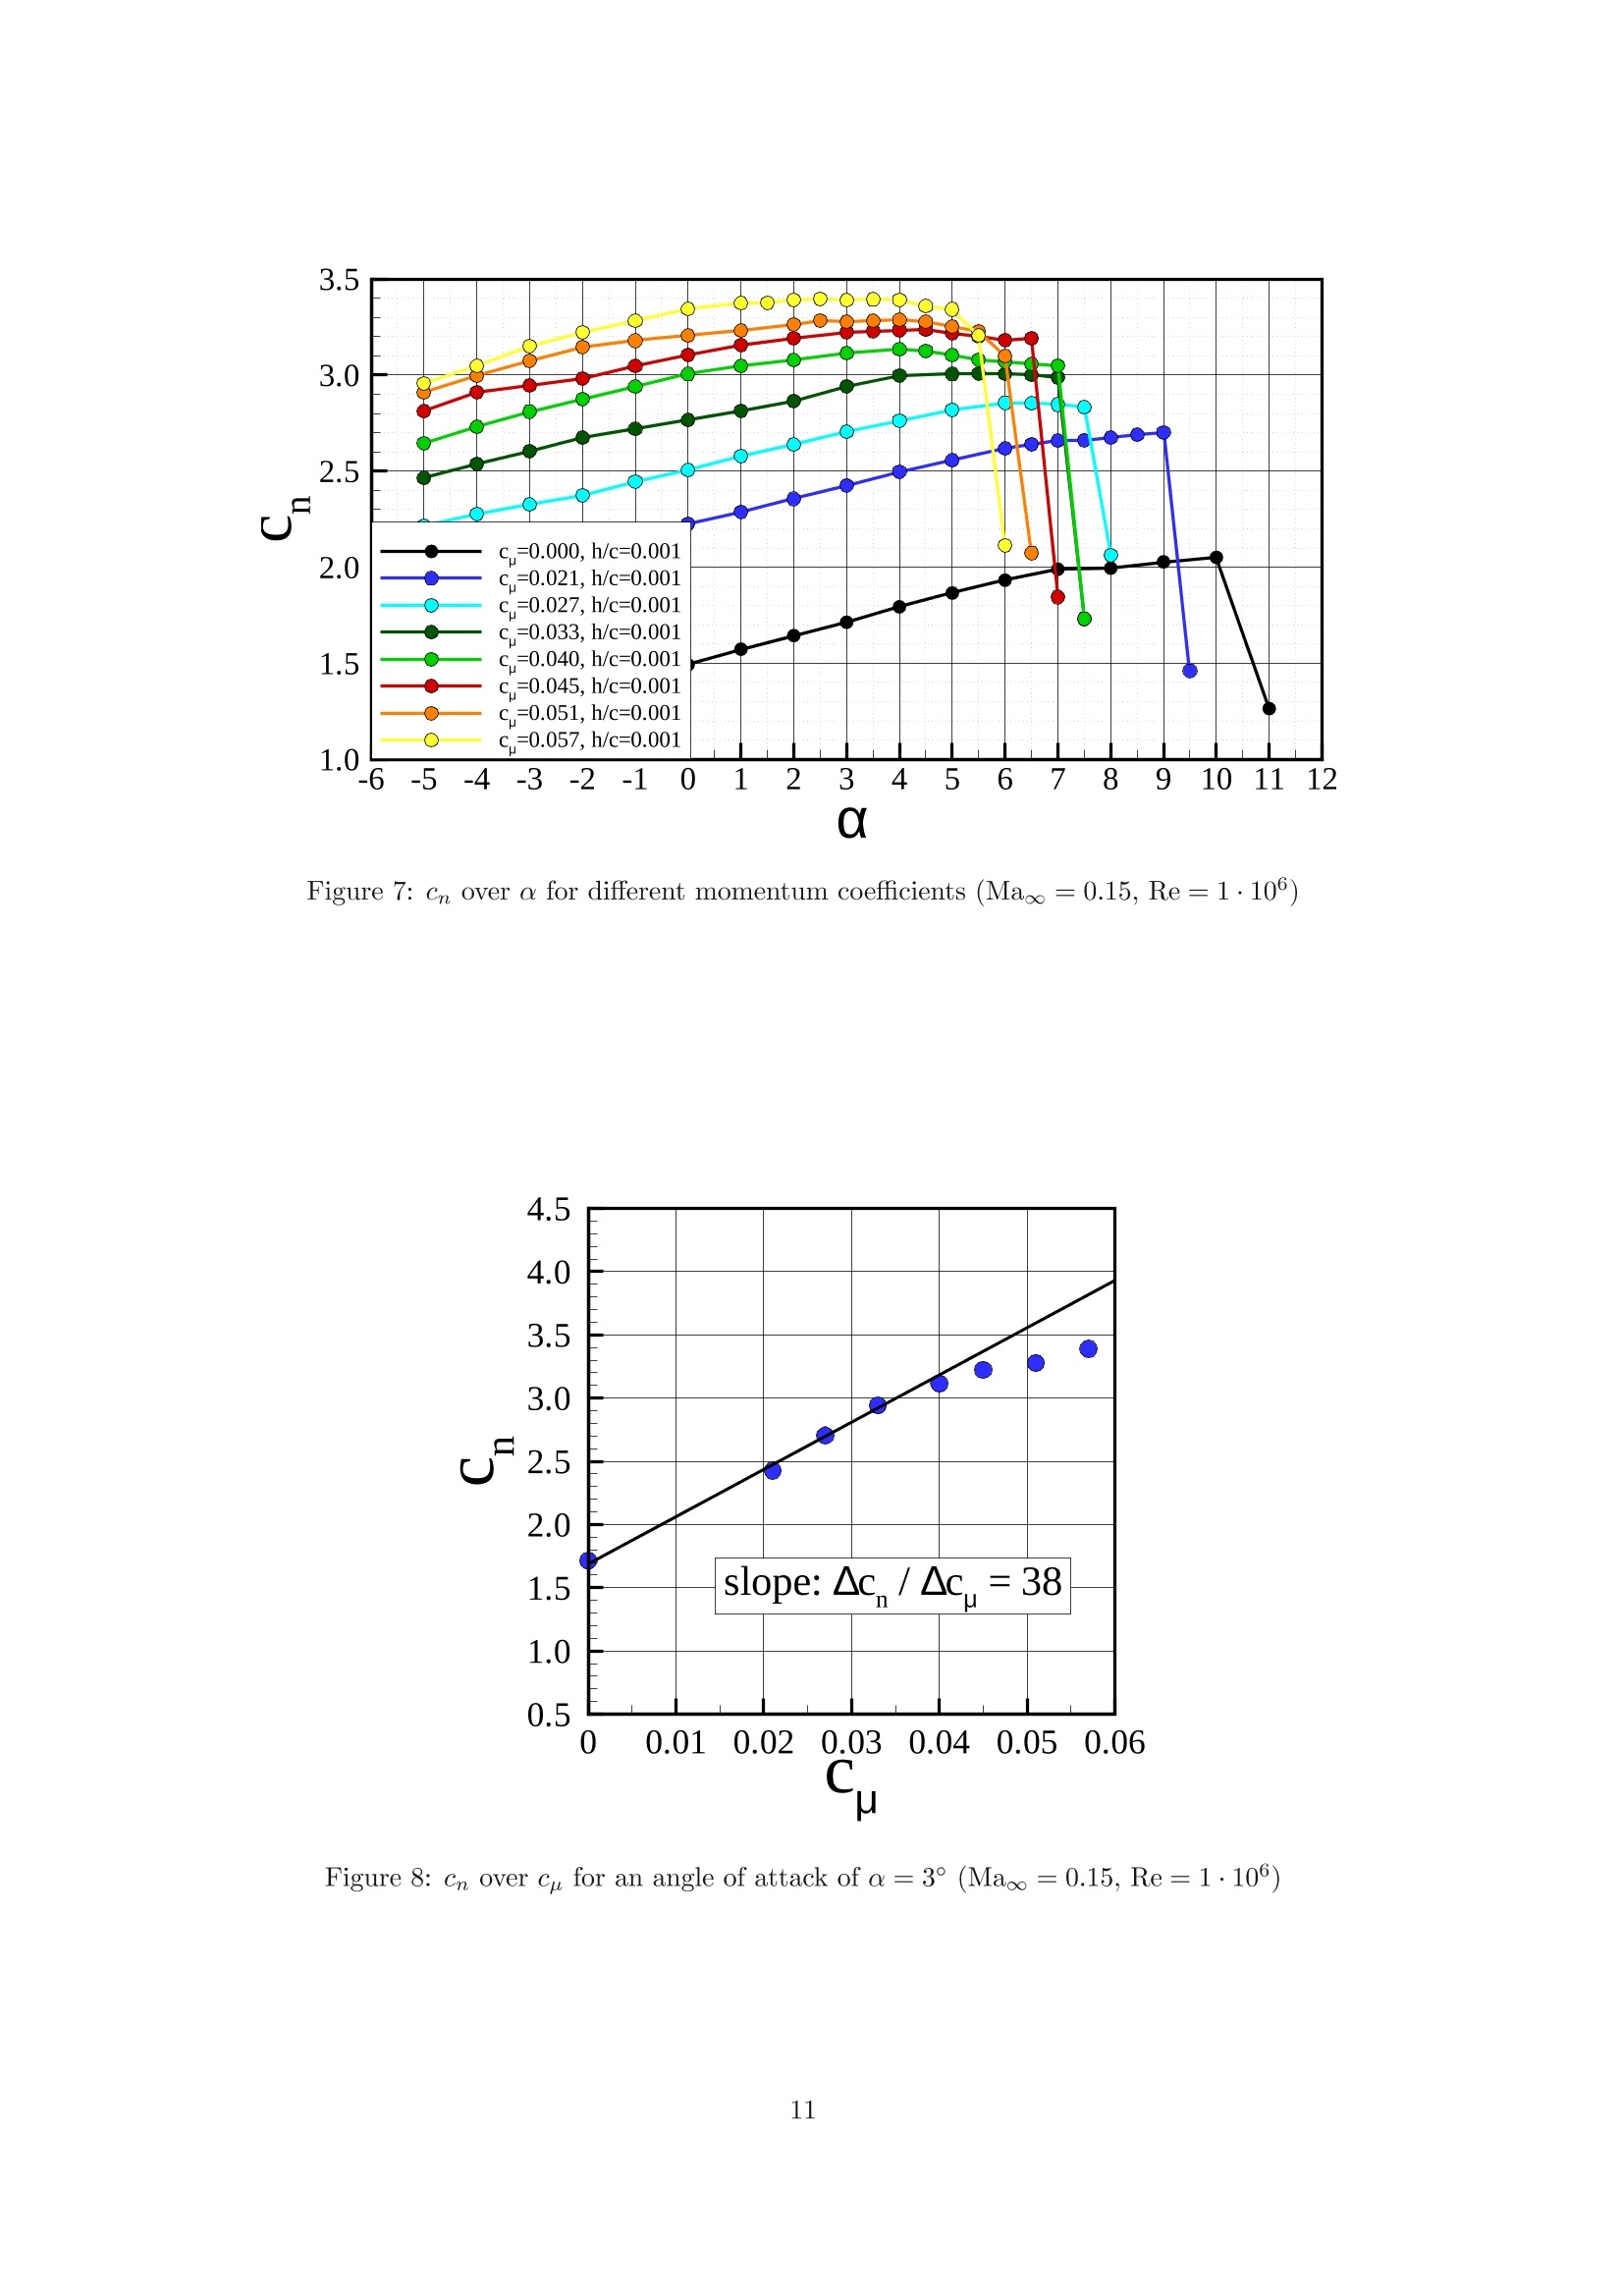
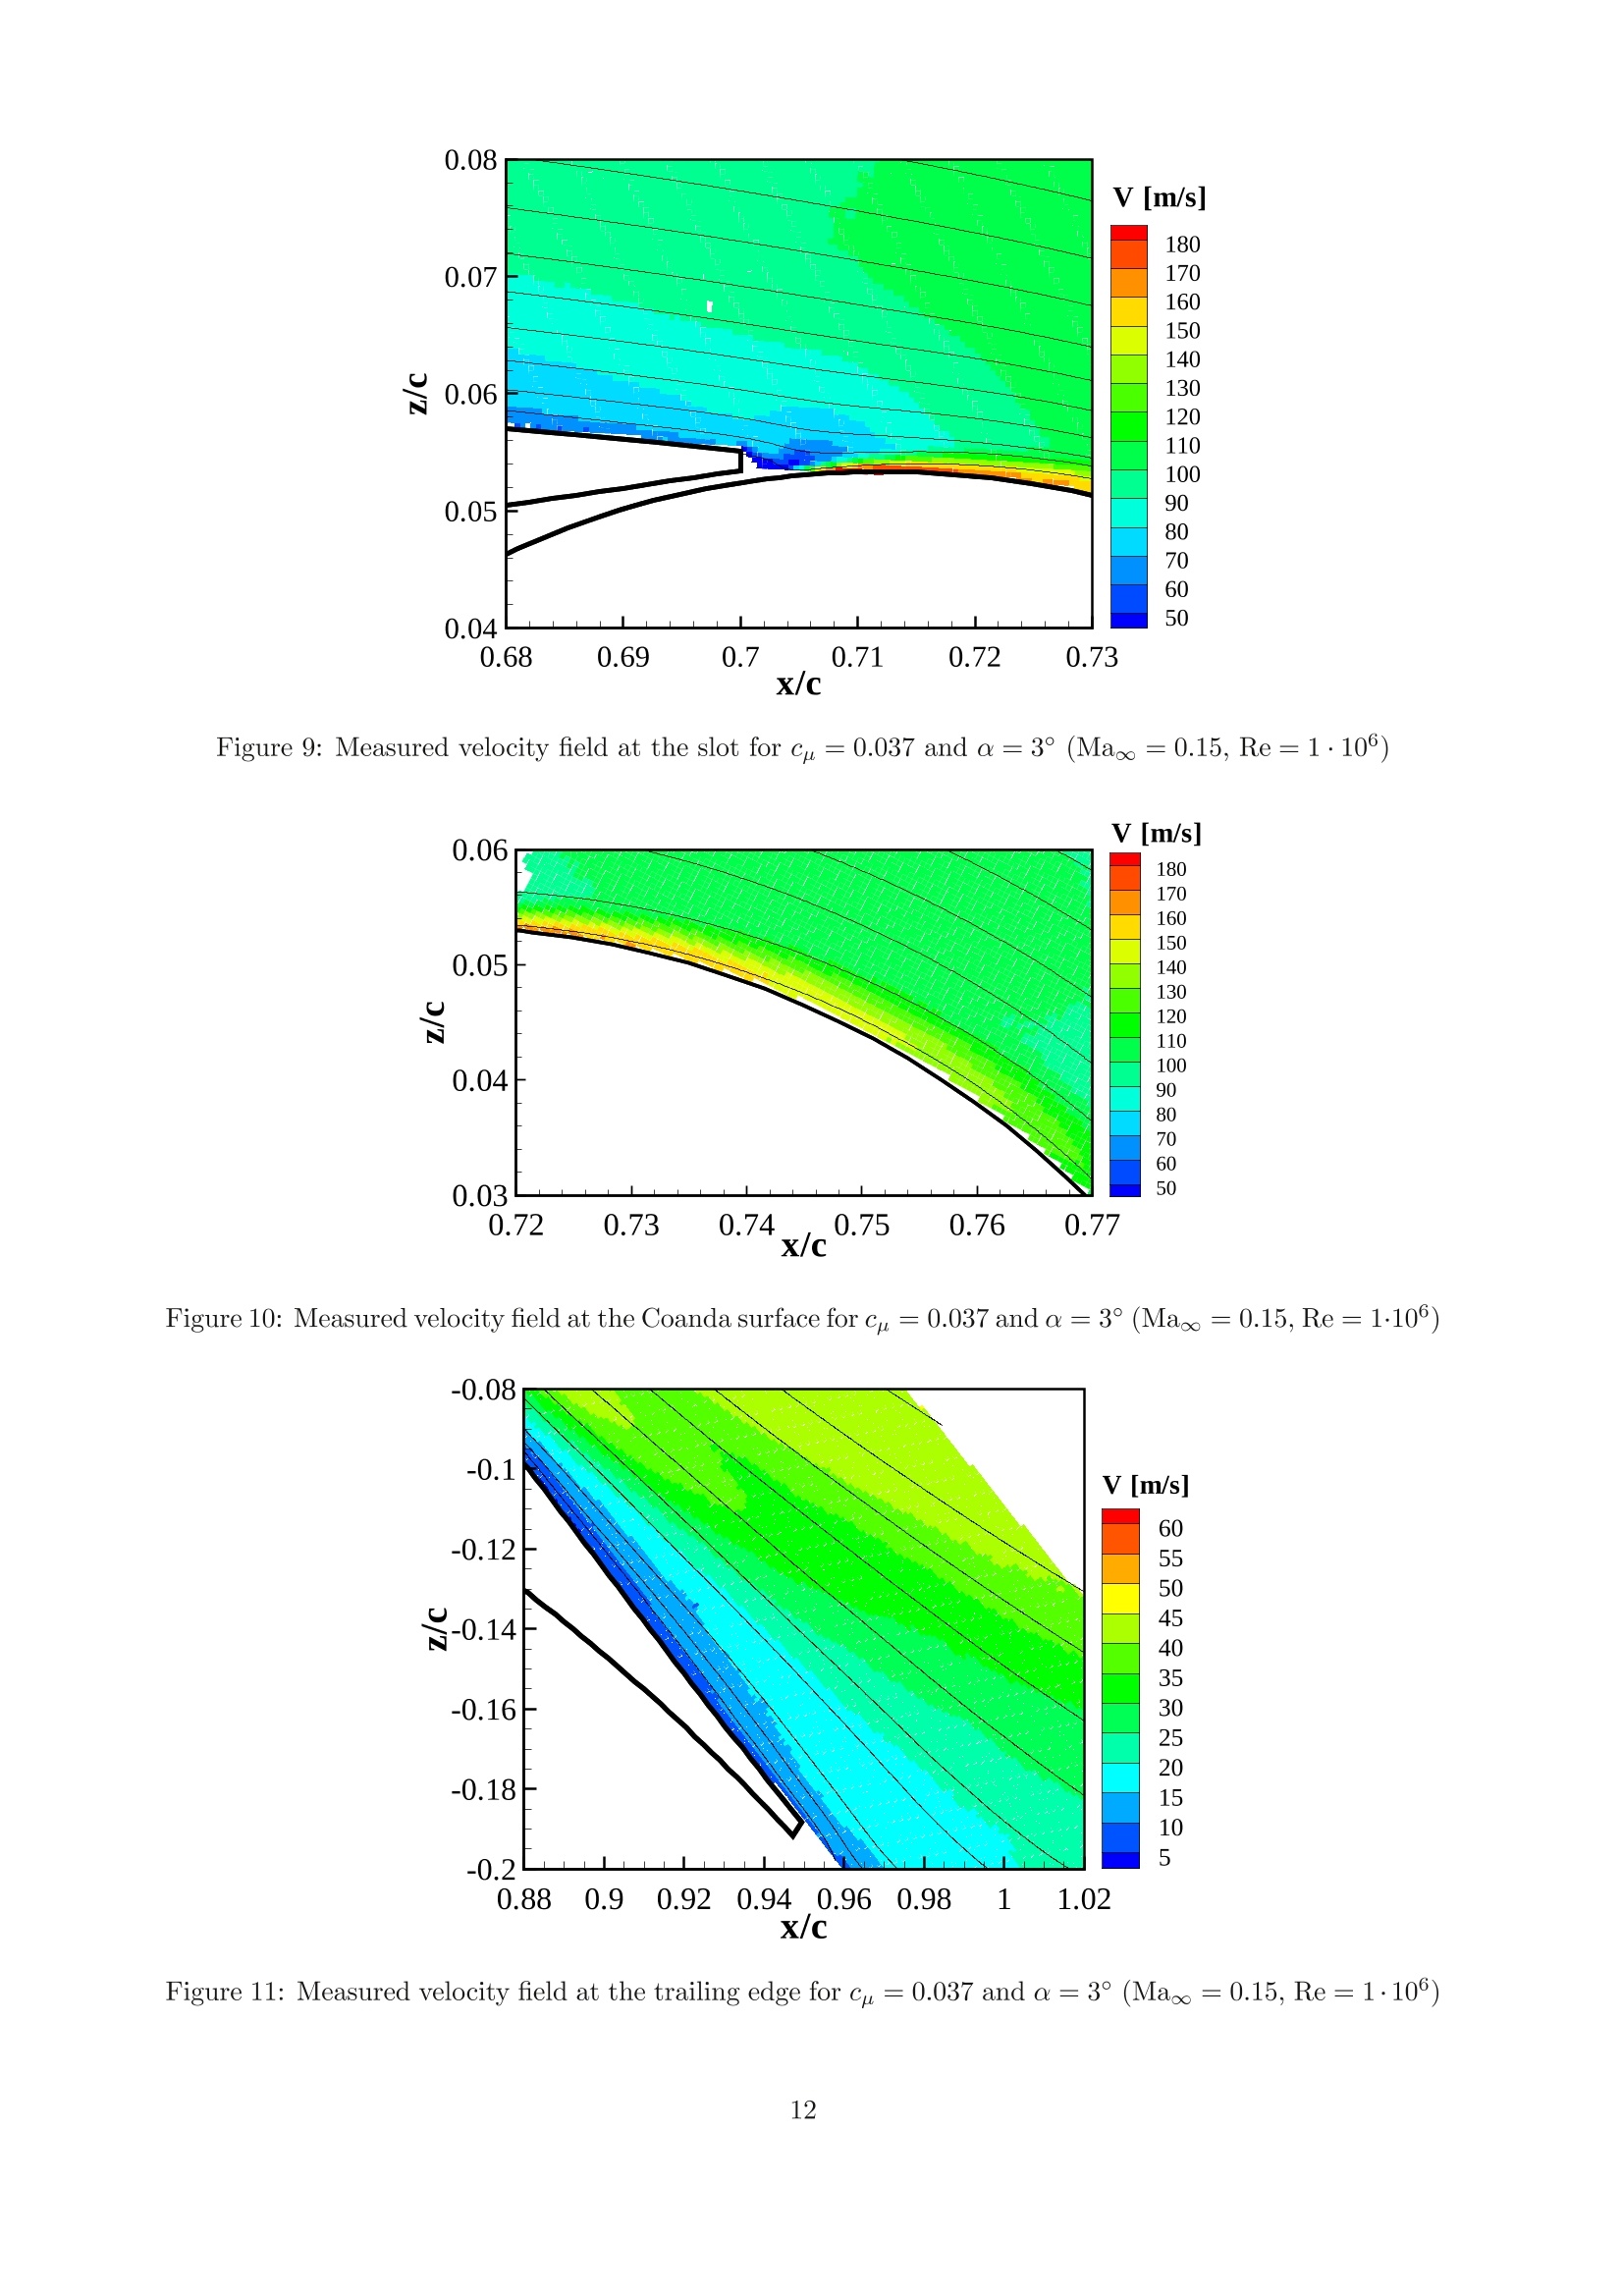
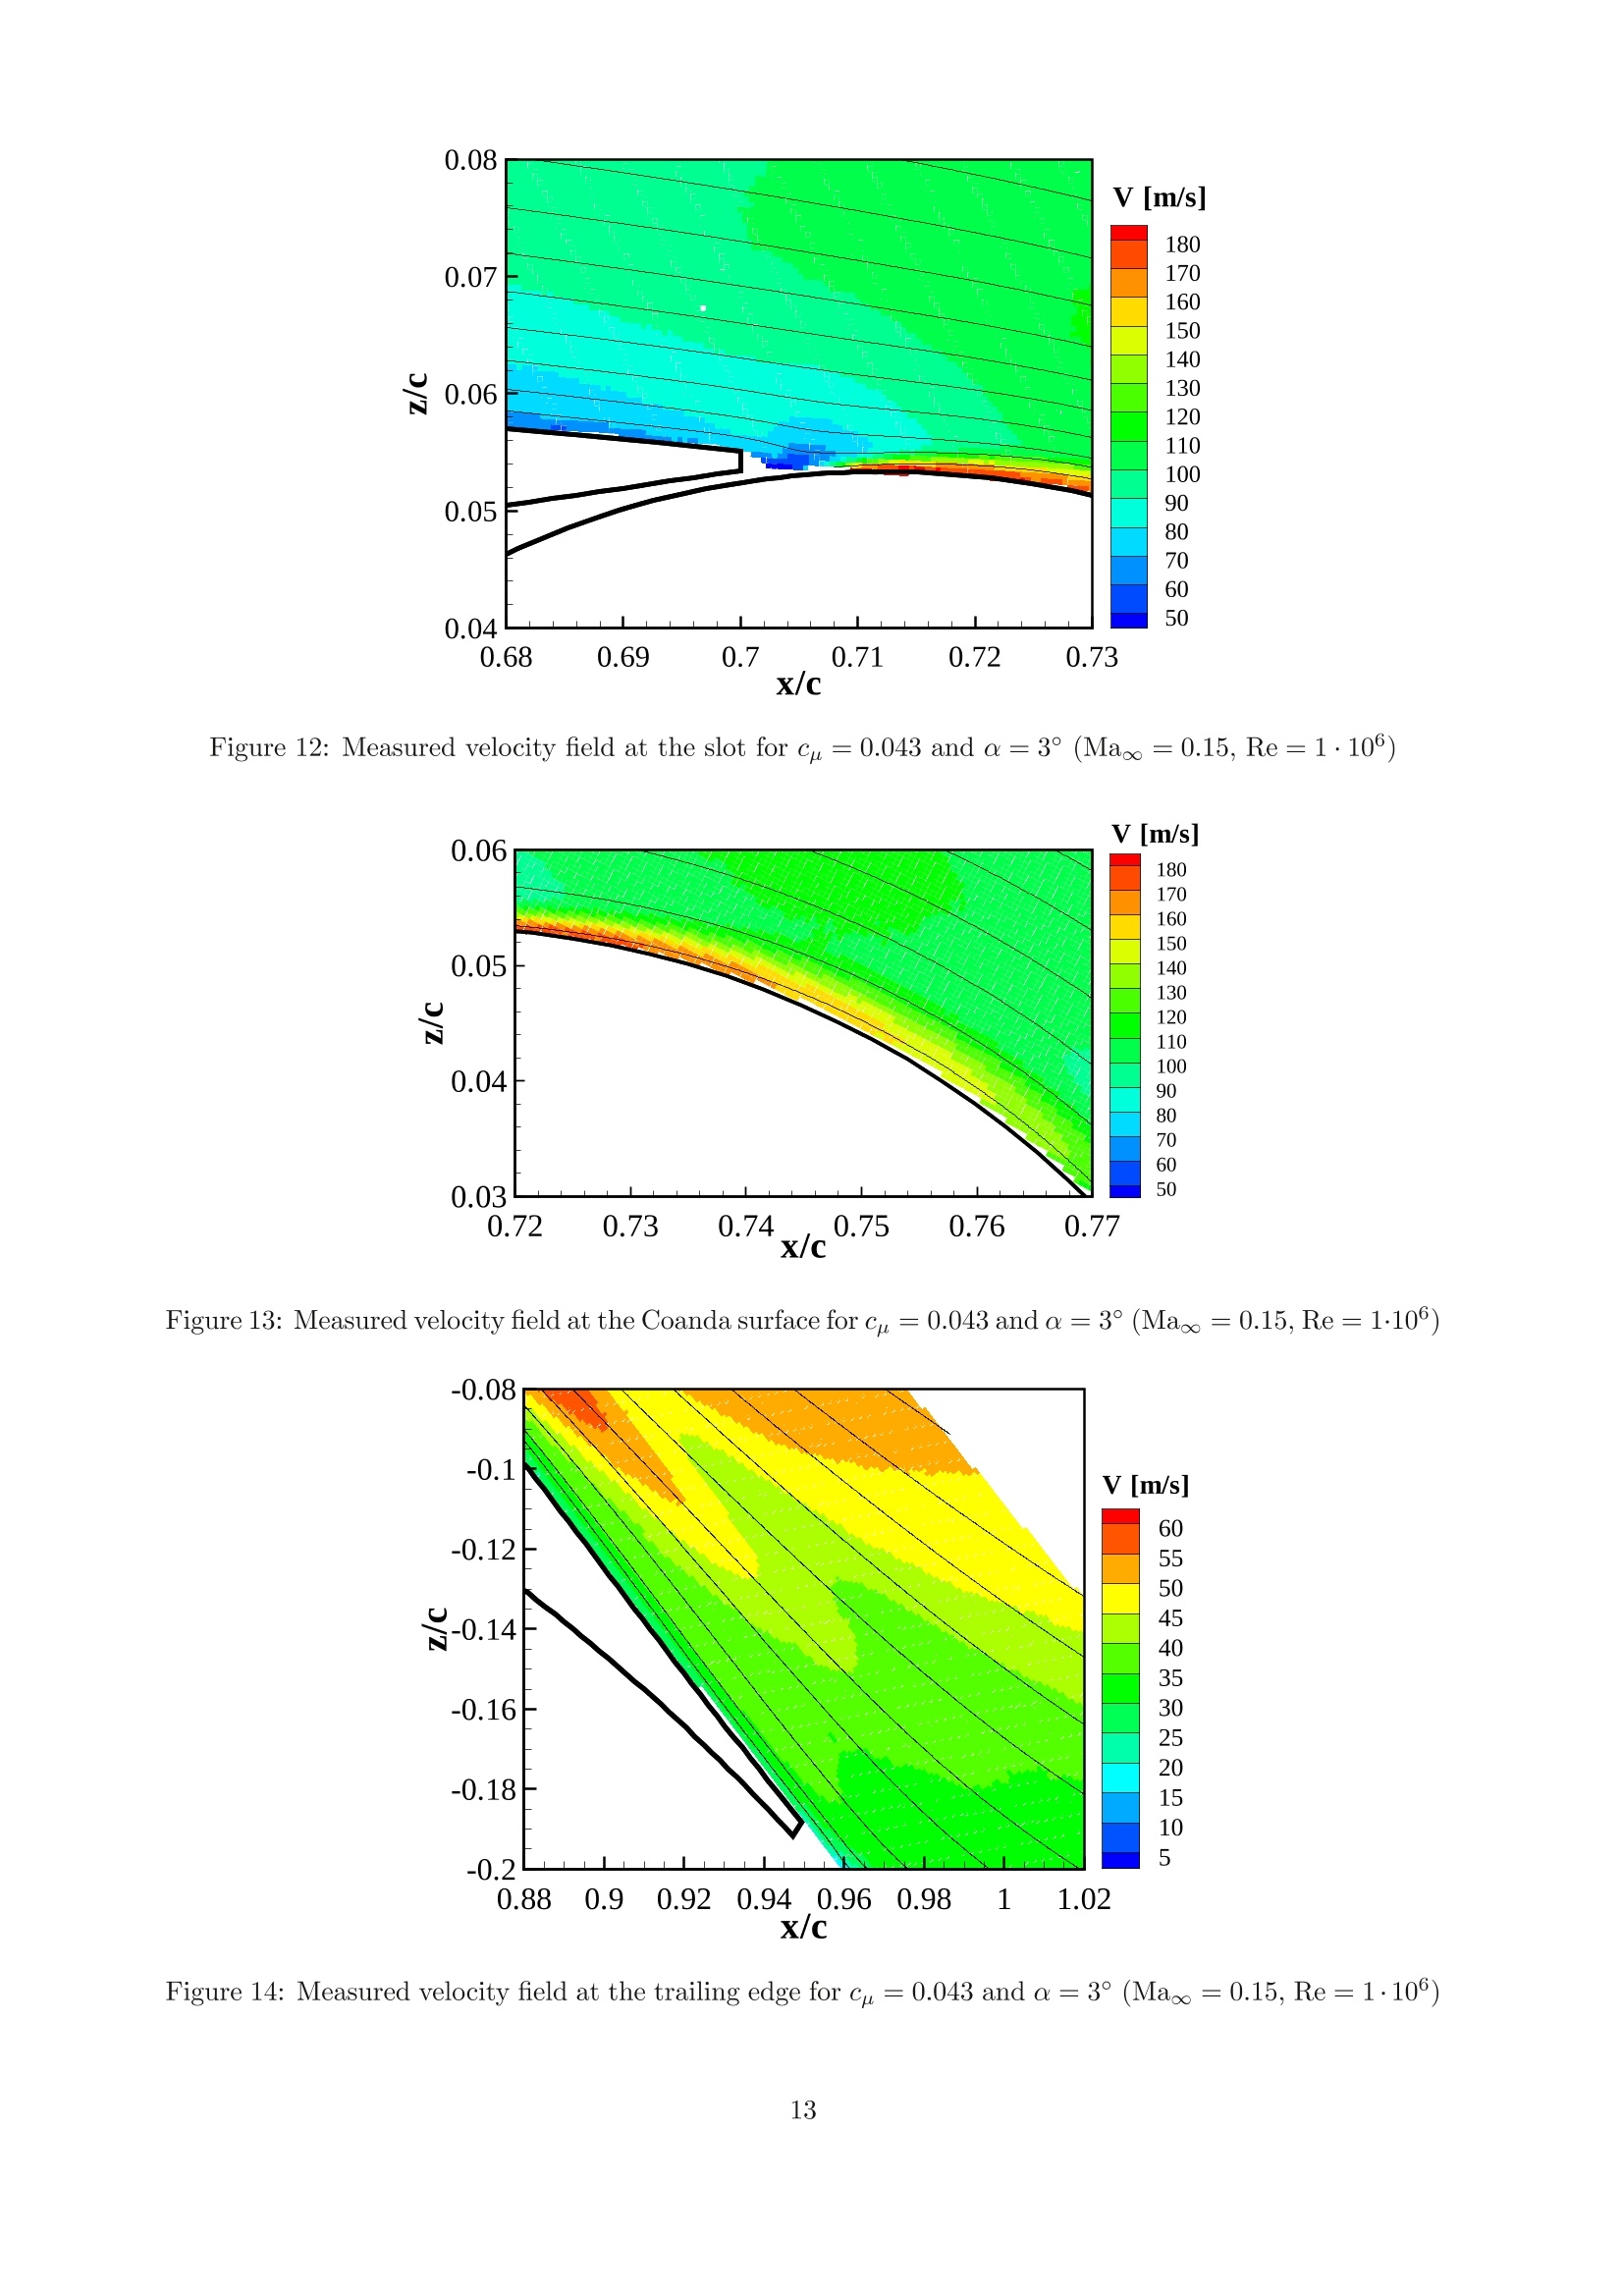
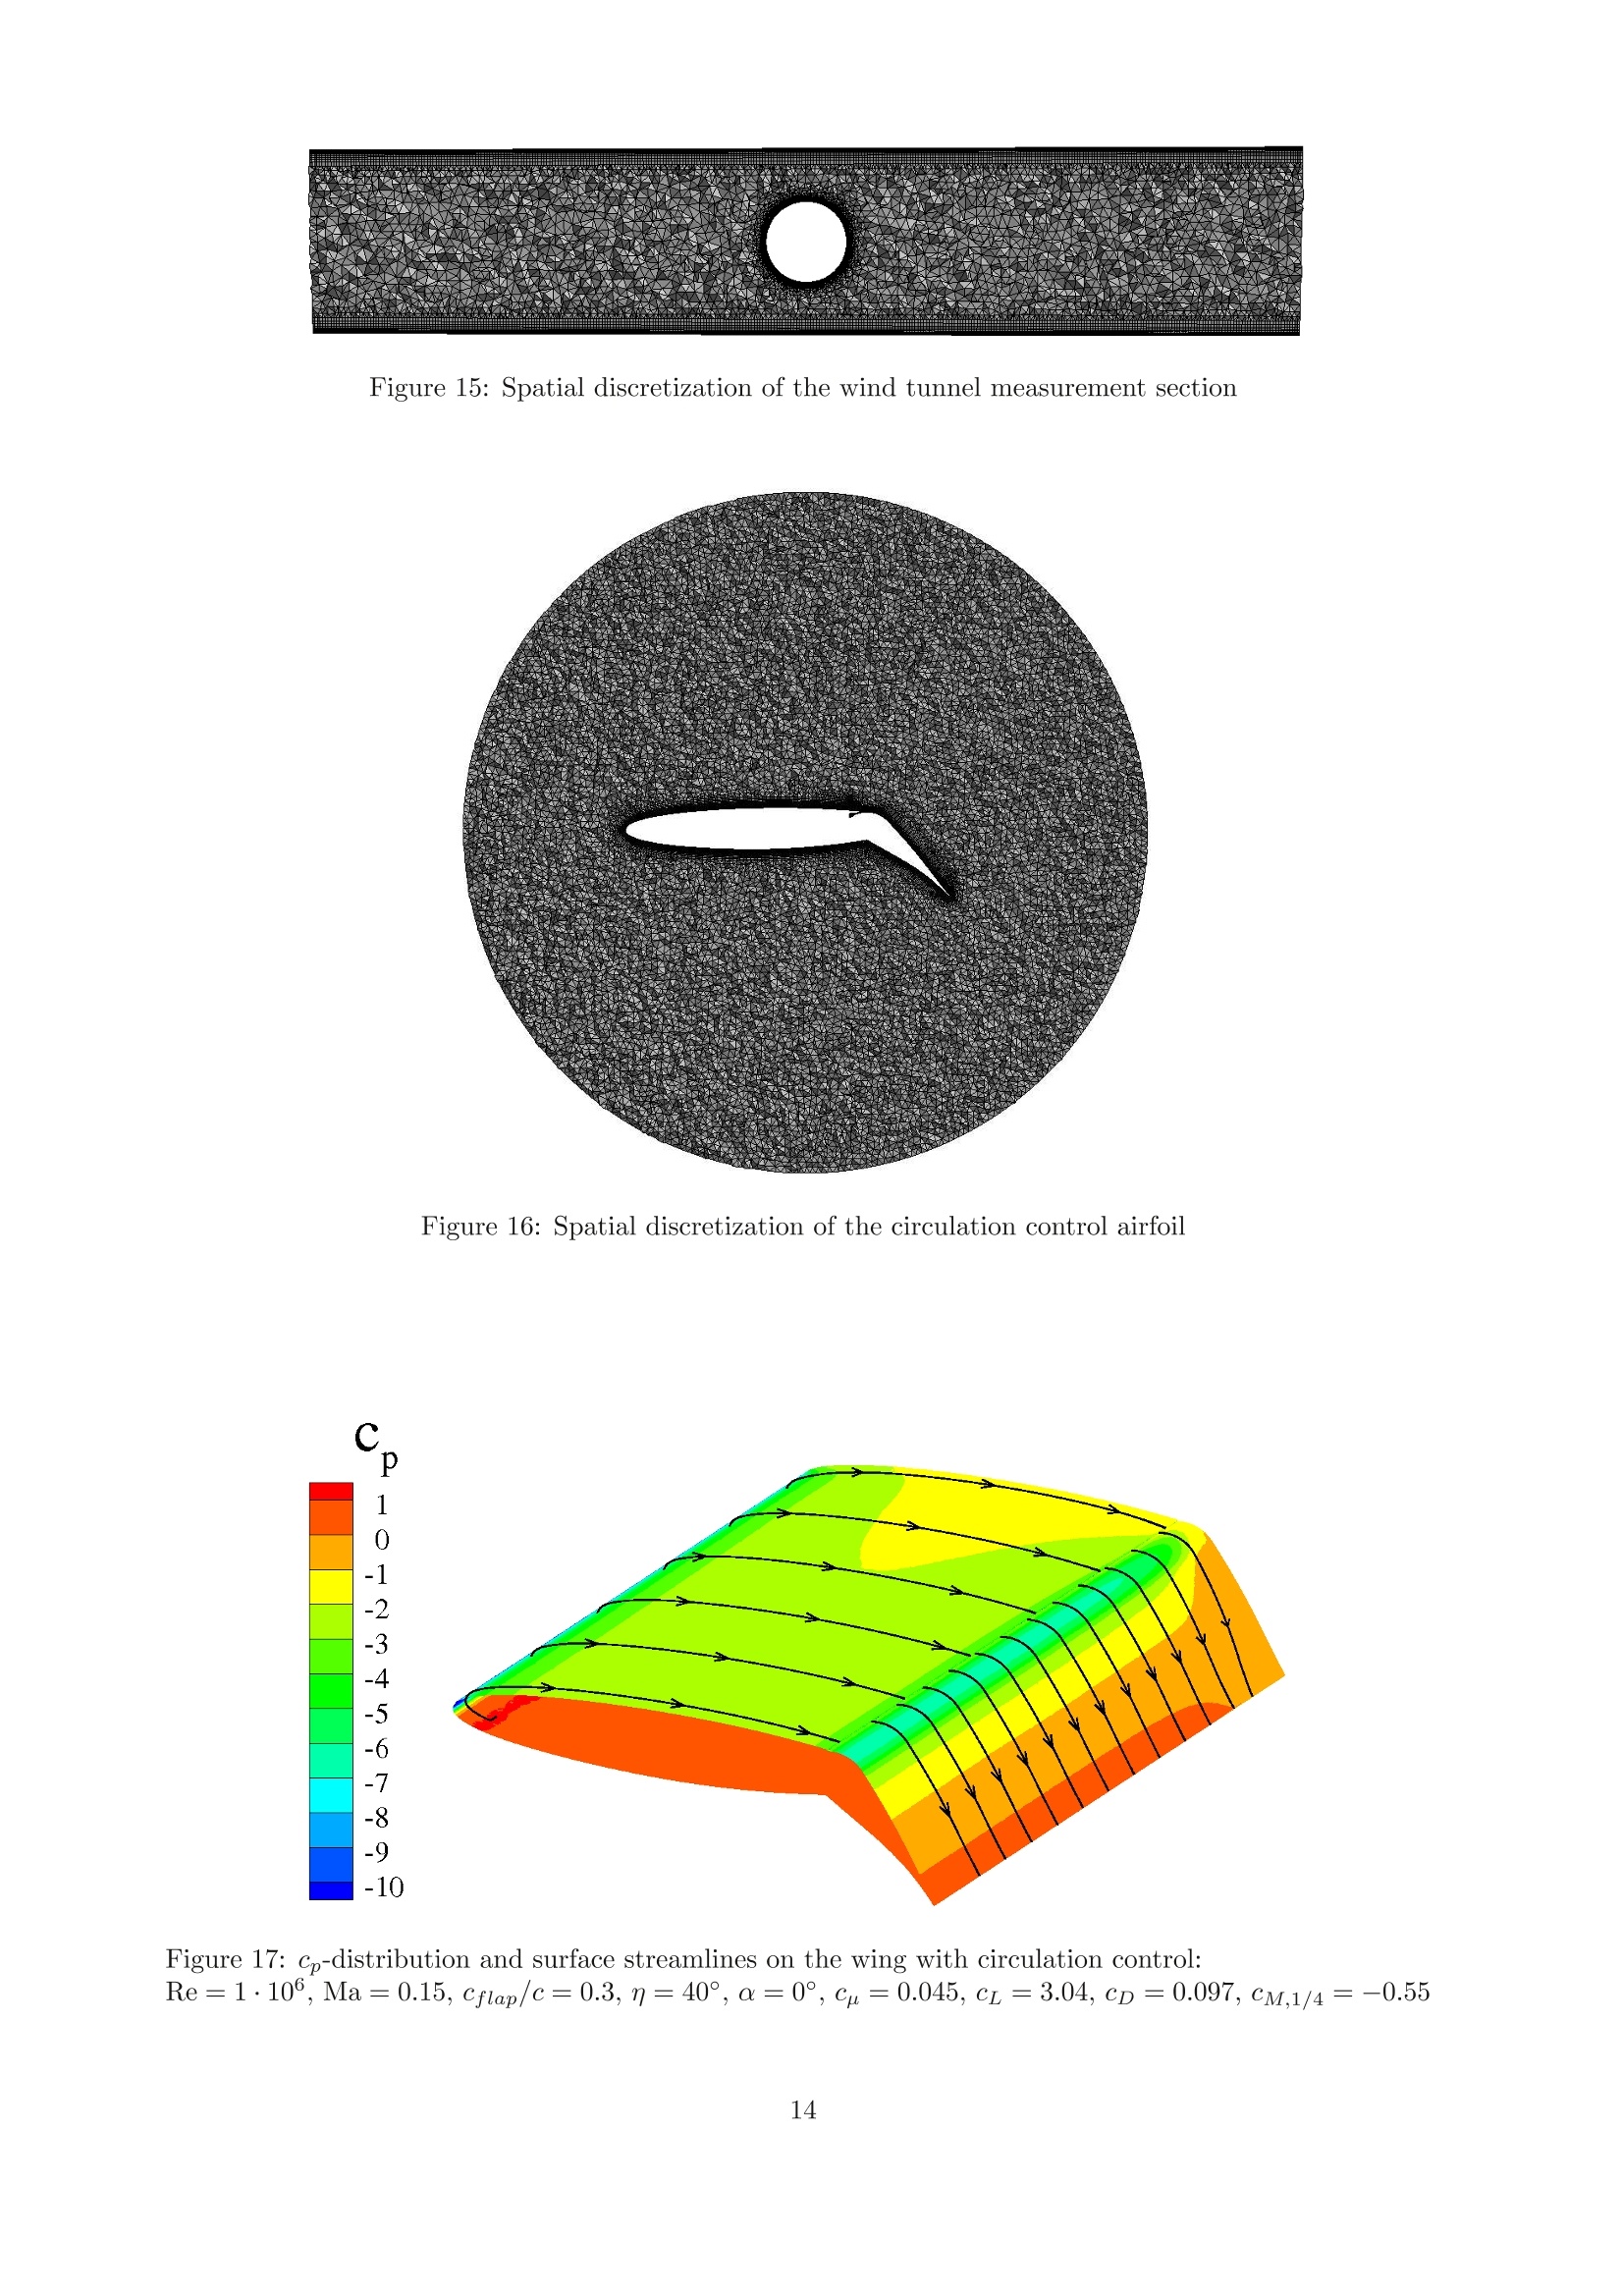
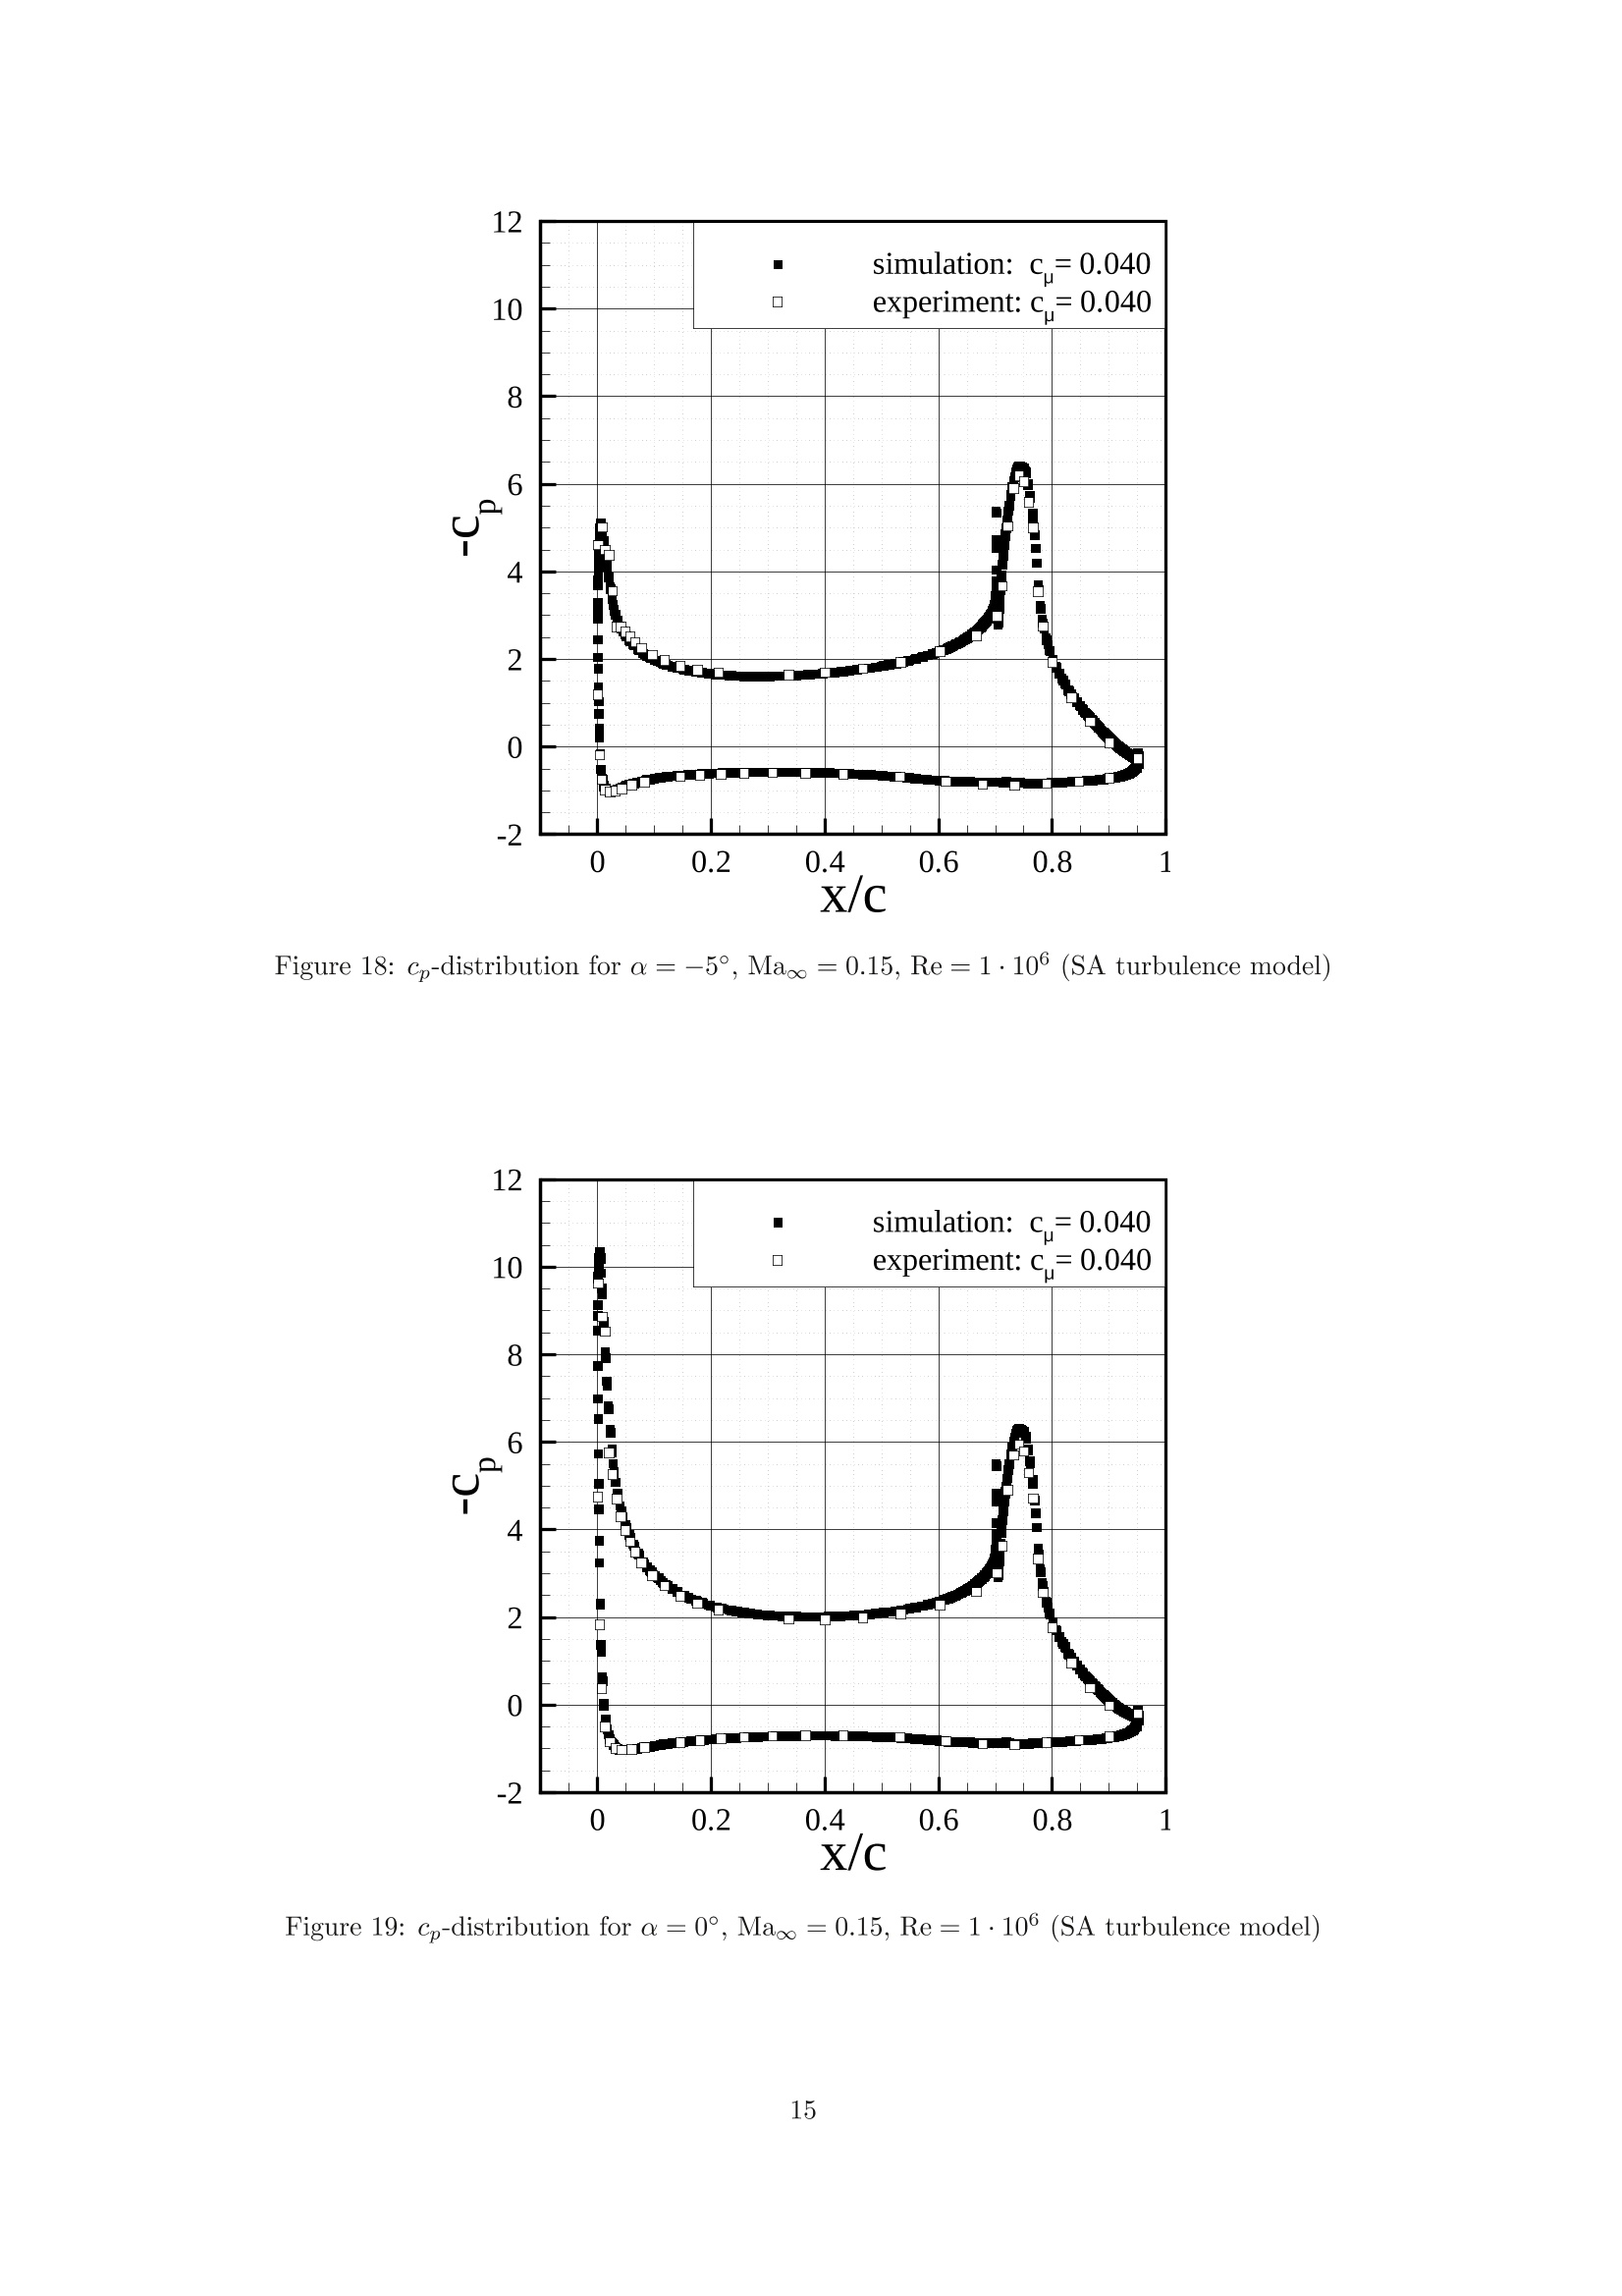
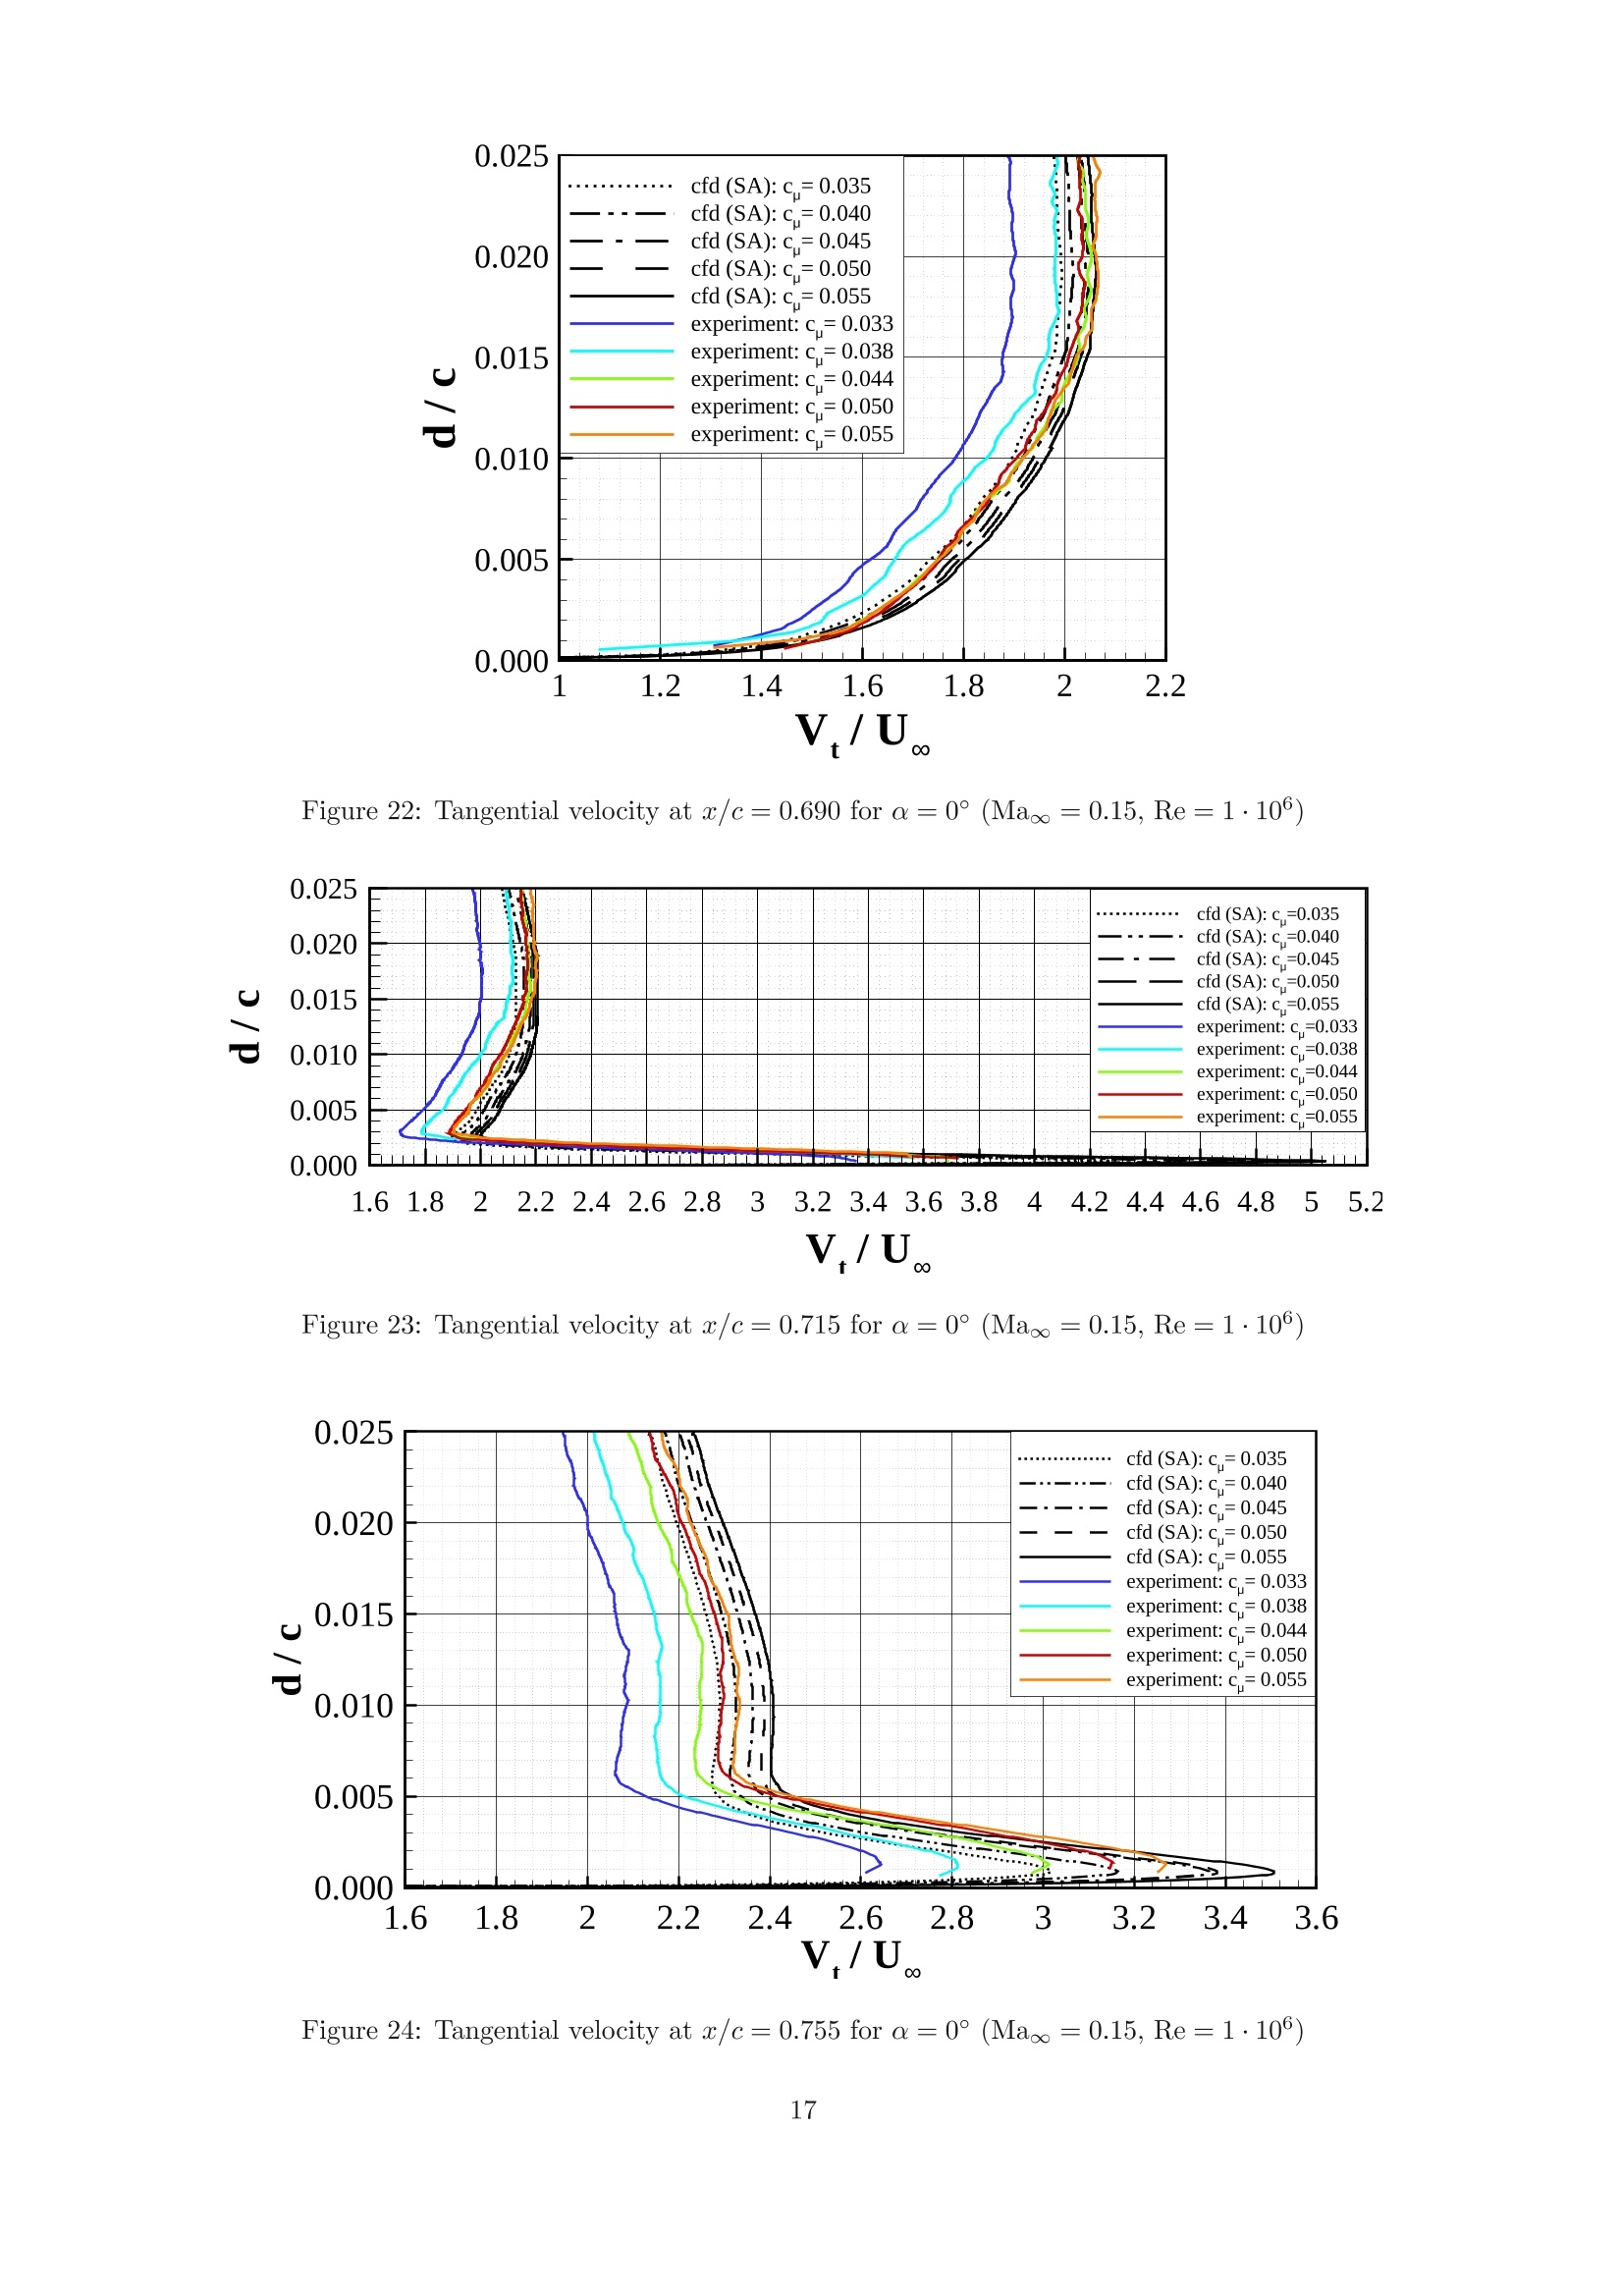
5 Numerical Simulation of Wind Tunnel Experiments Figures An experimental investigationof a gapless high-lift system using circulation control K. C. Pfingsten, R. D. Cecora and R. Radespiel Institute of Fluid Mechanics (ISM), Technische Universitat Braunschweig Bienroder Weg 3, 38106 Braunschweig, Germany K.C.Pfingsten@gmail.com Abstract When air is blown from a slot directly upstream of a flap, the flow over the flap can bear large adversepressure gradients without separation. This effect is used to design high-lift airfoils with low momentumcoefficients of blowing. For experimental assessment of these airfoils a rectangular wing with an aspectratio of 4.3 was built. The flow around the model in a low speed wind tunnel is analysed using pressuremeasurements and long distance microscopic particle image velocimetry. To measure the velocity in thevicinity of the slot and next to the surface of the flap the jet is seeded with particles. For Reynoldsnumbers of about Re=1·10 the dimensionless momentum coefficient of the jet and the angle of attackof the airfoil are varied. Numerical simulations of the three-dimensional flow around the circulationcontrol airfoil in the wind tunnel are compared to the experimental data. Good agreement is observedin terms of pressure distributions and velocity profiles. 1 Introduction In recent years noise pollution from aircraft, especially around airports, has become a huge problem. Hencethere is an increasing interest in reducing the noise emitted during take off and landing. The conventionalhigh-lift systems, consisting of slats and slotted flaps, are a major contributor of airframe noise. Thereforea gapless high-lift system without slats has a potential of reducing the overall noise emitted by an aircraft.With active flow control a gapless high-lift device is capable of generating the high lift coefficients neededfor climb and landing. For circulation control a small fraction of the cold engine flow is used for blowing.The bleed air is pipelined from the engine to a slot directly upstream of the flap and thus the flow overthe flap can bear large adverse pressure gradients without separation. Thus a gapless high-lift device withcirculation control can generate the required lift. The low drag coefficients during climb-out, achievable withthis powered high-lift system, could also allow for new low-noise trajectories, which would further reducenoise impact on the ground. The absence of slats might allow for laminar flow conditions in cruise flight,thereby reducing the drag in this flight segment. Even taking into account the additional system weightassociated with the bleed air distribution for a gapless high-lift system, there is a chance of reducing thetotal weight of the aircraft and possibly the cost, because slats and fowler systems are no longer needed. The first experiments using blowing to improve lift were conducted in the thirties of the last century byBamber [1] as well as Hagedorn and Ruden [2]. Circulation control was first proposed for the flow over acircular cylinder by Davidson [3] and then applied to elliptical airfoils by Kind and Maul [4]. Elliptical airfoilsutilising circulation control were also investigated by Stevenson et al 3] and Novak et al 6]. At TechnischeUniversitat Braunschweig systematic measurements and theoretical considerations for wings with blown flapsby Thomas 7] and Korner 8 yielded lift increase versus necessary momentum coefficients. The ellipticalairfoil with circulation control as well as the internally blown flap were extensively investigated by Englar[9] who could demonstrate good lift-over-drag performance. The first aircraft to demonstrate the high-lift capability of circulation control was a technology demonstrator built by Loth [10]. An experimentalinvestigation using particle image velocimetry to assess the flow around a circulation control airfoil withan elliptical trailing edge as well as the flow around an airfoil with a flap was conducted by Jones et al[11]. These configurations were assessed numerically by Baker and Paterson [12] using two-dimensionalRANS simulations. Large-eddy simulations for an elliptical profile with circulation control were performedby Slomski et al [13]. Due to the promising results of preceding numerical simulations by the authors[14] further experimentalinvestigations were conducted to analyse an airfoil with circulation control [15]. As in the preceding exper- iments the jet was not seeded with tracer particles, the velocity in the jet could not be measured. In theexperiments discussed here, the jet flow is seeded to measure the velocity profiles in the vicinity of the slotand on the flap surface using long distance microscopic particle image velocimetry. The special requirementsfor long distance uPIV are discussed by Kahler et al [16]. Simultaneously, numerical simulations of thewind tunnel experiments are performed. The experimental and numerical results are compared to assess theability of the used flow solver to simulate the flow around an airfoil with circulation control. 2Coanda Effect Profiles with blowing close to the trailing edge use the well known Coanda principle to generate high liftcoefficients. IIf a jet is positioned close to a wall, pressure forces change the path of the fluid elements.Thus the jet is deflected to the surface and becomes a tangential wall jet. The reason for this behaviouris low pressure between the jet and the solid surface. Due to the momentum transport from the jet to thestationary or slowly moving fluid, the flow in the vicinity of the jet is accelerated. Since the wall preventsfluid inflow into the area between the jet and the wall, pressure decreases. The emerging pressure gradientnormal to the wall generates a force, which moves the jet flow towards the wall. This effect applies for jetsalong straight and curved walls and hence tangential blowing can be used to achieve large turning of theflow over airfoils. Investigations by Englar and Hemmerly [17] showed that the Coanda effect works best when the slotheight is about 1% to 5% of the curved surface radius and the slot height is about one to two per mil of thechord length. The driving parameter for the Coanda effect is the dimensionless momentum coefficient, cu, of the jet,which is defined as follows: It is important to notice that the increase of the lift coefficient is much higher than the used dimensionlessmomentum coefficient. So the lift gain is due to flow separation control and super circulation and does notarise because the momentum of the jet is directed downwards. .3 Model Design for Wind Tunnel Experiments Numerical two-dimensional simulations of the flow around profiles using circulation control were conductedto find favourable geometries with low momentum coefficients..The flow around the circulation controlprofiles was simulated by solving the Reynolds-averaged Navier-Stokes equations using the DLR hybridunstructured flow solver TAU, which is based on a finite volume scheme 19,20. The code processes mesheswith different types of cells and combines the advantages of structured grids to resolve boundary layers withthe flexible grid generation of unstructured grids. To accelerate the convergence to steady state, techniqueslike local time stepping, residual smoothing and multi grid based on agglomeration of the dual-grid volumesare available. All preliminary two-dimensional computations were undertaken assuming the boundary layerto be fully turbulent and with the Spalart-Allmaras [21] turbulence model, which has proven its generalcapability of computing the flow fields around profiles with circulation control, using simulations of theexperimental results achieved by Novak [6] for an elliptical profile with circulation control [22, 23]. As a starting point for two-dimensional investigations of circulation control a modern transonic airfoilwas chosen, which can be seen in Figure 1. The design of the profile with circulation control has been donein a way to retain the characteristics of the basic profile at cruiseconditions. First the x-wise position of theslot is defined, which also determines the length of the flap. Thus the slot is positioned directly upstreamof the flap. Upstream of this position the original upper surface is used. Downstream of the slot the uppersurface of the flap has to be defined. The results of the numerical two-dimensional simulations for differentflap geometries were previously published by the authors 15]. For the wind tunnel tests the upper surface of the flap downstream of the vertical slot is defined as shownin Figure 2. The length ofthe large high-lift flap is set to cflap/c=0.3. This geometry is selected for thefollowing reasons: With the large high-lift flap large lift coefficients can be generated for a given momentumcoefficient and even when the blowing fails, reasonable lift coefficients can still be achieved. Low momentumcoefficients are here assumed as the most important requirement. When the Coanda radius is hidden inthe profile during cruise flight conditions the circulation control profile and the basic airfoil are identical. Ifthe flap is deflected for take off and landing, the Coanda radius appears downstream of the slot. The exact position of the hinge line can be used to obtain continuity in surface slope. This feature is not shown inFigure 2. Note that by doubling the slot height the generated lift is only slightly increased. Therfore here a profilewith a small slot height such as h/c=0.001 is preferred compared to a larger slot size, because the lift gainper momentum is larger and (as a rough estimate) the percentage of engine bleed air corresponds to thepercentage of overall thrust reduction. As a reference aircraft for the following consideration, an airplane for 260 passengers, a wing area ofS=244m² and a maximum take off weight of m =134t is chosen. For take off the reference aircraft needsa high-lift system, which can generate a two-dimensional lift coefficient of about ci ~ 2.7. The large high-liftflap with circulation control can provide the necessary lift for take off with flap deflections of n=20°. Forlanding much higher lift coefficients are needed in combination with large drag coefficients. The referenceaircraft requires a necessary two-dimensional lift coefficient of about ci~ 3.7 for the high-lift system. Thepreceding two-dimensional numerical simulations for this flow condition showed, that this can be achievedwith a flap deflected by n=40°, this time for an angle of attack of a=4°[15]. Therefore the model featuresa flap deflection angle of n= 40°to investigate the most important configuration. In order to achieve a two-dimensional flow around the circulation controlled airfoil and to keep wallinterference as small as possible, the aspect ratio of the model should be large. Therefore the chord has tobe as short as possible. On the other hand the Reynolds number should be as large as possible to reduce theinfluence of low Reynolds number effects. As a reasonable compromise a chord length ofc=0.3m was chosenfor the wind tunnel model, which yields an aspect ratio of A =4.3 and a Reynolds number of Re=1·10°.A profile with this length also provides sufficient space for the ducting of the pressurised air. With the geometric parameters defined, an aluminium wind tunnel model was manufactured. The modeldesign is displayed in Figure 3. The necessary mass flow of pressurised air used for circulation control issupplied into the model using both lateral sides of the wing. Thereby the total pressure distribution in theduct becomes more homogeneous and symmetrical in spanwise direction. Before wind tunnel testing theuniformity of the static pressure in the plenum in spanwise direction was checked by pressure measurementsat five locations in the model. For medium feed pressures corresponding to momentum coefficients aroundcu=0.04 the mean absolute deviation of the static pressures in the plenum was less than 0.1%. To analyse the jet distribution in spanwise direction, the dynamic pressure in the jet 0.01m downstreamof the slot was measured. For that reason a small Pitot tube was traversed in spanwise direction. To alwaysmeasure the same location inside the jet, the probe was kept in close contact to the wall. The results for amedium feed pressure are plotted in Figure 4. Here n is the normalised spanwise coordinate of the probeposition. The mean absolute deviation of the dynamic pressure is less than 6.5%. Thus we can assume analmost constant momentum coefficient of the jet in spanwise direction over the whole model, which is animportant requirement to obtain two-dimensional flow in the middle of the airfoil. It is important to mentionthat this data cannot be used to determine the jet velocity, as because of its size the probe measures anaveraged pressure over a certain boundary layer height. Measurements of the slot yielded a slot height ofh/c=0.001 with a maximum deviation of ▲h/c=0.0001. 4 Wind Tunnel Experiments The experimental investigations were conducted in the low speed wind tunnel of the Technische UniversitatBraunschweig, which is a closed-return atmospheric tunnel with a 1.3m x 1.3m closed test section. Anopening angle of y= 0.2°of the floor and ceiling of the test section compensates for the boundary layergrowth. In the measurement section a maximum speed of 55m/s can be achieved. A heat exchanger in thesettling chamber allows constant flow temperature. The wind tunnel model with circulation control was investigated at a free stream velocity of uo=50m/s,which results in a Mach number of Mao = 0.15 and a Reynolds number of Re = 1·106.. To analysethe performance of the airfoil for different momentum coefficients the static pressure of the pressurised airprovided by a blower could be varied from ambient pressure to pblower /p.=2. To determine the momentumcoefficient of the jet, the mass flow from the slot and the jet velocity are needed. To measure the massflowinto the airfoil, a flow measuring device is connected to the piping. When the total pressure and the totaltemperature of the air in the plenum and the static pressure at the slot are measured, the jet velocity canbe computed, using the equations for compressible flow and assuming an isen3SUItropic change of state fromthe plenum to the slot.To account for non isentropic losses an efficiency factor for the expansion wasevaluated based on numerical simulations of the flow: ?expansion =Ah/Ahs=vet/vrets=0.962. Thus themomentum coefficient for all experiments could be computed. The strong suction peak at the airfoil nose causes large laminar flow separation bubbles with a strongeffect on the overall airfoil flow. Therefore a zigzag strip was glued very close to the leading edge. Thethickness of this transition strip was chosen as 25um, by which overtripping could be avoided. To check for two-dimensional separation behaviour of the airfoil, tufts were attached to the upper surface.The flow separation always started in the centre of the airfoil as there was the highest aerodynamic load andthen started to grow towards the side walls. The pressure distribution around the airfoil was measured for different momentum coefficients. For eachanalysed momentum coefficient the measurements started at an angle of attack of a=-5°. The angle ofattack was then gradually increased until the flow separated from the airfoil. The pressure distribution onthe model surface was measured by 63 pressure taps, which are positioned in the plane of symmetry of theairfoil. The pressure taps were distributed to offer high resolution at the leading edge and on the Coandasurface to capture the suction peaks with sufficient accuracy. There was also one pressure tap in the trailingedge, which features a thickness of d/c=0.004. In order to compute the cp-distribution, the pressure at the ceiling and the floor in the plane of symmetryof the test section at a position of 9.5 chord length behind the airfoil was averaged and used as referencepressure. As the experimental calibration of the freestream velocity by the wind tunnel nozzle factor isaffected by the high-lift airfoil in the test section, the velocity in the measurement section is measured atthe same position as the reference pressure using two Prandtl tubes. In Figure 5 the cp-distributions for an angle of attack of a=0°and different momentum coefficientsare plotted. Without blowing the flow separates at the very beginning of the flap. For small momentumcoefficients like cu =0.021 the flow separates downstream of the Coanda surface. If momentum coefficientsgreater than cu=0.040 are used the flow stays attached up to the trailing edge. Note that an increase of themomentum coefficient always corresponds to an increase of the circulation around the complete airfoil andnot only decreases the pressure on the flap. The stagnation point on the lower surface moves backwards ifthe blowing is intensified. Figure 8 shows the cp-distributions around the wind tunnel model for Cu=0.045.If the angle of attack is increased the suction peak at the nose becomes stronger as the stagnation pointmoves backwards. At the same time the suction peak above the Coanda surface weakens. Using the measured pressure distribution the force normal to the airfoil chord could be computed. InFigure 7 the normal force coefficients cn are shown for seven different momentum coefficients betweenCu=0.021 and cu=0.057. For comparison the normal force coefficients of the airfoil without blowing arealso plotted, here the flow over the flap is fully detached for each angle of attack. When the momentumcoefficient of the jet is increased, the normal force is increased as well, whereas the angle of attack, for whichthe maximum normal force is achieved, decreases. The gain in normal force for increasing the momentumcoefficient becomes smaller for higher momentum coefficients. For small momentum coefficients the blowingworks as boundary layer control, the momentum of the jet results in a later separation of the flow on theupper surface of the flap. When the flow stays attached up to the trailing edge, the end of boundary layercontrol is reached; a further increase in jet momentum results in super circulation. For super circulation thenormal force is still increased by increasing the momentum coefficient. However, the efficiency of the flowcontrol device Acn/Ac, is reduced. This can be seen in Figure 8, where the gain in normal force coefficientis plotted over the corresponding momentum coefficient for an angle of attack of a=3°. For the investigatedairfoil super circulation starts for momentum coefficients larger than cu=0.040. Long distance uPIV was used to measure the velocity field over the flap in the centre of the airfoil.Therefore a Quantel Brilliant double pulsed Nd:YAG laser with an energy of E= 150mJ per pulse was usedto illuminate a flow parallel light sheet in the middle of the wind tunnel. Due to the necessary high laserpower per volume needed for long distance uPIV, reflections of the laser light become an important issue. Toprevent the laser sheet from hitting the airfoil surface at a right angle, the light sheet was tilted by y~ 35°from the vertical. Thus the reflections from the surface could be reduced. To further reduce the reflectionsthe model surface was polished. The laser sheet had a width of w= 80mm and a thickness of t = 0.1mm toreduce the out of plane component of the measured velocity. Due to the high spatial resolution in association with uPIV a high concentration of seeding particles isnecessary in the area of interest. To achieve this high density of tracer particles in the outer flow, stream-tubeseeding was realised by introducing the seeding to the flow in the settling chamber of the wind tunnel by atraversable tube with a streamline fairing. Thus a filament of high density seeding with a diameter of about50mm is created. The pressure distribution around the airfoil is not changed by the tube. The influence ofthe traversable tube on the turbulence level was assessed by Kruse 18 and has no significant effect on thecurrent measurements. To get tracer particles into the jet, a second flow of pressurised air is mixed with the flow from the blower.Before the secondary flow is fed into the main flow, after passing through a seeding generator, it is ducted through a cyclone to remove large tracer particles. Thus the interior of the model could be kept clean anda high quality of the seeding particles in the jet can be assured. For the computation of the momentum coefficient of the jet this additional mass flow has to be moni-tored as well. As seeding, oil particles with a diameter of about 1um were employed. To reduce windowcontamination by tracer particles, pressurised air is blown through a slot in the wind tunnel wall upstreamof the model. A LaVision Imager ProX 11M with a resolution of 4008 x 2672 pixels was used to capture the particleimages. Fast recording of image pairs is ensured by a minimum frame transfer rate of 250ns. A long-distancemicroscope (Infinity K2) equipped with two magnifier tubes and the close objective CF1 is employed toobtain the optical magnification necessary to investigate the flow in the vicinity of the slot and on theCoanda surface. For data acquisition and data evaluation, Davis7.2 by LaVision was used. One set of measurements was done to visualize the velocity field in the vicinity of the slot. Thousandimages with a field of view of 17mm x 11mm were taken for an angle of attack of a=0° and for momentumcoefficients of cu =0.026, Cp=0.033, cu=0.038, cu=0.044, cu=0.050 and cp = 0.055. For an angleof attack of a=3° thousand images were taken for momentum coefficients of cu = 0.026, cu =0.032,cp =0.037, cpu=0.043, cu= 0.049 and cu=0.055. Once the particle image acquisition of 1000 imagepairs for each measurement was completed, the velocity vector field of the flow around the airfoil had to bedetermined. After several image preprocessing techniques to improve the particle image quality, the particledisplacement evaluation was executed in the next step using a cross correlation scheme. Here a multipassinterrogation scheme was applied with decreasing interrogation window size from 128x 128 pixels down to64 x 64 pixels, 50% overlap and window shifting and deformation. A spatial resolution of the obtained vectorfield of 0.14mm in both directions was achieved, with the first velocity vector in a distance of d/c <0.0005to the wall. The resulting set of 1000 vector fields for each measurement was then post-processed. It wasnecessary to filter out non physical vectors, which would corrupt the results of the ensemble averagingprocedure. Only if in at least 250 vector fields a valid vector was found at a certain position an averagevelocity vector for this position was computed. The computed average flow field in the vicinity of the slotfor a momentum coefficient of cu=0.037 and an angle of attack of a=3° is displayed in Figure 9. Theboundary layer on the upper surface upstream of the slot as well as the high velocity in the jet can beseen. In Figure 12 the flow field for a momentum coefficient of cp= 0.043 is plotted. It is apparent thatthe velocity in the boundary layer as well as the velocity in the jet is increased for the higher momentumcoefficient. The second set of images was taken in order to measure the velocity profiles on the Coanda surfacedownstream of the slot. As the same optical setup was used the vector field yields also a spatial resolution of0.14mm in both directions. The first velocity information is gained in a distance of d/c <0.0005 to the wall.One thousand images with a size of 17mm x 11mm were taken for the same parameter space as for the firstsetup. To evaluate the velocity vectors the same algorithm were used as above. The computed average flowfield above the Coanda surface for a momentum coefficient of cu = 0.037 and an angle of attack of a=3°is displayed in Figure 10. The high velocity in the jet attached to the Coanda surface can be seen. For amomentum coefficient of cu=0.043 the velocity in the jet is further increased, which can be seen in Figure13. The third set of measurements was done to visualize the velocity field above the end of the flap. Thusit is possible to determine the minimum momentum coefficient necessary to keep the flow attached up tothe trailing edge. For this measurement no magnifier tubes were used, thus the window size is increasedto 70mm x 47mm. The corresponding spatial resolution is 0.29mm. Thousand images were taken for anangle of attack of a=3°and for momentum coefficients of cu=0.026, cp=0.032, cu=0.037, cu= 0.043,cp=0.049 and cp=0.055. To evaluate the velocity vectors the same algorithm were used as above, thougha multipass interrogation scheme with decreasing interrogation window size from 128 x 128 pixels down to32 x 32 pixels was applied. If a momentum coefficient of cp =0.037 is used for blowing the flow is not alwaysattached to the flap. As the flow is in the transition from being completely separated and being attached,the average streamlines, which can be seen in Figure 11, are still parallel to the surface. However,the lowvelocity close to the flap surface shows that the flow is not attached to the surface most of the time. Theflow field for a momentum coefficient of cu=0.043 is plotted in Figure 14. Here the momentum of the jetis high enough to keep the flow attached up to the trailing edge. The three-dimensional flow around the wing utilising circulation control was simulated by solving theReynolds-averaged Navier-Stokes equations, using the DLR hybrid unstructured flow solver TAU, as forthe two-dimensional simulations used to design the wind tunnel model. To increase the accuracy of thethree-dimensional simulations,low speed preconditioning was used. The viscous walls of the test sectionwere also simulated to obtain realistic results for the flow around the wind tunnel model. For efficient flowcomputations the chimera technique was employed with a local grid defined around the airfoil. The chimeratechnique allows using an already attained solution as a restart for a following simulation with a differentangle of attack. Using the chimera technique to gradually increase the angle of attack, the flow in the vicinityof maximum lift can be simulated correctly. In Figure 15 the spatial discretization of the wind tunnel test section can be seen. This hybrid meshconsists of 6·10° nodes. The cylindrical mesh around the model is positioned in the cylindrical hole of thebackground mesh. This local mesh, which is composed of 14·10 nodes, is displayed in Figure 16 and canbe rotated around its centreline. This centreline is identical to the axis of rotation of the wind tunnel model.Thus the chimera technique can be used to account for the hysteresis effect of the separation. The structured area on the surface of the wing has a thickness of 40 cells. On the walls of the wind tunnel32 prismatic layers were generated. The nondimensional first grid spacing normal to the wall is smaller than1.5 on most parts of the surface of the wing, except for local values of about 5 at the nose and on the Coandasurface due to the locally very high velocities. In the vicinity of the jet slot and the trailing edge the gridfor the numerical simulation is clustered to capture the jet behaviour correctly. First simulations of the flow field around the wind tunnel model are performed with the standard Spalart-Allmaras (SA) turbulence model without any curvature correction. In Figure 17 the cp-distribution onthe model surface and the surface streamlines are shown for an angle of attack of a=0°and a momentumcoefficient of cu = 0.045. Only one half of the symmetric model is shown in Figure 17. The backwardside in the figure is the location of the wind tunnel side wall. The computed flow field shows that almosttwo-dimensional flow can be assumed in the middle of the measurement section. To compute the momentumcoefficients the jet velocity in the plane of symmetry is mass averaged over the slot height, multiplied by theoverall massflow and divided by the wing area and the dynamic pressure of the flow. In order to compute the cp-distribution, the pressure at the ceiling and the floor in the plane of symmetryof the test section at a position of 9.5 chord length behind the airfoil was averaged and used as reference pres-sure, as it was done for the experimental data. In Figure 18 and Figure 19 the measured c-distributionsfor a momentum coefficient of cp= 0.040 for an angle of attack of a=-5°and a=0°are compared withthe results of the numerical simulations. In Figure 20 and Figure 21 the measured cp-distributions for ahigher momentum coefficient of cu = 0.045 are compared with the results of the numerical simulations forthe same angles of attack as above. The good agreement of the numerical and the experimental results demonstrates the capability of theSA turbulence model to simulate the flow around a circulation control airfoil with a sharp trailing edge.Unsteady simulations for higher angles of attack have to be conducted to analyse the capability of the SAturbulence model to predict the flow in the proximity of maximum lift. In Figure 22 -24 velocity profiles attained by particle image velocimetry are compared with thesimulated velocity profiles at the midspan position of x/c=0.690,c/c=0.715 anda/c=0.755. All velocityprofiles shown here are given for an angle of attack of a=0°and only the velocity component parallel tothe surface is shown. At all positions the velocity is increased by increasing the momentum coefficient. In Figure 22 the velocity profiles at s/c = 0.690 are plotted, which corresponds to a position about3mm upstream of the slot(z/c=0.7). For cp >0.040 the flow on the flap is completely attached and theshape of the velocity profiles is well predicted by using the SA turbulence model. Though the curvature ofthe experimental velocity profiles in the middle of the boundary layer is slightly smaller. In the regime ofboundary layer control, when the cg is not large enough to keep the flow attached on the complete flap, thediscrepancy between experimental and numerical velocity profiles is larger. Here the numerically simulatedvelocity for cp= 0.035 at the edge of the boundary layer differs by 2% from the velocity interpolated from theexperimental results for cp=0.033 and cp=0.038. The simulation for cp=0.035 shows a small separationon the edge of the flap, which has only a size of 2% of the chord length. In the experimental results theseparation on the flap is already much stronger for this momentum coefficient (see Figure 5) and thus thecirculation around the airfoil is reduced in the experiment. If a turbulence model is applied, which takesthe effect of shear flow curvature into account, as the SARC model (SARC: Spalart-Allmaras model forRotation and/or Curvature effects) [24, the size of the separation for cp=0.035 increases to 5%. In Figure 23 the velocity profiles at x/c = 0.715 are plotted, which corresponds to a position about 4.5mm downstream of the slot. In these graphs the jet as well as the shear layer above the jet can be seen.Again the numerically simulated velocity for cp=0.035 at the edge of the boundary layer differs by 2%from the velocity interpolated from the experimental results. For the momentum coefficients of cu=0.044,cu=0.050 and cp=0.055 the shape of the shear layer is predicted quite well, but the momentum deficiencycaused by the wake of the lip is about 6% larger in the experiment. The maximum jet velocity for cu=0.055is about 30% higher in the simulations. It can be speculated that the resolution of the uPIV data is nothigh enough to resolve the jet profile completely that close to the slot, as the jet has a thickness of about0.3mm at this position. The velocity profiles on the Coanda surface are shown in Figure 24 for a position of c/c=0.755, whichcorresponds to an angle of 40°on the Coanda surface. The shape of the simulated velocity profile fits wellto the experimental results.. The absolute values get closer to the experimental results if the blowing isincreased. For the highest investigated momentum coefficient of cp=0.055 the velocity is about 4% toosmall in the shear layer and about 7% in the middle of the jet. 6 Conclusions The experimental investigation of an airfoil with circulation control using an internally blown high-lift flapyields high normal force coefficients at comparably low momentum coefficients. Pressure distributions alongthe airfoil and uPIV measurements are obtained to establish a data set useful for validating numericalsimulation methods. First numerical simulations show a good agreement with the measured data, even if asimple one-equation turbulence model without curvature correction is used. More numerical simulations haveto be conducted to see if the same good agreement can be achieved for maximum lift and if the momentumcoefficient and the angle of attack for which separation starts can be predicted as well. Acknowledgments The present work is performed as a part of the European research project TimpAN (Technologies to IMProveAirframe Noise), which is part of the sixth framework programme. This project is founded by the EuropeanCommission and is coordinated by Airbus France. The authors thank the “Norddeutscher Verbund fir Hoch-und Hochstleistungsrechnen”(HLRN) for providing the necessary computational resources. References ( [1] Bamber, M . J.: Wind tun n el tests on air f oil bo u ndary layer control usi n g a backward-opening slot, NACAReport 3 85, 1 932. ) ( [2] Hagedorn, H. and R uden, P . : Windkanaluntersuchungen a n einem Junkers-Doppelfiiigel m i t A u s-blaseschlitz am H eck d e s H a uptfliigels, B ericht A 64 de r Li l ientha l -Gesells c haft fi i r L u ftfahrtforschung, 1938. ) ( [3] Davidson, I. M .: Aerofoil boundary layer co n trol system, British Pa t ent No. 9 13,754, 1960. ) ( [4] Kind, R . J . ,Ma u l, D. J.: An esp e rimental investigation ofa low-speed circulation controlled airfoil, TheAeronautical Q uarterly, V ol. XIX, May 1968, pp.170-182. ) ( [5] Stevenson, T. A., Franke, M. E., Rhynard, W. E . a nd Snyder J. R.: Wind-tunnel study ofa circulationcontrol elliptical airfoil, AIAA Journal of Aircraft Vol.14, N o . 9, 19 7 7, pp.881-886. ) ( [6] Novak, C . J.,Cornelius, K. C. and Roads R. K.: Experimental investigations o f the circular w all jet on acirculation control airfoil , AIAA Paper 8 7-0155,19 8 7. ) ( [7] Thomas, F .: Untersuchungen ube r die Grenzschichtbeeinflussung durch Ausblasen zur Erhohung desAuftriebes, Technische U niversitat B raunschweig, doctoral th e sis, 1961. ) ( [8] Korner, H. and L ohr, R .: Dreikomponentenmessungen am Mode l l eines leichten STOL-Flugzeuges mitAusblasen i n Fliigeltiefenrichtun g , Deutsche Forschungs- un d Versuchsanstal t fir Luf t -und Raumfahrt,DLR-FB 7 5 -74, 1975. ) ( [9] Englar, R. J . : Overiew o f c i rculation control p neumatic aerodynamics: Blo w n force and mome n t aug-mentation and modification as ap p lied primarily to fixed-wing aircraft, I n : J o slin, D., Jones, G . S. ( e di-tors): Applications of circulation control technology, P rogress in Astronautics and Ae r onautics, Vol.214,AIAA, 2006, pp.23-68. ) ( [10] Lot h , J . L . : Aduantages of combining BLC suction with c ircu l ation contr o l high-lift gen e ration, In:Joslin, D., Jones, G. S . (editors): Applications of circulation control technology, Progress in Astronauticsand Aeronautics, Vol.214, AIAA, 2 006, p p.3-21. ) ( [11] Jones, G. S . , Yao, C.-S. and Allan, B. G.: Experimental inuestigation o fa 2D supercritical c irculation-cotrol airfoi l using particle image velocimetry, AIAA Paper 2006-3009, 20 0 6. ) ( 12 B a ker, W. J. and Pat e rson, E. G . : S imu l ation of stead y circulation contr o l for the g e neral aviat i oncirculatio n control (GACC) wing, 200 4 NASA-ONR Circulation Control Workshop, March 20 0 4. ) ( [13] Slomski, J . F.,Chang, P. A. and Arunajatesan, S.: La r ge eddy simulation ofa circulation control airfoil,2004 NASA-ONR Circulation Workshop, March 2004. ) ( [1 4 ] Pfingsten, K . C . and Ra d espiel, R . : Num e rical Simu l ation of a win g w ith a gaples s high-l i ft systemusing circulation control, Notes on Numerical F l uid Mechanics and Multidisciplinary Design, Vol. 96, C. T ropea, S pringer, B erlin, 2 007. ) ( [15] Pfingsten, K. C. and Radespiel, R.: Experimental and Numerical Inuestigation of a C i rculation ControlAirfoi l ., AIAA Paper 2009-533, 47th AIAA A e rospace Sciences Meeting, Orlando,Flor i da,2009. ) ( [16] Kahler, C. J., Scholz, U. and Ortmanns, J . : W a ll-shear-stress and near-wall turbulence measurementsup to single picel resolution b y means of long-distance micro-PIV, Exp. F l uids 41,2006, Springer 2 006. ) ( [17] Englar, R.J. and Hemmerly, R .A.: D esign of the c irculation control wing STOL demonstrator a i rcraft,AIAA Journal of Aircraft Vol.18, No. 1, 1 981, p p. 5 1-58. ) ( [18] Kruse, M . and Radespiel, R.: Measurement ofa laminar separation bubble on a swept horizontal tailplaneusing uPIV, A IAA Paper 20 0 8-4054, 38 t h Fl u id Dy n amics Conference, Seattle, Washington, 2008. ) ( [19 DLR: Technical l . Documentation of the DLR TAU-Code. Institut fiir Aerodynamik und Stromungsmechanik, B r aunschweig, Gottingen, 20 0 6. ) ( [20] Gerhold, T. : Overuiew of the hybr i d RANS code TAU, MEGAFLOW-Numerical Flow Simulation forAircraft Design Vol.89 S pringer-Verlag, 2 005 (N o tes on Num e rical Fluid Mechanics and MultidisciplinaryDesign), p p.81-92. ) ( [21] Spalart, P. R. and Allmaras, S . R .: A one-equation t u rbulence model for aerodynamic fo w s, AIA A 92-043, 1 992. ) ( [22] Pfingsten, K. C ., Jensch, C .,Korber, K. W. and R. Radespiel: Numerical simulation of th e flow a roundcirculation control airfoils, First CEAS European A i r and Sp a ce Conference, Berlin, 200 7 . ) ( [23] Swanson, R . C. and R u msey, C. L.: Numerical issues for circulation co n trol calculations, AIAA Paper2006-3008, 2 006. ) ( [24] Shur, M. L . , Strelets , M. K., Travin, A. K. and Spalart, P. R.: Turbulence modeling in r otating andcurued channels: A ssessing the S palart-Shur correction, AIAA J o urnal, V o l.38, No. 5 , 2000, pp. 784-792. ) Figure 1: Basic transonic airfoil (not to scale) Figure 2: Design of the large high-lift flap Figure 3: Wind tunnel model with circulation control ducts (c/cflap =0.3,h/c=0.001,n=40°,b/c=4.3) Figure 4: Dynamic pressure distribution in spanwise direction at a position 0.01m downstream of the slot Figure 5: cp-distribution for a=0°,Mao=0.15,Re=1·10° Figure 6: cp-distribution for cp=0.045, Ma.。=0.15,Re=1.10° Figure 7: cn over a for different momentum coefficients (Ma=0.15, Re=1·10) Figure 8: Cn over cu for an angle of attack of a=3°(Ma=0.15,Re=1.10) Figure 9: Measured velocity field at the slot for cp=0.037 and α=3°(Ma.o=0.15,Re=1.10) Figure 10: Measured velocity field at the Coanda surface for cp=0.037 and α=3°(Ma.o=0.15,Re=1-10) Figure 11: Measured velocity field at the trailing edge for cp=0.037 and a=3°(Ma.。=0.15, Re =1.10) Figure 12: Measured velocity field at the slot for cu=0.043 and a=3°(Ma=0.15, Re=1·10) Figure 13: Measured velocity field at the Coanda surface for cp=0.043 and α=3°(Ma.。=0.15, Re=110) Figure 14: Measured velocity field at the trailing edge for cp=0.043 and a=3°(Ma.。=0.15, Re =1.10) Figure 15: Spatial discretization of the wind tunnel measurement section Figure 16: Spatial discretization of the circulation control airfoil Figure 17: cp-distribution and surface streamlines on the wing with circulation control: Re=1·106, Ma=0.15,Cflap/c=0.3,n=40°,a=0°, cu=0.045, cz=3.04, cD = 0.097, CM,1/4= -0.55 x/c Figure 18: cp-distribution for a=-5, Ma.=0.15, Re=1·10 (SA turbulence model) x/c Figure 19: c-distribution for a=0°,Ma=0.15, Re=1·106 (SA turbulence model) x/c Figure 20: c-distribution for a=-5°, Ma=0.15, Re=1·10°(SA turbulence model) Figure 21: cp-distribution for a=0°, Ma.=0.15, Re=1·106 (SA turbulence model) Figure 22: Tangential velocity at /c=0.690 for a=0°(Ma,=0.15, Re=1106) Figure 23: Tangential velocity at c/c=0.715 for a=0°(Ma=0.15,Re=1·10) Figure 24: Tangential velocity at c/c=0.755 for a=0°(Ma一=0.15,Re=110)
确定

还剩15页未读,是否继续阅读?

产品配置单


北京欧兰科技发展有限公司为您提供《无缝高升力系统中实验研究检测方案(粒子图像测速)》,该方案主要用于其他中实验研究检测,参考标准--,《无缝高升力系统中实验研究检测方案(粒子图像测速)》用到的仪器有显微粒子成像测速系统(Micro PIV)、Imager sCMOS PIV相机、PLIF平面激光诱导荧光火焰燃烧检测系统
推荐专场


CCD相机/影像CCD
更多


相关方案
更多
该厂商其他方案
更多