


方案详情
文
This paper presents observations and analysis of the time-dependent behaviour of a 10 kW
partially pre-mixed, swirl stabilized methane-air flame exhibiting self-excited thermo-acoustic
oscillations. This analysis is based on a series of measurements wherein particle image
velocimetry (PIV) and planar laser-induced fluorescence (PLIF) of the OH radical were
performed simultaneously at 5 kHz repetition rate over durations of 0.8s. Chemiluminescence
imaging of the OH* radical was performed separately, also at 5 kHz over 0.8s acquisition
runs. These measurements were of sufficient sampling frequency and duration to extract
usable spatial and temporal frequency information on the medium to large-scale flow-field
and heat-release characteristics of the flame. This analysis is used to more fully characterize
the interaction between the self-excited thermo-acoustic oscillations and the dominant flowfield
structure of this flame, a precessing vortex core (PVC) present in the inner recirculation
zone. Interpretation of individual measurement sequences yielded insight into various
physical phenomena and the underlying mechanisms driving flame dynamics. It is observed
for this flame that location of the reaction zone tracks large-scale fluctuations in axial velocity
and also conforms to the passage of large-scale vortical structures through the flow-field.
Local extinction of the reaction zone in regions of persistently high principal compressive
strain is observed. Such extinctions, however, are seen to be self healing and thus do not
induce blow-out. Indications of auto-ignition in regions of unburned gas near the exit are also
observed. Probable auto-ignition events are frequently observed coincident with the centers of
large-scale vortical structures, suggesting the phenomenon is linked to the enhanced mixing
and longer residence times associated with fluid at the core of the PVC as it moves through
the flame.
方案详情

Isaac Boxx, Michael Stohr, Campbell Carter*, Wolfgang Meier, Temporallyresolved planar measurements of transient phenomena in a partially pre-mixedswirl flame in a gas turbine model combustor, Combust. Flame 157 (2010)1510-1525 *Wright Patterson AFB The original publication is available at www.elsevier.com Combustion and FlameAccepted: Dec 16,2009 Temporally resolved planar measurements of transientphenomena in a partially pre-mixed swirl flame in a gas turbinemodel combustor I. Boxx, M. Stohr, C. Carter, W. Meier 1: Institut fur Verbrennungstechnik, Deutsches Zentrum fiir Luft-und Raumfahrt (DLR), Pfaffenwaldring 38-40, D-70569 Stuttgart, Germany2: Air Force Research Laboratory (AFRL)/PRAS1950 Fifth St, Wright-Patterson AFB,OH USA Corresponding Author: Isaac Boxx, Pfaffenwaldring 38-40, D-70569 Stuttgart,Germany, Fax: (+49) 711 6862 578, e-mail: Isaac.Boxx@dlr.de Abstract This paper presents observations and analysis of the time-dependent behaviour of a 10 kWpartially pre-mixed, swirl stabilized methane-air flame exhibiting self-excited thermo-acousticoscillations. This analysis is based on a series of measurements wherein particle imagevelocimetry (PIV) and planar laser-induced fluorescence (PLIF) of the OH radical wereperformed simultaneously at 5 kHz repetition rate over durations of 0.8s. Chemiluminescenceimaging of the OH* radical was performed separately, also at 5 kHz over 0.8s acquisitionruns.These measurements were of sufficient sampling frequency and duration to extractusable spatial and temporal frequency information on the medium to large-scale flow-fieldand heat-release characteristics of the flame. This analysis is used to more fully characterizethe interaction between the self-excited thermo-acoustic oscillations and the dominant flow-field structure of this flame, a precessing vortex core (PVC) present in the inner recirculationzone. Interpretation of individual1 measurement sequences yielded insight into variousphysical phenomena and the underlying mechanisms driving flame dynamics. It is observedfor this flame that location of the reaction zone tracks large-scale fluctuations in axial velocityand also conforms to the passage of large-scale vortical structures through the flow-field.Local extinction of the reaction zone in regions of persistently high principal compressivestrain is observed. Such extinctions, however, are seen to be self healing and thus do notinduce blow-out. Indications of auto-ignition in regions of unburned gas near the exit are alsoobserved. Probable auto-ignition events are frequently observed coincident with the centers oflarge-scale vortical structures, suggesting the phenomenon is linked to the enhanced mixingand longer residence times associated with fluid at the core of the PVC as it moves throughthe flame. Introduction In practical combustors, such as industrial furnaces or gas turbine (GT) combustors, swirling flows are often used because they enable a high energy conversion in a small volumeand exhibit good ignition and stabilization behavior over a wide operating range [Gupta et al.(1984); Syred, et al., (1971); Weber and Dugue (1992)]. Beyond a critical swirl number,vortex breakdown occurs [Gupta et al., (1984); Lucca-Negro and O'Doherty, (2001)] leadingto the establishment of an inner recirculation zone (IRZ) which transports hot combustionproducts and radicals back to the flame base. The mixing of the hot products with theincoming fuel-air mixture speeds up and stabilizes the combustion process, enabling operationover a significantly larger range of fuel/air ratios than may otherwise be possible. Swirlingflowsand flames, however, are also extremely complexxiandsusceptible tovariousinstabilities. On a short time scale the IRZ generated during vortex breakdown does notresemble a solid body vortex at all but is instead composed of many smaller vortices thatappear and disappear rapidly [Ji and Gore, (2002); Stopper, et al. (2008); Stohr, et al. (2009)].Such vortices can arise from the Kelvin-Helmholz instability in the shear-layer andcentrifugal instability induced by the swirl [Wang, et al. (2005)], as well as from randomturbulent fluctuations. Energetic large-scale coherent flow structures also play a key role inthe turbulence-chemistry interaction of such flames. Of particular interest in recent years isthe precessing vortex core (PVC), a three-dimensional unsteady and asymmetric coherentflow structure frequently observed in swirl-stabilized combustors [Froud et al. (1995);Anacleto et al.(2003); Wegner (2004); Syred, (2006); Schildmacher et al., (2006); Fernandeset al., (2006); Valera-Medina et al. (2009)]. This structure tends to appear at the boundary ofthe IRZ and the shear-layer, strongly influencing local flame dynamics [Syred, (2006)]. In the field of GT combustion for power generation, a major goal is a significantreduction of NOx emissions. This has led in recent years to the concept of lean premixed and partially premixed combustion where peak temperatures at near-stoichiometric conditions areavoided [Correa, (1998); Lefebvre, (1999)]. Further, this concept allows the achievement of aquite homogeneous temperature distribution at the turbine inlet and thus reduced thermal load.Unfortunately, lean premixed GT flames are susceptible to thermo-acoustic instabilitiesdriven by the combustion process and sustained by a resonant feedback mechanism couplingpressure and heat release [Keller, (1995); Fernandes, et al. (1996); Paschereit, (1998);Lefebvre (1999); Candel, (2002); Lee and Santavicca, (2003); Syred, (2006), Correa, (1998);Candel, (2002); Lieuwen and Yang, (2005)]. Such oscillations impact the performance,emissions and even structural integrity of GT combustors, and as such, the study of theirfundamental behavior and dynamics remains an area of intense interest. The physical andchemical mechanisms driving the instabilities are based on a complex interaction betweencombustor geometry, pressure, flow-field, mixing, chemical reactions, and heat release. Whileactive and passive control mechanisms have been developed to reduce or even eliminateinstabilities in some industrial burners [Syred, (2006); Docquier and Candel, (2002); Emirisand Whitelaw, (2003); Richards, et al. (2003), Mongia, et al. (2003)], the problem is not yetfully understood at a fundamental level. Another important aspect of GT combustion that is often related to instabilities is thestabilization mechanism of swirled premixed flames. While it is generally known that themixing of hot products from the IRZ into the fresh gas plays an important role, thecontribution from coherent structures such as the PVC (if present) is not well known. Also, itis not clear to what extent autoignition of mixtures of exhaust and fresh gas at elevatedtemperatures occurs or whether flame propagation by (partially) premixed flamelets is thedominant burning mechanism [Sadanandan, et al. (2008); Guttenfelder, et al., (2006)].Previous investigations have shown that local flame extinction occurs frequently in GT-likeflames [Meier, et al.,(2006)]; however, the details of the interaction between a vortex and a flame front have, so far, only been demonstrated for simpler flame configurations[Vagelopoulos and Frank, (2006); Meyer, et al. (2004); Hult, et al. (2005)] and not in GTflames. The complexity of the combustion process in lean, swirl-stabilized GT flames has led in recent years to a trend toward the application of multiple, complementary measuringtechniques, in particular 2D laser measuring techniques. The simultaneous application ofparticle image velocimetry (PIV) and planar laser-induced fluorescence (PLIF) have, forexample, contributed to a better understanding of the flow-field/flame interaction in swirlflames [Petersson, et al. (2007); Tanahashi, et al. (2005); Sadanandan et al. (2008); Stohr et al.(2009)]. Tlhese techniques also provide minimally-intrusive diagnosticss 1i1n otherwiseinaccessible environments such as high-pressure test rigs and combustion chambers. Researchgroups have performed laser-based measurements in high-pressure test rigs with opticalaccess in order to investigate GT combustion processes under realistic conditions, i.e.preheated air, high thermal loads, high turbulence levels and relevant combustor geometries[Lee, et al. (2000); Meier, et al. (2000); Lofstrom, et al. (2000); Gord, et al. (2002); Kojimaand Nguyen, (2004); Willert, et al. (2006), Griebel, et al.(2007); Janus, et al. (2008); Stopper,et al. (2008); Strakey, et al. (2008), Ax, et al. (2009)]. While these investigations havecontributed significantly to a better understanding of certain aspects of GT combustion underpressure, such complex and expensive experiments do not (and, indeed, cannot) result insystematic or comprehensive characterization of swirl flames and are often affected byuncertainties in the boundary conditions, originating, e.g., from limited optical access or acontribution from cooling air to the combustion. Alternatively, the use of model combustorsthat can be operated under laboratory conditions has proven a promising concept to gaininsight into the interplay between the turbulent swirling flow-field and the flame chemistryand to acquire reliable experimental data suitable for model validation. Theuse: of optically accessible, laboratory-scale model combustorsishasbeenparticularly fruitful in the study of thermo-acoustic pulsation in lean swirl-stabilized flames.By combining multiple high-resolution laser measurement techniques with acoustic signalacquisition in a well-controlled system, one may extract phase-resolved velocity and scalarfield data over the dominant acoustic pulsation cycle and thus better understand its underlyingphysical mechanism. Venkataraman et al. [1999] applied phase-resolved imaging of CHchemiluminescence to study flame-vortex interaction and flame surface area changes over thethermo-acousticc ccycle of aleeaanpremixe1d dump combustorand foundd tthaatitswirfundamentally alters the combustion instability. Ayoola et al. [2006] demonstrated theviability of using simultaneous OH and CH2O PLIF to determine the phase-dependent localheat-release rate in turbulent, premixed swirl flames. Using this technique (in addition tophase-resolved imaging of OH* and CH* chemiluminescence and burst-mode highspeed OH-PLIF) Balachandran et al. [2005] studied flame surface density and local heat release rate ofacoustically forced, bluff-body stabilized flames. They observed the flame to wrap aroundpropagating shear-layer vortices, resulting in a transient increase in local flame-surface areaand heat-release rate. This phenomenon was further explored by Bellows et al. [2007], usingphase-resolved OH-PLIF. In addition to the flame / shear-layer vortex interaction, they alsoobserved unsteady flame lift-off during the phase of the acoustic cycle corresponding to peakaxial-velocity and a corresponding decrease in flame-surface area. Subsequent phase-resolvedOH-PLIF imaging in the same burner lead Thumuluru and Liewen [2009] to conclude that theflame response is not controlled by any single process, but rather several competing fluid-mechanical phenomena. The present work focuses on the DLR Dual-Swirl Gas Turbine Model Combustor(GTMC). The GTMC is a research-scale swirl burner developed for the study of thermo-Boxx et al., Combust. Flame (2010). Accepted for Publication Dec. 16, 2009. 6 acoustic oscillationss.aand other aspectss of the turbulence-chemistry interaction undertechnically relevant operating conditions. It consists of a nozzle with two concentric airswirlers fed from a common plenum.The two co-swirling airstreams are separated by anannular ring nozzle supplying liquid or gaseous fuel. The nozzle is mounted in a combustionchamber with almost unrestricted optical access in the visible and ultraviolet regions of thespectrum. The excellent optical access, compact size and moderate thermal load (7-35kW)make this burner ideally suited to both point- and planar-laser measurement techniques. Assuch, it has been the subject of extensive measurement and characterization studies that haverelied extensively on the application of various non-intrusive laser-based measurementtechniques. Giezendanner et al. [2003, 2005a] studied a lean ((=0.75), 10 kW methane-air flamein this burner and observed a strong, self-excited combustion oscillation at a frequency ofapproximately 290Hz.Using planar laser-induced fluorescence (PLIF) of the OH, CH andH2CO)(combustion intermediates. laser Doppler anemometry (LDA) and OH*chemiluminescence imaging, all phase-locked to the dominant oscillation frequency, theydetermined flame zone location and the cyclic variability of parameters in this burner.Furthermore, they found a strong correlation between heat-release rate and axial velocity nearthe nozzle exit. Duan et al.[2005] studied the same (10kW) flame using phase-resolved LDA,Raman scattering and PLIF of OH and CH and measured pronounced (+/-33%) variations infuel and air flow-rates over the thermo-acoustic cycle and significant deviations fromequilibrium compositionand temperatureInear tthhee nozzle. Using two-line OH-PLIFthermometry, Giezendanner et al. [2005b, 2005c] showed these phase-dependent temperaturevariations were most prominent in the IRZ and that the temperature maximum correspondedto the phase of strongest recirculation. \. Weigand et al. [2005] identified the basic feedbackmechanism behind the dominant 290 Hz oscillation in this flame. Using phase-resolved LDA, PLIF, Raman scattering and OH* cheminluminescence imaging, they showed that a phase-dependent mixing rate of hot products from the recirculation zones with the fresh gasinfluenced the heat release rate which, in turn, affected thermal expansion and thus had astrong influence on the flow-field, leading to induced periodic motions of the inner and outerrecirculation zones. Withanunderstanding of the underlying mechanism for the thermo-acousticoscillation in place, research efforts have turned to understanding the physics of theturbulence-chemistry interaction behind this driving mechanism. Weigand et al. [2006]studied three flames in the GTMC: one which burned stably, one oscillating and one close toblowout. Using PLIF of OH and CH, LDA and Raman scattering, they found the flames werenot attached at the fuel nozzle (i.e. were partially premixed) and that despite having quitesimilar mean flow-fields, each displayed significantly different combustion characteristics.They determined the near-field region was dominated by fast mixing and finite-rate chemistryeffects and that combustion occurred in thin (~0.5mm), strongly corrugated reaction zones.Meier et al. [2006] studied the same three flames using Raman scattering to characterize themean temperature, major species concentration and mixture fraction throughout each flame.They found wide variation in local, instantaneous mixture fraction and temperature in thenear-field and determined that fast mixing near the nozzle exit was accompanied by strongturbulence-chemistry interactions in the form of local extinction and ignition delay. In allthree cases, burnout was complete by 50 mm downstream of the nozzle. Meier et al. [2005]studied flames in the GTMC with a global equivalence ratio of 0.75 and Reynolds numbersranging from 7500 - 60,000 to characterize the influence of different degrees of turbulence onthe thermo-chemical state and flame structure. They determined the flames in this burnerexhibit more characteristics of diffusion flames than of a uniformly premixed flame. Stohr and Meier [2006] performed a statistical analysis of particle image velocimetry (PIV)measurements using a proper orthogonal decomposition (POD) to show the flow-field of theGTMC is dominated by large-scale, non-stationary, coherent vortical structures. Theyshowed that chief among these is a precessing helical vortex, which occurs in the regionbetween the IRZ and the incoming gas. Subsequently, Stohr and Meier [2007] used phase-resolved PIV to show the principal motion of the PVC about the vertical axis does notcorrelate with the thermo-acoustic oscillation. However, using simultaneous, phase-resolvedPLIF and PIV, Stohr et al. [2009] observed that the PVC undergoes significant structuralchange during the thermo-acoustic oscillation cycle, particularly in the transverse plane.Taking advantage of the fact that OH is present in super-equilibrium concentration in thereaction zone, Sadanandan et al. [2008] showed that strong gradients in the OH-PLIF signalserve as a useful marker of the reaction zone location in these flames. Applying this principle,they used simultaneous OH-PLIF and PIV in the 10 kW flame to investigate flow-field /reaction zone interactions. They deduced that small vortices in the shear layers at the edge ofthe recirculation zones play an important role in flame stabilization. Previous research, with its extensive reliance upon stochastic and phase-resolvedmeasurement techniques, hasgenerate1d extensive insight into the flow-field, thermo-chemical, thermo-acoustic and operational characteristics of this researchitburner. Anextensive database of high resolution experimental measurements suitable for numerical andcode-validation studies has been acquired. Numerical simulations of the flame underconditions identical to those measured are currently underway [Widenhorn,(2009)].Thorough analysis, in particular using spectral and POD methods, has reinforced insightgained by these techniques. A complete fundamental understanding of the turbulence-chemistry interaction in this flame, however, remains elusive. This is because even the bestphase-averaged measurements only isolate mean and statistical cyclic variations of thermo-dynamic and thermo-chemical properties. Information on temporally developing, transient orBoxx et al., Combust. Flame (2010). Accepted for Publication Dec. 16,2009. 9 non-periodic combustion processes is lost. RANS and URANS simulations are similarlylimited. A fully resolved (temporally and spatially) direct numerical simulation with detailedchemistry and sufficient run duration to be statistically relevant is well beyond the state of theart and will likely remain so well into the future. A logical extension of the phase-resolved measurements and quasi-steady numericalsimulations described above is the acquisition of long-duration, time-resolved measurementsof similar flow-field quantities. As demonstrated by Upatnieks et al. [2004], Steinberg et al.[2008] and Boxx et al. [2009a, 2009b, 2009c], such measurements have the clear benefit ofallowing one to track specific events in the flow-field and reaction zones as they occur,greatly simplifying the interpretation of such data. Acquisition of a statistically significantnumber of cycles (e.g., several 100) per run also renders such interpretations more reliable.Long-duration, temporally resolved measurements also enable one to capture temporallyunpredictable phenomena such as flashback [Konle et al., (2008); Konle and Sattelmayer(2009)], turbulent flame extinction [Bohm et al. (2009)] and misfire events in internalcombustion engines [Fajardo and Sick, (2009)]. The ability to acquire these measurementsover several hundred consecutive cycles also allows a short (absolute) acquisition time. The aim of this paper is to present results from a recent experimental study, whereinwe applied simultaneous 3-component stereoscopic PIV and OH-PLIF at a 5 kHz repetitionrate over long periods (> 0.8 s per run) to study the turbulence-chemistry interaction in apartially premixed, swirl-stabilized turbulent flame generated by the DLR Gas Turbine ModelCombustor. This data is used to identify quasi-instantaneous/phenomenological behavior ofthe flame in the IRZ and inner shear-layer, as well as to extract temporal- and spatial-frequency informationl on 1the turbulence-chemistry interaction therein. Characteristicphenomena related to the PVC / reaction-zone interaction, thermo-acoustic oscillation andgeneral combustion behavior are identified and discussed. Boxx et al., Combust.Flame (2010). Accepted for Publication Dec. 16, 2009. Burner and Flames As the GTMC has been extensively characterized and there exist numerous detaileddescriptions of it in the literature, only a short description is presented here. Figure 1 shows aschematic of the GTMC. It consists of two parts, the combustion chamber and the plenumwith the gas film nozzle. The combustion chamber has a square cross-section measuring 85mm x 85 mm and stands 110 mm tall. The walls of the chamber are quartz plates held at thecorners with Inconel@ alloy posts (dia. 10 mm). The chamber is capped with a steel plate witha central exhaust tube (dia. 40 mm, length 50 mm) over a conical contraction. Dry, roomtemperature air enters the combustion chamber through a central nozzle (diameter 15 mm)and a concentric annular nozzle (i.d. 17 mm, o.d. 25 mm contoured to an o.d. of 40 mm). Theair is co-swirled using two sets of swirl vanes beneath the nozzles. The swirlers are fed froma common plenum. Non-swirling CH4 enters the chamber via a ring of 72 channels (0.5 mm x0.5 mm) located between the two air nozzles. The exit planes of the fuel and central air nozzlestand 4.5 mm below the exit plane of the outer air nozzle. The burner is equipped with multiple ports for pressure transducers and microphones. Inthe present study, only two of the ports were used: one mounted in a corner post of thecombustion chamber at y=16 mm and the other in the wall of the air plenum. The signals ofeach microphone (Briel & Kjaer, Type 4939) were sampled at 20 kHz via a multichannelA/D converter, which also (simultaneously) sampled and logged the trigger signal to theintensifier used with the PLIF detection camera. The flame studied in this work corresponds to that described as “Flame B’in the work ofWeigand et al. [2006]. Fuel and air were metered separately into the burner usingelectromechanical mass flow controllers at rates of 12.3 and 281 g/min, respectively. Thiscorresponds to a flame of 10 kW thermal power output, an equivalence ratio of 0.75 and swirlnumber of 0.55. Approximately 4% of the swirled co-flow air was delivered to the burnerBoxx et al.,Combust. Flame (2010). Accepted for Publication Dec. 16,2009. 11 through a fluidized bed particle seeder. Flow-rates of the fuel and seed and co-flow air weremonitored throughout the experiment via calibration-standard Coriolis mass flowmeters(Siemens Sitrans-FC MassFlo 2100, Model DI-1.5, DI-3 and DI-15 respectively). The burner was operated at 10 kW for at least twenty minutes prior to each experimentrun to allow it to heat up and thermally stabilize. During this warm-up period, no seedparticles were delivered to the air flow. Shortly before a measurement, the bulk air flow wasreduced by approximately 4% and the same amount was metered into the flow via the particleseeder using a separate electromechanical flow controller. This ensured reliable, reproducibleseed density for each run, while minimizing seed-buildup on the combustor windows duringthe warm-up period. Measurement Technique The combined stereo-PIV/OH-PLIF measuring system developed for this work hasbeen described previously [Boxx, et al. (2009a, 2009c)]. As such, only a brief description isprovided here. Planar Laser-Induced Fluorescence The OH-PLIF system consists of a conventional (albeit modified) frequency-doubled dyelaser and an intensified CMOS camera. The dye laser (Sirah Cobra-Stretch HRR, usingRhodamine 6G in ethanol) was pumped with a frequency-doubled, Q-switched, diode-pumped solid state Nd:YLF laser (Edgewave IS-811E). At 5 kHz, the pump laser delivered3.8 mJ/pulse (19 W average output) at 523 nm and had an 8.5 ns pulse duration. At 5 kHz, thetime-average output from the dye laser at 283.2 nm was ≈0.5 W or 100 pJ/pulse. The laserline width at 566 nm was 0.06 cm°. Wavelength tuning of the dye laser to the peak of theisolated Qi(7) line of the A-X (1-0) transition of OH was checked daily using a setupconsisting ofa laminar reference flame and a photomultiplier tube for fluorescence detection. The 283.2 nm beam was formed into a sheet of ~40 mm (high in the probe region) usingtwoo fused silica tl elnesnesse s( (fplifl =-25 mm, fplif2 =250 mm) in a cylindrical telescopeconfiguration and focused to a waist using a third cylindrical lens (fplif3=500 mm).The283 nm laser sheet was overlapped with the PIV laser sheet using a pair of dichroic mirrors(see Fig. 1). The PIV and PLIF sheets were overlapped in the near and far fields and also inthe probe region; this process was checked daily, and the overlap was found to be consistentlyvery good. Sheet thicknesses were measured by translating a narrow slit through each beamand using a photodiode to record the spatial distribution; with this approach the 283 nm beamwas determined to be ~400 um at the probe volume. Fluorescence signal was acquired with a CMOS camera (LaVision HSS6), external two-stage, lens-coupled intensifier (LaVision HS-IRO) and a fast Cerco 45mm, f/1.8 lens that isAR coated for the UV. Background luminosity was reduced using a 500 ns intensifier gateand elastic (particle) scattering at 283 nm was blocked using a high-transmission (> 80% at310 nm) bandpass interference filter (Custom fabrication - Laser Components GmbH) and acolor glass filter (1 mm thick WG295 Schott glass). A correction/calibration for spatialvariation of the laser sheet-intensity and camera/intensifier sensitivity was accomplishedusing a mean image derived from laser-induced fluorescence of acetone in the quartz-plateduct near the jet-exit. Run-to-run background and camera noise (equivalent to ~ 1% of thedynamic range) were corrected using a 1000 frame ensemble average acquired while thelasers were blocked. Particle Image Velocimetry The stereoscopic PIVsystem is tbased on a dual-cavity, diode-pumped, solid stateNd:YAG laser (Edgewave, IS-611DE) and a pair of CMOS cameras (LaVision HSS5). Thelaser produces 2.6 mJ/pulse at 532 nm at a repetition rate up to 10 kHz. As the laser is pulse-energy (as opposed to quasi-cw average power) limited, this corresponds to 13 W per head at5 kHz. Pulse duration is ~ 14 ns. Pulse timing separation for the PIV system was △t =20 us, Boxx et al., Combust.Flame (2010). Accepted for Publication Dec. 16, 2009. with the OH-PLIF excitation pulse temporally interlaced between the first and second PIVpulses of each measurement cycle. As with the PLIF system, three cylindrical lenses were used to form the sheet: fpivl=-25mm,fpiv2=300mm, and fpiv3=1000 mm. To minimize noise arising from inter-frame particledropout, the beam waist was located somewhat beyond the probe region.The sheetthicknesses were measured in the same manner as for the PLIF beam; at the probe volume, thesheet thicknesses were ≤ 0.7 mm. Mie scattering from titanium dioxide (TiO2) particles(nominal diameter 0.5 um) seeded into the flow was imaged using the pair of CMOS camerasmounted equidistant from opposite sides of the laser sheet (see Fig. 1). Each PIV camera hassufficient on-board memory (2.6 GB) for 4096 dual-frame images (i.e., 0.8 seconds imaging)at 512× 512 pixel resolution. For both PIV cameras, scattered light was collected with aTokina 100-mm focal length lens with the f-stop set to f/5.6, and image-blur due to off-axisdefocusing wasCcorrected using a Scheimpflug adaptor between the lens and camera.Perspective distortion was corrected using a dual-plane, three dimensional imaging target(LaVision Type 7). The same target was used to map the fields of view of the stereoscopicPIV and PLIF systems to one another. Image mapping, calibration, and particle cross-correlations were completed using a commercial, multi-pass adaptive window offset cross-correlation algorithm (LaVision DaVis 7.2). Final window size and overlap were 16x 16pixels and 50%, respectively. This corresponds to a spatial resolution of 1 mm and vectorspacing of 0.5 mm. Based on the ±0.1 pixel uncertainty of the cross-correlation peak-findingalgorithm, the random uncertainty of the PIV measurements is estimated to be ± 0.3 m/s. Results and Discussion Figure 2a shows a mean flow-field of the GTMC, acquired using a lower repetition-rate PIV system with a larger field of view. Although acquired with a different measurementsystem as part of another study, this figure shows the dominant flow-field characteristics ofBoxx et al., Combust. Flame (2010). Accepted for Publication Dec. 16, 2009. 14 the combustor. The flow swirls counter-clockwise about the vertical axis (as viewed fromabove) and the highest flow velocities are seen in the conically shaped inflow of fresh gases.The velocity values in the measurement plane are indicated by the arrows and the out-of-planecomponent (Vz) by the color bar. The flow-field is further characterized by a strong IRZ.There also exists a weaker, outer recirculation zone (ORZ), appearing in the lower cornerregions of the burner. This zone results from the confinement effect of the combustionchamber and is known to also play a role in flame stabilization. There exist two shear layers;one between the inflow and the IRZ and one between the inflow and the ORZ. With hotcombustion products being continuously mixed with the fresh fuel-air mixture in the innershear-layer (ISL), combustion is stabilized and the flame tends to reside there. However, aswill be shown later, combustion does frequently occur beyond the ISL, and the turbulence-chemistry interaction is frequently strong enough to force the reaction zone well beyond themean-shear-layer region. Figure 2b shows a mean velocity field acquired with the currentsystem, illustrating the relative field of view and spatial resolution. Also shown in this Fig.2b are the locations of the three monitor points used to determine the power spectra of axialvelocity discussed later in the paper. Figure 3a shows an OH-PLIF image acquired during this study. As noted earlier, theimaging region extends from one side of the combustion chamber to the other, spanningapproximately 85 mm. The laser sheet extends from the exit plane to approximately 40 mmdownstream. Mean background flame luminosity has been subtracted and spatial non-uniformity of the laser sheet and imaging system response have also been corrected, as notedabove. In this figure, the regions without OH (dark) representgas; at low-to-mediumtemperatures (T <1500 K), e.g. fresh fuel/air mixtures, possibly with some admixture ofburned gas. From Raman measurements in the same flame, it is known that there is asignificant mixing of exhaust gas with fresh gas near the nozzle and the burned/unburned gasmixture can cover a wide temperature range (300->1500 K). The light-grey regions (i.e.Boxx et al., Combust. Flame (2010). Accepted for Publication Dec. 16,2009. 15 those with moderate-to-high OH signal levels) within the IRZ and ORZ consist primarily ofgas at high temperature (> 1500 K). The brightest regions of the image are indicative ofregions containing super-equilibrium concentrations of OH. Although OH concentrationsdecay in the high temperature gas over a significantly longer timescale than that of thereactions in the flame front, the OH-PLIF signal may nonetheless be used to determinereaction zone location. Sadanandan, et al. [2008] showed that, for this flame, the largestmagnitude OH-gradients result from super-equilibrium concentrations of OH and are thusrepresentative of the reaction zone of the flame. Lower magnitude OH-gradients downstreamof the contiguous reaction zone tend to be indicative of mixing and diffusion of OH as itmoves away from the reaction zones and from mixing of hot combustion products in the IRZ.Figure 3b shows the PLIF image from Fig. 3a after the application of a Sobel gradient-filter.Consistent with previous studies on this flame, the reaction zone is seen to be highlycorrugated, continuous over several centimeters and to reside primarily in the shear-layerbetween the IRZ and the incoming unburned gas. A lower magnitude gradient is seen at theinterface between the ORZ and the unburned gas, probably representing a non-reactingmixture of high- and low-temperature gases. Power Spectra Figure 4 shows the power spectra of the axial component of velocity, measured at threemonitor points (see Fig. 2). The monitor points correspond to locations within the ISL (a), theIRZ (b) and the jet (C). The plotted data represent the average power spectra of measurementsacquired over seven separate acquisition runs or approximately 5.6 seconds. Also shown inFigure 4 are the power spectra of the chemiluminescence (d) and the acoustic (e) signals. Theacoustic data reveal a strong peak centered at 308 Hz, with run-to-run variation in peaklocation of approximately +/- 4Hz.. Astrongpeakat308 Hz is also visible inBoxx et al., Combust. Flame (2010). Accepted for Publication Dec. 16, 2009. 16 chemilumenscence, IRZ and jet axial-velocity power spectra. This peak clearly corresponds tothe dominant thermo-acoustic pulsation frequency for this flame. We note this frequencydiffers from the 290-295 Hz measured in previous studies; however, the absolute differenceis only 4%. Furthermore, the fact that the peak appears at the same frequency in the acoustic,velocity and chemiluminescence data indicates measurement error or data aliasing is not thecause of this shift. Rather, the difference is believed to arise from sensitivity of the thermo-acoustic pulsation to boundary conditions such asambient temperature andd pressureconditions and to deviations of mass flow rates within measurement uncertainty. These spectra yield significant insight into the global dynamics of the flame. As notedabove, there exists a strong peak in the acoustic, chemiluminescence and IRZ velocity spectraat 308 Hz, confirming the thermo-acoustic pulsation is a dominant parameter in this flame.However, there also exist strong secondary peaks in the velocity spectra at the jet and IRZlocations and a different primary peak altogether in the ISL, indicating the presence of othersignificant fluid dynamic phenomena. The dominant peak in the power spectrum of axialvelocity for the ISL lies at 515 Hz. The power spectrum of axial velocity within the jet andIRZ also shows clear secondary peaks at 515 Hz, further indicating the presence of a strong,periodic flow structure in the flame. The peak (at 515 Hz) in the axial velocity spectra islikely the result of the helical, precessing vortex core (PVC) previously identified by Stohrand Meier [2006, 2007]. A helical PVC is a long, tornado-like coherent vortical structurewhich corkscrews about the vertical axis of the flame. The presence of such structures inreacting swirl flows was predicted in the numerical work of [Roux et al., (2005)] andconfirmed experimentally by Stohr and Meier [2006, 2007]. The PVC was seen to reside inthe ISL between the incoming unburned gases and the IRZ and its presence would explain thestrong peak in the axial velocity spectra there. No equivalent peak is visible in the acoustic or chemiluminescence spectra. Aschemiluminescence and thermo-acoustic pulsation are related primarily by time-dependentBoxx et al., Combust. Flame (2010). Accepted for Publication Dec. 16, 2009. 17 variations in heat-release, this suggests the PVC is primarily fluid-dynamic in nature and doesnot directly impact the global heat-release rate of the flame. This is consistent with the findingof Stohr and Meier [2007], who determined the principal motion of the PVC not to be directlycorrelated with the thermo-acoustic oscillation. This does not, however, indicate the two actindependently. The spectra for both the jet and ISL locations show a small secondary peak at205-210 Hz. The magnitude of the difference (305-310 Hz) in peak frequency from that ofthe PVC indicates a superposition of the effects of both phenomena. It is not clear from thisdata whether the two are coupled or simply superimposed. Stohr et al. [2009] observed a(thermo-acoustic-driven) phase-dependent variation in the flow structure in the transverse (x-z) plane of the combustor chamber, with the unburned gas varying from an annular to a spiralconfiguration. Although this was not observed to fundamentally alter the nature of the helicalPVC, it may affect the in-plane dynamics of it. Such an effect could explain the secondarypeak we see in the axial velocity spectra. POD Analysis To better characterize the nature of the fluid-dynamic phenomena responsible for the peaks inthe power spectra, a proper orthogonal decomposition (POD) based analysis was performedon the PIV data. POD is a well-established technique in the field of fluid mechanics [Berkooz,et al.(1993)]. The result of the POD is a set of orthogonal eigenmodes, representing coherentflow structures ordered by their contribution to the turbulent kinetic energy. For eacheigenmode, temporal mode coefficients can be obtained by taking the scalar products of theinstantaneous flow-fields with the eigenmode. In the present case, the POD was calculatedusing the method of snapshots [Sirovich, (1987)] based on the time-series of 2048 flow-fieldmeasurements. From the temporal mode coefficients of the first three eigenmodes (and the knowntemporal separation between frames), the corresponding power spectra were determined.Boxx et al., Combust. Flame (2010). Accepted for Publication Dec. 16, 2009. 18 These spectra are presented in Figure 5. The spectra of eigenmodes 1 and 2 show a strongpeak at 514 Hz. Comparing this to the power spectra of axial velocity taken in the ISL, it isclear this peak corresponds to the same characteristic flow structure. Similarly, the spectraalso show secondary peaks at 205 and 822 Hz (or approximately +/-308 Hz, the thermo-acoustic frequency). Vector plots of the first and second spatial eigenmodes are shown in Figure 6.Consistent with the findings of Stohr and Meier [2006], these two eigenmodes reveal a seriesof vortices oriented symmetrically about the central axis. Although the field of view of thePIVnmeasurementsisIlSimited to ~30 mm and is positioned asymmetrically about thecenterline, these eigenmodes yield important insight into the global flow-field structure.Examination of the major vortices present in the first eigenmode reveals that both rotate in thesame direction; counter-clockwise. The dominant vortices in the second eigenmode also bothrotate counter-clockwise. However, the streamlines also indicate a pair of smaller, clockwise-rotating vortices at x=+/-5 mm,y=0 mm in the second spatial eigenmode. When the firsttwoo eigenmodesaratre superimposedo no nt hteh emean flow-fieldl with the correspondingmultiplicative (scalar) constants, one sees the alternating “zig-zag”pattern characteristic ofthe PVC. This finding is consistent with that of Stohr and Meier [2006], who showed the low-order (i.e., the most energetic) eigenmodes of a set of 200 statistically uncorrelated PIVmeasurements acquired in a similar flame in the same burner represent a helical PVC. Areconstruction of consecutive flow-field measurements based on just the first two eigenmodesclearly shows the oscillating pattern of vortex appearance and propagation one would expectfrom a two dimensional (planar) cut through a helical PVC located about the central axis ofthe nozzle. Thus, the first two eigenmodes clearly represent the PVC and indicate it is thedominant vortical structure in this flow-field. The power spectrum of the multiplicative constants for the third eigenmode shows astrong peak at 308 Hz, indicating this mode corresponds to the thermo-acoustic oscillationBoxx et al., Combust. Flame (2010). Accepted for Publication Dec. 16, 2009. 19 cycle. The vector field representation of the third spatial eigenmode (shown in Fig. 6) showsno clear evidence of vortices. Rather, it appears to show primarily up-down movement alongthe central (vertical) axis and a spreading near the nozzle, where high-velocity, swirled freshgas enters the chamber. This suggests the thermoacoustic oscillation acts primarily in an up-down or ‘piston-like’motion along the central vertical axis but does not result in theformation of coherent vortical structures. This is consistent with the work of Weigand et al.[2006], who showed the thermoacoustic oscillation results in a wider, flatter flame zonecompared to cases without significant oscillations. The POD analysis shows, as expected from previous studies, the dominant flow-fieldstructures in this flame are a helical PVC and a thermo-acoustic oscillation that actspredominantly along the vertical axis. Secondary peaks in the spectra indicate an interactionbetween the themoacoustic pulsation and the PVC, the nature of which is not immediatelyclear. The power of applying the POD to time-resolved planar measurements such as these isthat it allows(one to directly determine spatio-temporal scale, frequency and phaseinformation about specific flow structures and to track their progression through the datasequence. Phenomenological Data In addition to extracting frequency and structural information via analysis of time seriesmeasurements, inspection of individual measurement sequences yields significant new insightinto turbulence-chemistry interaction of the flame. Presented below is a sample measurementsequence acquired over 3 ms or approximately one thermo-acoustic cycle. It illustratesphenomena ranging from vortex-flame interaction and local flame extinction to burnout ofunreacted gas downstream of the reaction zone and probable auto-ignition events upstream of it. The simultaneous acquisition of both a reaction zone marker and three component velocityfield data enables mutually reinforcing interpretations of each observed phenomenon. OH PLIF Figure 8a shows a sequence of 15 consecutive images of OH-PLIF, corresponding to about 1cycle of the thermo-acoustic oscillation. The images in this sequence were cropped to includeonly the region of overlap between the OH-PLIF and the PIV measurements. The highest OHLIF signals are found in the region y <20 mm, where reactions predominantly take place. Thesuper-equilibrium concentrations of OH formed in the reaction zones decay towardsequilibrium levels over several milliseconds [Sadanandan et al., (2008)]. During this time, atthe flow velocities present in the flame, a pocket of gas would convect by 10-20 mmdownstream. The highest OH LIF signal levels can thus be regarded as representative of“young”OH, i.e. OH which has just been formed in the reaction zone.Thus, furtherdownstream, the OH concentrations are expected to be close to equilibrium levels. However itshould be noted that the local temperature and composition can also influence OH numberdensity and thus signal intensity. Even absent the simultaneously acquired velocity field data, this sequence iisillustrative of the complexity of the instantaneous OH field compared to that seen in phase-averaged measurements. In the first three frames, the reaction zone moves upstream,elongates and moves to the left of centerline, before flattening and moving downstream againby frame 6. In frames 7 to 10, the reaction zone again moves upstream, this time extending tothe right of centerline. In frame 7, two isolated pockets of OH appear near the exit plane ofthe nozzle (y~5mm,x~3-8 mm). These pockets of OH are not part of the contiguous, in-plane OH field, indicating they either appear from through-plane flame propagation, through-plane bulk transport, or auto-ignition of the fuel-air mixture near the exit. These regions ofOH grow and merge with the contiguous flame front over the next several frames. Another Boxx et al., Combust. Flame (2010). Accepted for Publication Dec. 16,2009. example of an isolated OH pocket appears in frame 15. In frames 11 and 12, we see a rapiddecrease in OH signal magnitude along the light-dark interface on the left hand side of theimage, indicating, presumably, local extinction of the flame. The extinguished region movesdownstream and grows larger before beginning to recover near the final frame. Figure 7 shows the measured pressure signal acquired simultaneously with the PIV /PLIF measurements. It is important to note that the PIV /PLIF measurements were acquiredat constant frame-rate simultaneously with the acoustic signal but were not synchronized to it.The points shown along the curve correspond to the measured point along the acoustic cyclespecific to each frame in Fig. 8a. With that in mind, Fig. 7 demonstrates that the OH PLIFimage sequence shown in Fig. 8a behaves in a manner consistent with what one would expectfrom the phase-averaged measurements of Giezendanner et al. [2003]. For example, the OH-containing region reaches its maximum upstream position in frames 2 through 5, whichsurround the negative maximum on the acoustic cycle. The OH zone dims and moves axiallydownstream in frames 6 through 10, corresponding to the rise of the acoustic cycle. Largeregions of high OH concentration are visible downstream and to the right of centerline inframes 11 - 15, the region surrounding the positive peak of the acoustic cycle. Qualitativelysimilar characteristics are apparent in phase-averaged OH LIF measurements of Giezendanneret al. [2003]. Although it is beyond the scope of the present work, Fig. 7 also demonstratesthat it is possible to phase-average the OH LIF and PIV measurements in post-processing inorder to directly compare them to earlier phase-resolved measurements acquired at muchlower frame rates. OH Gradient Field Figure 8b shows the same sequence after application of a Sobel gradient filter. Consistentwith previous studies, the largest magnitude gradients in the OH field observable in thesemeasurements occur in thin regions along the interface between the incoming unburned gasBoxx et al., Combust. Flame (2010). Accepted for Publication Dec. 16,2009. 22 and the IRZ. Sadanandan, et al. [2008] have shown that for this flame the largest magnitudegradients result from super-equilibrium concentrations of OH and are thus representative ofthe reaction zone of the flame. Lower magnitude gradients downstream of the contiguousreaction zone are indicative of mixing and diffusion of OH as it moves away from the reactionzones and from mixing of hot combustion products in the IRZ. In the upper left hand side of images 1 through 3 there exists a region withoutmeasurable quantities of OH downstream of the contiguous reaction zone. Although notvisible in the displayed images, this region was observed to result from the engulfment of aregion of unburned gas near the nozzle during a large fluctuation of the flame sheet. The rapiddecay and disappearance of this region indicates either burnout or mixing of unburned gaswith combustion products before eventually burning out downstream. The relatively lowmagnitude gradient in the OH field compared to those in the contiguous reaction zoneupstream suggests burn-out occurs there under unfavorable (e.g. very lean) conditions. Flame Location Figures 8c and d show the reaction zone location (based on a threshold outlining the highestmagnitude OH-gradients) overlaid on the contours of axial- and through-plane velocity,respectively. The vectors overlaid on top represent the in-plane components of velocity. Forclarity, the vector overlay shows only every second computed vector. In Figs. 8c and d, theredbackground contoursts rrepresent strong positive axial- and through-planee velocity,respectively. Green represents low- (i.e. near zero, positive or negative) magnitude velocitiesandd blue representsstrongly negative velocities. Prior to display, the velocity fieldmeasurements were processed using a 2048-set POD, which was bandpass-filtered before thevelocity field was reconstructed. The spectrum was cut off after the firstt aleigenmodes, which corresponded to approximately 70% of the energy content of the signal, asthe lack of discernable spatial or temporal structure and very low energy content in the higher Boxx et al., Combust. Flame (2010). Accepted for Publication Dec. 16, 2009. modes indicated primarily noise. This filtering was necessary due to the relatively coursevelocity resolution of the PIV system (~ +/- 0.3 m/s) at low velocity, which (as will bedemonstrated later) locally affects derivative quantities such as vorticity and strain. The flamewas observed to respond primarily to large-scale fluctuations in the flow and the POD is avery effective scale decomposition for the identification of energetic flow structures [Adrian,et al. (2000)]. No significant modification of the mid- to large-scale structure of the velocityfield was observed to result from this filtering. Figure 8c shows the reaction zone to reside primarily in regions of low axial velocity,represented by the green regions in the colour contour. Such regions tend to occur along theinterface between high axial-velocity incoming fluid (i.e., unburned gas from the nozzle) andthe lower- or negative-magnitude axial-velocity fluid in the IRZ. Here the flame is sustainedby the well mixed, unburned incoming gas from the nozzle on one side and the high-temperature, combustion-radical laden burned gas transported from downstream. Althoughtransient effects occasionally drive the reaction zone into regions of high axial velocity, ittends not to remain there. The contour of the reaction zone reaches its maximum upstream position in the lowvelocity region between the shear-layers that are located on either side of the origin. Theflattening and downstream propagation of the reaction zone previously noted in the frames 5through 7 of the OH image sequence clearly correlates to a mass of high axial-velocity gasissuing from the nozzle. As this high axial-velocity fluid exits the measurement region, thereaction zone propagates back upstream coincident with a mass of negative axial-velocityfluid, elongating and wrinkling in the process. Figure 8d shows there is little correlation between the instantaneous spatial location ofthe flame contour and the iso-contours of Vz-velocity, beyond a tendency to also reside inregions of lower velocity magnitude. The relative insensitivity of the flame location to the Vz-Boxx et al., Combust. Flame (2010). Accepted for Publication Dec. 16, 2009. 24 velocity field may be due to lower magnitude fluctuations compared to those of axial velocity,which is strongly affected by the thermo-acoustic oscillation. Flame-Vortex Interaction Figure 8e shows the same measurement sequence overlaid on the instantaneous vorticity fieldin order to better identify vortex-flame interaction. In frames 1 through 5, a vortical structureof approximately 8-10 mm diameter appears to the left of the origin and propagatesdownstream. In frames 5 through 10, a vortical structure of similar size and strength, albeit ofthe opposite magnitude, appears (also below the flame surface) to the right of the centerlineand likewise propagates up through the field ofview. Based on the POD analysis describedearlier and the timescale over which this pair of vortices appear (~2 ms), it is clear thesestructures represent planar slices of the three-dimensional PVC structure. The effect of the PVC on the reaction zone in this image sequence is clear. Thereaction zone conforms to the passage of the large-scale vortical structures as they appear andmove downstream. As noted previously, the flame sheet remains in the low-velocity peripheryof the vortices, but is clearly influenced by the passage of the structures. In frames 1-7, thereaction zone moves upstream and to the left, elongating and wrapping around the vortex. Byframe 6, the center of the vortex has moved several millimetres from the reaction zone andhas decreased in diameter, suggesting that heat-release and dilatation around the flame hasdiminished the strength of the vortex. In frames 7 through 11, a similar movement of thereaction zone relative to the vortex structure to the right side of the vertical axis is observable.In this instance, however, the motion of the reaction zone is complicated by the appearance ofseveral isolated pockets of OH upstream of the contiguous reaction zone, which grow andinteract with the local flow-field. The image sequence shows the shape and instantaneous spatial position of the reactionzone is significantly affected by the local dynamics of both the PVC and the thermo-acousticoscillation. Whereas the thermo-acoustic oscillation is a dominant parameter affecting axialvelocity fluctuations and thus the absolute axial location of the reaction zone, the tendency ofthe flame to conform to the passage of large-scale vortices indicates the shape or wrinklednessof the flame is significantly affected by the PVC. Although Stohr and Meier [2007]determined the principal motion of the PVC does not correlate to the thermo-acousticoscillation, the simultaneous effect of both on the shape and location of the reaction zone,together with the stabilizing effect of local heat-release by a flame suggests the two are locallycoupled near the nozzle exit. The secondary peaks observed in the velocity spectra at the jet-and shear-layer monitor are consistent with a local coupling between the PVC and thermo-acoustic oscillation. Local Extinction In frame 11 of the image sequence,a break appears in the reaction zone at approximately7 mm to the left of centreline, and 14 mm downstream of the exit plane. Although the exactsize and centerpoint of the break will inevitably be sensitive to the magnitude of the thresholdused to determine reaction zone location from the OH gradient field, it is nonetheless clearthat this break is physical, spatially significant and representative of local extinction of thereaction zone. Evidence of local flame extinction has been noted by previous researchers[Meier et al., (2006)], but the dynamics of the process have yet to be fully explored. The reason for this sudden breach in the reaction zone is not immediately clear fromthe velocity or vorticity data. A small region ofhigh axial-velocity fluid is visible near theflame hole in frame 11, but it remains largely overlapped with the flame-sheet rather than thebreach, indicating that fluid exceeding the local flame propagation speed is not a likelyexplanation. Similarly, although through-plane velocity is an important parameter governingBoxx et al.,Combust. Flame (2010). Accepted for Publication Dec. 16,2009. 26 the dynamics of this flame, the breech first appears in a region of relatively low Vz-magnitudefluid, indicating it is not likely to have been swept in from beyond the measuring plane. Thereis no evidence of a large-scale vortical structure in the immediate vicinity of the breach,indicating elongation and distortion of the reaction zone by the PVC does not explain theextinction either. Indeed, as the present measurements do not include temperature or mixturefraction, it is impossible to conclusively determine the cause of this event. The data do,however, yield a promising explanation. Shown in Figure 8f is the reaction zone contour overlaid against contours of minimum2D principal normal strain. Minimum 2D principal normal strain is perhaps the most relevantflow-field metric available in this data set as previous experimental [Rehm and Clemens,(1998); Kothnur and Clemens, (2005)] and numerical [Ashurst et al., (1987)] studies indicatethe largest scalar gradients tend to align with the axis of principal compressive strain and thestrongest dissipation layers form orthogonal to this axis. Local extinction in a turbulentdiffusion flame is frequently observed when a strong scalar dissipation layer crosses thestoichiometric contour [Sutton and Driscoll, (2007)]. The thinnest reaction zones are also tobe found orthogonal to the axis of principal compressive strain [Rehm and Clemens (1998)].Beginning at frame 6, a region of large magnitude (>2000 s ) principal normal strain formsupstream of the reaction zone, near the burner exit. This high strain region remains close tothe reaction zone throughout the subsequent frames until extinction occurs in frame 11.During this period, the reaction zone is observed to re-orient itself, aligning parallel to themajor axis of this high strain region. In frame 10, the high strain region crosses the reactionzone at the location where the reaction zone breech will occur in the next frame. It is wellestablished [Rehm and Clemens (1998)] that turbulent flames frequently experience transientstrains significantly exceeding their steady state extinction values while remaining intact.Bohm et al. [2009] used spatio-temporal conditioning of simultaneous time-resolved PIV and OH PLIF in a turbulent opposed jet flame to show that extinction occurs only after the strainnear the reaction zone exceeds a critical value for a sufficient length of time. In the presentsequence, the region of high principal compressive strain is seen to persist behind the reactionzone over five frames, or approximately one millisecond. This, taken together with the lack ofhigh axial-velocity and/ or vorticity fluid in the immediate vicinity of the breach, suggeststhis region of high 2D principal normal strain is the primary cause of the local flameextinction. Referring back to frame 10 of Fig. 8c, this region of high principal compressivestrain results from the appearance of high axial-velocity fluid near the exit, which thenimpacts the flame sheet. As one sees in Fig.8e, the flame sheet simultaneously elongates andconforms to the passage of a large-scale vortical structure to the right of the centreline.Together, the combination of high axial-velocity unburned gas with a downward propagatingreaction zone results in stagnation point flow. Thus, it appears both the strong axial-velocityoscillation associated with thermo-acoustic pulsation and the movement of the reaction zoneas it conforms to the passage of the PVC in this case combine to generate a high strainstagnation point flow which persists over a sufficiently long period to extinguish the flamelocally. Isolated OH Pockets Afrequently observed phenomenonn in themeasurementt sequences was the suddenappearance of isolated pockets of OH in regions of unburned gas significantly upstream of thecontiguous flame-front. Such pockets, for example, appear in frames 7 and 15 of the imagesequence described above. These pockets of OH either grow in size over the next severalframes before coalescing with the contiguous reaction zone, or rapidly collapse and disappear.For the case where these OH pockets grow, they tend to do so very rapidly, forming highlycorrugated reaction zones. As one can see for the case of the expanding OH pocket appearingin frame 7, there is a rapid increase in reaction zone length about the periphery of suchBoxx et al., Combust. Flame (2010). Accepted for Publication Dec. 16,2009. 28 pockets. As heat release occurs primarily in the vicinity of the reaction zones, the suddenappearance and rapid expansion of these OH pockets may represent an additional mechanismof flame stabilization in this burner. The appearance of isolated pockets of OH in the measurement region can result fromone of two mechanisms, auto-ignition of the fuel-air mixture in a region of unburned gas orpropagation and/or convection of a flame sheet into the field of view from out of plane. Thetendency of turbulent flames to form long ‘fingers’, which may pinch off and burn outseparately from the contiguous flame sheet has been observed in turbulent premixed flames(Filatyev et al., [2005]). Viewed in a plane perpendicular to such a “flame finger", the flamewould appear as an isolated OH-pocket. As the PLIF technique identifies only the presence ofOH and not its source, it is impossible to definitively conclude which mechanism isresponsible for the appearance of such a pocket in any given instance. The extensive dynamicfluctuation of the (in-plane) reaction zone together with the high through-plane velocitiespresent in the swirling flow indicate that the latter mechanism is a convincing explanation forthe sudden appearance of these pockets some of the time. Indeed, the OH pocket seen inframe 7 of the measurement sequence appears in a region of relatively high into-planevelocity, suggesting it may have been transported into the field of view. Evidence from thepresent measurements and previous studies indicate, however, that auto-ignition is also aviable explanation. Figure 9 shows a scatter-plot of the mixture fraction vs. temperature based on single-shot Raman data of Meier et al. [2006] at approximately the same location under identicalflame conditions. Each symbol in the figure represents the result of at single shotmeasurement, and the line displays the relation for adiabatic equilibrium conditions. There isa significant variation in mixture fraction ranging from 0 (pure air) to about 0.15 (equivalenceratio D~3). The scatter in temperature reflects the different thermo-chemical states: non-Boxx et al., Combust. Flame (2010). Accepted for Publication Dec. 16, 2009. 29 reacted mixtures at room temperature, completely reacted mixtures with T close to Tad(probablyy:stemming from the IIRZ)and partiallyreacted sampleswithh intermediatetemperatures. The partially reacted mixtures mostly reflect mixtures of burned gas from therecirculation zones and fresh gas from the nozzle which have not yet reacted. Particularly themixtures exhibiting elevated temperatures can be subject to auto-ignition. Meier et al. [2006]calculated the ignition delay for mixtures of cold CH4-air and adiabatic exhaust gas and foundit be on the order oft<0.5 ms and largely insensitive to mixture fraction for temperaturesnear detection limit of the OH PLIF system, approximately 1500 K. Inspection of the axial-velocity and vorticity fields for this sequence shows the OH pockets in frame 7 first appearnear the center of the large vortex structure propagating up and to right of the centreline inthat frame. The vectors and axial velocity contours in Fig. 8c indicate low absolute velocitymagnitude in the region of the OH pocket. Tracing the progress of the vortex through earlierframes indicates that fluid near the core may experience residence times on the order of amillisecond or more, i.e. greater than the auto-ignition delay, provided the local fluidtemperature is sufficiently high. It was noted previously that the reaction zone conforms to thepassage of this large scale vortex, indicating that fluid at the core may experience significantpre-heating resulting from mixing induced by the vortex. Taken together, these data indicateauto-ignition is a viable explanation for the sudden appearance of this OH pocket. The appearance of isolated OH regions near the center of large-scale vorticalstructures in the unburned gas occurred frequently throughout each measurement run. The OHpocket identified in frame 15, for example, also appears near the core of a large scale vortex.Figure 10 shows a similar measurement sequence acquired during the same imaging run. Thedata in this sequence shows the reaction zone overlaid against a vorticity field determinedfrom velocity data without application of the bandpass filtered POD reconstruction orinterpolation beyond single vector gaps in the vector post-processing algorithms. As expected, this sequence is noisier than the previous one, but the physical interpretation remains thesame. In frame 2 an isolated pocket of OH appears in the measurement plane close to a large-scale vortical structure and in a region of unburned gas away from the contiguous reactionzone. The increased noise makes it difficult to determine how close this OH pocket is to thecenter of the vortex when it appears, but it does nonetheless appear to be associated with thestructure. This region of OH grows rapidly and soon engulfs the vortical structure beforecoalescing with the contiguous reaction zone. As in the previous example, the appearance ofthis OH pocket results in a rapid increase in reaction zone area present in the measurementregion. Conclusions Stereoscopic PIV and OH PLIF were applied simultaneously at a repetition rate of 5 kHz tostudy the dynamics and turbulence-chemistry interaction of a 10kW, swirl-stabilized,methane-air flame exhibiting self-excited thermo-acoustic oscillation. Spatial and temporalfrequency content were extracted via time-series analysis. Interpretation of individualmeasurement sequences yielded physical insight into various relevant combustion phenomenaand the underlying mechanisms driving flame dynamics. The reaction zone was seen to reside primarily in the regions of low axial velocityfluid along the interface between incoming unburned gas and the high-temperature innerrecirculation zone (IRZ). The axial position of the flame front was seen to track large-magnitude axial-velocity fluctuations, while remaining in locally low speed regions of theflow. The reaction zone also conforms to the passage of large scale vortex structuresassociated with a precessing vortex core present within the flow-field. This resulted insignificant wrinkling and corrugation of the reaction zone. Local extinction of the reaction zone occurred frequently along the interface betweenthe incoming gas and IRZ. One mechanism for such extinctions appeared to be high 2Dprincipal compressive strain in the immediate vicinity of the reaction zone that persists overtimescales >1 ms. Under the flow conditions of this study, local extinctions are short-livedand the flame surface is observed to mend quickly after such events. Regions of unburned gasare frequently observed beyond the contiguous reaction zone, resulting from the engulfmentof fluid by the flame during large-scale fluctuations of the IRZ. These regions burn out as theypropagate downstream. Isolated regions of OH appeared frequently in regions of unburned gas away from theContiguous reactionl zonnee.. The evidence indicates that auto-ignitionn isareasonableexplanation for at least some of these events. The rapid expansion of reaction zone lengthassociated with the growth of these flame kernels indicates that they could have a significantimpact on the instantaneous local heat-release rate of the flame. Further, they present anadditional contribution to the stabilization of the flame and, by extension, the drivingmechanism of the thermo-acoustic oscillation. The results presented also demonstrate that the high-speed planar diagnostics system iscapable of providing good quality OH PLIF and PIV measurements at sustained repetitionrates of 5 kHz, enabling the recording of the temporal development of the interaction betweenthe flow-field and the flame-fronts. In this way, the dynamic processes within a GT-relevantswirl flame could be visualized for the first time with sufficient temporal resolution. Asdemonstrated, the results clearly help identify the sequence of events leading to phenomenalike flame-front deformation or local flame extinction. With respect to periodic instabilities,the time series of roughly 4000 correlated images easily allow the determination of thedominant frequencies. In addition, the data sets allow for conditional averaging or averagingwith respect to the phase of the thermo-acoustic or hydrodynamic instability (PVC). In theongoing data evaluation, it is intended to analyze, for example, the influence of the acousticBoxx et al., Combust. Flame (2010). Accepted for Publication Dec. 16,2009. 32 phase on local flame extinction events or on the appearance of isolated OH pockets near thenozzle. Despite the tremendous gain in temporal resolution for simultaneous OH PLIF andstereo PIV measurements compared to conventional low-repetition systems, some ambiguitiesremain in the interpretation of the results stemming from the out-of-plane motion, particularlyin swirl flames. As described, the frequently measured OH pockets, which are isolated withinthe imaged area, might be connected to a larger contiguous flame surface located behind or infront of the interrogation plane. For an unambiguous identification of auto-ignition events inthis flame, it would be necessary to apply one or two additional OH PLIF sheets, eitherparallel or inclined to the original one, and thus this i an1 i: area for future work. References B.O.Ayoola,R. Balachandran, J.H. Frank, E. Mastorakos, C.F. Kaminski. Comb. Flame, 144(2006)1-16. R.J. Adrian, K.T. Christensen, Z.-C. Liu, Exp. Fluids 29 (2000) 275-290. P.M. Anacleto, E.C. Fernandes, M.V. Heitor, S.I. Shtork, Combust. Sci. And Technol. 175(2003) 1369-1388. W.T. Ashurst, A.R. Kerstein, R.M. Kerr, C. H. Gibson, Phys. Fluids 30, (1987), 2343-2353. H. Ax, U. Stopper, W. Meier, M. Aigner, F. Guthe, Proceedings of ASME Turbo Expo 2009,GT2009-59171. R. Balachandran, B.O. Ayoola, C.F. Kaminski, A.P. Dowling, E. Mastorakos. Combust.Flame,143 (2005)37-55. B.D. Bellows, M.K. Bobba, A. Forte, J.M. Seitzman, T. Lieuwen. Proc. Comb. Inst. 31 (2007)3181-3188. G. Berkooz, P. Holmes, J.L. Lumley, Ann. Rev. Fluid Mech., (1993) 539-575. B. Bohm,I. Boxx, C. Kittler, W. Meier, A. Dreizler. Proc. Comb. Inst. 32 (2009) 1647-1654. I. Boxx, M. Stohr, R. Blumenthal, C. Carter, W. Meier, AIAA2009-644, 47th AIAAAerospace Sciences Meeting, 5-8 January (2009a). I. Boxx, C. Heeger, R. Gordon, B. Bohm, A. Dreizler, W. Meier, Combust. Flame, 156(2009b)269-271. I. Boxx, M. Stohr,C. Carter, W. Meier, Appl. Phys B, 95(1) 2009c. 23-29. S. Candel. Proc. Comb. Inst. 29 (2002) 1-28. S. Correa. Proc. Comb. Inst. (1998) 1793-1807. N. Docquier, S. Candel, Prog. Energy Combust. Sci. 28 (2002) 107-150. X. R. Duan, W. Meier, P. Weigand, B. Lehmann, Appl. Phys. B 80 (2005) 389-396. I. Emiris,J.H. Whitelaw, Combust. Sci. Technol. 175 (2003) 157-184. C. Fajardo, V. Sick, Exp. Fluids 46, (2009) 43-53. E.C. Fernandes, M.V. Heitor, in F. Culick, M.V. Heitor, J.H. Whitelaw (Eds.), UnsteadyCombustion, Kluwer Academic press, Dordrecht, 1996. S.A. Filatyev, J.F. Driscoll, C.D. Carter, J.M. Donbar, Combus. Flame 141, (2005) 1-21. D. Froud, T. O'Doherty, N. Syred, Combust. Flame, 100 (1995) 407-412. Boxx et al., Combust. Flame (2010). Accepted for Publication Dec. 16,2009. R. Giezendanner-Thoben, O. Keck, P. Weigand, W. Meier, U. Meier, W. Stricker, M. Aigner,Combust. Sci. Tech. 175 (2003)721-741. R. Giezendanner-Thoben, P. Weigand, X. R. Duan, W. Meier, U. Meier, M. Aigner, B.Lehmann, J.Eng. Gas Turb. Power. 127 (2005a) 492-496. R. Giezendanner-Thoben, U. Meier, W. Meier, M. Aigner,“Phase-Locked TemperatureMeasurements by Two-Line OH PLIF Thermometry of a Self-Excited Combustion Instabilityin a Gas Turbine Model Combustor”, Flow Turb. Combust. 75 (2005b) 317-333. R. Giezendanner-Thoben, U. Meier, W. Meier, J. Heinze, M. Aigner, Appl. Opt. 44 (2005c)6565-6577 J.R. Gord, M.S. Brown, T.R. Meyer, 22nd AIAA Aerodynamic Measurement Technology andGround Testing Conference, 24-26 June 2002, St. Louis,Missouri, paper AIAA 2002-3039 P. Griebel, P. Siewert, P. Jansohn, Proc. Combust. Inst. 31, (2007)3083-3090. A. K. Gupta, D.G. Lilley, N. Syred, Swirl Flows, Abacus Press (1984) W.A. Guttenfelder, M.W. Renfro, N.M. Laurendeau, J. Ji, G.B. Galen, J.P. Gore, Combust.Flame 147 (2006) 11-21. J. Hult, U. Meier, W. Meier, A. Harvey, C.F. Kaminski, Proc. Combust. Inst. 30 (2005) 701-709. B. Janus, A, Dreizler, J. Janicka,Proc.Comb. Inst. 31 (2007)3091-3098. J.Ji, J.P. Gore,Proc. Combust. Inst.29 (2002)861-867. J.J.Keller, AIAA J. 33 (1995) 2280-2287. J. Kojima, Q.-V. Nguyen, Meas. Sci. Technol. 15 (2004) 565-580. M. Konle, T. Sattelmayer, Exp. Fluids. (In Print) DOI 10.1007/s00348-009-0679-5. M. Konle, F. Kiesewetter, T. Sattelmayer, Exp. Fluids 44 (2008) 529-538. P.S. Kothnur, N.T. Clemens, Phys. Fluids 17 (2005) 1-14. S.-Y. Lee, S. Seo,J.C. Broda, S. Pal,R.J. Santoro, Proc. Combust. Inst. 28(2000) 775-782. J.G. Lee, D.A. Santavicca, J. Propulsion and Power 19 (2003)735-750. A.H. Lefebvre, Gas Turbine Combustion, Taylor & Francis, Philadelphia, 1999 T. Lieuwen, V. Yang.Combustion Instabilities in Gas Turbine Engines: OperationalExperience, Fundamental Mechanisms, And Modeling, AIAA (2005). C. Lofstrom, J. Engstrom, M. Richter, C.F. Kaminski, P. Johansson, K. Nyholm, J. Nygren,M. Alden, Proc. ASME Turbo Expo 2000,2000-GT-0124, May 8-11, 2000, Munich,Germany O. Lucca-Negro, T. O'Doherty,Vortex breakdown: a review, Prog. Energy Combust.Sci. 27(2001) 431-481. U.E. Meier, D. Wolff-GaBmann, W. Stricker, Aerosp. Sci. Technol. 4, (2000) 403-414. W. Meier,X.R. Duan, P. Weigand, Proc. Combust. Inst. 30, (2002) 835-842. W. Meier, X. R. Duan, P. Weigand, Combust. Flame 144 (2006) 225-236. H.C. Mongia, T.J. Held, G.C. Hsiao, R.P. Pandalai, J. Propulsion and Power 19 (2003) 822-829. T.R. Meyer, G.J. Fiechtner, S.P. Gogineni, J.C. Rolon, C.D. Carter, J.R. Gord, Exp. Fluids 36(2004)259-267. C.O. Paschereit, E. Gutmark, W. Weisenstein, Combust. Sci. Technol.138 (1998) 213-232. P. Petersson, J. Olofsson, C. Brackmann, H. Seyfried, J. Zetterberg, M. Richter, M. Alden,M.A. Linne, R.K. Cheng, A. Nauert, D. Geyer, A. Dreizler, Appl. Opt. 46, (2007) 3928-3936. J.E. Rehm, N.T. Clemens. Proc. Combust. Inst. 27(1998) 1113-1120. G.A. Richards, D.L. Straub, E.H. Robey,J. Propulsion Power 19 (2003) 795-810. S. Roux, G. Lartigue, T. Poinsot, U. Meier, C. Berat, Comb. Flame, 121, (2005) 40-54. R. Sadanandan, M. Stohr, W. Meier, Appl. Phys. B 90 (2008) 609-618. K.-U. Schildmacher, R. Koch, H.-J. Bauer, Flow, Turb. and Combust. 76 (2006) 177-197. A.M. Steinberg, J.F. Driscoll, S.L. Ceccio, Exp Fluids 44 (2008)985-999. M. Stohr, W. Meier, 12th international symposium on flow visualization (2006) M. Stohr, W. Meier, Proc. Europ. Combust. (2007) M. Stohr, R. Sadanandan, W. Meier, Proc. Comb. Inst. 32 (2009)2925-2932. L. Sirovich. Q. Applied Mathematics. XLV:3 (1987) 561-571. U. Stopper, M. Aigner, W. Meier, R. Sadanandan, M. Stohr, I.S. Kim, Proc. of 2008 ASMETurbo Expo, GT2008-50520 J.A. Sutton, J.F. Driscoll. Proc. Combust. Inst.31 (2007),1487-1495. P.A. Strakey, S.D. Woodruff, T.C. Williams,R.W. Schefer, AIAA J. 46 (2008) 1604-1613. Boxx et al., Combust. Flame (2010). Accepted for Publication Dec. 16,2009. N. Syred, N.A. Chigier, J.M. Beer, Proc. Combust. Inst. 13 (1971), 617-624. N. Syred,Prog. Energy Combust. Sci. 32 (2006) 93-161. M. Tanahashi, S. Murakami, G.-M. Choi, Y. Fukuchi, T. Miyauchi, Proc. Combust. Inst. 30,(2005) 1665-1672. S.K. Thumuluru, T. Lieuwen. Proc. Combust. Inst. 32, (2009) 2893-2900. A. Upatnieks, J.F. Driscoll, C.C. Rasmussen, S.L. Ceccio, Comb. Flame 138 (2004) 259-272. A. Valera-Medina, N. Syred, A. Griffiths, Comb. Flame 156(2009) 1723-1734. C.M. Vagelopoulos, J.H. Frank, Combust. Flame 146 (2006) 572-588. K.K. Venkataraman,L.H. Preston,D.W. Simons, B.J. Lee,J.G. Lee, D.A. Santavicca. J. Prop.Power 15:6 (1999) 909-918. S. Wang, S-Y. Hsieh, V. Yang. Phys. Fluids,17(2005), 045106. R. Weber, J. Dugue, Prog. Energy Combust. Sci. 18 (1992) 349-367. B. Wegner, A. Maltsev, C. Schneider, A. Sadiki, A. Dreizler, J. Janicka. Int.J.Heat and FluidFlow 25, (2004) 528-536. P. Weigand, W. Meier, X. R. Duan, R. Giezendanner-Thoben, U. Meier, Flow Turbul.Combust. 75 (2005)275-292. P. Weigand, W. Meier, X. R. Duan, W. Stricker, M. Aigner, Investigations of swirl flames ina gas turbine model combustor I. Turbulence-chemistry interactions, Combust. Flame 144(2006)205-224. A. Widenhorn, B. Noll, M. Aigner, AIAA 2009-647, 47th AIAA Aerospace SciencesMeeting,5-8 January 2009. C. Willert, C. Hassa, G. Stockhausen, M. Jarius, M. Voges, J. Klinner, Meas. Sci. Technol.17(2006)1670-1679. Acknowledgments Campbell Carter acknowledges support of the Air Force Office of Scientific Research(AFOSR) Windows on Europe Program. Figure Captions Figure 1. a) Experiment configuration. b) Dual-swirl GTMC burner Figure 2. a) Mean centerline flow-field for the burner chamber. b) Mean flow-field withinimaged region, including monitor points used for frequency analysis. Figure 3. a) Sample OH PLIF image. b) OH gradient magnitude Figure 4. Power spectra of axial velocity in a) Inner shear layer (ISL) b) Inner recirculationzone (IRZ)c) jet. Power spectra of d) integrated chemiluminescence and e) acoustic signal Figure 5. Power spectra of POD temporal eigenmodes a) first, b) second and c) third Figure 6. Spatial eigenmodes 1, 2 and 3 of POD. Modes 1 and 2 correspond to the PVC,while 3 corresponds to the thermo-acoustic pulsation. Figure 7. Measured acoustic signal corresponding to sample sequence shown in Fig.8. Figure 8.a) OH PLIF images -time separation = 0.2 ms Figure 8. b) OH Gradient images. Large magnitude gradients indicate reaction zones. FF1ig9ure 8.c) Reaction zones overlaid against contours of axial velocity. For clarity, only everysecond computed vector is plotted in the vector overlay. Figure 8. d) Reaction zones overlaid against contours of Vz-(through plane) velocity. Forclarity, only every second computed vector is plotted in the vector overlay. Figure 8. e) Reaction zones overlaid against contours of vorticity Figure 8. f) Reaction zones overlaid against contours of minimum principle normal strain Figure 9. Scatter plot of data acquired by Meier et al. [2006] showing evidence of autoignition around location where isolated OH pockets appear in the image sequences. Figure 10. Development of isolated OH pocket (first evident near x=-5 mm in frame 2),overlaid on unfiltered vorticity data. Figure 1. a) Experiment configuration. b) Dual-swirl GTMC burner X (mm)(a) (b) Figure 2. a) Mean centerline flow-field for the burner chamber. b) Mean flow-field within imagedregion, including monitor points used for frequency analysis. 40- intensity 8000 7200 EE 30 6400 5600 20- 4800 4000 > 3200 10- 2400 1600 800 0 -40 -20 0 20X (mm)(a) 40 40- 4000 3600 30 3200 EE 2800 2400 20 2000 1600 > 1200 10- 800 400 0 -40 -20 20 40 X (mm) (b) Figure 3. a) Sample OH PLIF image. b)OH gradient magnitude Figure 4. Power spectra of axial velocity in a) Inner shear layer (ISL) b) Inner recirculation zone (IRZ)c)jet. Power spectra of d) integrated chemiluminescence and e) acoustic signal 100- 80- 60 20-Mi1000 1500 2000 2500 Frequency (Hz) (c) Figure 5. Power spectra of POD temporal eigenmodes a) first, b) second and c) third (c) Figure 6. Spatial eigenmodes 1, 2 and 3 of POD. Modes 1 and 2 correspond to the PVC, while 3corresponds to the thermo-acoustic pulsation. Figure 7. Spatial eigenmodes 1, 2 and 3 of POD. Modes 1 and 2 correspond to the PVC, while 3corresponds to the thermo-acoustic pulsation. Figure 8. a)OH PLIF images - time separation = 0.2 ms Figure 8. b) OH Gradient images. Large magnitude gradients indicate reaction zones. Figure 8. c) Reaction zones overlaid against contours of axial velocity. For clarity, only every secondcomputed vector is plotted in the vector overlay. Figure 8. d) Reaction zones overlaid against contours of Vz-(through plane) velocity. For clarity, onlyevery second computed vector is plotted in the vector overlay. -5000 -2500 0 2500 5000 (1/s) Figure 8. e) Reaction zones overlaid against contours of vorticity Figure 8. f) Reaction zones overlaid against contours of minimum principle normal strain -5000 Figure 10. Development of isolated OH pocket (first evident near x =-5 mm in frame 2), overlaid onunfiltered vorticity data. Boxx et al., Combust. Flame (. Accepted for Publication Dec.
确定


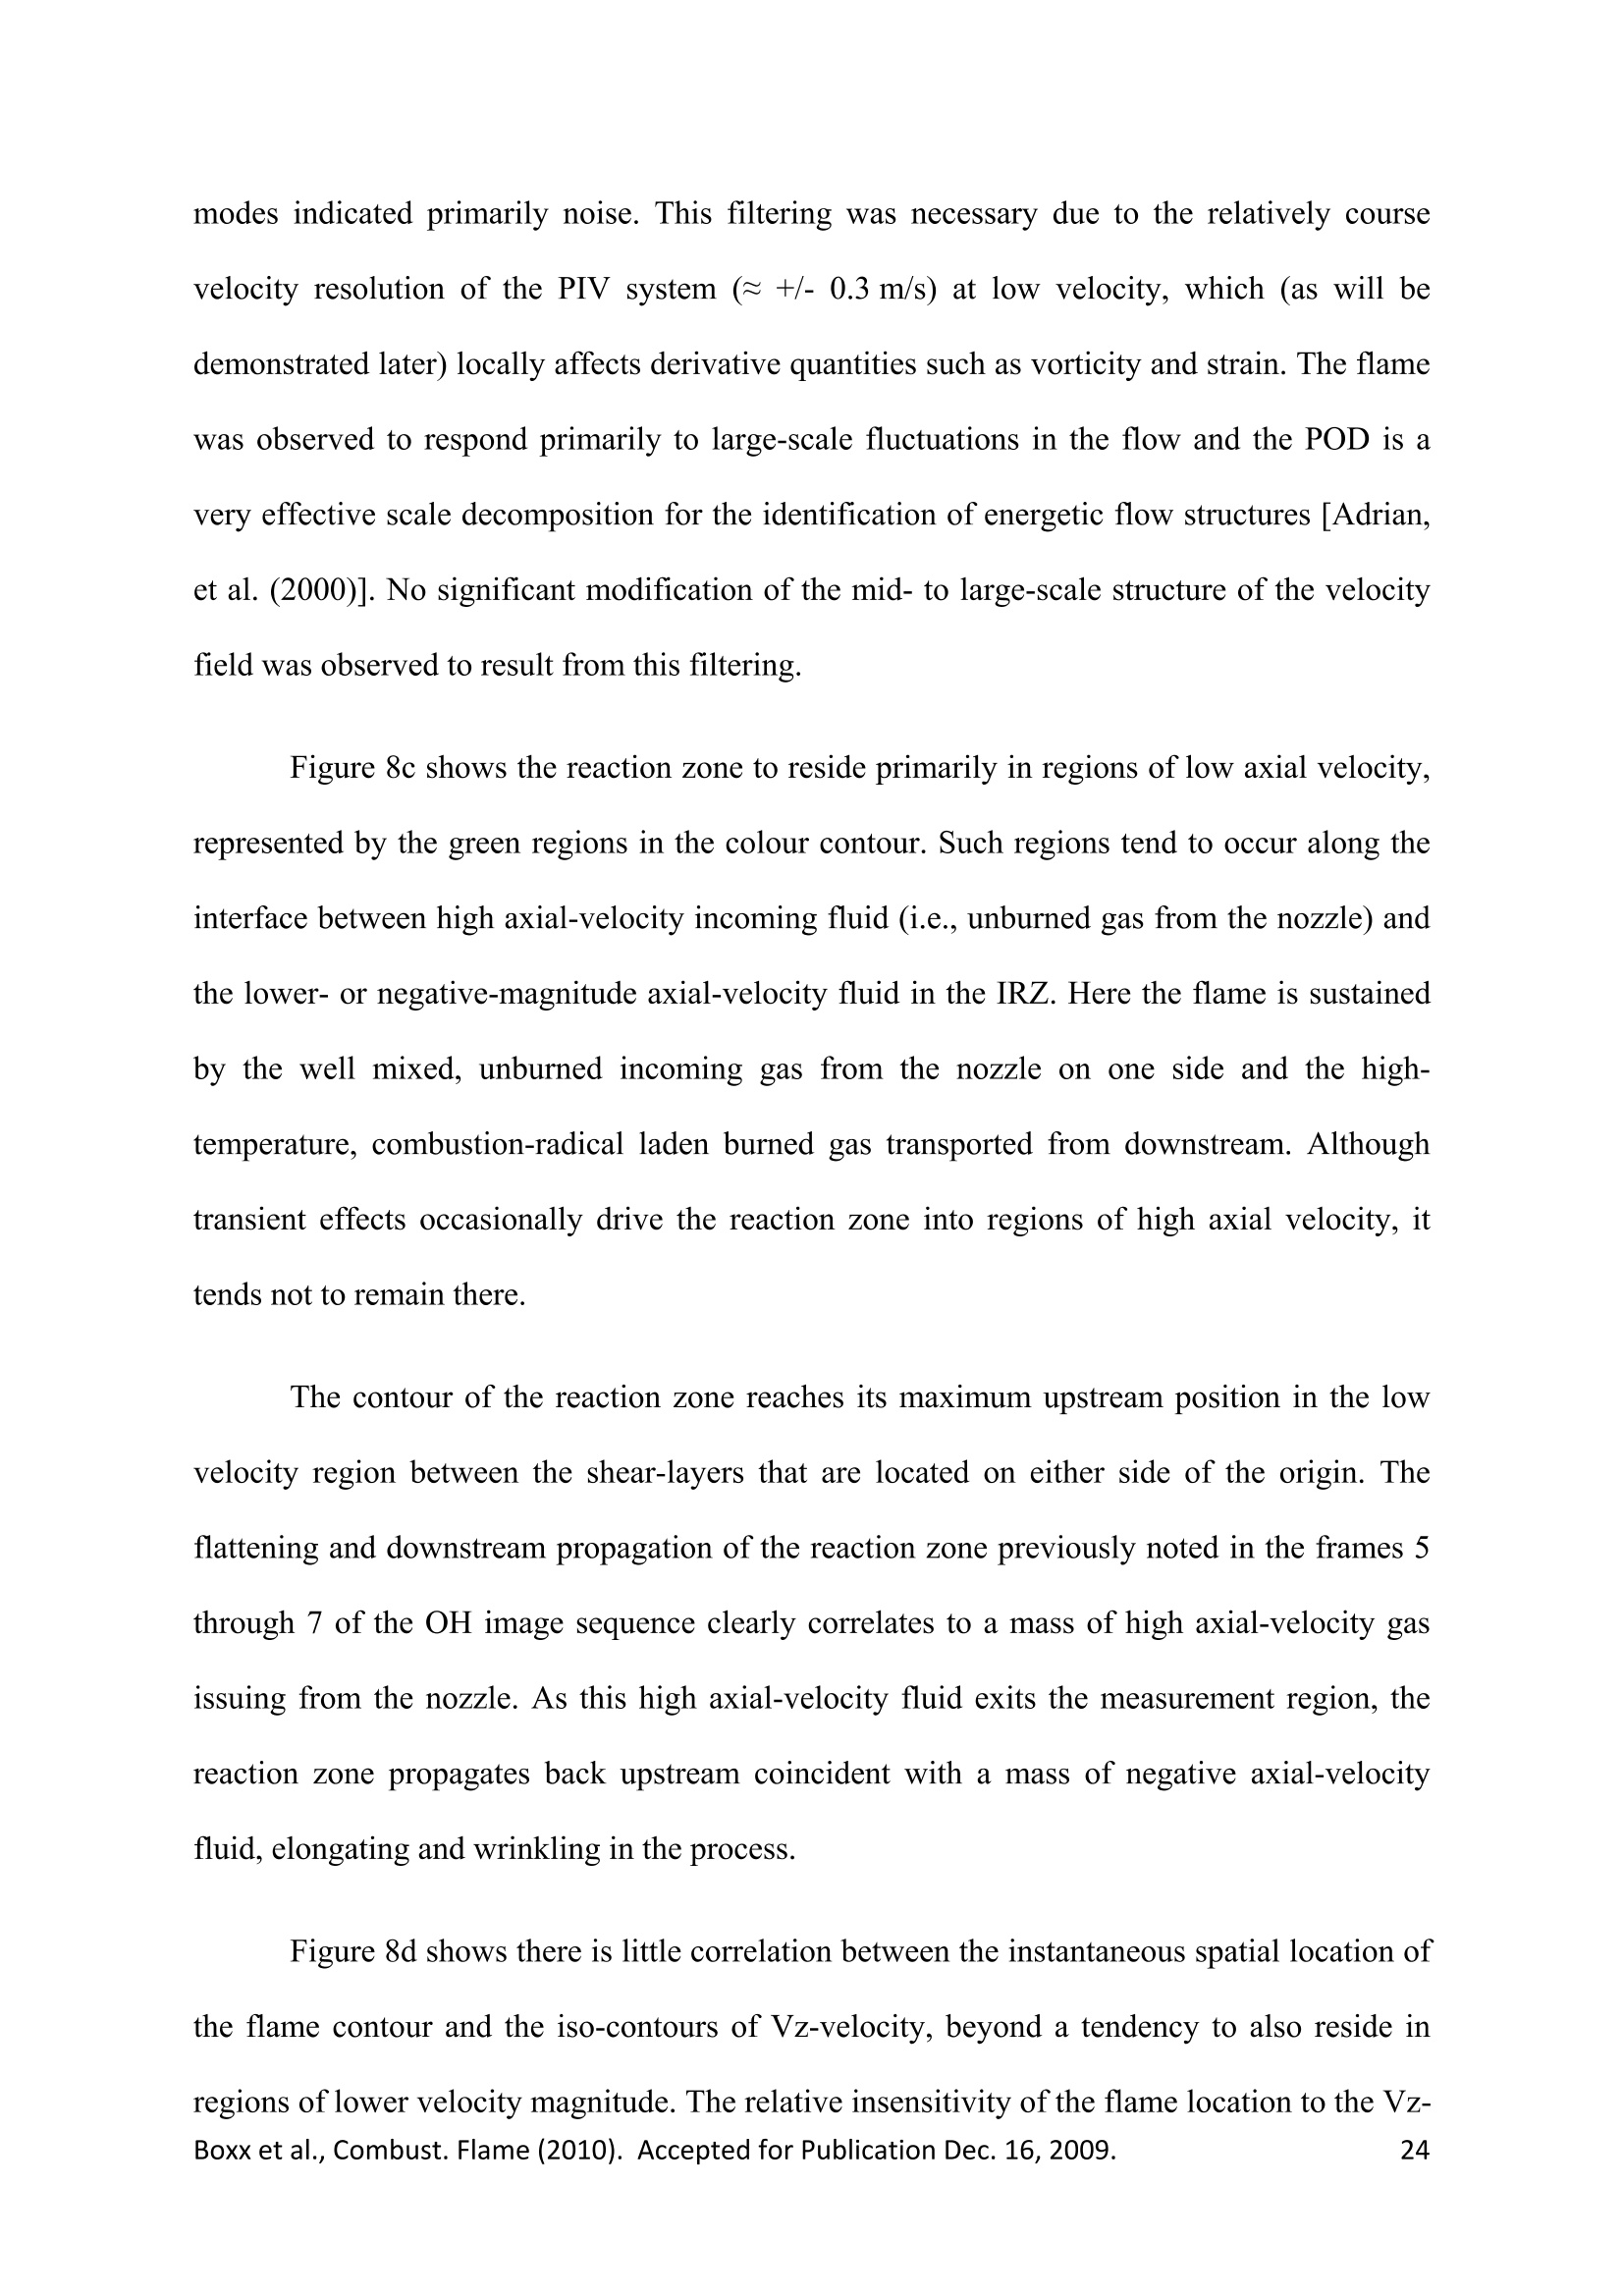
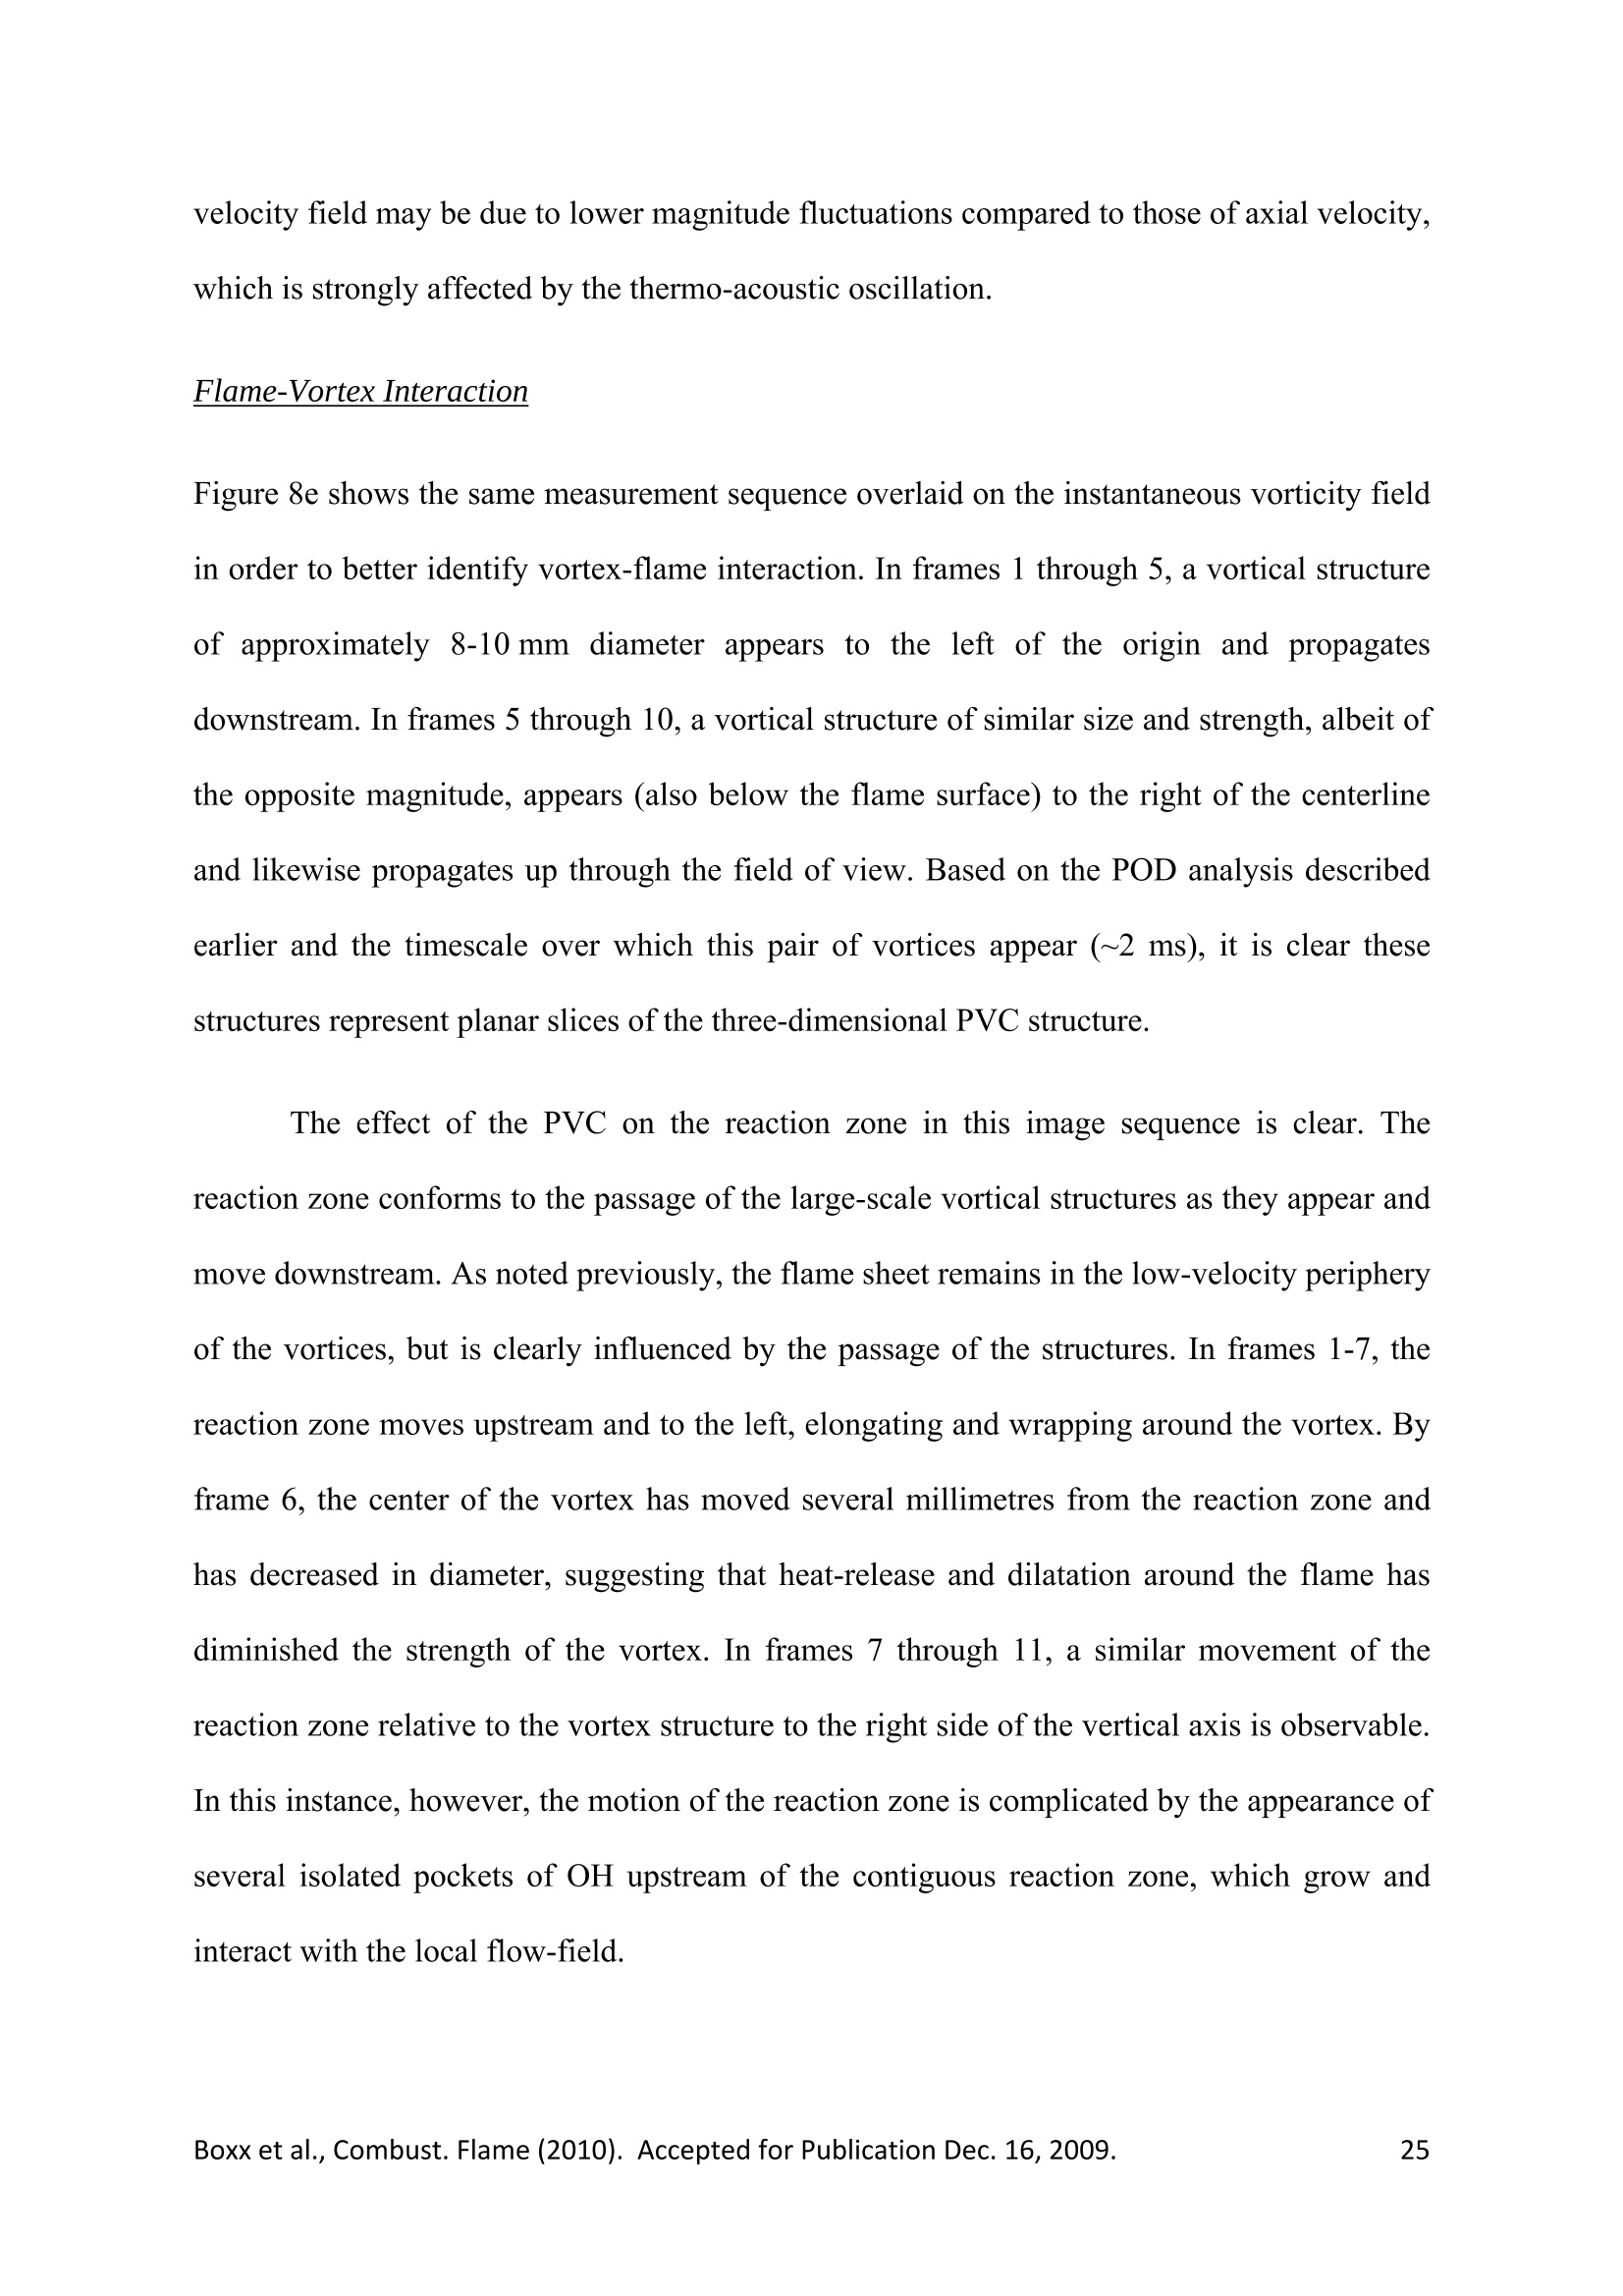
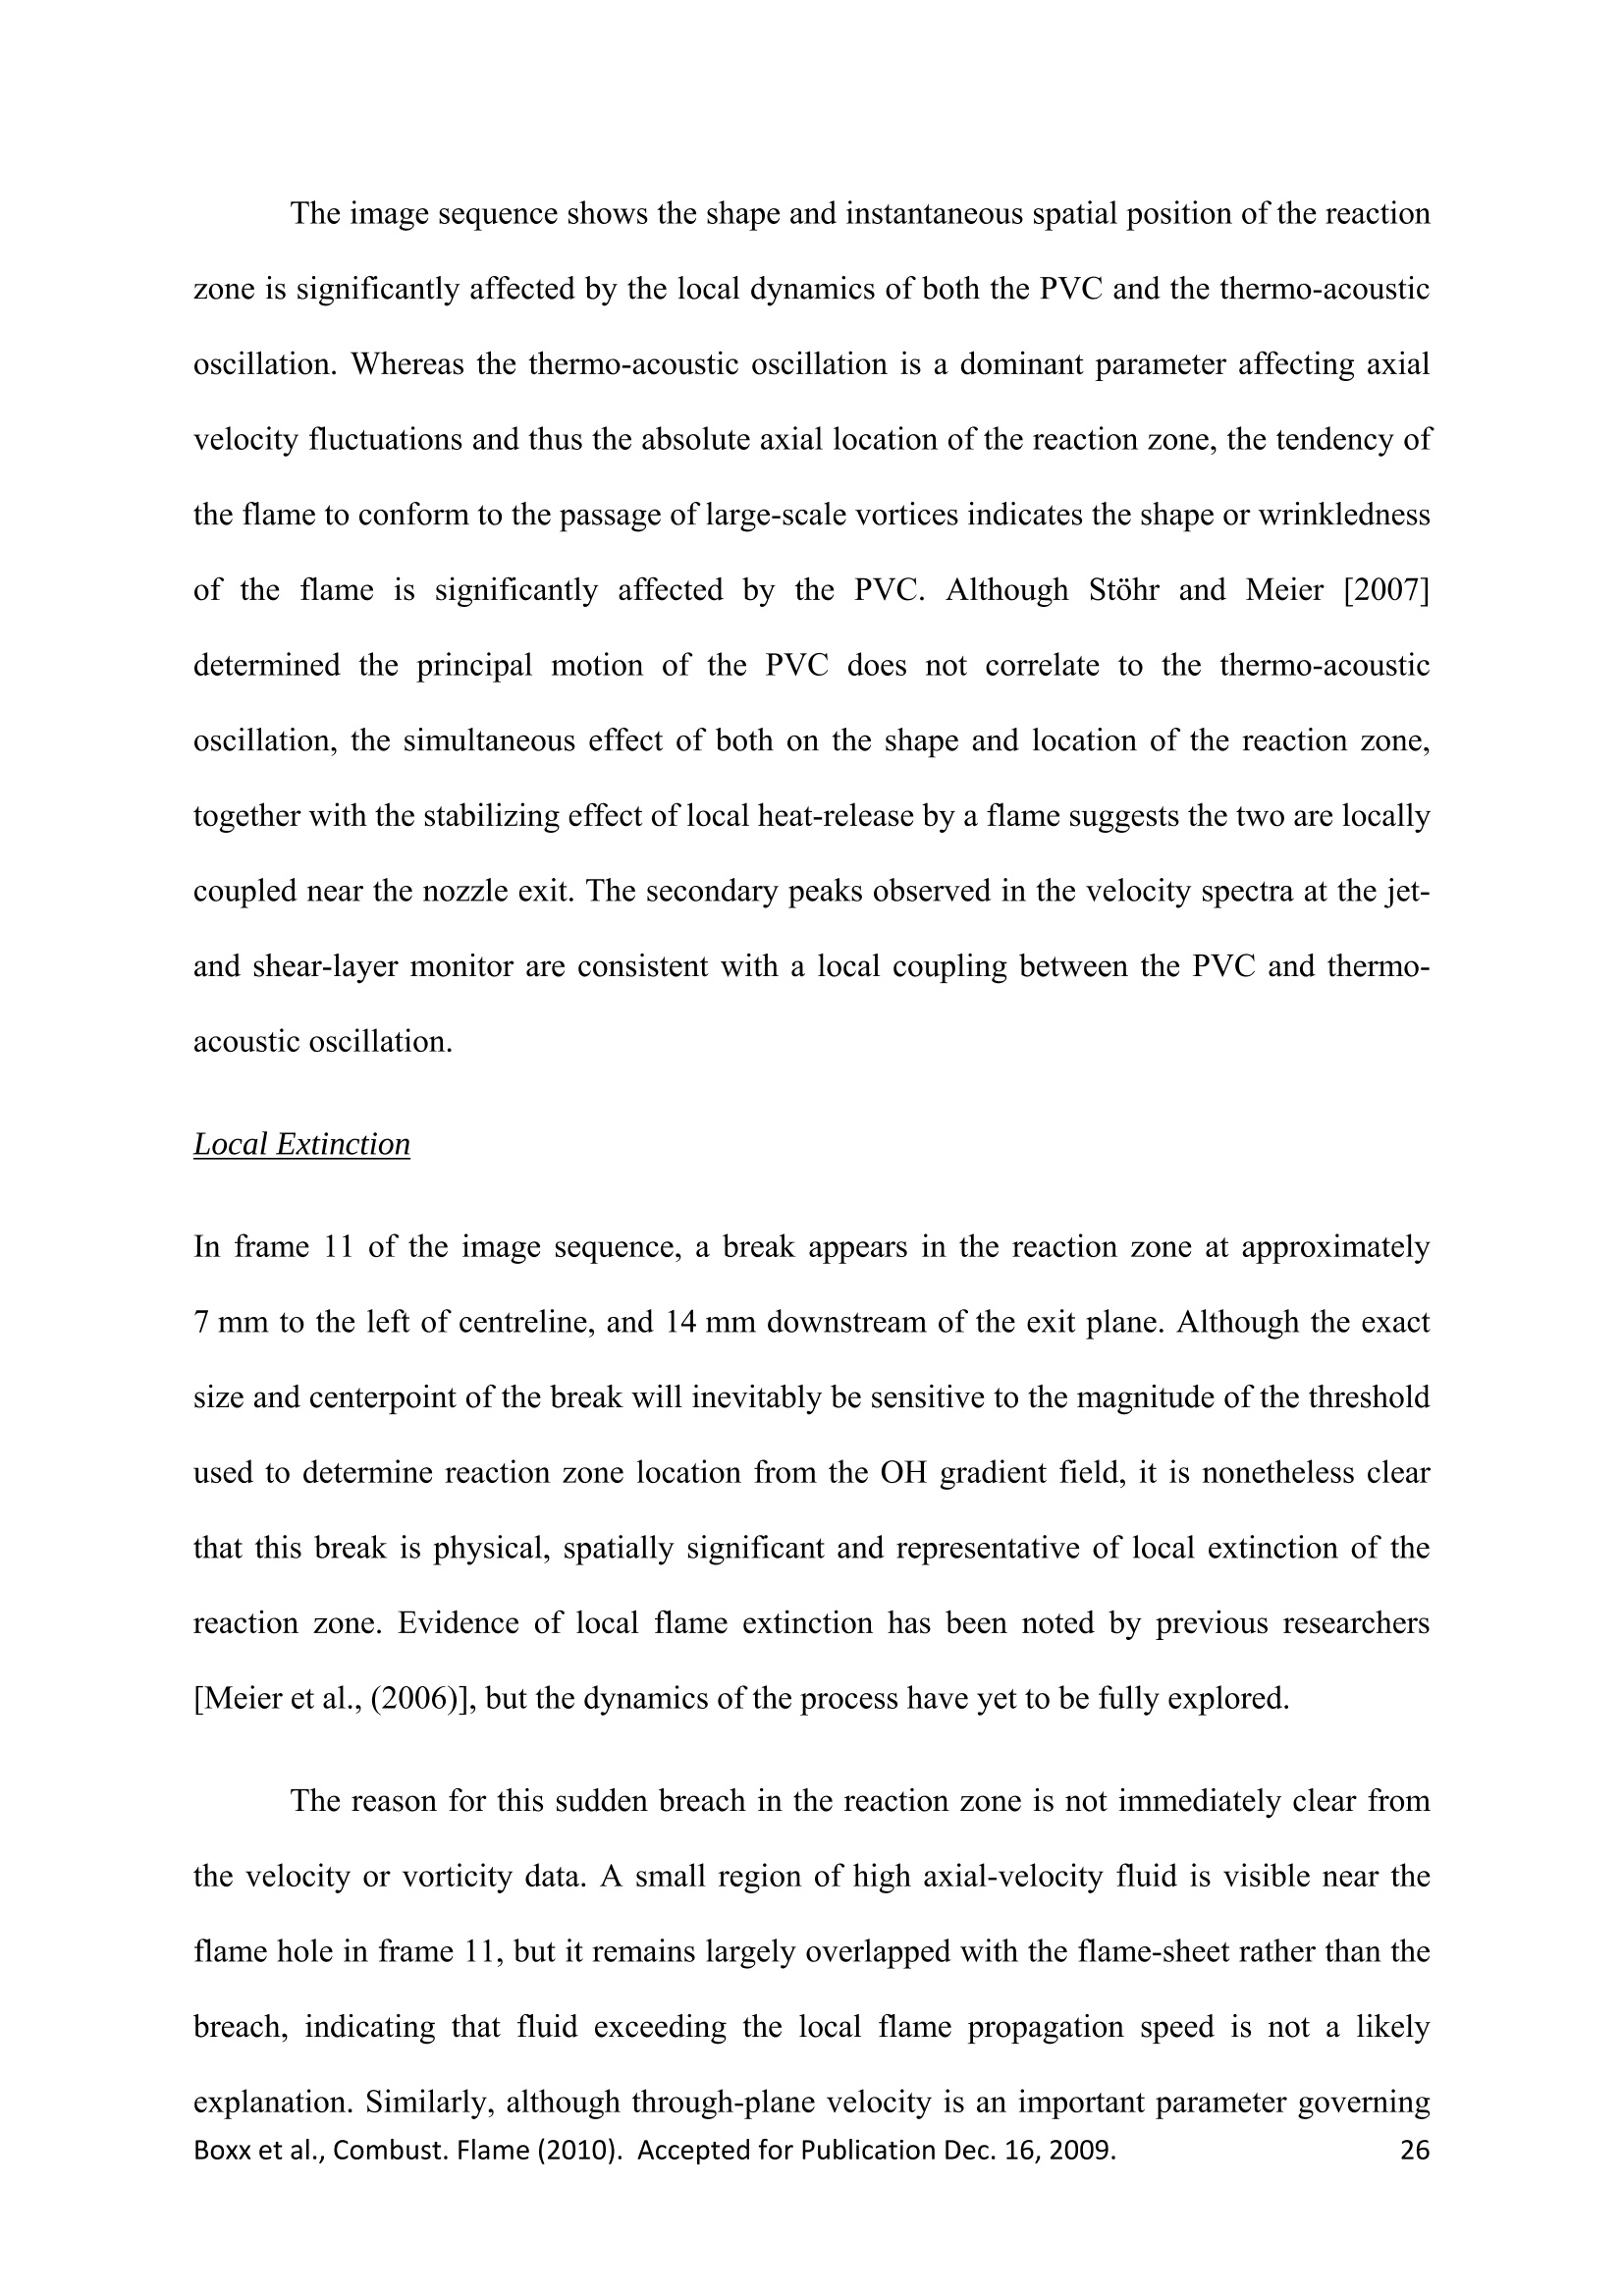
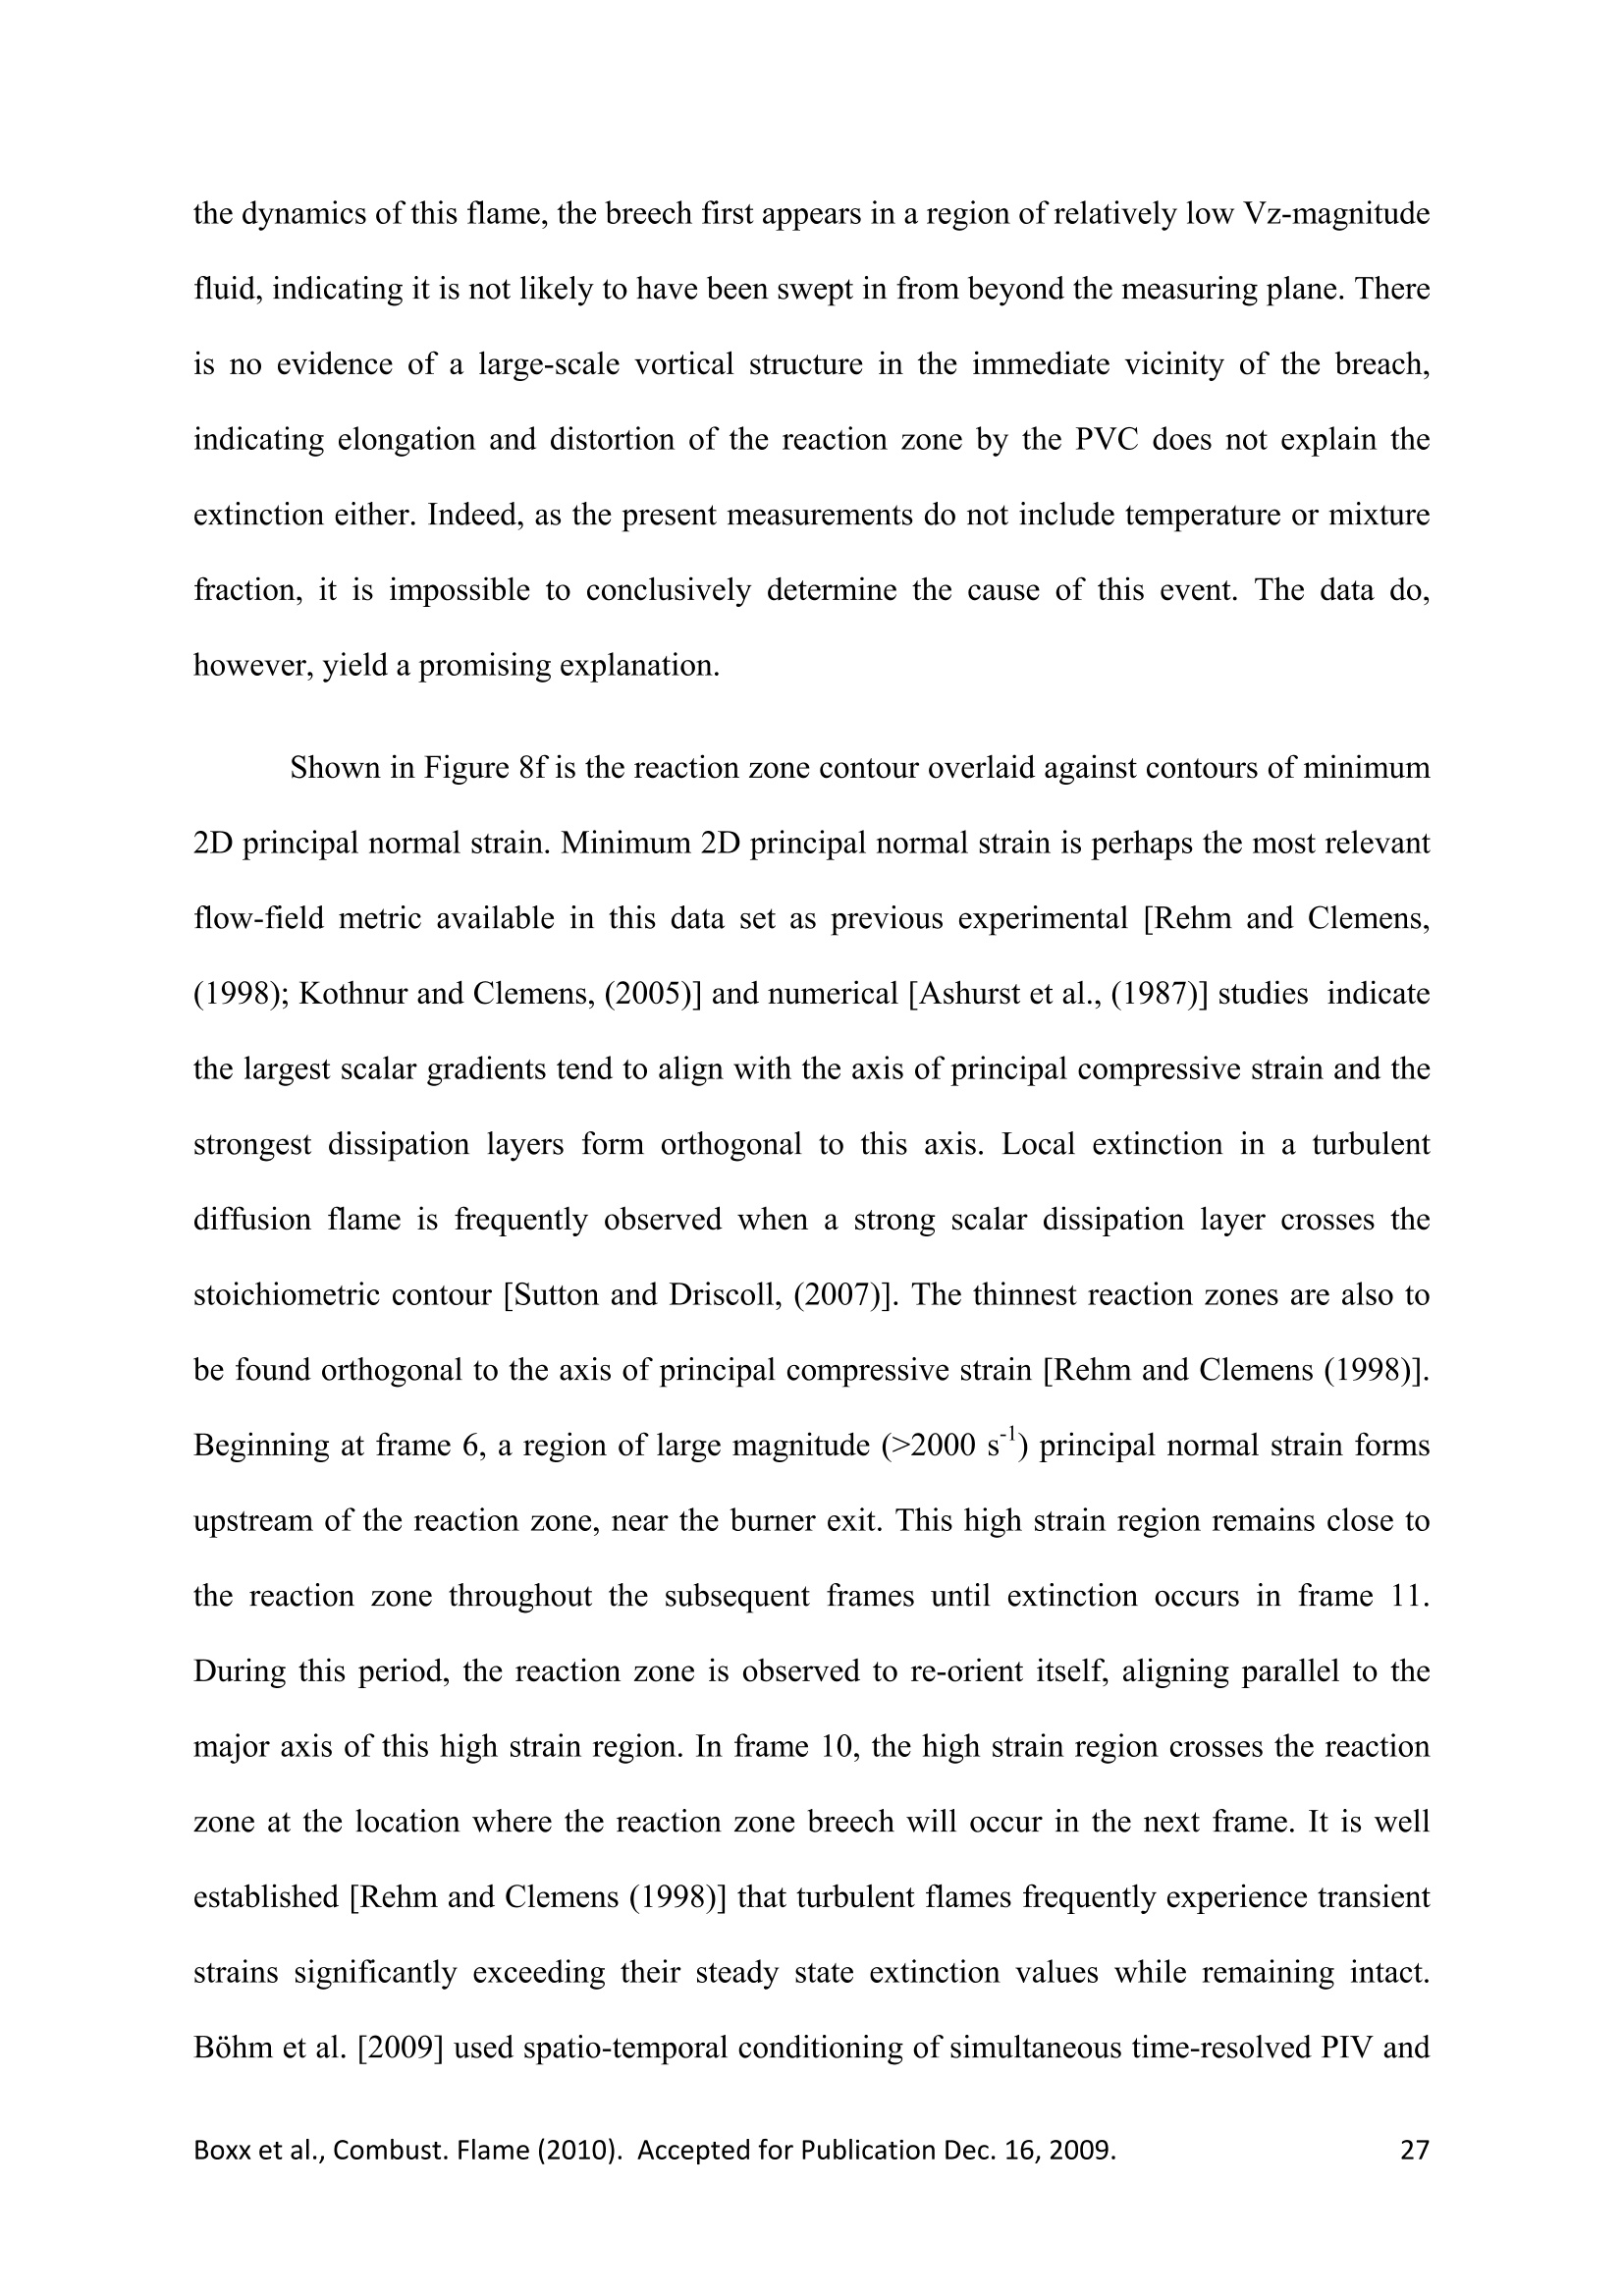
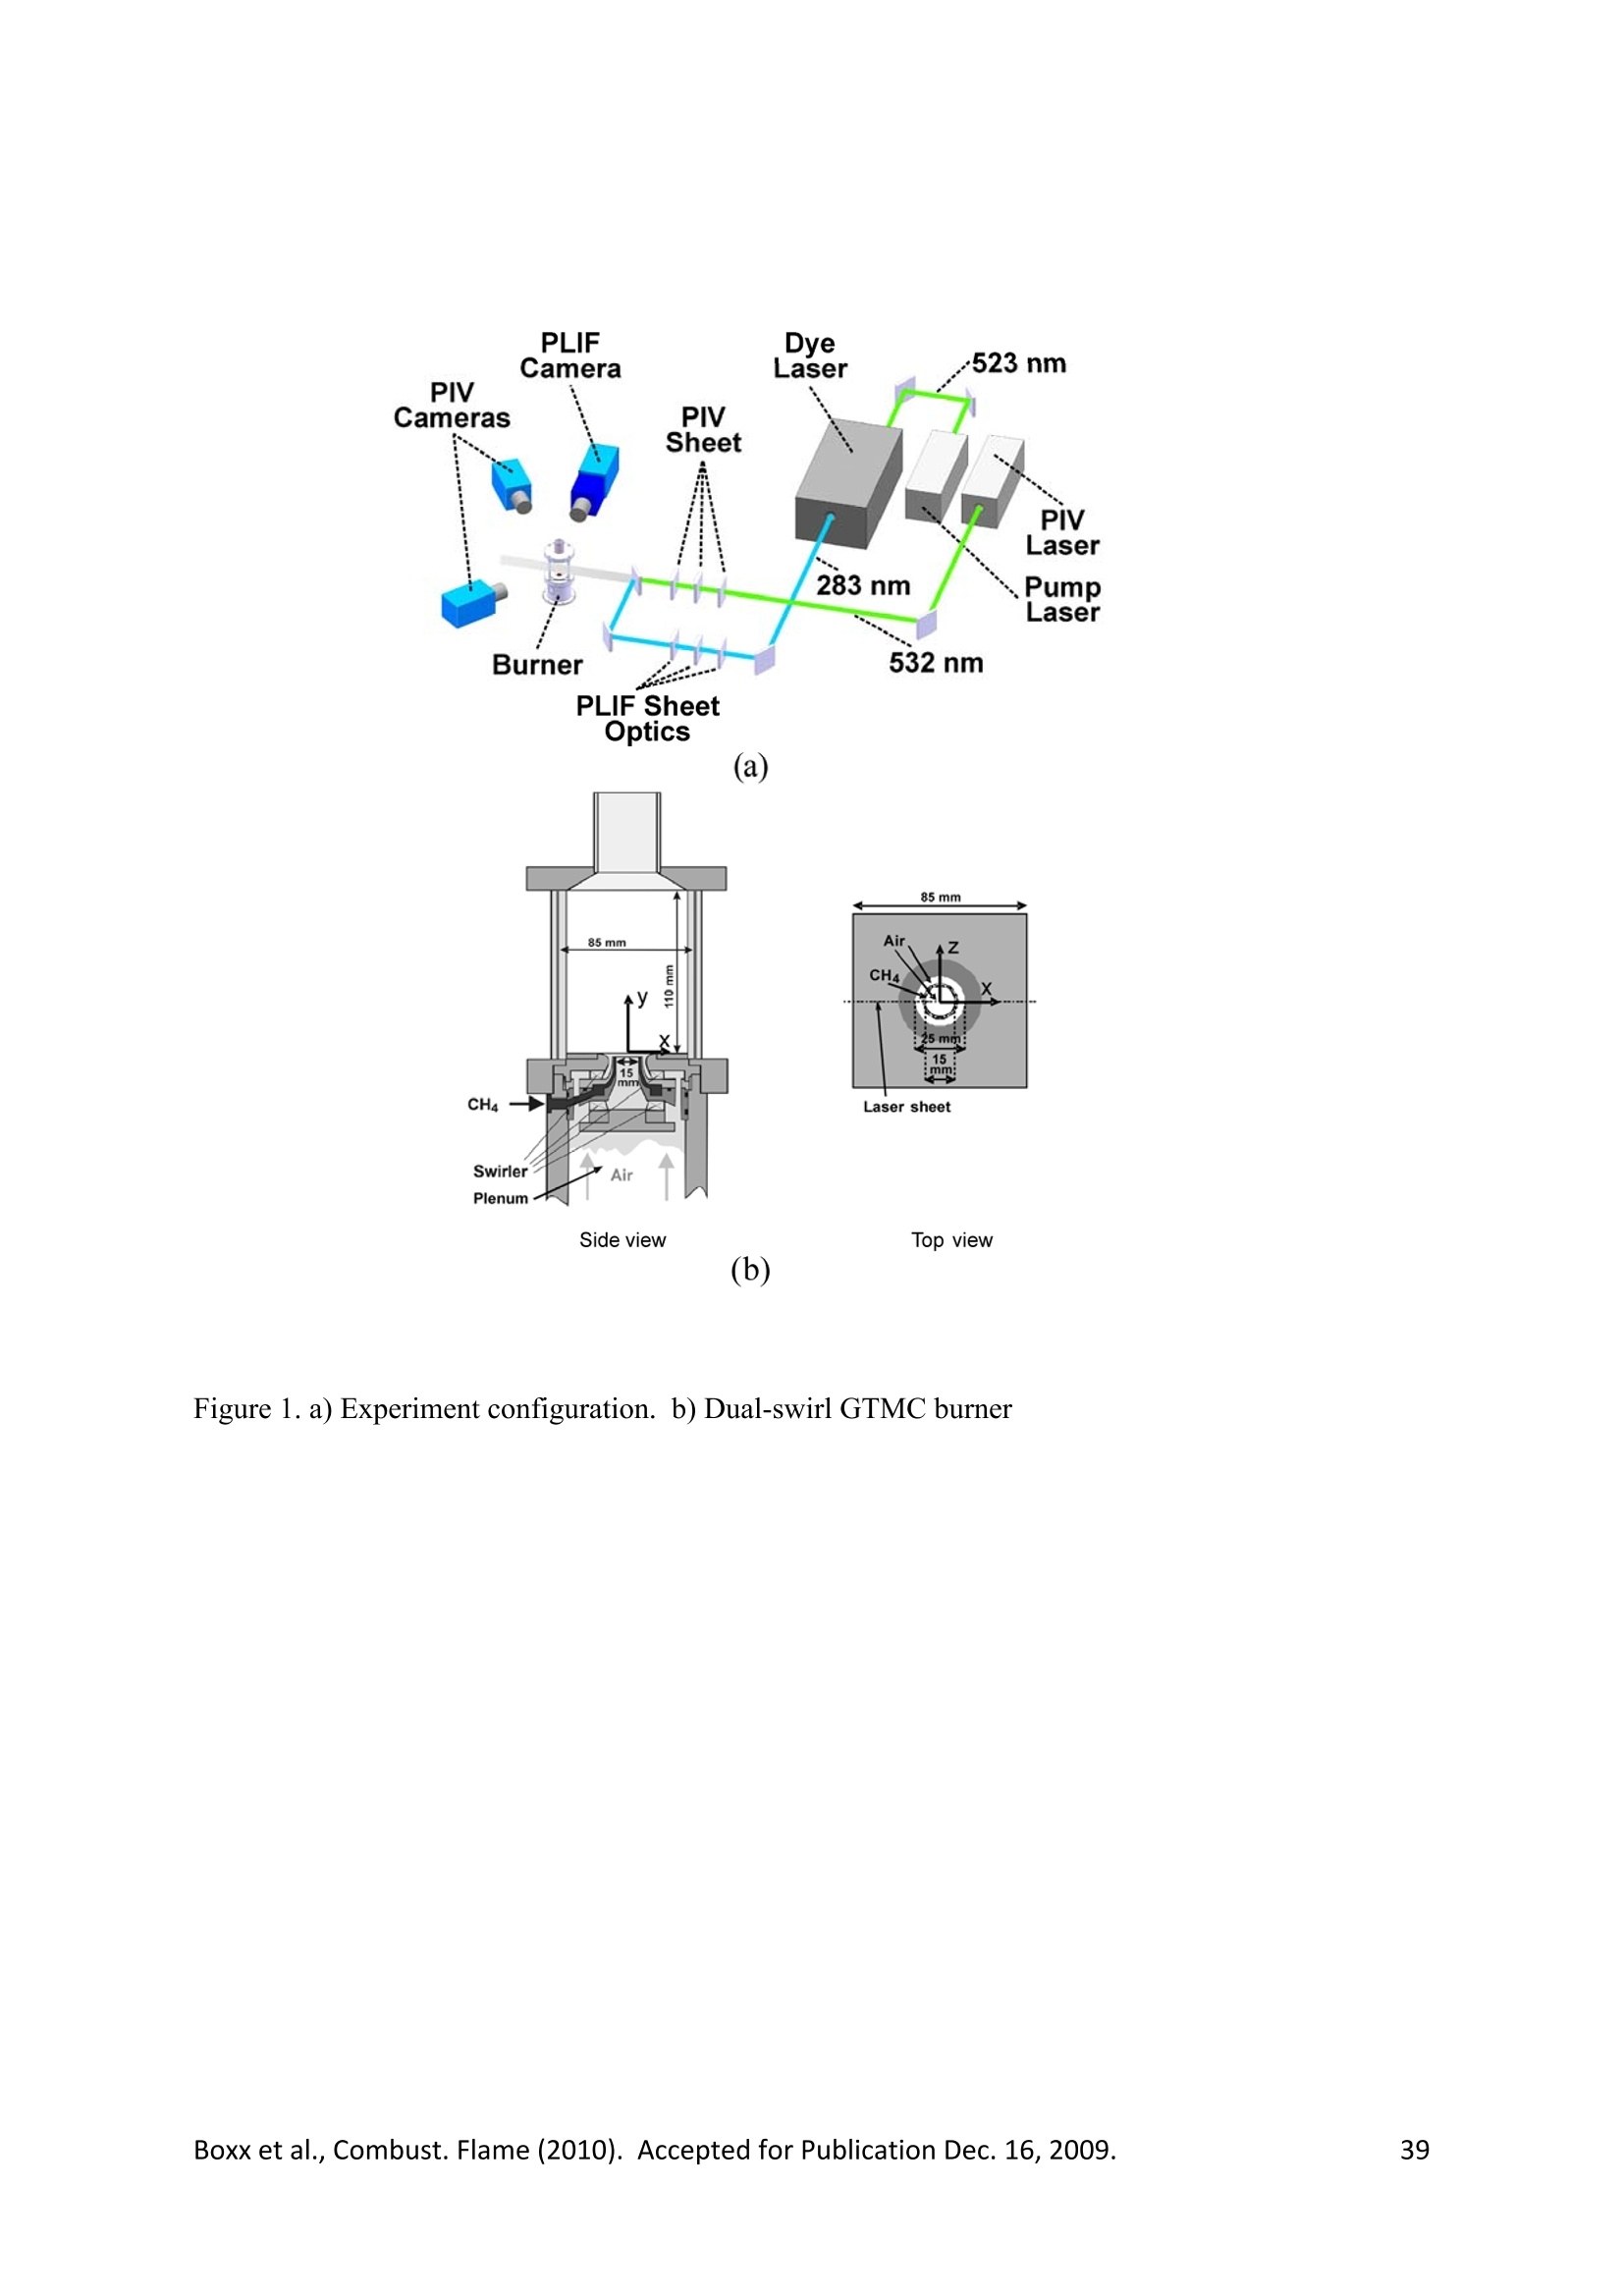
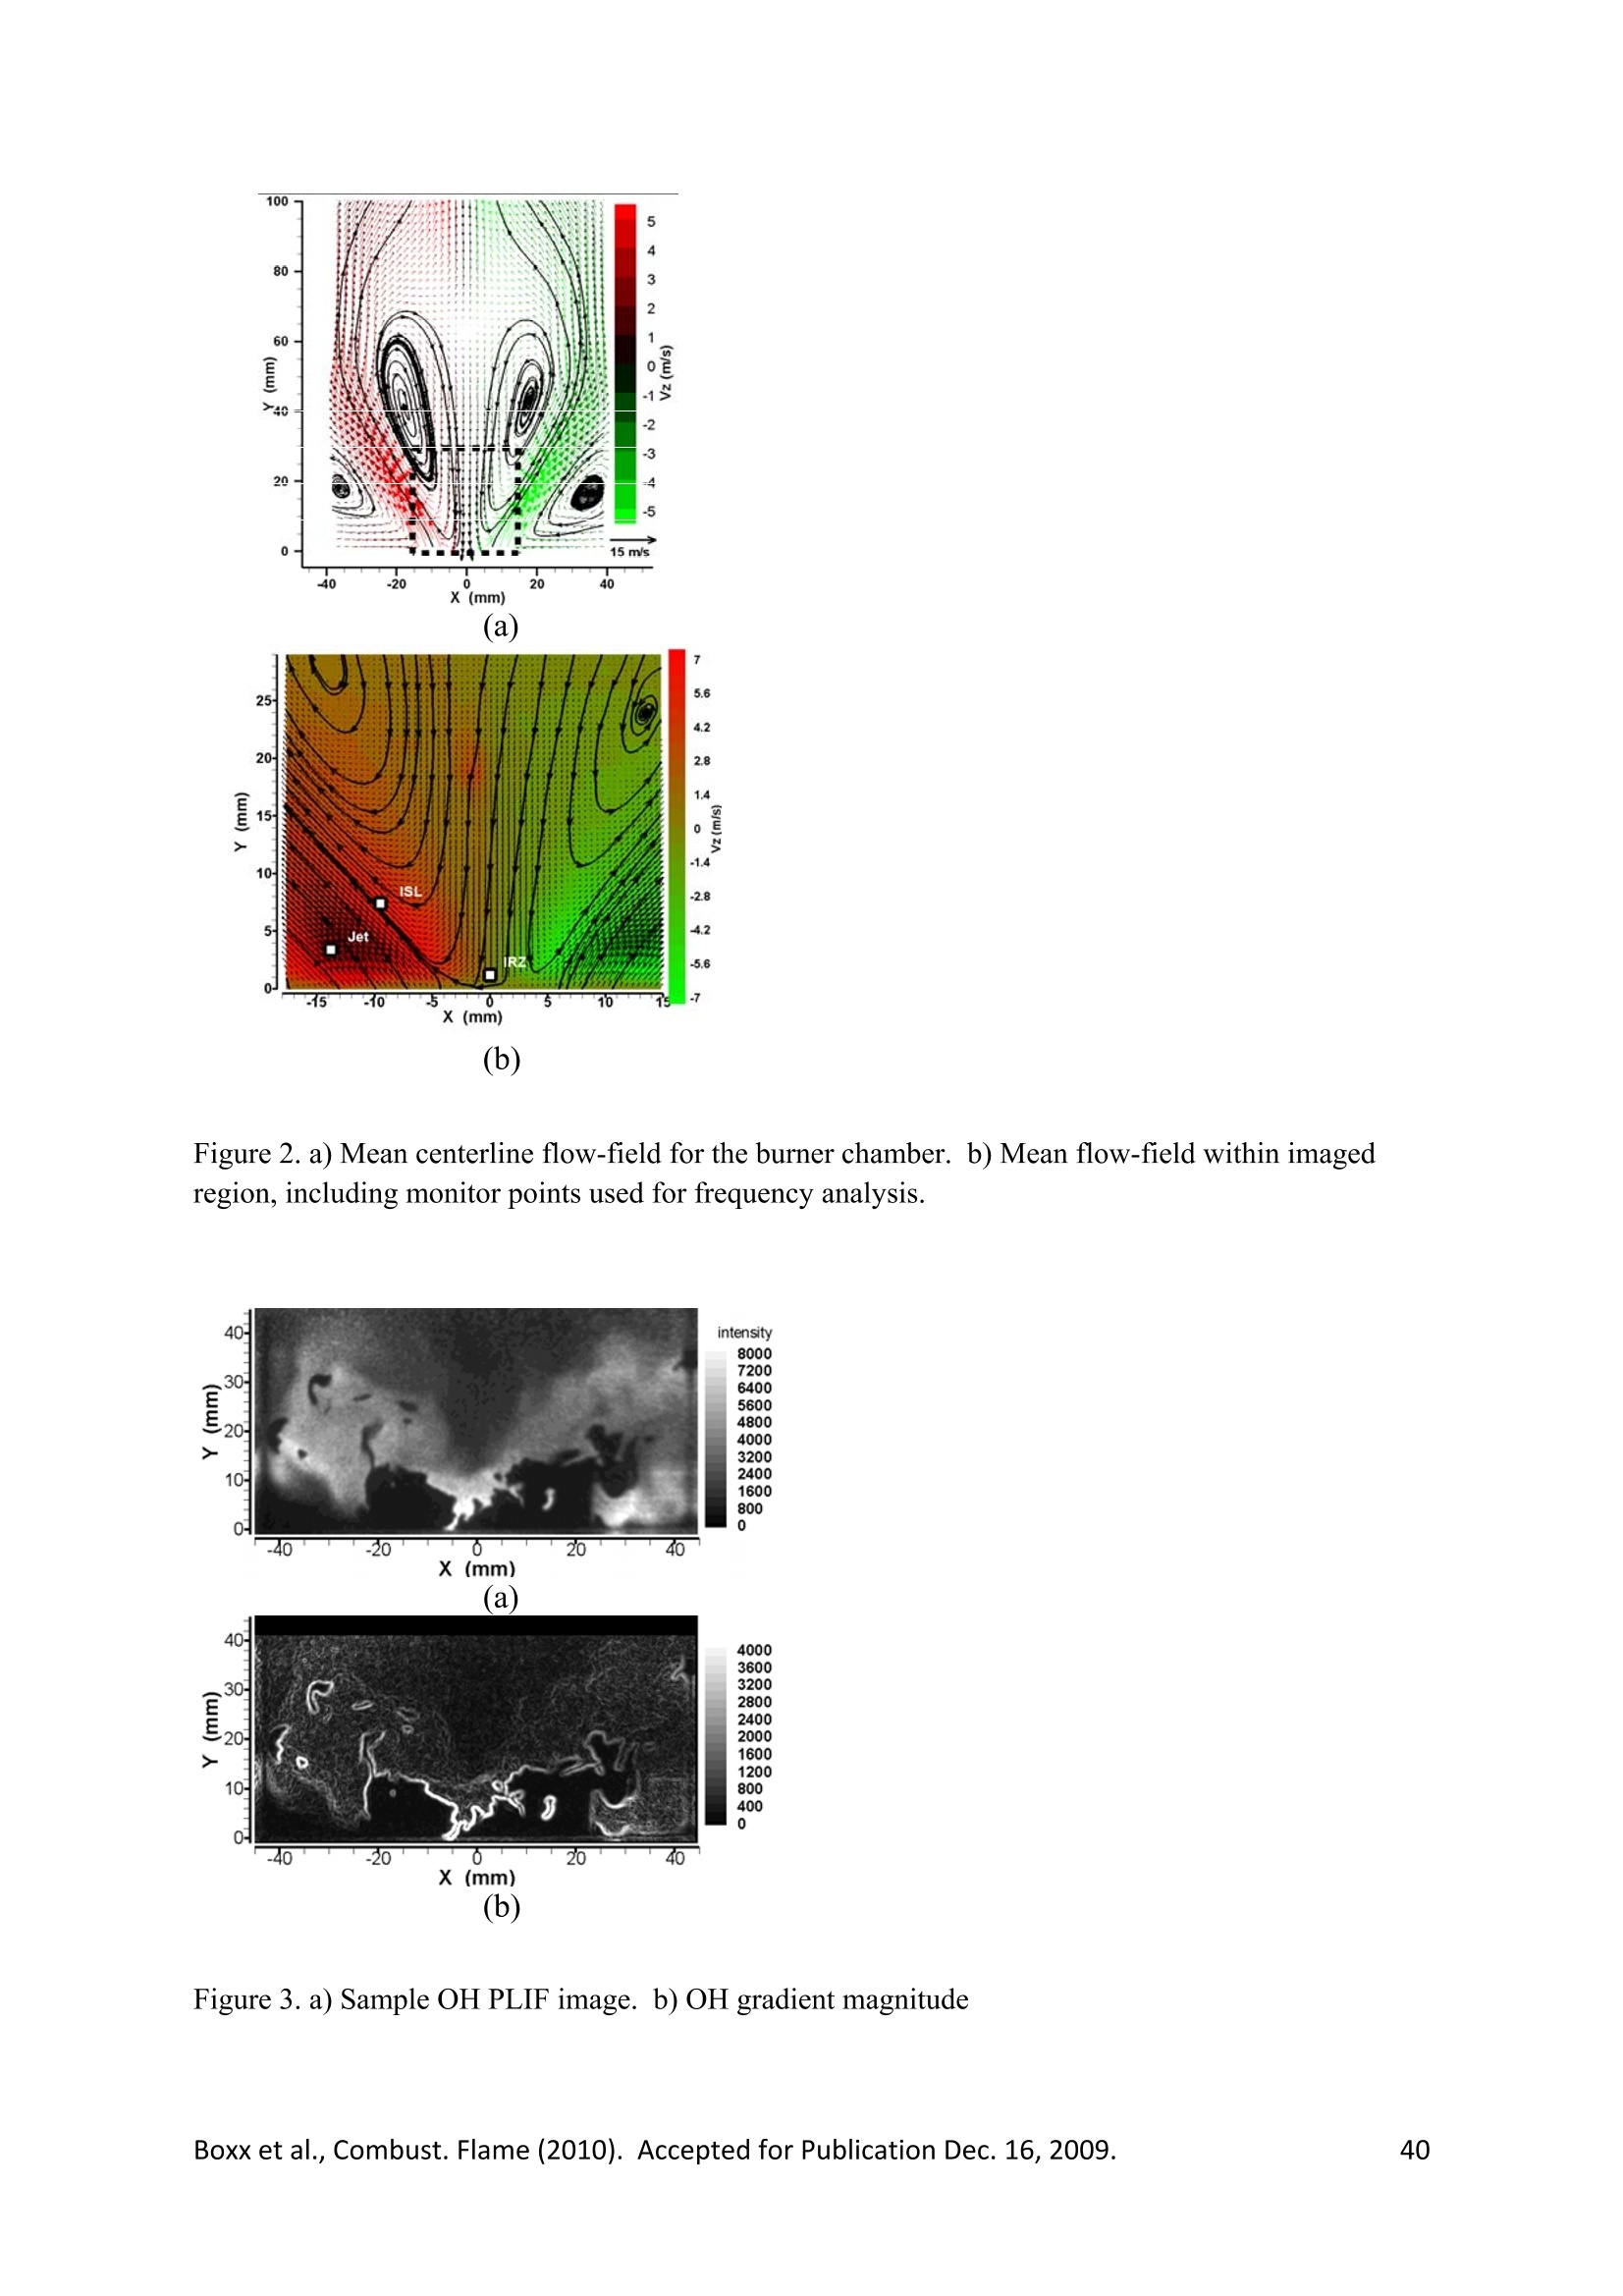
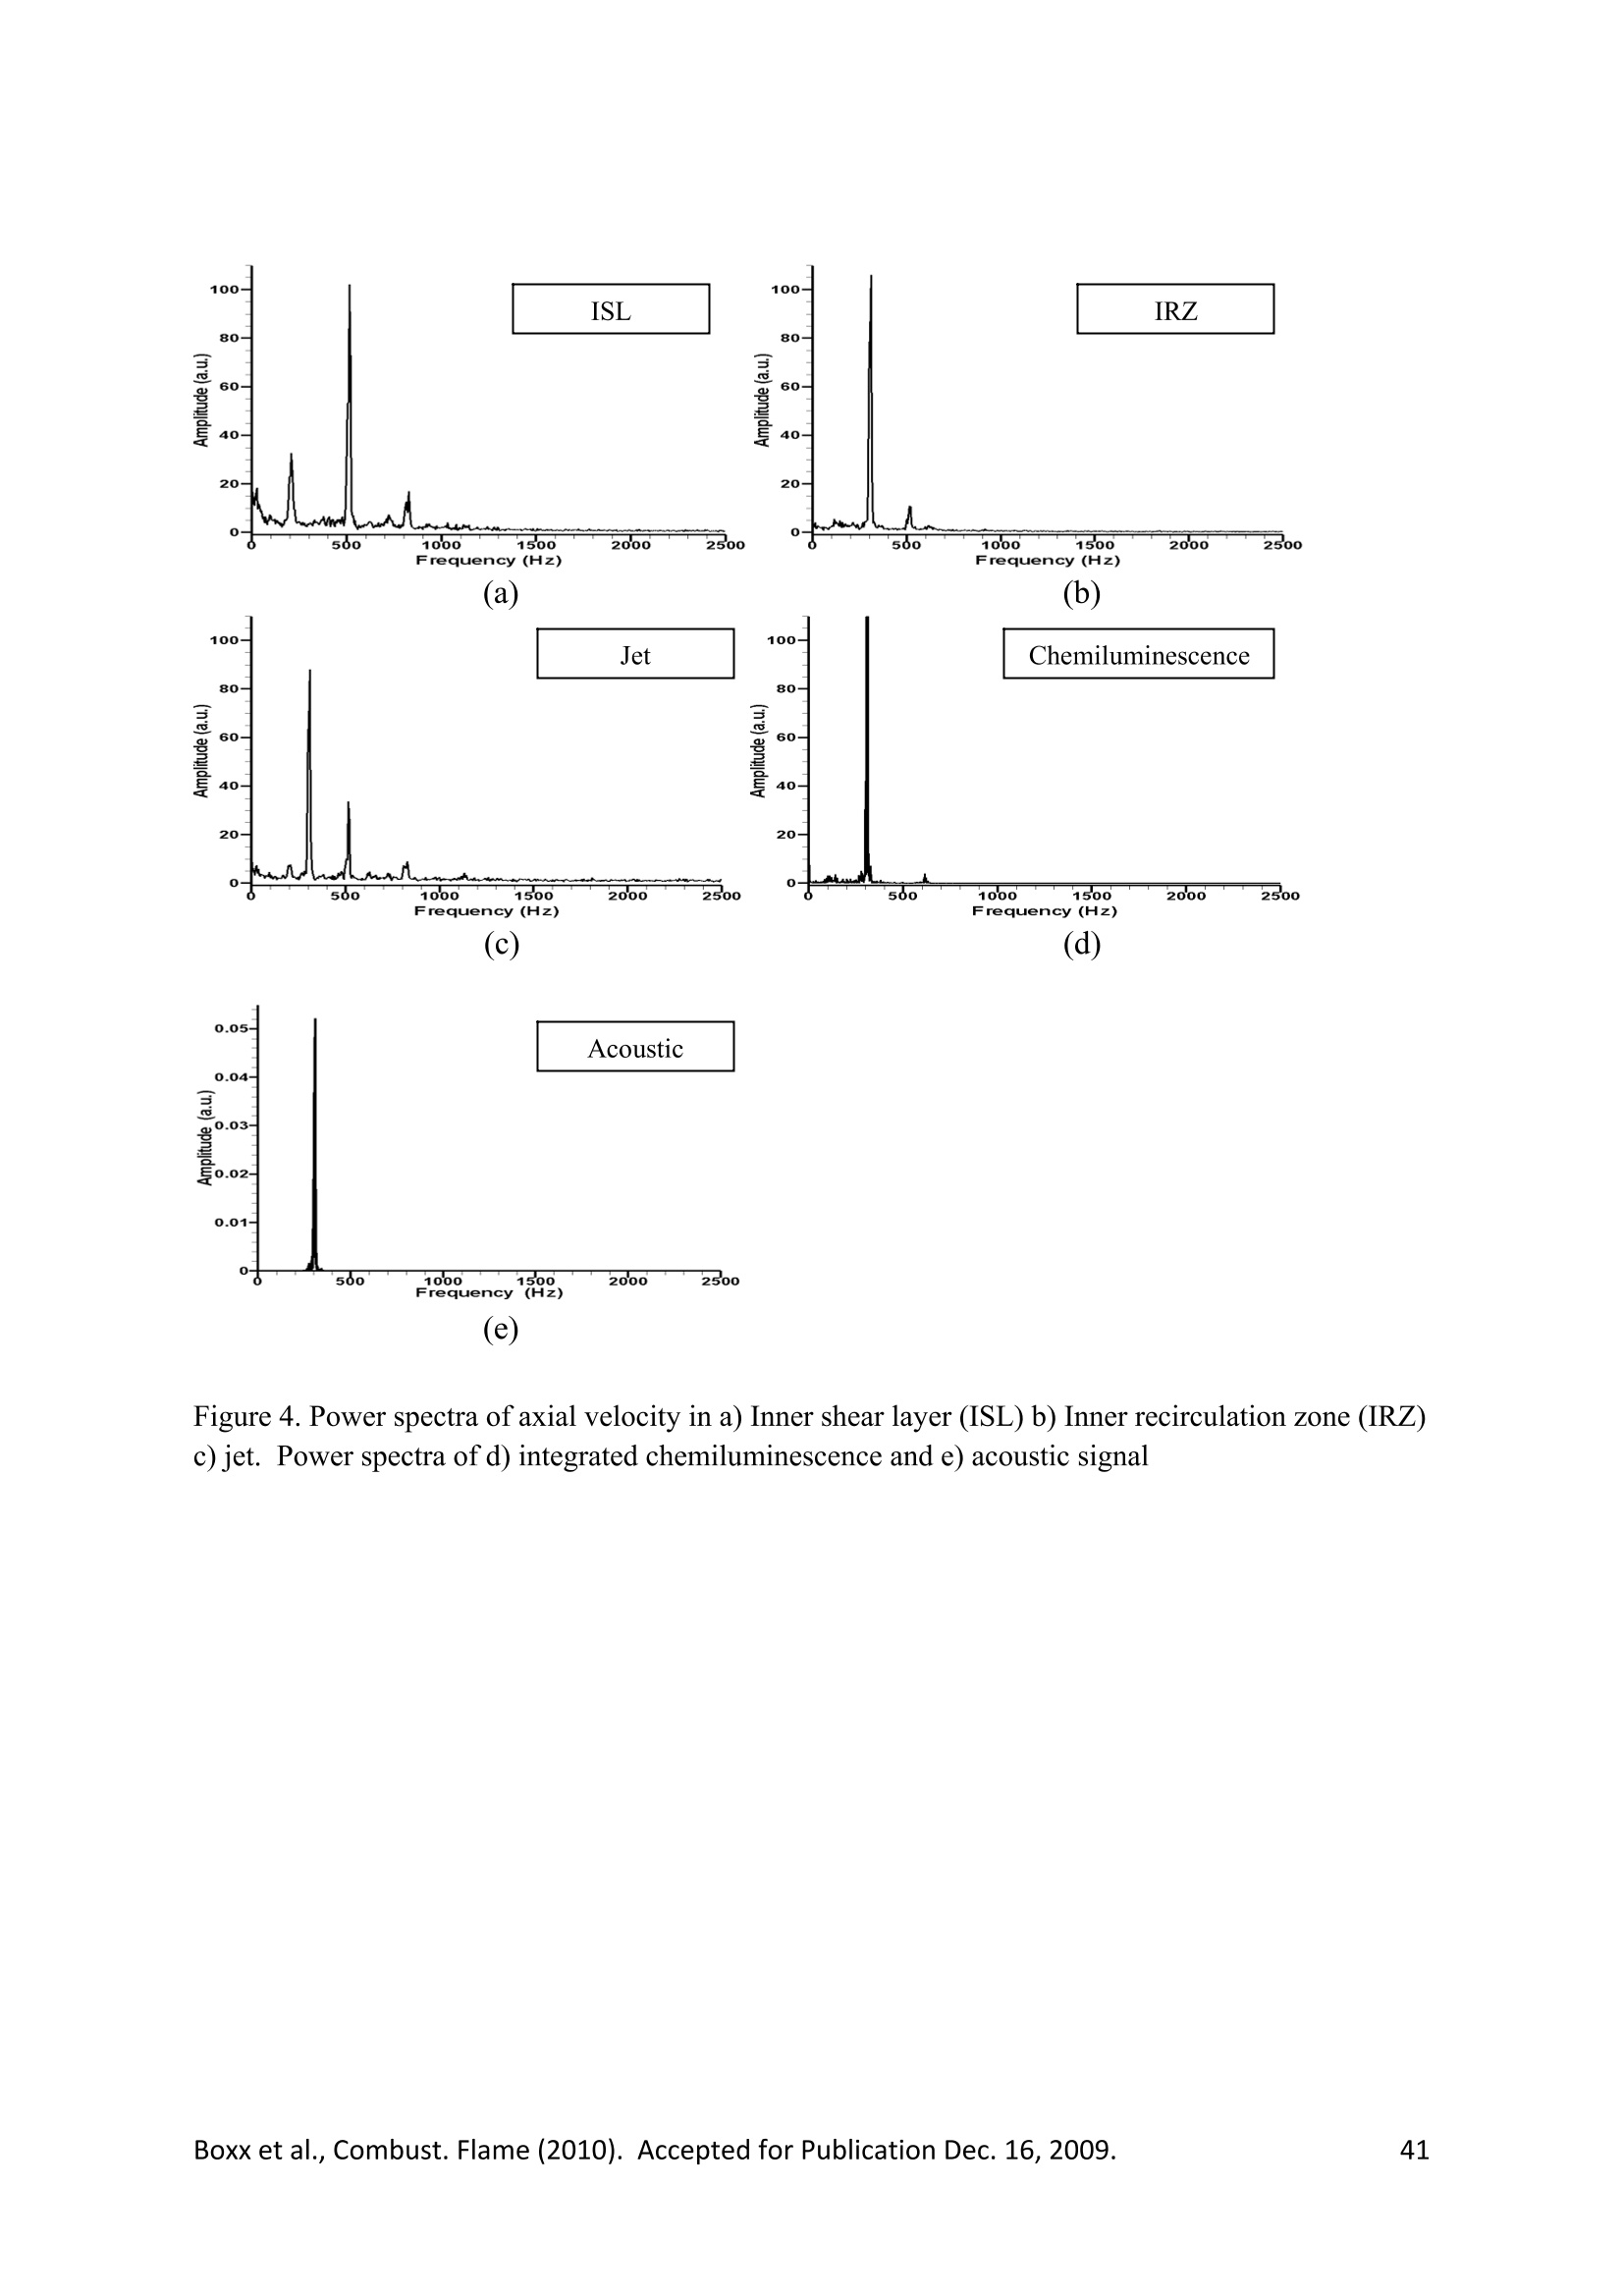
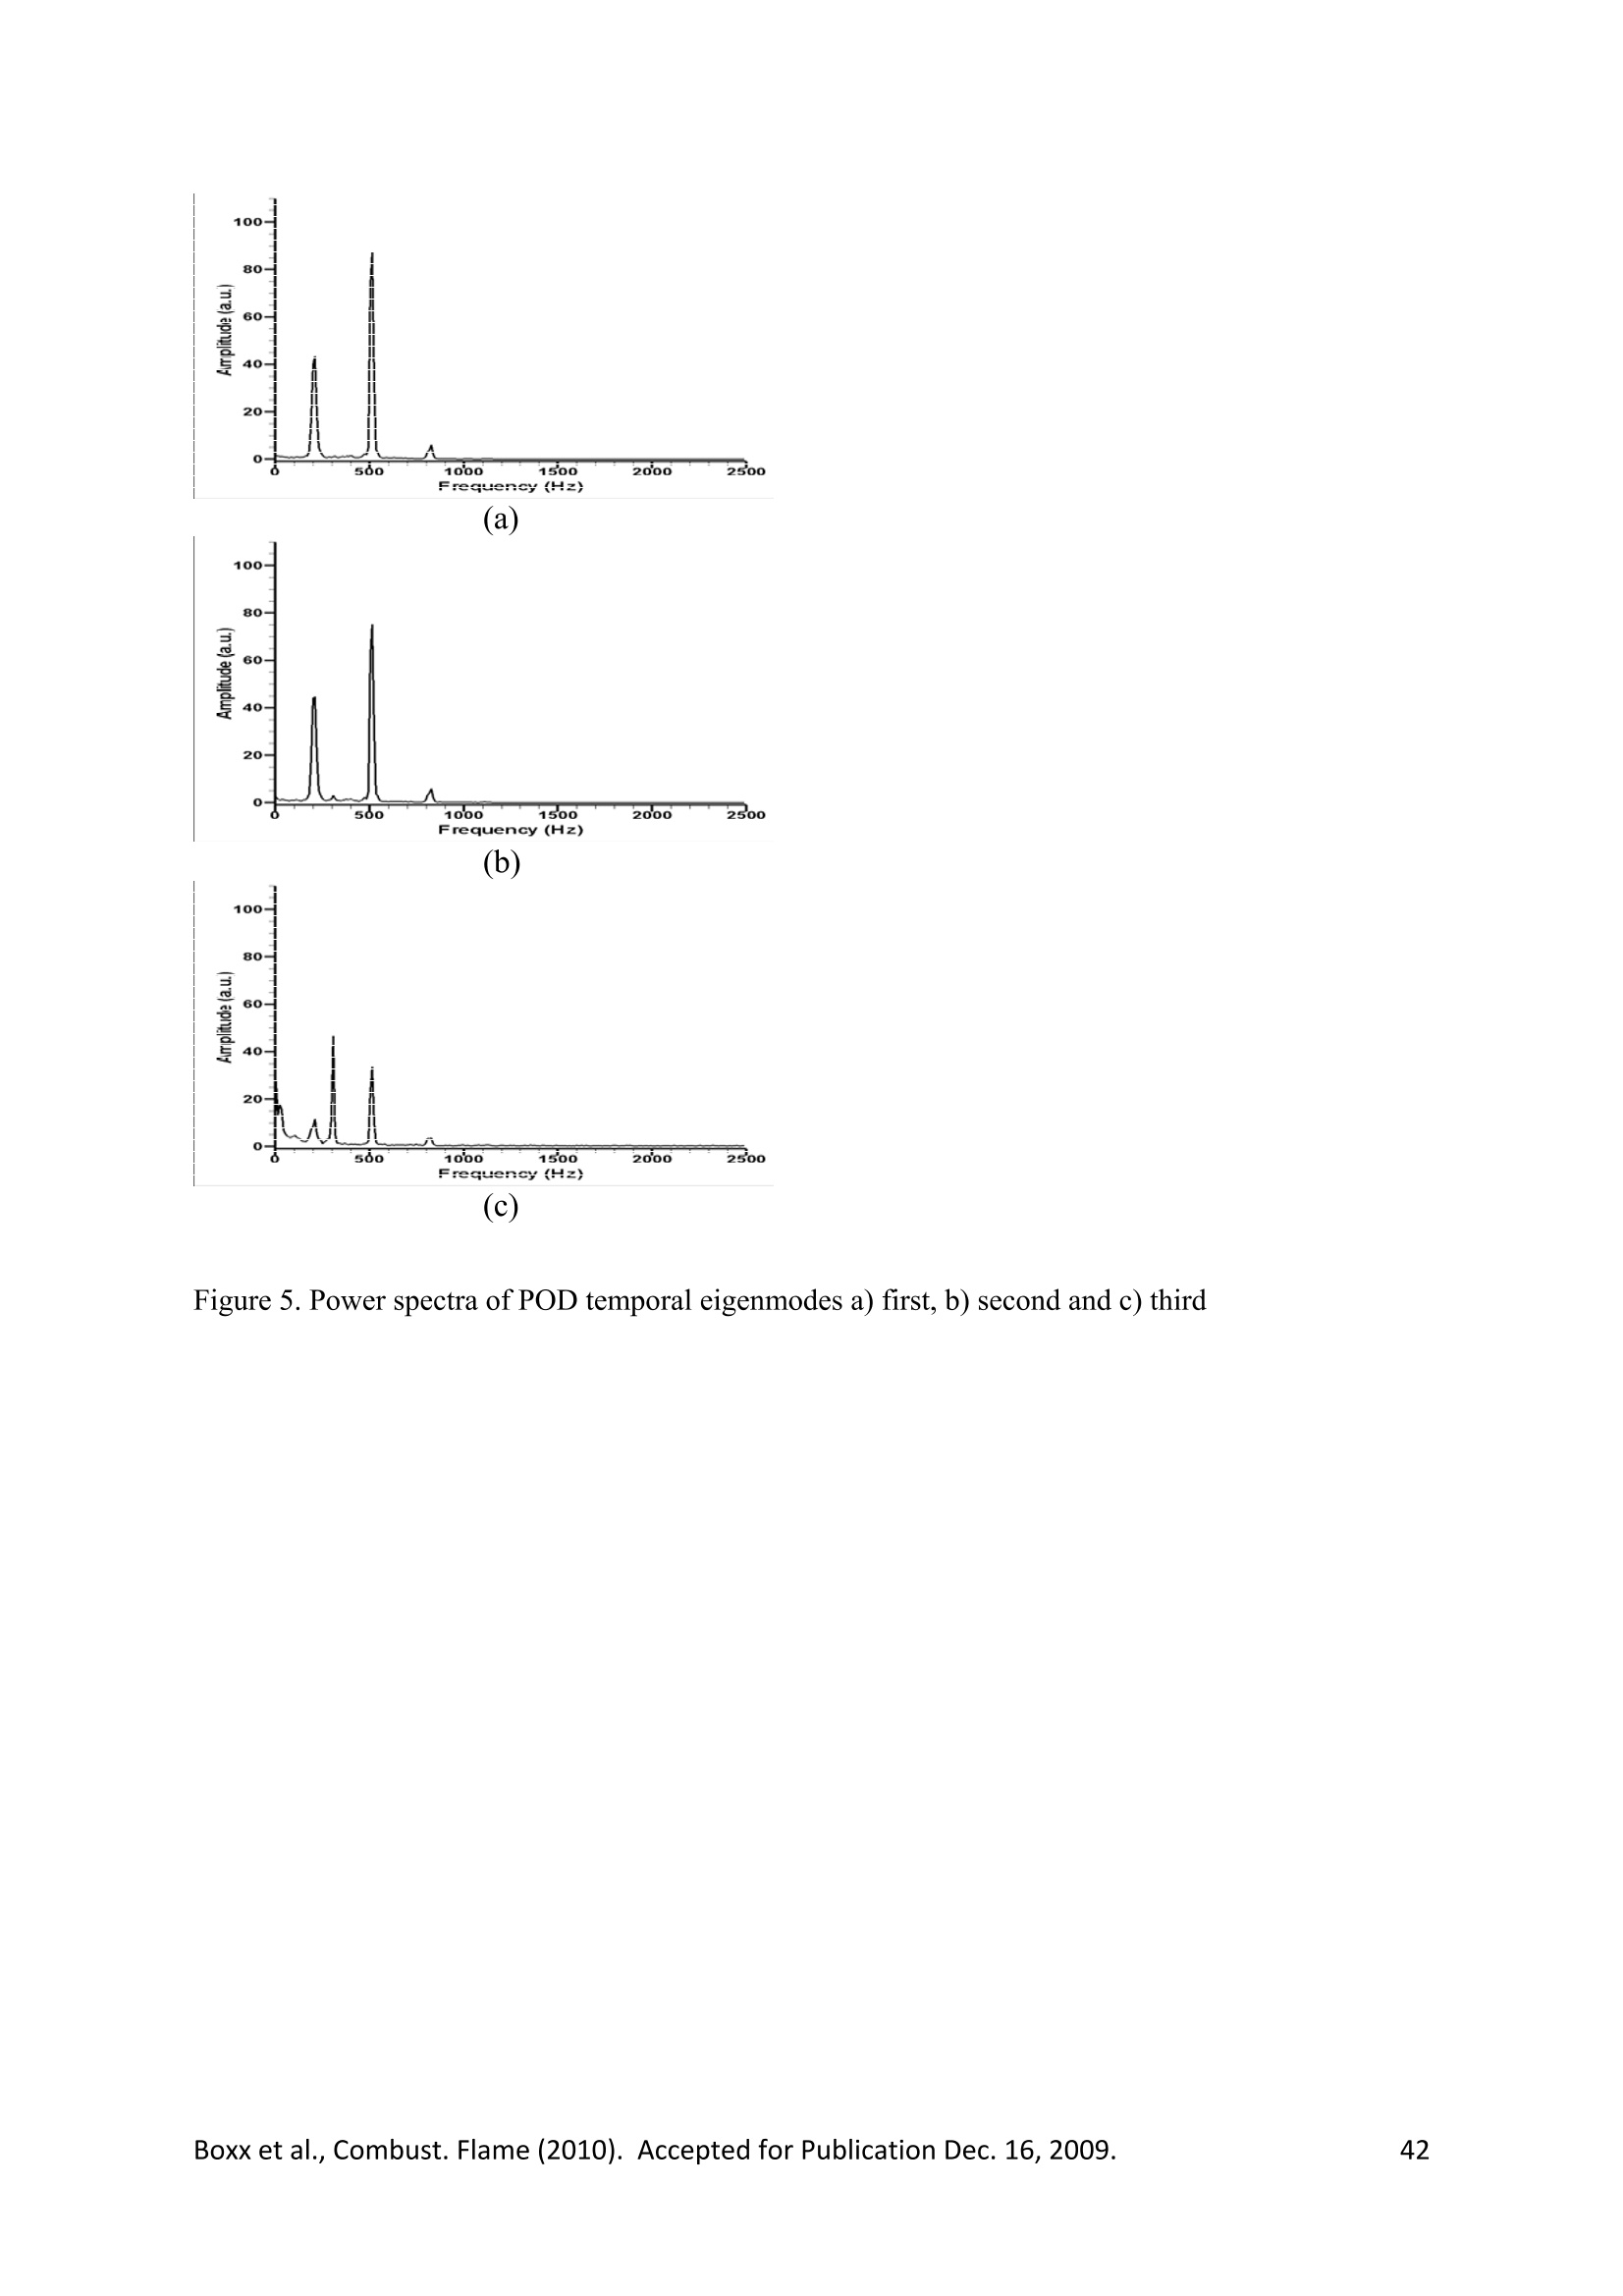
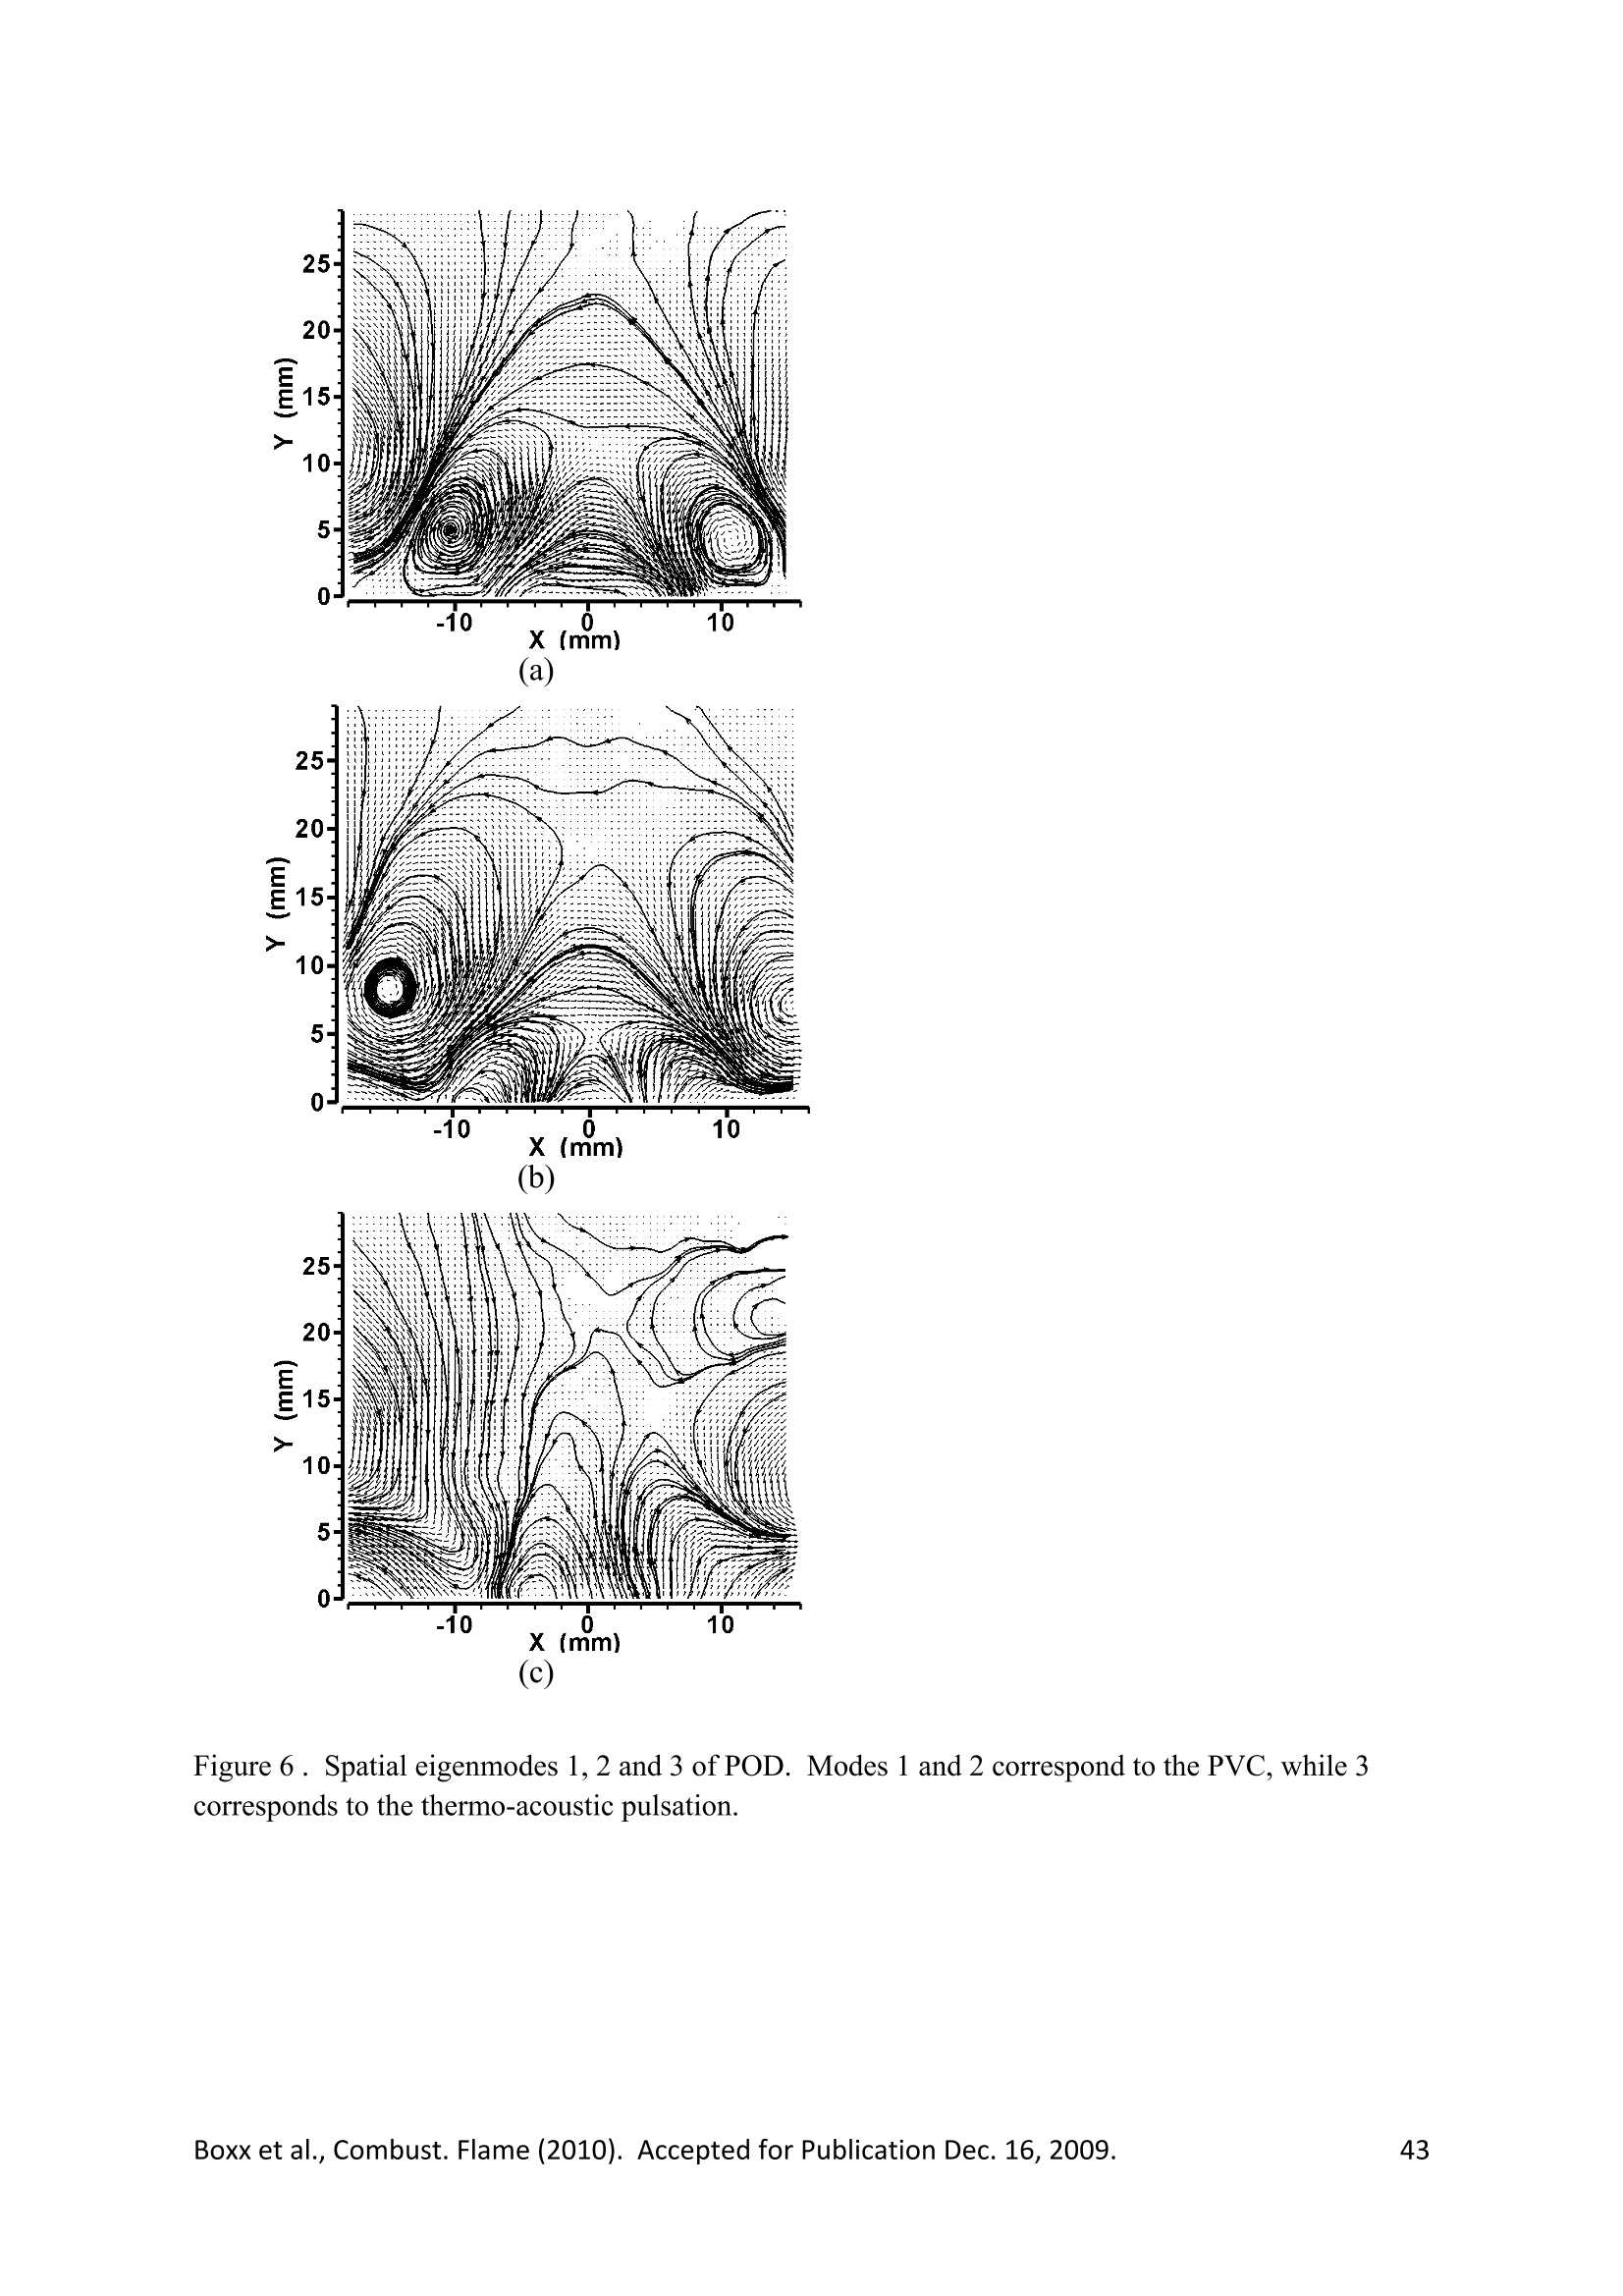
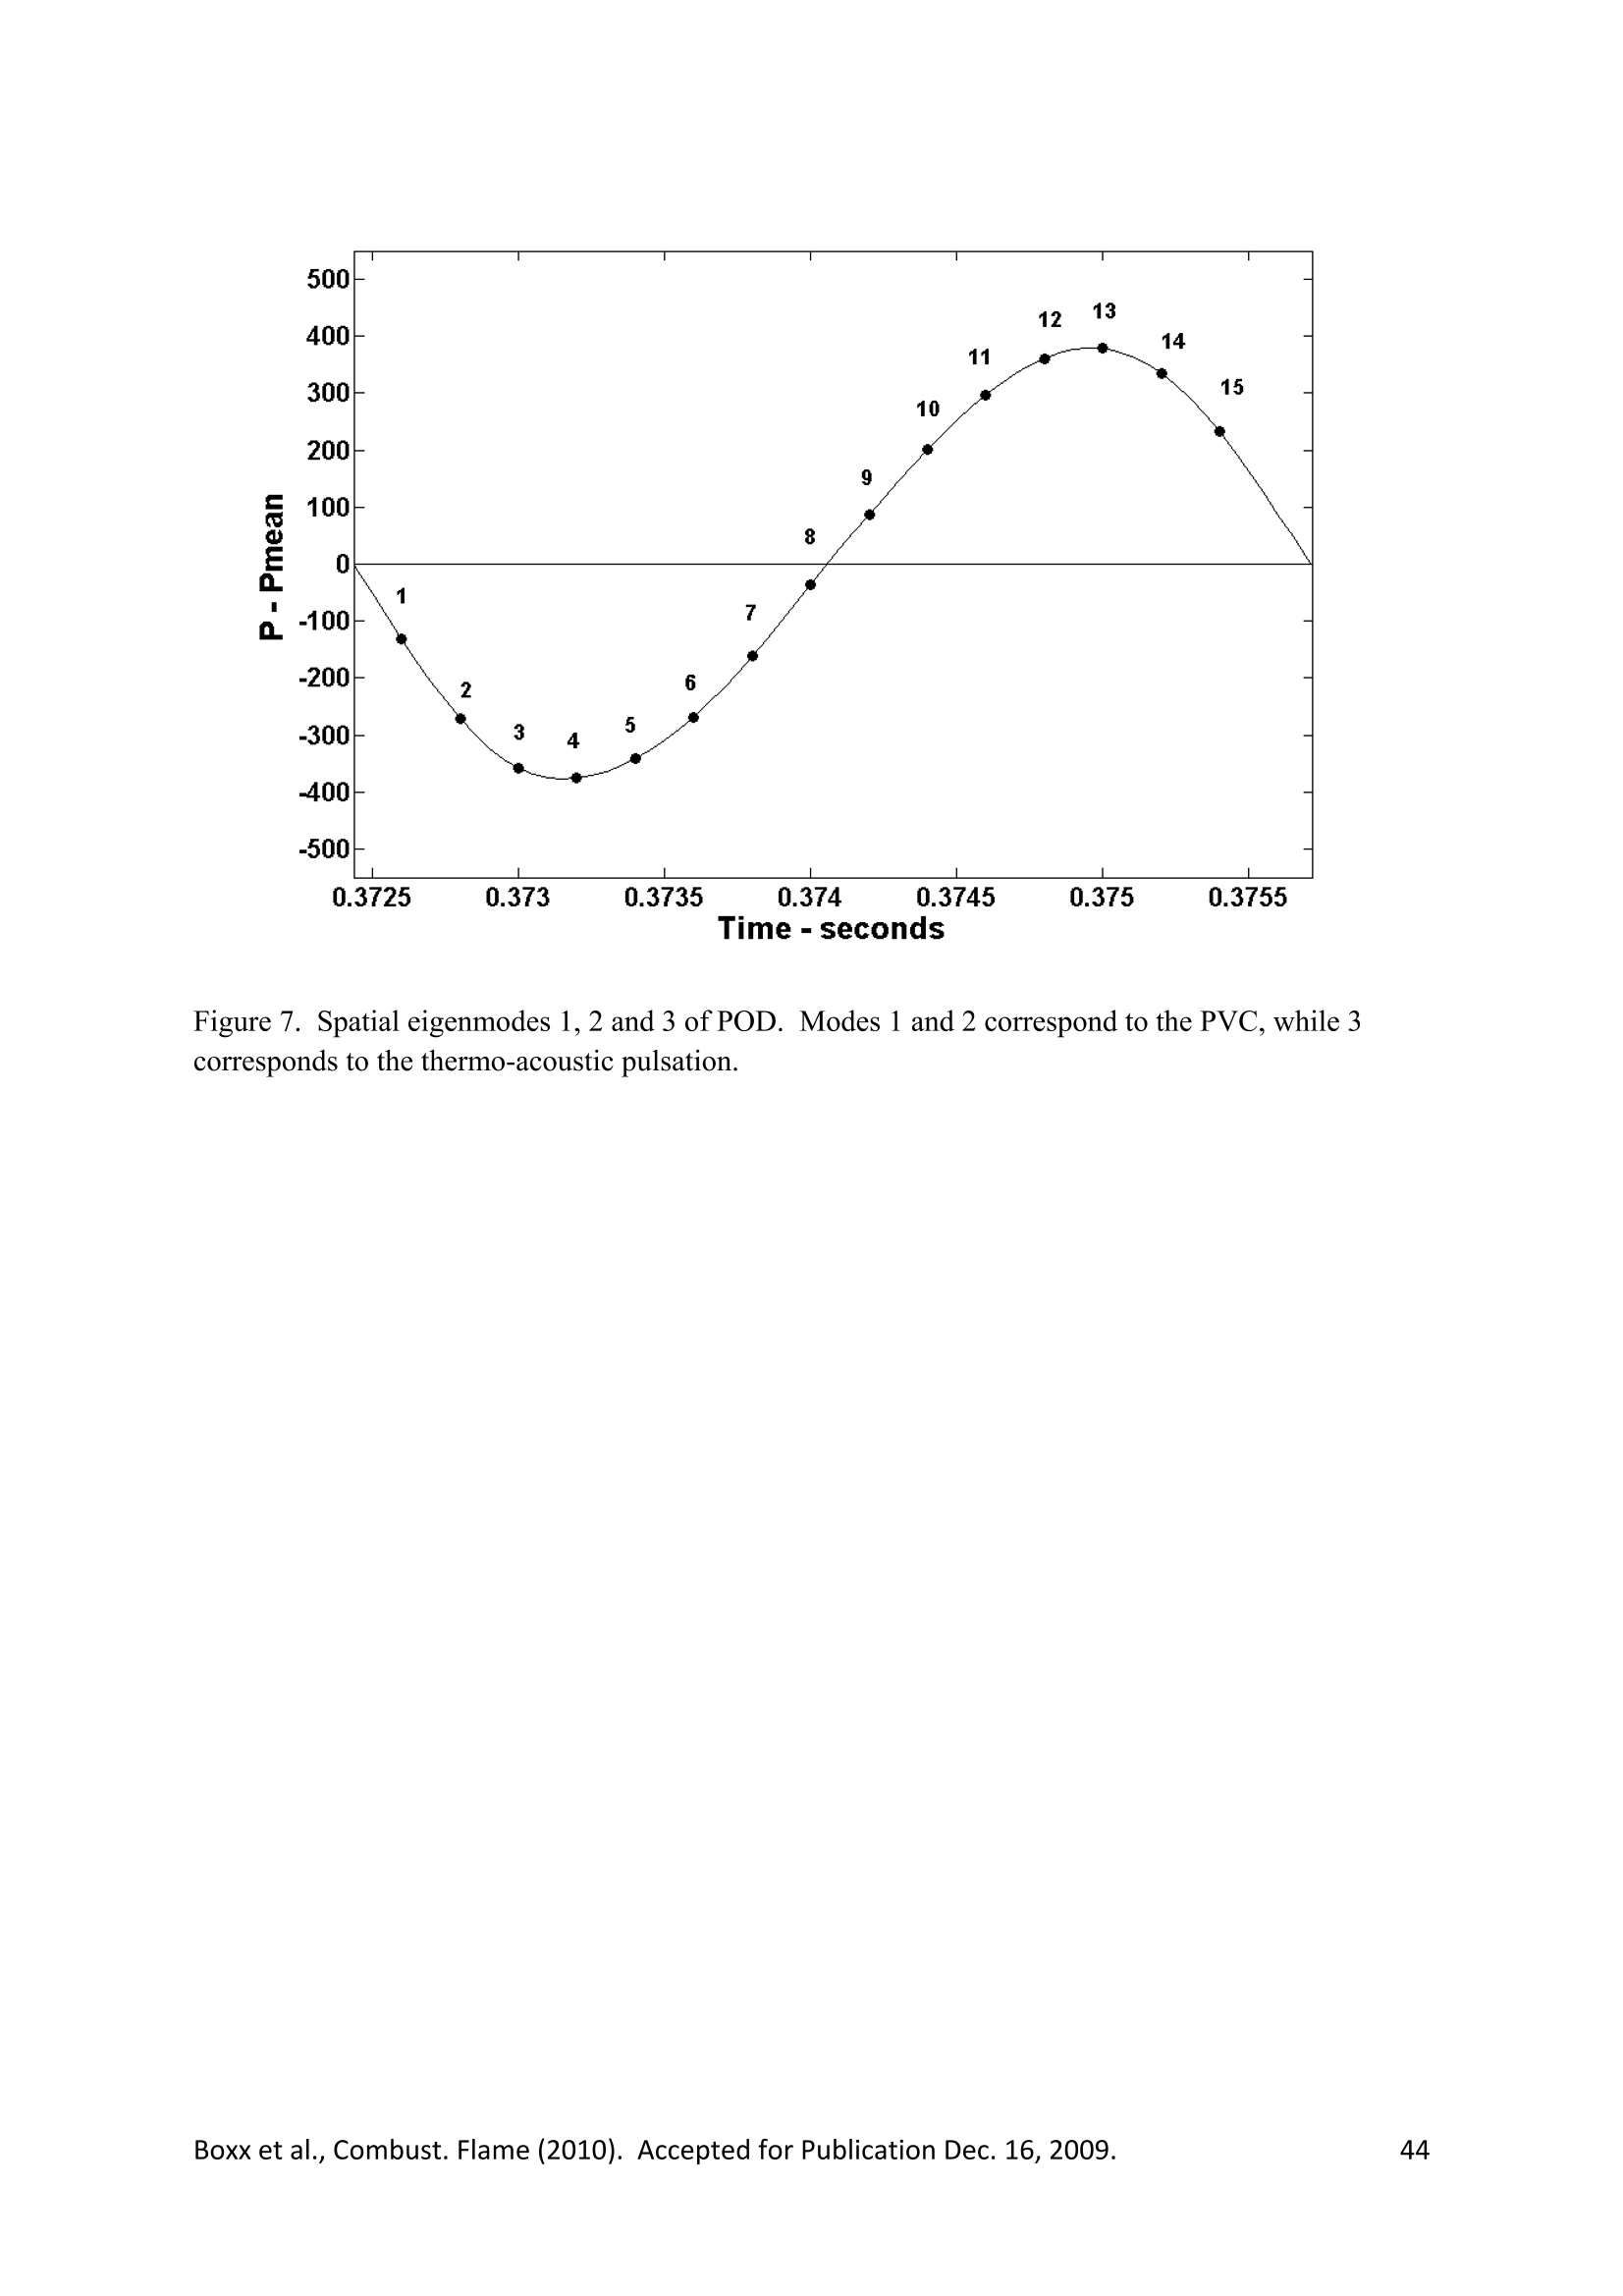
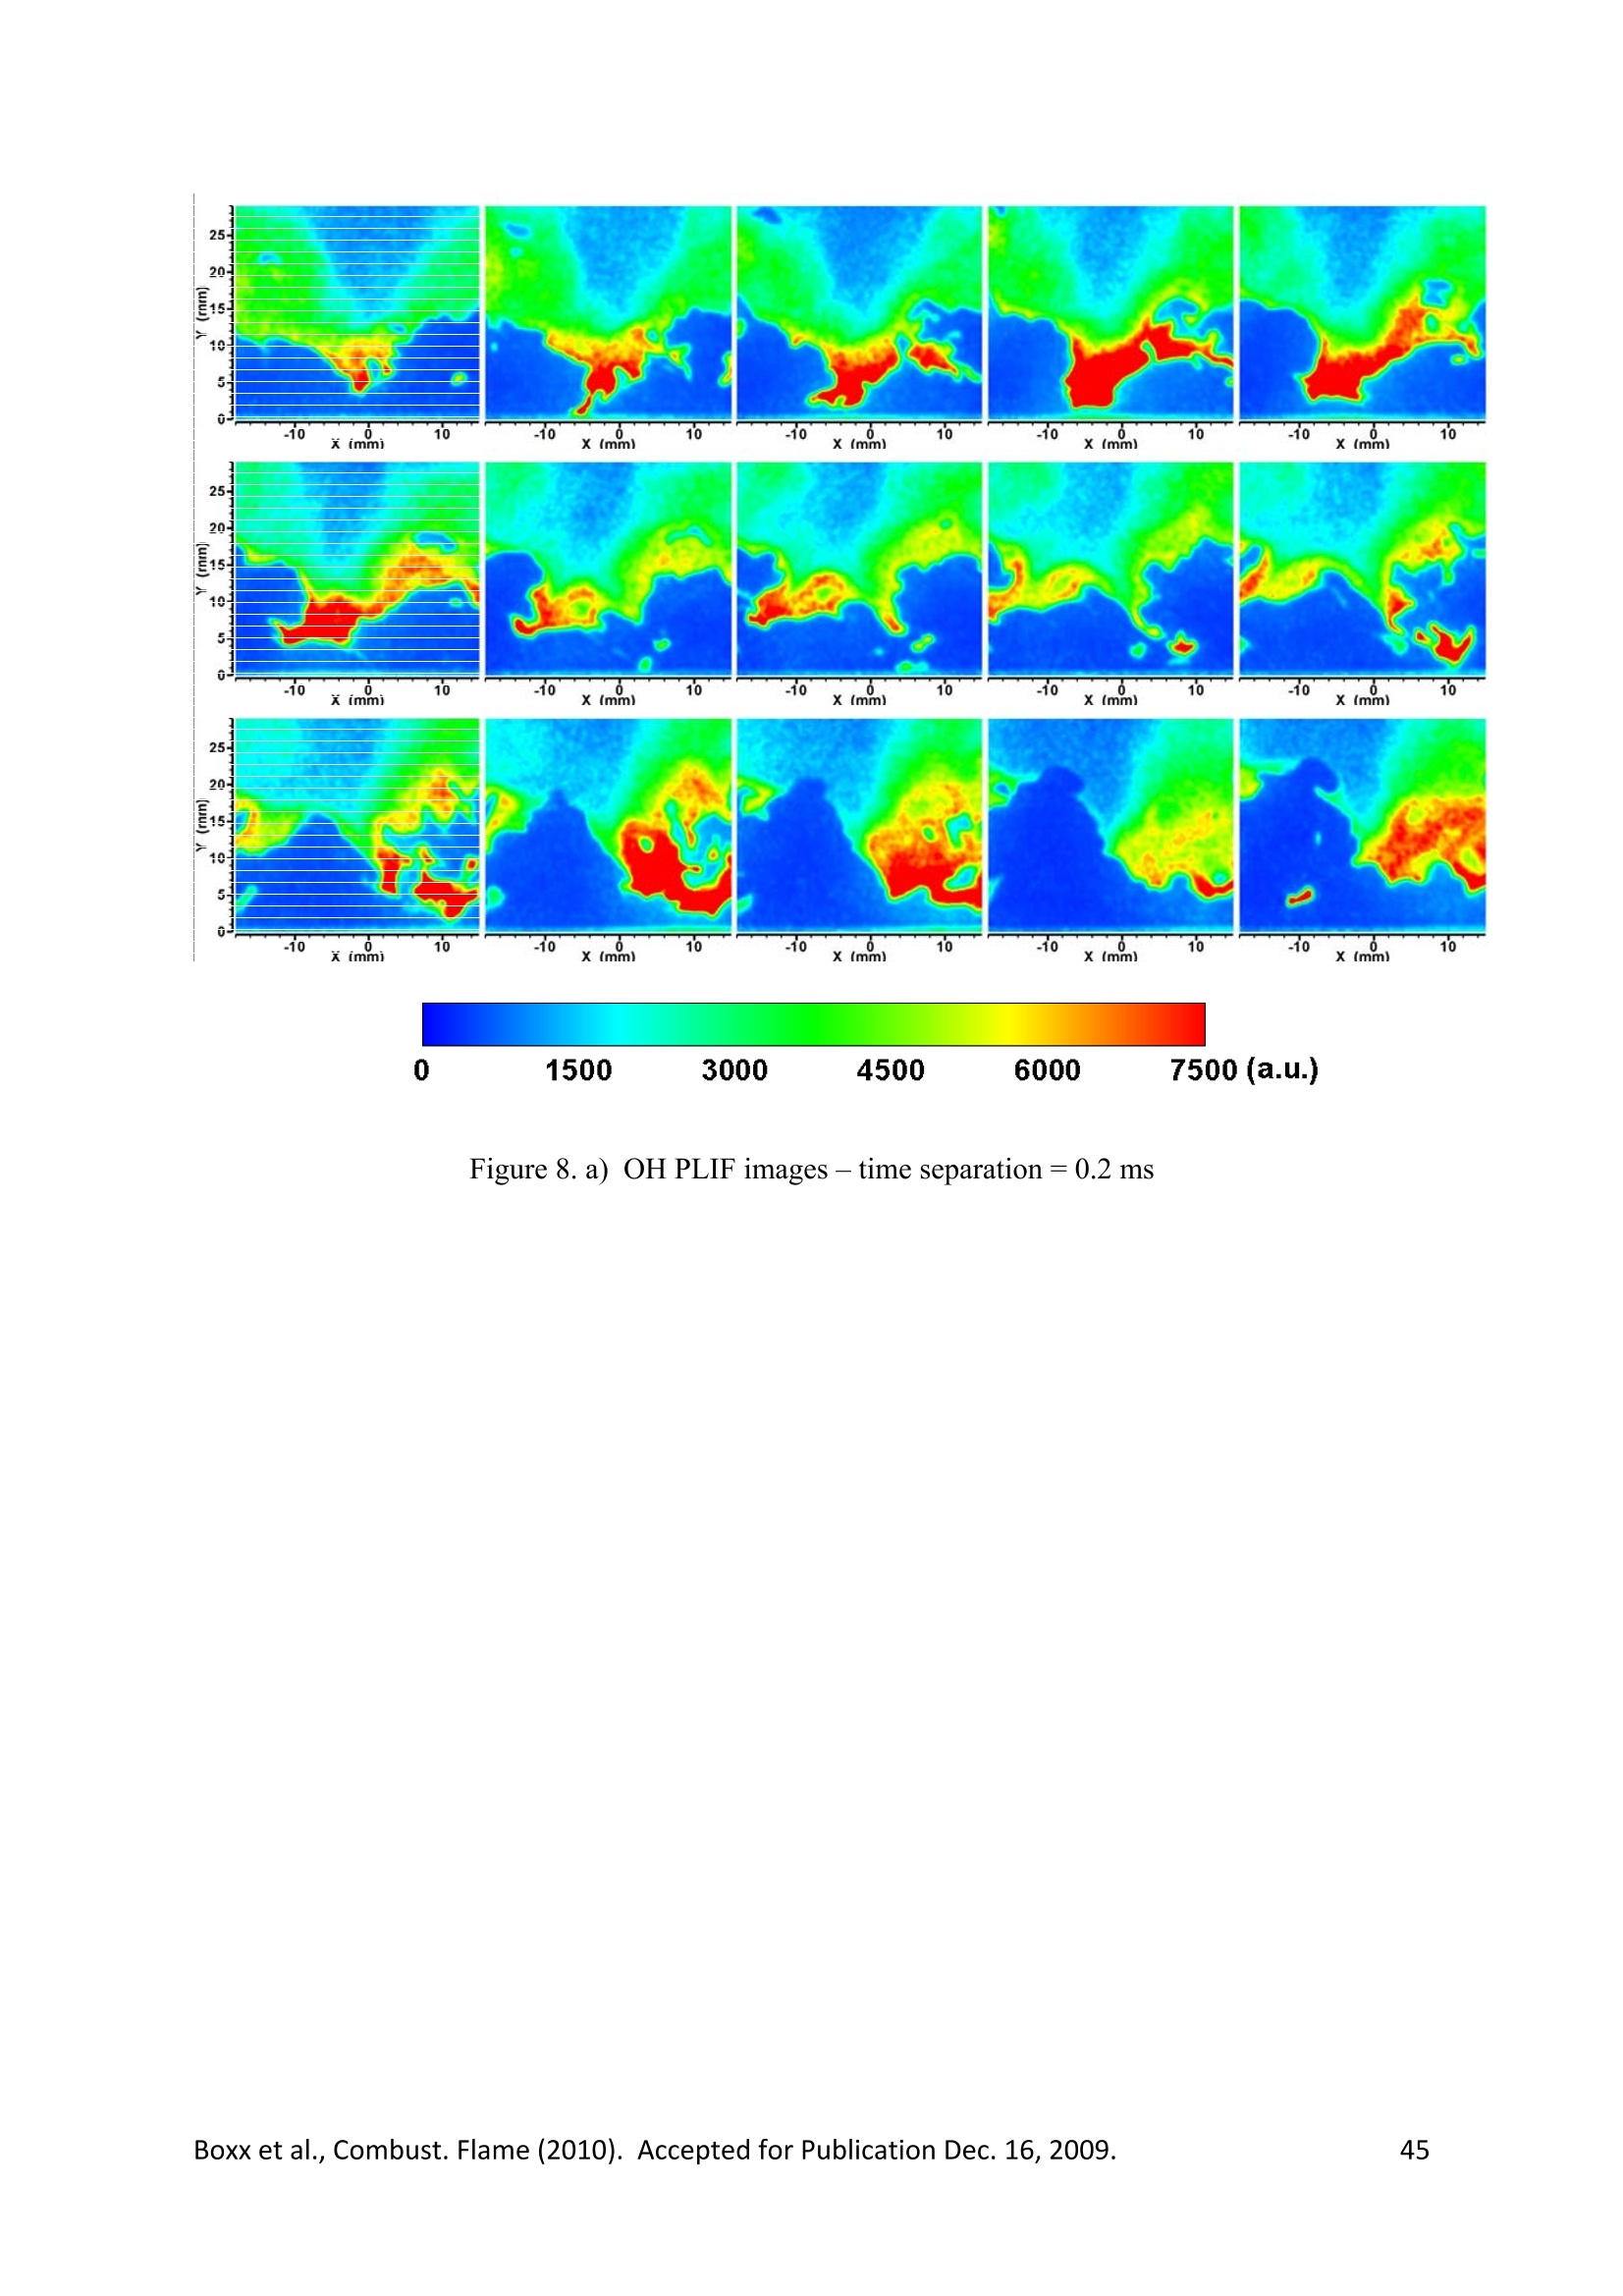
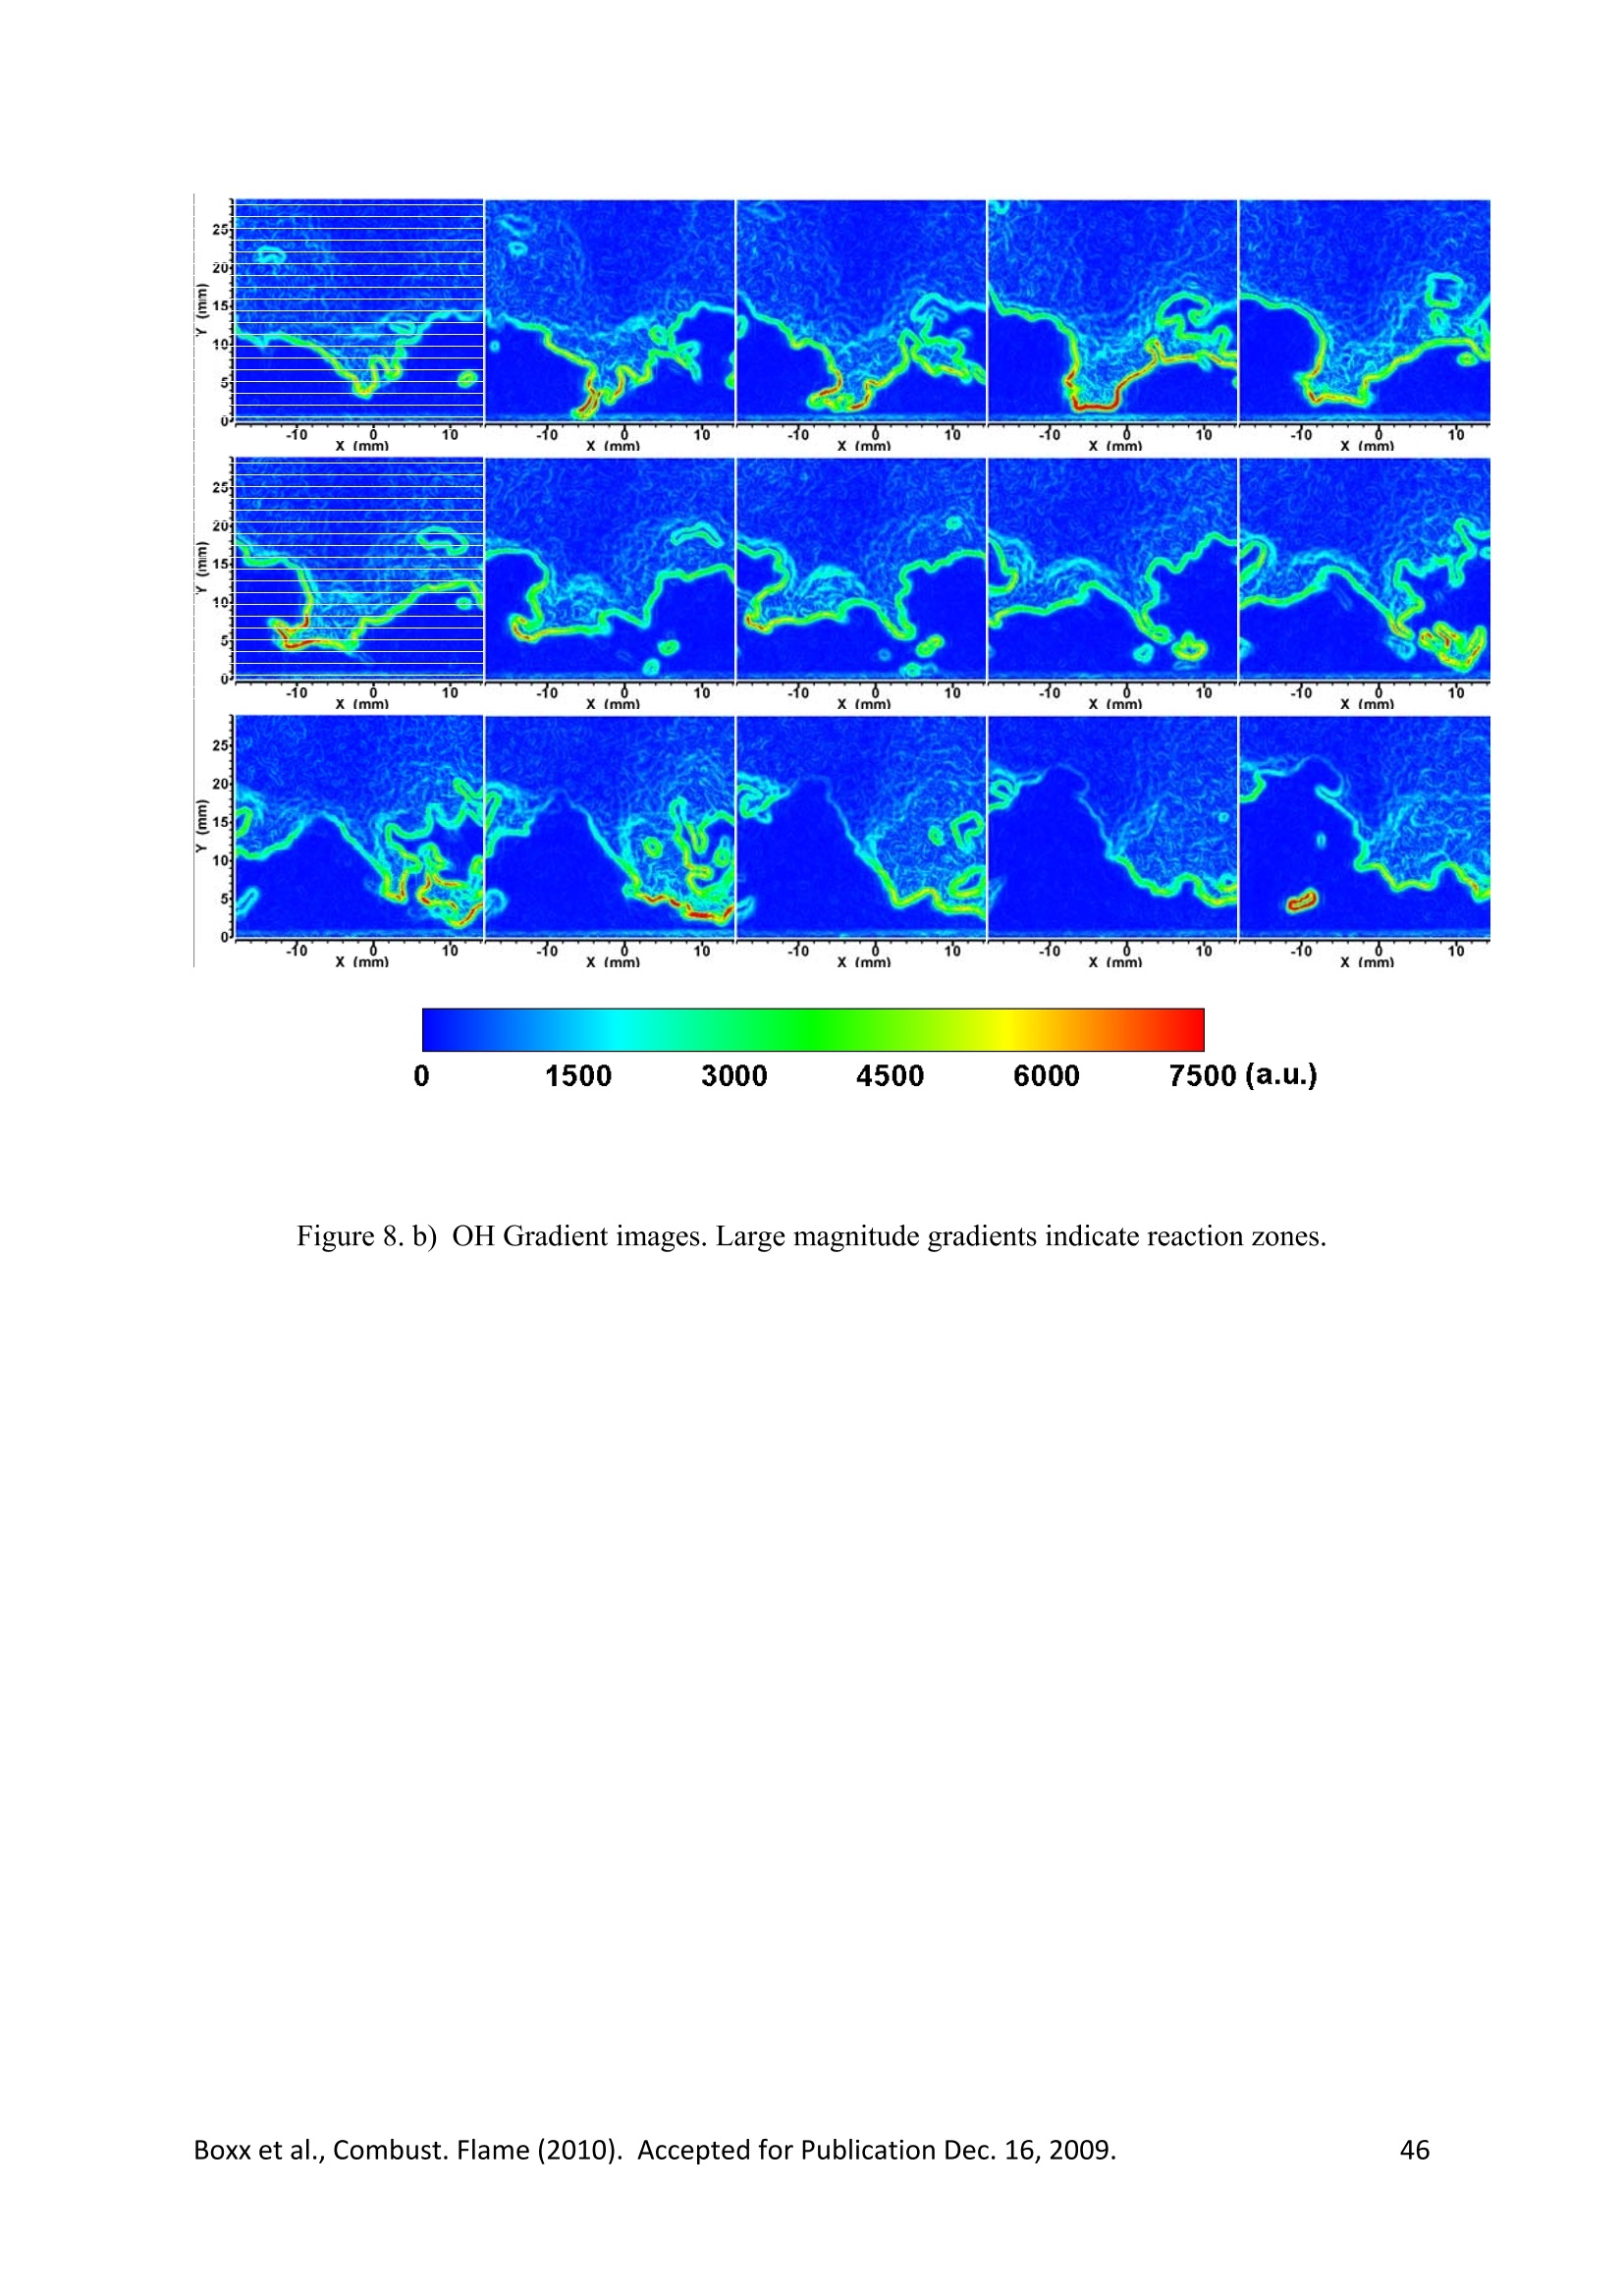
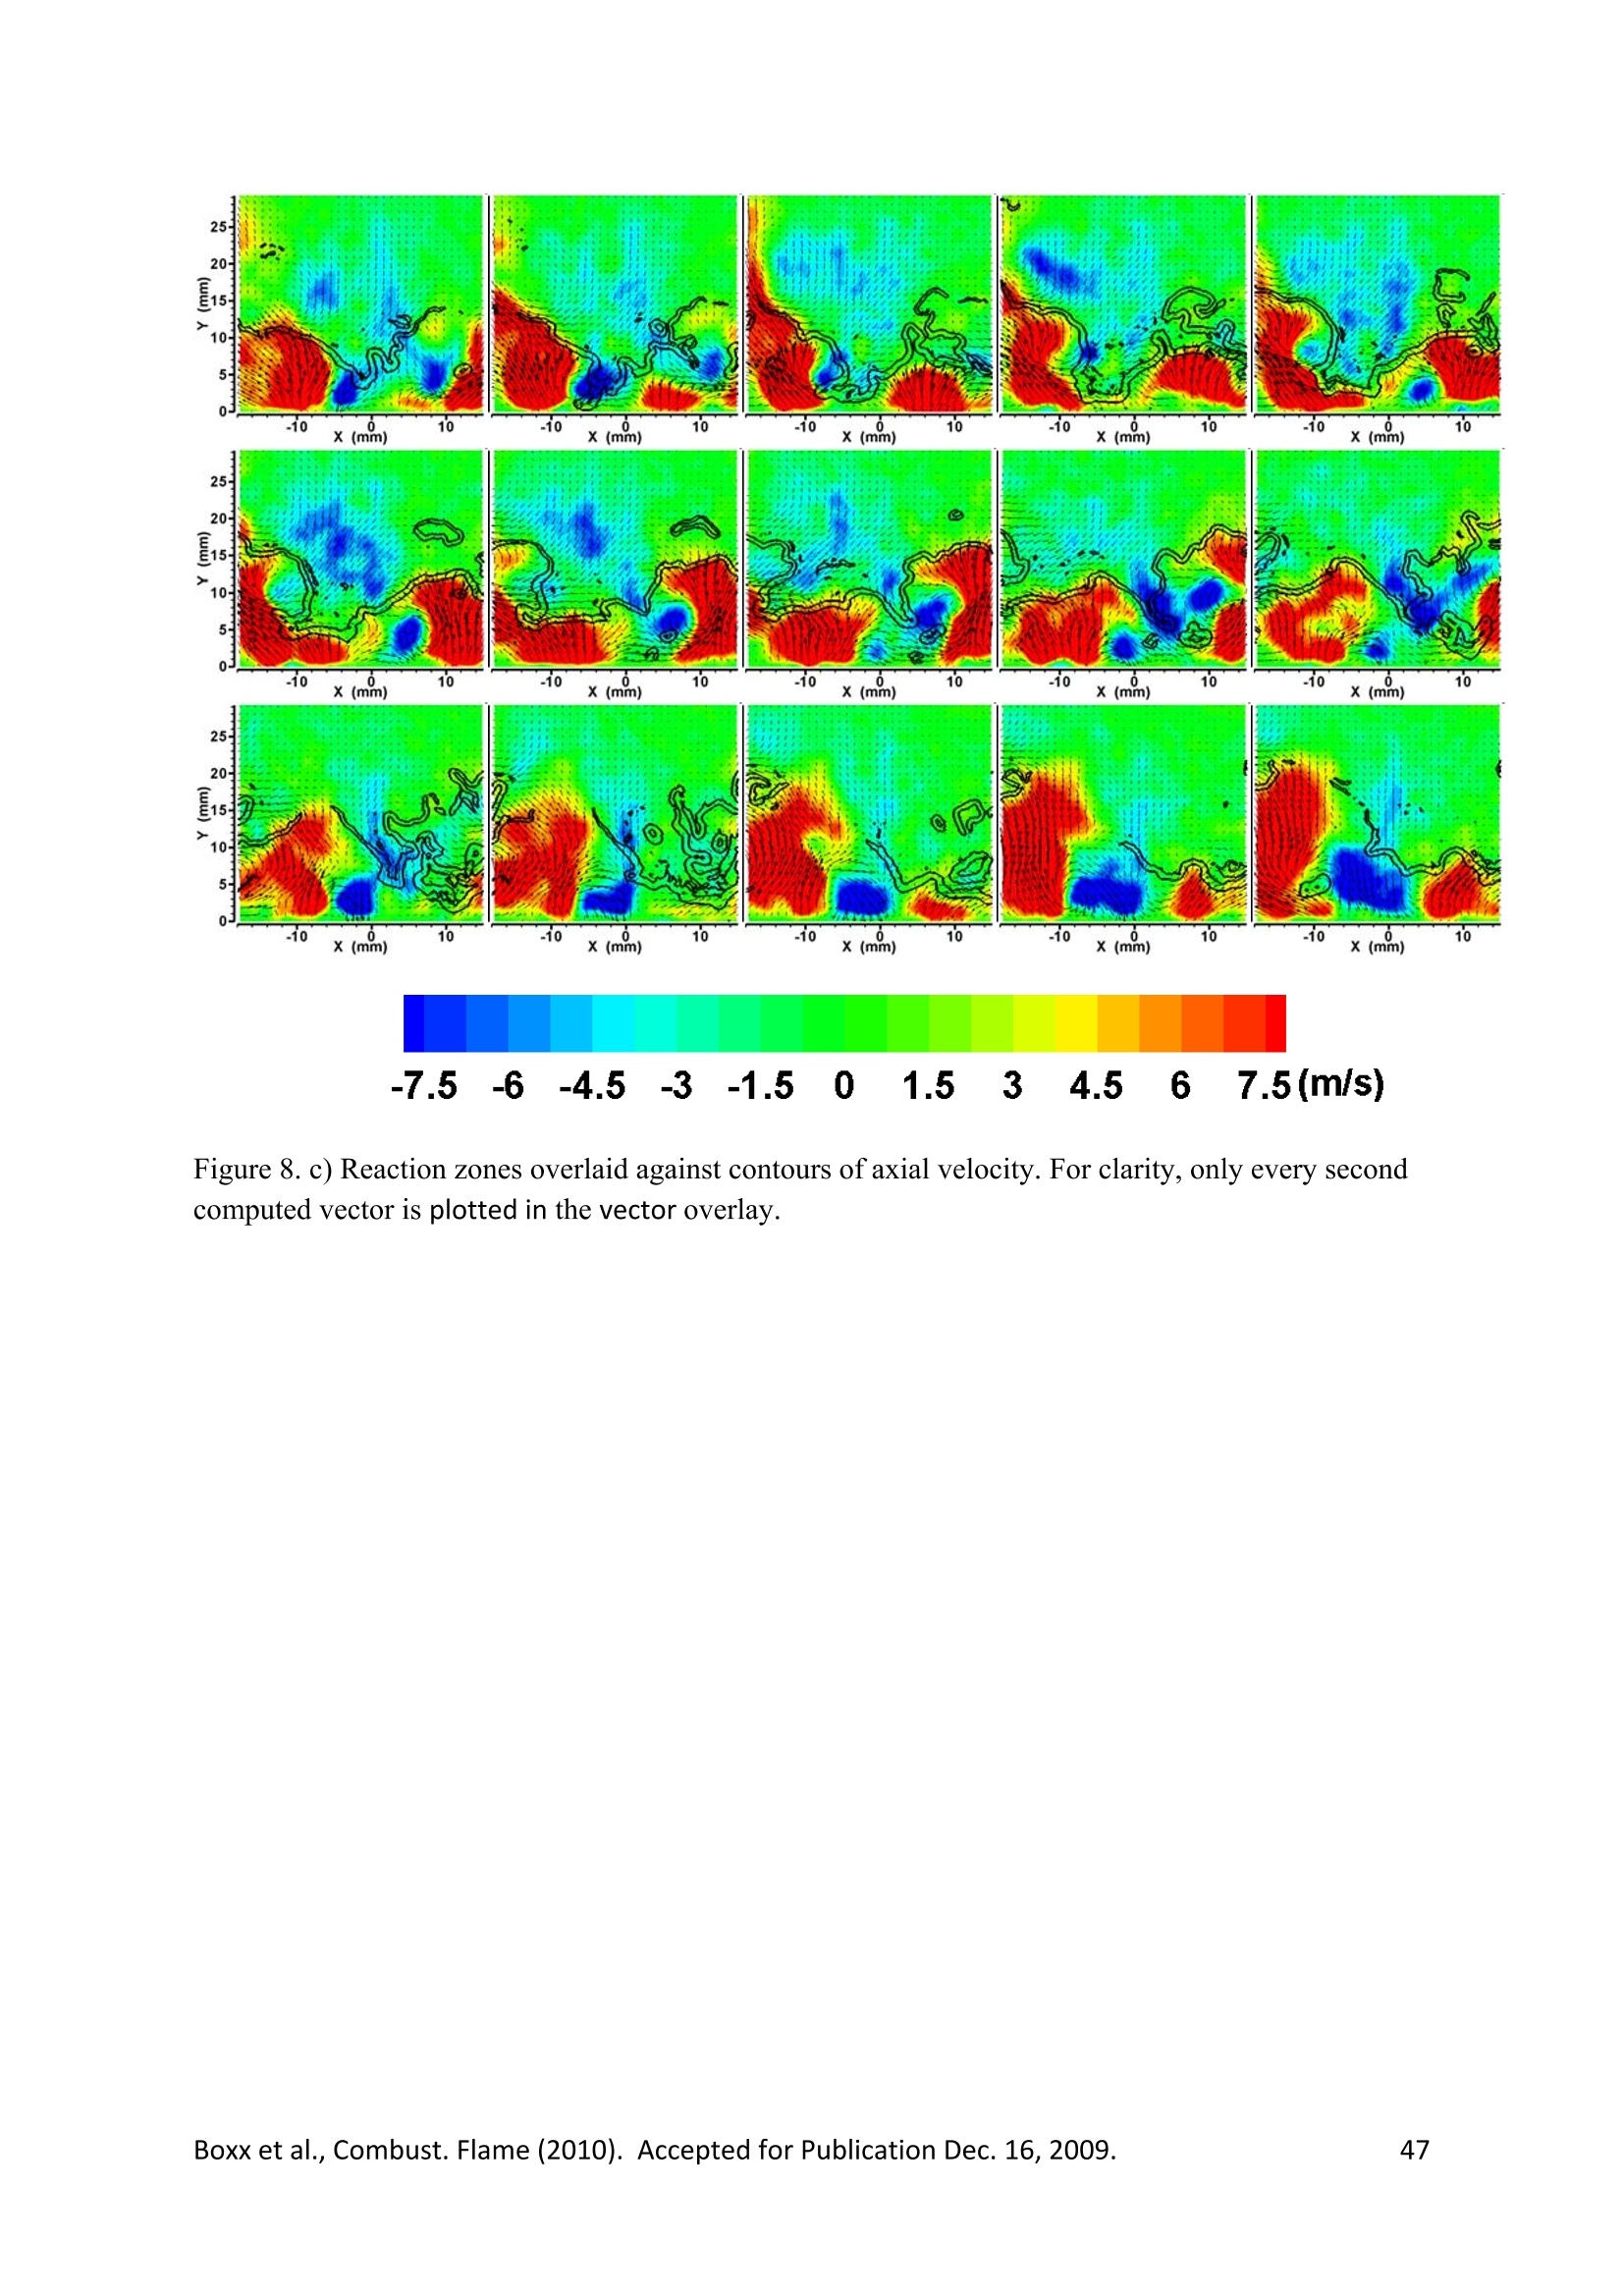
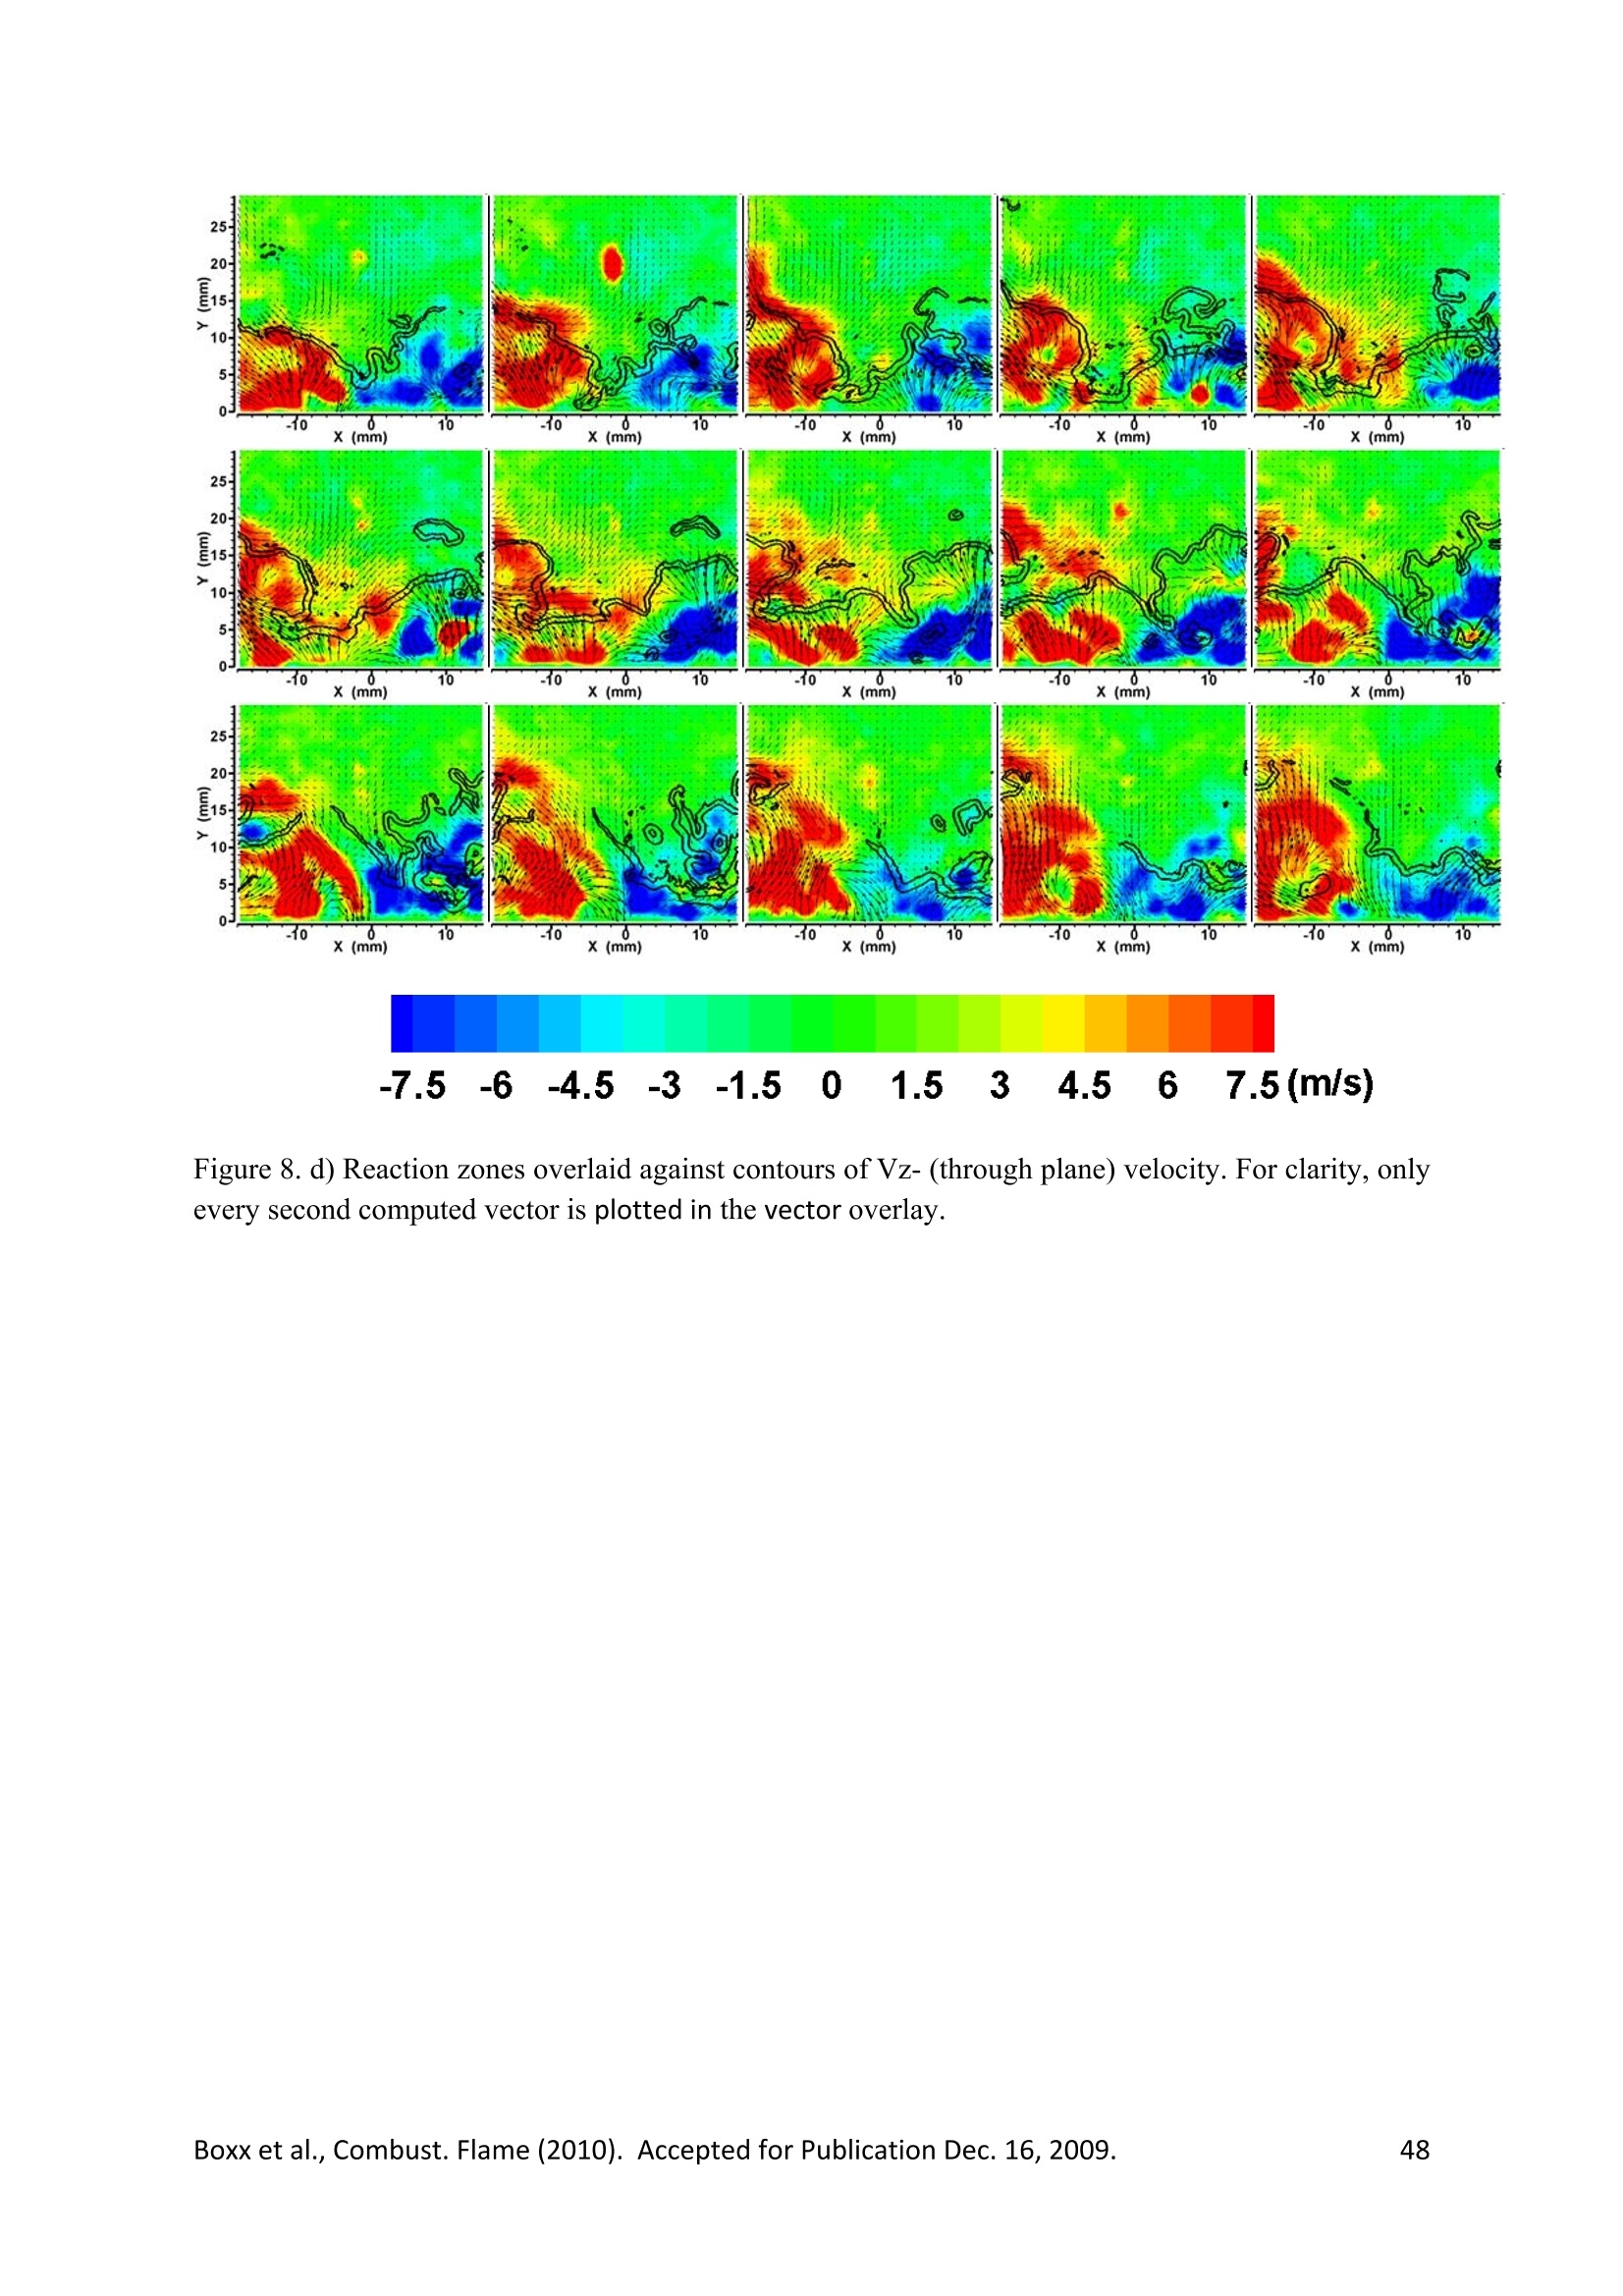
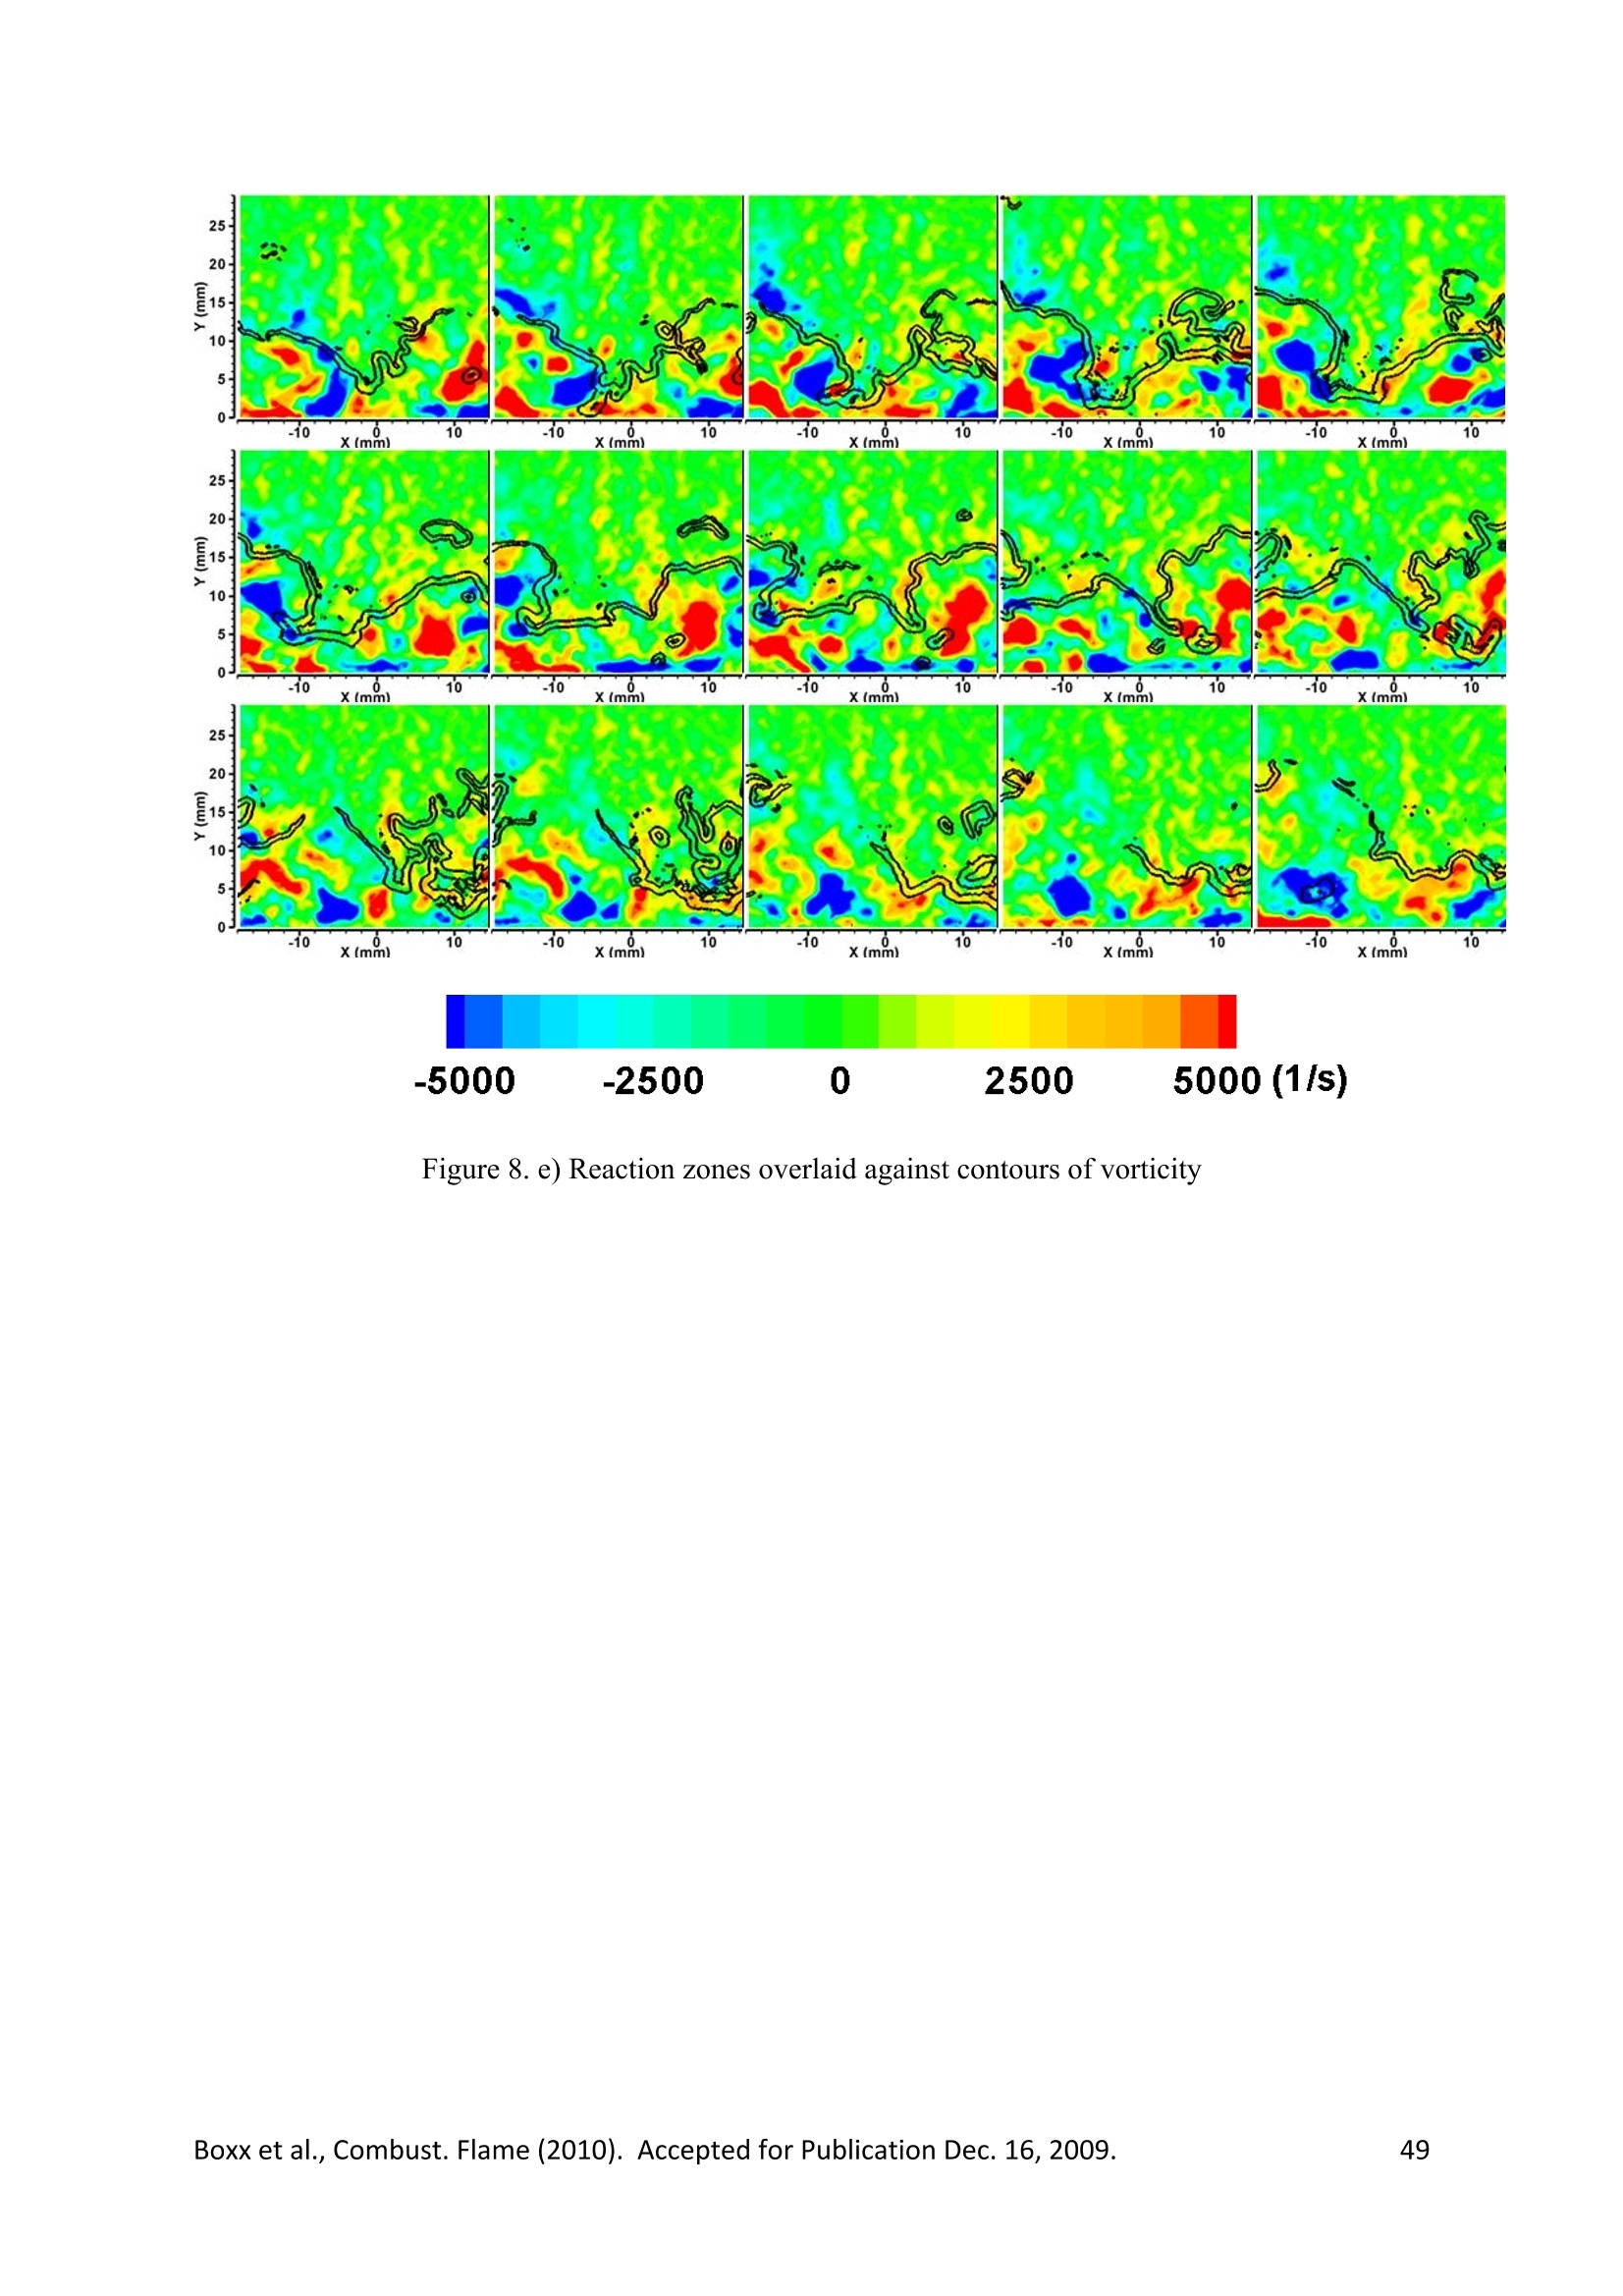
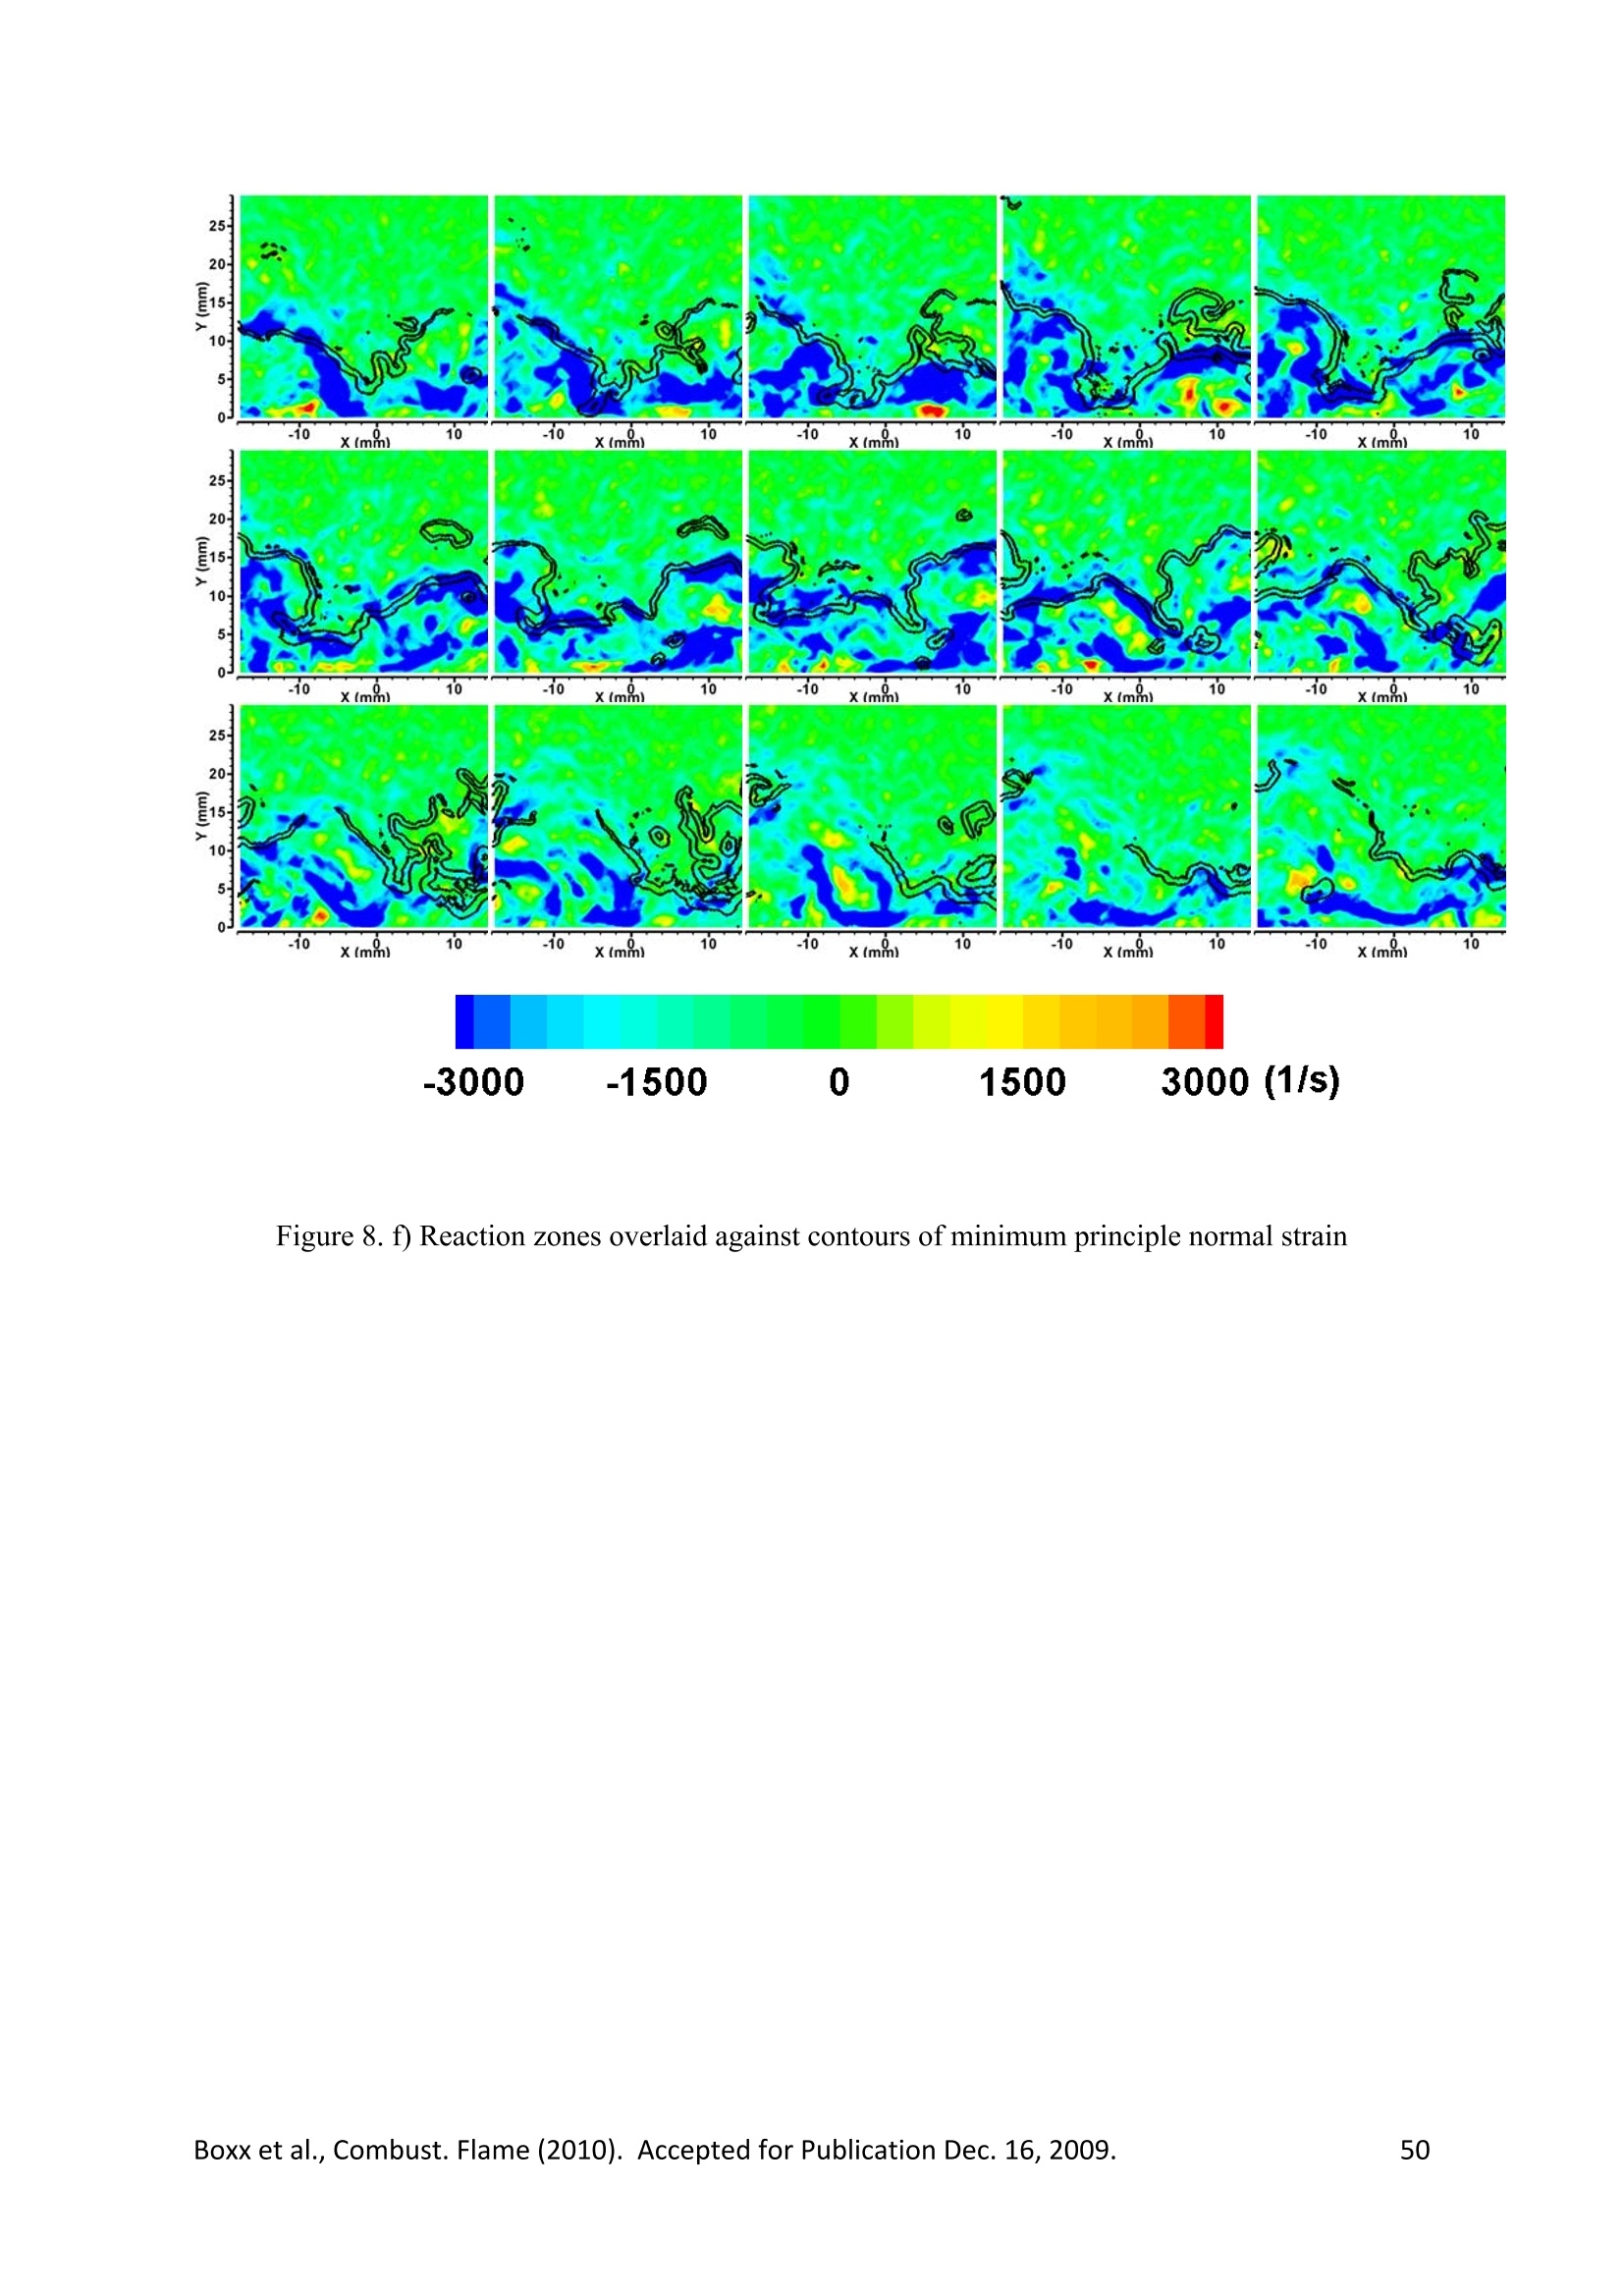

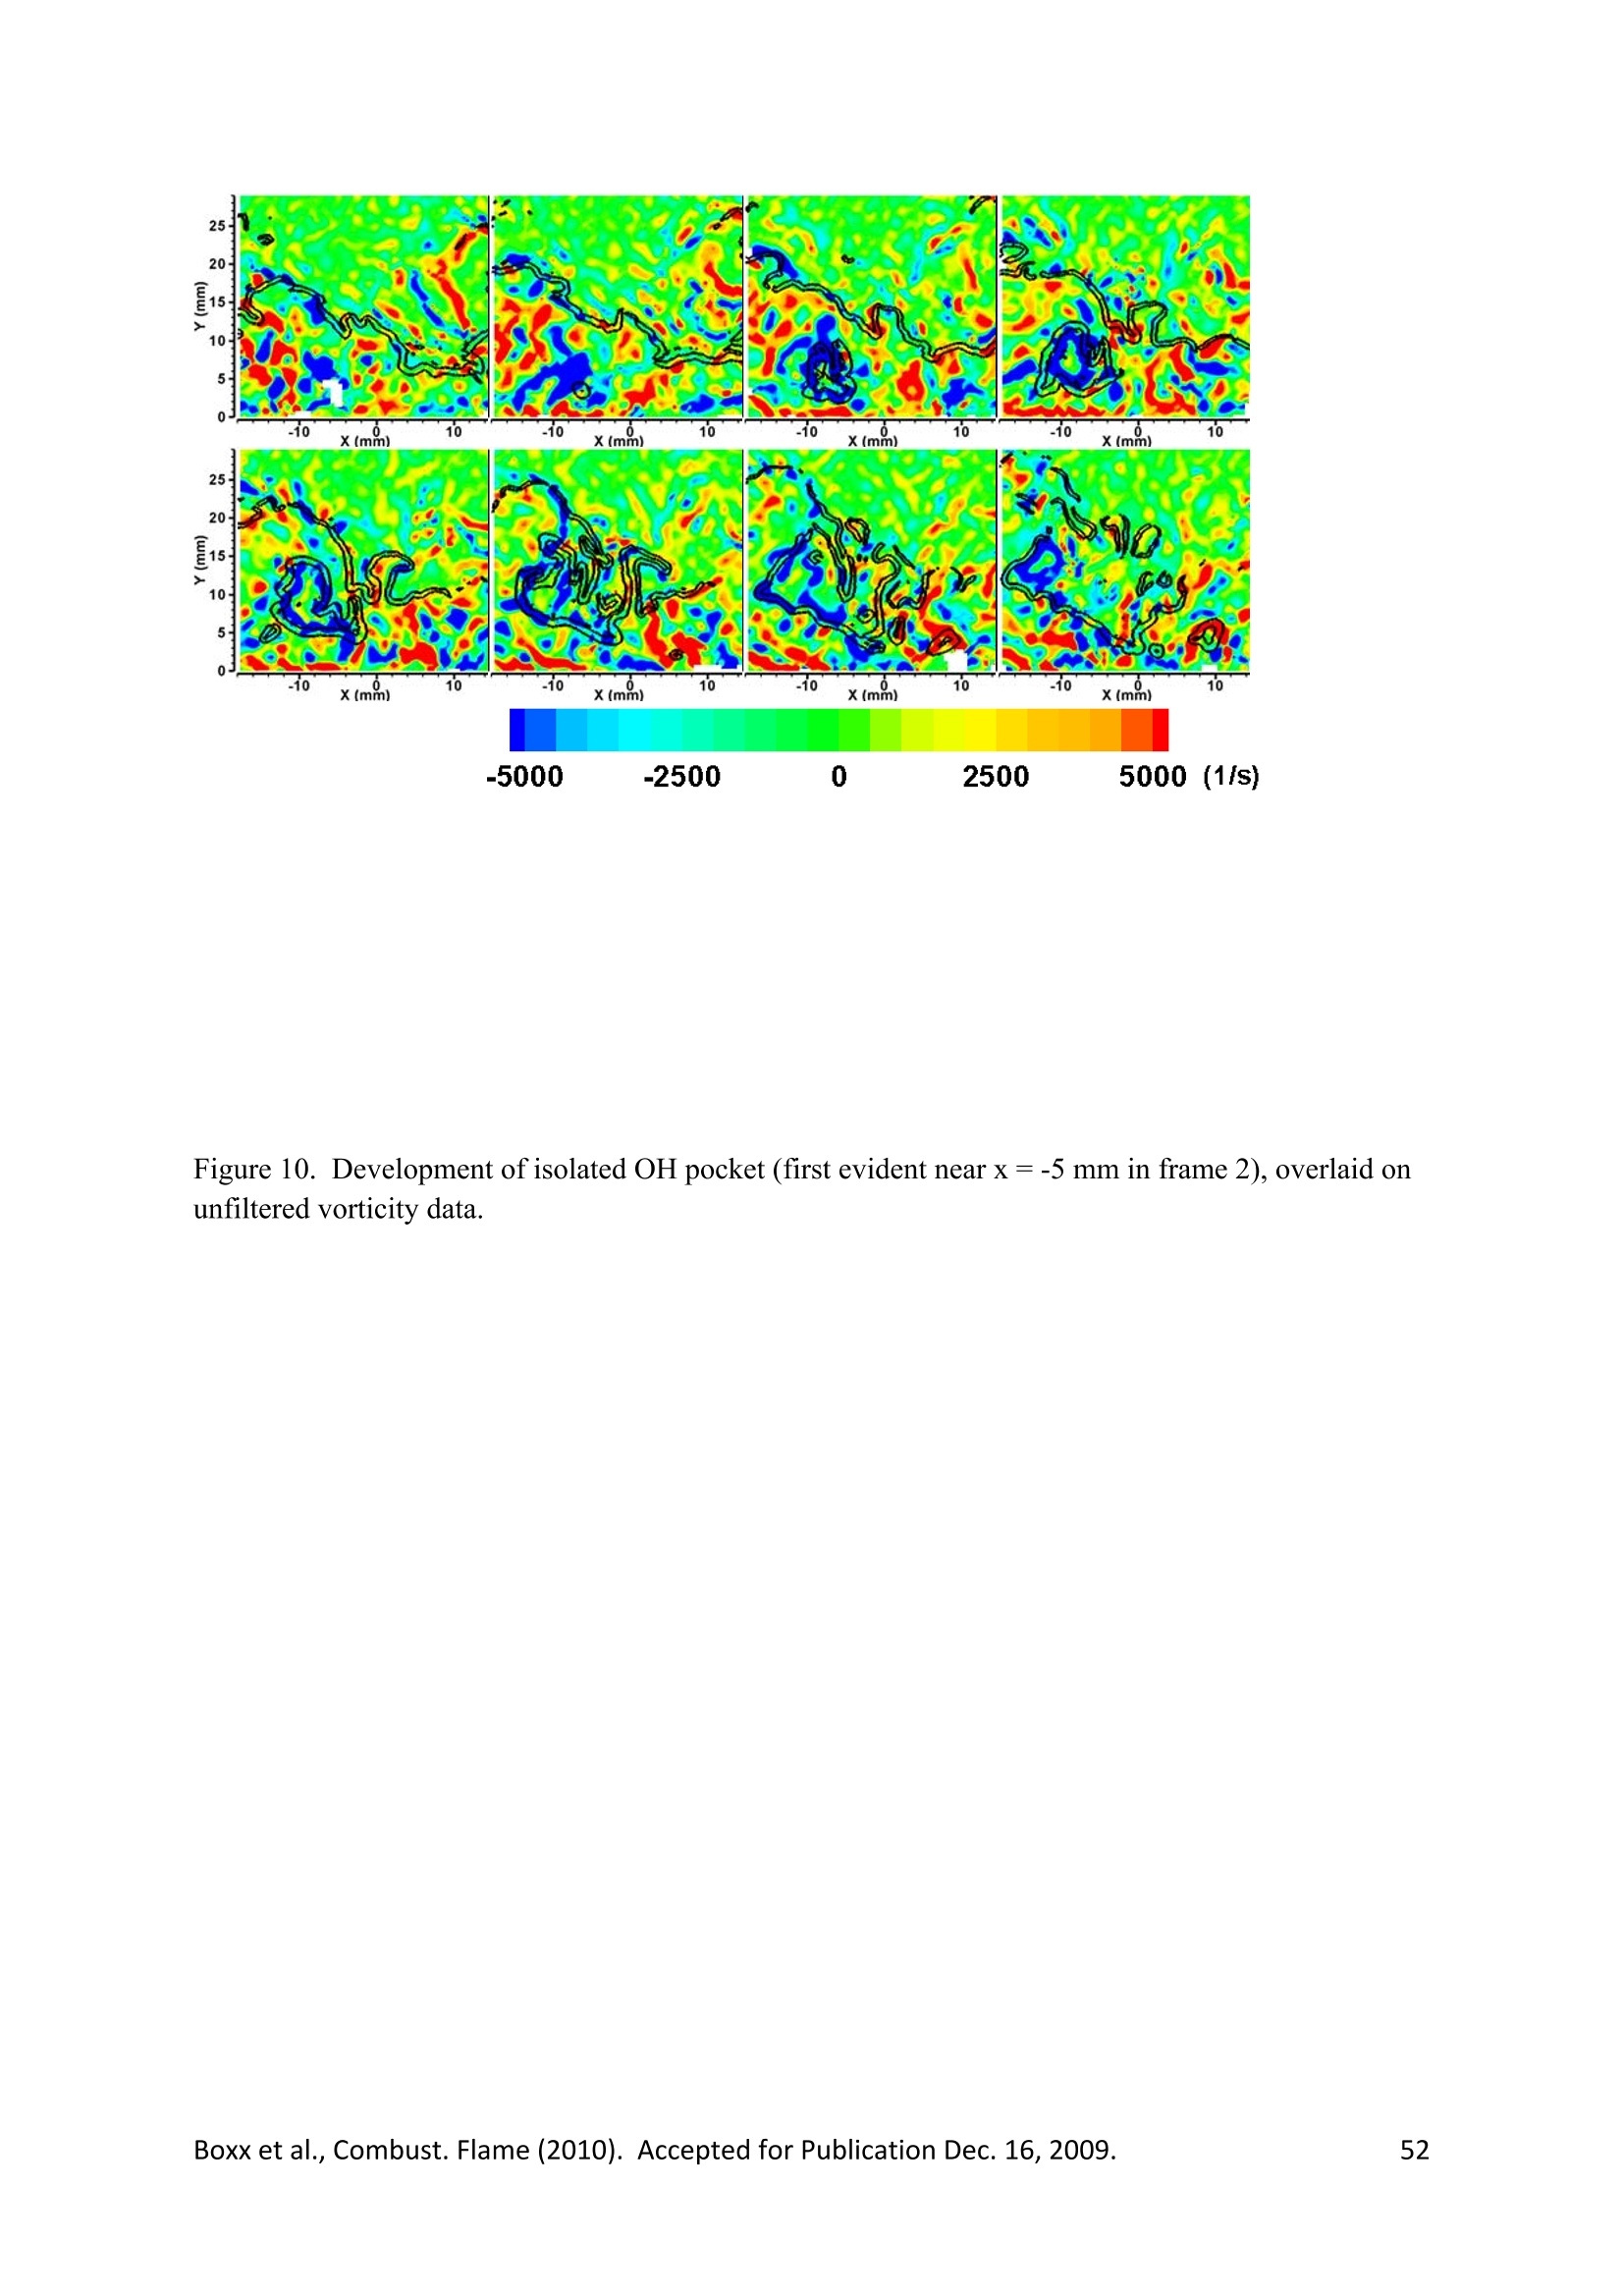
还剩51页未读,是否继续阅读?

产品配置单


北京欧兰科技发展有限公司为您提供《火焰中气体透平模型燃烧器部分预混和旋流火焰瞬态现象的平面时间分辨测量检测方案(流量计)》,该方案主要用于其他中气体透平模型燃烧器部分预混和旋流火焰瞬态现象的平面时间分辨测量检测,参考标准--,《火焰中气体透平模型燃烧器部分预混和旋流火焰瞬态现象的平面时间分辨测量检测方案(流量计)》用到的仪器有PLIF平面激光诱导荧光火焰燃烧检测系统、Imager sCMOS PIV相机、德国LaVision PIV/PLIF粒子成像测速场仪
推荐专场


相关方案
更多
该厂商其他方案
更多