


方案详情
文
Low-frequency combustion instabilities were studied experimentally in a model lean-premixed stepped
combustor. The PLIF technique was used to characterize the flame structure. The PIV technique, associated with
high-speed visualization of the OH* radical chemiluminescence’s emission, allowed to investigate the flow field
during the quasi-periodic unsteady flashback when the flame lifted from the edge of the step and moved periodically
in and out of the premixing duct. Results strongly suggest that impact of acoustic waves on the flame structure
should be taken into account when applying LES approach to industrial gas turbines.
方案详情

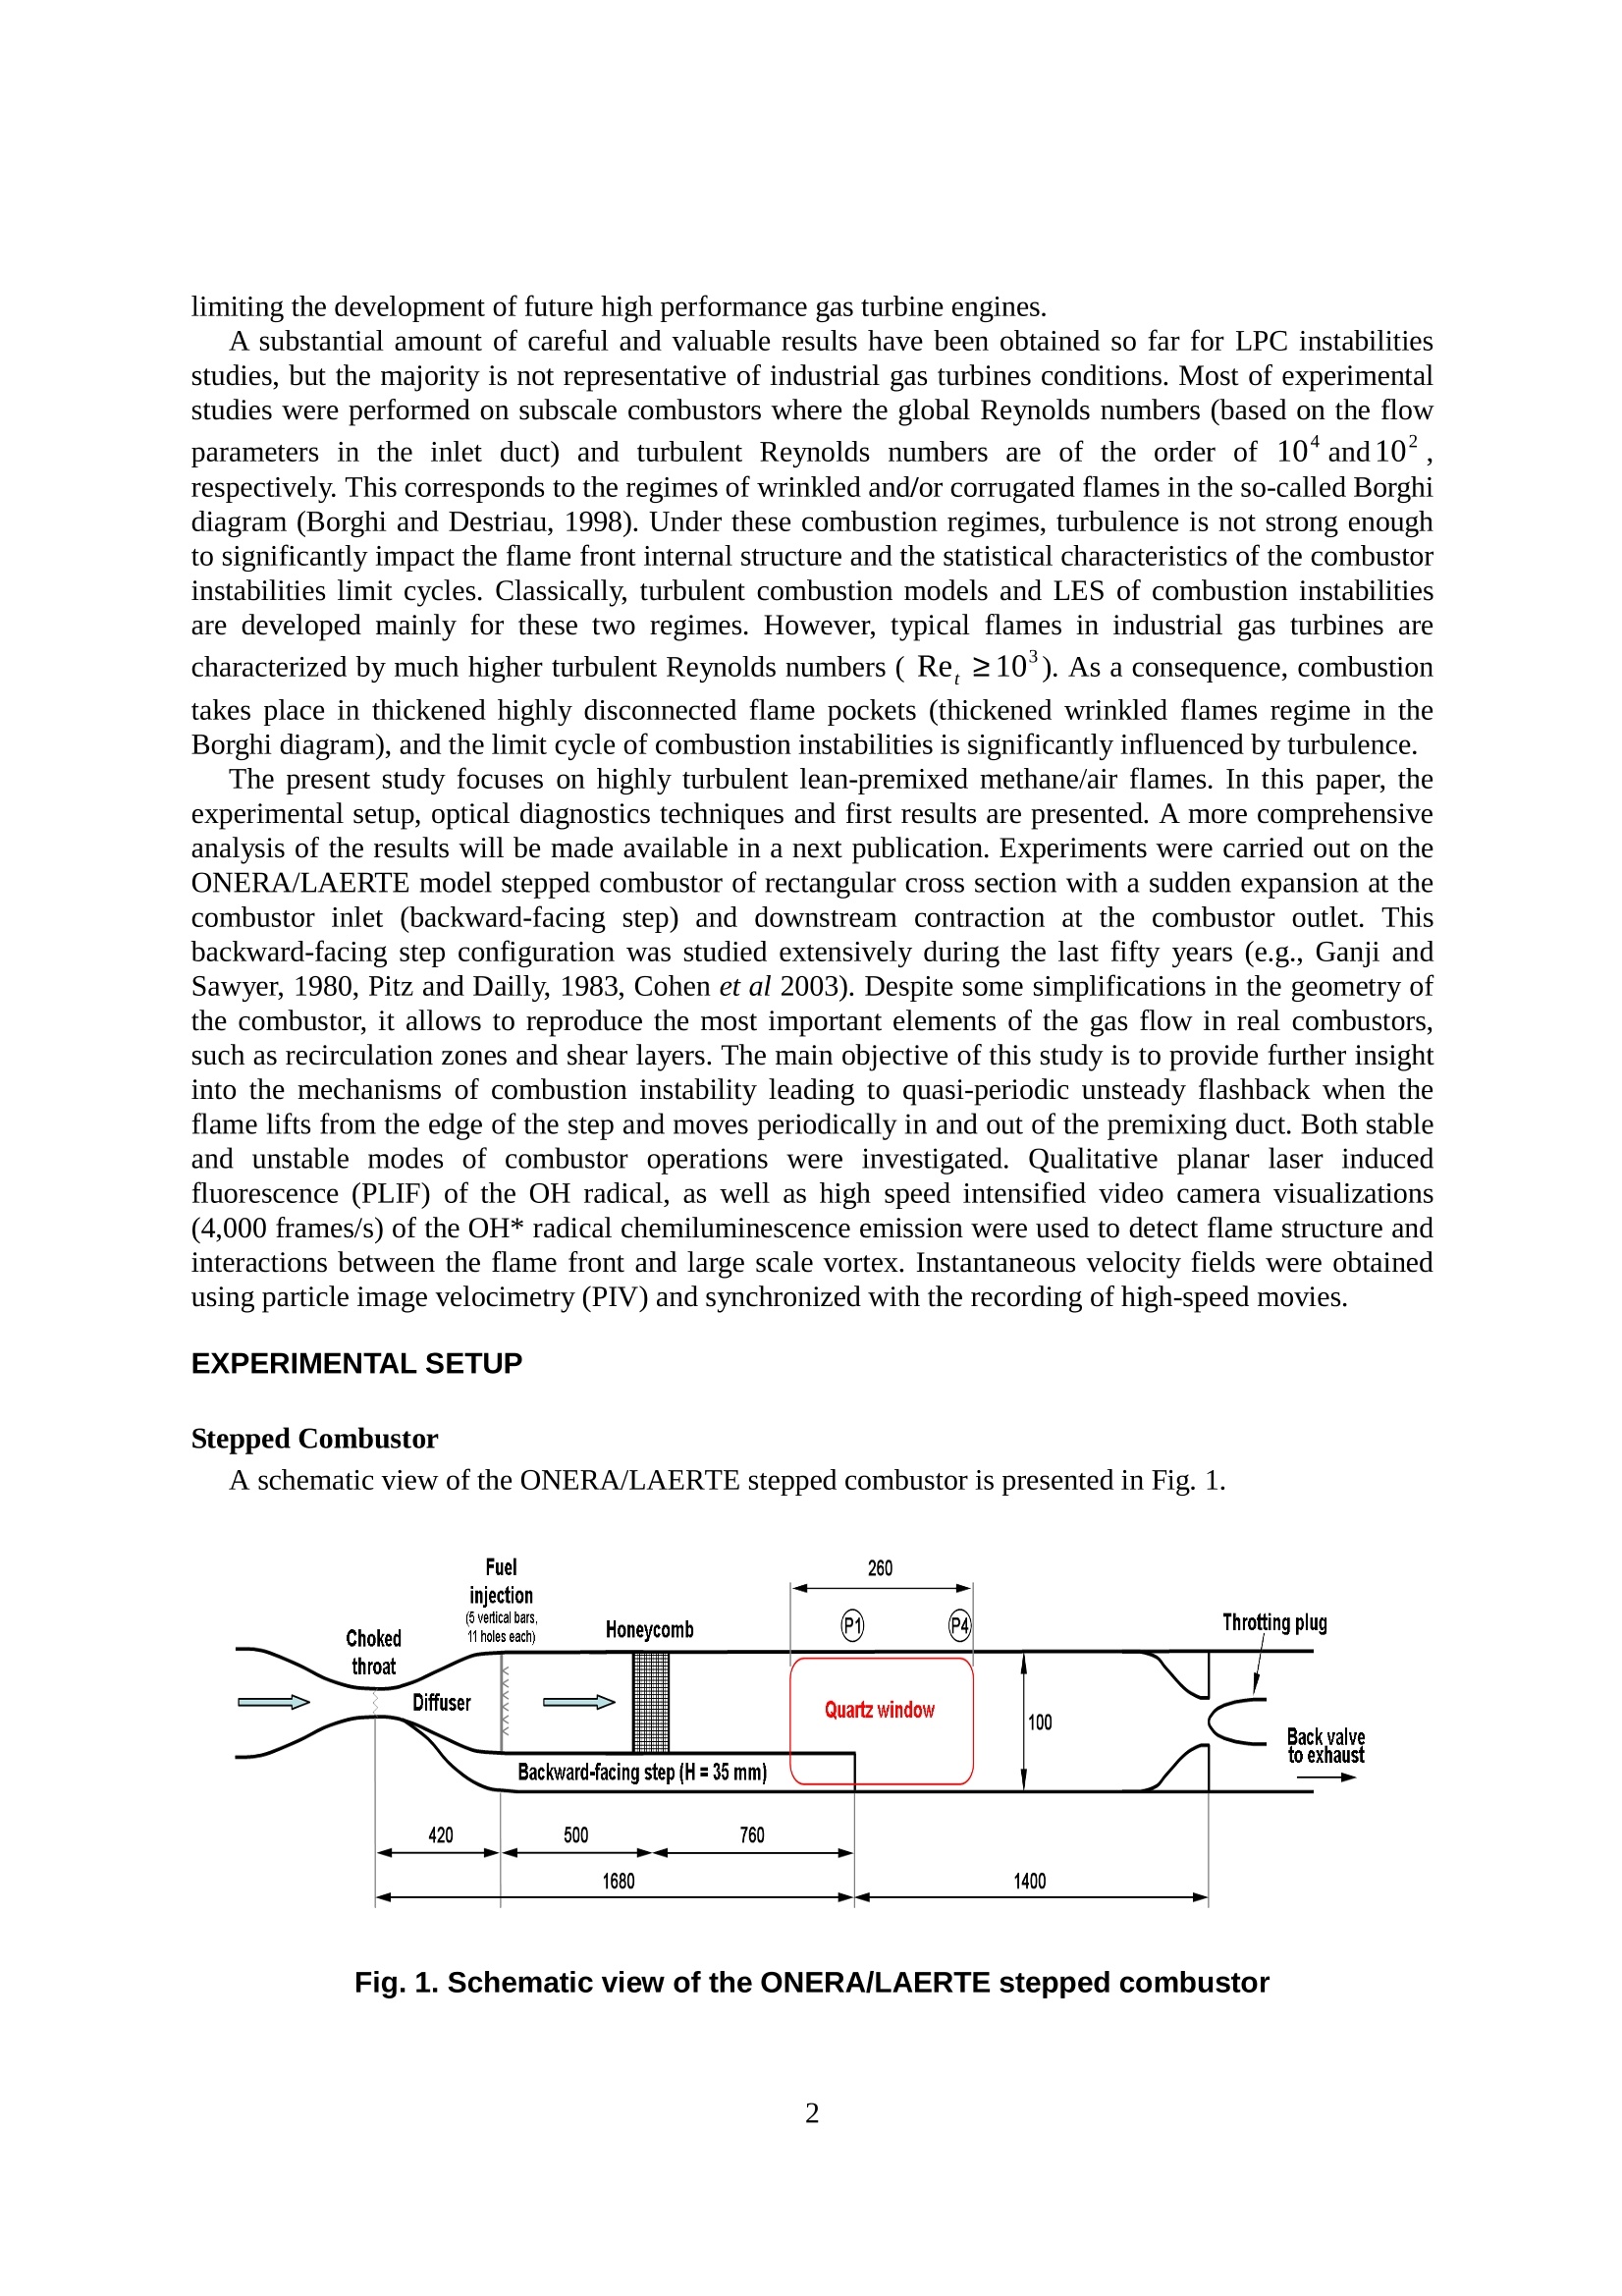
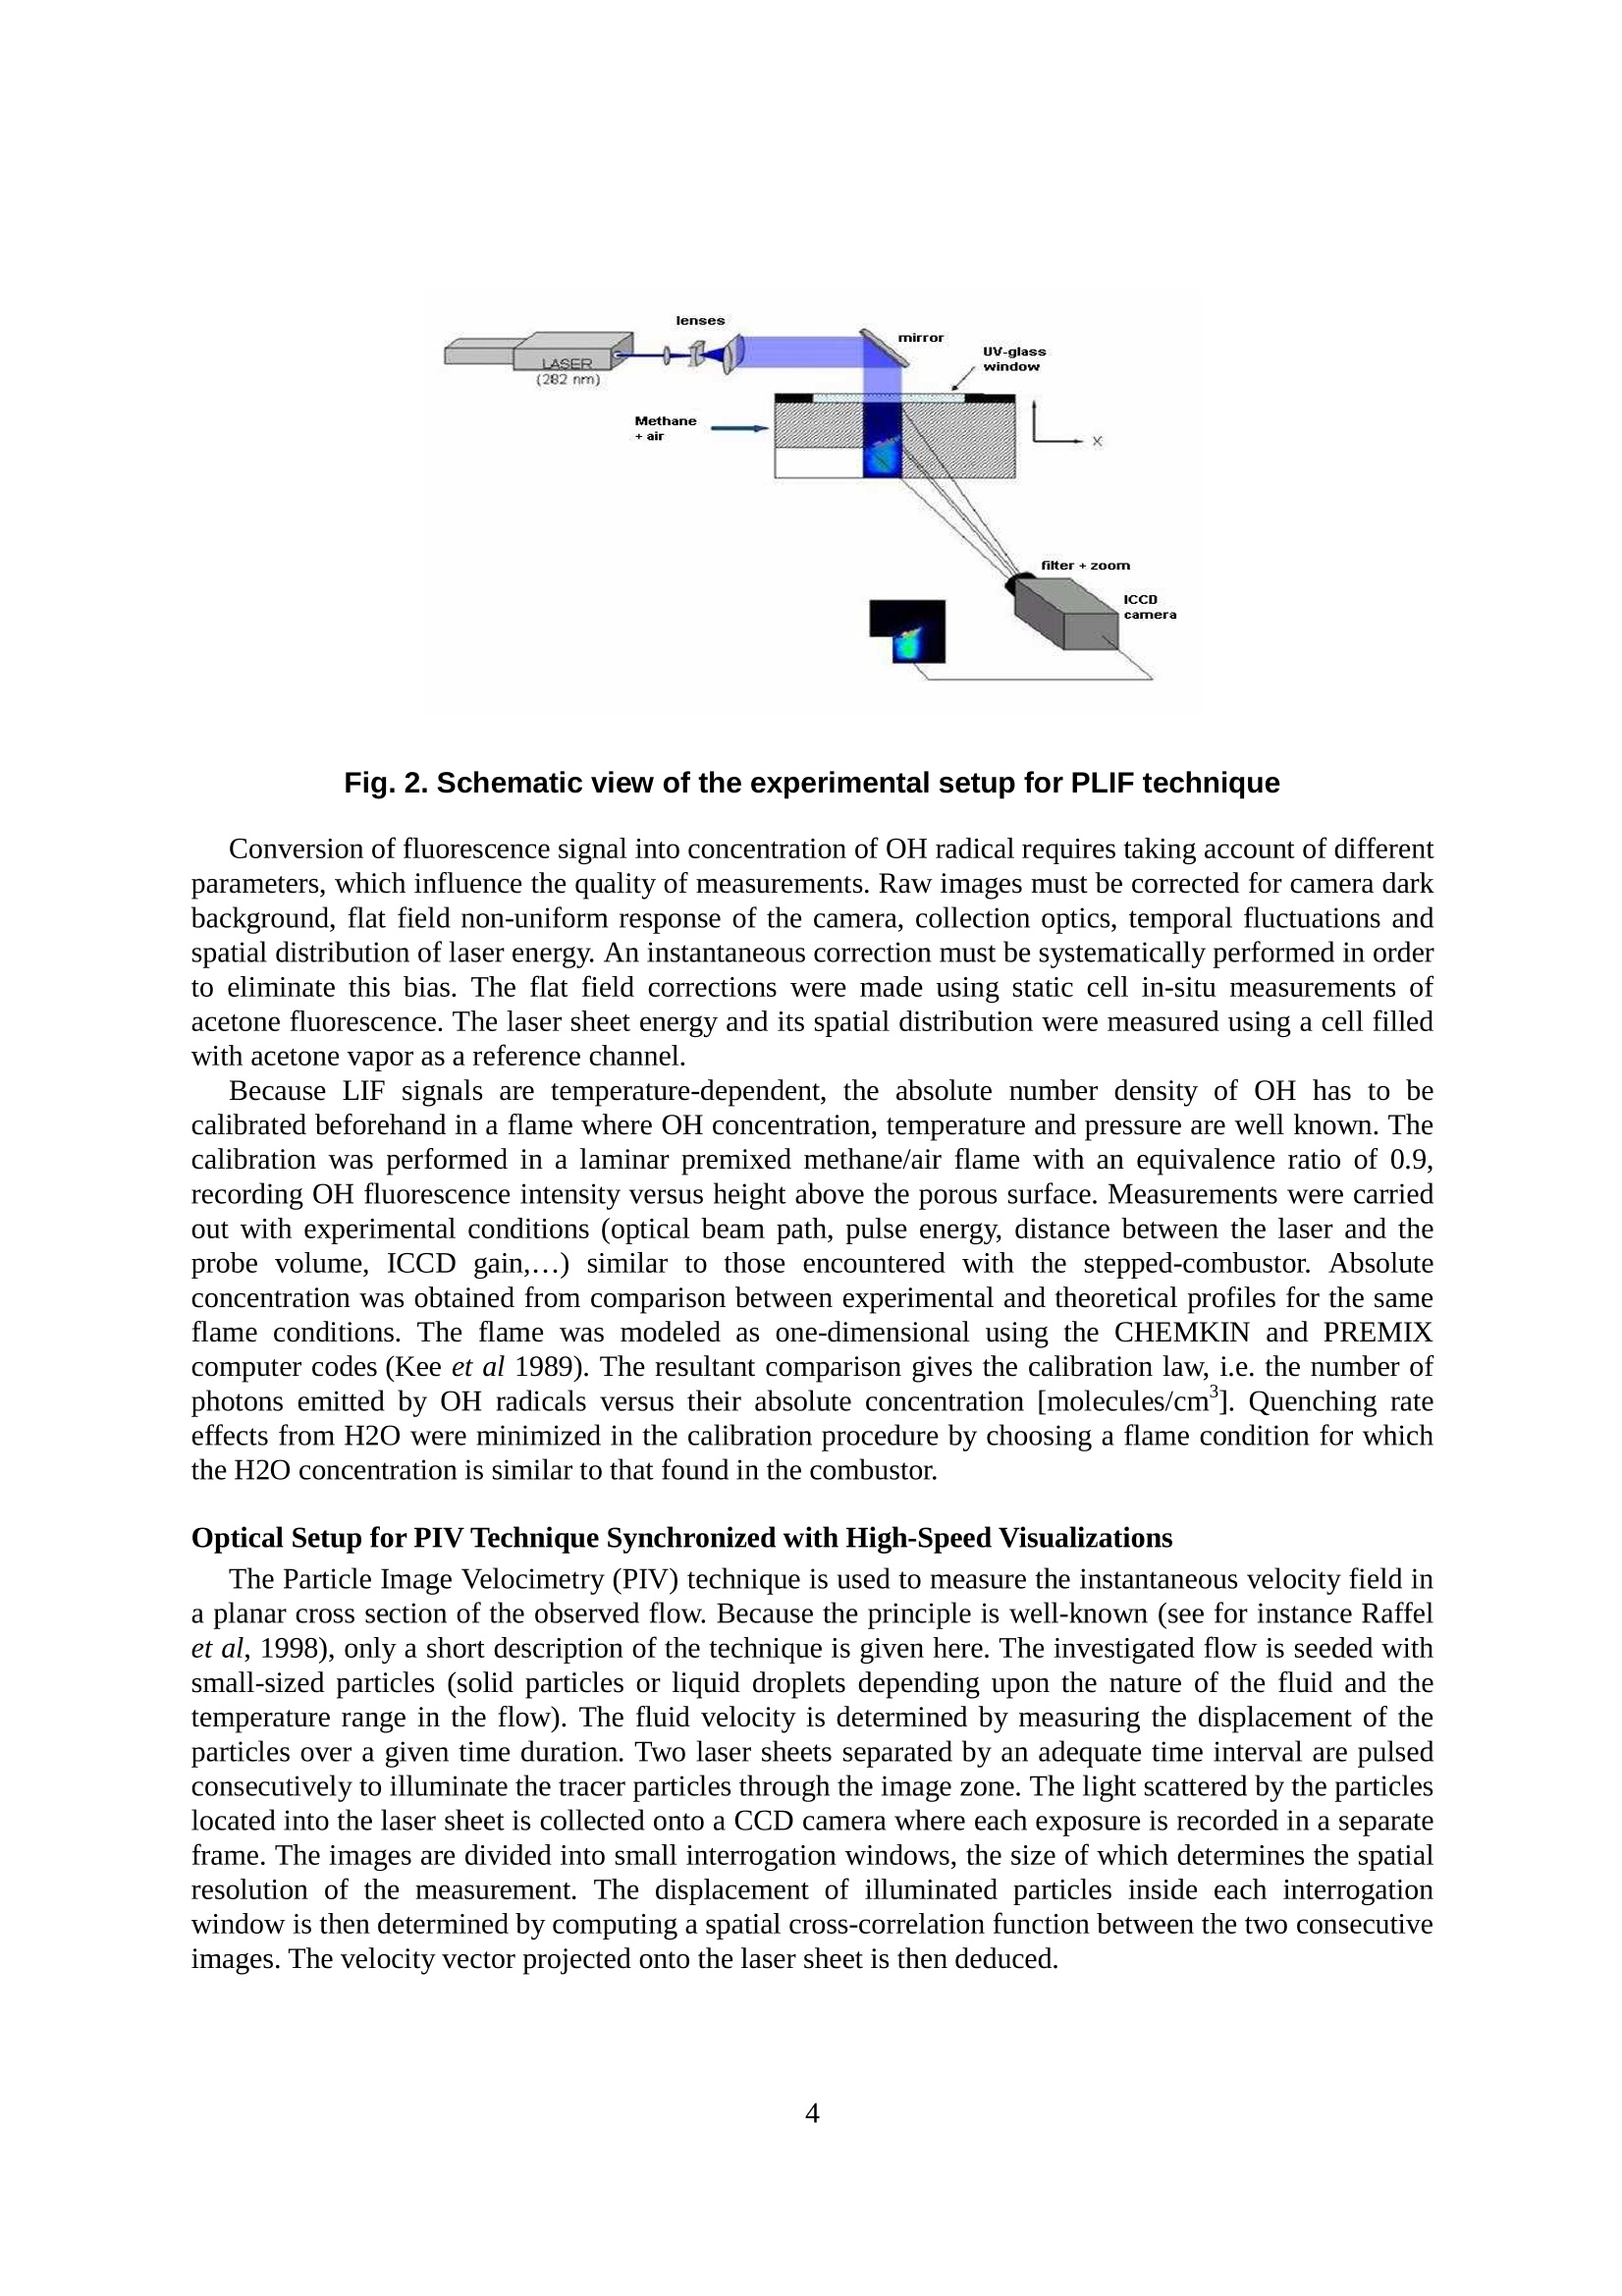
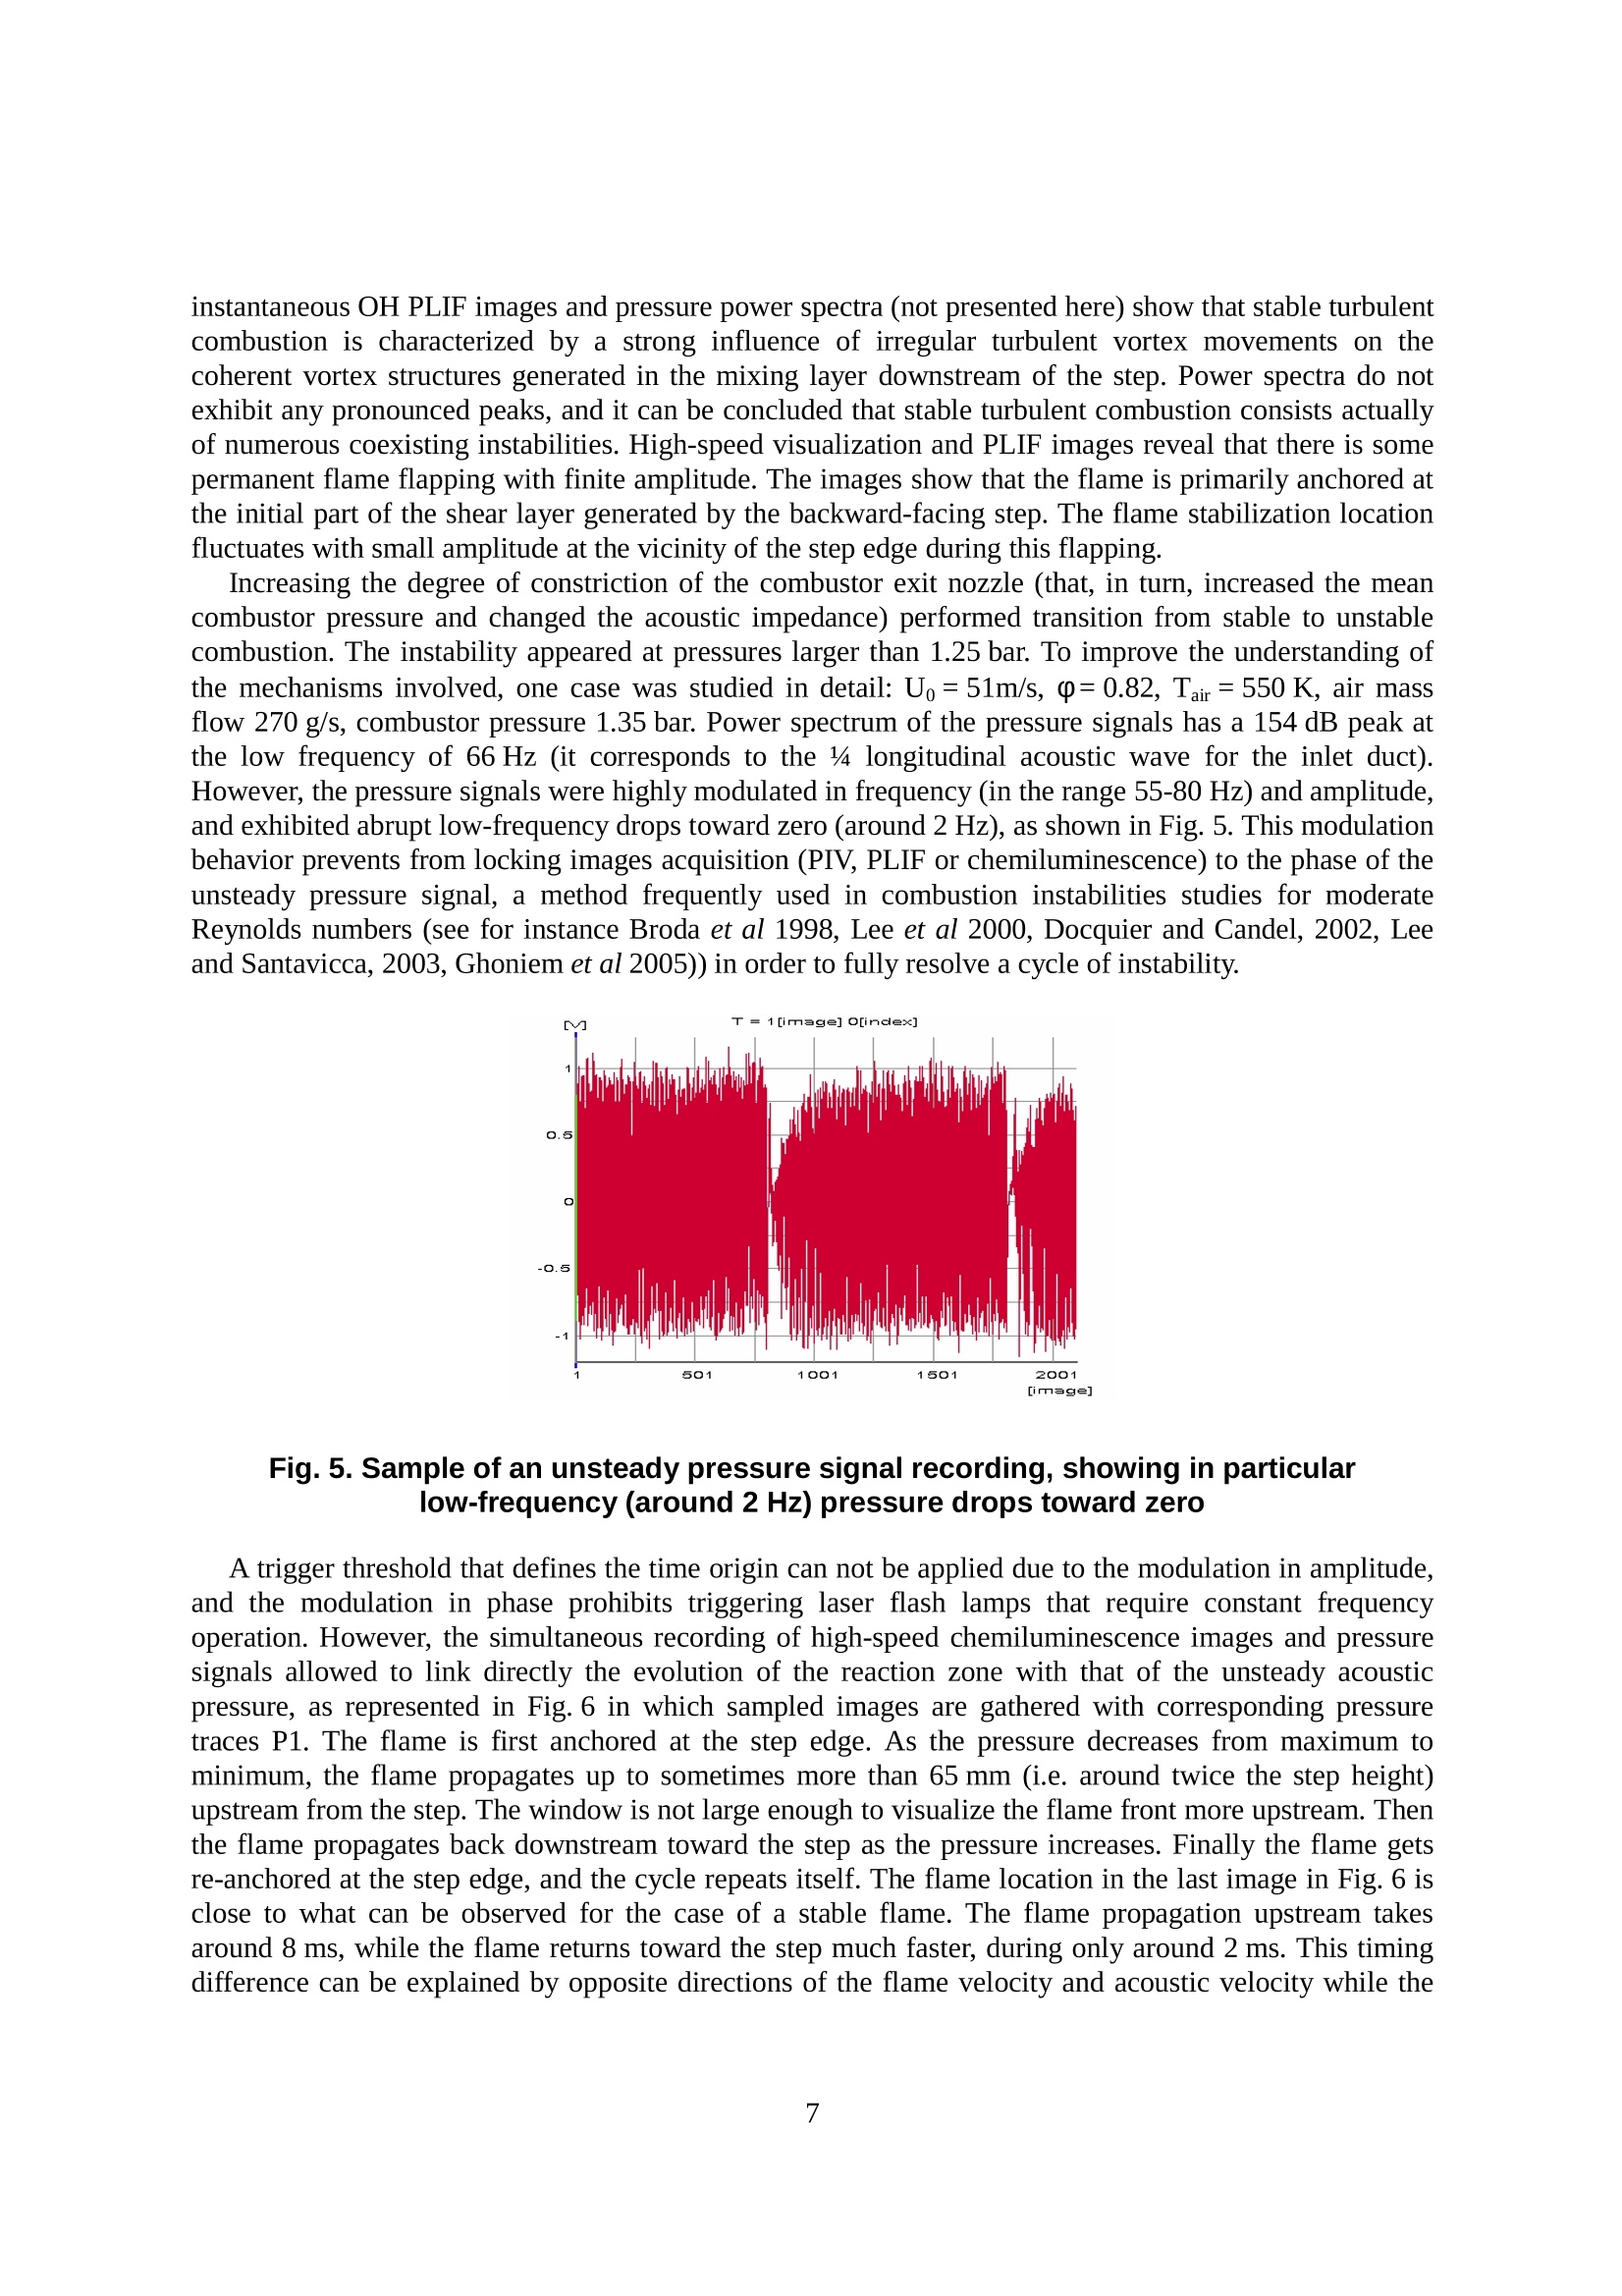
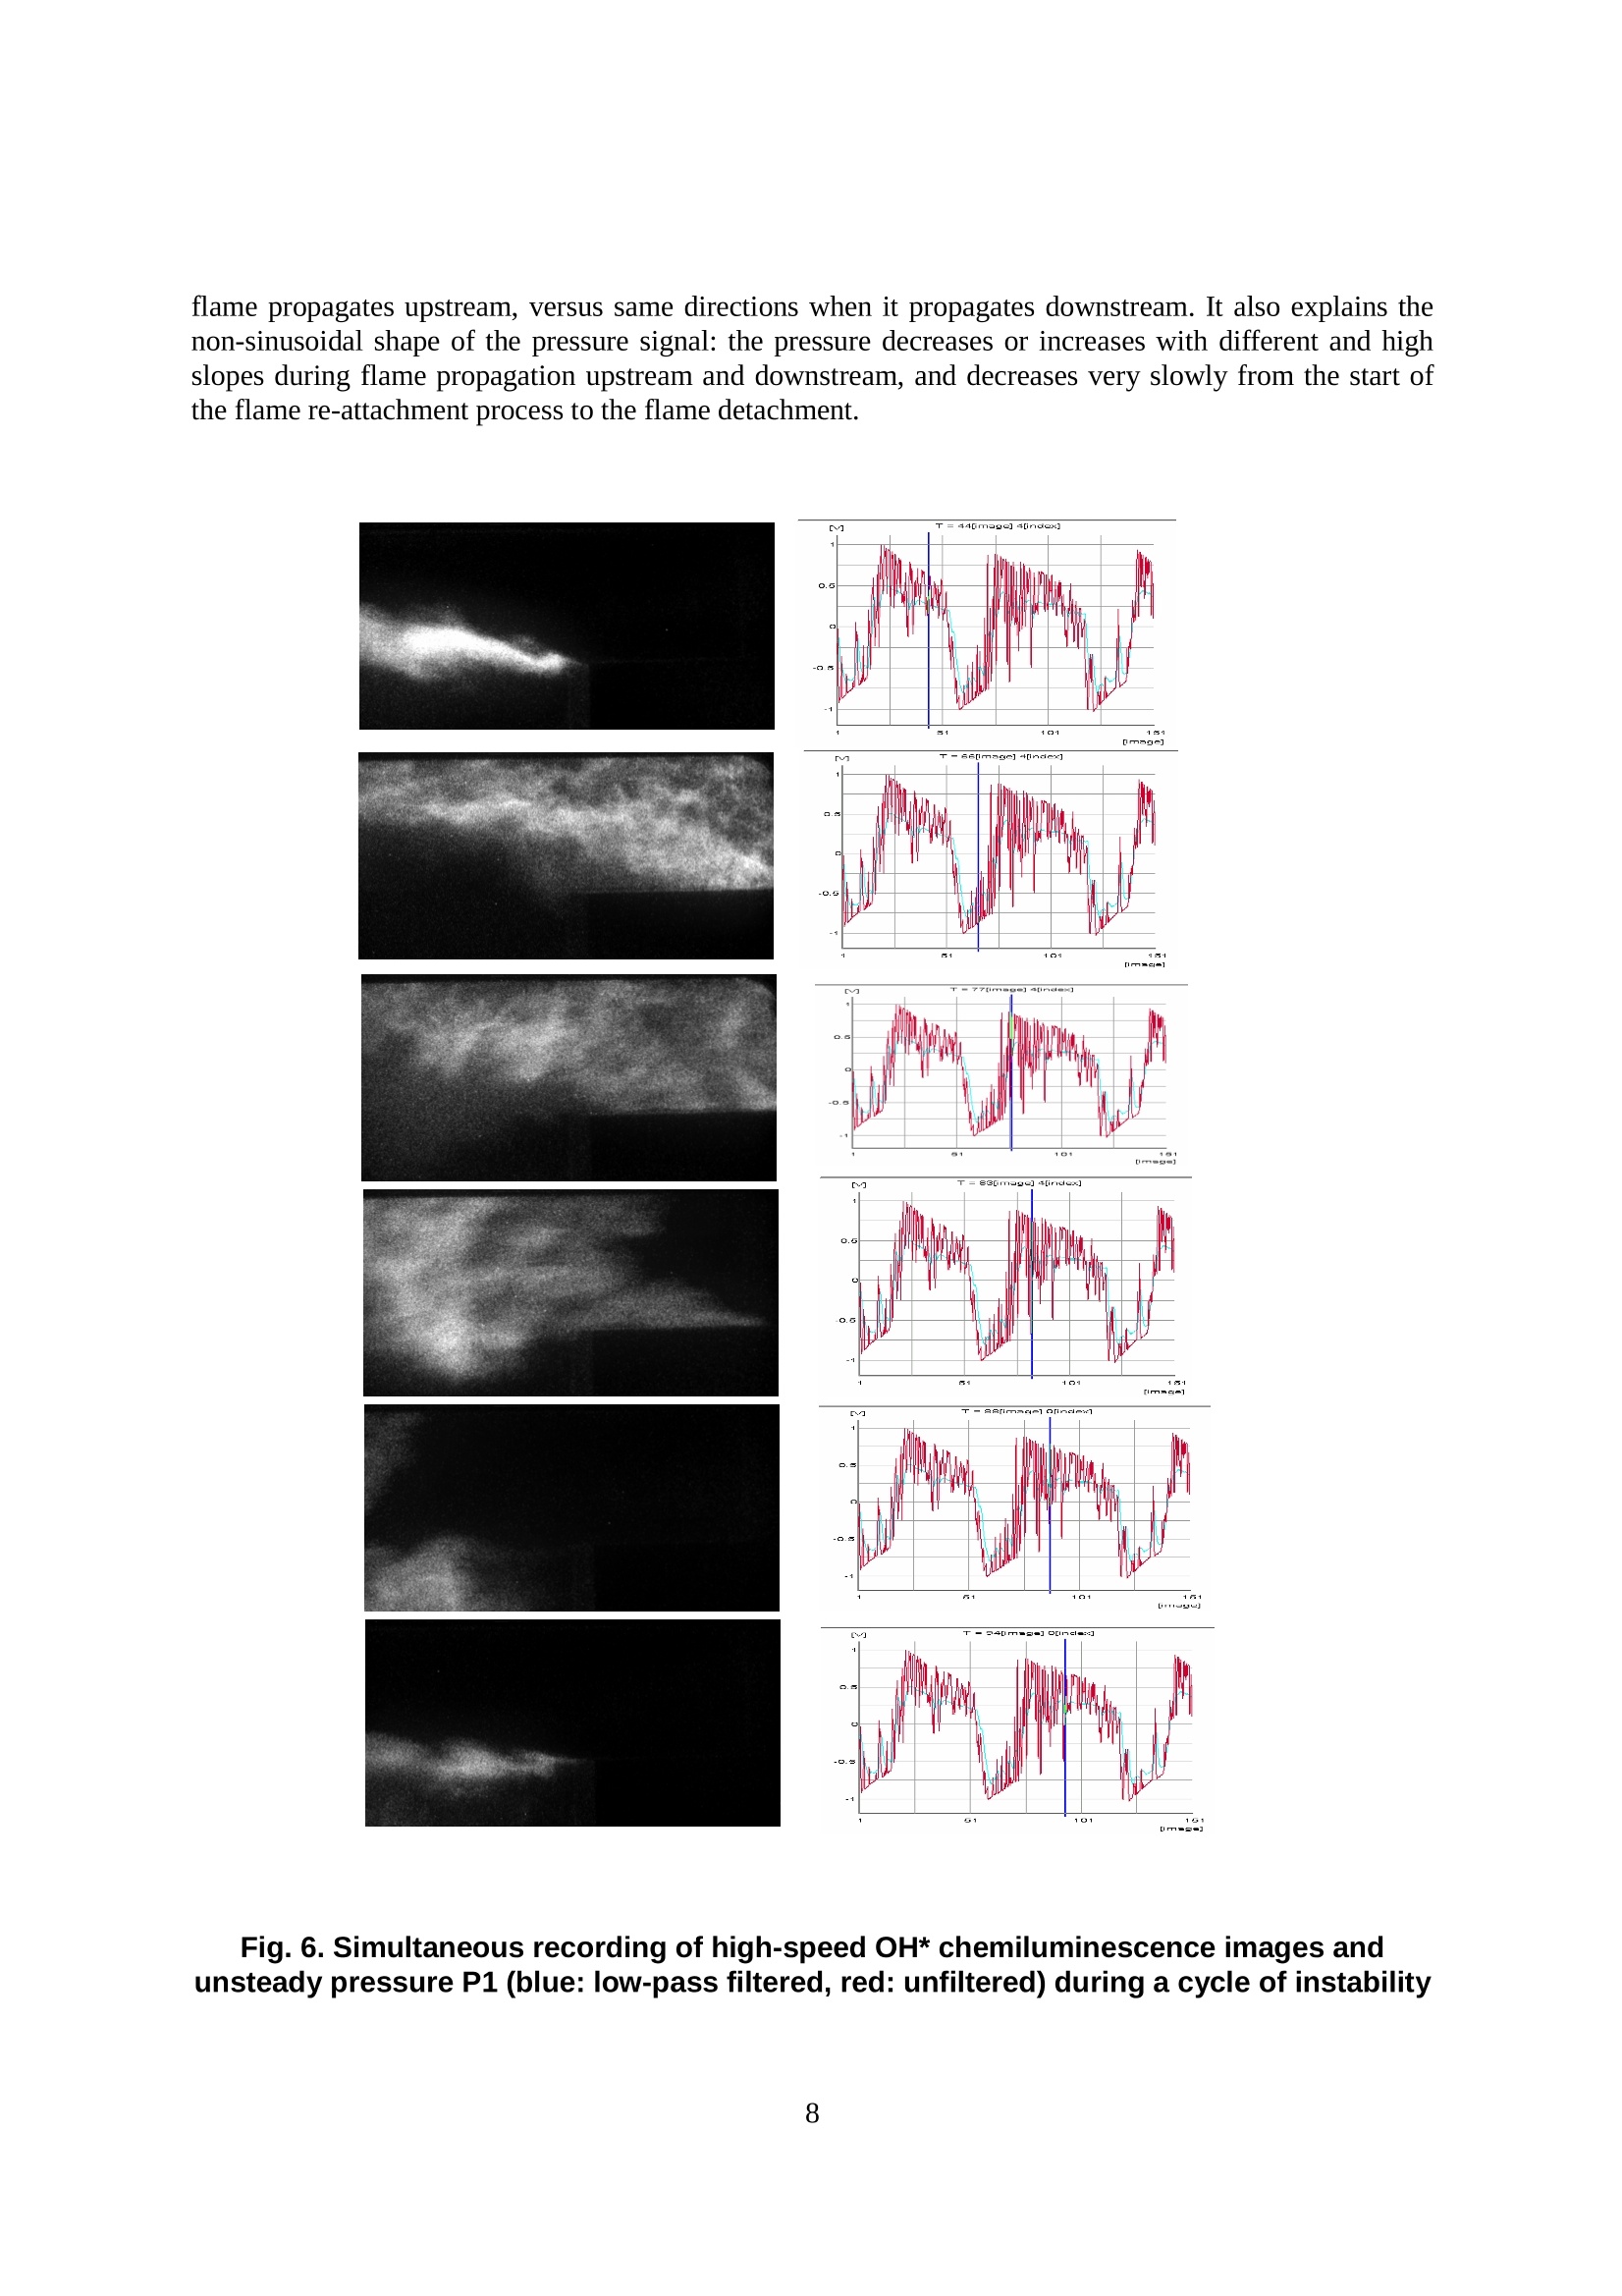
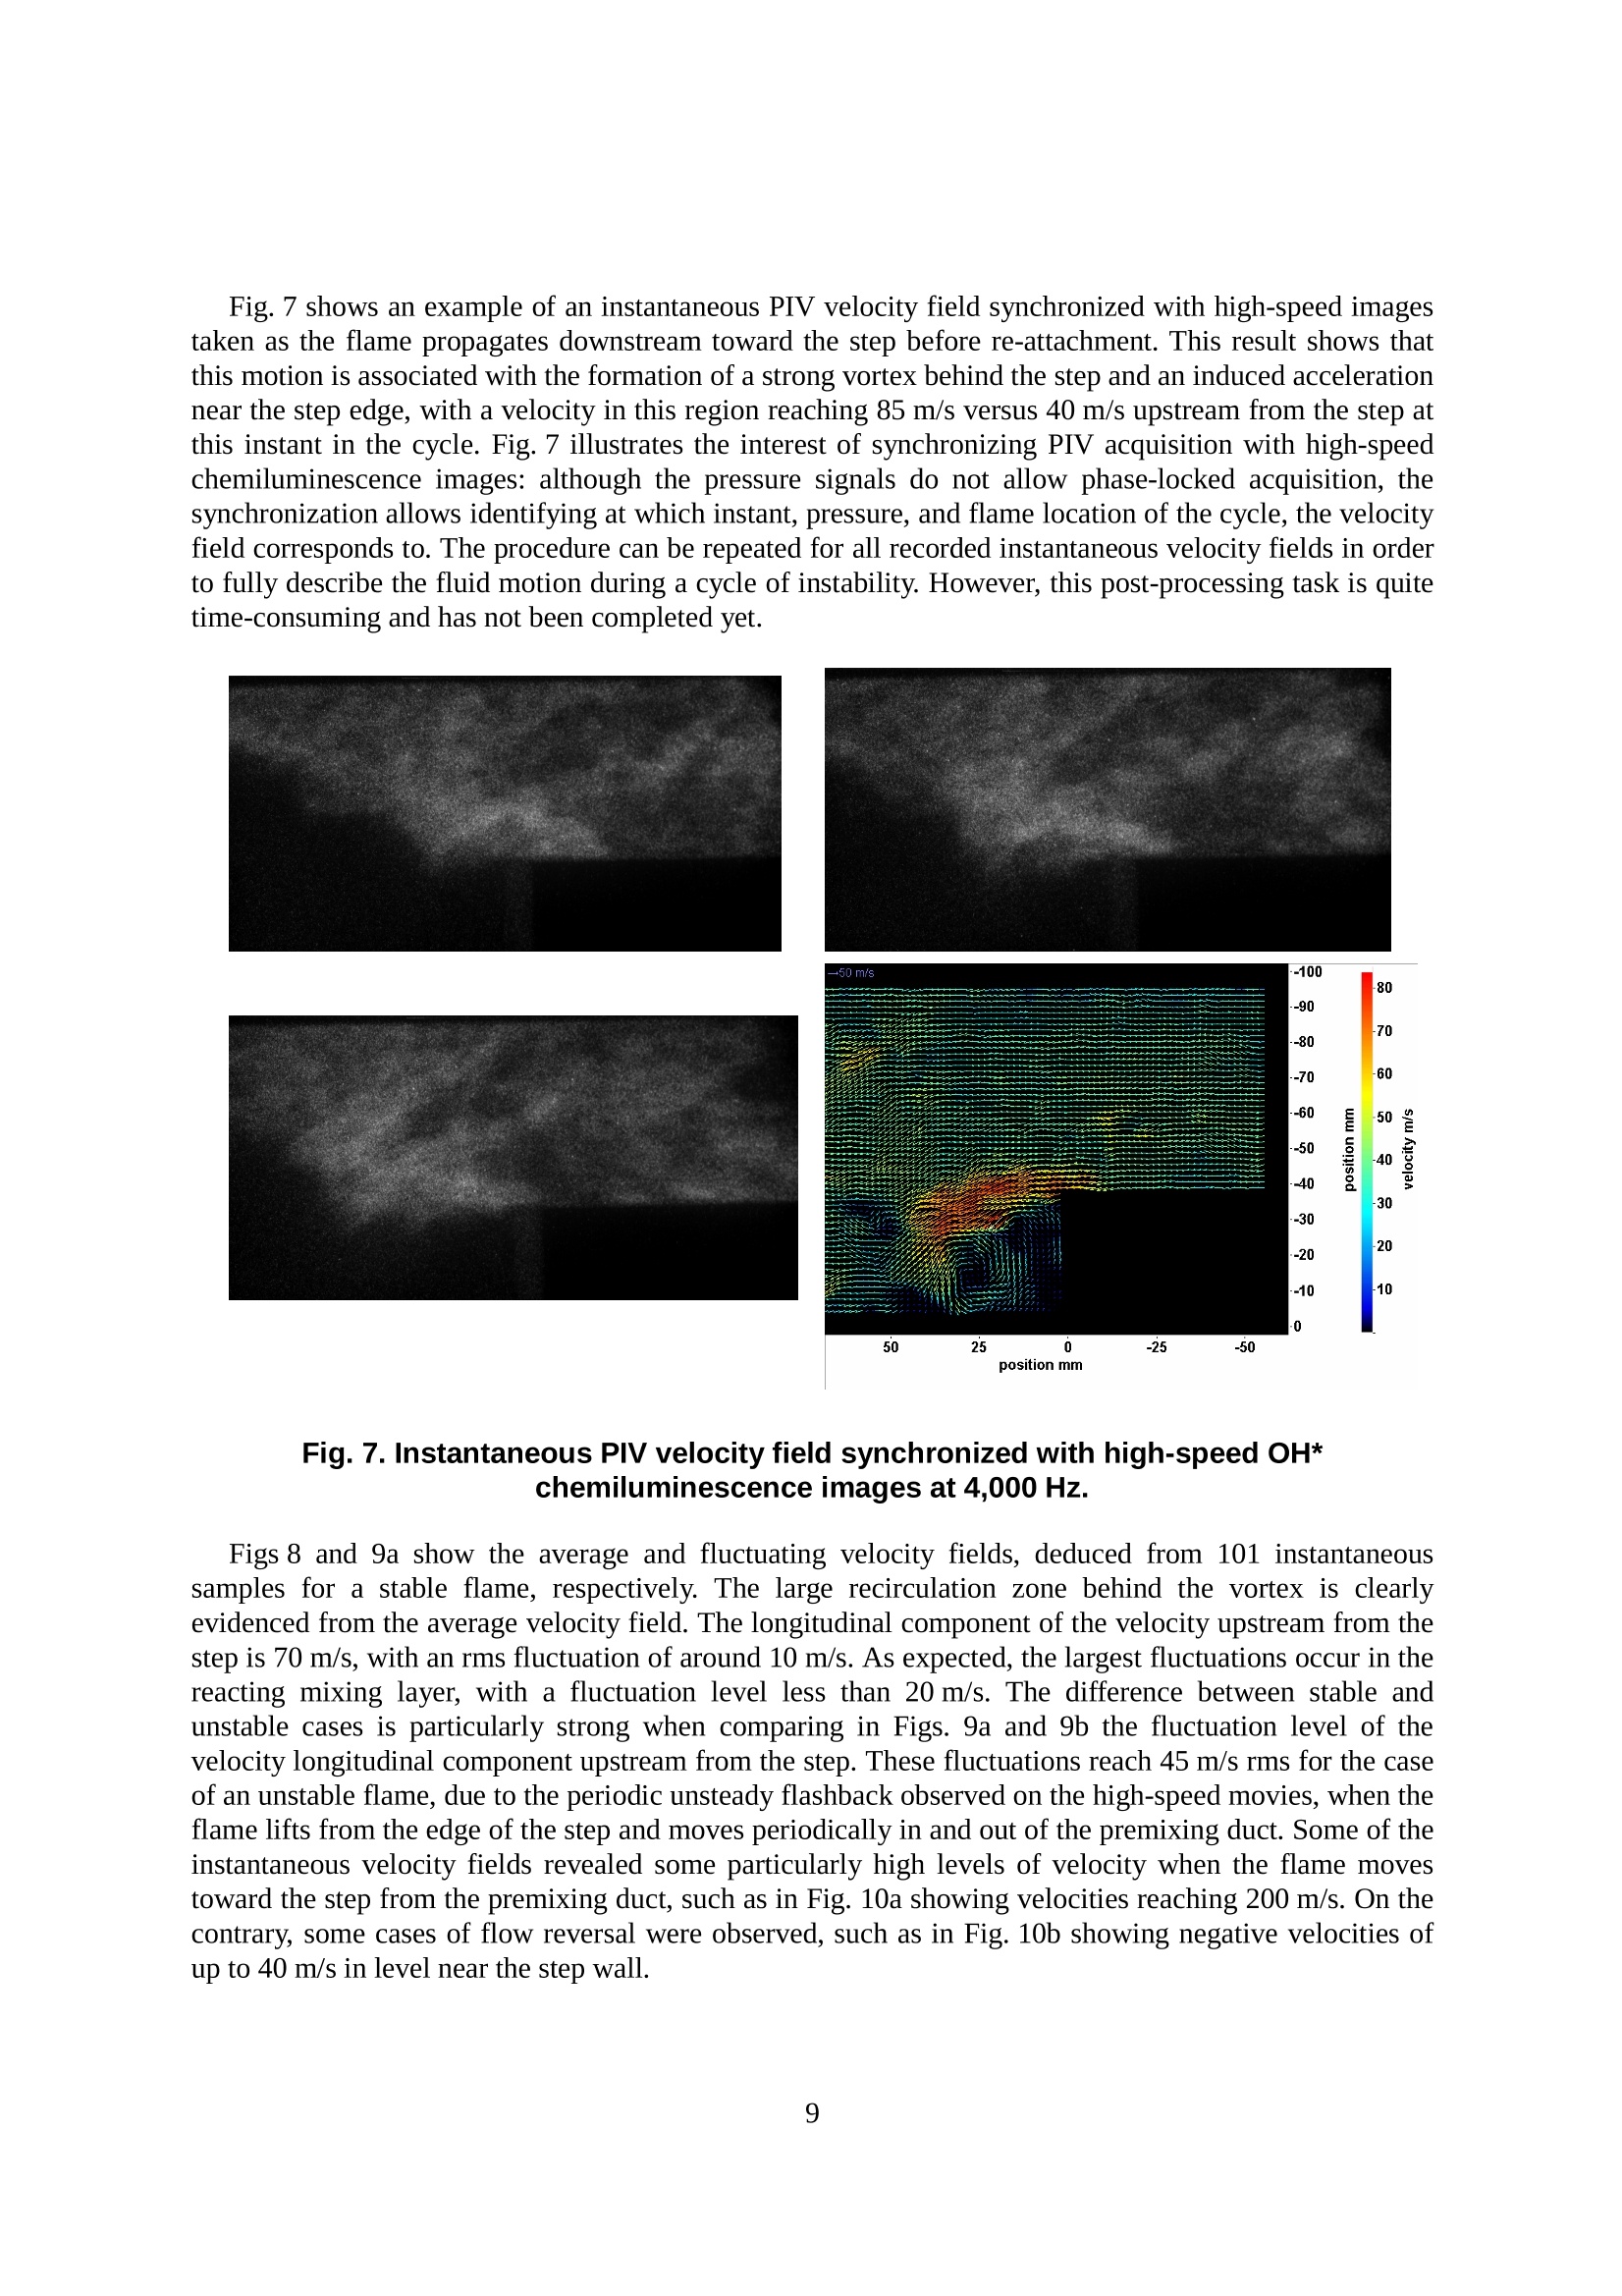
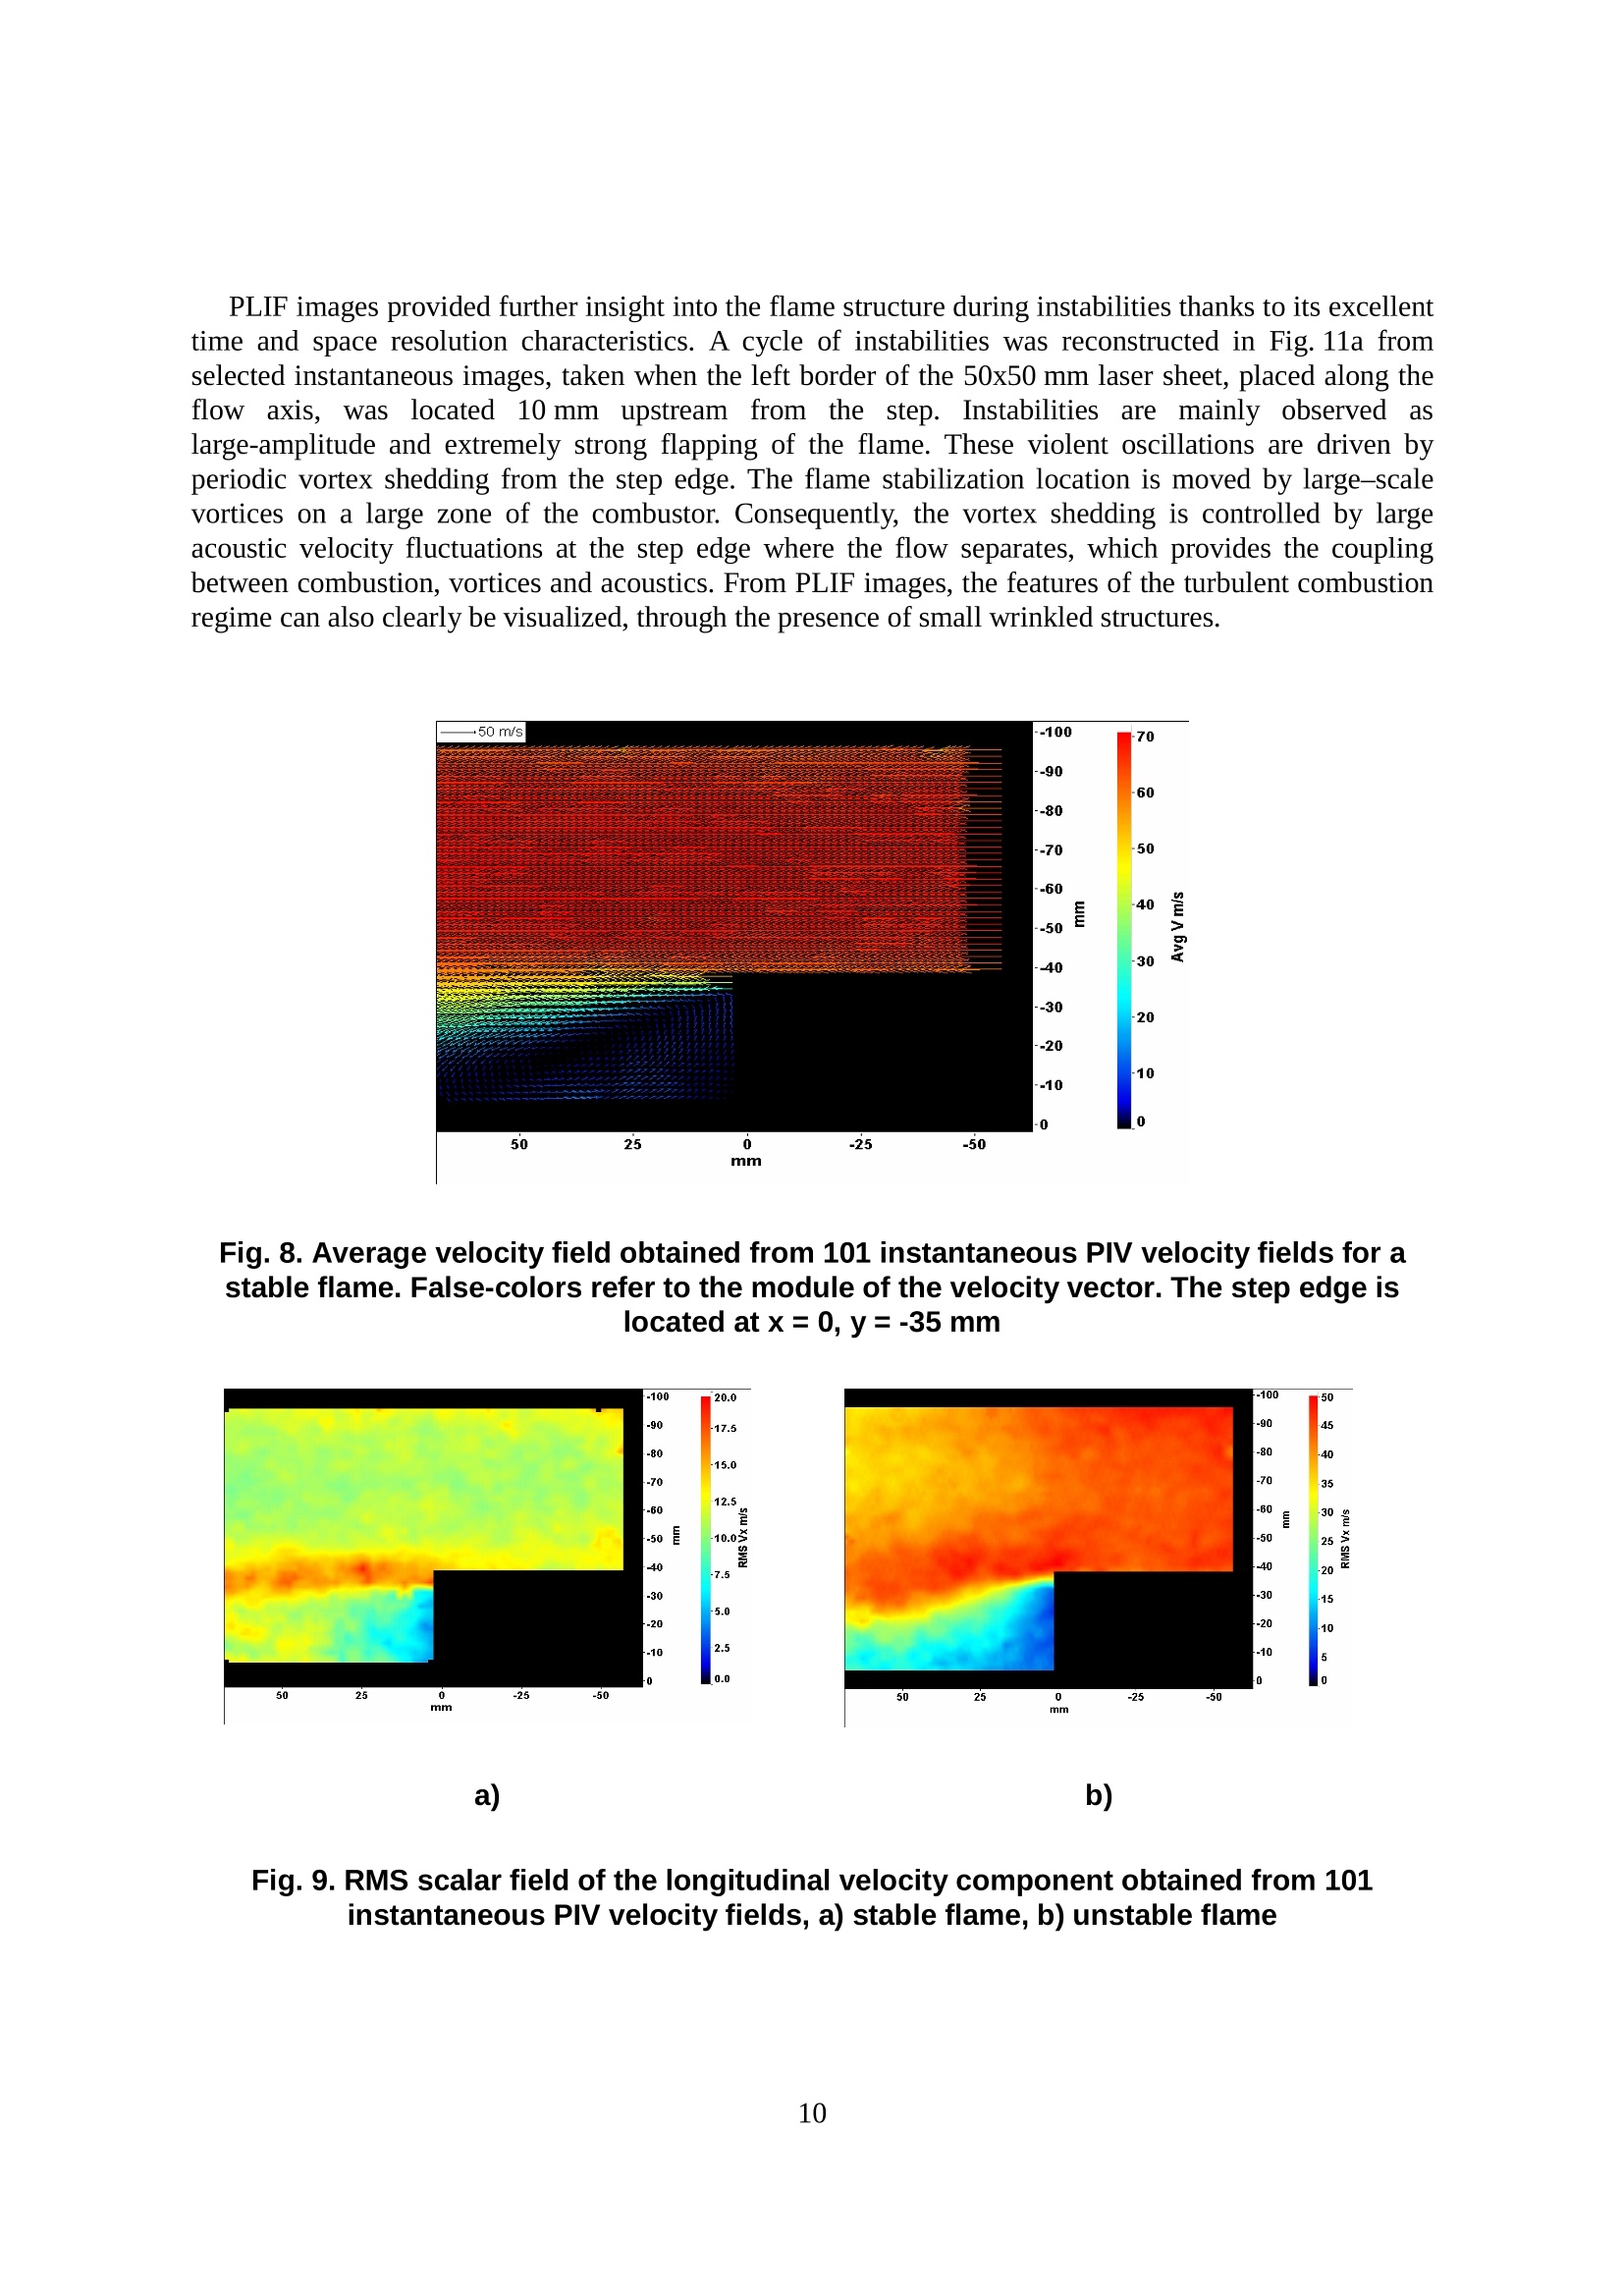
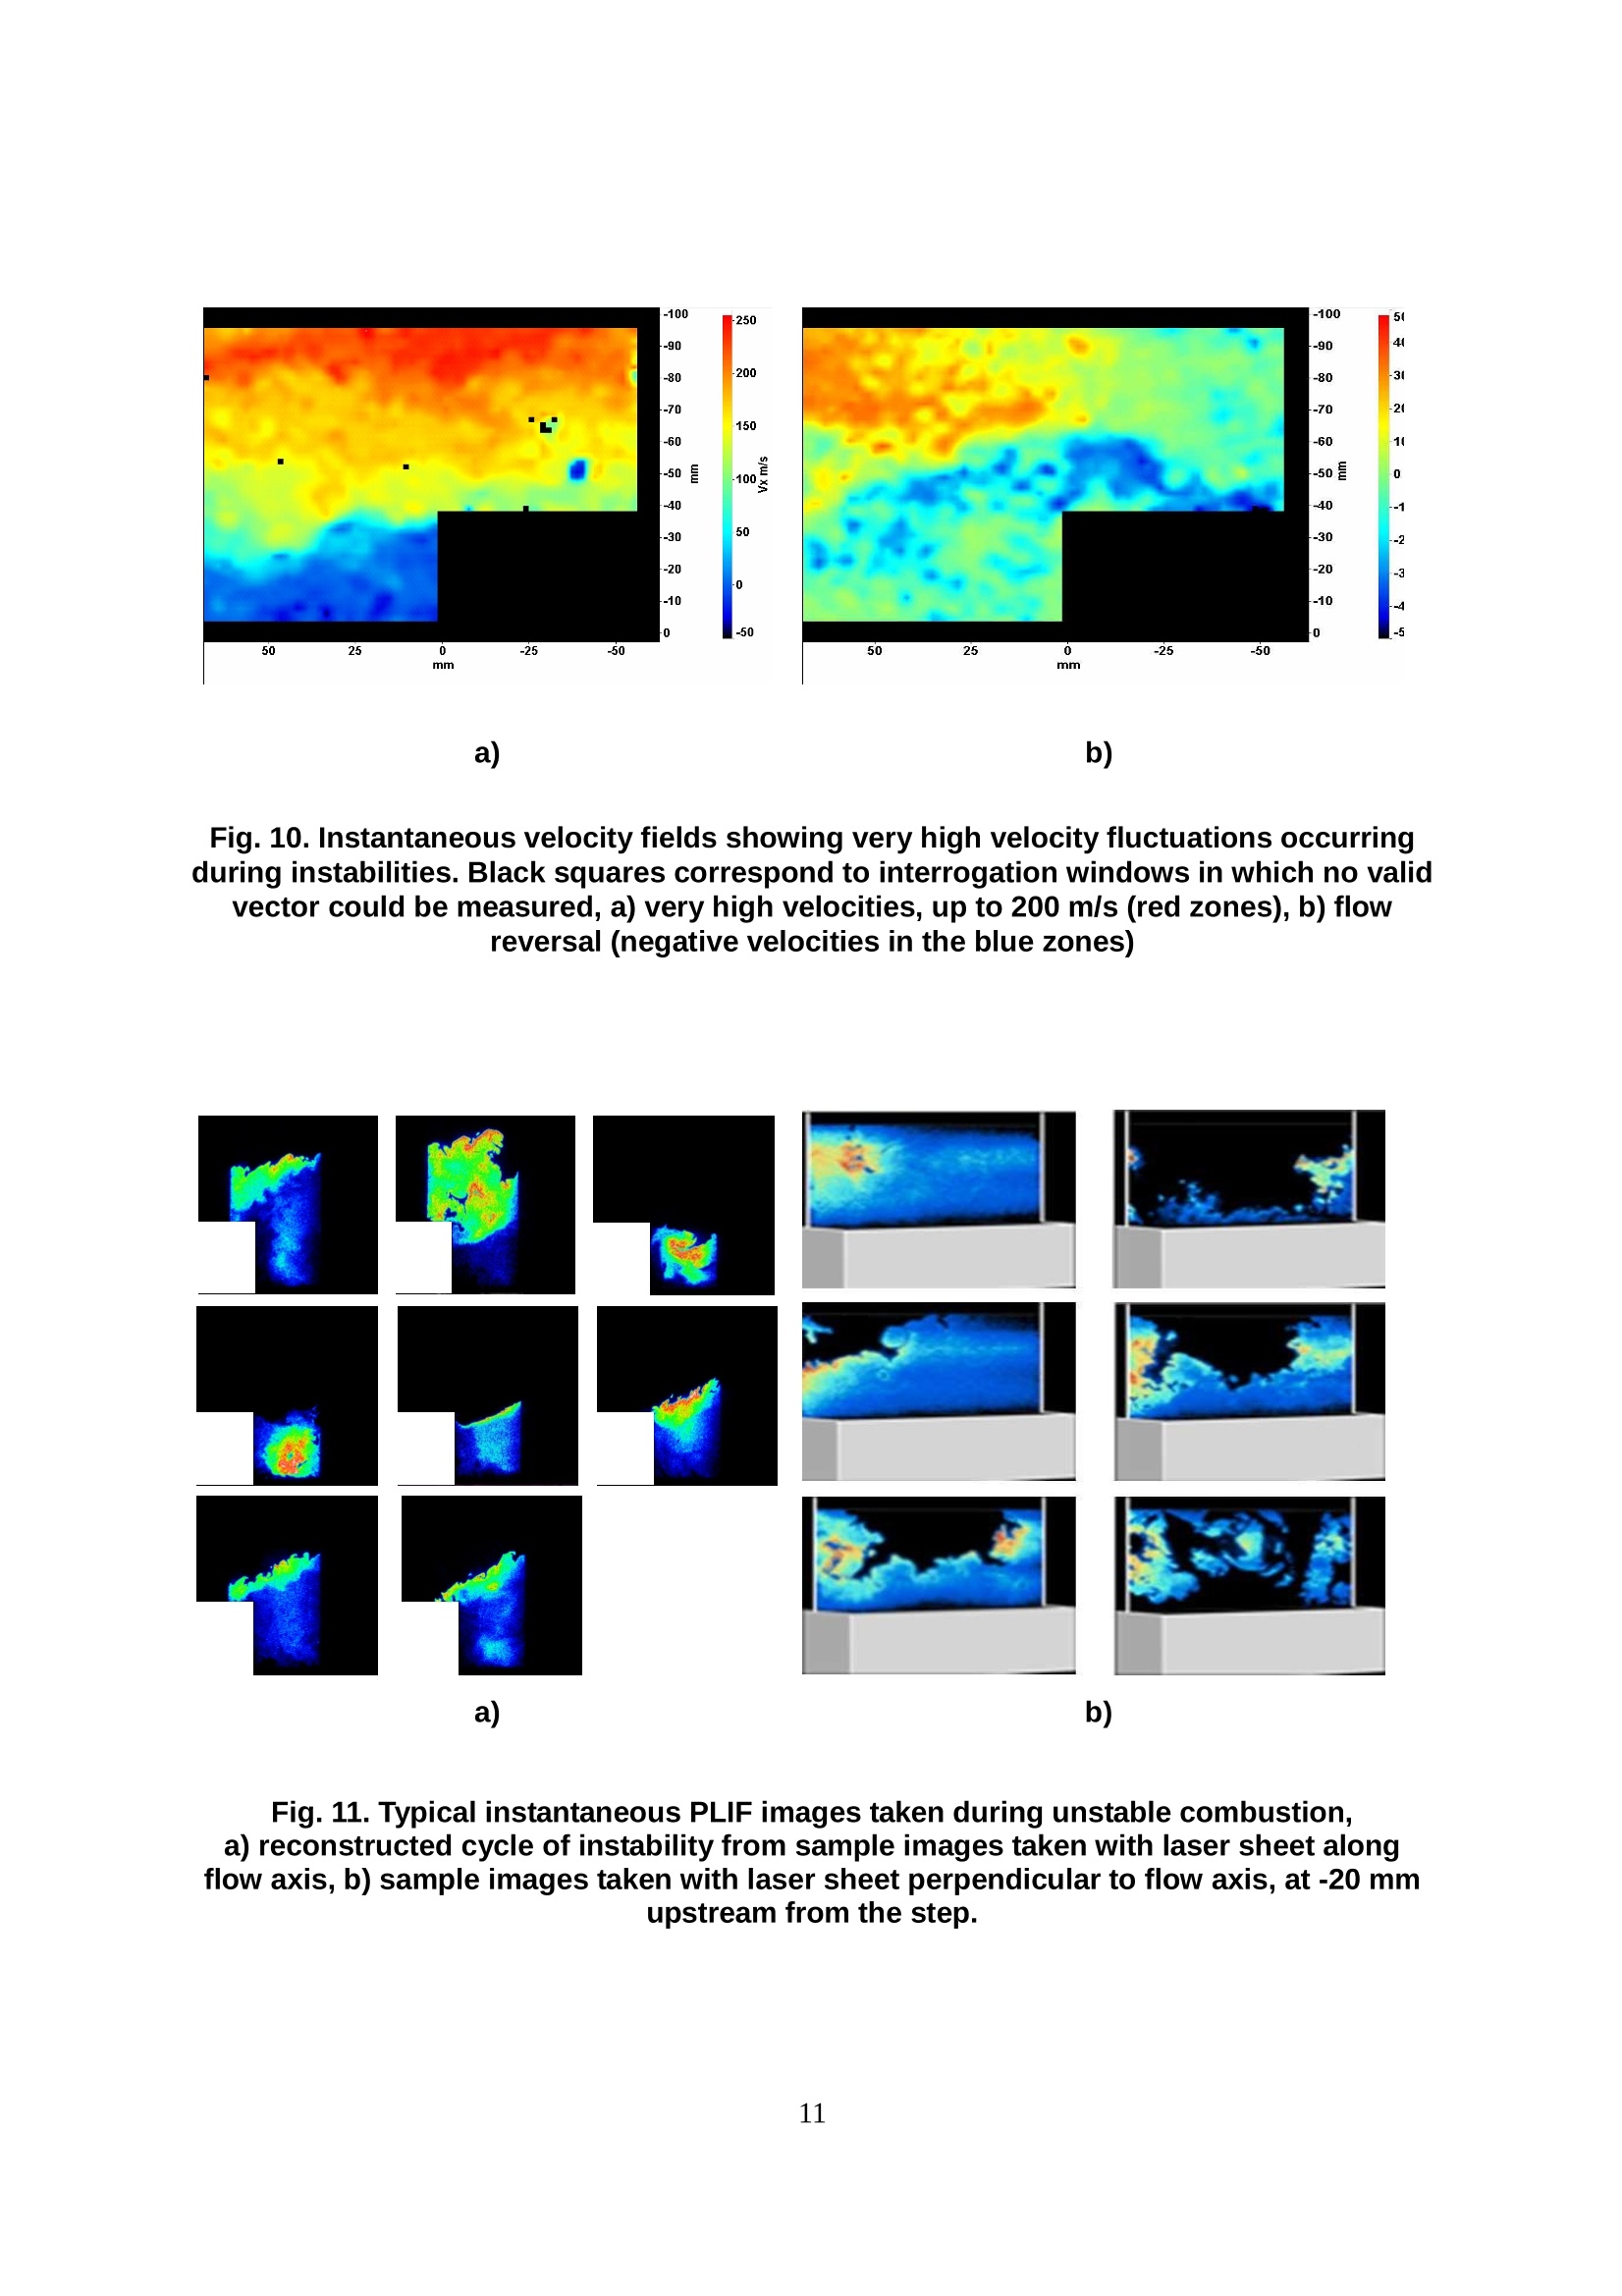
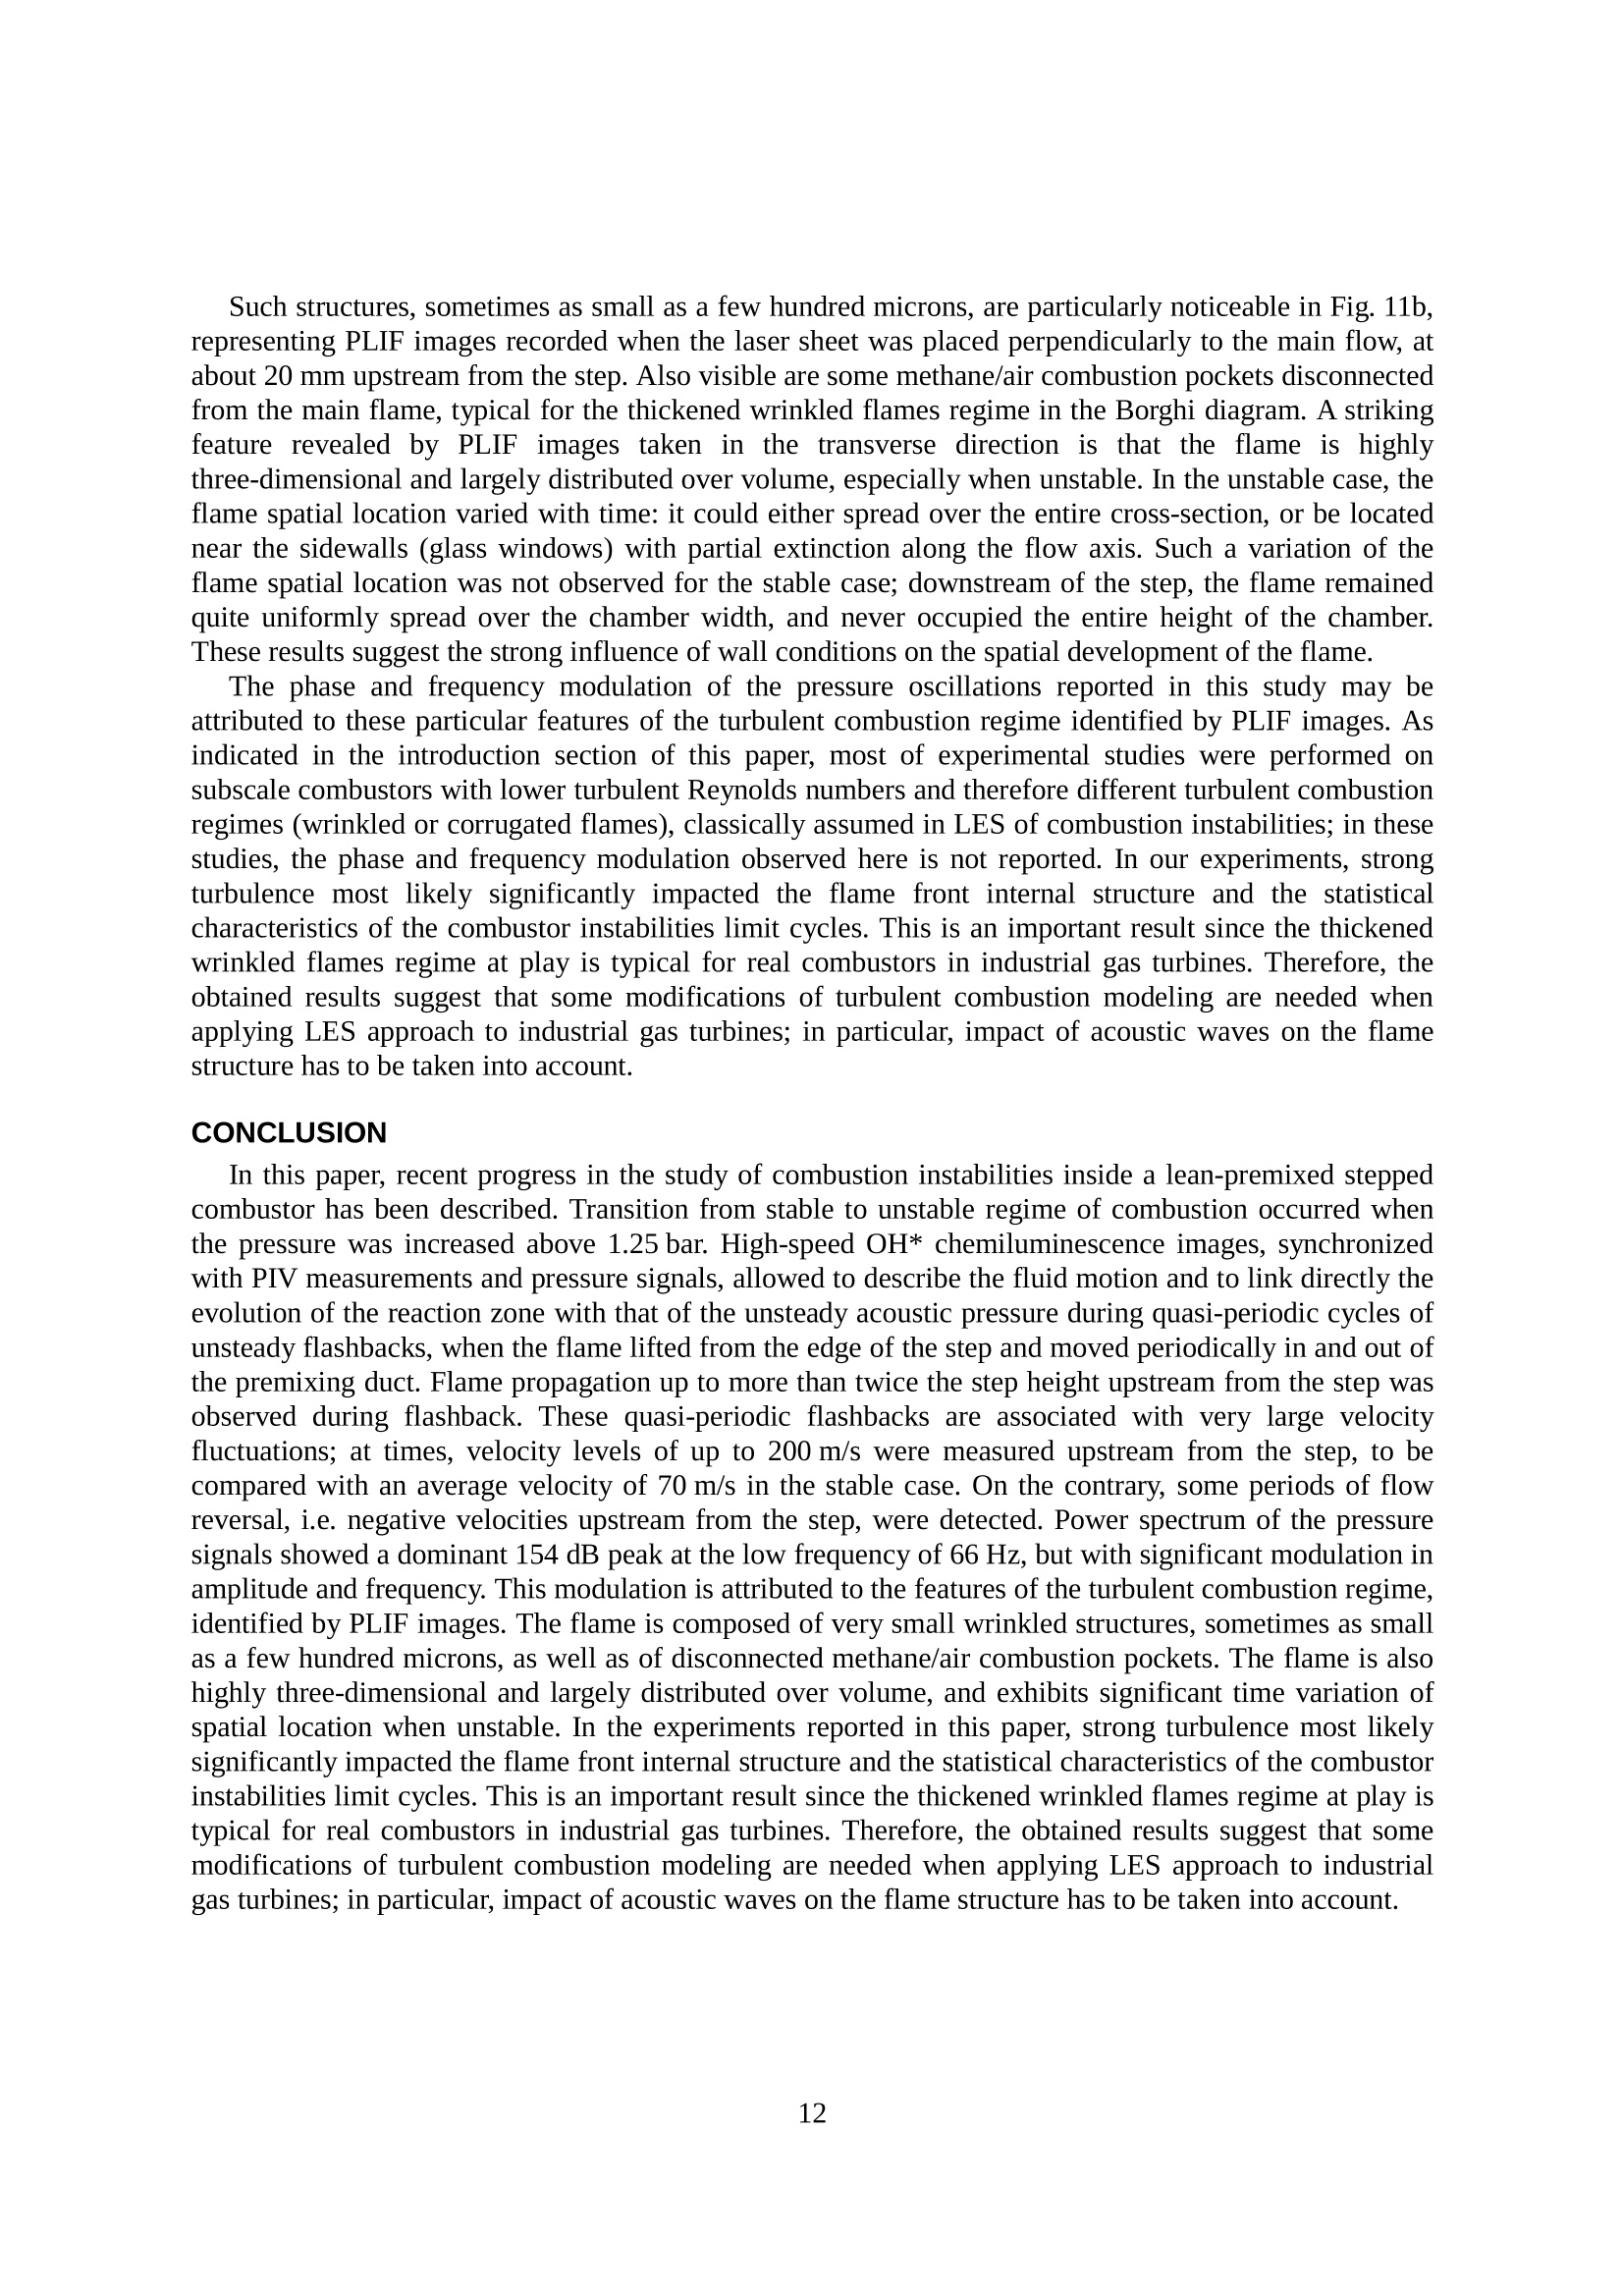
FLUCOME 200910th International Conference on Fluid Control, Measurements, and VisualizationAugust 17-21,2009, Moscow, Russia VISUALIZATION STUDY OFTHERMO-ACOUSTIC INSTABILITIES INA BACKWARD-FACING STEP STABILIZED LEAN-PREMIXED FLAMEINHIGH TURBULENCE FLOW V. Sabel’nikov, C. Brossard,M. Orain, F. Grisch, M. Barat , A. Ristori,P. Gicquel’ ABSTRACT Low-frequency combustion instabilities were studied experimentally in a model lean-premixed steppedcombustor. The PLIF technique was used to characterize the flame structure. The PIV technique, associated withhigh-speed visualization of the OH* radical chemiluminescence’s emission, allowed to investigate the flow fieldduring the quasi-periodic unsteady flashback when the flame lifted from the edge of the step and moved periodicallyin and out of the premixing duct. Results strongly suggest that impact of acoustic waves on the flame structureshould be taken into account when applying LES approach to industrial gas turbines. Keywords: Combustion instabilities,, turbulent combustion, lean-premixed flame,steppedcombustor, PIV, PLIF, high-speed visualization. INTRODUCTION Lean-premixed combustion (LPC) has become one of the most promising means of meeting stringentenvironmental requirements for the reduction of NOx emissions produced by gas turbine engines(Lefebvre, 1995). Operating at lean-premixed conditions, however, often leads to the occurrence ofundesirable combustion driven pressure oscillations and intense heat release fluctuations that can severelydamage the combustor or turbine hardware. Combustion instabilities occur when pressure oscillationscaused by small perturbations in the combustion system grow to the point that they overcome dampingforces. If the pressure oscillations are in phase with heat release fluctuations, the Rayleigh criterion issatisfied and the amplitude of the pressure oscillations increases (Rayleigh, 1945). Eventually, pressureoscillations reach a maximal limit when the energy losses become equal to or greater than the energygains (Culick,1971). While combustion chamber instabilities can be initialized by numerous differentperturbation sources, like flame surface area variations or equivalence ratio fluctuations, it is difficult todetermine the exact mechanism responsible for combustion instabilities because they are often system,geometry or operating parameters dependent. The understanding and control of pressure oscillations inthe combustor represents one of the most challenging and least understood phenomena potentially ( C o rresponding a u thor: O ffice N ational d'Etudes et de Recherches Aerospatiales (ONERA), F undamental and A p plied Energetics Department e-mail: v ladimi r .s abe l niko v @ o ner a . f r ) ( Office National d 'Etudes et de Recherches Aerospatiales (ONERA), Fundamental and Applied Energetics Department ) ( 'Office National d'Etudes e t de Recherches Aerospatiales (ONERA), Physics Inst r umentation and Sensing Department ) limiting the development of future high performance gas turbine engines. A substantial amount of careful and valuable results have been obtained so far for LPC instabilitiesstudies, but the majority is not representative of industrial gas turbines conditions. Most of experimentalstudies were performed on subscale combustors where the global Reynolds numbers (based on the flowparameters in the inlet duct) and turbulent Reynolds numbers are of the order of 10 and102,respectively. This corresponds to the regimes of wrinkled and/or corrugated flames in the so-called Borghidiagram (Borghi and Destriau, 1998). Under these combustion regimes, turbulence is not strong enoughto significantly impact the flame front internal structure and the statistical characteristics of the combustorinstabilities limit cycles. Classically, turbulent combustion models and LES of combustion instabilitiesare developed mainly for these two regimes. However, typical flames in industrial gas turbines arecharacterized by much higher turbulent Reynolds numbers (Re,≥10). As a consequence, combustiontakes place in thickened highly disconnected flame pockets (thickened wrinkled flames regime in theBorghi diagram), and the limit cycle of combustion instabilities is significantly influenced by turbulence. The present study focuses on highly turbulent lean-premixed methane/air flames. In this paper, theexperimental setup, optical diagnostics techniques and first results are presented. A more comprehensiveanalysis of the results will be made available in a next publication.Experiments were carried out on theONERA/LAERTE model stepped combustor of rectangular cross section with a sudden expansion at thecombustor inlet (backward-facing step) and downstream contraction at the combustor outlet. Thisbackward-facing step configuration was studied extensively during the last fifty years (e.g., Ganji andSawyer, 1980, Pitz and Dailly, 1983, Cohen et al 2003). Despite some simplifications in the geometry ofthe combustor, it allows to reproduce the most important elements of the gas flow in real combustors,such as recirculation zones and shear layers. The main objective of this study is to provide further insightinto the mechanisms of combustion instability leading to quasi-periodic unsteady flashback when theflame lifts from the edge of the step and moves periodically in and out of the premixing duct. Both stableand unstable modes of combustor operations were investigated. Qualitative planar laser inducedfluorescence (PLIF) of the OH radical, as well as high speed intensified video camera visualizations(4,000 frames/s) of the OH* radical chemiluminescence emission were used to detect flame structure andinteractions between the flame front and large scale vortex. Instantaneous velocity fields were obtainedusing particle image velocimetry (PIV) and synchronized with the recording of high-speed movies. EXPERIMENTAL SETUP Stepped Combustor A schematic view of the ONERA/LAERTE stepped combustor is presented in Fig. 1. Fig.1. Schematic view of the ONERA/LAERTE stepped combustor The water-cooled combustion facility consists of a 1.7-m long inlet duct, a 1.4-m long dump(backward-facing step) combustor, and an exhaust nozzle. The facility is supplied with preheated air witha maximum temperature of 650 K. Air maximum flow rate is 600 g/s. Preheated air is delivered to thefacility through a choked nozzle located at 1.7 m upstream from the combustor inlet. Then the preheatedair passes through the inlet (premixing) duct before entering the combustor. The inlet duct is comprised ofseveral rectangular-section (100×65 mm²) pipes. The methane injector, made of five vertical bars piercedwith a total of 55 holes, was placed 1.26 m upstream from the step. Downstream of the injector was ahoneycomb grid, which straightened the flow, reduced the turbulence level and improved thehomogeneity of the airflow. The thickness of the boundary layer (measured by a Pitot tube) at the stepsection was about 13 mm. Velocity profile corresponded to a fully-developed turbulent boundary layerand was well-described by a 1/7 power law. The fuel and air lines were metered by sonic nozzles. Thestep is 35-mm high, and the 1.4-m long chamber has a square section of 100×100 mm. The test section isequipped with 100-mm high by 260-mm long UV-glass windows on 3 sides (upper and both lateral) of thecombustor to provide optical access to the flame. A spark igniter is inserted through the lower combustorwall. It is mounted flush with the surface. The exit nozzle has an adjustable plug that is used to modify thechamber pressure and acoustic impedance. The tests were performed over a range of air inlet velocityUo=40- 65 m/s, inlet air temperature Tair=450 - 600 K, fuel-air equivalence ratio ER=0.8 -1.0, airmass flow rate mair=200 - 350 g/s, Reynolds number based on the flow parameters in the inlet ductRen=10'-3.10’, turbulent Reynolds number Re=10³-2.10’, chamber pressure P= 1.12-1.5 bar andthermal power of the chamber 550 -830 kW. Acoustic pressure measurements were performed at twoaxial locations in the combustor tunnel, indicated in Fig. 1: P1 and P4-at 1.5 cm and 67.5 cmdownstream of the step, respectively. Pressure oscillations were detected by 4 in. (6.3 mm) Bruel&Kjaermicrophones (type 4136 and 4938) mounted on waveguides and equipped with preamplifiers. Themicrophones are positioned at 80 cm from the ports located on the upper wall (opposite the step) of themodel by using a connecting duct. This duct is terminated by a 10 m-long coil pipe, which eliminatesreflected waves. Optical Setup for PLIF Technique Only a short description of planar laser induced fluorescence (PLIF) ofthe OH radical (OH PLIF) isgiven here.A schematic view of the optical setup is displayed in Fig. 2. A single, 6 ns, 20 mJ pulse from afrequency-doubled, Nd:YAG-pumped dye laser (Quantel YG780) was formed into a collimated sheetusing one spherical and two cylindrical lenses. The first two lenses, -50 mm and 300 mm focal lengths,formed a cylindrical telescope which spread the laser beam into a collimated, 50-mm wide sheet. Thespherical lens, 1 m focal length, focused the sheet to a 150 um waist. The laser was tuned to the Qi(5)transition of the (1,0) vibration band of the (XTI-A2z*) system of OH at 282.75 nm. This transition waschosen due to its strong intensity and its weak dependence with temperature: as a consequence, therecorded fluorescence intensity is directly proportional to the concentration of OH radicals. The laserlinewidth was measured to be approximately 0.1 cm°byrecording the spectral profile of several OHtransitions in a premixed methane-air reference flame. The laser was tuned to the line-centre of the OHtransition using the reference flame. Fluorescence signal was recorded using an intensified CCD camera(Princeton Instruments, Imax) with an intensifier gate width of 200 ns. The CCD array was 512 by 512pixels and the frame rate of the system was 3 Hz. The ICCD camera was equipped with Schott spectralfilters WG295 and UG5 and a 94 mm, f/4.1 UV lens. The vertical laser sheet was first placed along theflow axis and at various axial locations downstream of and upstream from the step. A 50×100 mm areaof the flow field was imaged onto the camera, so that the spatial resolution was 195 um per pixel. Thevertical laser sheet was then placed in the transverse direction in order to investigate the flame structure ina cross-section of the flow, at two longitudinal locations: 20 mm upstream from and 40 mm downstreamof the step. Fig. 2. Schematic view of the experimental setup for PLIF technique Conversion of fluorescence signal into concentration of OH radical requires taking account of differentparameters, which influence the quality of measurements. Raw images must be corrected for camera darkbackground, flat field non-uniform response of the camera, collection optics, temporal fluctuations andspatial distribution of laser energy. An instantaneous correction must be systematically performed in orderto eliminate this bias. The flat field corrections were made using static cell in-situ measurements ofacetone fluorescence. The laser sheet energy and its spatial distribution were measured using a cell filledwith acetone vapor as a reference channel. Because LIF signals are temperature-dependent, the absolute number density of OH has to becalibrated beforehand in a flame where OH concentration, temperature and pressure are well known. Thecalibration was performed in a laminar premixed methane/air flame with an equivalence ratio of 0.9,recording OH fluorescence intensity versus height above the porous surface.Measurements were carriedout with experimental conditions (optical beam path, pulse energy, distance between the laser and theprobe volume, ICCD gain,...) similar to those encountered with the stepped-combustor. Absoluteconcentration was obtained from comparison between experimental and theoretical profiles for the sameflame conditions. The flame was modeled as one-dimensional using the CHEMKIN and PREMIXcomputer codes (Kee et al 1989). The resultant comparison gives the calibration law, i.e. the number ofphotons emitted by OH radicals versus their absolute concentration [molecules/cm]. Quenching rateeffects from H20 were minimized in the calibration procedure by choosing a flame condition for whichthe H2O concentration is similar to that found in the combustor. Optical Setup for PIV Technique Synchronized with High-Speed Visualization The Particle Image Velocimetry (PIV) technique is used to measure the instantaneous velocity field ina planar cross section ofthe observed flow. Because the principle is well-known (see for instance Raffelet al, 1998), only a short description of the technique is given here. The investigated flow is seeded withsmall-sized particles (solid particles or liquid droplets depending upon the nature of the fluid and thetemperature range in the flow). The fluid velocity is determined by measuring the displacement of theparticles over a given time duration. Two laser sheets separated by an adequate time interval are pulsedconsecutively to illuminate the tracer particles through the image zone. The light scattered by the particleslocated into the laser sheet is collected onto a CCD camera where each exposure is recorded in a separateframe. The images are divided into small interrogation windows, the size of which determines the spatialresolution of the measurement. The displacement of illuminated particles inside each interrogationwindow is then determined by computing a spatial cross-correlation function between the two consecutiveimages. The velocity vector projected onto the laser sheet is then deduced. a) b) Fig. 3. Photos: a) PlV and high-speed intensified video camera setup around combustor,1: PIV camera; 2: high-speed camera; 3: 100 mm diameter mirror for laser sheet; 4:combustion chamber; b) combustion chamber with flame anchored at the step,illuminated with vertical PIV laser sheet Fig. 3a shows a photo of the PIV setup and high-speed intensified video camera around the steppedcombustor. Two superimposed diverging laser sheets at 532 nm wavelength were formed from a doubleoscillator, frequency-doubled pulsed Nd:YAG laser system (Quantel Twins CFR, 120 mJ/pulse). The lasersheets were placed vertically along the flow axis by using a 100 mm diameter mirror located above theupper window, as shown in Fig. 3a. Fig 3b shows a photo of the combustion chamber with the flameanchored at the step, illuminated with vertical PIV laser sheet (regions upstream from and downstream ofthe step are seen). The time interval between the two consecutive laser pulses was set to 3 us for theexperiments reported in this paper. The flow was seeded upstream of the methane injector with solidtracer particles using a pressurized cyclone generator. Magnesium oxide particles, capable of withstandingthe high-temperature reacting environment, were chosen. The size distribution of the particles is centeredon 1 um. These particles were slightly diluted with nanometric Aerosil@ (fumed silicon dioxide) particlesin order to fluidize the seeding particles mixture and reduce the risk for particles agglomeration. Particlesimages were collected perpendicularly to the laser sheets, through one of the chamber lateral UV-glasswindows, as shown in Fig. 3a, using a CCD camera (LaVisionFlowmaster 3S), with a frame size of1280x1024 pixels. The camera was equipped with a 50 mm, f/8 lens and a narrow-band interference filtercentered at 532 nm wavelength (3 nm FWHM bandwidth) in order to filter out the flame radiation. Thefield-of-view covered the whole height of the chamber (100 mm) and a 130 mm length (65 mm on eitherside of the step). Image acquisition and data reduction were performed using the Davis 7.1 software fromLaVision. In order to reduce the background noise generated by window pollution from MgO particlesdeposits, particularly significant in the recirculation zone located downstream of the step, images weresystematically pre-processed using a subtract-sliding-background type numerical filter. Cross-correlationinterrogation windows of 32x32 pixels with 50% overlap were used, corresponding to a measurementspatial resolution of 3.25 mm and a vector every 1.6 mm. The high-speed intensified video camera (Photron Fastcam-ultima APX-i2) was placed near the PIVcamera, as shown in Fig. 3a, and viewed the chamber with a slight tilt angle. It was equipped with a narrow-band filter (CVI Technical Optics Ltd) centered at 310 nm wavelength (10 nm FWHM bandwidth)in order to select a spectral region in which the only flame radiation source is OH* chemiluminescenceemission. The frame rate of the camera was 4,000 frames/s, for a frame size of 1024x512 pixels. For eachimage, the intensifier was operated during the last 150 us of the 250-us CCD array exposure. This timeduration was found to be the best compromise between sufficient signal-to-noise ratio and low exposuretime. Signals from microphones located at P1 and P4 (see Fig.1) were recorded simultaneously to theimages at a 40 kHz data rate by using a multi-channel data link system associated with the camera. ThePIV images and high-speed images acquisitions were synchronized following the scheme represented inFig. 4. The synchronization allowed a timing identification of the instantaneous PIV velocity fields withrespect to the flame movement. The PIV acquisition unit and the high-speed cameras were the master andslave systems, respectively. At each trigger signal from the PIV system, a 30-ms sequence of 121chemiluminescence images was recorded. The two PIV images were recorded in the middle of thesequence. A total of 101 such sequences were successively recorded at a 2.5 Hz acquisition rate, afterwhich the memory of the high-speed camera was filled. Fig. 4. PIV/high-speed camera synchronization scheme It should be reminded here that, on one hand, contrarily to PLIF, which is a planar technique, emissionimages are integrated over the chamber width (line-of-sight technique). Moreover, due to the largeexposure time, the time resolution of the emission images is quite poor (150 us exposure time, versus 6 nspulse duration for PLIF), and the observed flame image can not be “frozen” due to significant fluidmotion during the exposure. On the other hand, because the OH* radical, on an electronic excited state,exists only in the flame front, the chemiluminescence signal is a much more reliable tracer of the reactingzone than the fluorescing OH, which is in the fundamental electronic state and exists not only in the flamefront, but also in the burnt gas. Moreover, the acquisition rate of the PLIF technique is limited to a few Hz(3 Hz in this study, versus 4,000 Hz for high-speed chemiluminescence images) and does not provideaccess to unsteady information. Therefore, the high-speed chemiluminescence visualization and PLIFtechniques complement each other: the PLIF technique provides excellent time and space resolution; thehigh-speed visualization provides detailed qualitative characterization of the flame unsteadiness. EXPERIMENTAL RESULTS Classic stable turbulent combustion was observed when the exit nozzle was fully open, under thefollowing conditions: P=1.12bar, 中≥0.8,Tair ≥500 K and Uo≥ 40 m/s. High-speed visualization, instantaneous OH PLIF images and pressure power spectra (not presented here) show that stable turbulentcombustion is characterized by a strong influence of irregular turbulent vortex movements on thecoherent vortex structures generated in the mixing layer downstream of the step. Power spectra do notexhibit any pronounced peaks, and it can be concluded that stable turbulent combustion consists actuallyof numerous coexisting instabilities. High-speed visualization and PLIF images reveal that there is somepermanent flame flapping with finite amplitude. The images show that the flame is primarily anchored atthe initial part of the shear layer generated by the backward-facing step. The flame stabilization locationfluctuates with small amplitude at the vicinity of the step edge during this flapping. Increasing the degree of constriction of the combustor exit nozzle (that, in turn, increased the meancombustor pressure and changed the acoustic impedance) performed transition from stable to unstablecombustion. The instability appeared at pressures larger than 1.25 bar. To improve the understanding ofthe mechanisms involved, one case was studied in detail: Uo=51m/s, 中=0.82, Tair = 550 K, air massflow 270 g/s, combustor pressure 1.35 bar. Power spectrum of the pressure signals has a 154 dB peak atthe low frequency of 66 Hz (it corresponds to the y4 longitudinal acoustic wave for the inlet duct).However, the pressure signals were highly modulated in frequency (in the range 55-80 Hz) and amplitude,and exhibited abrupt low-frequency drops toward zero (around 2 Hz), as shown in Fig.5. This modulationbehavior prevents from locking images acquisition (PIV, PLIF or chemiluminescence) to the phase of theunsteady pressure signal, a method frequently used in combustion instabilities studies for moderateReynolds numbers (see for instance Broda et al 1998,Lee et al 2000, Docquier and Candel, 2002, Leeand Santavicca, 2003, Ghoniem et al 2005)) in order to fully resolve a cycle of instability. Fig.5. Sample of an unsteady pressure signal recording, showing in particularlow-frequency (around 2 Hz) pressure drops toward zero A trigger threshold that defines the time origin can not be applied due to the modulation in amplitude,and the modulation in phase prohibits triggering laser flash lamps that require constant frequencyoperation. However, the simultaneous recording of high-speed chemiluminescence images and pressuresignals allowed to link directly the evolution of the reaction zone with that of the unsteady acousticpressure, as represented in Fig. 6 in which sampled images are gathered with corresponding pressuretraces P1. The flame is first anchored at the step edge. As the pressure decreases from maximum tominimum, the flame propagates up to sometimes more than 65 mm (i.e. around twice the step height)upstream from the step. The window is not large enough to visualize the flame front more upstream. Thenthe flame propagates back downstream toward the step as the pressure increases. Finally the flame getsre-anchored at the step edge, and the cycle repeats itself. The flame location in the last image in Fig. 6 isclose to what can be observed for the case of a stable flame. The flame propagation upstream takesaround 8 ms, while the flame returns toward the step much faster, during only around 2 ms. This timingdifference can be explained by opposite directions of the flame velocity and acoustic velocity while the flame propagates upstream, versus same directions when it propagates downstream. It also explains thenon-sinusoidal shape of the pressure signal: the pressure decreases or increases with different and highslopes during flame propagation upstream and downstream, and decreases very slowly from the start ofthe flame re-attachment process to the flame detachment. Fig. 6. Simultaneous recording of high-speed OH* chemiluminescence images andunsteady pressure P1 (blue: low-pass filtered, red: unfiltered) during a cycle of instability Fig. 7 shows an example of an instantaneous PIV velocity field synchronized with high-speed imagestaken as the flame propagates downstream toward the step before re-attachment. This result shows thatthis motion is associated with the formation of a strong vortex behind the step and an induced accelerationnear the step edge, with a velocity in this region reaching 85 m/s versus 40 m/s upstream from the step atthis instant in the cycle. Fig. 7 illustrates the interest of synchronizing PIV acquisition with high-speedchemiluminescence images: although the pressure signals do not allow phase-locked acquisition, thesynchronization allows identifying at which instant, pressure, and flame location of the cycle, the velocityfield corresponds to. The procedure can be repeated for all recorded instantaneous velocity fields in orderto fully describe the fluid motion during a cycle of instability. However, this post-processing task is quitetime-consuming and has not been completed yet. Fig. 7. Instantaneous PIV velocity field synchronized with high-speed OH*chemiluminescence images at 4,000 Hz. Figs 8 and 9a show the average and fluctuating velocity fields, deduced from 101 instantaneoussamples for a stable flame, respectively. The large recirculation zone behind the vortex is clearlyevidenced from the average velocity field. The longitudinal component of the velocity upstream from thestep is 70 m/s, with an rms fluctuation of around 10 m/s. As expected, the largest fluctuations occur in thereacting mixing layer, with a fluctuation level less than 20 m/s. The difference between stable andunstable cases is partiS 1Scularly strong when comparing in Figs. 9a and 9b the fluctuation level of thevelocity longitudinal component upstream from the step. These fluctuations reach 45 m/s rms for the caseof an unstable flame, due to the periodic unsteady flashback observed on the high-speed movies, when theflame lifts from the edge of the step and moves periodically in and out of the premixing duct. Some of theinstantaneous velocity fields revealed some particularly high levels of velocity when the flame movestoward the step from the premixing duct, such as in Fig. 10a showing velocities reaching 200 m/s. On thecontrary, some cases of flow reversal were observed, such as in Fig. 10b showing negative velocities ofup to 40 m/s in level near the step wall. PLIF images provided further insight into the flame structure during instabilities thanks to its excellenttime and space resolution characteristics. A cycle of instabilities was reconstructed in Fig. 11a fromselected instantaneous images, taken when the left border of the 50x50 mm laser sheet, placed along theflow axis,, wwaass located 10 mm upstream from the step. Instabilities are mainly observed aslarge-amplitude and extremely strong flapping of the flame. These violent oscillations are driven byperiodic vortex shedding from the step edge. The flame stabilization location is moved by large-scalevortices on a large zone of the combustor. Consequently, the vortex shedding is controlled by largeacoustic velocity fluctuations at the step edge where the flow separates, which provides the couplingbetween combustion, vortices and acoustics. From PLIF images, the features of the turbulent combustionregime can also clearly be visualized, through the presence of small wrinkled structures. Fig. 8. Average velocity field obtained from 101 instantaneous PIV velocity fields for astable flame. False-colors refer to the module of the velocity vector. The step edge islocated at x=0,y=-35mm a) b) Fig. 9. RMS scalar field of the longitudinal velocity component obtained from 101instantaneous PIV velocity fields, a) stable flame, b) unstable flame a) Fig. 10.Instantaneous velocity fields showing very high velocity fluctuations occurringduring instabilities. Black squares correspond to interrogation windows in which no validvector could be measured, a) very high velocities, up to 200 m/s (red zones), b) flowreversal (negative velocities in the blue zones) Fig. 11. Typical instantaneous PLIF images taken during unstable combustion,a) reconstructed cycle of instability from sample images taken with laser sheet alongflow axis, b) sample images taken with laser sheet perpendicular to flow axis, at -20 mmupstream from the step. Such structures, sometimes as small as a few hundred microns, are particularly noticeable in Fig. 11b,representing PLIF images recorded when the laser sheet was placed perpendicularly to the main flow, atabout 20 mm upstream from the step. Also visible are some methane/air combustion pockets disconnectedfrom the main flame, typical for the thickened wrinkled flames regime in the Borghi diagram. A strikingfeature revealed by PLIF images taken in the transverse direction is that the flame is highlythree-dimensional and largely distributed over volume, especially when unstable. In the unstable case, theflame spatial location varied with time: it could either spread over the entire cross-section, or be locatednear the sidewalls (glass windows) with partial extinction along the flow axis. Such a variation of theflame spatial location was not observed for the stable case; downstream of the step, the flame remainedquite uniformly spread over the chamber width, and never occupied the entire height of the chamber.These results suggest the strong influence of wall conditions on the spatial development of the flame. The phase and frequency modulation of the pressure oscillations reported in this study may beattributed to these particular features of the turbulent combustion regime identified by PLIF images. Asindicated in the introduction section of this paper, most of experimental studies were performed onsubscale combustors with lower turbulent Reynolds numbers and therefore different turbulent combustionregimes (wrinkled or corrugated flames), classically assumed in LES of combustion instabilities; in thesestudies, the phase and frequency modulation observed here is not reported. In our experiments, strongturbulence most likely significantly impacted the flame front internal structure and the statisticalcharacteristics of the combustor instabilities limit cycles. This is an important result since the thickenedwrinkled flames regime at play is typical for real combustors in industrial gas turbines. Therefore, theobtained results suggest that some modifications of turbulent combustion modeling are needed whenapplying LES approach to industrial gas turbines; in particular, impact of acoustic waves on the flamestructure has to be taken into account. CONCLUSION In this paper, recent progress in the study of combustion instabilities inside a lean-premixed steppedcombustor has been described. Transition from stable to unstable regime of combustion occurred whenthe pressure was increased above 1.25 bar. High-speed OH* chemiluminescence images, synchronizedwith PIV measurements and pressure signals, allowed to describe the fluid motion and to link directly theevolution of the reaction zone with that of the unsteady acoustic pressure during quasi-periodic cycles ofunsteady flashbacks, when the flame lifted from the edge of the step and moved periodically in and out ofthe premixing duct. Flame propagation up to more than twice the step height upstream from the step wasobserved during flashback. These quasi-periodic flashbacks are associated with very large velocityfluctuations; at times, velocity levels of up to 200 m/s were measured upstream from the step, to becompared with an average velocity of 70 m/s in the stable case. On the contrary, some periods of flowreversal, i.e. negative velocities upstream from the step, were detected. Power spectrum of the pressuresignals showed a dominant 154 dB peak at the low frequency of 66 Hz, but with significant modulation inamplitude and frequency. This modulation is attributed to the features of the turbulent combustion regime,identified by PLIF images. The flame is composed of very small wrinkled structures, sometimes as smallas a few hundred microns, as well as of disconnected methane/air combustion pockets. The flame is alsohighly three-dimensional and largely distributed over volume, and exhibits significant time variation ofspatial location when unstable. In the experiments reported in this paper, strong turbulence most likelysignificantly impacted the flame front internal structure and the statistical characteristics of the combustorinstabilities limit cycles. This is an important result since the thickened wrinkled flames regime at play istypical for real combustors in industrial gas turbines. Therefore, the obtained results suggest that somemodifications of turbulent combustion modeling are needed when applying LES approach to industrialgas turbines; in particular, impact of acoustic waves on the flame structure has to be taken into account. ACKNOWLEDGEMENTS The authors would like to acknowledge the Direction Generale de I’Armement (French ministry) forpartly funding this study. Special thanks are also expressed to Michel Poirot, Patrick Roux, Bruno Rouxel and David Carru fortheir technical support. REFERENCES Borghi, R., Destriau, M. (1998), La combustion et les flammes, Editions Technip, Paris, France. Broda, J.C., Seo, S., Santoro, R.J., Shirhattikar, G., Yang, V. (1998),“An experimental study ofcombustion dynamics of a premixed swirl injector”, 27th Int. Symp. On Combustion, 1849-1856. Cohen, J.M., Wake, B.E., Choi, D. ( 2003),“Investigation of Instabilities in a Lean Premixed StepCombustor”,J. Propulsion and Power, 19(1), 81-88. Culick, F. E. C. (1971),“Non-Linear Growth and Limiting Amplitude of Acoustic Oscillations inCombustion Chambers”, Combustion Science and Technology, 3, 1-16. Docquier, N., Candel, S. (2002),“Combustion control and sensors: a review”, Prog. Energy Combust. Sci,28, 107-150. Ganji, A. R., Sawyer, R.F. (1980),“An Experimental Study of the Flowfield of a Two-DimensionalPremixed Turbulent Flame”, AIAA J.,18(7),817-824. Ghoniem, A. F., Annaswamy, A., Park, S., Sobhani, Z.C. (2005), “Stability and emissions control usingair injection and H2 addition in premixed combustion”, Proceedings of the Combustion Institute, 30,1765-1773. Kee, R.J., Rupley, F.M., Miller, J.A.(1989),“CHEMKIN-II: A Fortran chemical kinetics package for theanalysis of gas-phase chemical kinetics”, Sandia National Laboratories Report SAND89-8009. Lee, J.G., Santavicca, D.A. (2003),“Experimental diagnostics for the study of combustion instabilities inlean premixed combustors”, J. Propulsion and Power”, 19, 735-750. Lee, S.Y., Seo, S., Broda, J.C., Pal, S., Santoro, R.J. (2000),“An experimental estimation of meanreaction rate and flame structure during combustion instability in a lean premixed gas turbinecombustor”,28th Int. Symp. On Combustion”, 775-782. Lefebvre, A. H. (1995),“The Role of Fuel Preparation in Low-Emission Combustion,”ASME J. Eng.Gas Turbines Power, 117, 617-654. Pitz, R.W., Dailly, J.W. (1983),“Combustion in a turbulent mixing layer formed at a rearward facingstep”,AIAA J., 21(11), 1565-1570. Raffel, M., Willert, C., Kompenhans, J. (1998), Particle Image velocimetry. A Practical Guide, Springer,Berlin. Rayleigh, J. W. S.(1945), The Theory of Sound, Vol. II, Dover Publications, New York, USA.
确定


还剩11页未读,是否继续阅读?

产品配置单


北京欧兰科技发展有限公司为您提供《贫燃预混火焰中热-声不稳定性可视化,速度场,速度矢量场检测方案(粒子图像测速)》,该方案主要用于其他中热-声不稳定性可视化,速度场,速度矢量场检测,参考标准--,《贫燃预混火焰中热-声不稳定性可视化,速度场,速度矢量场检测方案(粒子图像测速)》用到的仪器有德国LaVision PIV/PLIF粒子成像测速场仪、Imager SX PIV相机
推荐专场


相关方案
更多
该厂商其他方案
更多