


方案详情
文
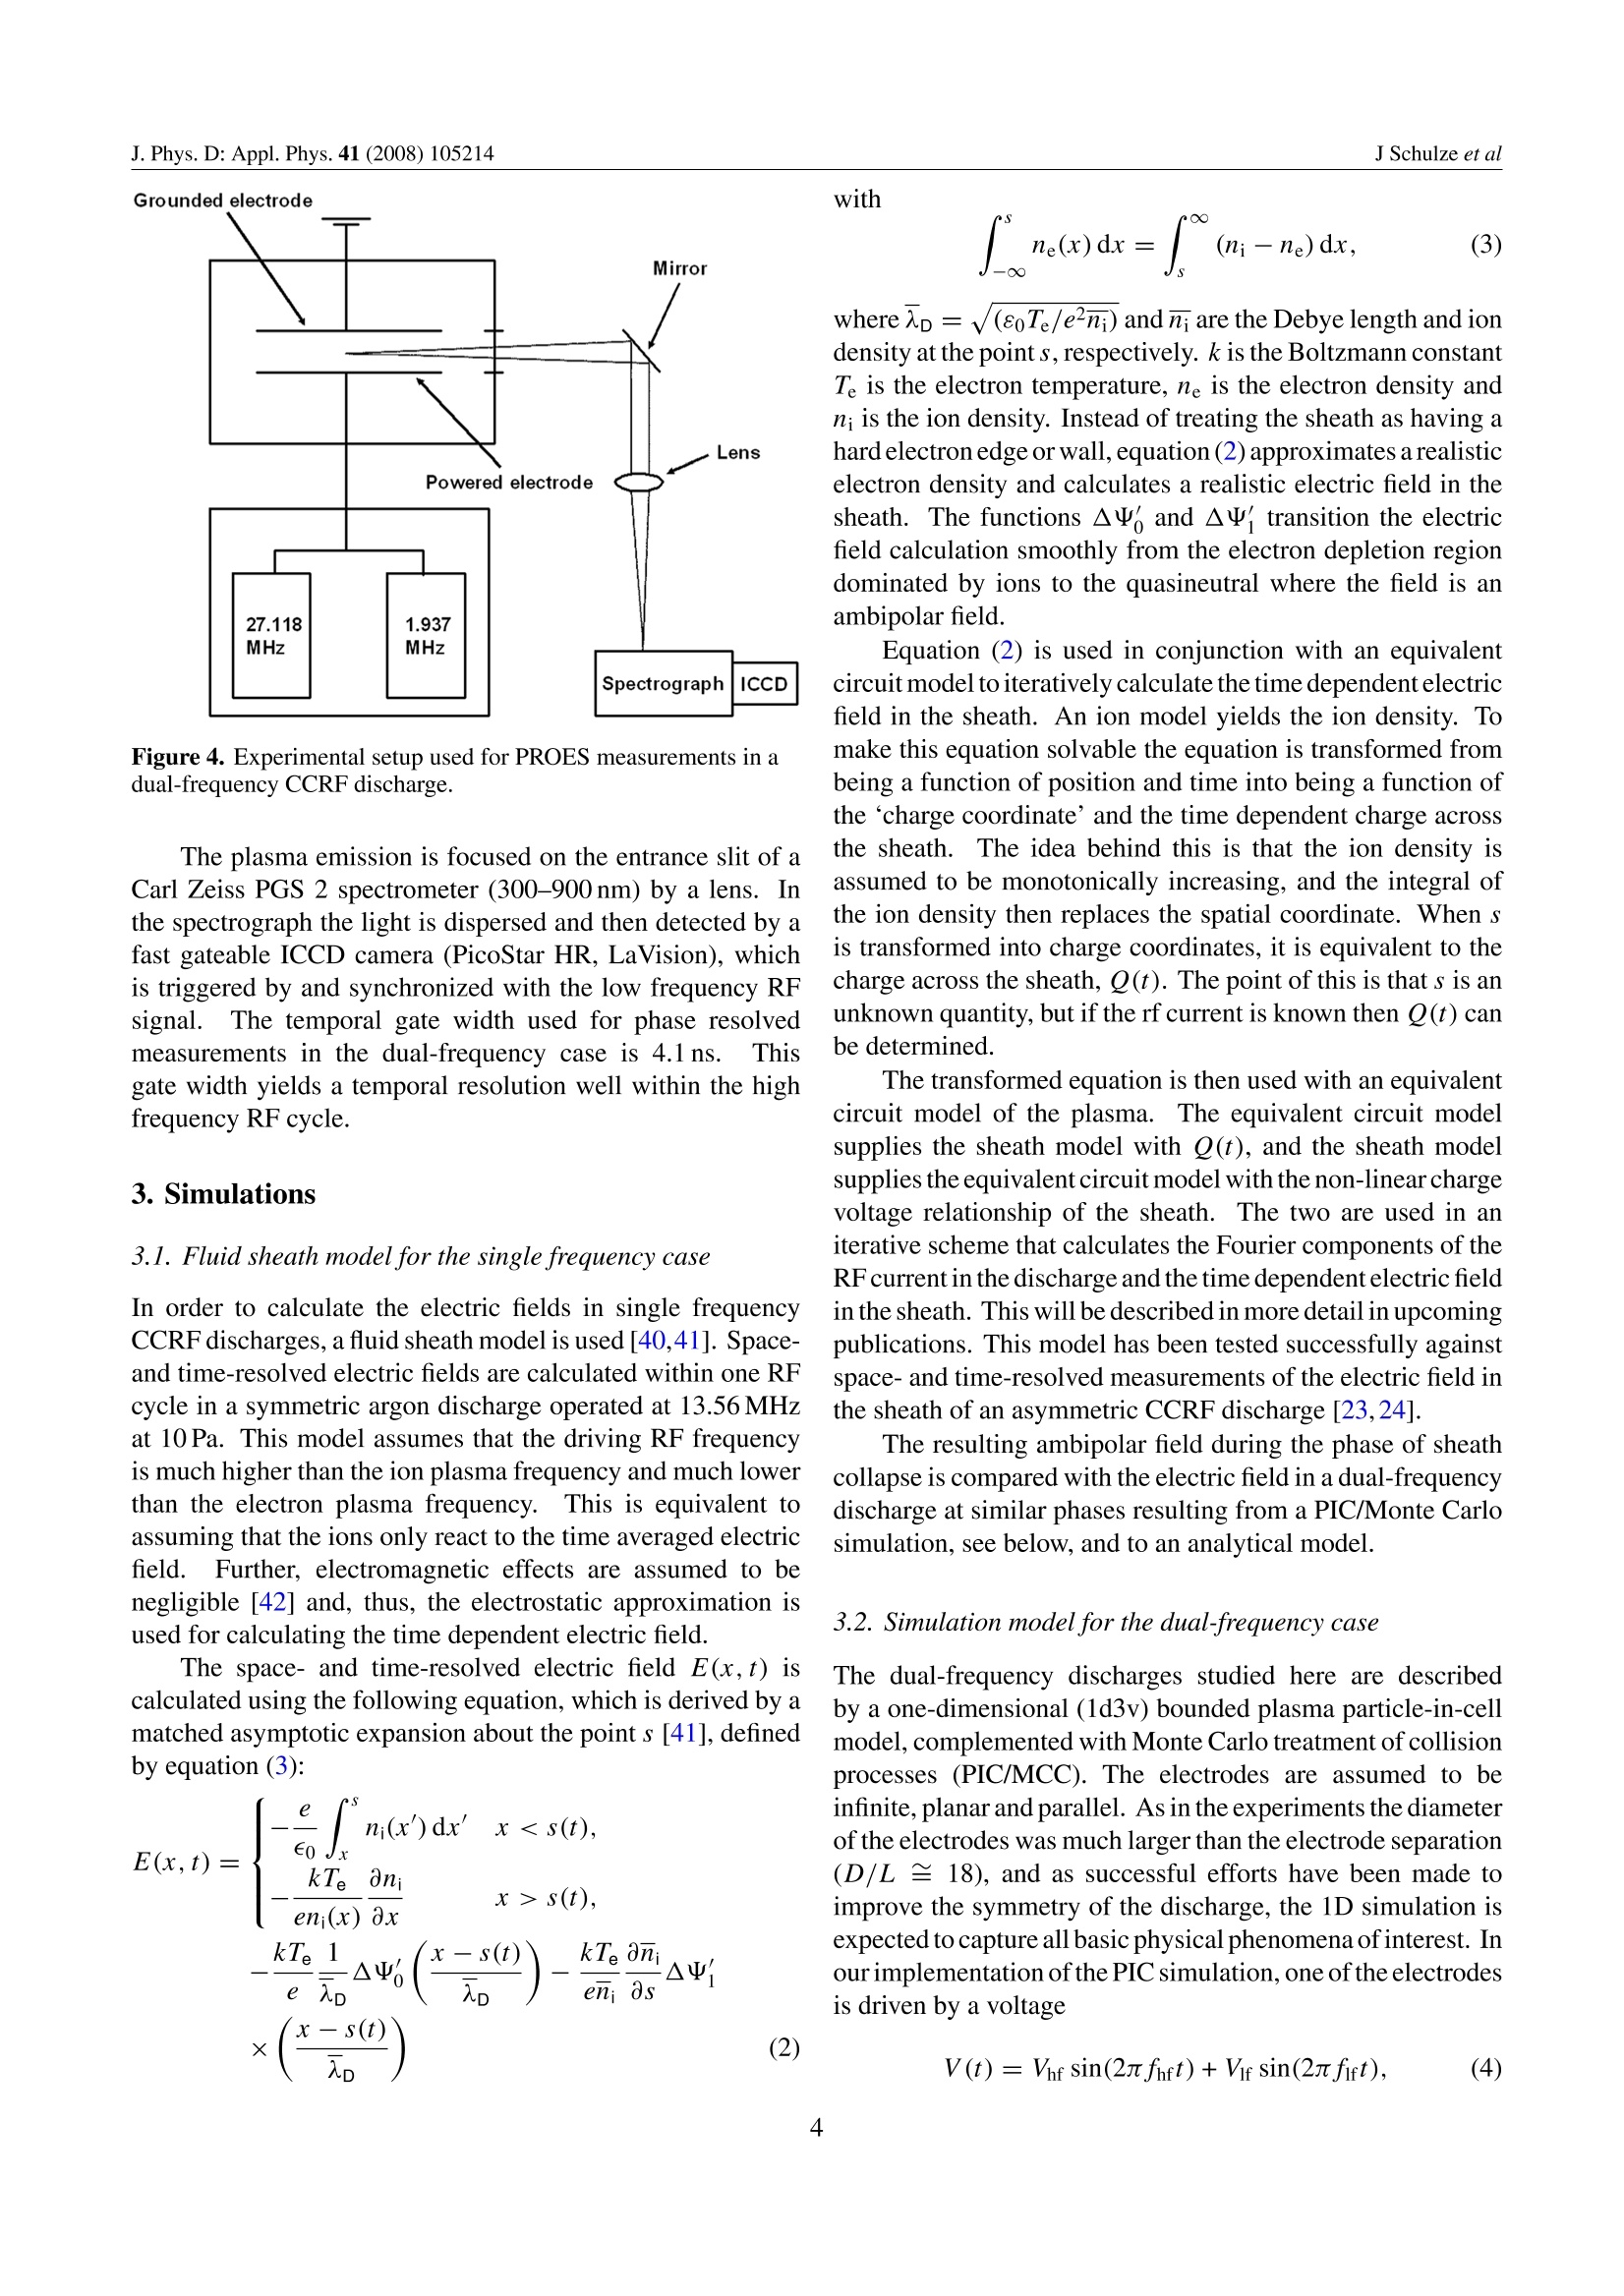
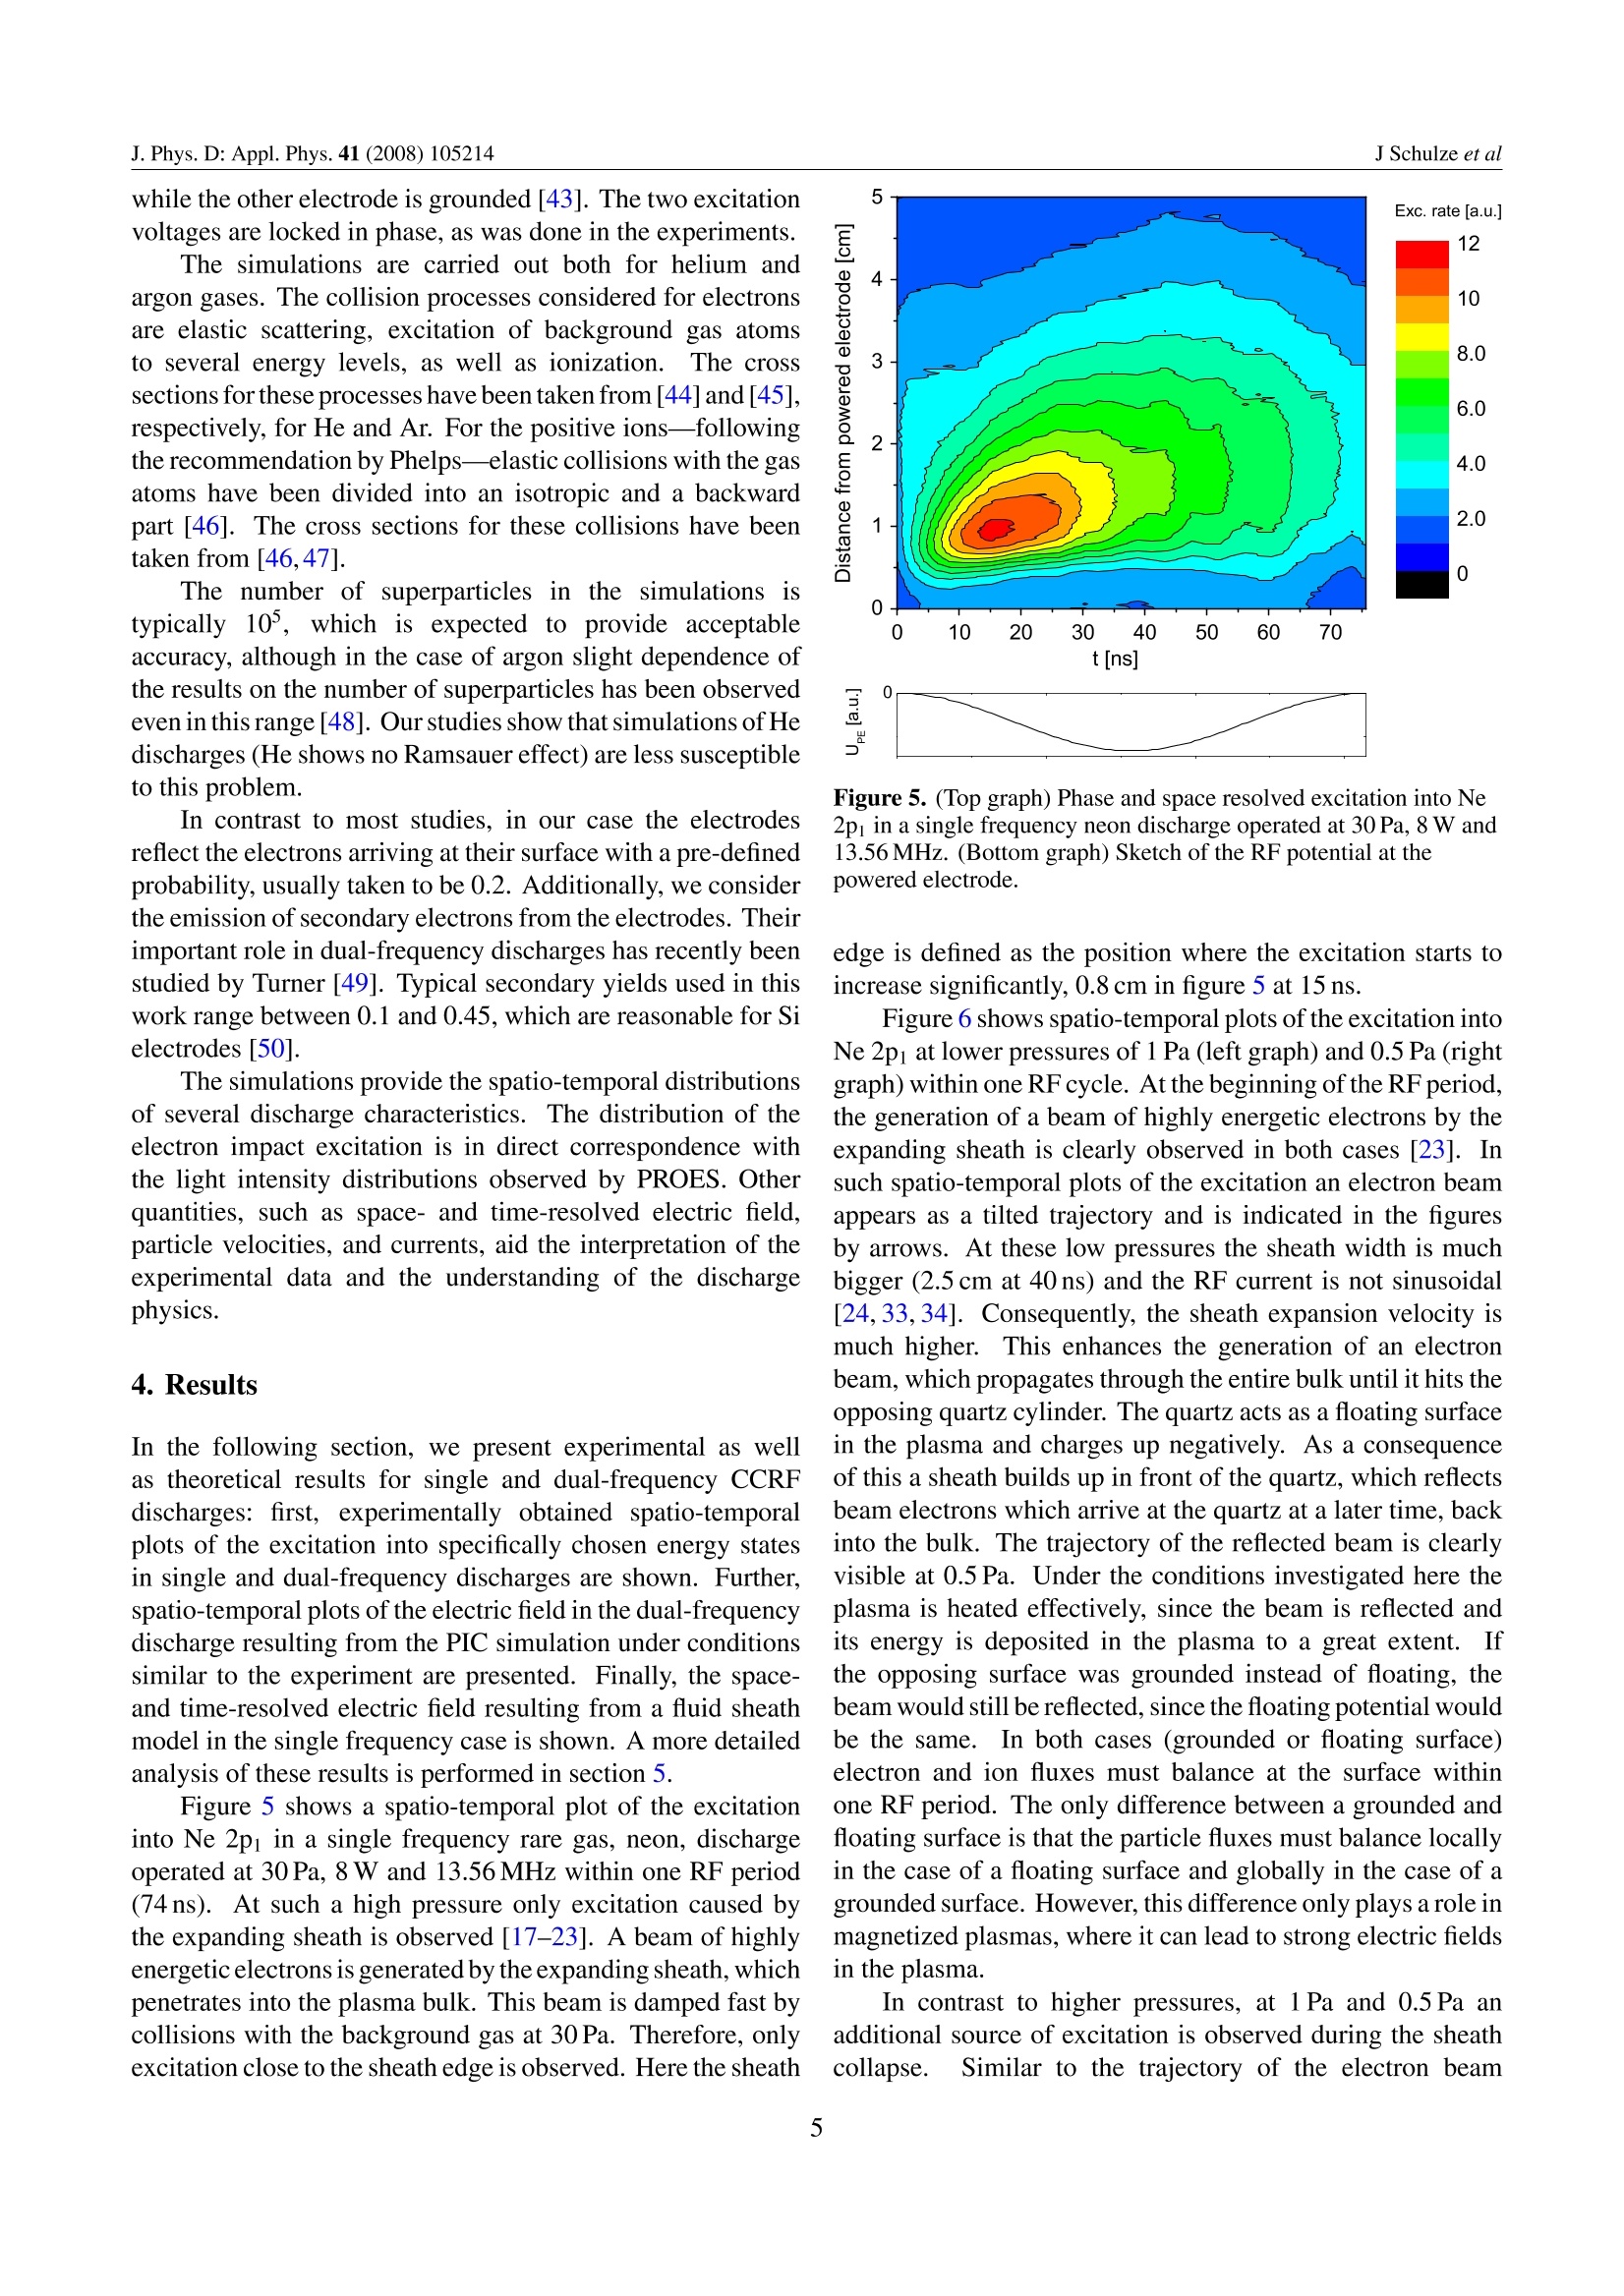
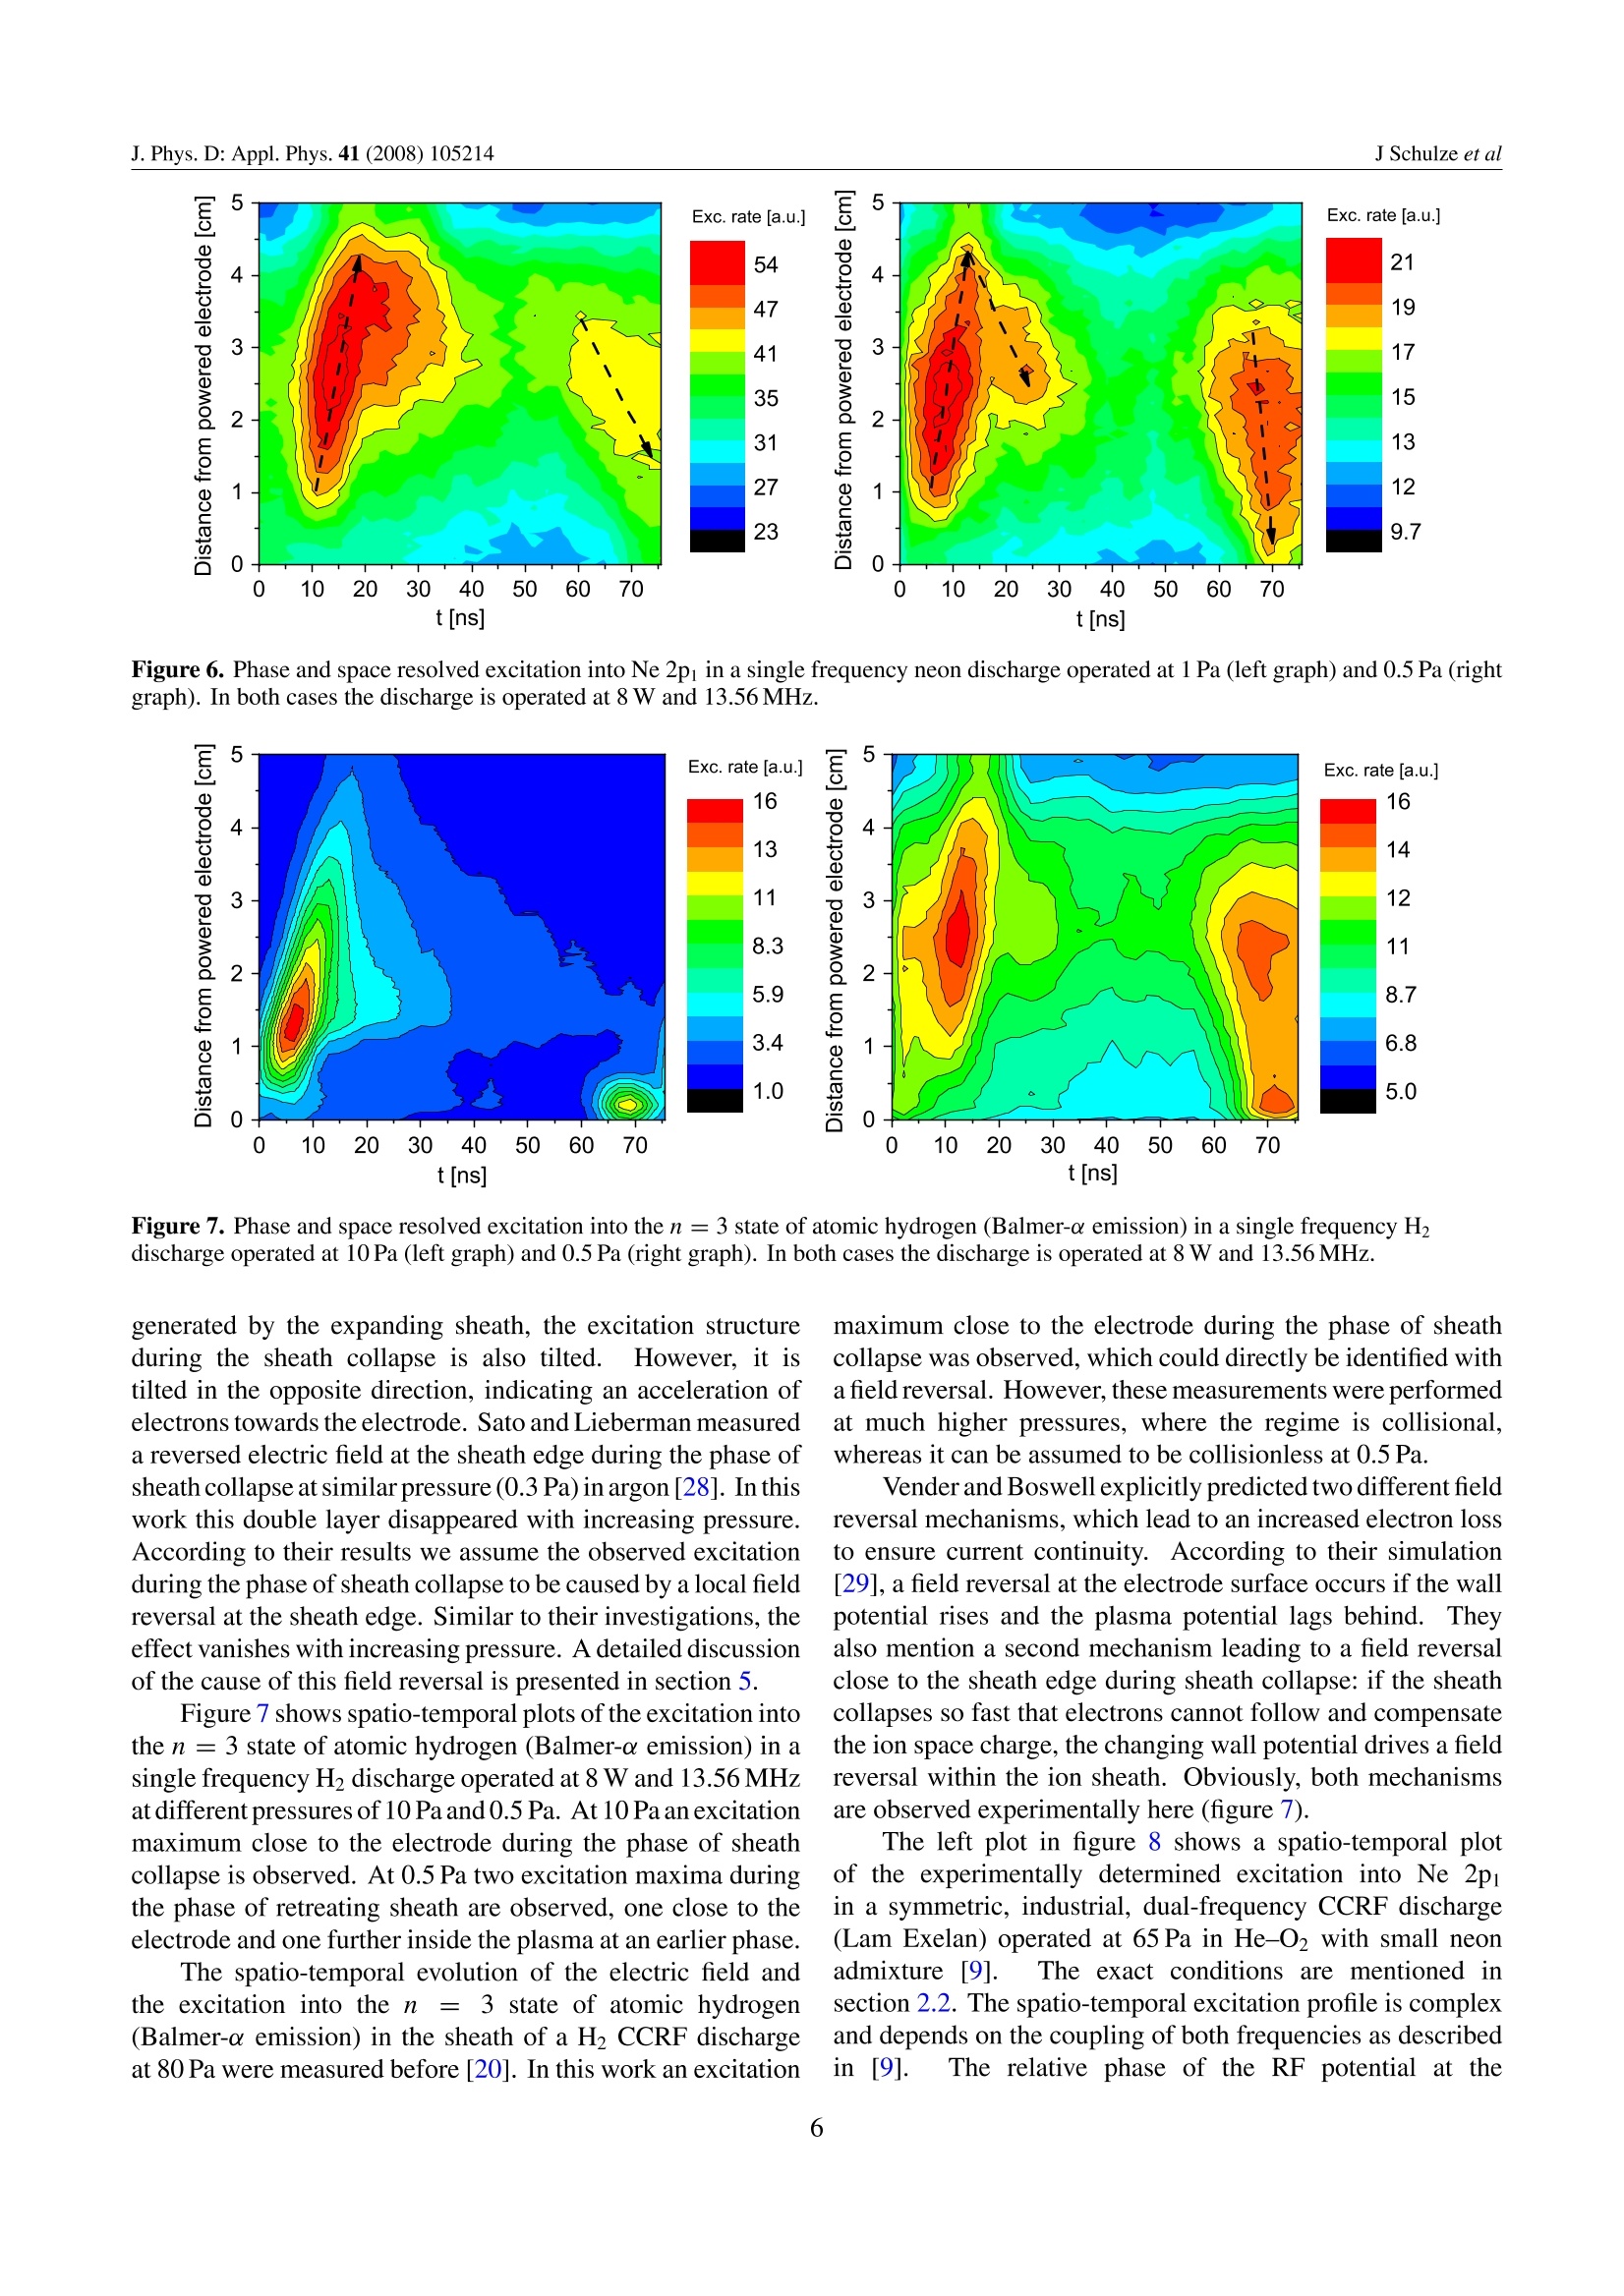
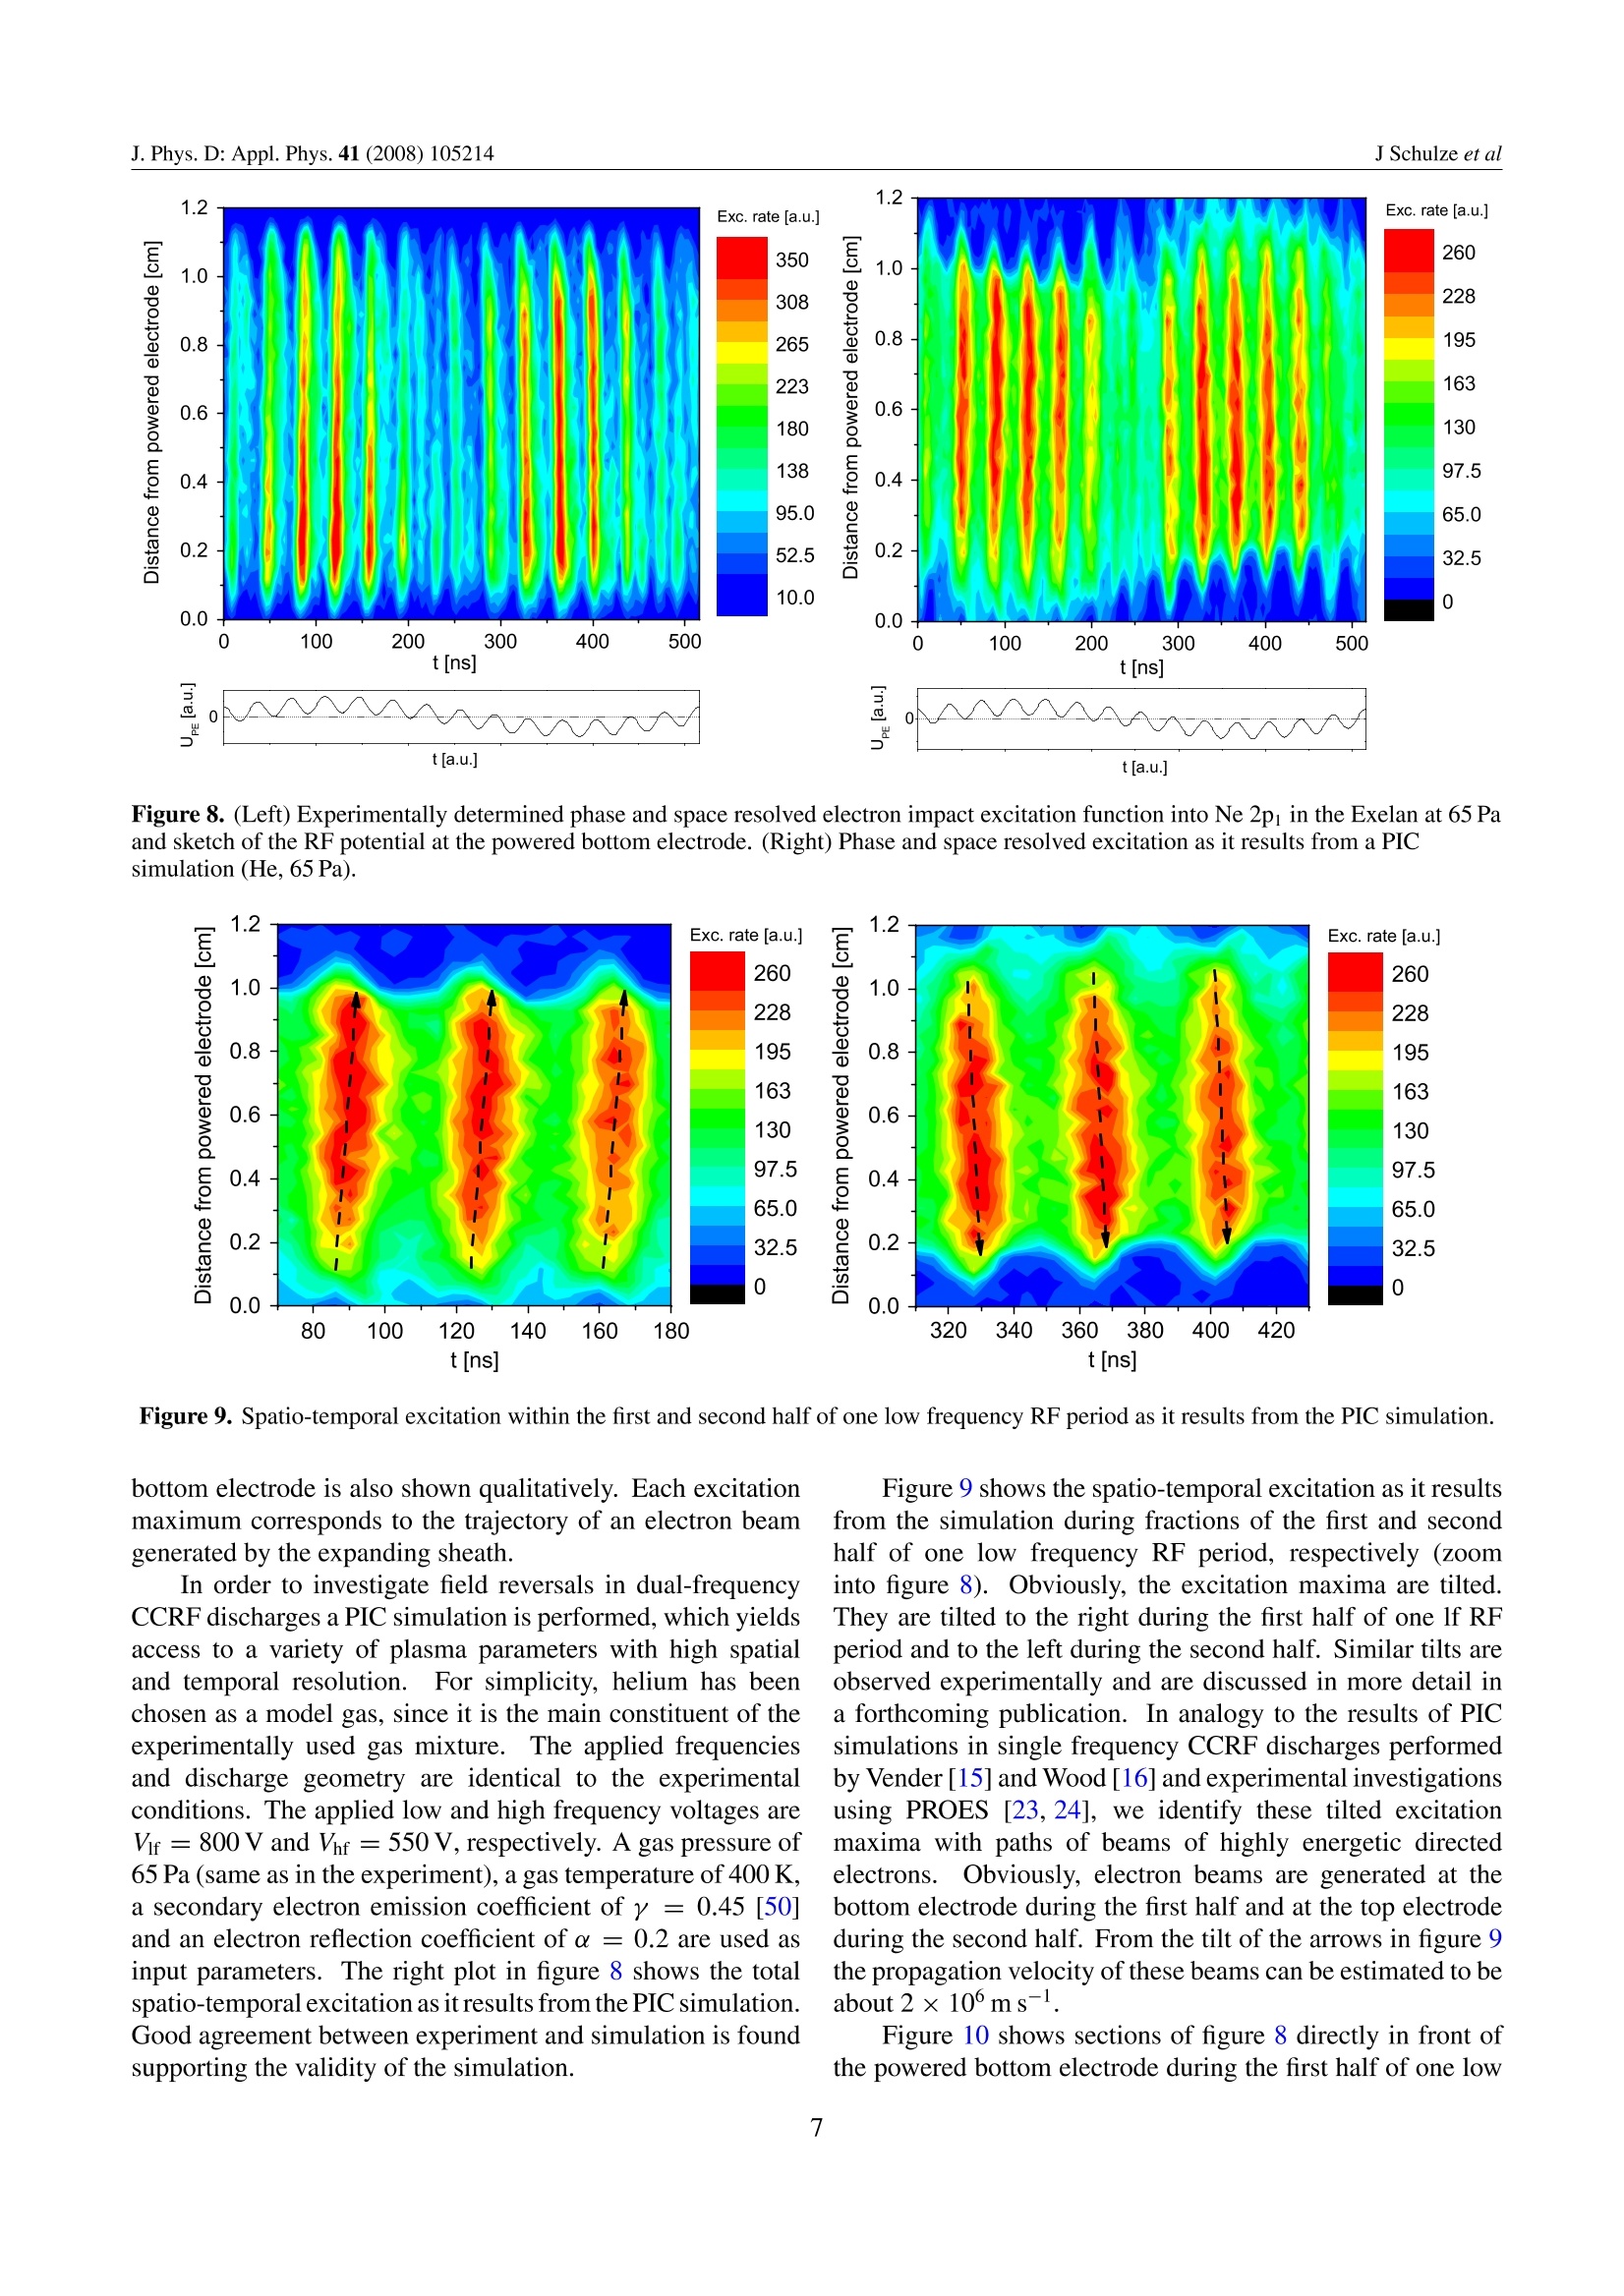
Electric field reversals in single and dual-frequency capacitively coupled radio frequency
discharges are investigated in the collisionless (1 Pa) and the collisonal (65 Pa) regimes.
Phase resolved optical emission spectroscopy is used to measure the excitation of the neutral
background gas caused by the field reversal during sheath collapse. The collisionless regime is
investigated experimentally in asymmetric neon and hydrogen single frequency discharges
operated at 13.56MHz in a GEC reference cell. The collisional regime is investigated
experimentally in a symmetric industrial dual-frequency discharge operated at 1.937 and
27.118 MHz. The resulting spatio-temporal excitation profiles are compared with the results of
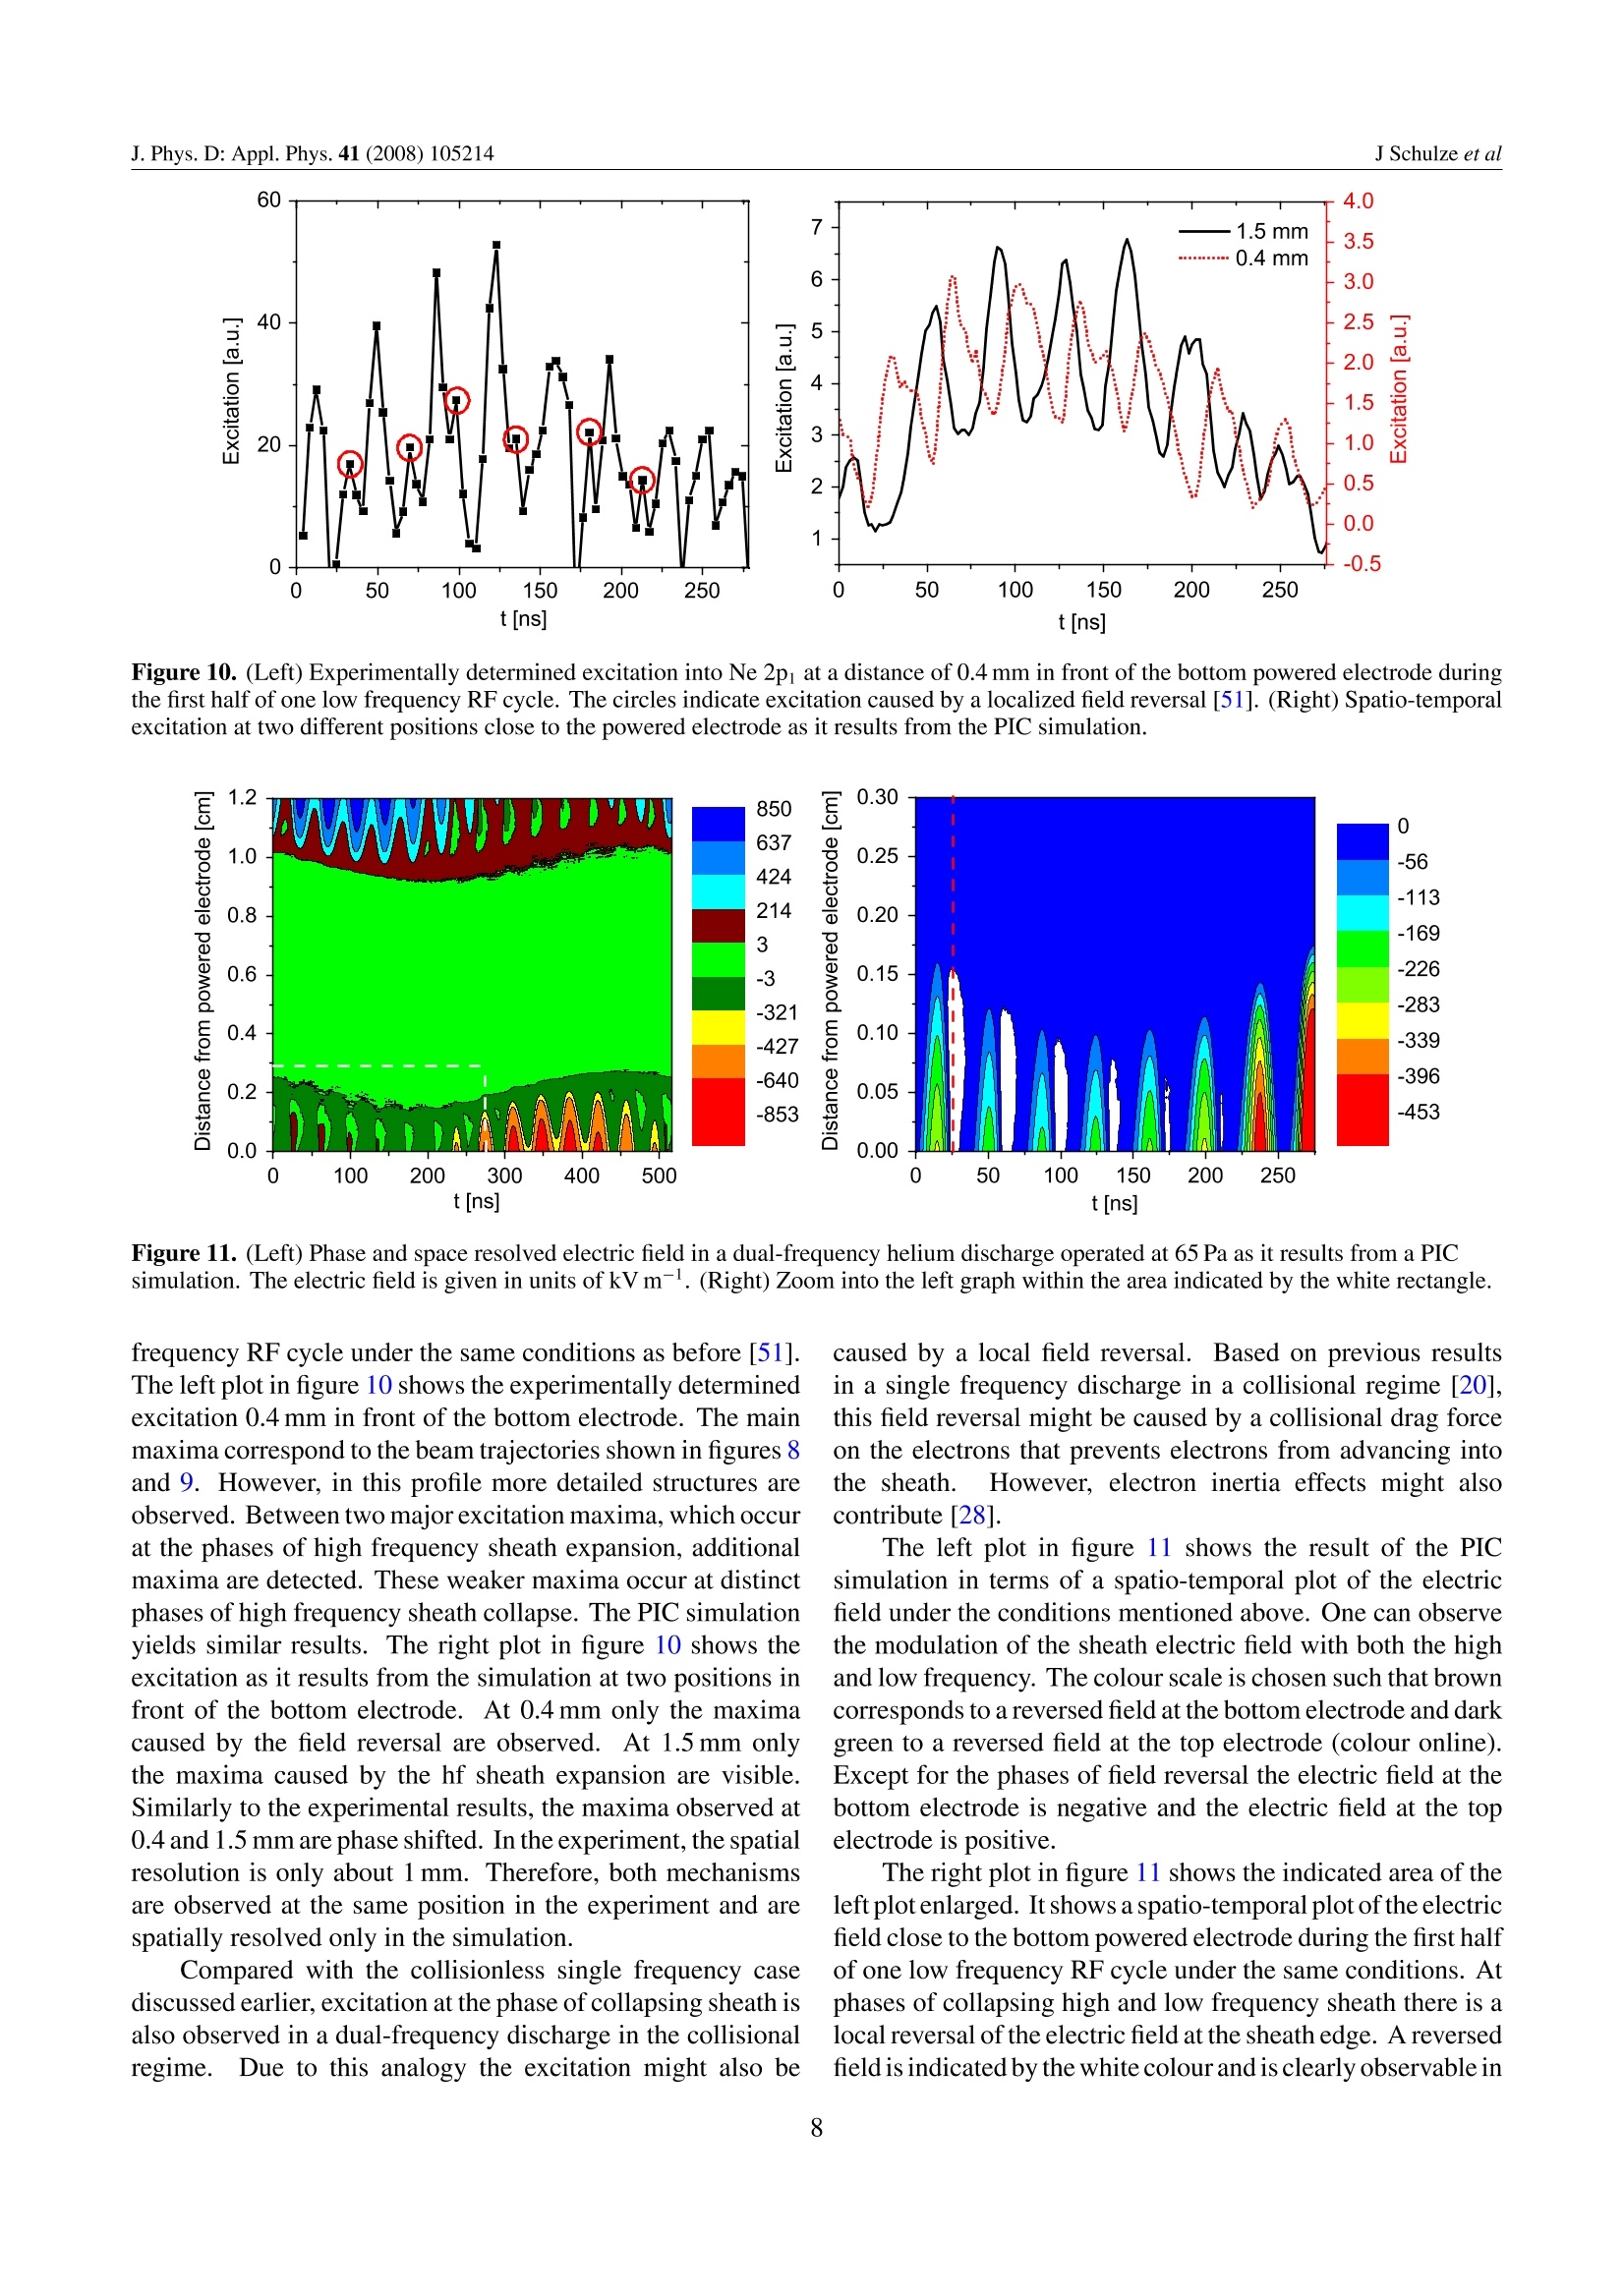
a fluid sheath model in the single frequency case and a particle-in-cell/Monte Carlo simulation
in the dual-frequency case. The results show that field reversals occur in both regimes. An
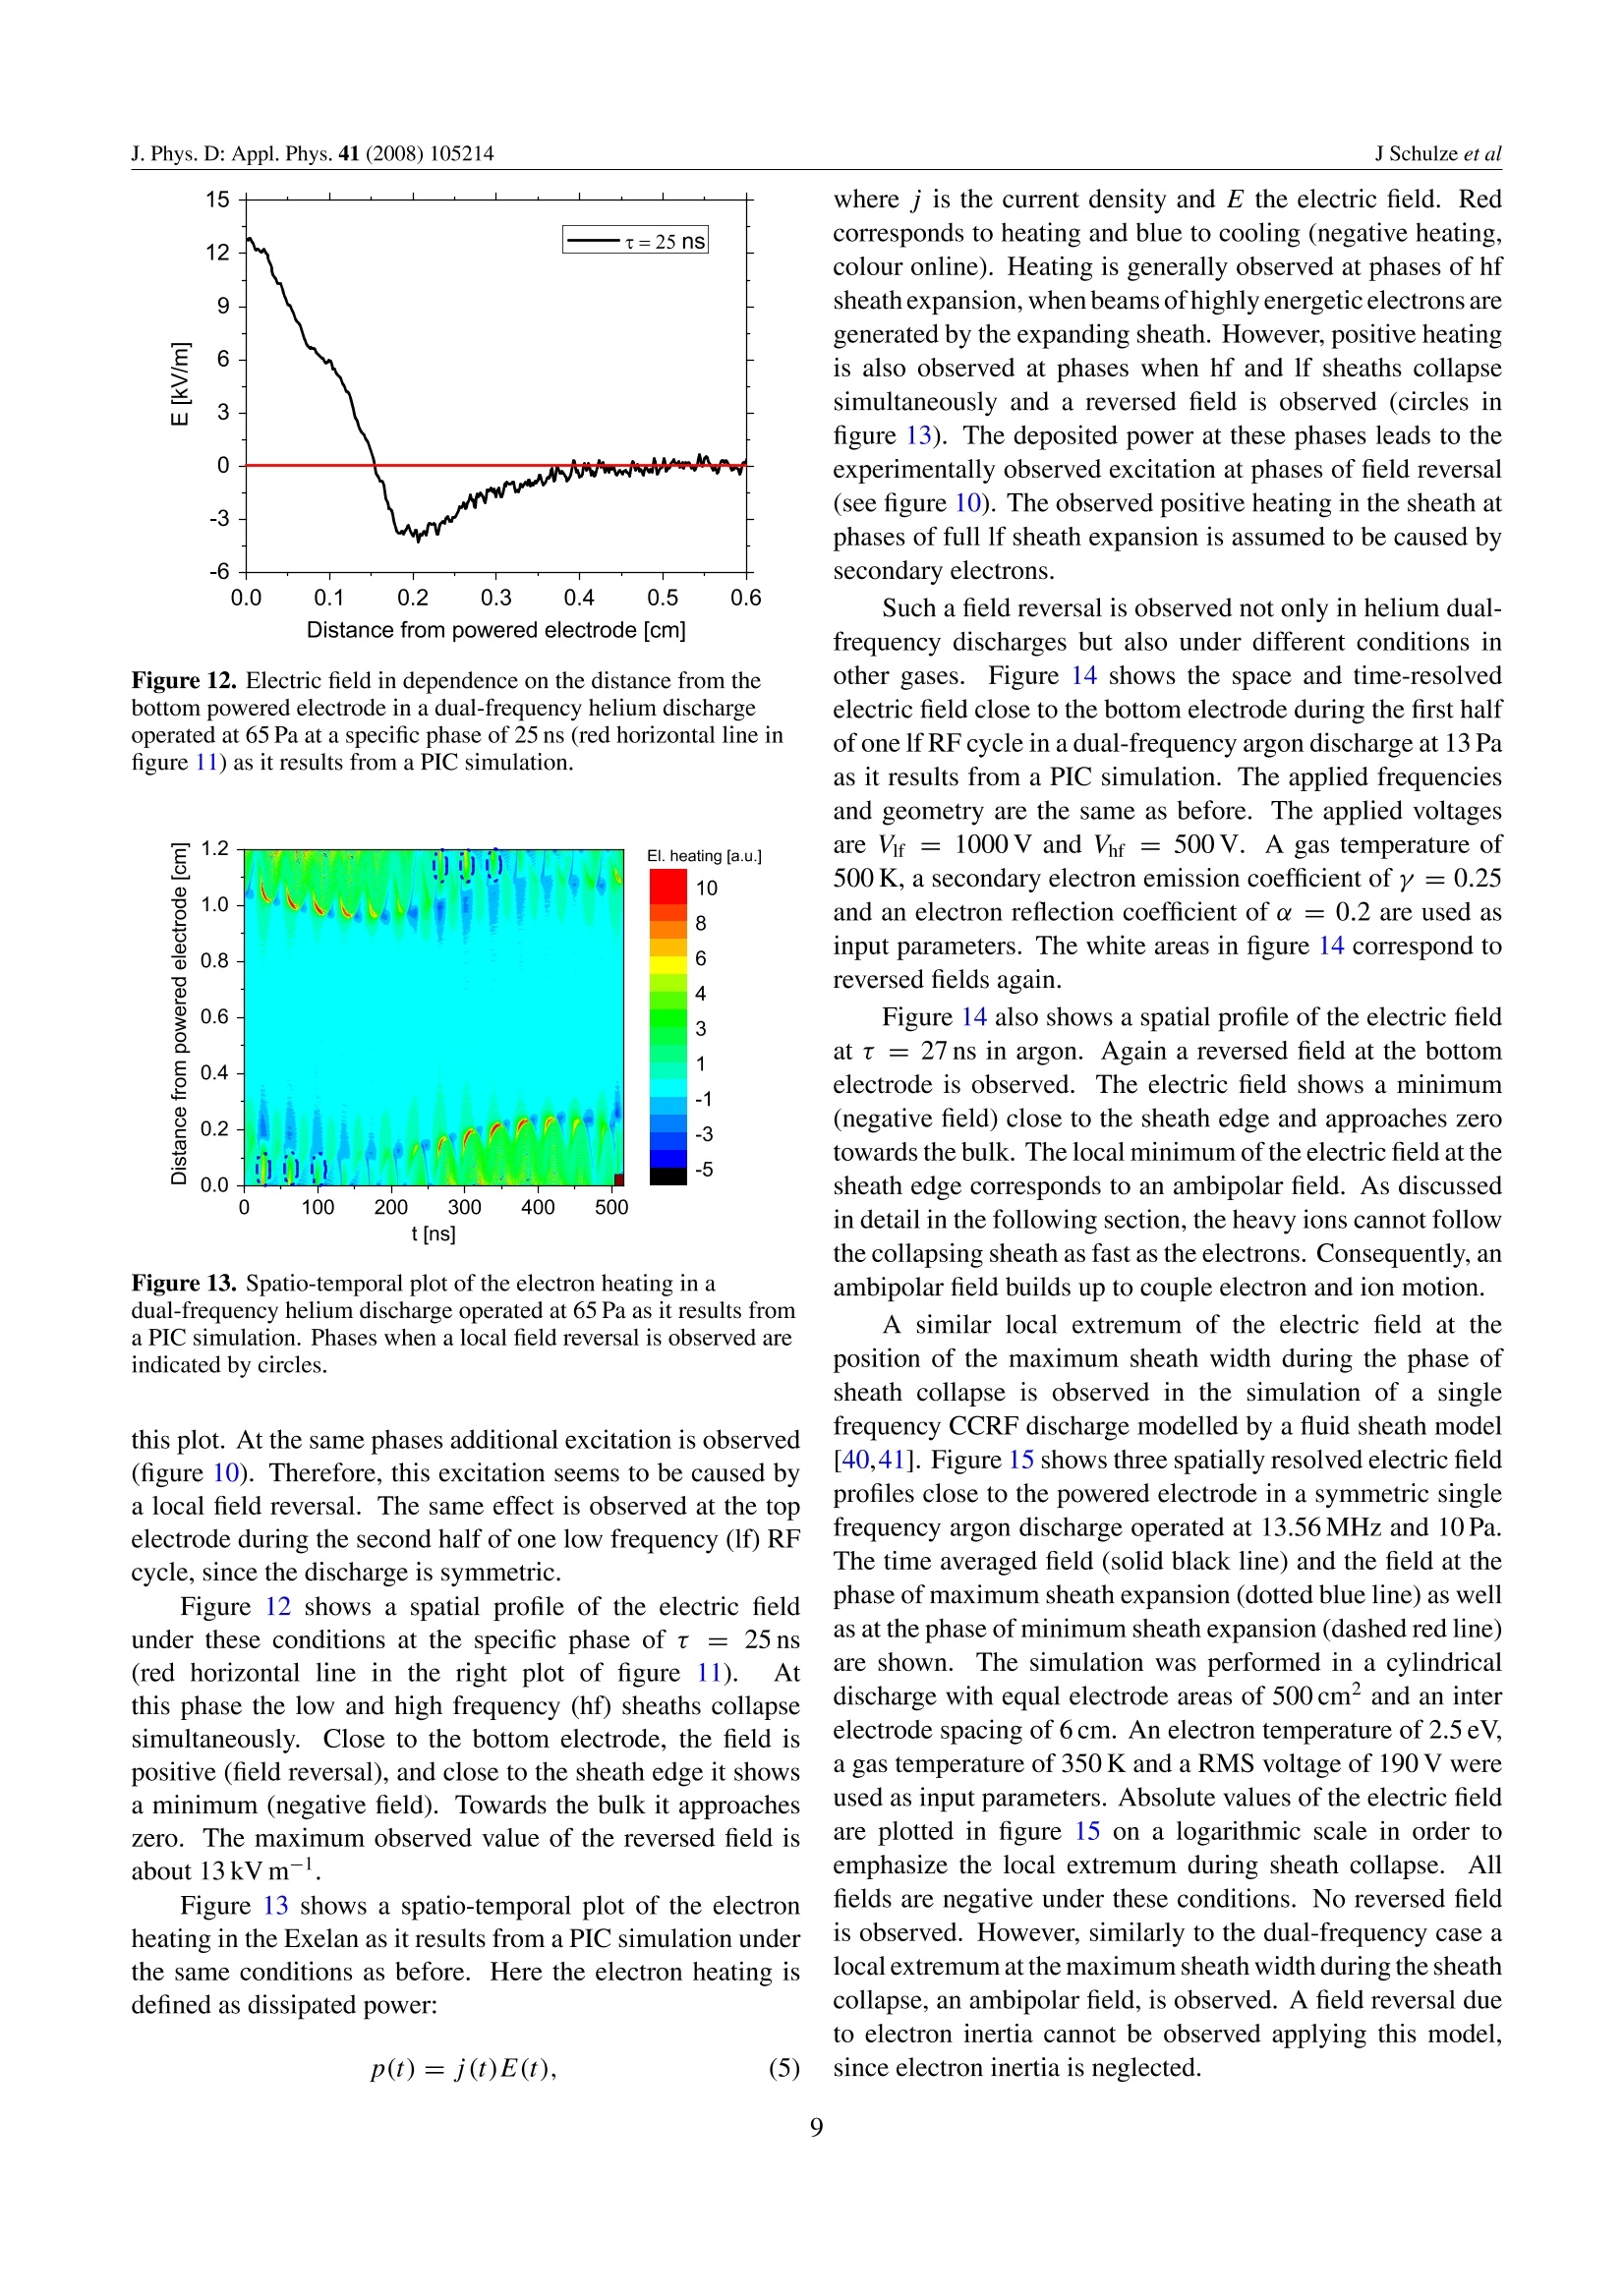
analytical model gives an insight into the mechanisms causing the reversal of the electric field.
In the dual-frequency case a qualitative comparison between the electric fields resulting from
the PIC simulation and from the analytical model is performed. The field reversal seems to be
caused by different mechanisms in the respective regimes. In the collisionless case it is caused
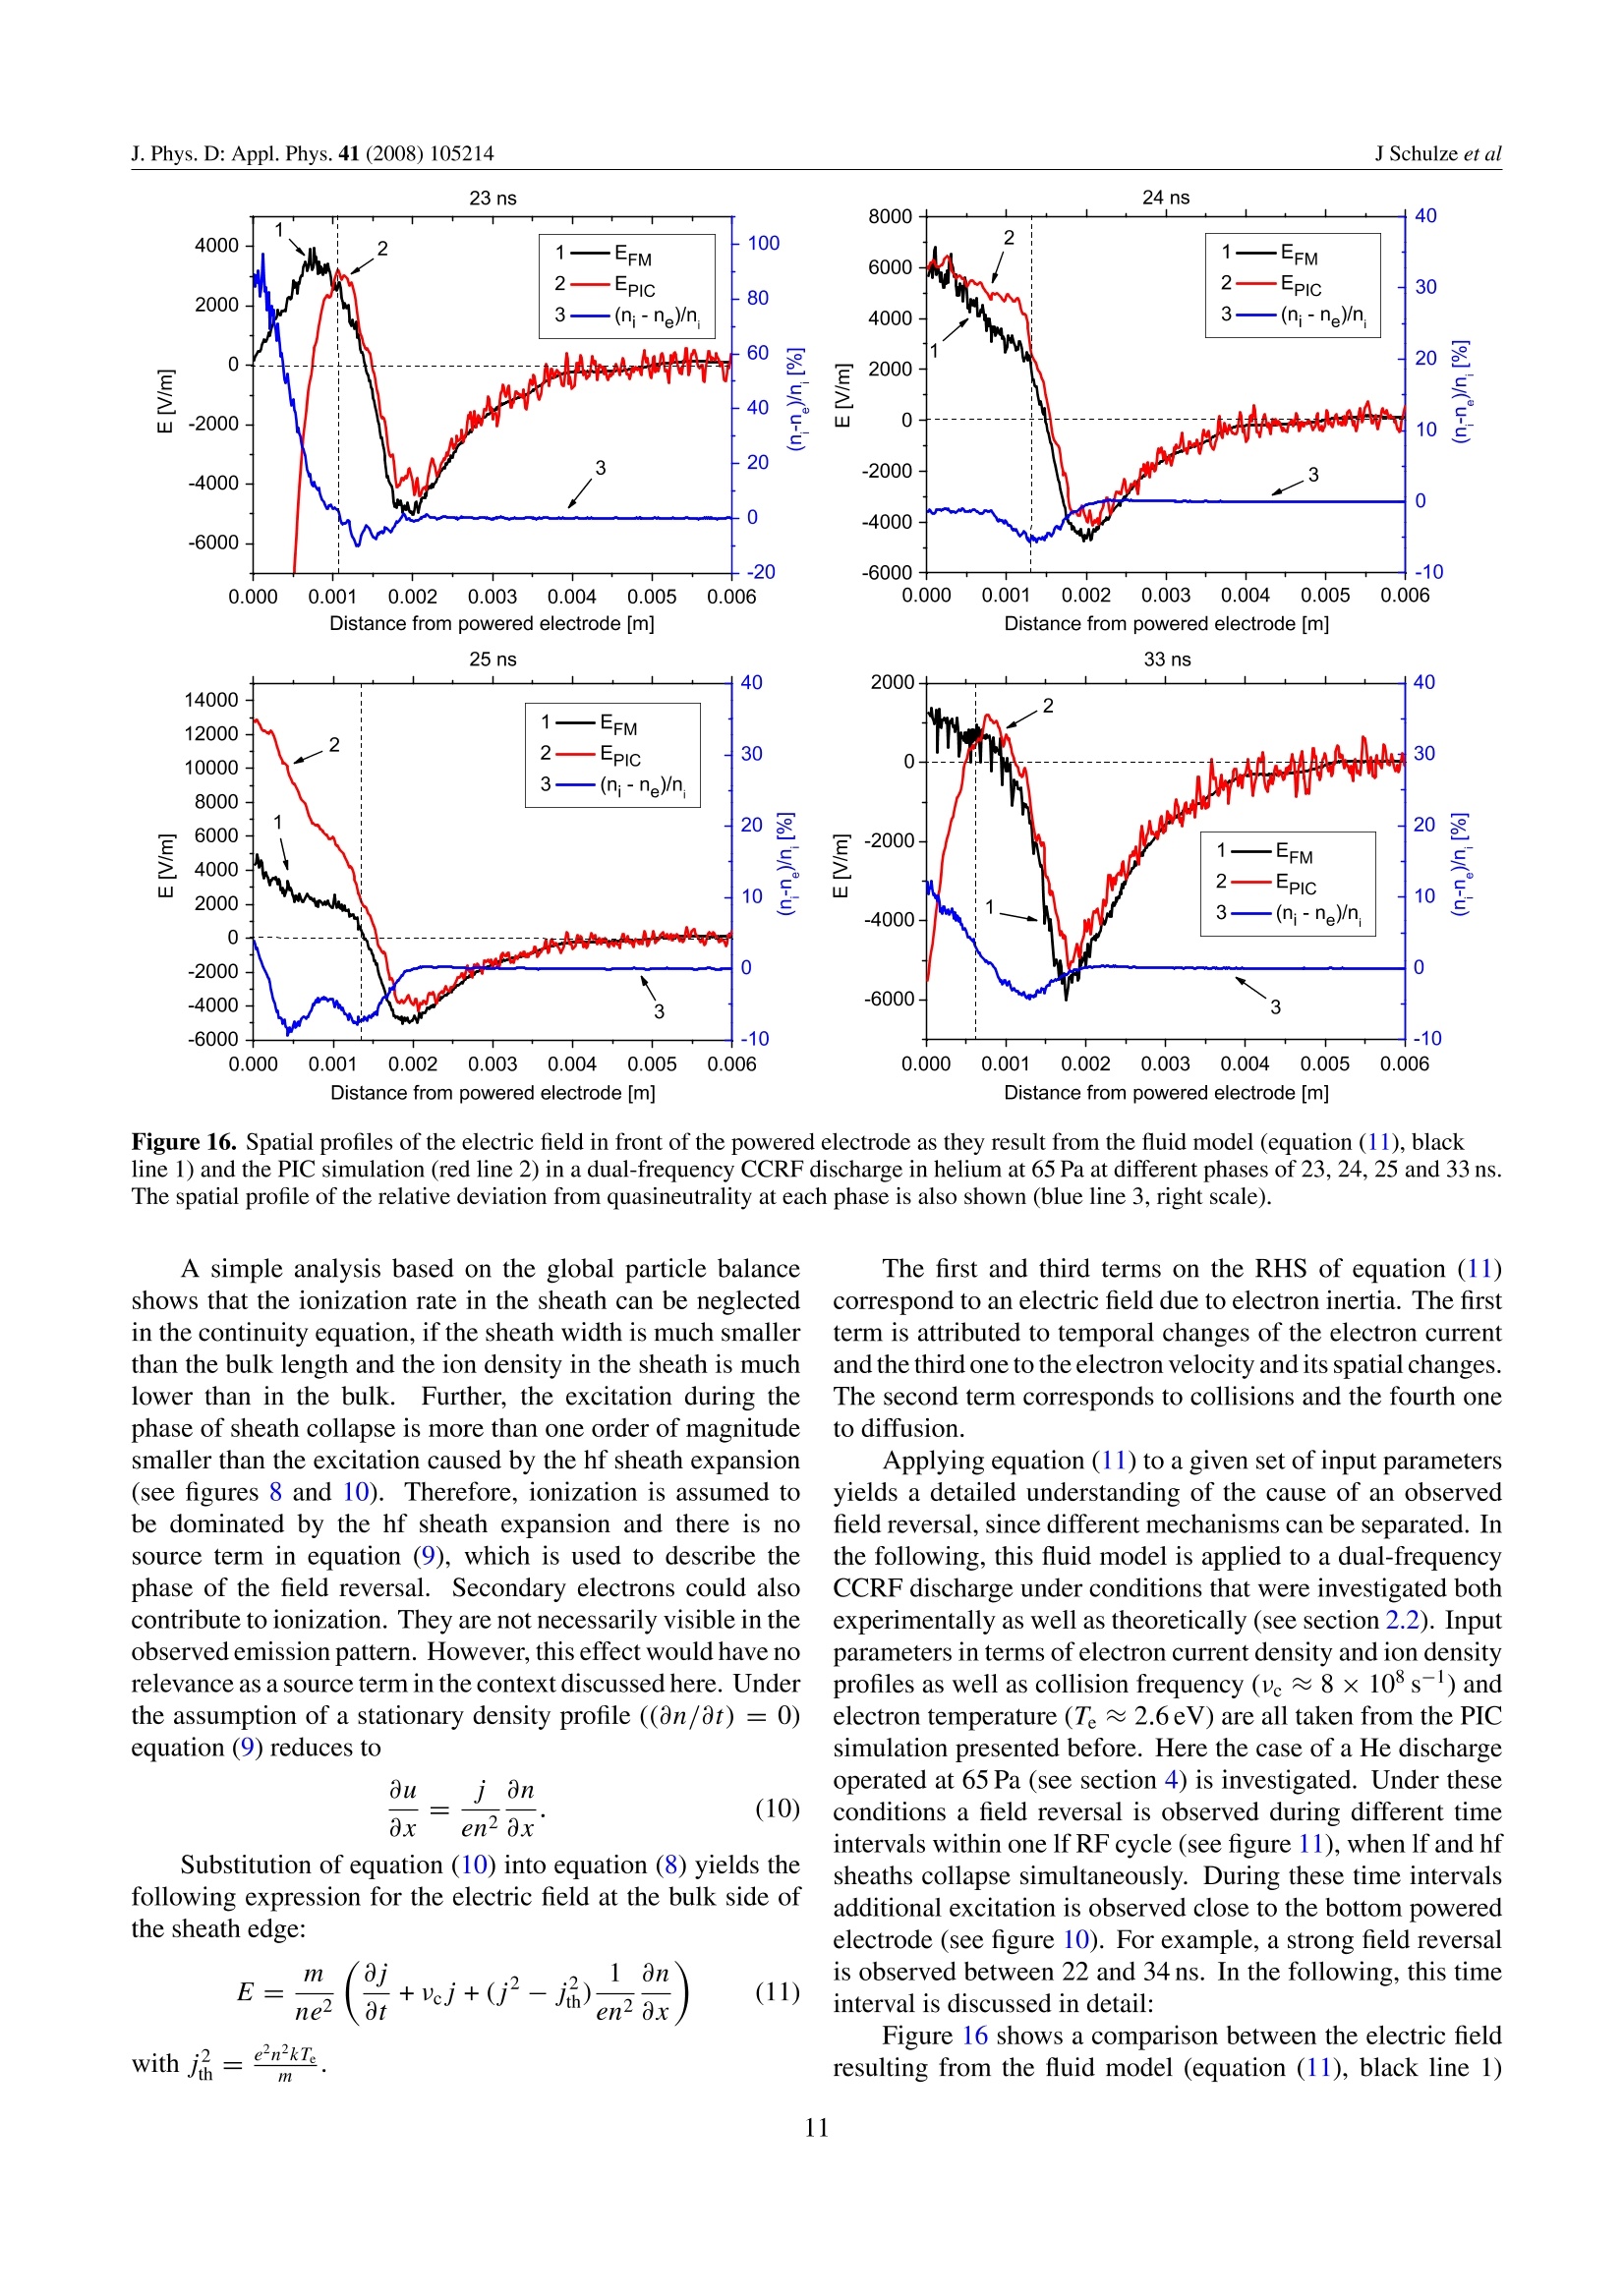
by electron inertia, whereas in the collisional regime it is caused by a combination of the low
mobility of electrons due to collisions and electron inertia. Finally, the field reversal during the
sheath collapse seems to be a general source for energy gain of electrons in both single and
dual-frequency discharges.
方案详情

iopscience.iop.org JOURNAL OF PHYSICS D: APPLIED PHYSICSIOP PUBLISHINGJ.Phys.D: Appl. Phys. 41 (2008)105214 (15pp)doi:10.1088/0022-3727/41/10/105214 Home Search Collections Journals AbouttContact usMy lOPscience Electric field reversals in the sheath region of capacitively coupled radio frequency dischargesat different pressures This article has been downloaded from IOPscience. Please scroll down to see the full text article.2008 J. Phys. D: Appl. Phys. 41 105214(http://iopscience.iop.org/0022-3727/41/10/105214) View the table of contents for this issue, or go to the journal homepage for more Download details: |P Address: 148.6.27.70 The article was downloaded on 26/07/2010 at 10:15 Please note that terms and conditions apply. Electric field reversals in the sheath regionof capacitively coupled radio frequencydischarges at different pressures J Schulzel,Z Donko, B G Heil,D Luggenholscher, T Mussenbrock,R P Brinkmannand U Czarnetzkil Institute for Plasma and Atomic Physics,Ruhr-University Bochum, GermanyResearch Institute for Solid State Physics and Optics of the Hungarian Academy of Science, Budapest,Hungary Institute for Theoretical Electrical Engineering, Ruhr-University Bochum, Germany E-mail: fjschulze@hotmail.com Received 25 January 2008, in final form 26 March 2008Published 1 May 2008 Online at stacks.iop.org/JPhysD/41/105214 Abstract Electric field reversals in single and dual-frequency capacitively coupled radio frequencydischarges are investigated in the collisionless (≤1 Pa) and the collisonal (65 Pa) regimes.Phase resolved optical emission spectroscopy is used to measure the excitation of the neutralbackground gas caused by the field reversal during sheath collapse. The collisionless regime isinvestigated experimentally in asymmetric neon and hydrogen single frequency dischargesoperated at 13.56 MHz in a GEC reference cell. The collisional regime is investigatedexperimentally in a symmetric industrial dual-frequency discharge operated at 1.937 and27.118 MHz. The resulting spatio-temporal excitation profiles are compared with the results ofa fluid sheath model in the single frequency case and a particle-in-cell/Monte Carlo simulationin the dual-frequency case. The results show that field reversals occur in both regimes. Ananalytical model gives an insight into the mechanisms causing the reversal of the electric field.In the dual-frequency case a qualitative comparison between the electric fields resulting fromthe PIC simulation and from the analytical model is performed. The field reversal seems to becaused by different mechanisms in the respective regimes. In the collisionless case it is causedby electron inertia, whereas in the collisional regime it is caused by a combination of the lowmobility of electrons due to collisions and electron inertia. Finally, the field reversal during thesheath collapse seems to be a general source for energy gain of electrons in both single anddual-frequency discharges. (Some figures in this article are in colour only in the electronic version) 1. Introduction Single ancldlual-frequency capacitively coupledd radiofrequency (CCRF) discharges are often used for industrialapplications such as etching and deposition processes. Forinstance, these discharges are used as one of many steps inthe production of integrated circuits [1]. In the bulk plasmathe ion temperature is usually close to room temperature,whereas the electron temperature is a few electron voltsAs the ion temperature is low, there is little uncontrolleddamage of the substrate. ]By adjusting the sheath voltage, the etching of microscopic structures by ion bombardmentof the wafer surface can be controlled. In particular, dual-frequency CCRF discharges have become more important forindustrial applications during the recent years. The advantageof these discharges is separate control of ion energy and ionflux impinging on the substrate surface [2-5]. However,recentinvestigations [6-9] have shown that this separate control islimited due to the coupling of both frequencies. Despite thiss enormous relevance for applications,fundamental phenomena such as electron heating and electron.dynamics particularly at low pressures and in dual-frequency CCRF discharges are not yet fully understood and represent animportant current research topic. Within one RF cycle there are different mechanismsleading to an energy gain of electrons as a result of theplasma interacting with its boundary sheath in electropositivedischarges: During the phase of sheath expansion electrons areaccelerated from the sheath into the plasma bulk bythe expanding sheath..In single frequency dischargesthis mechanism has been investigated both theoretically[10-16] and experimentally [17-24] at high and lowpressures in different gases. In dual-frequency CCRFdischarges electron heating by the expanding sheath hasbeen observed experimentally [9] and theoretically [25].However, in the case of dual-frequency CCRF dischargesthe number of investigations is limited and restricted toparticular conditions. e During the phase of maximum applied voltage andfull sheath expansion secondary electrons can contributeconsiderably to ionization and, therefore, to plasmasustainment [1,17,21,26,27]. Secondary electrons areproduced at the electrode surface by ion bombardmentand are accelerated into the plasma bulk by the electricfield in the sheath. The production of secondary electronsstrongly depends on the discharge conditions. Ionizationdue to secondary electrons is most efficient at highpressures, high sheath voltages and electrode materialswith high secondary electron emission coefficients. During the phase of sheath collapse electrons cangain energy by a local reversal of the electric fieldat the sheath edge under certain conditions. If thesheath collapses so fast that electrons cannot followby diffusion, a locally reversed electric field builds upthat accelerates electrons towards the electrode in orderto support a constant current. In single frequencydischarges at low pressures such field reversals wereobserved experimentally in argon by electron beam probemeasurements [28] and theoretically in a PIC simulationof hydrogen discharges [29].The occurrence of thefield reversal is explained by electron inertia effects inboth works. In single frequency discharges at highpressures, field reversals were observed experimentally inhydrogen [18,19,20,22] and theoretically in nitrogen [30],helium [27] and hydrogen [14,19]. At high pressures,the ield reversal is explained by a collisional drag nforce on the electrons, which prevents electrons fromadvancing into the sheath. In electronegative dischargesdouble layers during the phase of sheath collapse wereobserved [17, 31, 32]. These double layers are closelyrelated to the existence of negative ions in the discharge.Such phenomena in electronegative discharges are notdiscussed in this work. A field reversal has been observed neither experimentallynor theoretically yet in dual-frequency CCRF discharges. The focus of this paper is on the energy gain of electronsby local field reversals in single and dual-frequency dischargesin both collisionless and collisional regimes. Applying phase resolved optical emission spectroscopy (PROES), spatio-temporal plots of the excitation into specifically chosen energylevels are obtained. One-dimensional spatial resolution alongthe discharge axis and temporal resolution within the RF periodis achieved.Such plots show an energy gain of electronsduring the sheath collapse. Measurements are performed inasymmetric single frequency hydrogen and neon dischargesat 13.56 MHz at low pressures (≤1Pa) and in a symmetricindustrial dual-frequency discharge operated at 1.937 and27.118 MHz in a He-O2 gas mixture at higher pressure (65 Pa).The results are compared with those derived from a particle-in-cell/Monte Carlo code (PIC/MCC) simulation of a dual-frequency discharge and a fluid sheath model of the singlefrequency discharge. An analytical model, which yields theelectric field during the sheath collapse, is derived to describethe effect in both regimes and in single as well as dualfrequency discharges.This model is applied explicitly tothe dual-frequency case using input parameters from the PICsimulation, which is performed under conditions similar tothe ones investigated experimentally. The resulting electricfields are compared with those resulting from the PIC modequantitatively. Different terms contributing to the field reversalare identified with physical mechanisms using the analyticalmodel. At low pressures, of typically 1 Pa or below, and inasymmetric discharges the current is no longer sinusoidal, butshows strong high frequency oscillations due to the excitationof the plasma series resonance (PSR) often referred to asthe geometric resonance [23, 24,33-35]. This non-sinusoidaRF current is measured in a single frequency dischargesimultaneously to the PROES measurements which show thefield reversal. This non-sinusoidal current is expected to havean effect on the field reversal. The paper is structured in the following way. In section 2the experimental setups of both the single and dual-frequencydischarges are introduced and the applied diagnostics areexplained. In section 3 a short description of the simulationsis given. Section 4 presents the experimental and theoreticalresults. The discussion of the results and the analytical modelto describe the field reversal in both regimes are presented insection 5. Finally, conclusions are drawn in section 6. 2. Experimental setup 2.1. Single frequency CCRF discharge In the case of the collisionless regime, measurements areperformed in a modified hybrid GEC reference cell [36]. Thesetup can principally be operated as a combination of ICP andCCP discharge (see figure 1). The metal cylinder surroundingthe ICP antenna and the dielectric window are replaced bya monolithic quartz housing.Here the inductive couplingis not used.The RF voltage is applied only to the lowerelectrode and the whole chamber wall acts as the groundedelectrode. Therefore, the discharge is strongly asymmetricand almost the entire voltage is dropped across the sheath atthe powered electrode. The electrode and chamber walls aremade of stainless steel. The electrode radius and gap betweenelectrode and quartz are both 5 cm. RF power supply Figure 1. GEC reference cell and ICCD camera used for PROES inthe case of an asymmetric single frequency CCRF dischargeoperated at 13.56MHz. PROES measurements are performed in molecular gasdischarges, H2, as well as rare gas discharges, neon, at lowpowers of 8 W and at pressures of 1 Pa or below. In the case ofH2 the plasma induced emission at Balmer-a, excitation energy12.1 eV [37], is detected spatially and temporally resolved byan Andor iStar ICCD camera. In the case of neon emissionfrom the Ne 2pi state, excitation energy 19 eV, is observed. Thecamera is synchronized with the RF-generator via a frequencydivider and operated at the maximum repetition rate of thecamera, 30KHz.The lifetimes of the upper level of theH-Balmer-o line, 10 ns, and the Ne 2p1 state, 14.5 ns [37], areshort enough to resolve electron dynamics within one RF cycleat 13.56 MHz (TRF= 74 ns). Figure 2 shows the principle ofphase resolved measurements..The internal delay generatorof the ICCD camera sets a certain delay between the triggerand the camera gate. Here the minimum camera gate widthof 4.2 ns is used. Signal is acquired at a specific phase duringseveral thousand RF cycles. Then the delay is increased anda different phase is scanned. Here a step width of 2.1 ns ischosen. 38 steps are performed, and a bit more than one RFcycle is scanned.lTypical exposure times are 10s for eachstep. All images are binned in the horizontal direction inorder to reduce the noise resulting in one-dimensional spatialresolution along the discharge axis. We estimate the verticalspatial resolution to be 0.5 mm. Neglecting cascade contributions and excitation out ofmetastable states, the excitation Ei(t) can be determined fromthe measured emission [211: Here Aik is the transition probability of the observedemission, no is the ground state density, nph,i (t) is the measurednumber of photons per unit volume and time and A;=(1/t)is the decay rate that is given by the inverse of the lifetime t. The RF voltage is measured simultaneously to the PROESmeasurements at the output of the matching box directly infront of the powered electrode using a LeCroy high voltageprobe. The current to the chamber wall is also measuredsimultaneously by a Plasmetrex current sensor, which isintegrated into the side wall of the GEC cell (figure 3). Figure 2. Principle of PROES measurements in a single frequencyCCRF discharge. Figure 3. Sketch of the experimental setup including the diagnosticused for the measurements of the RF current waveform (currentsensor) [35]. This sensor locally picks up a fraction of the RF current.This diagnostic—known as self-excited electron resonancespectroscopy (SEERS) [38,39]—is used as a non-invasiveprocess monitoring technique in the semiconductor industry. 2.2.Dual-frequency CCRF discharge In the collisional regime PROES measurements are performedin a Lam Exelan process chamber, which is described indetail elsewhere [9]. It is a modified industrial dual-frequencyCCRF discharge with plane parallel electrodes separated bya gap of 12 mm, see figure 4. Two RF voltages are appliedsimultaneously to the bottom electrode, whereas the topelectrode is grounded. The electrodes are made of siliconwith a radius of 110 mm. The plasma is confined in the radiadirection by adjustable quartz rings, which shield it from thechamber walls. Thus, the discharge is almost symmetric. For these experiments, the discharge is operated at Phf =800 W and Pf =200Wat p=65Pa. The RF signals arefixed in frequency at 1.937 and 27.118 MHz with a commonphase reference (fhf =14fir). Measurements are performedin a 72% He-19% O2 discharge with a 9% admixture of neonused as reference gas for PROES. Figure 4. Experimental setup used for PROES measurements in adual-frequency CCRF discharge. The plasma emission is focused on the entrance slit of aCarl Zeiss PGS 2 spectrometer (300-900 nm) by a lens. Inthe spectrograph the light is dispersed and then detected by afast gateable ICCD camera (PicoStar HR, LaVision), whichis triggered by and synchronized with the low frequency RFsignal. The temporal gate width used for phase resolvedmeasurements in the dual-frequency case is 4.1 ns.3.Thisgate width yields a temporal resolution well within the highfrequency RF cycle. 3. Simulations 3.1. Fluid sheath model for the single frequency case In order to calculate the electric fields in single frequencyCCRF discharges, a fluid sheath model is used [40,41]. Space-and time-resolved electric fields are calculated within one RFcycle in a symmetric argon discharge operated at 13.56 MHzat 10 Pa. This model assumes that the driving RF frequencyis much higher than the ion plasma frequency and much lowerthan the electron plasma frequency. This is equivalent toOassuming that the ions only react to the time averaged electricfield.Further, electromagnetic effects are assumed to benegligible [42] and, thus, the electrostatic approximation isused for calculating the time dependent electric field. The space- and time-resolved electric field E(x,t) iscalculated using the following equation, which is derived by amatched asymptotic expansion about the point s [41], definedby equation (3): where 入p =√(8oTe/e’n;) and n; are the Debye length and iondensity at the point s, respectively. k is the Boltzmann constantTe is the electron temperature, ne is the electron density andni is the ion density. Instead of treating the sheath as having ahardelectron edge or wall, equation (2) approximates arealisticelectron density and calculates a realistic electric field in thesheath. The functions A and A transition the electricfield calculation smoothly from the electron depletion regiondominated by ions to the quasineutral where the field is anambipolar field. Equation (2) is used in conjunction with an equivalentcircuit model to iteratively calculate the time dependentelectricfield in the sheath. An ion model yields the ion density. Tmake this equation solvable the equation is transformed frombeing a function of position and time into being a function ofthe ‘charge coordinate’and the time dependent charge acrossthe sheath. The idea behind this is that the ion density isassumed to be monotonically increasing, and the integral ofthe ion density then replaces the spatial coordinate. When sis transformed into charge coordinates, it is equivalent to thecharge across the sheath, Q(t). The point of this is that s is anunknown quantity, but if the rf current is known then Q(t) canbe determined. The transformed equation is then used with an equivalentcircuit model of the plasma. The equivalent circuit modelsupplies the sheath model with Q(t), and the sheath modelsupplies the equivalent circuit model with the non-linear chargevoltage relationship of the sheath.The two are used in aniterative scheme that calculates the Fourier components of theRFcurrent in the discharge and the time dependentelectric fieldin the sheath. This will be described in more detail in upcomingpublications. This model has been tested successfully againstspace- and time-resolved measurements of the electric field irthe sheath of an asymmetric CCRF discharge [23,24]. The resulting ambipolar field during the phase of sheathcollapse is compared with the electric field in a dual-frequencydischarge at similar phases resulting from a PIC/Monte Carlosimulation, see below, and to an analytical model. 3.2. Simulation model for the dual-frequency case The dual-frequency discharges studied here are describedby a one-dimensional (1d3v) bounded plasma particle-in-cellmodel, complemented with Monte Carlo treatment of collisionprocesses (PIC/MCC). The electrodes are assumed to beinfinite, planar and parallel. As in the experiments the diameterof the electrodes was much larger than the electrode separation(D/L 18), and as successful efforts have been made toimprove the symmetry of the discharge, the 1D simulation isexpectedto capture all basic physical phenomena ofinterest. Inour implementation of the PIC simulation, one of the electrodesis driven by a voltage while the other electrode is grounded [43]. The two excitationvoltages are locked in phase, as was done in the experiments. The simulations are carried out both for helium andargon gases. The collision processes considered for electronsare elastic scattering, excitation of background gas atomsto several energy levels, as well as ionization. The crosssections for these processes have been taken from [44] and[45],respectively, for He and Ar. For the positive ions-followingthe recommendation by Phelps—elastic collisions with the gasatoms have been divided into an isotropic and a backwardpart [46]. The cross sections for these collisions have beentaken from [46,47]. The number of superparticles in the simulations istypically 10, which iss expected to provide acceptableaccuracy, although in the case of argon slight dependence ofthe results on the number of superparticles has been observedeven in this range [48]. Our studies show that simulations of Hedischarges (He shows no Ramsauer effect) are less susceptibleto this problem. In contrast to most studies, in our case the electrodesreflect the electrons arriving at their surface with a pre-definedprobability, usually taken to be 0.2. Additionally, we considerthe emission of secondary electrons from the electrodes. Theirimportant role in dual-frequency discharges has recently beenstudied by Turner [49]. Typical secondary yields used in thiswork range between 0.1 and 0.45, which are reasonable for Sielectrodes [50]. The simulations provide the spatio-temporal distributionsof several discharge characteristics. The distribution of theelectron impact excitation is in direct correspondence withthe light intensity distributions observed by PROES. Otherquantities, such as space- and time-resolved electric field,particle velocities, and currents, aid the interpretation of theexperimental data and the understanding of the dischargephysics. 4. Results In the following section, we present experimental as wellas theoretical results for single and dual-frequency CCRFdischarges: first, experimentally obtained spatio-temporalplots of the excitation into specifically chosen energy statesin single and dual-frequency discharges are shown. Further,spatio-temporal plots of the electric field in the dual-frequencydischarge resulting from the PIC simulation under conditionssimilar to the experiment are presented. Finally, the space-and time-resolved electric field resulting from a fluid sheathmodel in the single frequency case is shown. A more detailedanalysis of these results is performed in section 5. Figure 5. (Top graph) Phase and space resolved excitation into Ne2pi in a single frequency neon discharge operated at 30 Pa, 8 W and13.56 MHz. (Bottom graph) Sketch of the RF potential at thepowered electrode. edge is defined as the position where the excitation starts toincrease significantly, 0.8 cm in figure 5 at 15 ns. Figure 6 shows spatio-temporal plots of the excitation intcNe 2pi at lower pressures of 1 Pa (left graph) and 0.5 Pa (rightgraph) within one RF cycle. At the beginning ofthe RF period,the generation of a beam of highly energetic electrons by theexpanding sheath is clearly observed in both cases [23]. Insuch spatio-temporal plots of the excitation an electron beamappears as a tilted trajectory and is indicated in the figuresby arrows. At these low pressures the sheath width is muchbigger (2.5 cm at 40 ns) and the RF current is not sinusoidal[24,33,34]. Consequently, the sheath expansion velocity ismuch higher. This enhances the generation of an electronbeam, which propagates through the entire bulk until it hits theopposing quartz cylinder. The quartz acts as a floating surfacein the plasma and charges up negatively.As a consequenceof this a sheath builds up in front of the quartz, which reflectsbeam electrons which arrive at the quartz at a later time, backinto the bulk. The trajectory of the reflected beam is clearlyvisible at 0.5 Pa. Under the conditions investigated here theplasma is heated effectively, since the beam is reflected andits energy is deposited in the plasma to a great extent.the opposing surface was grounded instead of floating, thebeam would still be reflected, since the floating potential wouldbe the same. In both cases (grounded or floating surface)electron and ion fluxes must balance at the surface withinone RF period. The only difference between a grounded andfloating surface is that the particle fluxes must balance locallyin the case of a floating surface and globally in the case of agrounded surface. However, this difference only plays a role inmagnetized plasmas, where it can lead to strong electric fieldsin the plasma. In contrast to higher pressures, at 1Pa and 0.5 Pa anadditional source of excitation is observed during the sheathcollapse. Similar to the trajectory of the electron beam Exc. rate [a.u.] 54 47 41 35 31 27 23 Figure 6. Phase and space resolved excitation into Ne 2pi in a single frequency neon discharge operated at 1 Pa (left graph) and 0.5 Pa (rightgraph). In both cases the discharge is operated at 8 W and 13.56 MHz. t [ns] Figure 7. Phase and space resolved excitation into the n =3 state of atomic hydrogen (Balmer-a emission) in a single frequency Hdischarge operated at 10 Pa (left graph) and 0.5 Pa (right graph). In both cases the discharge is operated at 8 W and 13.56MHz. generated by the expanding sheath, the excitation structureduring the sheath collapse is also tilted.However, it istilted in the opposite direction, indicating an acceleration ofelectrons towards the electrode. Sato and Lieberman measureda reversed electric field at the sheath edge during the phase ofsheath collapse at similar pressure (0.3 Pa) in argon [28]. In thiswork this double layer disappeared with increasing pressure.According to their results we assume the observed excitationduring the phase of sheath collapse to be caused by a local fieldreversal at the sheath edge. Similar to their investigations, theeffect vanishes with increasing pressure. A detailed discussionof the cause of this field reversal is presented in section 5. Figure 7 shows spatio-temporal plots of the excitation intothe n=3 state of atomic hydrogen (Balmer-a emission) in asingle frequency H2 discharge operated at 8 W and 13.56MHzat different pressures of 10 Pa and 0.5 Pa.At 10 Pa an excitationmaximum close to the electrode during the phase of sheathcollapse is observed. At 0.5 Pa two excitation maxima duringthe phase of retreating sheath are observed, one close to theelectrode and one further inside the plasma at an earlier phase. The spatio-temporal evolution of the electric field andthe excitation into the n = 3 state of atomic hydrogen(Balmer-a emission) in the sheath of a H2 CCRF dischargeat 80 Pa were measured before [20]. In this work an excitation maximum close to the electrode during the phase of sheathcollapse was observed, which could directly be identified witha field reversal. However, these measurements were performedat much higher pressures, where the regime is collisional,whereas it can be assumed to be collisionless at 0.5 Pa. Vender and Boswell explicitly predicted two different fieldreversal mechanisms, which lead to an increased electron lossto ensure current continuity. According to their simulation[29], a field reversal at the electrode surface occurs if the wallpotential rises and the plasma potential lags behind. Theyalso mention a second mechanism leading to a field reversalclose to the sheath edge during sheath collapse: if the sheathcollapses so fast that electrons cannot follow and compensatethe ion space charge, the changing wall potential drives a fieldreversal within the ion sheath. Obviously, both mechanismsare observed experimentally here (figure 7). The left plot in figure 8 shows a spatio-temporal plotof the experimentally determined excitation into Ne 2piin a symmetric, industrial, dual-frequency CCRF discharge(Lam Exelan) operated at 65 Pa in He-一2 with small neonadmixture [9].The exact conditions are mentioned insection 2.2. The spatio-temporal excitation profile is complexand depends on the coupling of both frequencies as described1n[9]. The relative phase of the RF potential at the 1.2 Figure 8. (Left) Experimentally determined phase and space resolved electron impact excitation function into Ne 2pi in the Exelan at 65 Paand sketch of the RF potential at the powered bottom electrode. (Right) Phase and space resolved excitation as it results from a PICsimulation (He, 65 Pa). bottom electrode is also shown qualitatively. Each excitationmaximum corresponds to the trajectory of an electron beamgenerated by the expanding sheath. In order to investigate field reversals in dual-frequencyCCRF discharges a PIC simulation is performed, which yieldsaccess to a variety of plasma parameters with high spatialand temporal resolution. For simplicity, helium has beenchosen as a model gas, since it is the main constituent of theexperimentally used gas mixture. The applied frequenciesand discharge geometry are identical to the experimentalconditions. The applied low and high frequency voltages areVir = 800 V and Vhf =550 V, respectively. A gas pressure of65 Pa (same as in the experiment), a gas temperature of 400 K,a secondary electron emission coefficient of y = 0.45 [50]and an electron reflection coefficient of = 0.2 are used asinput parameters. The right plot in figure 8 shows the totalspatio-temporal excitation as it results from the PIC simulation.Good agreement between experiment and simulation is foundsupporting the validity of the simulation. Figure 9 shows the spatio-temporal excitation as it resultsfrom the simulation during fractions of the first and secondhalf of one low frequency RF period, respectively (zoominto figure 8). Obviously, the excitation maxima are tilted.They are tilted to the right during the first half of one lf RFperiod and to the left during the second half. Similar tilts areobserved experimentally and are discussed in more detail ina forthcoming publication. In analogy to the results of PICsimulations in single frequency CCRF discharges performedby Vender [15] and Wood [16] and experimental investigationsusing PROES [23, 24], we identify these tilted excitationmaxima with paths of beams of highly energetic directedelectrons.Obviously, electron beams are generated at thebottom electrode during the first half and at the top electrodeduring the second half. From the tilt of the arrows in figure 9the propagation velocity of these beams can be estimated to beabout2x10°ms-1. Figure 10 shows sections of figure 8 directly in front ofthe powered bottom electrode during the first half of one low Figure 10. (Left) Experimentally determined excitation into Ne 2pi at a distance of 0.4 mm in front of the bottom powered electrode duringthe first half of one low frequency RF cycle. The circles indicate excitation caused by a localized field reversal [51]. (Right) Spatio-temporalexcitation at two different positions close to the powered electrode as it results from the PIC simulation. t [ns] Figure 11. (Left) Phase and space resolved electric field in a dual-frequency helium discharge operated at 65 Pa as it results from a PICsimulation. The electric field is given in units of kVm-. (Right)Zoom into the left graph within the area indicated by the white rectangle. frequency RF cycle under the same conditions as before [51]The left plot in figure 10 shows the experimentally determinedexcitation 0.4 mm in front of the bottom electrode. The mainmaxima correspond to the beam trajectories shown in figures 8and 9. However, in this profile more detailed structures areobserved. Between two major excitation maxima, which occurat the phases of high frequency sheath expansion, additionalmaxima are detected. These weaker maxima occur at distinctphases of high frequency sheath collapse. The PIC simulationyields similar results. The right plot in figure 10 shows theexcitation as it results from the simulation at two positions infront of the bottom electrode. At 0.4 mm only the maximacaused by the field reversal are observed. At 1.5 mm onlythe maxima caused by the hf sheath expansion are visible.Similarly to the experimental results, the maxima observed at0.4 and 1.5 mm are phase shifted. In the experiment, the spatialresolution is only about 1 mm. Therefore, both mechanismsare observed at the same position in the experiment and arespatially resolved only in the simulation. Compared with the collisionless single frequency casediscussed earlier, excitation at the phase of collapsing sheath isalso observed in a dual-frequency discharge in the collisionalregime...Due to this analogy the excitation might also be caused by a local field reversal. Based on previous resultsin a single frequency discharge in a collisional regime [20],this field reversal might be caused by a collisional drag forceon the electrons that prevents electrons from advancing intothe sheath.1.However, electron inertia effects might alsocontribute [28]. . The left plot in figure 11 shows the result of the PICsimulation in terms of a spatio-temporal plot of the electricfield under the conditions mentioned above. One can observethe modulation of the sheath electric field with both the highand low frequency. The colour scale is chosen such that browncorresponds to a reversed field at the bottom electrode and darkgreen to a reversed field at the top electrode (colour online).Except for the phases of field reversal the electric field at thebottom electrode is negative and the electric field at the topelectrode is positive. The right plot in figure 11 shows the indicated area of theleft plot enlarged. It shows a spatio-temporal plot of the electricfield close to the bottom powered electrode during the first halfof one low frequency RF cycle under the same conditions. Atphases of collapsing high and low frequency sheath there is alocal reversal of the electric field at the sheath edge. A reversedfield is indicated by the white colour and is clearly observable in Figure 12. Electric field in dependence on the distance from thebottom powered electrode in a dual-frequency helium dischargeoperated at 65 Pa at a specific phase of 25 ns (red horizontal line infigure 11) as it results from a PIC simulation. Figure 13. Spatio-temporal plot of the electron heating in adual-frequency helium discharge operated at 65 Pa as it results froma PIC simulation. Phases when a local field reversal is observed areindicated by circles. this plot. At the same phases additional excitation is observed(figure 10). Therefore, this excitation seems to be caused bya local field reversal. The same effect is observed at the topelectrode during the second half of one low frequency (lf) RFcycle, since the discharge is symmetric. Figure 12 shows a spatial profile of the electric fieldunder these conditions at the specific phase of t = 25 ns(red horizontal line in the right plot of figure 11). Atthis phase the low and high frequency (hf) sheaths collapsesimultaneously. Close to the bottom electrode, the field ispositive (field reversal), and close to the sheath edge it showsa minimum (negative field). Towards the bulk it approacheszero. The maximum observed value of the reversed field isabout 13kVm-. Figure 13 shows a spatio-temporal plot of the electronheating in the Exelan as it results from a PIC simulation underthe same conditions as before. Here the electron heating isdefined as dissipated power: where j is the current density and E the electric field. Redcorresponds to heating and blue to cooling (negative heating,colour online). Heating is generally observed at phases of hfsheath expansion, when beams of highly energetic electrons aregenerated by the expanding sheath. However, positive heatingis also observed at phases when hf and lf sheaths collapsesimultaneously and a reversed field is observed (circles infigure 13). The deposited power at these phases leads to theexperimentally observed excitation at phases of field reversal(see figure 10). The observed positive heating in the sheath atphases of full lf sheath expansion is assumed to be caused bysecondary electrons. Such a field reversal is observed not only in helium dual-frequency discharges but also under different conditions inother gases. Figure 14 shows the space and time-resolvedelectric field close to the bottom electrode during the first halfof one lf RF cycle in a dual-frequency argon discharge at 13 Paas it results from a PIC simulation. The applied frequenciesand geometry are the same as before. The applied voltagesare Vr = 1000V and Vhf =500V. A gas temperature of500 K, a secondary electron emission coefficient of y= 0.25and an electron reflection coefficient of a = 0.2 are used asinput parameters. The white areas in figure 14 correspond toreversed fields again. Figure 14 also shows a spatial profile of the electric fieldat t = 27 ns in argon. Again a reversed field at the bottomelectrode is observed. The electric field shows a minimum(negative field) close to the sheath edge and approaches zerotowards the bulk. The local minimum of the electric field at thesheath edge corresponds to an ambipolar field. As discussedin detail in the following section, the heavy ions cannot followthe collapsing sheath as fast as the electrons. Consequently, anambipolar field builds up to couple electron and ion motion. A similar local extremum of the electric field at theposition of the maximum sheath width during the phase ofsheath collapse is observed in the simulation of a singlefrequency CCRF discharge modelled by a fluid sheath model[40,41]. Figure 15 shows three spatially resolved electric fieldprofiles close to the powered electrode in a symmetric singlefrequency argon discharge operated at 13.56 MHz and 10 Pa.The time averaged field (solid black line) and the field at thephase of maximum sheath expansion (dotted blue line) as wellas at the phase of minimum sheath expansion (dashed red lineare shown. The simulation was performed in a cylindricaldischarge with equal electrode areas of 500 cm’ and an interelectrode spacing of 6cm. An electron temperature of 2.5 eV,a gas temperature of 350 K and a RMS voltage of 190V wereused as input parameters. Absolute values of the electric fieldare plotted in figure 15 on a logarithmic scale in order toemphasize the local extremum during sheath collapse. Allfields are negative under these conditions. No reversed fieldis observed. However, similarly to the dual-frequency case alocal extremum at the maximum sheath width during the sheathcollapse, an ambipolar field, is observed. A field reversal dueto electron inertia cannot be observed applying this model,since electron inertia is neglected. Figure 14. (Left) Spatio-temporal plot of the electric field close to the bottom powered electrode in a dual-frequency argon dischargeoperated at 13 Pa during the first half of one low frequency RF cycle (PIC simulation). The electric field is given in units of kVm-.(Right)Electric field in dependence on the distance from the bottom powered electrode at 13 Pa at a specific phase of 27 ns (red dashed line in leftgraph). Figure 15. Absolute values of spatially resolved electric fields closeto the powered electrode in a single frequency CCRF discharge inargon at 10 Pa calculated using a fluid sheath model [40,41]. Thetime averaged field (solid black line) and the field at the phase ofmaximum sheath expansion (dotted blue line) as well as at the phaseof minimum sheath expansion (dashed red line) are shown. 5. Discussion Local reversals of the electric field during sheath collapseare observed in single as well as dual-frequency CCRFdischarges. In asymmetric, single frequency discharges,additional excitation during the phase of sheath collapse isobserved at low pressures (≤Pa) in molecular as well asrare gas discharges. The tilt of the observed maximum in thespatio-temporal plots of the excitation indicates an electric fieldthat accelerates electrons towards the electrode at this phase.In a symmetric dual-frequency discharge, a field reversal isobserved both experimentally and theoretically at relativelyhigh pressures of 65 Pa.EBased on earlier investigations[14,19,20,22, 28-30] these field reversals can be caused bydifferent mechanisms depending upon the pressure. At lowpressure it is caused by electron inertia and at high pressuresby electron collisions with the background gas and electroninertia. However, in both cases the effect is the same. Electrons cannot follow the fast collapsing sheath1.. Consequently, areversed electric field builds up that accelerates electronstowards the electrode in order to support a constant current. In this paragraph, a simple fluid model is developed,which describes the field reversal in the different regimesqualitatively. This model is limited to those regions wherethe condition of quasineutrality is fulfilled and the currentdominated by electron conduction current. Displacementcurrent is not included in the model. It does not describe howthe sheath is filled with electrons. The momentum balance equation for electrons in adischarge without magnetic fields is given by where m is the electron mass,n =ne = ni the plasma density,u the electron velocity, e the elementary charge, E the electricfield, p the pressure and ve the collision frequency for elasticcollisions of electrons with the neutral background gas. As only the electron motion perpendicular to the electrode(defined as thex direction) is relevant here and only gradientsin this direction occur, equation (6) reduces to with Vp= kT Vn. Here u and E are the x-components ofu and E, respectively, k the Boltzmann constant and Te theelectron temperature. Substituting the current density j =--enuintoequation (7) assuming a stationary ion density profile oneobtains The continuity equation is given by Figure 16. Spatial profiles of the electric field in front of the powered electrode as they result from the fluid model (equation (11), blackline 1) and the PIC simulation (red line 2) in a dual-frequency CCRF discharge in helium at 65 Pa at different phases of 23, 24, 25 and 33 ns.The spatial profile of the relative deviation from quasineutrality at each phase is also shown (blue line 3, right scale). A simple analysis based on the global particle balanceshows that the ionization rate in the sheath can be neglectedin the continuity equation, if the sheath width is much smallerthan the bulk length and the ion density in the sheath is muchlower than in the bulk.Further, the excitation during thephase of sheath collapse is more than one order of magnitudesmaller than the excitation caused by the hf sheath expansion(see figures 8 and 10). Therefore, ionization is assumed tobe dominated by the hf sheath expansion and there is nosource term in equation (9), which is used to describe thephase of the field reversal. Secondary electrons could alsocontribute to ionization. They are not necessarily visible in theobserved emission pattern. However, this effect would have norelevance as a source term in the context discussed here. Underthe assumption of a stationary density profile ((0n/ot)=0)equation (9) reduces to Substitution of equation (10) into equation (8) yields thefollowing expression for the electric field at the bulk side ofthe sheath edge: The first and third terms on the RHS of equation (11)correspond to an electric field due to electron inertia. The firstterm is attributed to temporal changes of the electron currentand the third one to the electron velocity and its spatial changes.The second term corresponds to collisions and the fourth oneto diffusion. Applying equation (11) to a given set of input parametersyields a detailed understanding of the cause of an observedfield reversal, since different mechanisms can be separated. Inthe following, this fluid model is applied to a dual-frequencyCCRF discharge under conditions that were investigated bothexperimentally as well as theoretically (see section 2.2). Inputparameters in terms of electron current density and ion densityprofiles as well as collision frequency (vc≈8×10’s-l) andelectron temperature (Te~2.6eV) are all taken from the PICsimulation presented before. Here the case of a He dischargeoperated at 65 Pa (see section 4) is investigated. Under theseconditions a field reversal is observed during different timeintervals within one lf RF cycle (see figure 11), when lf and hfsheaths collapse simultaneously. During these time intervalsadditional excitation is observed close to the bottom poweredelectrode (see figure 10). For example, a strong field reversalis observed between 22 and 34 ns. In the following, this timeinterval is discussed in detail: Figure 16 shows a comparison between the electric fieldresulting from the fluid model (equation (11), black line 1) Figure 17. Spatial profiles of the different terms of equation (11), which contribute to the electric field in front of the powered electrode at24 ns. Inertia term I corresponds to the first term in equation (11), collision term to the second, inertia term II to the third and diffusion termto the fourth. using input parameters from the PIC simulation and the electricfield directly resulting from the PIC simulation (red line 2).It shows spatial profiles of the electric field at different phaseswithin one hf period (23, 24,25,33ns). Good agreementbetween the fluid model and PIC simulation is found as longas the condition of quasineutrality is fulfilled (blue line 3)At 23 ns the sheath is retreating; however, it is not yet fullycollapsed. In the sheath, where quasineutrality is violated, thefluid model is not applicable. As the sheath collapses electronsare transported from the bulk towards the electrode in orderto fill up the ion matrix. Since the ion density close to theelectrode is lower than in the bulk a higher electric field isneeded in the sheath region compared with the bulk region inorder to keep a constant current. This field is generated by alocal negative charge excess at the sheath edge, which is clearlyvisible in figure 16 (23 ns). Figure 16 (24ns) shows a comparison between electricfield profiles obtained from the fluid model (black line 1) andthe simulation (red line 2) one nanosecond later. Now thesheath is fully collapsed and the condition of quasineutralityis fulfilled almost everywhere. Only at the sheath edge anexcess of negative charges is observed again. High values ofthe reversed field (6kV m-l) are observed and well reproducedby the fluid model. Figure 17 shows the respective contributions of theindividual terms of equation (11) to the total electric field at this phase. The black line 1 in figure 16 (24 ns) is the sumof these four terms. The origin of the negative field betweenthe bulk and the sheath edge is clearly electron diffusion. Aselectrons are much lighter than the He ions, they can follow thecollapsing sheath faster by diffusion. The ions cannot followand the electrons move away from them. This leads to anambipolar field between the negative charge excess close tcthe sheath edge and the positive charge excess in the bulk. Theamplitude of this ambipolar field is determined by the decaylength of the ion density (1/ni)(0ni/0x). The reversed field at24 ns is caused by both electron inertia and electron collisionswith the neutral background gas to similar extents. At the. other phases discussed here the relative contributions of theindividual terms to the electric field are similar. Obviously,the discharge is operated in a transition regime between theinertially and collisionally dominated regime. Under theseconditions both mechanisms contribute equally to the fieldreversal. At much lower pressures, such as the single frequencycase investigated here, the field reversal can only be causedby electron inertia. At much higher pressures collisions areresponsible for a field reversal. One more nanosecond later, at 25 ns, the reversed electricfield is even stronger (figure 16 (25ns)). At this phase aninteresting phenomenon is observed: As shown in figure 16(25ns) quasineutrality is violated in the vicinity of the electrodeand the fluid model is no longer applicable. However. Figure 18. Electric field in dependence on the distance from the1,,14bottom powered electrode in a dual-frequency argon dischargeoperated at 65 Pa at a specific phase of 27 ns as it results from thecalculation of an ambipolar field (black line 1) and PIC simulation(red line 2). The relative deviation from quasineutrality is alsoshown. there is no conventional sheath consisting of an excess ofpositive charges.At this phase the electrode charges uppositively due to ion bombardment and to compensate theion current.Consequently, a sheath filled with electronsis observed at this phase. A similar phenomenon wasobserved by Vender theoretically in a single frequencydischarge [29]. At the end of the time interval, when a field reversal isobserved, the (ion) sheath expands again. The correspondingelectric field profiles at a phase of 33 ns are shown in figure 16(33 ns). Shortly after this phase, a beam of energetic electronsis generated by the expanding sheath that penetrates into theplasma bulk [9]. In argon, the field reversal is much less pronounced.However, an ambipolar field that couples electron and ionmotion is also observed. Figure 18 shows the spatial profileof the electric field in argon close to the powered bottomelectrode during the phase of sheath collapse at 27 ns as itresults from a PIC simulation (red line 2). In this case thedischarge is operated at 65 Pa. The applied frequencies andgeometry are the same as before. The applied voltages areVir = 500 V and Vhf = 220V. A gas temperature of 600 K,a secondary electron emission coefficient of y = 0.1 andan electron reflection coefficient of a =0 are used as inputparameters. In order to verify the hypothesis that the extremumpresent in figure 18 is caused by an ambipolar field the field iscalculated based on the assumption of an ambipolar field usingthe ion density profile and electron temperature (Te=1.4 eV)resulting from the PIC simulation as input parameters. Theambipolar field Eamb is given by [1] Here ni is the ion density taken from the PIC simulation,D: anddDe the ion and electron diffusion coefficientsand pi and ue the ion and electron mobilities. Theelectron diffusion coefficient and mobility are generally Figure 19. Normalized time averaged electron distribution functionin the centre of the discharge as it results from the PIC simulation(argon,65 Pa) given by [1] Here Vm(u) is the effective collision frequency formomentum transfer for electrons and feo the isotropic part ofthe electron distribution function fe. Generally Vm(u) dependson velocity and, therefore, the above integrals must be solvedexplicitly to get De and ue. However, in thecase of Maxwellian distribution functionsDe and ue are related by the Einstein relation [1]: Figure 19 shows the normalized time averaged electrondistribution function in the plasma bulk as it results from thePIC simulation under the conditions discussed here. As a goodapproximation the distribution function is Maxwellian and theEinstein relation is, therefore, used to calculate the ambipolarfield (equation (12)). The result of this calculation is shown in figure 18(black line 1). As the electric field profile obtained fromthe simulation is reproduced well, the local extremum of theelectric field near the sheath edge can be identified with anambipolar field. In a single frequency discharge ambipolarfields during the phase of sheath collapse are also observed(figure 15). Figure 20. Measured current and voltage in a single frequency,neon discharge operated at 1 Pa and 8 W. Figure 20 shows phase resolved measurements of the RFcurrent and voltage in neon under the conditions investigatedexperimentally here. The high frequency oscillations of theRF current at such low pressures are not completely dampeduntil the end of the RF cycle. Due to the PSR effect thespatial oscillation of the sheath within one RF period is non-sinusoidal. It leads to a faster expansion and collapse of thesheath and has, therefore, probably an important influence onthe occurrence of a field reversal. Furthermore, in asymmetric discharges such as the singlefrequency discharge investigated here there is a dc bias, whichis nearly equal to the RF amplitude of the voltage, if thedischarge is strongly asymmetric. This de bias affects thefield reversal at the powered electrode,since it leads to biggersheath widths at the driven electrode. Consequently, the sheathcollapses faster in asymmetric than in symmetric dischargesat a given RF voltage amplitude and plasma density. Withincreasing velocity of the collapsing sheath the reversed fieldneeded to keep a constant current also increases. If there is adc bias the ion density at the powered electrode will decrease.Consequently, the electron density at the powered electrode atthe phase of sheath collapse will also be lower. Therefore, agiven ion flux to the electrode is compensated less effectively,if there is a dc bias, and a higher reversed field is needed toensure this compensation. In the case of the dual-frequencydischarge investigated here there is almost no dc bias, sinceto a good approximation the discharge is symmetric. In theexperiment the plasma is shielded from the chamber wallsby confinement rings. The degree of symmetry was testedby the degree of symmetry of the spatio-temporal excitationprofile (see figure 8). Therefore, the assumption of a voltagesource that is purely RF in the PIC simulation is justified. Ifasymmetric discharges are investigated, the simulation willhave to be modified in this respect. 6. Conclusions Field reversals in single and dual-frequency CCRF dischargeswere investigated experimentally as well as theoretically. Inboth discharges the maxima of the excitation during phasesof sheath collapse are observed by PROES indicating a fieldreversal. Inn an asymmetric single frequency discharge fieldreversals are observed at low pressures below 1Pa in raregases as well as in molecular gas discharges. In a symmetricdual-frequency discharge field reversals are observed at thephases when the high and low frequency sheaths collapsesimultaneously. In the dual-frequency case the experimentalresults in terms of spatio-temporal excitation profiles arecompared with the results of a PIC simulation. This simulationexplicitly shows reversed fields at distinct phases. A fluidmodel used to calculate the electric field during sheath collapseis developed. Using input parameters from the simulation theresulting electric field profiles agree well with the field directlyobtained from the PIC simulation in regions of quasineutrality,where the model is applicable. Based on this model, differentmechanisms leading to the observed field profiles are separatedand the physical causes of the field reversal understood. Depending on the discharge conditions, a field reversal incapacitive discharges can either be caused by electron inertia(low pressures), collisions of electrons with the backgroundgas (high pressures) or a combination of both (intermediatepressures). Each of these mechanisms can prevent electronsfrom instantaneously following the collapsing sheath. Ifelectrons cannot follow the retreating sheath by diffusion, areversed field builds up that accelerates electrons towards theelectrode in order to keep a constant current and to compensatethe ion flux to the electrode within one RF cycle. It is shown explicitly for the dual-frequency dischargethat was investigated experimentally that the field reversal isequally caused by both electron inertia and collisions. During a time interval of a few nanoseconds the electrodecan be charged up positively by ion bombardment at phasesof vanishing external voltage. At these phases a sheath ofelectrons (negative charge excess) is observed in front of theelectrode. As the ion density decreases towards the electrodea higher field is needed at the electrode than in the bulk to keepa constant current. Electron diffusion leads to an ambipolar field at theposition of maximum sheath width that couples electron andion motion. It is caused by the fact that electrons can follow thecollapsing sheath faster than the heavy ions. Such ambipolarfields are observed in PIC simulations of dual-frequencydischarges in different gases and in calculations of the electricfield in a single frequency argon discharge using a fluid sheathmodel In general, field reversals are observed in both single anddual-frequency CCRF discharges. As electrons gain additionalenergy through the reversed fields, field reversals contributesignificantly to plasma heating. A detailed understanding ofthe underlying mechanisms might be relevant for industrialprocesses, since it contributes to plasma production and canlead to charged surfaces. Acknowledgments This work has been funded by the DFG through SFB 591 andGRK 1051, the Hungarian Scientific Research Fund throughgrants OTKA-T-48389 and OTKA-IN-69892 and supportedby Andor Technology. The dual-frequency measurements were performed in collaboration with Timo Gans, DeborahO'Connell, Bert Ellingboe and Miles Turner and supported byLam Research Inc., the EU (FP5), the DFG (SFB 591 and GRK1051) and the Studienstiftung des dt. Volkes. ( References ) ( [ 1] Lieberman M A and Lichtenberg AJ 2005 Principles ofPlasma Discharges and Materials Processing 2nd edn(New York: Wiley-Interscience) ) ( [2] Boyle P C, Ellingboe A R and Turner M M 2004 PlasmaSources Sci. Technol . 13 493-503 ) ( [3] Boyle P C, Ellingboe A R a nd Turner M M 2004 J. P h ys. D:Appl. Phys. 37 697 ) ( [4] K itajima T, Takeo Y, P etrovic Z L and Makabe T 2000 Appl. Phys. Lett. 77 489 ) ( [5] D enda T, Miyoshi Y, K o mukai Y, Goto T, Petrovic Z L and Makabe T 2004 J. Appl. Phys. 95 870 ) ( [6] Kawamura E, Lieberman M A a n d Li c htenberg A J 2 0 06Phys. Plasmas 13 053506 ) ( [7] Turner M M and Chabert P 2006 Phys. Rev. Lett. 96 205001 [8] Gans T, S chulze J,O’Connell D, Czarnetzki U, Fa u lkner R, Ellingboe A R a nd Turner M M 2006 Appl. Phys. L e tt. 89261502 ) ( [9] Schulze J, Gans T, O'Connell D, Czarnetzki U, Ellingboe A R and Turner M M 2007 J. Phys. D: Appl. Phys. 40 7008 - 18 ) ( [ 1 0] Lieberman M A and Godyak VA 19 9 8 IEEE Trans. Plasma Sci. 26 955 ) ( [1 1 ] S urendra M a n d Graves D B 1 991 Phys. Rev. Lett. 6 6 1469 ) ( [12] Turner M M 1 9 95 Phys. Rev. Lett. 75 13 1 2 ) ( [13] G ozadinos G, Turner M M an d Vender D 199 5 Phy s . Rev. Lett.87 135004 ) ( [ 1 4] S alabas A, M a rques L, Jolly J and Alves L L 2004 J. Appl.Phys. 95 4605 - 20 ) ( [ 1 5] V ender D and Boswell R W 19 9 0 IEEE Trans. Plasma Sci. 18 725 ) ( [16] W ood B P 1991 PhD Thesis University of California at Berkely ) ( [17] Tochikubo F, Suzuki A, Kakuta S, Terazono Y and Makabe T 1990 J. Appl. Phys. 68 5532 ) ( [ 1 8] P etrovicZ Lj, Tochikubo F, Kakuta S and Makabe T 1992 J.Appl. Phys. 71 2143 ) ( [19] L eroy OL, Stratil P, Perrin J, Jolly J and Bellenguer Ph 1995J. Phys. D: Appl. Phys. 28 500 ) ( [20] C zarnetzki U, L uggenholscher D a n d D o bele H F 1999Plasma Sources Sci. Technol. 8 230- 4 8 ) ( [21] Gans T, Schulz-von der Gathen V and Dobele H F 2004Europhys. L ett. 66 232-8 ) ( [22] Mahony C M O, Wazzan R Al and Graham W G 1997Appl. Phys. Lett . 71 608- 1 0 ) ( [23] Schulze J, Heil B G, Luggenholscher D, Czarnetzki U an d B rinkmann R P 2008 J. P hys. D: Appl. Phys. 41 042003 ) ( [24] Schulze J, Kampschulte T, Luggenholscher D and ) ( Czarnetzki U 2007 J. Phys. Conf. Ser 86 012010 ) ( [25] Salabas A and Brinkmann R P 2005 Plasma Sources Sci.Technol. 14 S53 - 9 ) ( [26] Godyak V A, Piejak R B and Alexandrovich B M 199 2 P lasma Sources. S c i. Technol. 1 3 6 ) ( [27] B elenguer Ph and Boeuf J P 1 9 90 Phys. Rev. A 4 1 4447 ) ( [28] Sato A H and Lieberman M A 1990J. Appl. Phys. 68 6117 ) ( [29] Vender D and Boswell R W 1992 J. Vac. Sci. Technol. A 101331 ) ( [30] Turner M M and Hopkins M B 19 9 2 Phys. Rev. Lett. 693511 ) ( [31] T ochikubo F, Makabe T, K a kuta S and Suzuki A 19 9 3 J. Appl. Phys. 73 2163 ) ( [32] GottschoR A 1 9 87 Phys. Rev. A 3 6 2233 ) ( [33] M ussenbrock T and Brinkmann R P 2006 Appl. Phys. Lett. 88151503 ) ( [34] Mussenbrock T and Brinkmann R P 2007 Plasma Sources. Sci. Technol. 16 377-85 ) ( [35] Czarnetzki U, Mussenbrock T and Brinkmann R P 2006 Phys. Plasmas 13 12 3 503 ) ( [36] M iller P A, Hebner G A , Greenberg K E, Pochan PD andAragon B 1995 J. R e s. Natl Inst. Stand. Technol. 100 427 ) ( [37] N IST Atomic Spectra Database ht tp:/ / phys la b.nist.gov/ cg i-bin/AtData/main_asd ) ( [38] Klick M 1996 J. Appl. Phys. 79 3445 ) ( [39] Klick M, Kammeyer M, Rehak W, Kasper W, Awakowicz Pand F ranz G 1 9 98 Surf. Coat. Technol. 9 8 1 3 95 ) ( [40] Kratzer M , B rinkmann R P, Sabisch W and Schmidt H 2001J. Appl. Phys. 90 2169 ) ( [4 1 ] Brinkmann R P 2007 J. Appl. Phys. 102 093302 ) [42] Mussenbrock T, Hemke T, Ziegler D, Brinkmann R P and ( K lick M 2008 Plasma Sources Sci. Technol. 1 7 025018 ) ( [43] D onk6Z and Pe t rovic Z Lj 2006 Japan. J. Appl. P hys. 45 8151 ) ( [44] M organ W L, B oeufJP and P itc h ford L C The Siglo Dat a bas e , CPAT and Kinema Software ht tp://www.sig lo- kinema.com ) ( [45] P helps A V and Petrovic Z Lj 1 999 Plasma Sources Sci. Technol. 8 R21 ) ( [46] P helps AV 1 9 94 J. Appl. Phys. 76 747 ) ( [ 47] P helps A V ht tp:/ / jilawww.c o lorado.edu/avp/collisiondata/ unpublished ) ( [48] Turner M M 2006 Phys. Plasmas 1 3 033506 ) ( [49] T urner M M, Chabert P, Levif P, Boyle P and Robiche J 2007 Proc. 1 8th Int. Conf. on ICPIG (Prague, Czech Republic, 15-20 July 2007) G08 ) [50] Bohm C and Perrin J 1992 Rev. Sci. Instrum. 64 31-44 ( [51] Schulze J, Heil B, Luggenholscher D , C z arnetzki U and Ellingboe A R 2 0 07 Bull. Am. Phys. Soc. 52 4 ) C IOP Publishing Ltd Printed in the UK
确定


还剩14页未读,是否继续阅读?

产品配置单

北京欧兰科技发展有限公司为您提供《电容中不同压力下电容耦合射频放电鞘层区域的电场反转检测方案(CCD相机)》,该方案主要用于其他中不同压力下电容耦合射频放电鞘层区域的电场反转检测,参考标准--,《电容中不同压力下电容耦合射频放电鞘层区域的电场反转检测方案(CCD相机)》用到的仪器有德国LaVision PIV/PLIF粒子成像测速场仪、Ekspla PL2230型高能量皮秒激光器
推荐专场


相关方案
更多
该厂商其他方案
更多