


方案详情
文
Many surfactants and polymers are considered as excellent drag reducing agents. This phenomenon induces
a significant head loss reduction compared to the pure solvent. In this study an aqueous solution of CTAC/NaSal
(CetylTrimethyl Ammonium Chloride and Sodium Salicylate) is used in turbulent pipe flow system. Drag
reduction experiments were carried out for different experimental conditions using pressure drop measurements.
At the same time the spatial velocity distribution was measured and analysed using particle image velocimetry
(PIV).
方案详情

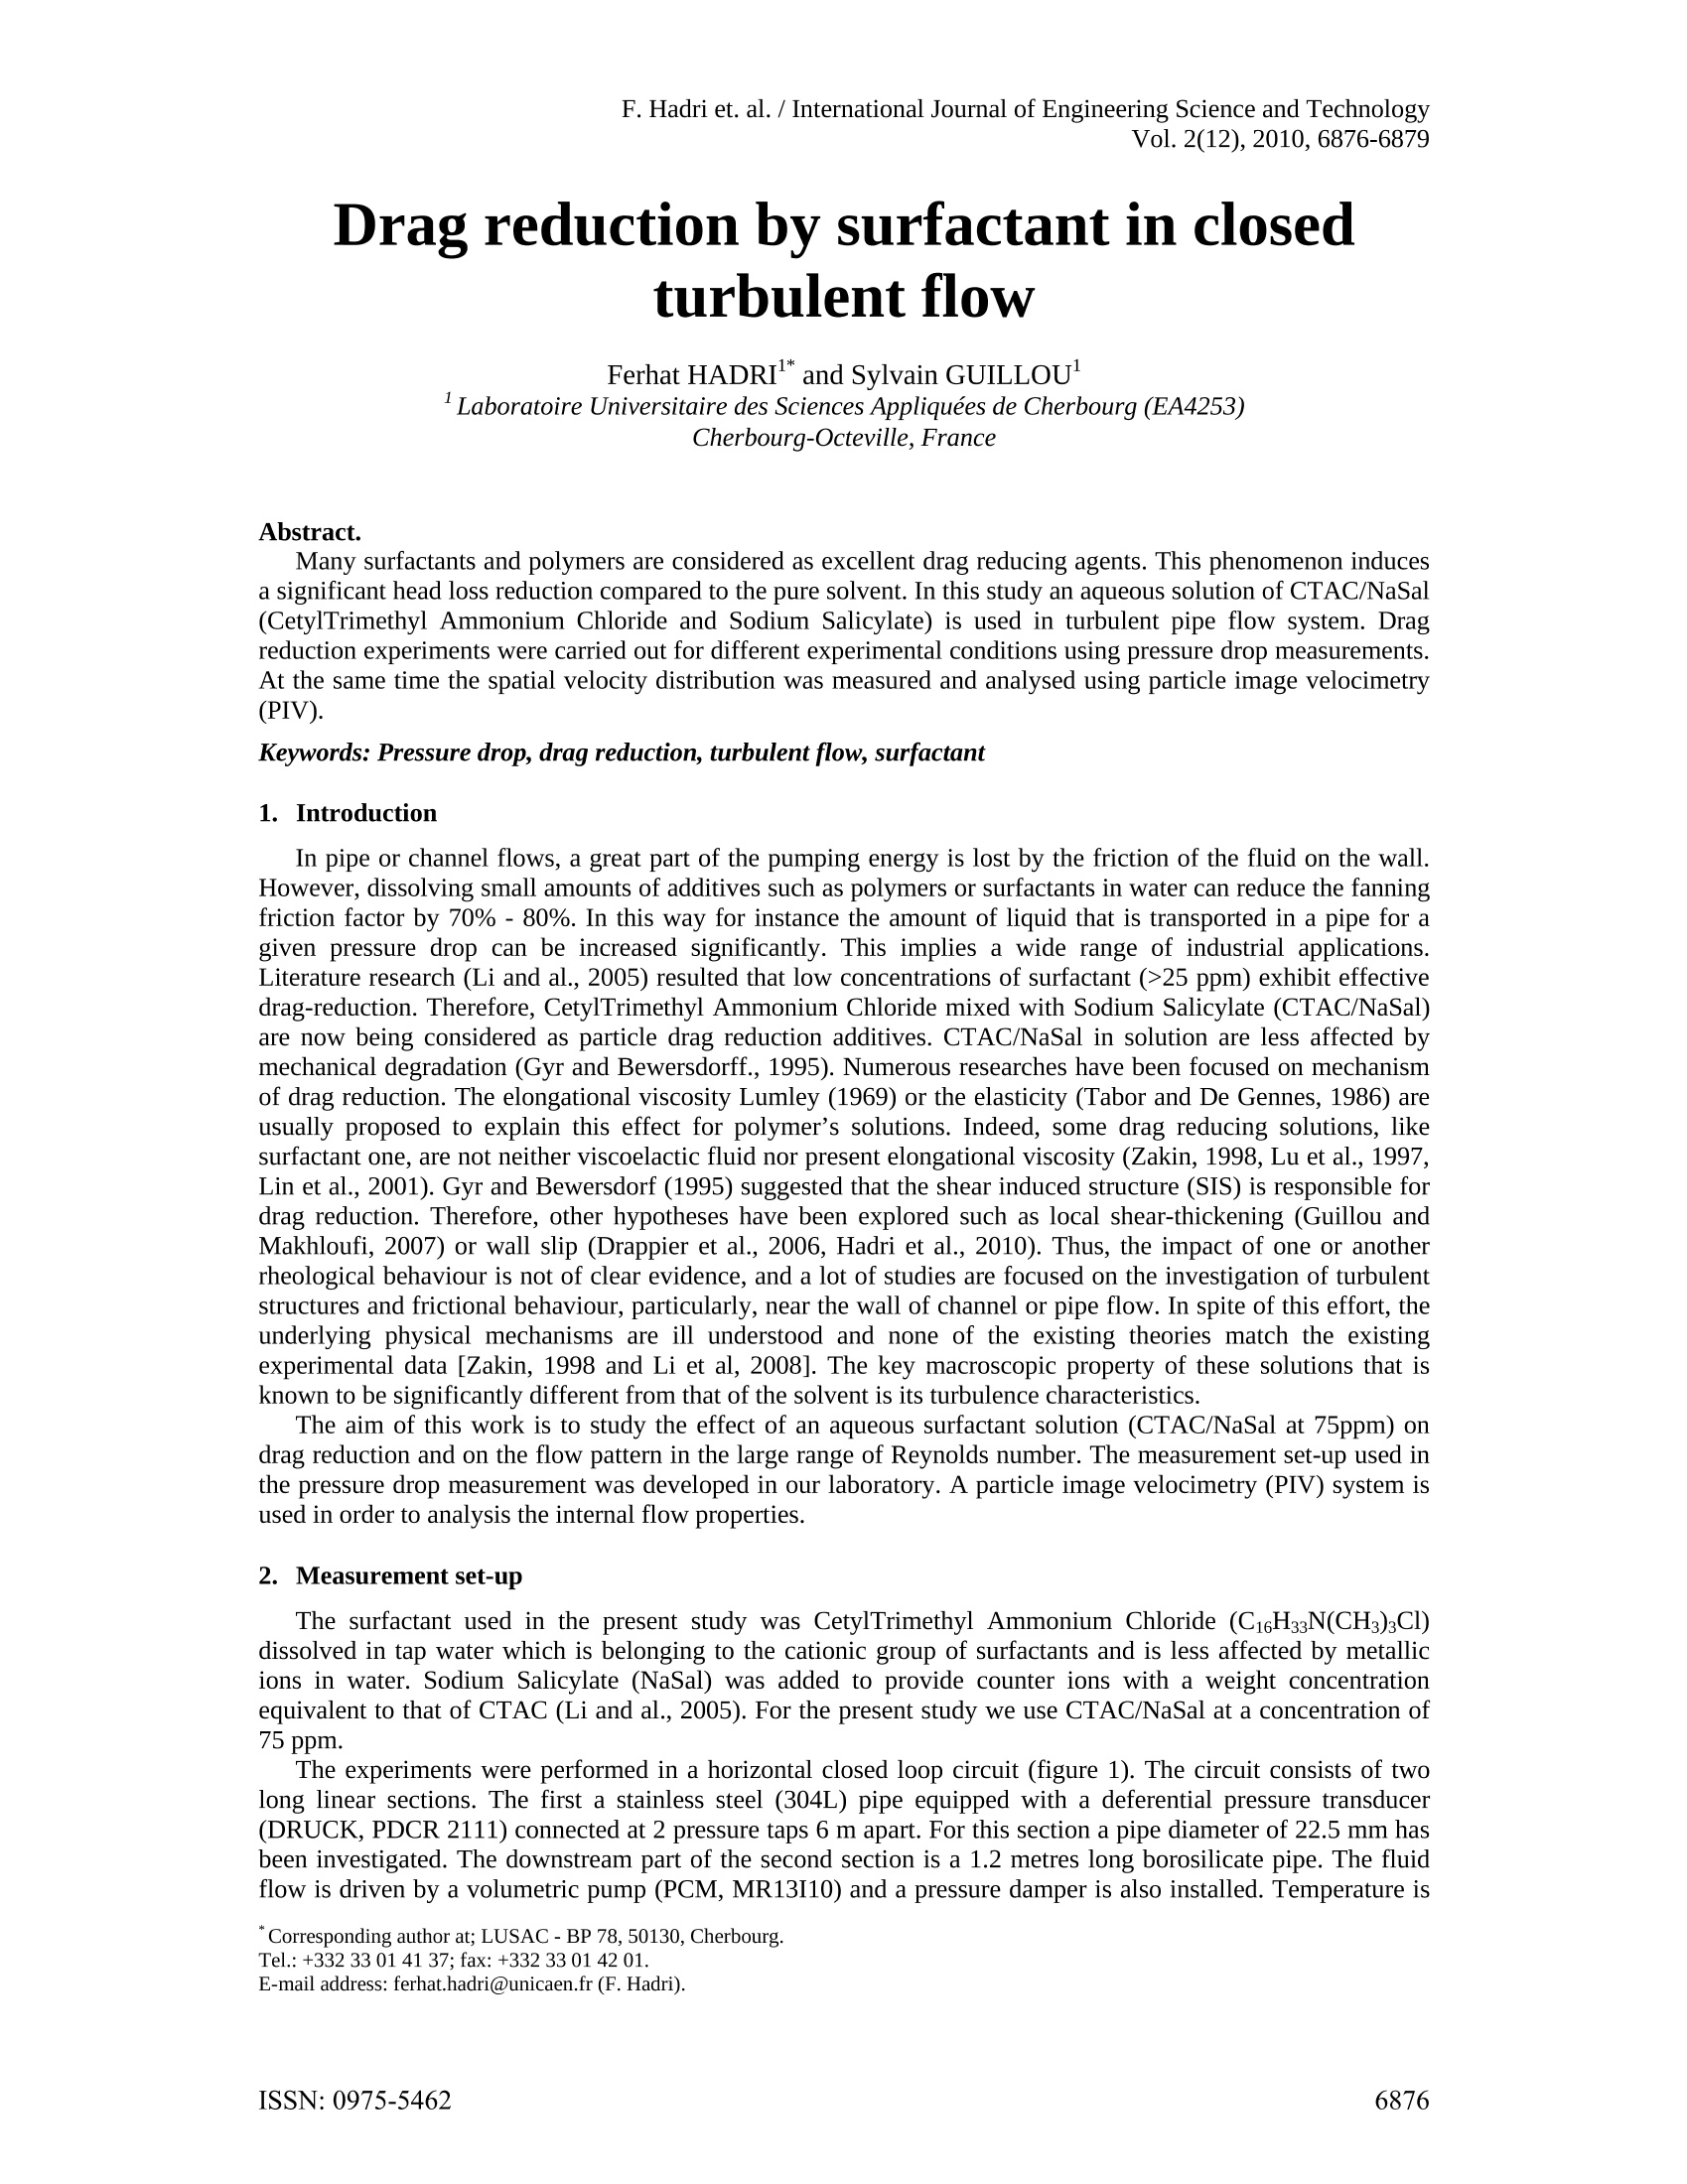
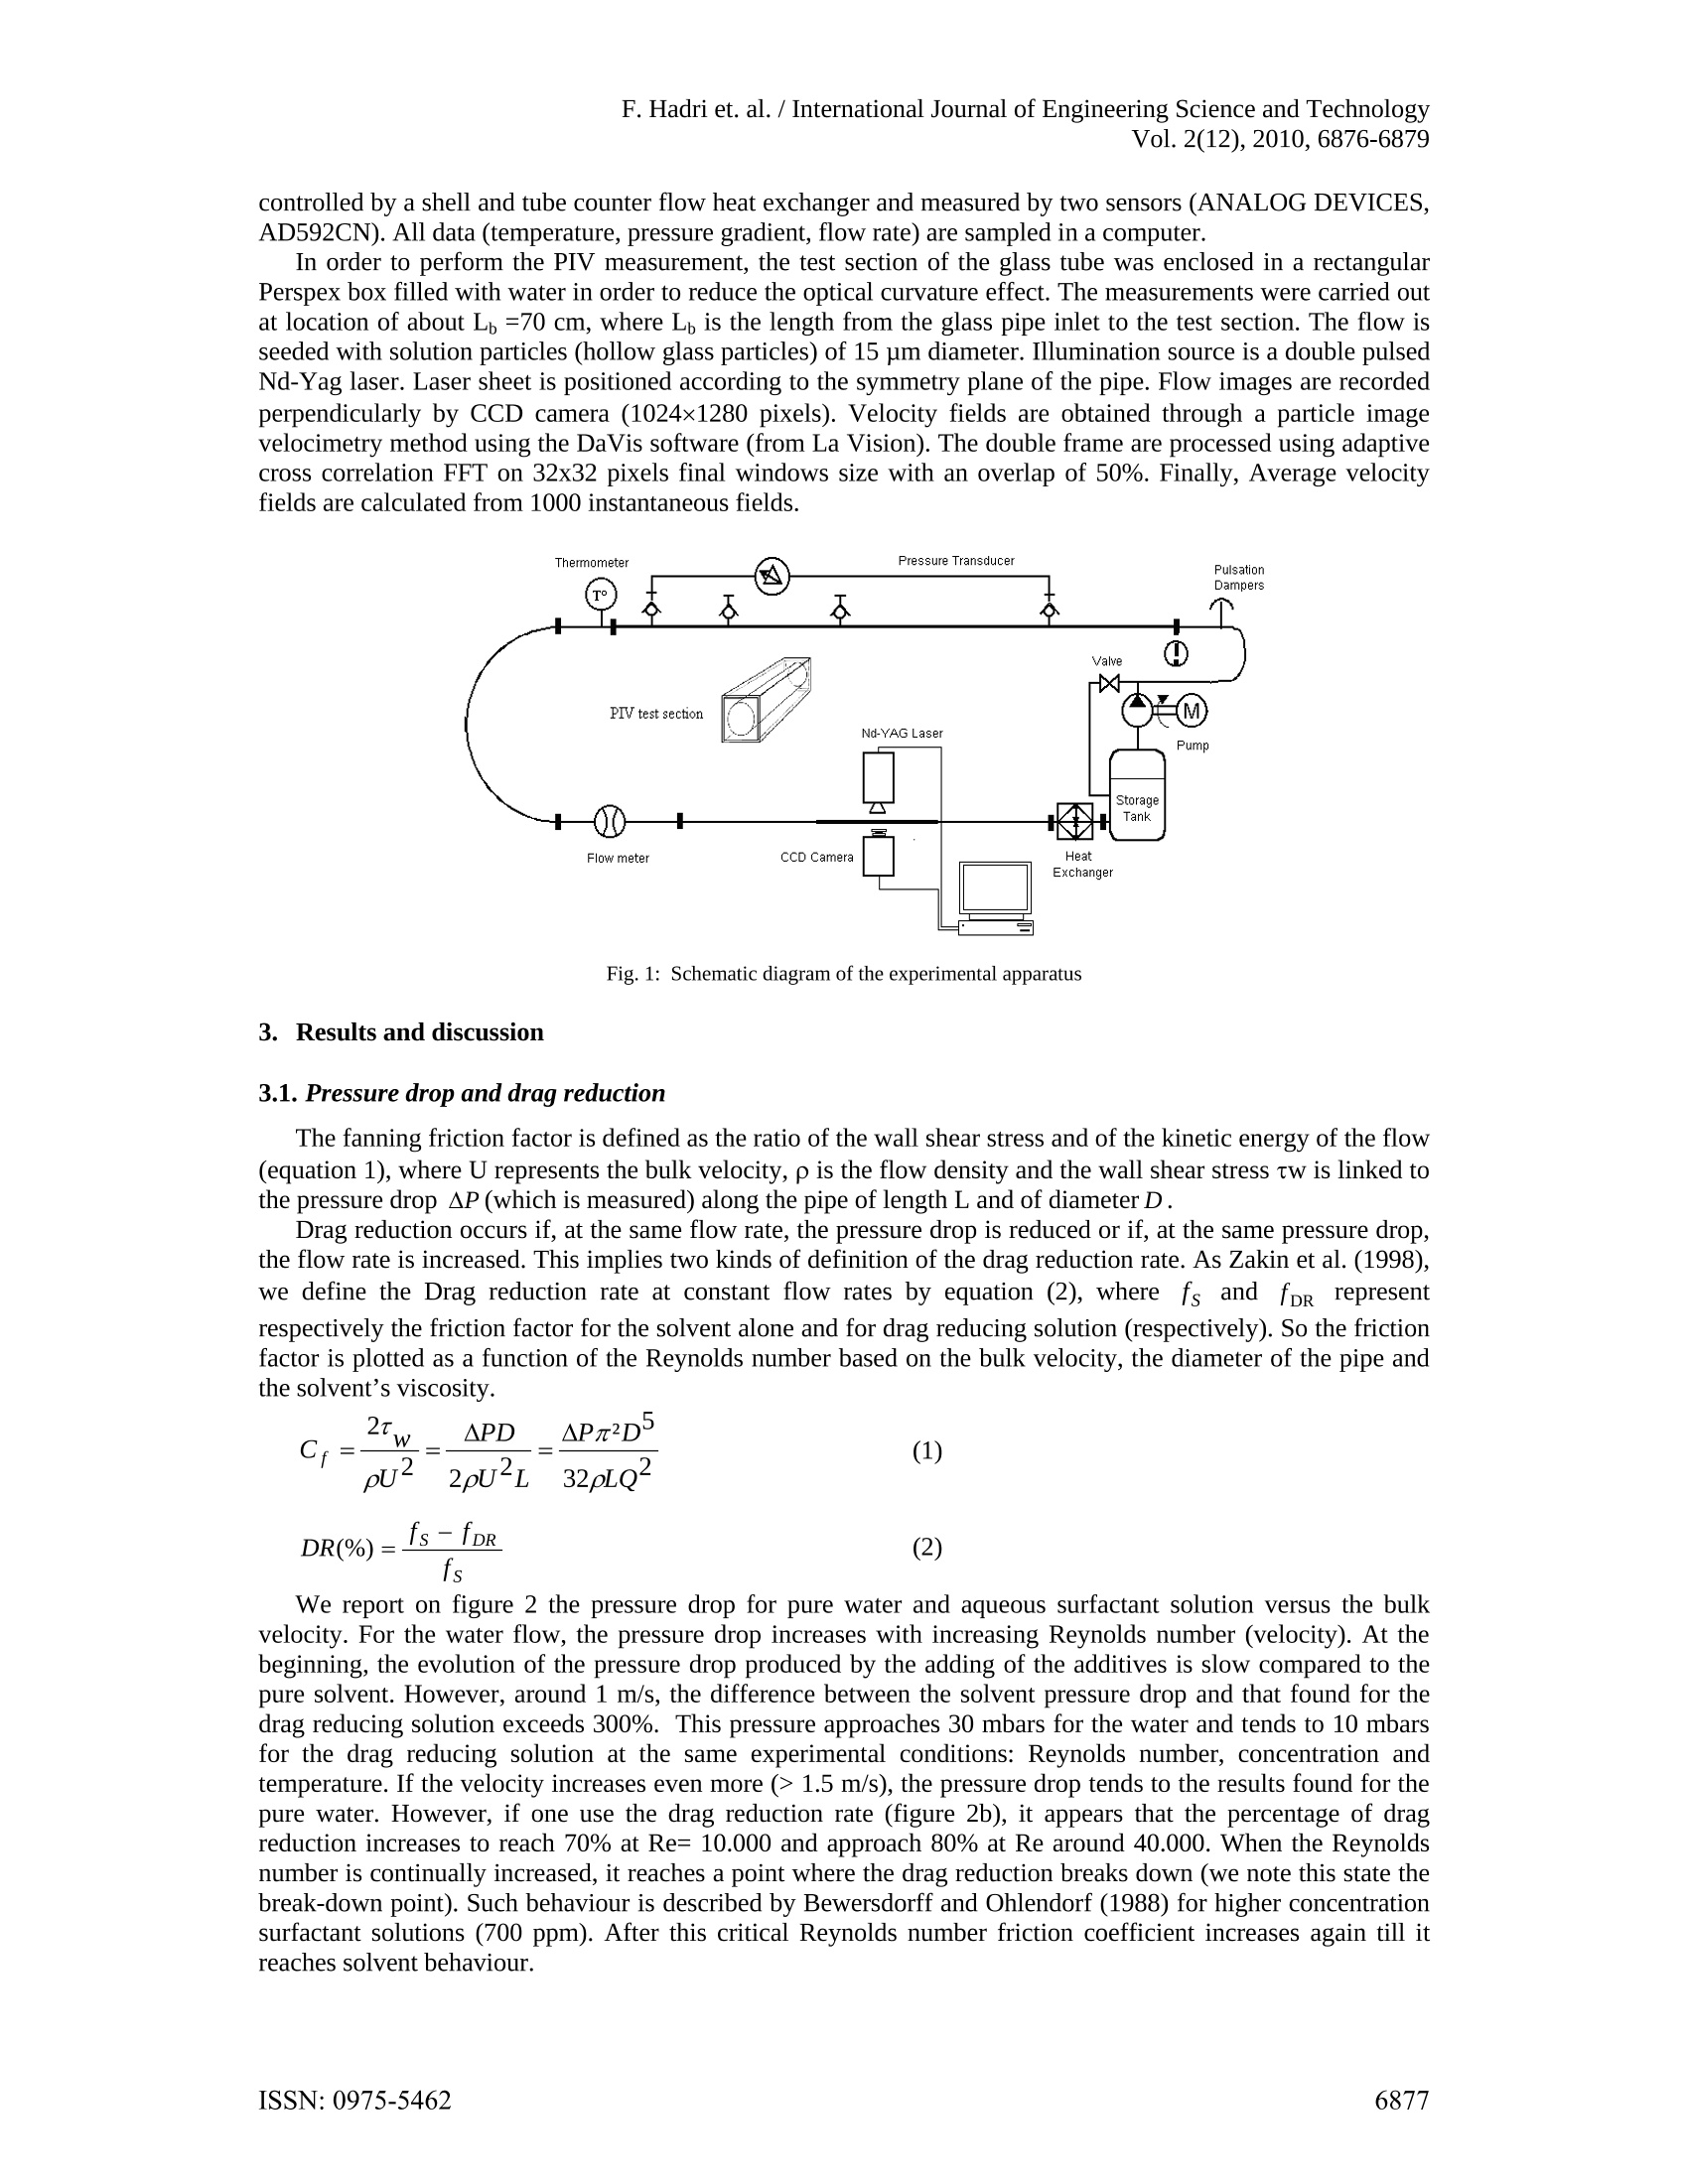
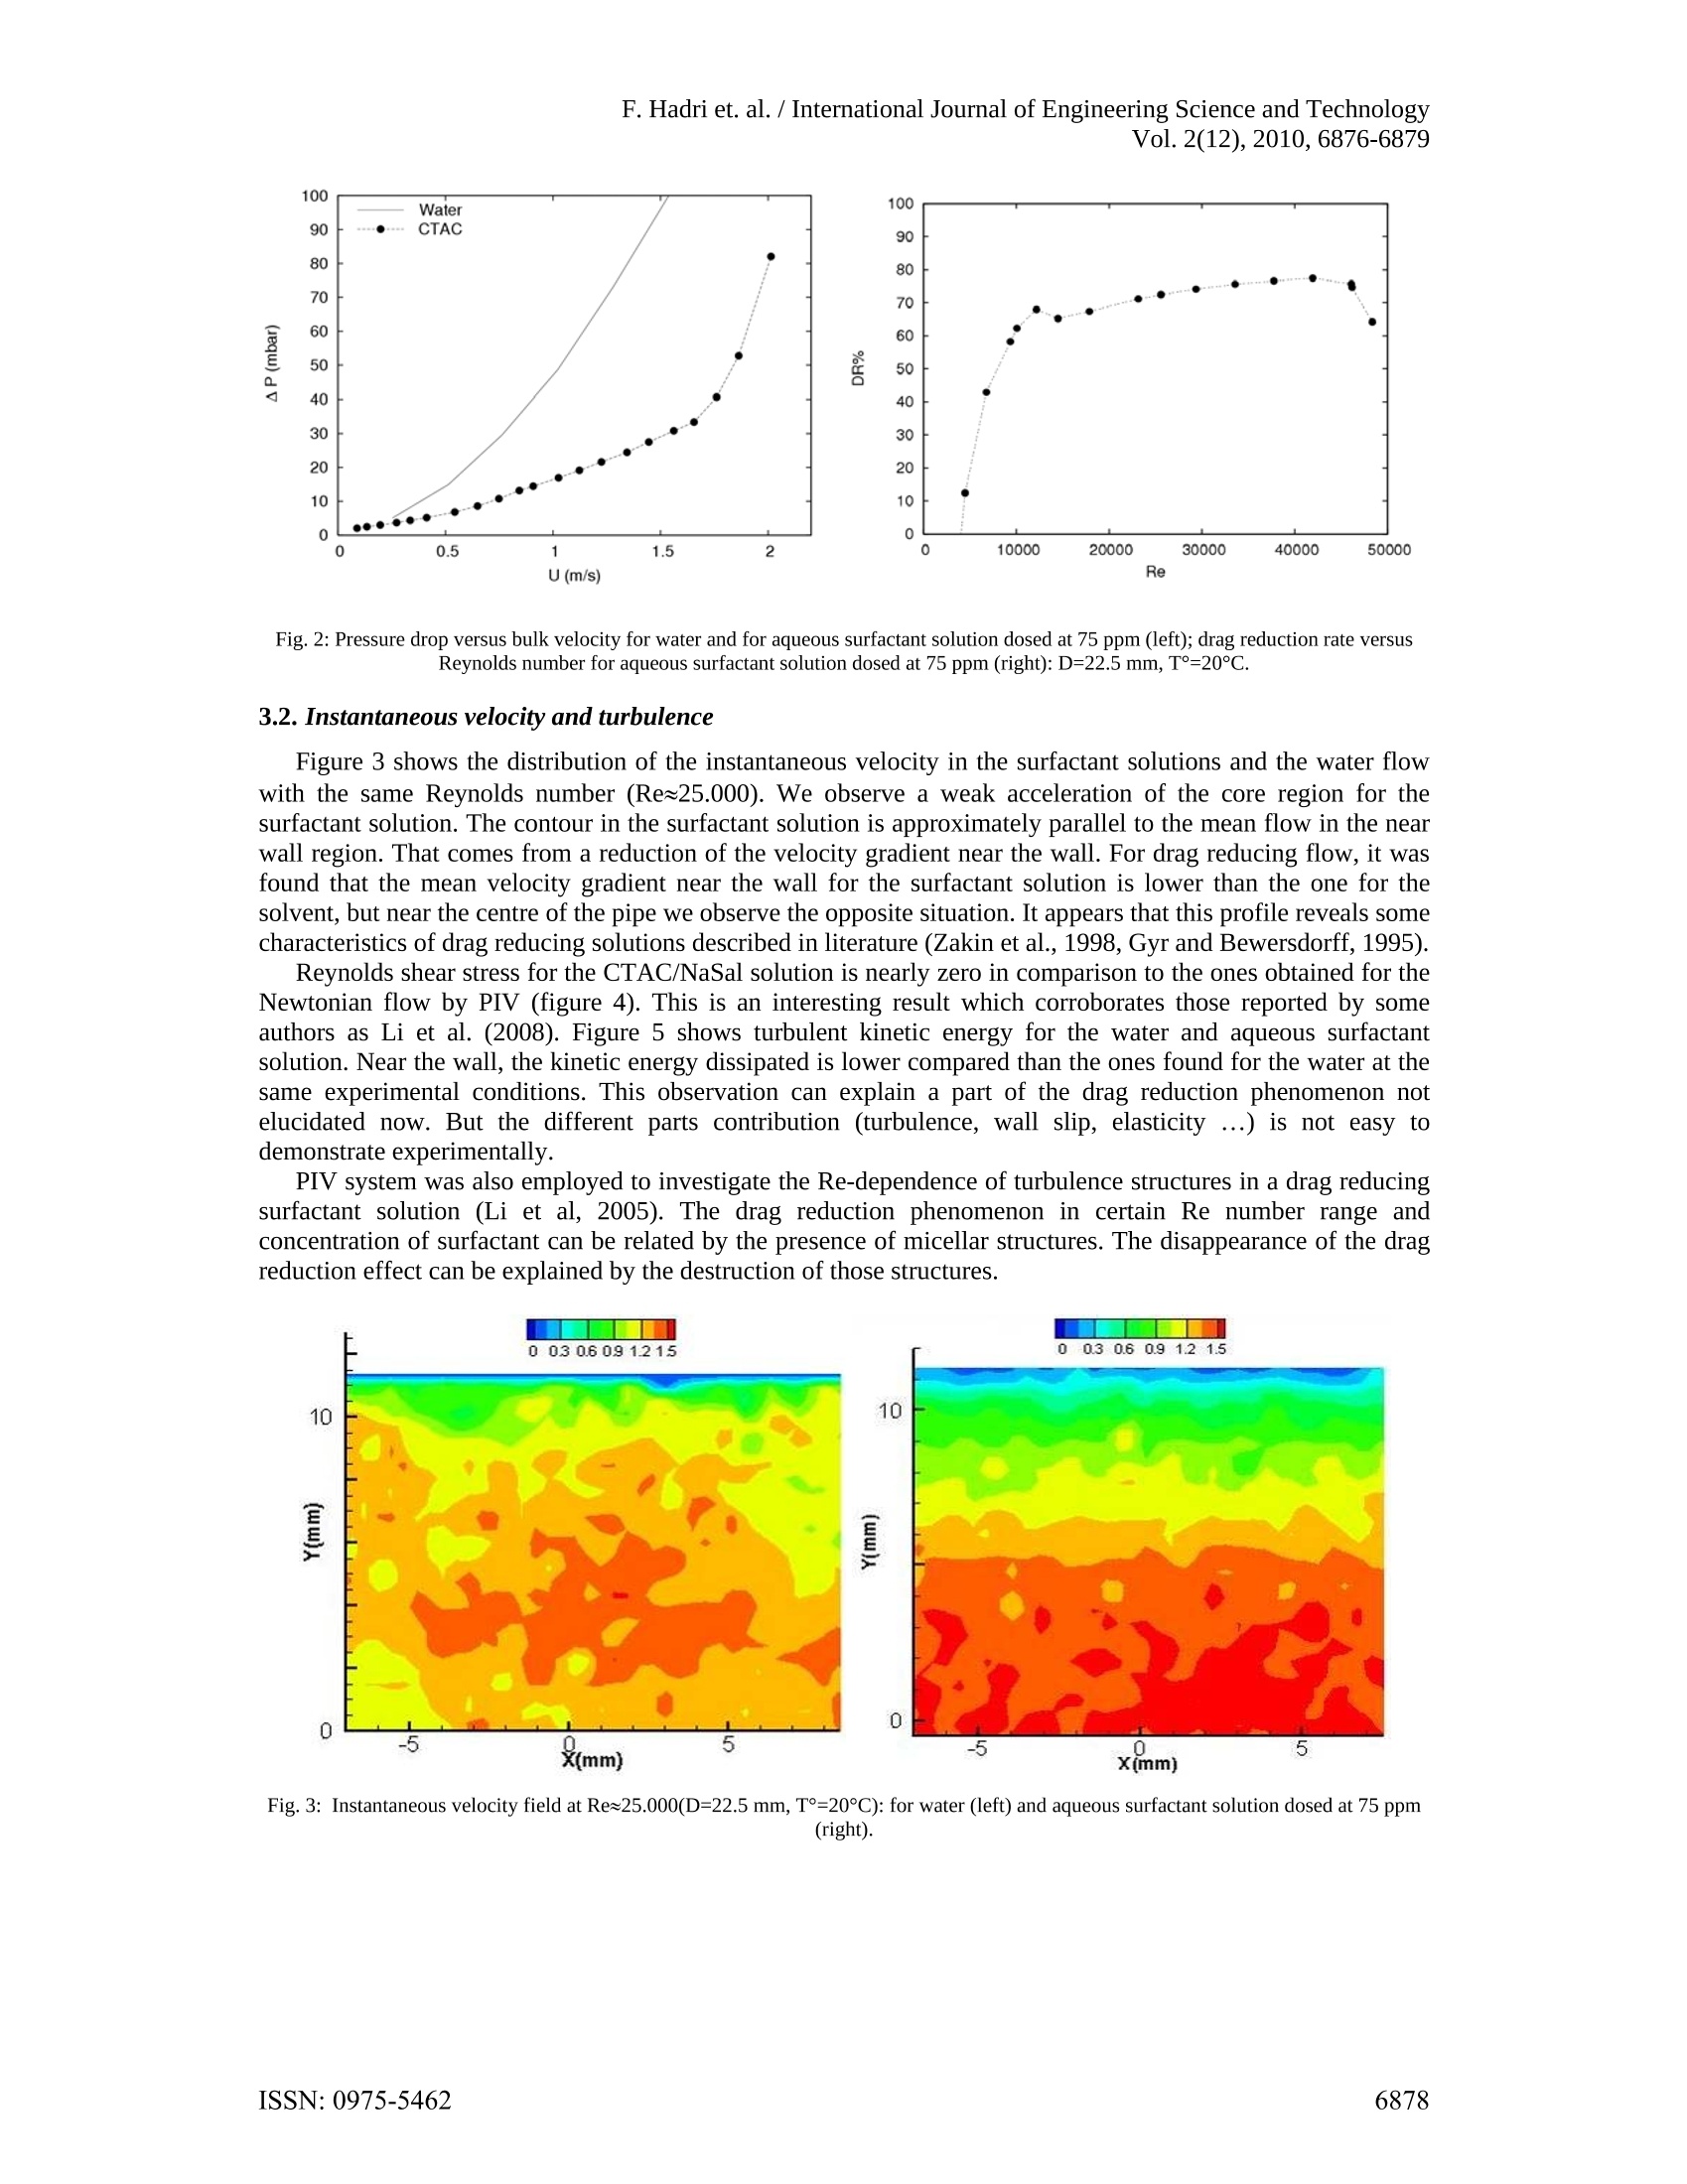
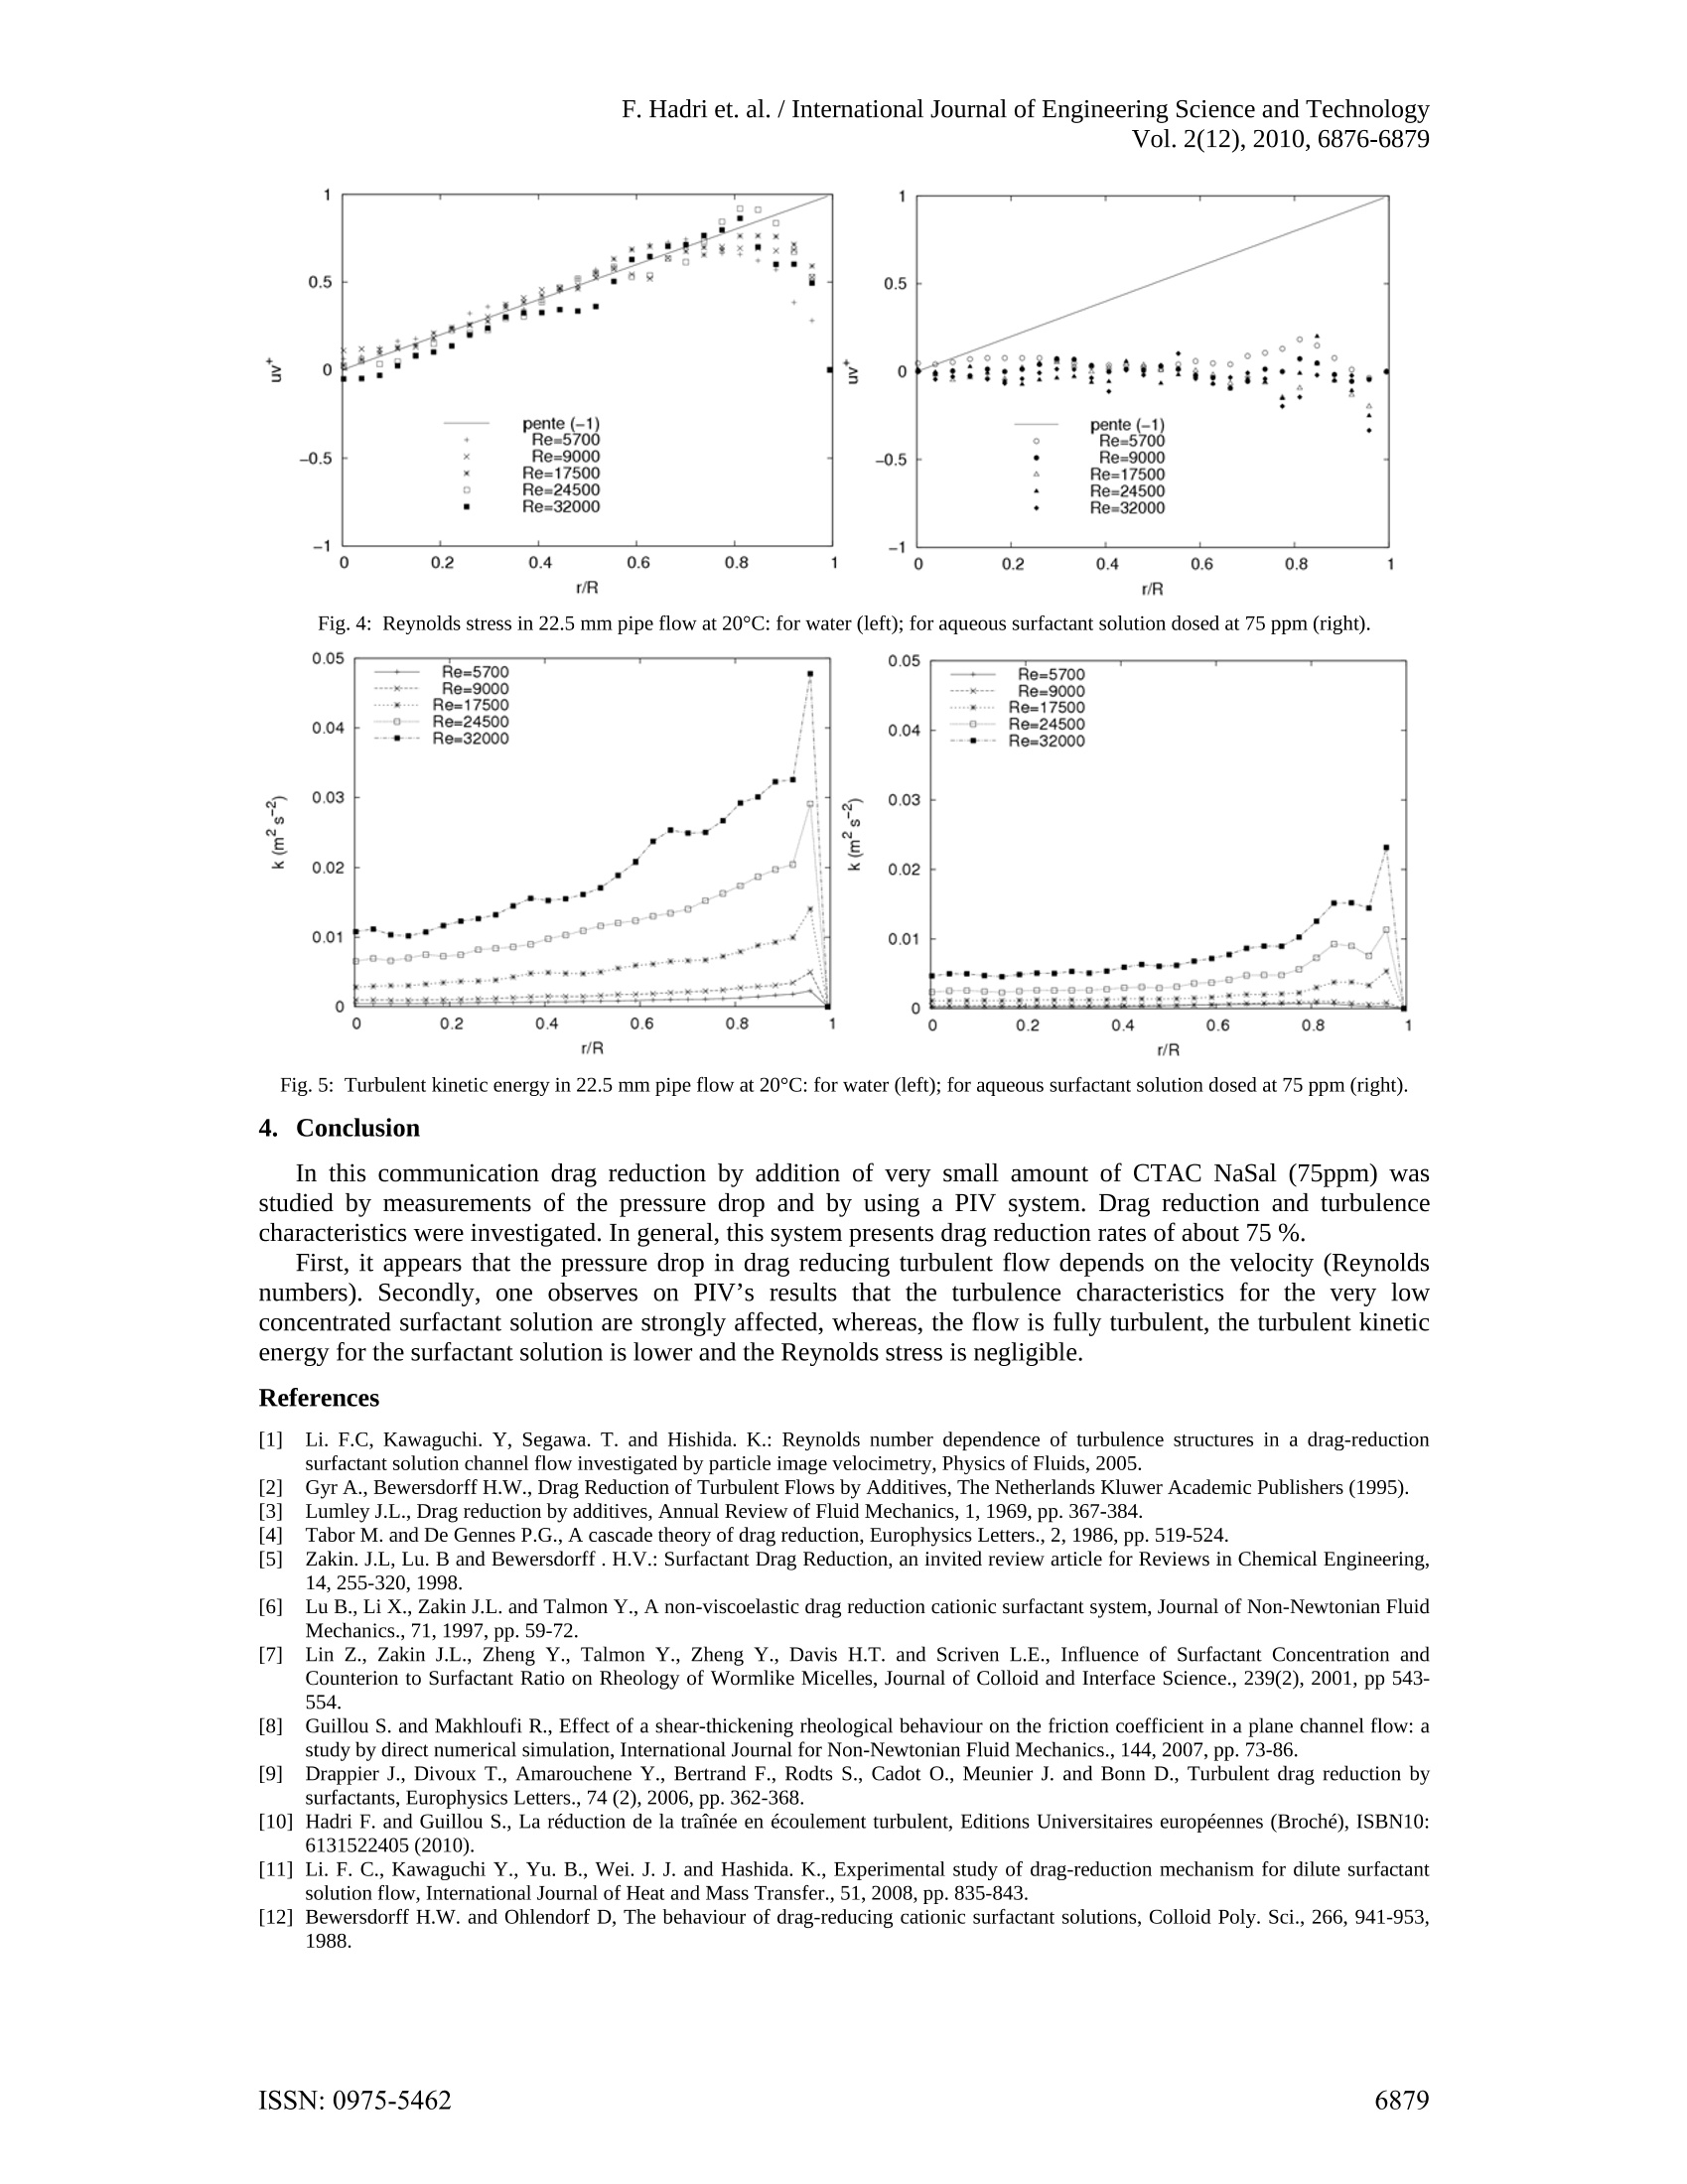
F. Hadri et. al. /International Journal of Engineering Science and TechnologyVol. 2(12),2010,6876-6879 Drag reduction by surfactant in closedturbulent flow Ferhat HADRI*and Sylvain GUILLOU' 'Laboratoire Universitaire des Sciences Appliquees de Cherbourg (EA4253)Cherbourg-Octeville, France Abstract. Many surfactants and polymers are considered as excellent drag reducing agents. This phenomenon inducesa significant head loss reduction compared to the pure solvent. In this study an aqueous solution of CTAC/NaSal(CetylTrimethyl Ammonium Chloride and Sodium Salicylate) is used in turbulent pipe flow system. Dragreduction experiments were carried out for different experimental conditions using pressure drop measurements.At the same time the spatial velocity distribution was measured and analysed using particle image velocimetry(PIV). Keywords: Pressure drop, drag reduction, turbulent flow, surfactant 1. Introduction In pipe or channel flows, a great part of the pumping energy is lost by the friction of the fluid on the wall.However, dissolving small amounts of additives such as polymers or surfactants in water can reduce the fanningfriction factor by 70%-80%. In this way for instance the amount of liquid that is transported in a pipe for agiven pressure drop can be increased significantly. This implies a wide range of industrial applications.Literature research (Li and al., 2005) resulted that low concentrations of surfactant (>25 ppm) exhibit effectivedrag-reduction. Therefore, CetylTrimethyl Ammonium Chloride mixed with Sodium Salicylate (CTAC/NaSal)are now being considered as particle drag reduction additives. CTAC/NaSal in solution are less affected bymechanical degradation (Gyr and Bewersdorff., 1995). Numerous researches have been focused on mechanismof drag reduction. The elongational viscosity Lumley (1969) or the elasticity (Tabor and De Gennes, 1986) areusually proposed to explain this effect for polymer’s solutions. Indeed, some drag reducing solutions, likesurfactant one, are not neither viscoelactic fluid nor present elongational viscosity (Zakin, 1998, Lu et al., 1997,Lin et al., 2001). Gyr and Bewersdorf (1995) suggested that the shear induced structure (SIS) is responsible fordrag reduction. Therefore, other hypotheses have been explored such as local shear-thickening (Guillou andMakhloufi, 2007) or wall slip (Drappier et al., 2006, Hadri et al., 2010). Thus, the impact of one or anotherrheological behaviour is not of clear evidence, and a lot of studies are focused on the investigation of turbulentstructures and frictional behaviour, particularly, near the wall of channel or pipe flow. In spite of this effort, theunderlying physical mechanisms are ill understood and none of the existing theories match the existingexperimental data [Zakin, 1998 and Li et al, 2008]. The key macroscopic property of these solutions that isknown to be significantly different from that of the solvent is its turbulence characteristics. The aim of this work is to study the effect of an aqueous surfactant solution (CTAC/NaSal at 75ppm) ondrag reduction and on the flow pattern in the large range of Reynolds number. The measurement set-up used inthe pressure drop measurement was developed in our laboratory. A particle image velocimetry (PIV) system isused in order to analysis the internal flow properties. 2. Measurement set-up The surfactant used in the present study was CetylTrimethyl Ammonium Chloride (C16H33N(CH)3Cl)dissolved in tap water which is belonging to the cationic group of surfactants and is less affected by metallicions in water. Sodium Salicylate (NaSal) was added to provide counter ions with a weight concentrationequivalent to that of CTAC (Li and al., 2005). For the present study we use CTAC/NaSal at a concentration of75 ppm. The experiments were performed in a horizontal closed loop circuit (figure 1). The circuit consists of twolong linear sections. The first a stainless steel (304L) pipe equipped with a deferential pressure transducer(DRUCK, PDCR 2111) connected at 2 pressure taps 6 m apart. For this section a pipe diameter of 22.5 mm hasbeen investigated. The downstream part of the second section is a 1.2 metres long borosilicate pipe. The fluidflow is driven by a volumetric pump (PCM, MR13I10) and a pressure damper is also installed. Temperature is ( Corresponding author at; LUSAC - BP 78, 50130, Cherbourg. ) ( T el.: + 332 33 01 41 37; fax :+ 332 33 01 42 01. ) ( E-mail address: f e rhat.hadri@unicaen.fr (F. Hadri). ) controlled by a shell and tube counter flow heat exchanger and measured by two sensors (ANALOG DEVICES,AD592CN). All data (temperature, pressure gradient, flow rate) are sampled in a computer. In order to perform the PIV measurement, the test section of the glass tube was enclosed in a rectangularPerspex box filled with water in order to reduce the optical curvature effect.The measurements were carried outat location of about Lb=70 cm, where L is the length from the glass pipe inlet to the test section. The flow isseeded with solution particles (hollow glass particles) of 15 um diameter. Illumination source is a double pulsedNd-Yag laser. Laser sheet is positioned according to the symmetry plane of the pipe. Flow images are recordedperpendicularly by CCD camera (1024×1280 pixels). Velocity fields are obtained through a particle imagevelocimetry method using the DaVis software (from La Vision). The double frame are processed using adaptivecross correlation FFT on 32x32 pixels final windows size with an overlap of 50%. Finally, Average velocityfields are calculated from 1000 instantaneous fields. Fig. 1: Schematic diagram of the experimental apparatus 3. Results and discussion 3.1. Pressure drop and drag reduction The fanning friction factor is defined as the ratio of the wall shear stress and of the kinetic energy of the flow(equation 1), where U represents the bulk velocity, p is the flow density and the wall shear stress tw is linked tothe pressure drop AP (which is measured) along the pipe of length L and of diameter D. Drag reduction occurs if, at the same flow rate, the pressure drop is reduced or if, at the same pressure drop,the flow rate is increased. This implies two kinds of definition of the drag reduction rate. As Zakin et al.(1998),we define the Drag reduction rate at constant flow rates by equation (2), where fs and fpR representrespectively the friction factor for the solvent alone and for drag reducing solution (respectively). So the frictionfactor is plotted as a function of the Reynolds number based on the bulk velocity, the diameter of the pipe andthe solvent’s viscosity. We report on figure 2 the pressure drop for pure water and aqueous surfactant solution versus the bulkvelocity. For the water flow, the pressure drop increases with increasing Reynolds number (velocity). At thebeginning, the evolution of the pressure drop produced by the adding of the additives is slow compared to thepure solvent. However, around 1 m/s, the difference between the solvent pressure drop and that found for thedrag reducing solution exceeds 300%. This pressure approaches 30 mbars for the water and tends to 10 mbarsfor the drag reducing solution at the same experimental conditions: Reynolds number, concentration andtemperature. If the velocity increases even more (> 1.5 m/s), the pressure drop tends to the results found for thepure water. However, if one use the drag reduction rate (figure 2b), it appears that the percentage of dragreduction increases to reach 70% at Re= 10.000 and approach 80% at Re around 40.000. When the Reynoldsnumber is continually increased, it reaches a point where the drag reduction breaks down (we note this state thebreak-down point). Such behaviour is described by Bewersdorff and Ohlendorf (1988) for higher concentrationsurfactant solutions (700 ppm). After this critical Reynolds number friction coefficient increases again till itreaches solvent behaviour. Fig. 2: Pressure drop versus bulk velocity for water and for aqueous surfactant solution dosed at 75 ppm (left); drag reduction rate versusReynolds number for aqueous surfactant solution dosed at 75 ppm (right): D=22.5 mm,T=20°C. 3.2. Instantaneous velocity and turbulence Figure 3 shows the distribution of the instantaneous velocity in the surfactant solutions and the water flowwith the same Reynolds number (Re~25.000). We observe a weak acceleration of the core region for thesurfactant solution. The contour in the surfactant solution is approximately parallel to the mean flow in the nearwall region. That comes from a reduction of the velocity gradient near the wall. For drag reducing flow, it wasfound that the mean velocity gradient near the wall for the surfactant solution is lower than the one for thesolvent, but near the centre of the pipe we observe the opposite situation. It appears that this profile reveals somecharacteristics of drag reducing solutions described in literature (Zakin et al., 1998, Gyr and Bewersdorff, 1995). Reynolds shear stress for the CTAC/NaSal solution is nearly zero in comparison to the ones obtained for theNewtonian flow by PIV (figure 4). This is an interesting result which corroborates those reported by someauthors as Li et al. (2008). Figure 5 shows turbulent kinetic energy for the water and aqueous surfactantsolution. Near the wall, the kinetic energy dissipated is lower compared than the ones found for the water at thesame experimental conditions. This observation can explain a part of the drag reduction phenomenon notelucidated now. But the different parts contribution (turbulence, wall slip, elasticity...) is not easy todemonstrate experimentally. PIV system was also employed to investigate the Re-dependence of turbulence structures in a drag reducingsurfactant solution (Li et al, 2005). The drag reduction phenomenon in certain Re number range andconcentration of surfactant can be related by the presence of micellar structures. The disappearance of the dragreduction effect can be explained by the destruction of those structures. Fig. 3: Instantaneous velocity field at Re~25.000(D=22.5 mm,T=20℃): for water (left) and aqueous surfactant solution dosed at 75 ppm(right). Fig. 4: Reynolds stress in 22.5 mm pipe flow at 20°C: for water (left); for aqueous surfactant solution dosed at 75 ppm (right). Fig.5: Turbulent kinetic energy in 22.5 mm pipe flow at 20°℃: for water (left); for aqueous surfactant solution dosed at 75 ppm (right). 41.. Conclusion In this communication drag reduction by addition of very small amount of CTAC NaSal (75ppm) wasstudied by measurements of the pressure drop and by using a PIV system. Drag reduction and turbulencecharacteristics were investigated. In general, this system presents drag reduction rates of about 75 %. First, it appears that the pressure drop in drag reducing turbulent flow depends on the velocity (Reynoldsnumbers). Secondly, one observes on PIV’s results that the turbulence characteristics for the very lowconcentrated surfactant solution are strongly affected, whereas, the flow is fully turbulent, the turbulent kineticenergy for the surfactant solution is lower and the Reynolds stress is negligible. References ( [1] L i. F.C, Kawaguchi. Y , S egawa. T. and H i shida. K.: R eynolds n u mber dependence of turbulence structures in a d rag-reductionsurfactant solution channel flow i nvestigated by p article image velocimetry, Physics of F luids, 2005. ) Gyr A., Bewersdorff H.W., Drag Reduction of Turbulent Flows by Additives, The Netherlands Kluwer Academic Publishers (1995).34 Lumley J.L., Drag reduction by additives, Annual Review of Fluid Mechanics, 1, 1969, pp. 367-384. Tabor M. and De Gennes P.G., A cascade theory of drag reduction, Europhysics Letters., 2, 1986, pp. 519-524. Zakin. J.L, Lu. B and Bewersdorff. H.V.: Surfactant Drag Reduction, an invited review article for Reviews in Chemical Engineering,14,255-320,1998. [6] Lu B., Li X., Zakin J.L. and Talmon Y., A non-viscoelastic drag reduction cationic surfactant system, Journal of Non-Newtonian FluidMechanics., 71, 1997,pp.59-72. ( 71 [7] Lin Z ., Zakin J .L., Zheng Y., Talmon Y. , Zh e ng Y., Dav i s H.T . and Scri v en L.E., Infl u ence of S u rf a ctant Concentration andCounterion t o S u rfactant R a tio o n Rheology of W ormlike Micel l es, Journal of Colloid and Interf a ce Science., 239(2) , 2001, p p 543-554 . ) ( [8] Guillou S. and Makhloufi R. , Effect of a shear-thickening rheological behaviour on the friction coefficient in a plane c h annel flow: astudy b y d irect numerical simulation, International Journal for Non-Newtonian Fl u id Me c hanics., 144 , 2007, pp. 73-8 6 . ) ( [9] D rappier J ., Divoux T ., Amarouchene Y., Bertrand F., R o dts S., Cadot O . , M e unier J. a n d Bonn D., Turbulent drag re d uction bysurfactants, Europhysics Letters., 74 (2),2006, pp.362-368. ) ( [10] Hadri F . a nd Guillou S., L a r eduction d e l a trainee en écoulement turbulent, Editions Universitaires europeennes (Broche), ISBN10: 6131522405(2010). ) ( [11] L i . F. C., Kawaguchi Y . , Y u . B., W e i. J . J. a nd Hashida. K . , Experimental s t udy of drag-reduction mechanism for dilute surfactantsolution flow, International Journa l of Hea t and Mass Transfer., 51, 2008 , pp.835-843. ) ( [12] B ewersdorff H. W . and Ohlendorf D, The b e haviour of drag-reducing cationic surfactant solutio n s, Colloid Poly. S c i., 2 6 6, 9 41-953,1988. ) ISSN:
确定
还剩2页未读,是否继续阅读?

产品配置单


北京欧兰科技发展有限公司为您提供《封闭湍动流体,表面活性剂中减阻,速度场,速度矢量场检测方案(粒子图像测速)》,该方案主要用于其他中减阻,速度场,速度矢量场检测,参考标准--,《封闭湍动流体,表面活性剂中减阻,速度场,速度矢量场检测方案(粒子图像测速)》用到的仪器有德国LaVision PIV/PLIF粒子成像测速场仪、Imager LX PIV相机
推荐专场


相关方案
更多
该厂商其他方案
更多