


方案详情
文
The dynamics associated with a long rod projectile, travelling at high velocity, penetrating a
heterogeneous target has long been an active research area. Historically both analytic and
numeric models have assumed a continuous target medium in order to predict the performance of
the penetrator-target system, even in cases where the target is composed of concrete, foam or a
granular porous medium such as sand. Continuum models fail to capture the complicated grain
level response within the heterogeneous target which can result in asymmetric loading of the
projectile leading to variations in projectile performance. In this work a series of experiments were
conducted in order to investigate the penetration dynamics of loose sand, specifically with a goal
of building a better understanding of the grain level dynamics. High speed photography coupled
with a particle image velocimetry (PIV) technique were used to capture both the grain level and
bulk response of the penetration event. Experiments were conducted over a velocity range of 30
to 100 m/s using both cylindrical and spherical projectiles. The results indicate that variations in
the projectile size and shape effect cavity formation and that cavity formation occurs nearly 25
times slower than the projectile velocity.
方案详情

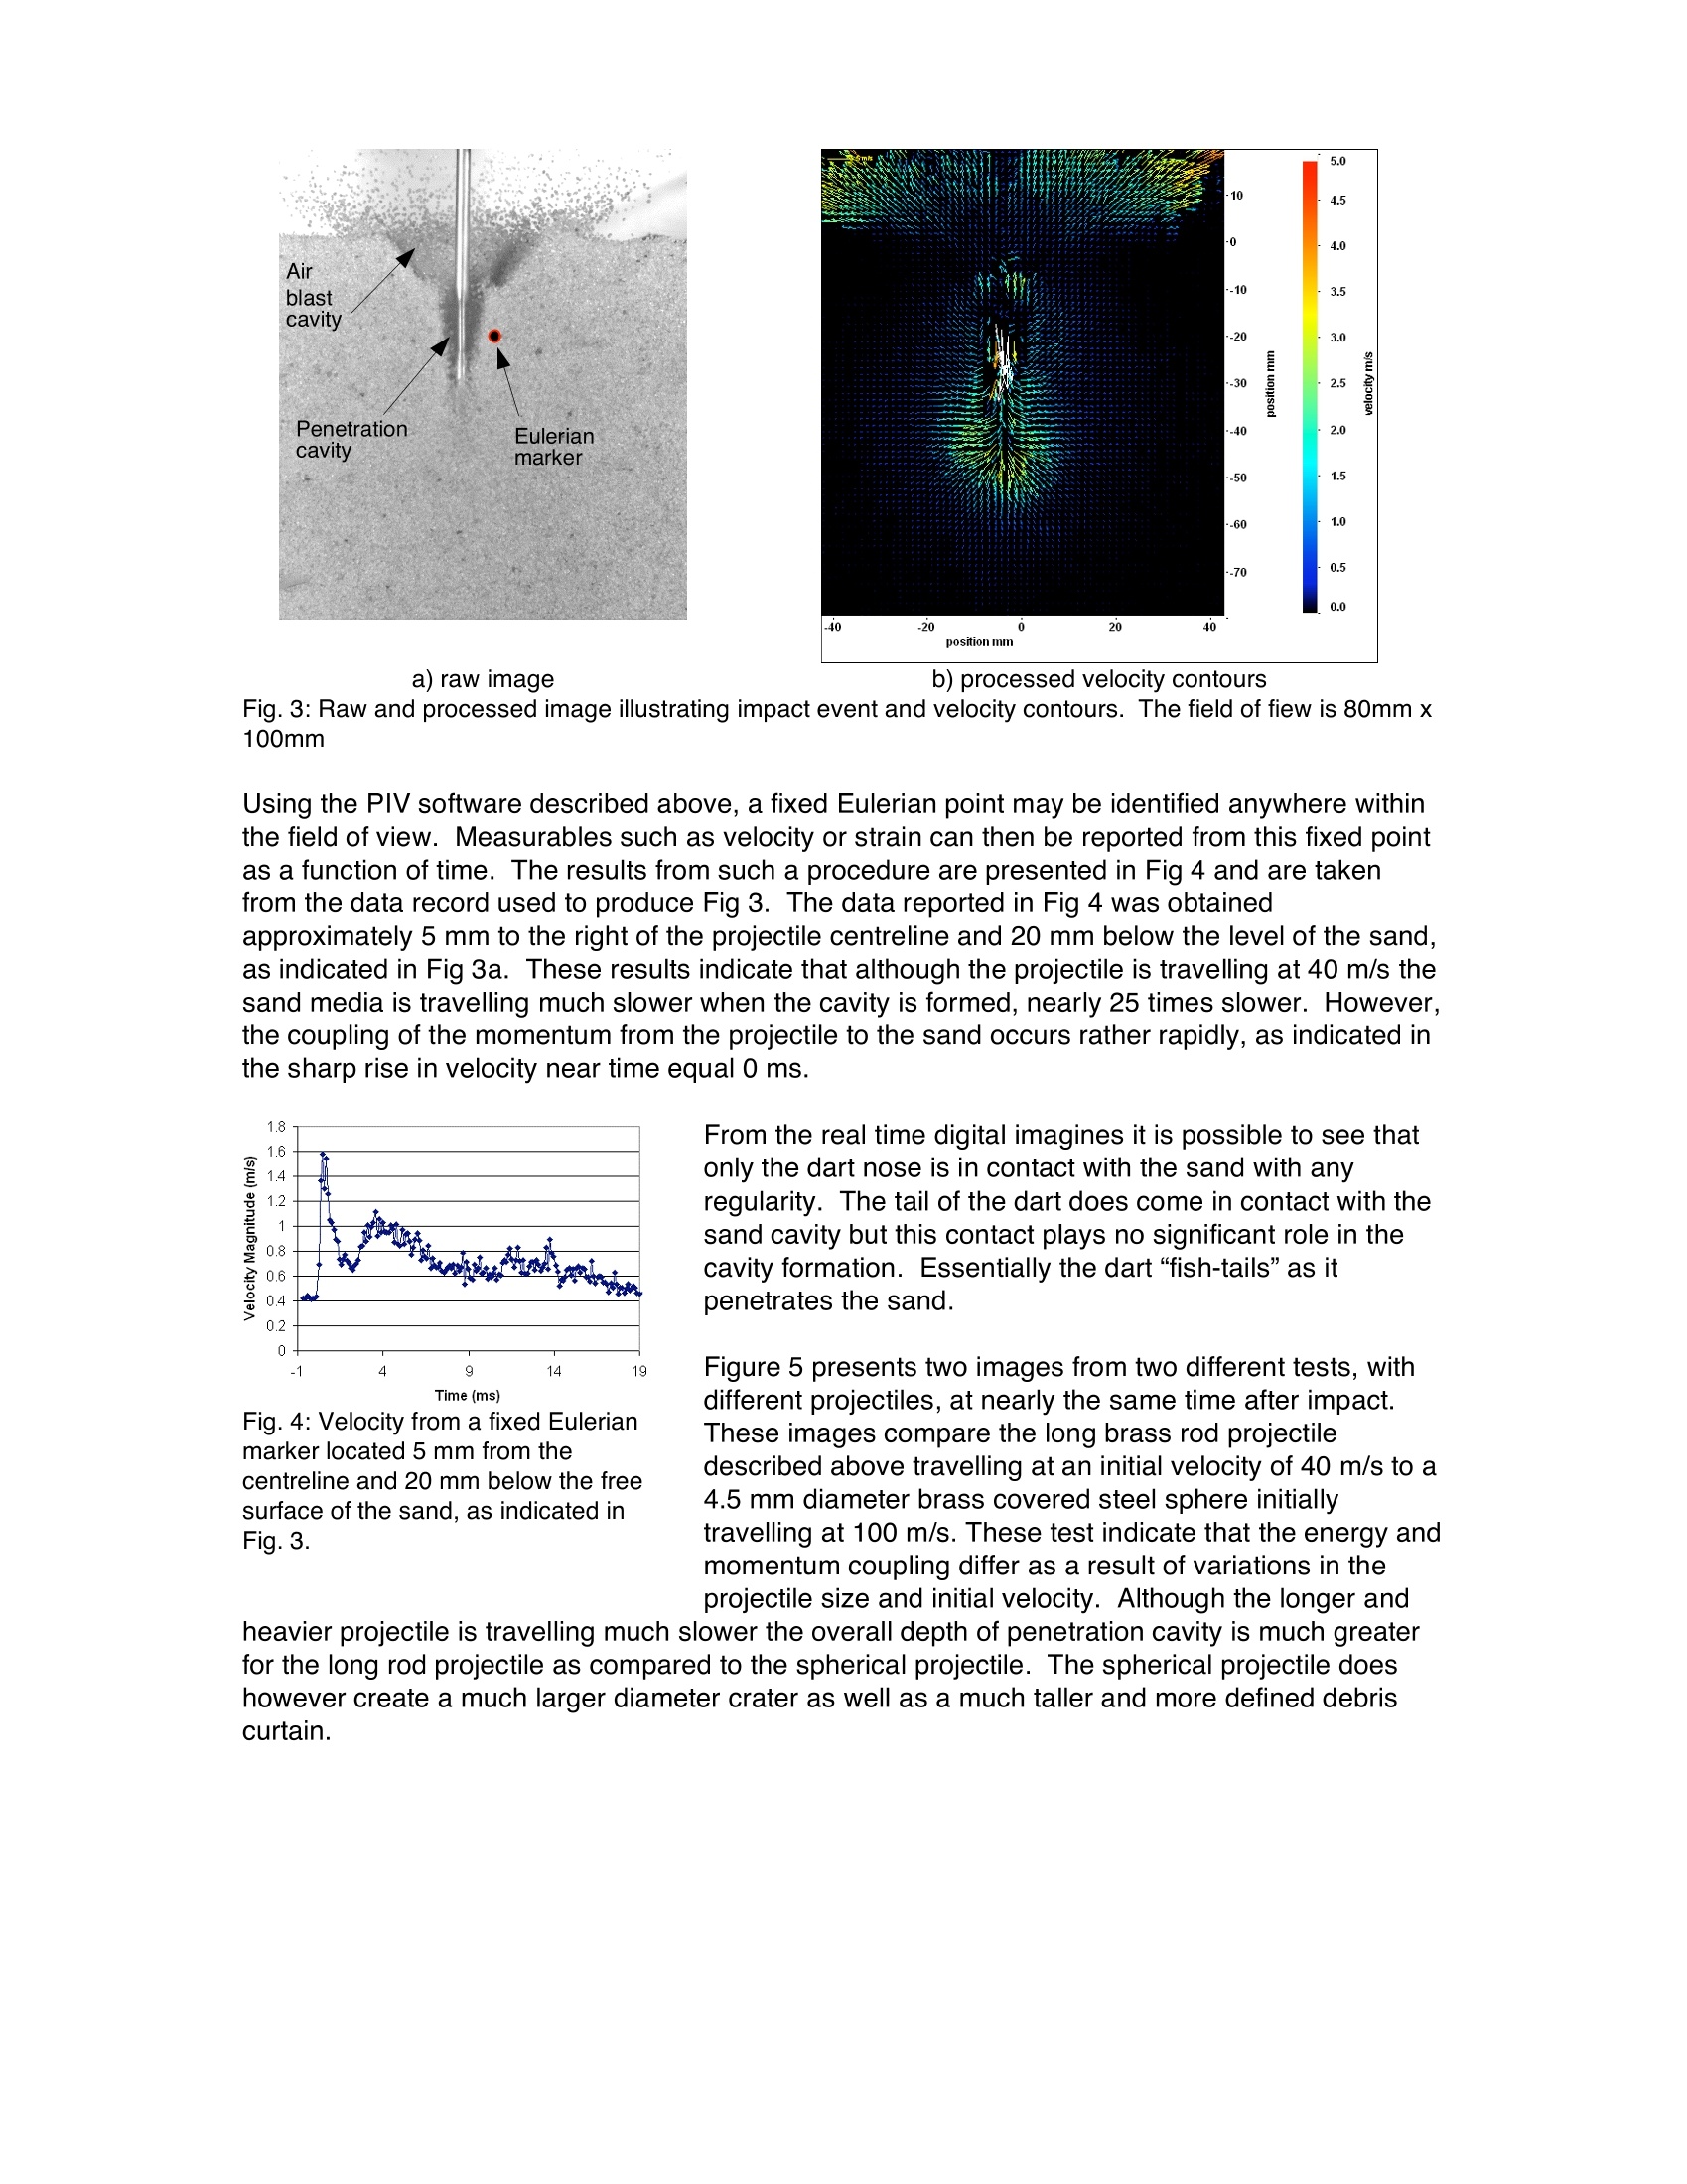
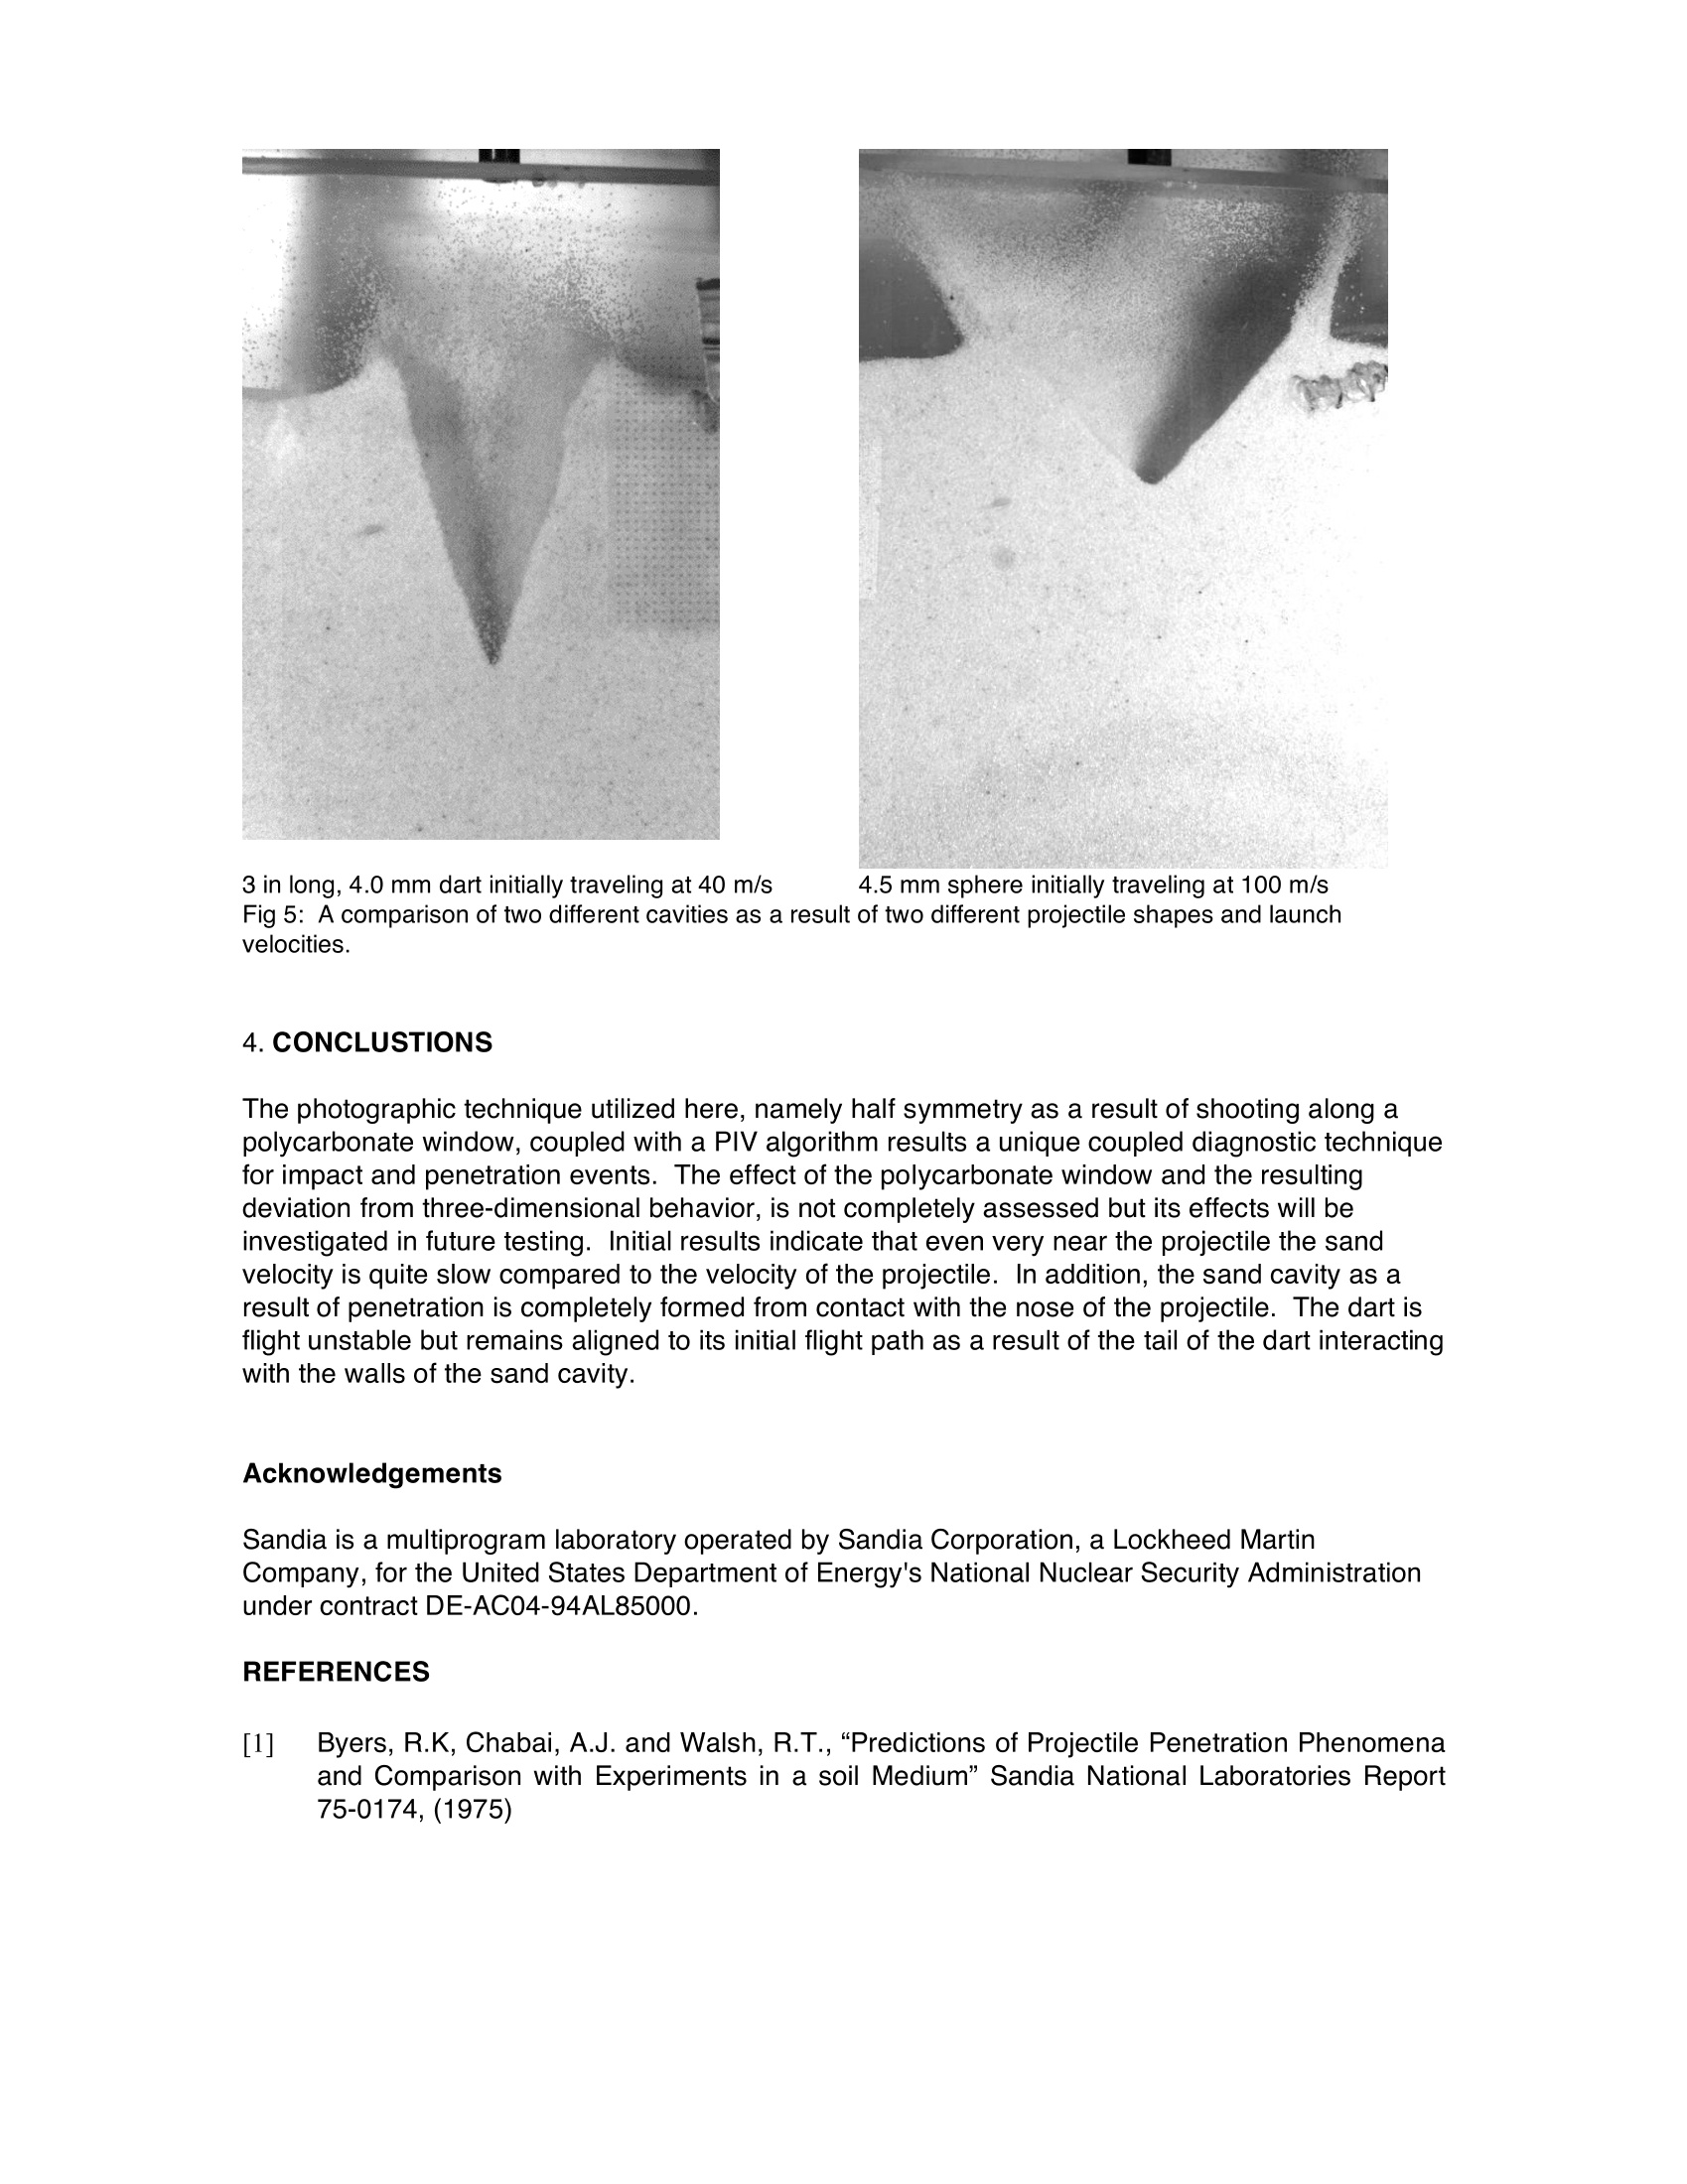
Proceedings of the XIth International Congress and ExpositionJune 2-5, 2008 Orlando, Florida USAC2008 Society for Experimental Mechanics Inc. An Experimental Investigation of the a High Velocity ProjectilePenetrating Sand John P. Borgand Tracy J. Vogler’ ·Department of Mechanical Engineering, Marquette University, 1515 W. Wisconsin Ave, Milwaukee, WI 53233 USA, john.borg@marquette.edu Sandia National Laboratories, M.S. 1181, Albuquerque NM, 87185 USA ABSTRACT The dynamics associated with a long rod projectile, travelling at high velocity, penetrating aheterogeneous target has long been an active research area. Historically both analytic andnumeric models have assumed a continuous target medium in order to predict the performance ofthe penetrator-target system, even in cases where the target is composed of concrete, foam or agranular porous medium such as sand. Continuum models fail to capture the complicated grainlevel response within the heterogeneous target which can result in asymmetric loading of theprojectile leading to variations in projectile performance. In this work a series of experiments wereconducted in order to investigate the penetration dynamics of loose sand, specifically with a goalof building a better understanding of the grain level dynamics. High speed photography coupledwith a particle image velocimetry (PIV) technique were used to capture both the grain level andbulk response of the penetration event. Experiments were conducted over a velocity range of 30to 100 m/s using both cylindrical and spherical projectiles. The results indicate that variations inthe projectile size and shape effect cavity formation and that cavity formation occurs nearly 25times slower than the projectile velocity. 1. INTRODUCTION The penetration dynamics associated with a projectile launched into a heterogeneous target havelong been of interest and remain an active research area. Experimental investigations havedemonstrated a wide variety of behaviors of solid projectiles against various heterogeneousmaterials such as soil [1-4], sand [5-8], concrete [9-12],and a variety of laminated and/orcomposite materials. Of interest in the current study is to explore novel experimental techniques,which can be used to assess the projectile target interaction and gain a better understanding of theoverall cavity formation and penetration event. Recent simulations [13] were conducted in order toassess the variability in performance associated with a brass rod (3.2 mm diameter and 7.6 cmlong) travelling at approximately 40 m/s into a large container of dry Ottawa sand. Results indicatethat small variability in the target material result can result in large variation in depth of penetration.In similar experiments the performance of a projectile demonstrated sensitivity to other system characteristics such as boundary condition [5], obliquity and projectile nose profiles [6,14]. Thuslarge scale dart behavior, such as penetration depth or deviation from the shot line trajectory, issensitive to small scale variations within the test. Penetration experiments have led to a widevariety of modeling techniques in order to predict various aspects of a projectile's performance.Reviews of penetration dynamics can be found in Zukas, et. al.[15] and Orphal [16]. 2. EXPERIMENTAL SETUP Experiments were conducted in order to assess penetration and performance of a long brass rod(3.2 mm diameter and 7.6 cm long) launched from a gas gun at approximately 40 m/s into a largetarget tank containing dry Ottawa sand (0.45-0.55 mm effective diameter, average bulk density:1.56 g/cm). The projectile was constructed from machine brass and contained two brass ringswhich where used as compression rings and guides. The nose of the projectile was full diameterand flat and 1.5 cm from noise the dart also contained a turndown middle section approximately1.5 cm long. The target tank was constructed with 1.9 cm thick polycarbonate (i.e. bullet proof glass) in order togain visual access to the impact event. Careful alignment of the gun barrel and target tank insuredthat the projectile remained in near contact with the polycarbonate window throughout thepenetration event. In so doing the impact and penetration event, including the cavity formationcould be photographed in real time. The objective was to gain visual access to this three-dimensional event and produce two-dimensional cross-sections of this event. Since theimpedance of the sand and polycarbonate are similar it is hoped that the effects of the widow areminimized. These effects will be investigated further in future work. Images were obtained with aPhotron RS CMOS high speed digital camera. Typically images where obtained at a frameinterval of 200 ps and have a pixel resolution of 512 x 1024; the cameras have enough onboardmemory to store nearly 2 seconds of data at these acquisition rates. Fig. 1: Schematic of proposed test configurationfor directly observing a two-dimensional view of animpact of a geological sample. Particle Image Velocimetry (PIV) Classic particle image velocimetry (PIV)techniques measures entire velocity fields bytaking two successive images and calculating thedistance individual particles travelled within thistime. From the known time difference and themeasured displacement, the velocity iscalculated. The techniques utilized in this workare similar except that instead of tracingindividual particles and velocities, the image fieldof view is discretized into interrogation windows,typically 12x 12 pixels in size. A characteristicvelocity is then assigned to all the materialcontained within the interrogation window. A characteristic velocity is determined by performing a spatial cross-correlation from two successiveimages for each discretized interrogation window, see Figure 2. The cross-correlation results in aspatial distribution of variance, however only the peak value is retained. This peak valuecorresponds to the spatial shift, or bulk motion (distance) the material has travelled from one frameto the next. By knowing the inter-frame time the bulk velocity can be determined. The PIV datareduction technique described above is available in a commercial code entitled LaVision, a spinoffcompany from the Max Planck Institute and Laser Laboratory in Goettingen, Germany. Fig 2: Particle Image Velcemitry (PIV) uses a cross-correlation ofmaterial distributions within successive interrogation windows toproduce a single characteristic velocity. 3. RESULTS Over the course of this test series approximately 30 test shots were executed. The averagepenetration depth over all the tests was 20.5 cm or approximately 4 rod lengths. Figure 3 presentsa side-by-side comparison of a single digital image of the penetration event as well as thecorresponding processed PIV image of the resulting velocity field, where the color representsvelocity magnitude. Starting from the top of the image, above level of the sand, there is quite a bitof"splash-back"as a result of initial impact. The velocity associated with this splash-back sand iseasily detectable and measured by the PIV technique. Just below the splash-back one sees arather large cavity which is formed before the arrival of the projectile and is the result of the airblast. Below this the projectile creates an initially thin cavity which corresponds to the penetrationevent itself. Within Figure 3a the dart is easily visible, the corresponding dart velocity is approximately 40 m/sin this image, having just begun its penetration. Since the dart is rather smooth and shinny, thePIV algorithm has difficulty identifying the overall bulk velocity of the dart. This is true of all PIVsimilar techniques: without distinguishing features,i.e. features smaller than the interrogationwindow, the cross-correlation is noisy. However the velocity of smaller features, smaller than thecross-correlation interrogation window utilized within the PIV techniques, are readily measurable.One example is the front turned shoulder near the leading edge of the dart. The PIV has identifiedlarge velocity vectors in this region corresponding the flight velocity of the dart but are indicated inwhite due to clipping of the color legend. In addition one can easily identify large velocitydistributions imparted into the sand in front of the projectile. This coupling is of special interest tothe research presented here in that this velocity represents the coupling process by whichmomentum is imparted into the sand bed before the arrival of the projectile. a) raw image o) processed velocity contours Fig. 3: Raw and processed image illustrating impact event and velocity contours. The field of fiew is 80mm x100mm Using the PIV software described above, a fixed Eulerian point may be identified anywhere withinthe field of view. Measurables such as velocity or strain can then be reported from this fixed pointas a function of time. The results from such a procedure are presented in Fig 4 and are takenfrom the data record used to produce Fig 3. The data reported in Fig 4 was obtained approximately 5 mm to the right of the projectile centreline and 20 mm below the level of the sand,as indicated in Fig 3a. These results indicate that although the projectile is travelling at 40 m/s thesand media is travelling much slower when the cavity is formed, nearly 25 times slower. However,the coupling of the momentum from the projectile to the sand occurs rather rapidly, as indicated inthe sharp rise in velocity near time equal 0 ms. Time(ms) Fig. 4: Velocity from a fixed Eulerianmarker located 5 mm from thecentreline and 20 mm below the freesurface of the sand, as indicated inFig.3. From the real time digital imagines it is possible to see thatonly the dart nose is in contact with the sand with anyregularity. The tail of the dart does come in contact with thesand cavity but this contact plays no significant role in thecavity formation. Essentially the dart “fish-tails”" as itpenetrates the sand. Figure 5 presents two images from two different tests, withdifferent projectiles, at nearly the same time after impact.These images compare the long brass rod projectiledescribed above travelling at an initial velocity of 40 m/s to a4.5 mm diameter brass covered steel sphere initiallytravelling at 100 m/s. These test indicate that the energy andmomentum coupling differ as a result of variations in theprojectile size and initial velocity. Although the longer and heavier projectile is travelling much slower the overall depth of penetration cavity is much greaterfor the long rod projectile as compared to the spherical projectile. The spherical projectile doeshowever create a much larger diameter crater as well as a much taller and more defined debriscurtain. 3 in long, 4.0 mm dart initially traveling at 40 m/s 4.5 mm sphere initially traveling at 100 m/sFig 5: A comparison of two different cavities as a result of two different projectile shapes and launchvelocities. 4. CONCLUSTIONS The photographic technique utilized here, namely half symmetry as a result of shooting along apolycarbonate window, coupled with a PlV algorithm results a unique coupled diagnostic techniquefor impact and penetration events. The effect of the polycarbonate window and the resultingdeviation from three-dimensional behavior, is not completely assessed but its effects will beinvestigated in future testing. Initial results indicate that even very near the projectile the sandvelocity is quite slow compared to the velocity of the projectile. In addition, the sand cavity as aresult of penetration is completely formed from contact with the nose of the projectile. The dart isflight unstable but remains aligned to its initial flight path as a result of the tail of the dart interactingwith the walls of the sand cavity. Acknowledgements Sandia is a multiprogram laboratory operated by Sandia Corporation, a Lockheed MartinCompany, for the United States Department of Energy's National Nuclear Security Administrationunder contract DE-AC04-94AL85000. REFERENCES [1] Byers, R.K, Chabai, A.J. and Walsh, R.T., “Predictions of Projectile Penetration Phenomenaand Comparison with Experiments in a soil Medium”Sandia National Laboratories Report75-0174,(1975) ( [2] Bernard, R. S. and D .C. Creighton“Projectile penetration in Soil and Rock: Analysis for Non-Normal Impact,” US A rmy Engineer C o rp of Engineers Waterways Experiment Sta t ion,Technical Report S L-79-15 (1979) ) [3] Richmond, P.W.“Influence of Nose Shape and L/D Ratio on Projectile penetration in FrozenSoil,” US Army Cold Regions Research and Engineering Laboratory, Special Report 80-17(1980) ( [4] Forrestal, M.J., and V. K. L uk“Penetration into soil t a rgets,”Int. J. Impact Eng., 12, 427-444, 1992 ) ( [5] W.A. A llen, E.B. Mayfield and H.L. Morrison“Dynamics of a Projectile Penetrating Sand,”J.Appl. Physics 28(3), 370-376 ( 1957). ) ( [6] W.A. Allen, E.B. Mayfield and H .L. M orrison“Dynamics of a Projectile Penetrating S a nd.Part II,”J. Appl. Physics 28(11), 1 331-1335 (1957). ) ( [7] Wang W.L.“E x perimental Stud y of Projectile Penetration in O t tawa Sand at Low Velocities",Journal of Spacecraft and Rockets,vol.6 n o.4 497-498. (1969) ) ( [8] Savvateev A.F. Budin A . V. Kolikov V.A. a n d Rutberg P.G. “Hi g h-speed pene t ration intosand,”International journal of impact engineering.26(1),675-681, ( 2 001) ) ( [9] Yankelevsky, D. Z., “ Local response of concrete slabs to low velocity missile impact."In t . J . Impact Eng., (19)4,331-343.1997. ) ( [10] Corbett, G. G., Reid, S. R. , and Johnson, W . 1 996.“Impact loading o f plates a nd shells byfree-flying projectiles: A review." Int. J . Impact Eng., 18,141-230. ) ( [111 Forrestal et al . “An empirical equation f or penetration d epth of ogive-nose p r ojectiles i ntoconcrete targets." Int. J . Impact Eng. 15 (4) (1994 ) 395-405 ) |121 Gran and Frew “In-target radial stress measurements from penetration experiments intoconcrete by ogive-nose steel projectiles”, Int. J. Impact Eng. 19 (8) (1997) 715-726 131 Borg, JP and Vogler, TJ., Mesoscale Simulations of a Dart Penetrating Sand. Int. J. ImpactEng., in press. ( [141 Rosenberg, Z . and Dekel, E. “ O n the role of nose profile in long-rod p e netration."International Journal o f Impact Engineering Volume 22, Issue 5 , May 1999, Pages 551-557 ) ( 151 Zukas, J .A. Nicholas, T . Swift, H.F. Greszczuk L . B. a n d Cu r ran, D. R ., Impact Dy n a mics, Kriger Publishing Company (1992). ) [16]Orphal. D.L.“Explosions and impacts”Int.J.Impact Eng.. 33,(1-12),496-545,2006
确定

还剩4页未读,是否继续阅读?

产品配置单

北京欧兰科技发展有限公司为您提供《沙层中速度场,速度矢量场检测方案(粒子图像测速)》,该方案主要用于其他中速度场,速度矢量场检测,参考标准--,《沙层中速度场,速度矢量场检测方案(粒子图像测速)》用到的仪器有时间分辨粒子成像测速系统(TR-PIV)、LaVision HighSpeedStar 高帧频相机
推荐专场


相关方案
更多
该厂商其他方案
更多