


方案详情
文
We study experimentally the impulse response of a cylinder wake below the critical Reynolds
number of the Bénard–von Kármán instability. In this subcritical regime, a localized inhomogeneous
region of convective instability exists which causes initial perturbations to be transiently amplified.
The aim of this work is to quantify the evolution resulting from this convective instability using
two-dimensional particle image velocimetry in a hydrodynamic tunnel experiment. The velocity
fields allow us to describe the evolution of wave packets in terms of two control parameters: the
Reynolds number and the magnitude of the imposed perturbation. The temporal evolution of energy
exhibits a transient algebraic growth at short times followed by an exponential decay.
方案详情

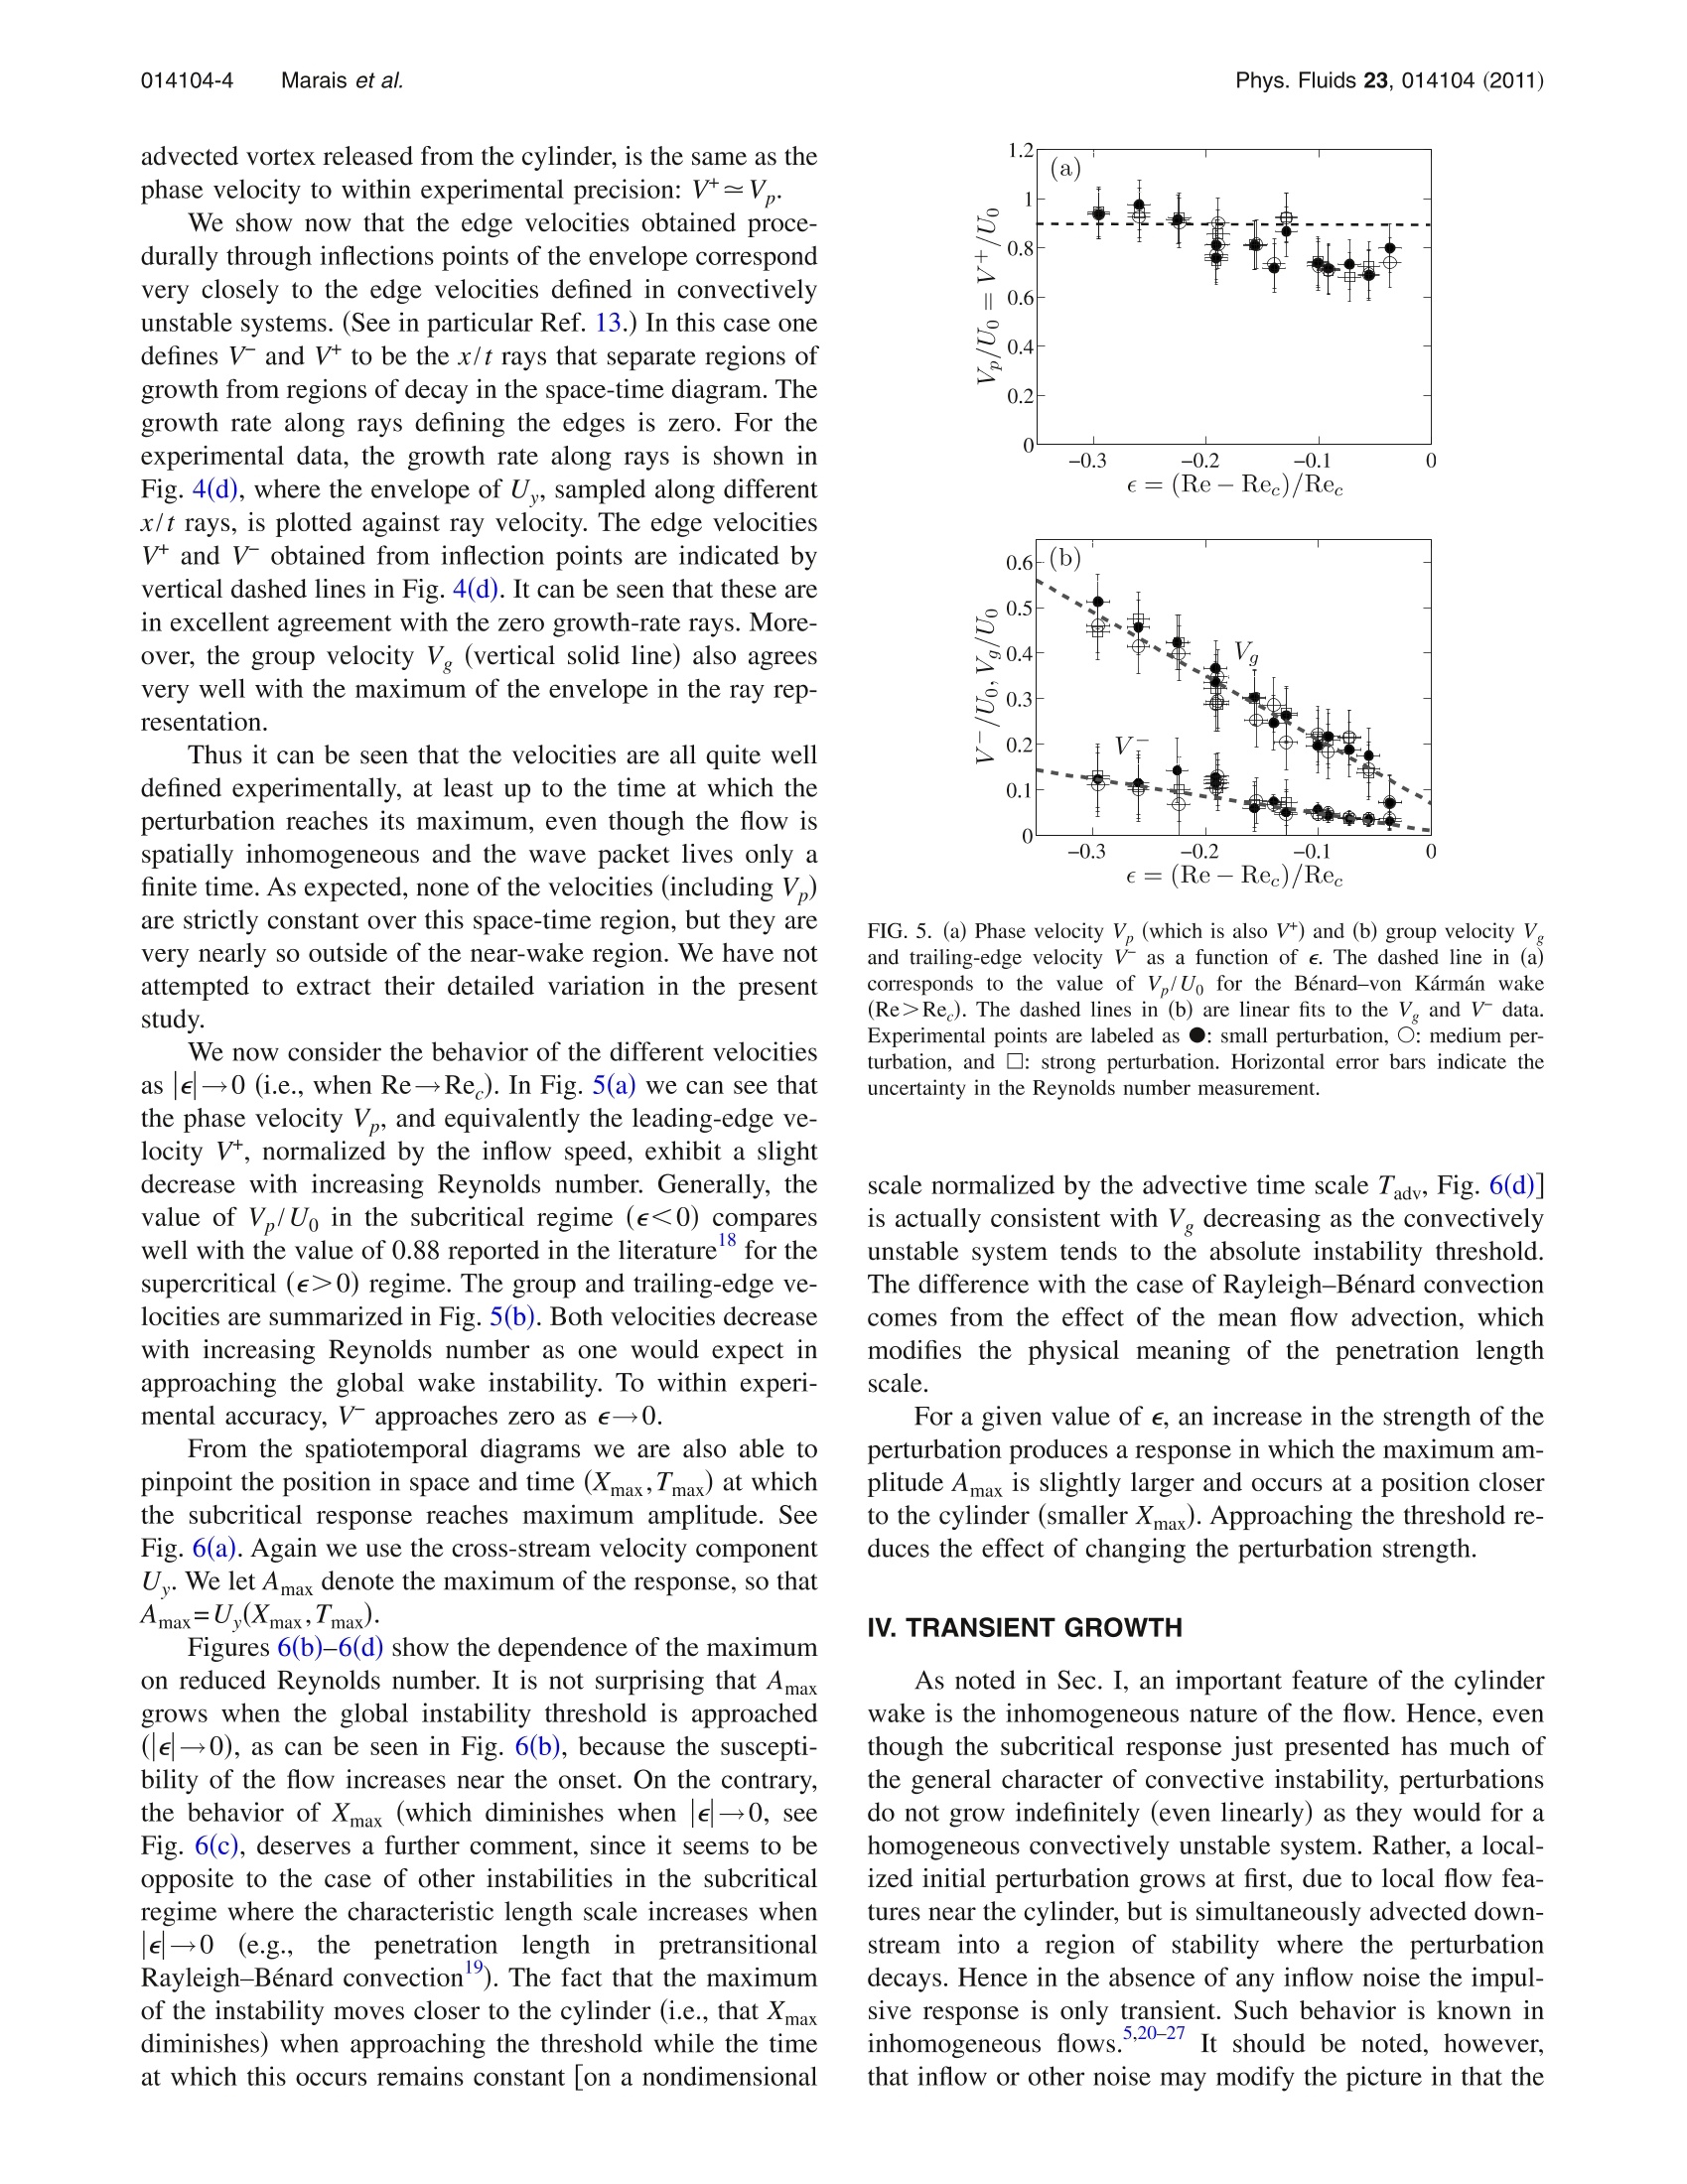
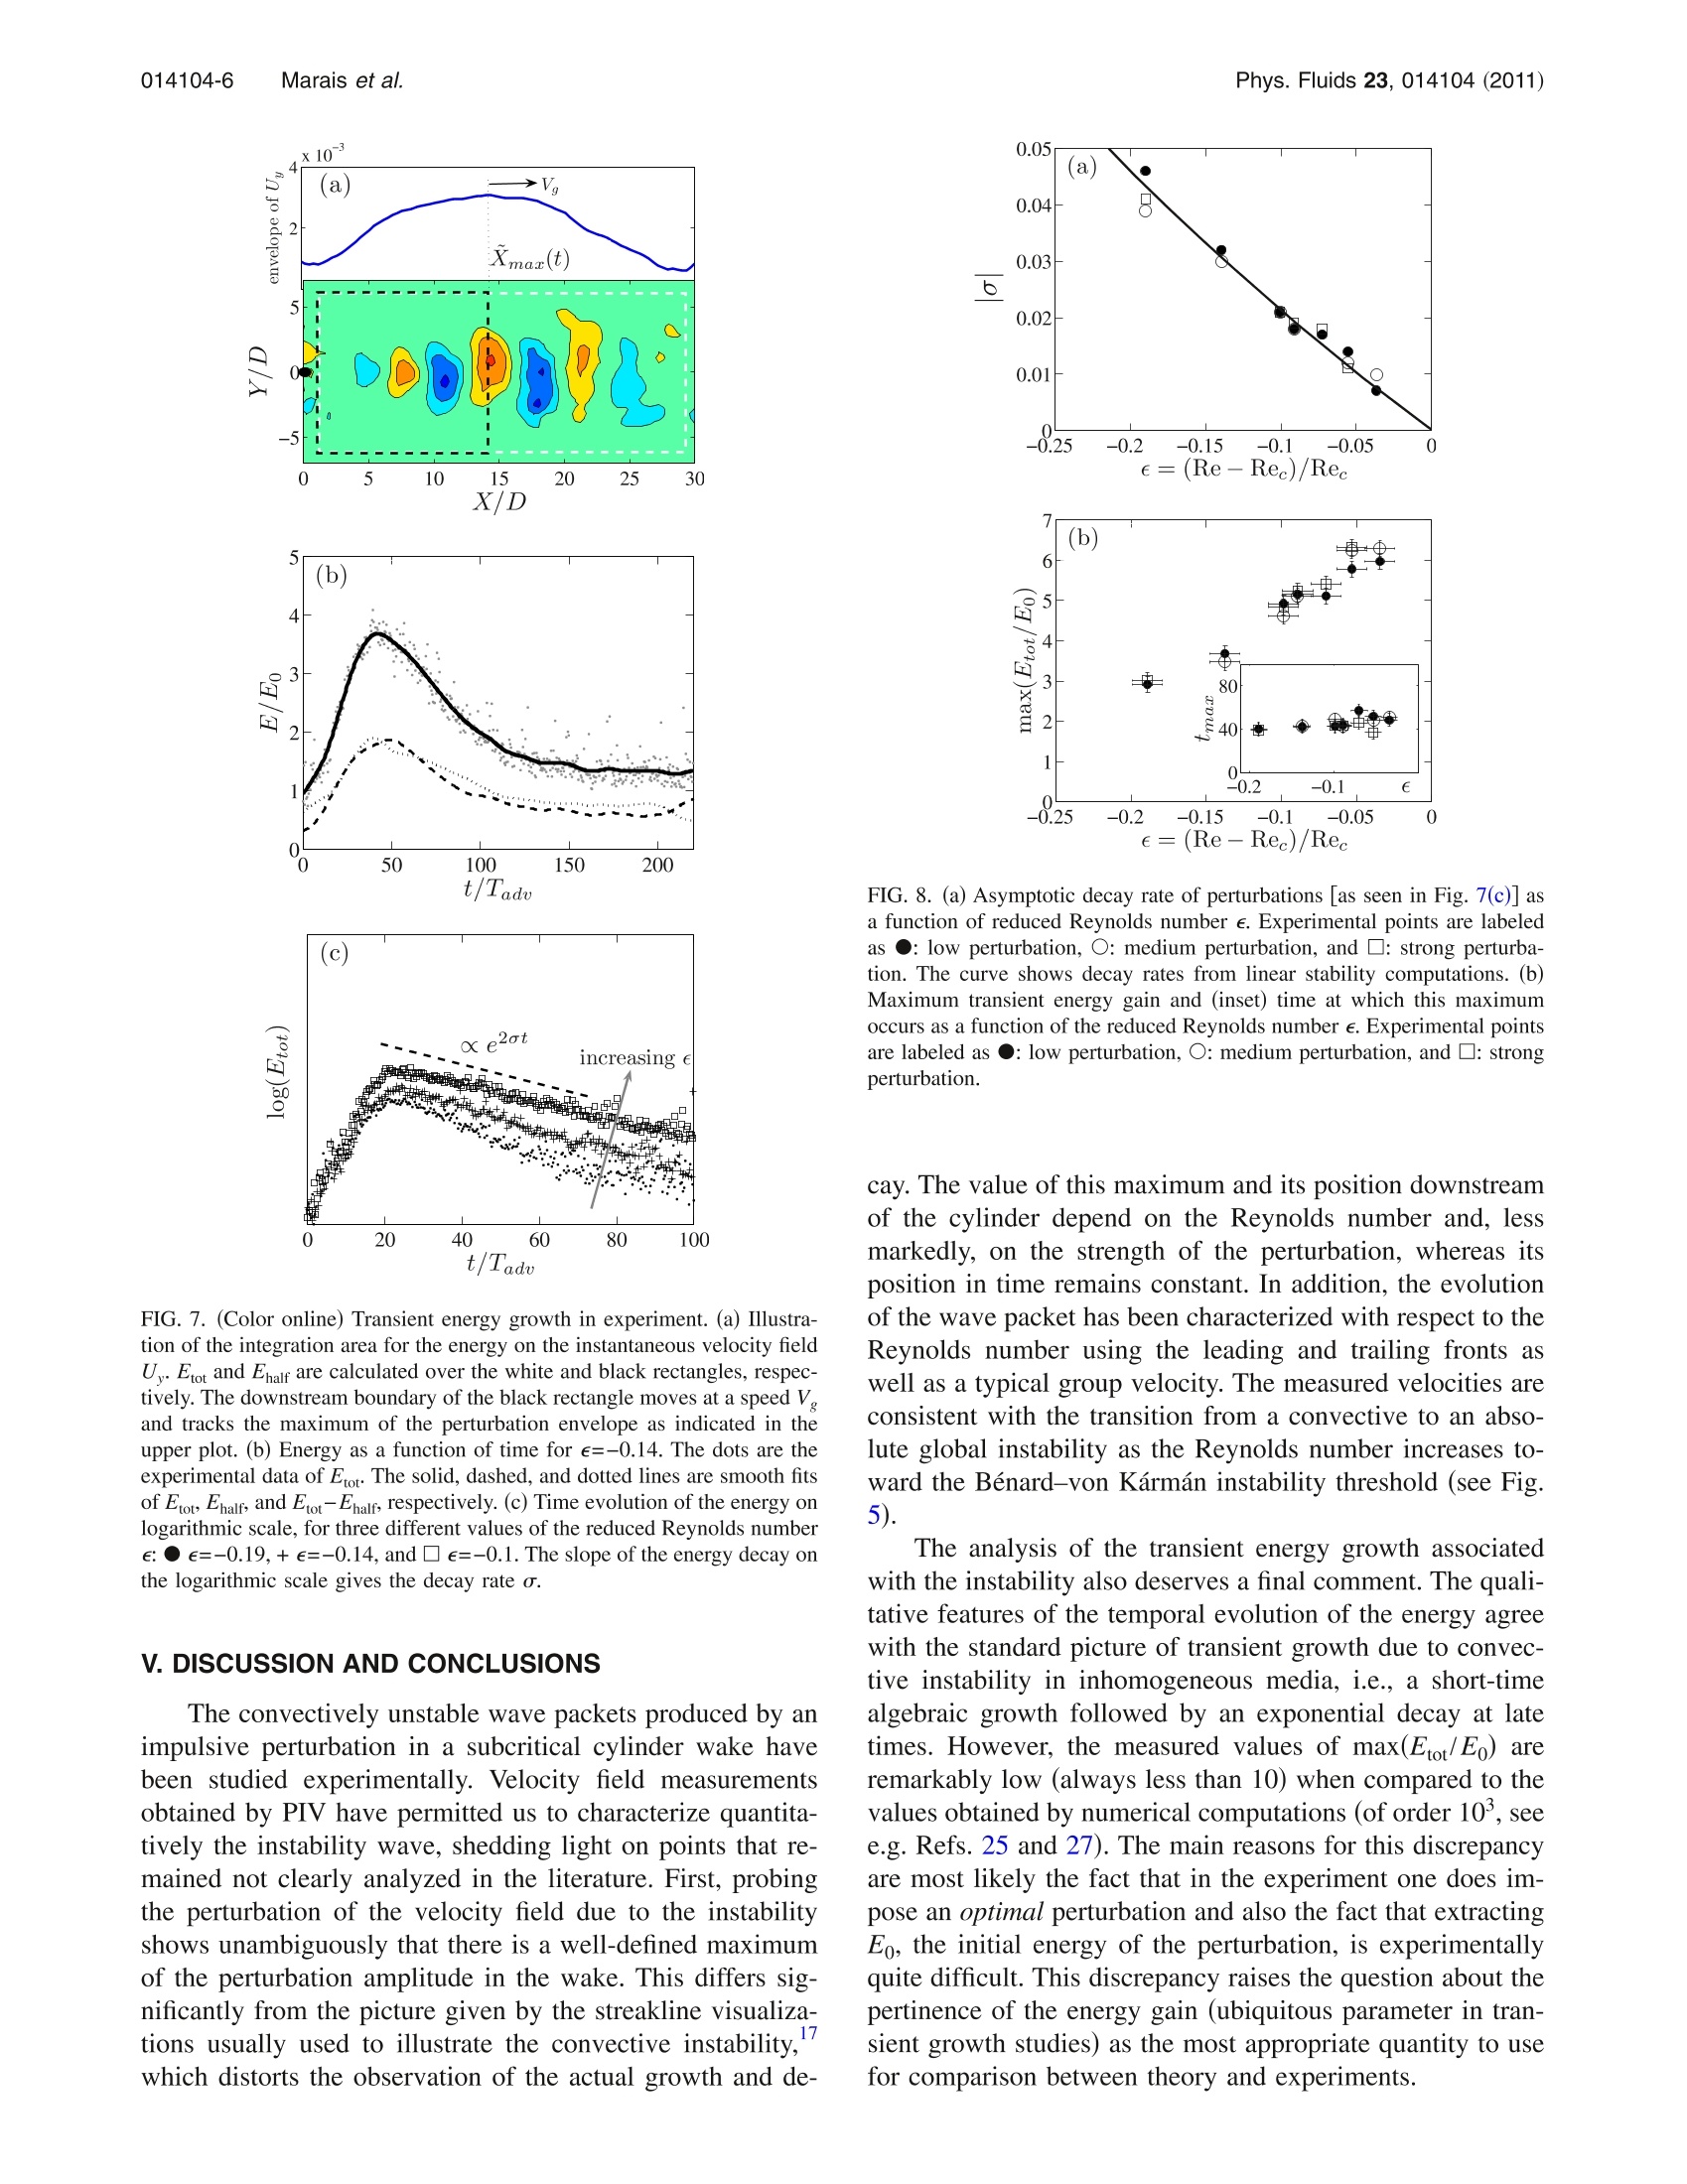
PHYSICS OF FLUIDS 23, 014104 (2011) Phys. Fluids 23, 014104 (2011)014104-2 Marais et al. C 2011 American Institute of Physics23,014104-11070-6631/2011/23(1)/014104/7/$30.00 C. Marais, R. Godoy-Diana,1,a) D. Barkley,and J. E. Wesfreid' 'PMMH, UMR7636 CNRS,ESPCI ParisTech, UPMC, University Denis Diderot, 10 rue Vauquelin,75005 Paris, France Mathematics Institute, University of Warwick, Coventry CV4 7AL, United Kingdom (Received 20 May 2010; accepted 17 November 2010; published online 11 January 2011) We study experimentally the impulse response of a cylinder wake below the critical Reynoldsnumber of the Benard-von Karmán instability. In this subcritical regime, a localized inhomogeneousregion of convective instability exists which causes initial perturbations to be transiently amplified.The aim of this work is to quantify the evolution resulting from this convective instability usingtwo-dimensional particle image velocimetry in a hydrodynamic tunnel experiment. The velocityfields allow us to describe the evolution of wave packets in terms of two control parameters: theReynolds number and the magnitude of the imposed perturbation. The temporal evolution of energyexhibits a transient algebraic growth at short times followed by an exponential decay. 2011 American Institute of Physics. [doi:10.1063/1.3531724 I. INTRODUCTION Flow past a circular cylinder is a classic prototype forstudying hydrodynamic instabilities and bifurcations in sepa-rated flows.1-Moreover, the academic case of a two-dimensional cylinder wake can be used as a basic model formany real situations, including the flow behind supportcables or around an airfoil. When the Reynolds numberRe=UD/u (where Uo is the free-stream velocity, Dis thecylinder diameter, andv is the kinematic viscosity) reaches aparticular critical value (Re~47 for an infinitely longcylinder2), a sustained periodic shedding of opposite-signedvortices gives rise to the well-known Benard-von Karmánvortex street. The transition to sustained oscillations can be describedlocally, via wake profiles at different spatial stations, or glo-bally, viewing the two-dimensional (2D) wake as whole. Toelaborate further, we first recall the standard distinction be-tween convective and absolute instabilities in parallel flowsillustrated in Figs. 1(a) and 1(b). An instability is convectiveif a perturbation grows but is simultaneously advected withthe flow such that the disturbance decays at any fixed point,as in Fig. 1(a), while it is absolute if the perturbation growsat a fixed spatial position, as in Fig. 1(b).-10 A useful way todistinguish convective from absolute instability is in terms ofpropagating edge or front velocities: assuming a positiveleading-edge velocity V, as is the case here, convective in-stability corresponds to a positive trailing-edge velocity V-,while absolute instability corresponds to a negative trailing-edge velocity.13 Local analysis of wake profiles, i.e., a parallel flow ap-proximation, gives a picture of the transition to sustainedoscillations as follows.4,13,14 Above Re=5 there is a localregion of convectively unstable flow in the wake. AboveRe=25 there is additionally a pocket of absolutely unstable ( "Electronic mail: ramiro@pmmh.espci.fr. ) flow within the region of convective instability. Once thepocket of absolutely unstable flow becomes sufficientlylarge, the flow becomes globally unstable. Globally, how-ever, one does not observe the onset of a locally absolutelyunstable region. Instead, one finds that below Re, the wakeresponds to perturbations, but only transiently, as perturba-tions are advected through the system. This is illustrated inFig. 1(c). Above Re, as in Fig. 1(d), perturbations grow andlead to a synchronized wake in the formation of what iscalled a global mode.15'Hence, even though convective andabsolute instabilities are strictly defined for parallel flowsand streamwise periodic flowwss ,9,10,16?inhomogeneous flows,such as flow past a cylinder, may exhibit similar characteris-tics. The transient response in the subcritical regime has thehallmarks of convective instability while the global instabil-ity above Re, has the hallmarks of absolute instability. Despite the large body of work on the cylinder wake,only a few experimental studies have examined the wake’ssubcritical behavior and none have quantitatively charac-terized the transient dynamics in this regime. The goal of thepresent paper is therefore to analyze quantitatively the sub-critical regime using a well-controlled experiment. After describing the experimental setup, we focus firston the evolution of amplified wave packets and on obtainingthe leading-edge, trailing-edge, and group velocities in anexperimental setting. The decrease of trailing-edge velocitytoward zero when approaching the global instability thresh-old confirms the transition to an absolute instability. The sub-critical behavior is further characterized in terms of the evo-lution of the maximum amplitude of the wave packet, and itsspace-time position, as a function of the strength of the per-turbation and the distance to the Benard-von Karman insta-bility threshold. Finally, to quantify the transient growth phe-nomenon due to the inhomogeneity of the media, we analyzethe temporal evolution of the energy of the perturbation. space FIG. 1. Sketch of the space-time response of flows to infinitesimal pertur-bations. (a) and (b) correspond to local analysis, i.e., parallel flows, illus-trating the distinction between (a) convective and (b) absolute instabilities.The leading-edge velocity V* is positive in both cases. For convective in-stability, the trailing-edge velocity V is also positive, while for absoluteinstability it is negative. (c) and (d) correspond to the global wake illustrat-ing the distinction between the (c) subcritical, ReRe, cases. In the subcritical case, the perturbation reaches a maxi-mum and subsequently decays. In the supercritical case the perturbationcontinues to grow until it saturates nonlinearly. The edge velocities can beobtained over finite times only in experiment (see Sec. II). II. EXPERIMENTAL SETUP A cylinder of diameter D=5 mm is placed in a hydro-dynamic tunnel of section 100 mm×100 mm (see Fig.2)with a nearly plug flow in the test section. The boundarylayer width in the tunnel walls is of ~10 mm in the regionof interest. The cylinder span is 98 mm which covers prac-tically the whole height of the tunnel. We use a Cartesiancoordinate system, placed in the cylinder center, with thex-axis pointing in the flow direction and the z-axis runningalong the cylinder centerline. The cylinder can be put intorotationntoprovide impulse perturbationssMto the flow.Measurements are taken in the horizontal midplane of thechannel. We define and work with the reduced Reynolds numbere=(Re-Re,)/Re, corresponding to the distance from theglobal instability threshold. The critical Reynolds numbermeasured in this experiment is Re~64, which is larger thanthe ideal 2D case, primarily due to confinement and blockageeffects. We adjust the Reynolds number in the experiment bycontrolling the flow rate in the tunnel. In the results thatfollow, e varies from -0.30 to -0.04. For this range ofReynolds numbers, the flow remains 2D over nearly the en-tire cylinder span. Impulse perturbations consist of applying very short ro-tary motions to the cylinder. Rotation is controlled by a pro-grammable microstepping electronic module which gives aresolution of 1/256 per full step, allowing for a precise con-trol of the cylinder motion. In the present work, we fix thenondimensional time interval over which the cylinder is ro-tated, and use the speed of rotation as the amplitude of theperturbation. More specifically, the perturbation amplitude isdefined from the tangential speed of rotation at the cylindersurface U, (see Fig. 2). We consider three perturbation am-plitudes given by three values of the nondimensional rotationspeed: U,/Uo=75, 100, and 125, which we refer to as small,medium, and strong, respectively. Uo is the measuredvelocity of the flat profile. The small-amplitude perturbation (a) X (b) FIG. 2. (a) Schematic diagram of the experimental setup in the hydrody-namic tunnel. (b) Sketch showing a top view of the cylinder during animpulsive rotation of intensity U. is the smallest perturbation that produced an observable re-sponse in the wake. For all applied perturbations,the cylin-der is rotated for a fix dimensionless duration given byAt/Tady~0.2, where At is the dimensional duration of theperturbation and Tady=DIU. Note that since Uo varies withReynolds number, both the dimensional tangential speed U,and the dimensional duration At vary with Reynolds number. The wave packet generated by the perturbation can beobserved qualitatively by visualizing streaklines, as in thework of Ref. 17. Figure 3 shows this type of visualizationcompared with snapshots of the cross-stream component ofthe velocity field obtained by 2D particle image velocimetry(PIV) in the horizontal midplane. This highlights a signifi-cant difference between the present experiment and previousstudies of the subcritical wake response. Velocity field mea-surements obtained by PIV permit oneto study directly thespatial structure of velocity perturbations as they evolve. Thevelocity perturbations exhibit a well-defined maximum in thewake. These are impossible to determine from streaklinerecords since the deformation amplitude of injected dyenever decays downstream, an artifact caused by mass conser-vation of the dyed fluid. Therefore, streakline deformationdoes not give information about the amplitude of the velocityfluctuations U, and thus about the spatial evolution of theimpulse response. PIV acquisition and postprocessing havebeen performed using a LaVision system with an ImagerPro1600×1200 charge-coupled device camera with a 12-bitdynamic range capable of recording double-frame pairs ofimages up to 15 Hz and a two rod Nd:yttrium aluminumgarnet (15 mJ) pulsed laser. The time lapse between twoframes is set to 20 ms. Finally, additional postprocessing andanalysis have been carried out with MATLAB and the PIVMATTOOLBOX. III. EVOLUTION OF THE WAVE PACKET The convective nature of the impulsively perturbed cyl-inder wake is clearly illustrated in the experimental datashown in Figs. 4(a) and 4(b). In Fig. 4(a), cross-stream ve-locity U, profiles, measured at successive times along the FIG. 3. (Color online) Visualization of the impulse re-sponse at three successive time instants (from bottom totop) in the cylinder wake. Left: streaklines obtainedfrom fluorescein dye visualization. Right: instantaneousvelocity fields obtainedfrom PIVmeasurements. wake symmetry axis y=0, are stacked up to form a spatio-temporal diagram. The cross-stream velocity on the symme-try axis is the ideal quantity to use to investigate the per-turbed flow field because it is everywhere zero for theunperturbed flow. Figure 4(b) is similar to Fig. 4(a) exceptthat the envelope [obtained through a Hilbert transform ofU,as illustrated in Fig.4(c)] is plotted. We measure a number of velocities associated with thespace-time evolution of the wave packets. From the Hilberttransform of the cross-stream velocity we are able to extract,at each time instant, the envelope of the wave packet asillustrated in Fig. 4(c). Procedurally, we define the leadingand trailing positions as the inflection points of hyperbolictangent fits to the relevant parts of the envelope at each time. Such fits, together with the associated inflection points, areincluded in Fig. 4(c). Then we obtain the leading-edge ve-locity V+ and the trailing-edge velocity V-from the collec-tion of fronts extracted from the envelopes at short times(≤50Tady). Likewise, we obtain the envelope maximum ateach time, and from these data, we define the group velocityV to be the velocity of envelope maximum, as this gives thespeed of the packet as a whole. These velocities are the in-verse of the slopes shown in the spatiotemporal diagram ofFig. 4(b). Finally, we define the phase velocity V, as thetranslation speed of the vortices in the evolving wave packetas seen in Fig. 4(a). Note that all vortices move at essentiallyidentical speed. Moreover, the leading-edge velocity V,which is effectively determined by the velocity of the first FIG. 4. (Color online) Evolution ofthe wave packet seen in spatiotempo-ral diagrams for e=-0.137. (a) Cross-stream velocity U,(x,t), (b) envelopeof U,(x,t), and (c)U,(x) and its enve-lope (bold dashed curve) at a fixedtime (t=24Tadv). Also shown (thincurves) are tanh fits to the relevantpart of the envelope. The infectionpoints and envelope maximum are in-dicated. (d) Envelope of U, sampledalong various rays as a function of rayvelocity. The edge and group veloci-ties,obtainedd1fromtlthiee inflectionpoints and envelope maxima, are indi-cated with vertical lines. advected vortex released from the cylinder, is the same as thephase velocity to within experimental precision: V+=V,. We show now that the edge velocities obtained proce-durally through inflections points of the envelope correspondvery closely to the edge velocities defined in convectivelyunstable systems. (See in particular Ref. 13.) In this case onedefines V and V* to be the x/t rays that separate regions ofgrowth from regions of decay in the space-time diagram. Thegrowth rate along rays defining the edges is zero. For theexperimental data, the growth rate along rays is shown inFig. 4(d), where the envelope of U,, sampled along differentx/t rays, is plotted against ray velocity. The edge velocitiesV* and V- obtained from inflection points are indicated byvertical dashed lines in Fig. 4(d). It can be seen that these arein excellent agreement with the zero growth-rate rays. More-over, the group velocity V (vertical solid line) also agreesvery well with the maximum of the envelope in the ray rep-resentation. Thus it can be seen that the velocities are all quite welldefined experimentally, at least up to the time at which theperturbation reaches its maximum, even though the flow isspatially inhomogeneous and the wave packet lives only afinite time. As expected, none of the velocities (including V,)are strictly constant over this space-time region, but they arevery nearly so outside of the near-wake region. We have notattempted to extract their detailed variation in the presentstudy. We now consider the behavior of the different velocitiesas e →0(i.e., when Re→Re). In Fig. 5(a) we can see thatthe phase velocity V, and equivalently the leading-edge ve-locity V*, normalized by the inflow speed, exhibit a slightdecrease with increasing Reynolds number. Generally, thevalue of V,/U in the subcritical regime (e<0) compareswell with the value of 0.88 reported in the literature for thesupercritical (e>0) regime. The group and trailing-edge ve-locities are summarized in Fig.5(b). Both velocities decreasewith increasing Reynolds number as one would expect inapproaching the global wake instability. To within experi-mental accuracy, Vapproaches zero as e→0. From the spatiotemporal diagrams we are also able topinpoint the position in space and time (Xmax,Tmax) at whichthe subcritical response reaches maximum amplitude. SeeFig.6(a). Again we use the cross-stream velocity componentU. We let Amax denote the maximum of the response, so thatAmax=0,(Xmax, max). Figures 6(b)-6(d) show the dependence of the maximumon reduced Reynolds number. It is not surprising that Amaxgrows when the global instability threshold is approached(e →0), as can be seen in Fig.6(b), because the suscepti-bility of the flow increases near the onset. On the contrary,the behavior of Xmax (which diminishes when e →0, seeFig.6(c), deserves a further comment, since it seems to beopposite to the case of other instabilities in the subcriticalregime where the characteristic length scale increases whene→0 (e.g., the penetration length inpretransitionalRayleigh-Benard convection). The fact that the maximumof the instability moves closer to the cylinder (i.e., that Xmaxdiminishes) when approaching the threshold while the timeat which this occurs remains constant on a nondimensional FIG. 5. (a) Phase velocityV, (which is also V+) and (b) group velocity Vand trailing-edge velocity V as a function of e. The dashed line in (a)corresponds to the value of V,/U for the Benard-von Kármán wake(Re>Re). The dashed lines in (b) are linear fits to the V, and V data.Experimental points are labeled as ●: small perturbation, O: medium per-turbation, and : strong perturbation. Horizontal error bars indicate theuncertainty in the Reynolds number measurement. scale normalized by the advective time scale Tady, Fig. 6(d)]is actually consistent with V decreasing as the convectivelyunstable system tends to the absolute instability threshold.The difference with the case of Rayleigh-Benard convectioncomes from the effect of the mean flow advection, whichmodifies the physical meaning of the penetration lengthscale. For a given value of e, an increase in the strength of theperturbation produces a response in which the maximum am-plitude Amax is slightly larger and occurs at a position closerto the cylinder (smaller Xmax). Approaching the threshold re-duces the effect of changing the perturbation strength. IV. TRANSIENT GROWTH As noted in Sec. I, an important feature of the cylinderwake is the inhomogeneous nature of the flow. Hence, eventhough the subcritical response just presented has much ofthe general character of convective instability, perturbationsdo not grow indefinitely (even linearly) as they would for ahomogeneous convectively unstable system. Rather, a local-ized initial perturbation grows at first, due to local flow fea-tures near the cylinder, but is simultaneously advected down-stream into a region of stability where the perturbationdecays. Hence in the absence of any inflow noise the impul-sive response is only transient. Such behavior is known ininhomogeneous flows.5.20-2727It should be noted, however,that inflow or other noise may modify the picture in that the FIG. 6. (Color online) (a) Definitionof the maximum of the perturbation onthe spatio-temporal diagram. (b) Evo-lution of the maximum of the pertur-bation Amax (c) Xmax, and (d) Tmax as afunction of the reduced Reynoldsnumber e. Amax, Xmax, and Tmax arerendered nondimensionalized, respec-tively, by the free-stream velocity U,the cylinder diameter D, and the ad-vective time scale Tadv=D/U. Experi-mental points are labeled as ●: lowperturbation,O: medium perturbation,and : strong perturbation. localized region of instability acts as an amplifier and sus-tained dynamics may arise in some cases even in the sub-ewime 11,24,27-29critical regime. An increasingly common approach to quantifying thetransient response of flows is in terms of their transient en-ergy growth.Such an analysis provides a global measure ofthe response dynamics. Here we undertake such an analysisof experimental data. We define the perturbation energy from our measure-ments as follows where where the base flow (Uxbase, Uy base) is the measured steadyflow before any perturbation. Experimentally, the total energy of the perturbation canonly be measured while the packet is contained in the obser-vation window. Hence, the energy calculated from the ve-locimetry data does not include the contribution from vorti-ces that have been advected out of the measurement area. Inorder to quantify this effect we compare the energy calcu-lated using two different streamwise sizes for the integrationarea A: the total energy E, where the whole measurementwindow is used, and the energy of the first half of the wavepacket Ehalf, where the downstream boundary of the integra-tion area ▲ is given by the time-dependent position of themaximum perturbation amplitude Xmax (t); see Fig. 7(a). Wenote that Xmax(t) is time-dependent and should not be con-fused with Xmax shown in Fig. 6(c). The quantities are related via: Xmax=max,Xmax(t). We find that the ratio of Erot/Enalfremains approximately constant (≈2) in time, which meansthat the measurement window is sufficiently large to capturethe dynamics of the perturbation growth and decay beforethe effect of the flow structures advected away from thedownstream boundary of the measurement window becomessignificant. The time evolution of the energy is shown in Fig. 7(b).The value of Etot, as well as Ehalf and Etot-Ehalf, are shown.All energies are all normalized by Eo,the value of Etot at thefirst measured instance following the impulse. The perturba-tion energy initially undergoes growth until t=50Tadv, atwhich point the energy decays. This is precisely the transientgrowth dynamics expected of convective instabilities in in-homogeneous media. The late time behavior of the energy corresponds to theexponential decay of the least stable normal mode in a stableregion, e.g. Refs. 31 and 7. As the system approaches theabsolute instability threshold (e→0) this decay becomesslower. This can be seen in Fig. 7(c), where the decay rate isgiven by the slope of the curves of log Etot and more quan-titatively in Fig. 8(a) where the asymptotic decay rate is plot-ted as a function of reduced Reynolds number. For compari-son, decay rates from linear stability computations6areshown with a solid curve. The agreement is excellent. The energy growth at short times can be examined usingthe maximum of the energy Emax and the time for which thismaximum is reached tmax as a function of e. See Fig. 8(b).Consistently with the approach of the absolute instabilitythreshold, Emax increases when e→0. The time tmax wherethe maximum energy is reached remains approximatelyconstant. X/D (c) x e2at increasinge 0 20 60 80 100 t/Tadu FIG. 7.(Color online) Transient energy growth in experiment.(a) Illustra-tion of the integration area for the energy on the instantaneous velocity fieldU. Etot and Ehalf are calculated over the white and black rectangles, respec-tively. The downstream boundary of the black rectangle moves at a speed Vand tracks the maximum of the perturbation envelope as indicated in theupper plot. (b) Energy as a function of time for e=-0.14. The dots are theexperimental data of Etot The solid, dashed, and dotted lines are smooth fitsof Etop Ehalf, and Etot-Ehalf, respectively. (c) Time evolution of the energy onlogarithmic scale, for three different values of the reducedReynolds numbere:●e=-0.19,+e=-0.14, ande=-0.1. The slope of the energy decay onthe logarithmic scale gives the decay rate o. V. DISCUSSION AND CONCLUSIONS The convectively unstable wave packets produced by animpulsive perturbation in a subcritical cylinder wake havebeen studied experimentally. Velocity field measurementsobtained by PIV have permitted us to characterize quantita-tively the instability wave, shedding light on points that re-mained not clearly analyzed in the literature. First, probingthe perturbation of the velocity field due to the instabilityshows unambiguously that there is a well-defined maximumof the perturbation amplitude in the wake. This differs sig-nificantly from the picture given by the streakline visualiza-tions usually used to illustrate the convective instability,17which distorts the observation of the actual growth and de- FIG. 8. (a) Asymptotic decay rate of perturbations [as seen in Fig. 7(c)] asa function of reduced Reynolds number e. Experimental points are labeledas ●: low perturbation, O: medium perturbation, and : strong perturba-tion. The curve shows decay rates from linear stability computations. (b)Maximum transient energy gain and (inset) time at which this maximumoccurs as a function of the reduced Reynolds number e. Experimental pointsare labeled as ●: low perturbation, O: medium perturbation, and : strongperturbation. cay. The value of this maximum and its position downstreamof the cylinder depend on the Reynolds number and, lessmarkedly, on the strength of the perturbation, whereas itsposition in time remains constant. In addition. the evolutionof the wave packet has been characterized with respect to theReynolds number using the leading and trailing fronts aswell as a typical group velocity. The measured velocities areconsistent with the transition from a convective to an abso-lute global instability as the Reynolds number increases to-ward the Benard-von Karmán instability threshold (see Fig.5). The analysis of the transient energy growth associatedwith the instability also deserves a final comment. The quali-tative features of the temporal evolution of the energy agreewith the standard picture of transient growth due to convec-tive instability in inhomogeneous media, i.e., a short-timealgebraic growth followed by an exponent)wth:ial decay at latetimes. However, the measured values of max(Etot/E ) areremarkably low (always less than 10) when compared to thevalues obtained by numerical computations (of order 10’, seee.g. Refs. 25 and 27). The main reasons for this discrepancyare most likely the fact that in the experiment one does im-pose an optimal perturbation and also the fact that extractingEo, the initial energy of the perturbation, is experimentallyquite difficult. This discrepancy raises the question about thepertinence of the energy gain (ubiquitous parameter in tran-sient growth studies) as the most appropriate quantity to usefor comparison between theory and experiments. ACKNOWLEDGMENTS D.B. gratefully acknowledges support from the Lever-hulme Trust and the Royal Society. We acknowledge supportfrom the French Research Agency through Project No.ANR-08-BLAN-0099. ( 'M. P rovansal, C. M athis, a nd L. B oyer,“Benard-von Kar m an instability: T ransient and forced regimes,” J . Fluid Mech. 1 82, 1 ( 1987). ) ( C. P . Jackson, “A finite-element s t udy o f the o n set o f v o rtex shedding in f low past variously shaped b odies,”J . F l uid Mech. 1 8 2, 23 ( 1 987). ) ( B. Noack and H. E ck elmann,“A global stability analysis of the steady and ) ( p eriodic c ylinder wake,”J . F luid M ech. 2 7 0, 297 (19 9 4)."B. Pier,“On the f requency selection of finite-amplitude vortex shedding in t he cylinder wake,"J . Fluid Mech. 458, 407 ( 2002). ) ( ' J .-M. Chomaz,“G l obal in s tabilities in spatially developing flows: N on- n ormality a nd nonlinearity,”A n nu. R e v. F l uid M e ch. 3 7 , 357 (2005). ) ( D. Barkley, “ Linear analysis of the cylinder wake mean flow, "Europhys . L ett. 75, 7 50 (2006). ) ( 'F. Giannetti and P. L uchini,“Structural se n sitivity of the first instability of t he cylinder wake,"J . F luid M ech . 5 8 1, 1 6 7 (2007). ) ( °L. D. Landau a nd E . M . L ifshitz , Flui d Me c hanic s (Pergamon, London, 1 959). ) ( P. Huerre a nd P. A. M onkewitz,“A b solute and convective ins t abilities in f ree shear layers, ” J . Flu i d Mech. 159, 1 51 ( 1985). ) ( P. H u erre and P. A. Monkewitz, "Loc a l and global instabilities in s p atially developing f lows," An n u. R ev. F l u i d M ec h . 2 2, 473 (1990). ) ( R. J. Dei s sler, “Noise-sustained structure, in t ermittency, a n dthe G inzburg-L a ndau eq u ation,”J. S t a t. P h ys. 4 0 , 371 (1 9 8 5). ) ( W. V.Saarloos,"Front propagation into unstable states,"Phys. R ep. 29, 3 86(2003). ) ( I . D e lbende and J. Ch o maz, “Non l inear convective/absolute instab i lities in p arallel two-dimensional w akes,”Ph ys. F l u id s 1 0 , 2724 (1 9 98). ) ( “P. A. M onkewitz,“T h e ab s olute an d co n vective na t ure of instability intwo-dimensional wakes at low R e ynolds numbers," Phy s. Fl uids 3 1, 999 (1988). ) ( J. A . Zielinska an d J. E . We s freid, “On the s pat i al stru c ture of glob a l m odes i n wake flow,”P h ys . F lui d s 7 , 1 418 ( 1 995). ) P. L. Gal and V. Croquette,“Visualization of the space-time impulse re-sponse of the subcritical wake of a cylinder,” Phys. Rev. E 62, 4424(2000). C. Williamson,“Oblique and parallel modes of vortex shedding in thewake of a circular cylinder at low Reynolds numbers,” J. Fluid Mech.206,579 (1989). J. Wesfried, P. Berge, and M. Dubois, “Induced pretransitional Rayleigh-Benard convection," Phys. Rev. A 19, 1231 (1979). C. Cossu and J. M. Chomaz,“Global measures of local convective insta-bilities,”Phys. Rev. Lett. 78,4387 (1997). ( P. Gondret, P. Ern, L. Meignin , and M. Rabaud,“Experimental evidence of a nonlinear transition f rom c o nvective to absolute instability,”P h y s. Rev . Lett . 82, 1 442 ( 1999). ) ( 22r 22L. Kim a nd J. Moehlis,“Transient g rowth f o r streak-streamwise vortex i nteractions," Phys. L e tt . A 358, 431 ( 2006). ) ( "H. Blackburn, D . Barkley, and S. Sh e rwin,“Co n vective inst a bility and transient growth in flow over a backward-facing s tep,”J . F lu i d M ech. 603,271 ( 2008). ) ( O . Marquet, D. Sipp, J.-M. C h omaz, and L. Ja c quin,“Amplifier and reso- nator dynamics of a l ow-Reynolds-number recirculation bubble in a globalframework,”J . F l uid Mech . 605,429(2008). ) ( N. Abdessemed, A. S. Sharma, S. J. S h erwin, and V. Theo f ilis,“Transient growth analysis o f t he f low p ast a circular cylinder," Ph ys. Fluids 21, 044103(2009). ) ( 2C. D . Cantwell, D . B arkley, and H. Blackburn,“ T ransient growth analysis of flow through a sudden e x pansion in a circular pipe," P h y s . F l u i ds 2 2 , 034101(2010). ) ( C. D. Cantwell and D. Ba r kley,“Computational stu d y of s ub c ritical re-Ssponse in f low past a circular cylinder," Phys. Rev. E 8 2, 026315 (2010). ) ( 28 G. Gauthier, P. Gondret, and M. Rabaud,“Axisymmetric propagating vor- tices in the flow between a stationary a nd a rotating disk enclosed b y a cylinder , ” J . Fluid Mech. 3 86,105 (1999). 29 ) ( J. M. L o pez, F. Marques, A . M . Rubio, and M. Av i la, "Crossflow insta- bility of finite Bodewadt flows: Transients and spiral waves,” P hys. F l uids 21,114107( 2 009). ) 30P. J. Schmid and D. S. Henningson, Stability and Transition in ShearFlows (Springer, New York, 2001). R. H. Hernandez and A. Pacheco,“Numerical simulation and experimentsof a control method to suppress the Benard-von Karman instability,"Eur.Phys. J. B 30, 265 (2002).
确定


还剩5页未读,是否继续阅读?

产品配置单


北京欧兰科技发展有限公司为您提供《圆柱尾流中冲击响应检测方案(粒子图像测速)》,该方案主要用于其他中冲击响应检测,参考标准--,《圆柱尾流中冲击响应检测方案(粒子图像测速)》用到的仪器有德国LaVision PIV/PLIF粒子成像测速场仪、Imager sCMOS PIV相机、Ekspla CARS 相干反斯托克斯拉曼显微光谱仪
推荐专场


CCD相机/影像CCD
更多


相关方案
更多
该厂商其他方案
更多