


方案详情
文
To gain some more understanding of the flapping wing aerodynamics and aeroelasticity associated with biological flyers and micro air vehicles (MAVs), a combined computational and experimental study of a well characterized flapping wing structure was conducted. In particular, the coupling between aerodynamics and structural dynamics plays an important role in such flyers but to date has not been adequately addressed. An aeroelasticity framework based on a co-rotational shell finite element solver with a Navier-Stokes solver is developed. Experimentally, a customized digital image correlation system measures the wing deformation, a load sensor attached to the flapping mechanism records the forces produced by the flapping motion, and a stereo digital particle image velocimetry measures the flow velocities. Computational efforts with insight into the fluid physics are reported. Relevant fluid physics are documented including the counter-rotating vortices at the leading and the trailing edge which interact with the tip vortex during the wing motion. Overall, good correlations between experiment and computation are attained. Furthermore, studies on hypothetical flexible flapping wing configurations showed that wing flexibility can be tailored to alter the aerodynamics of a flapping wing.
方案详情

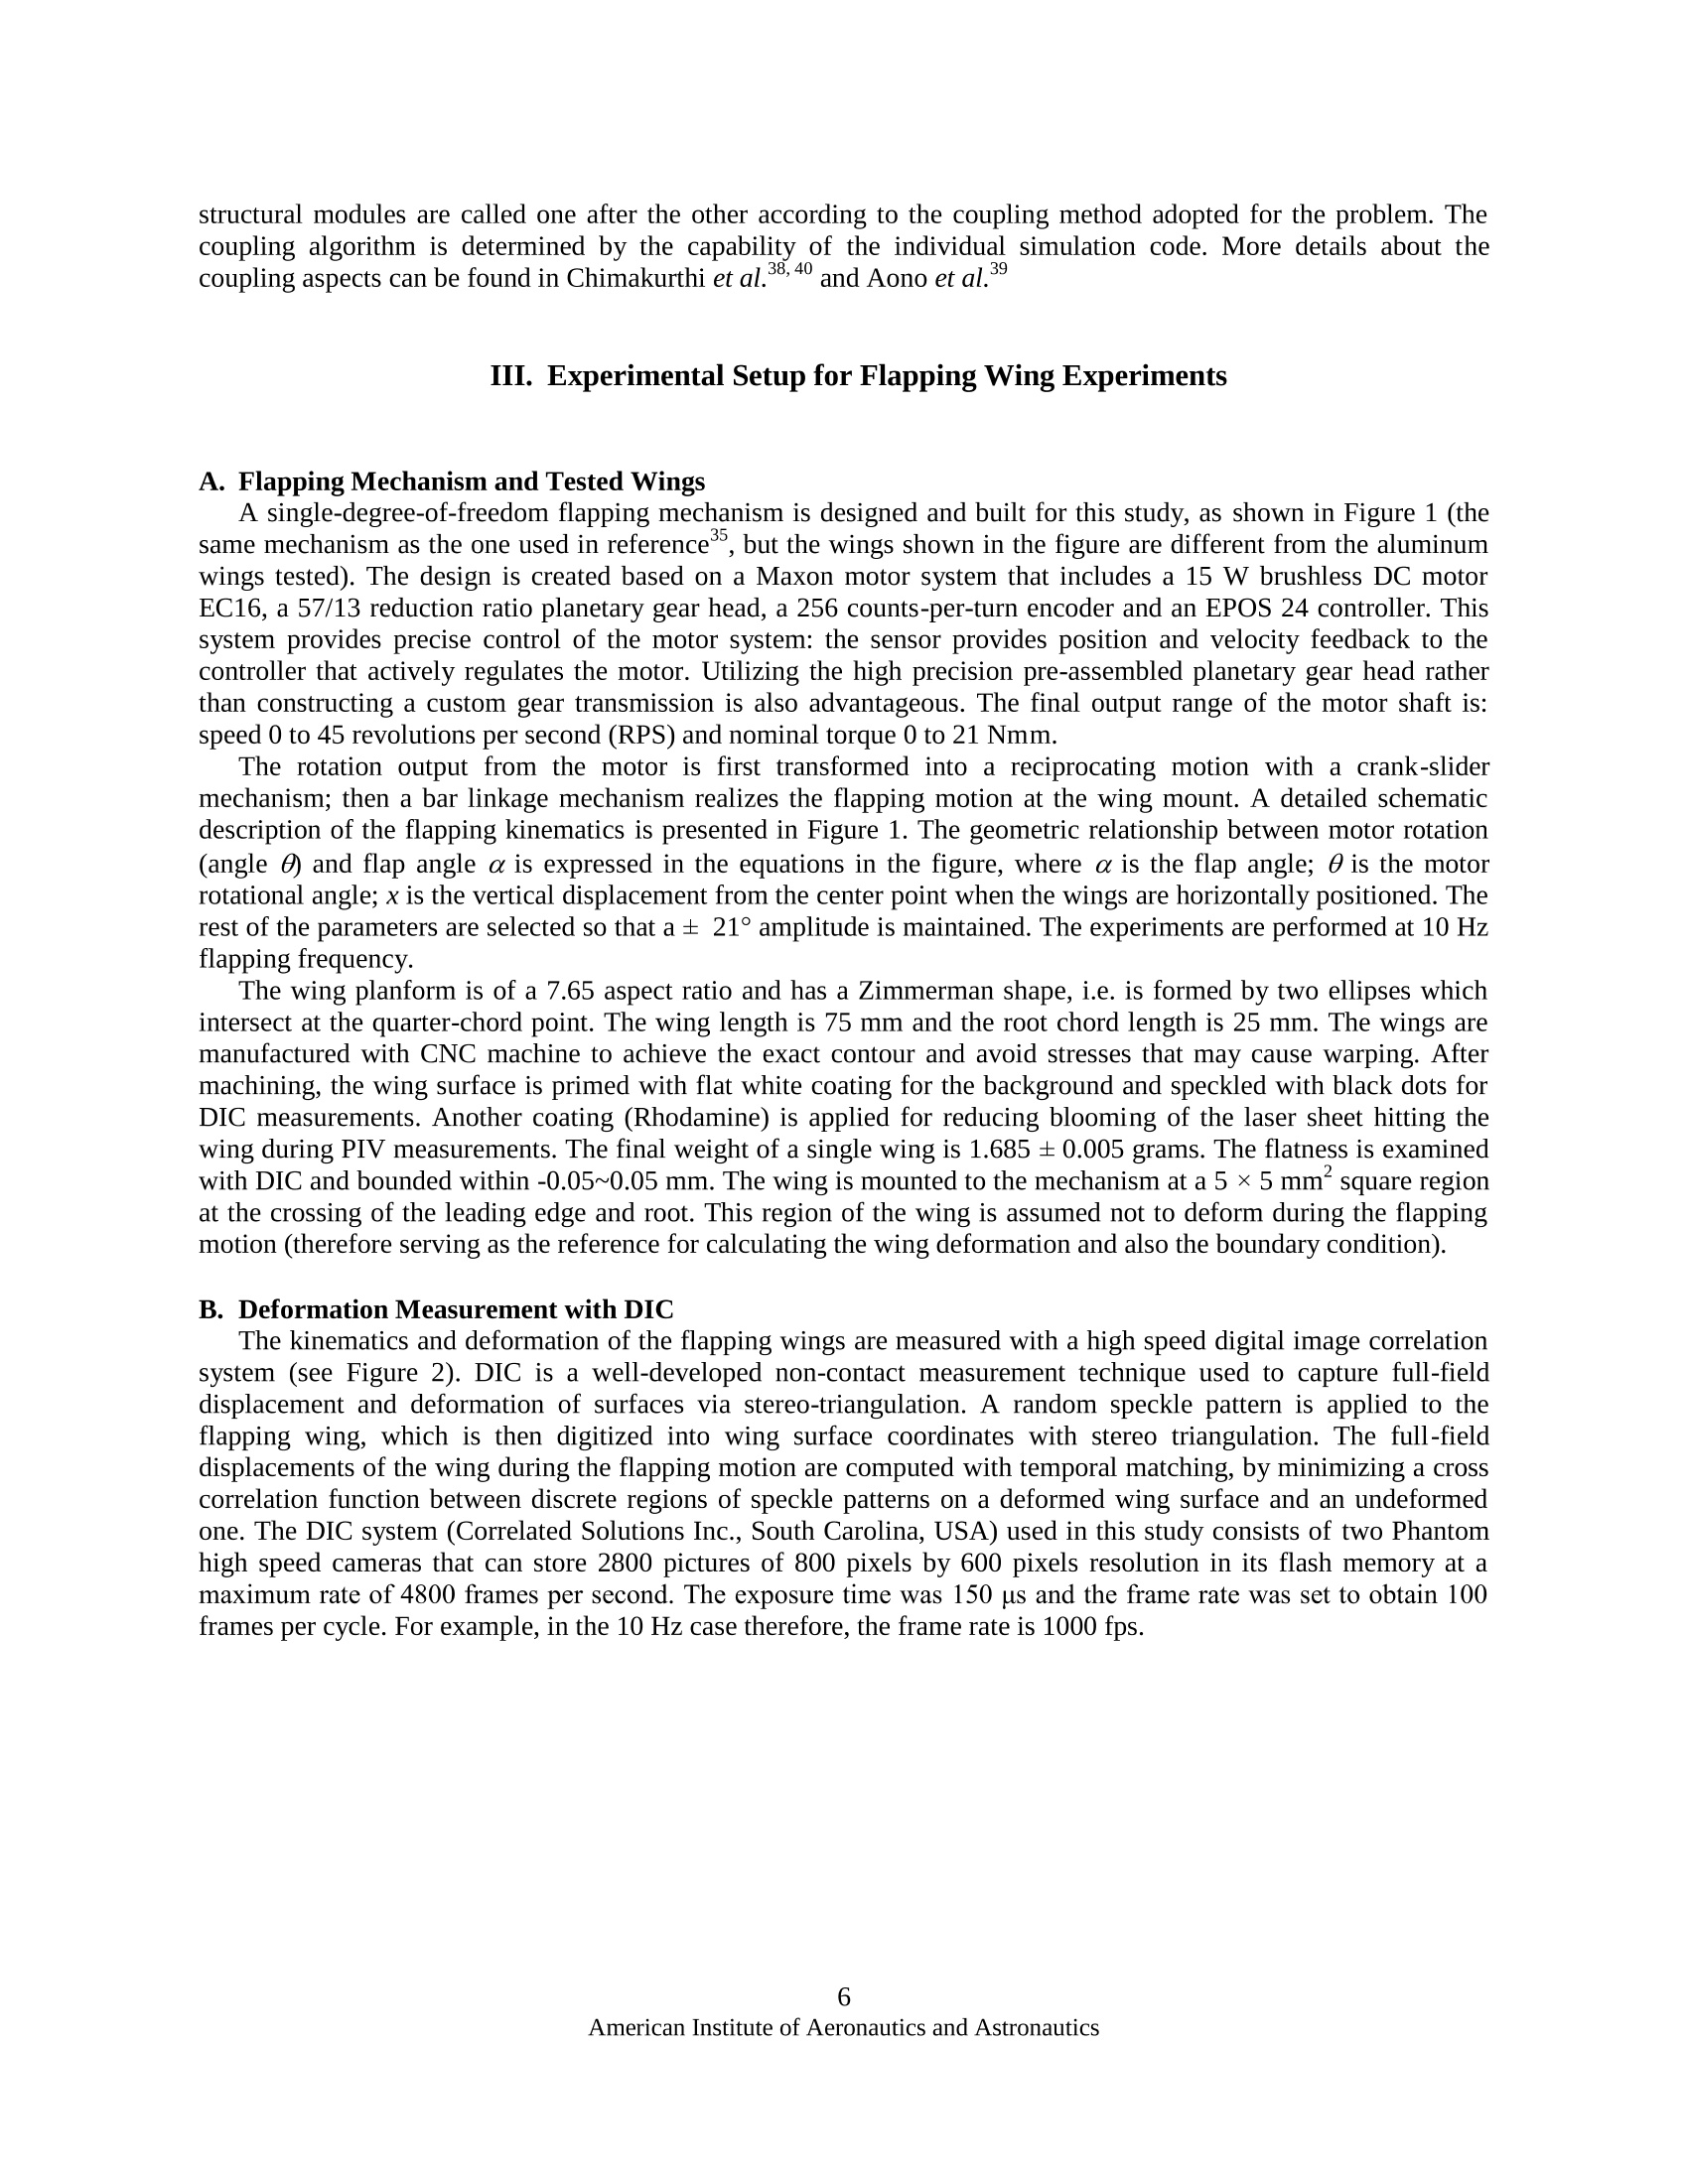
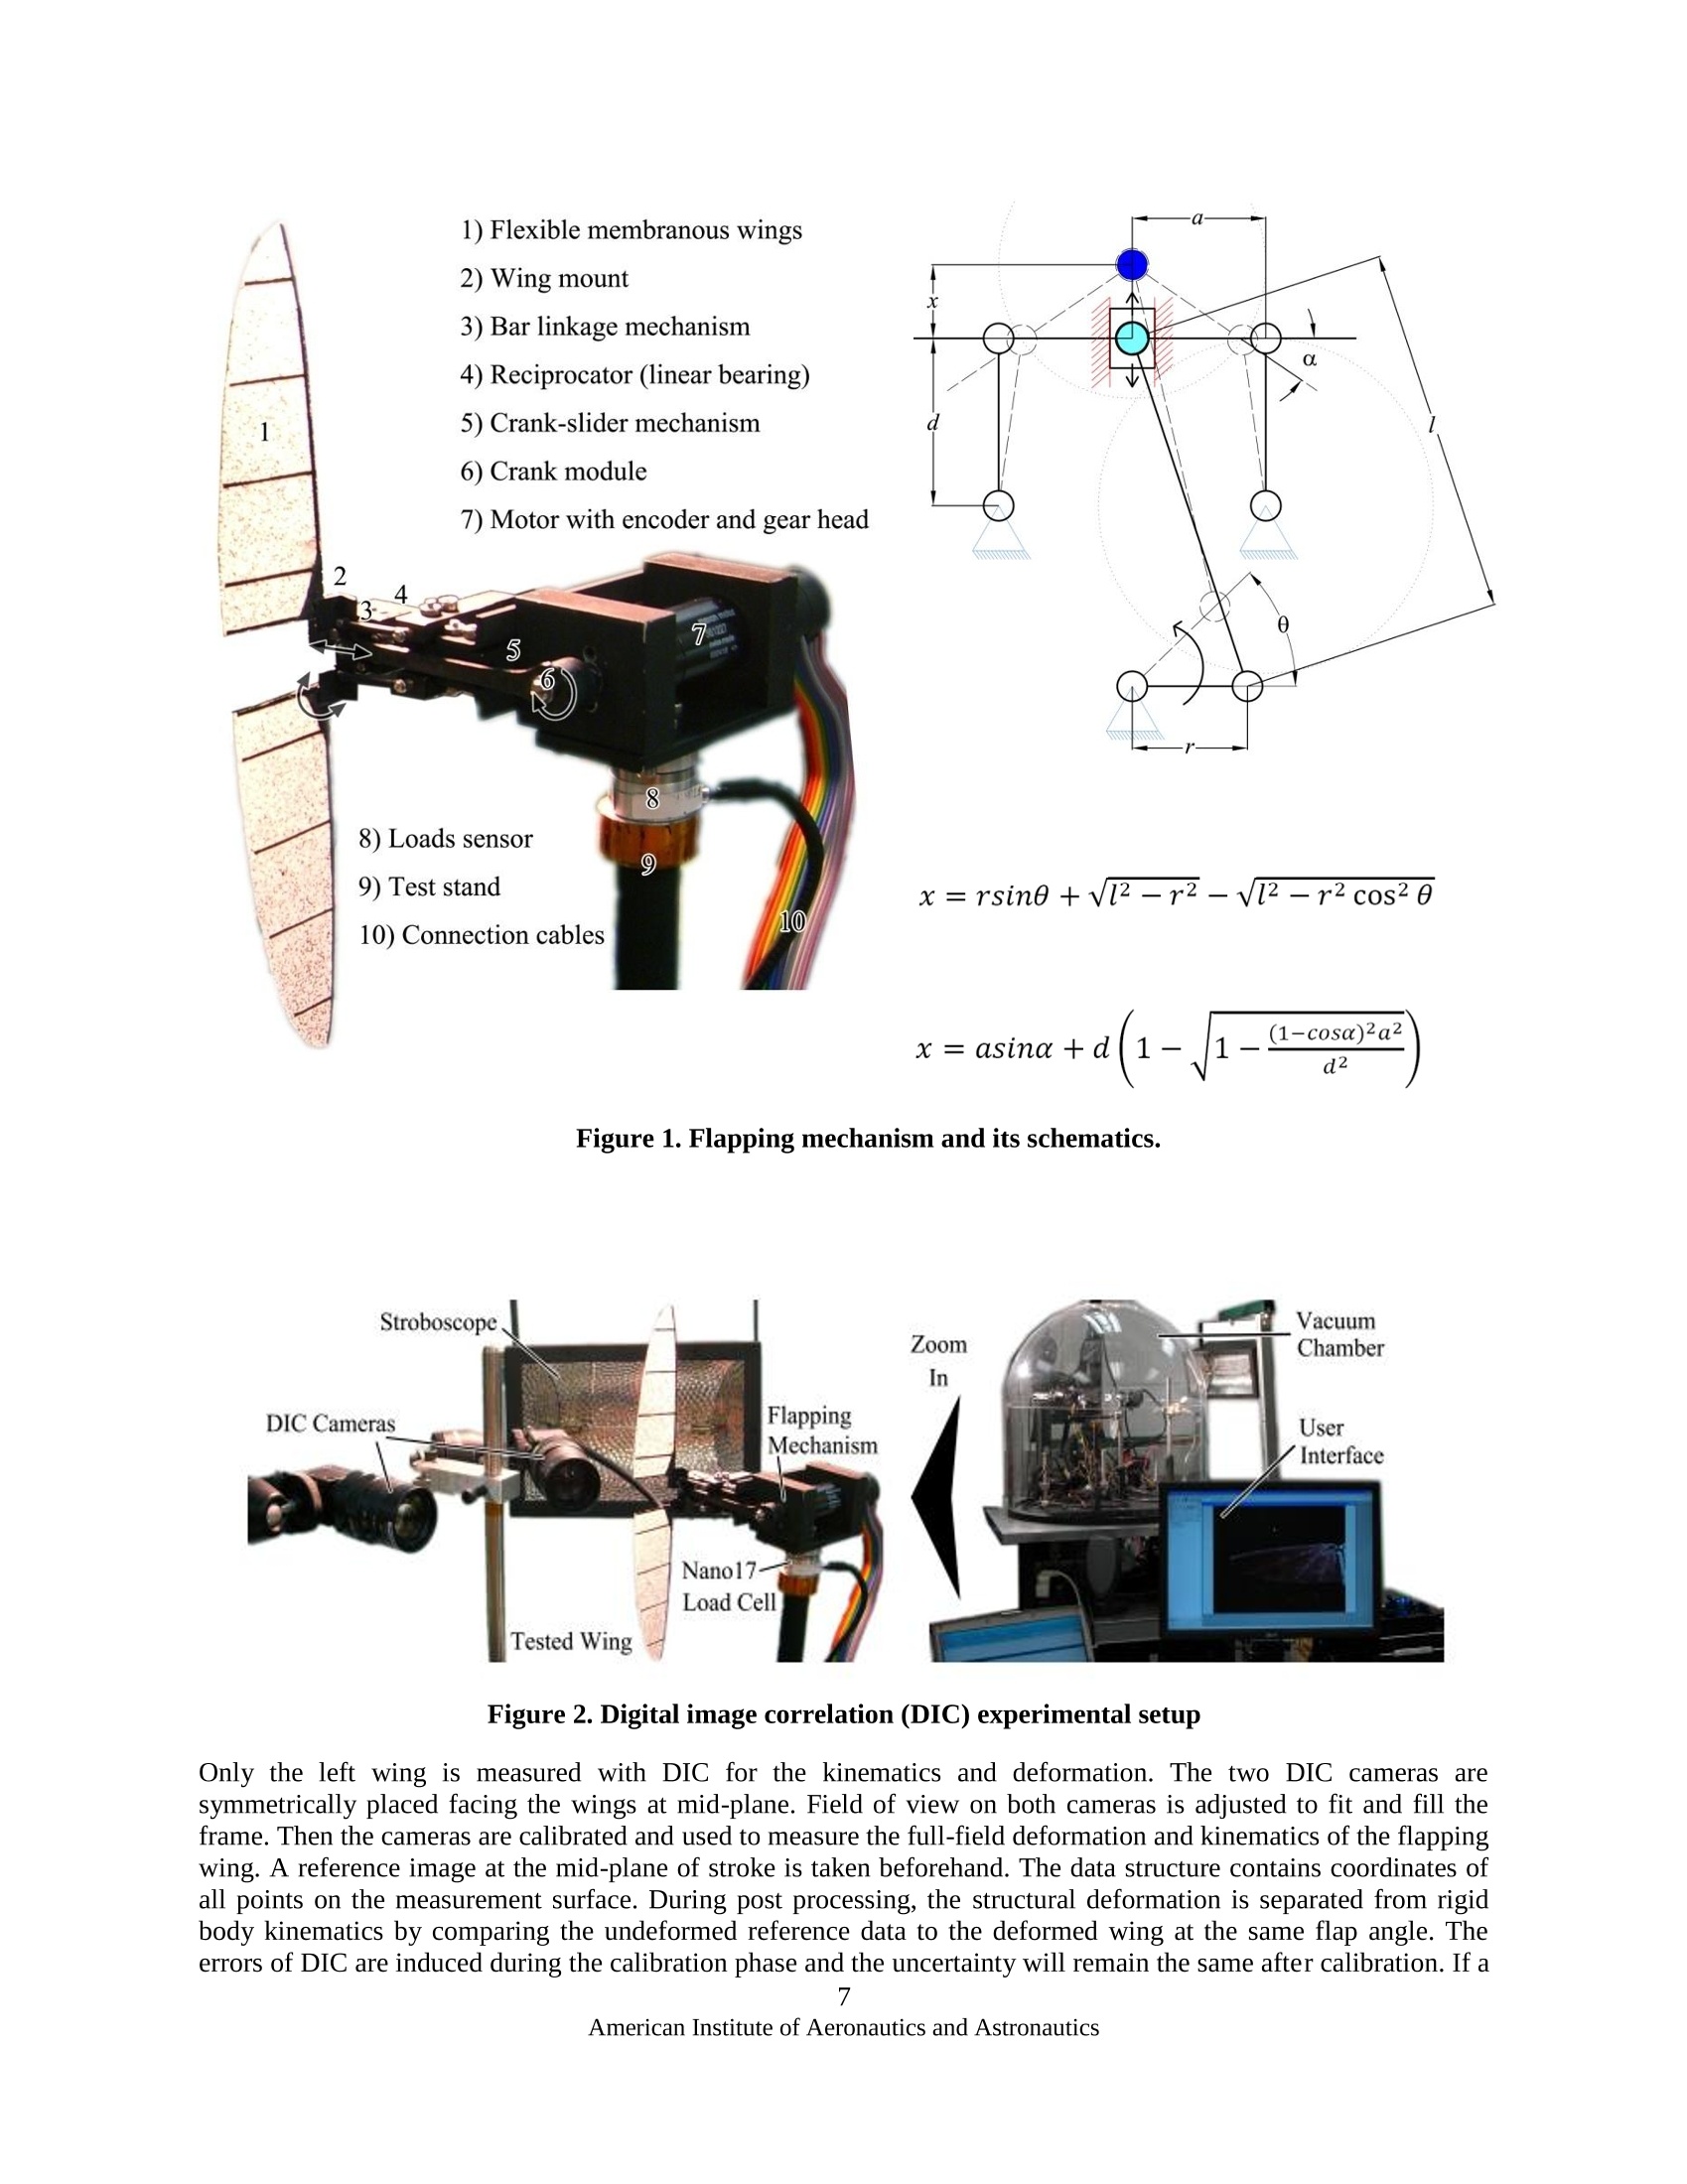
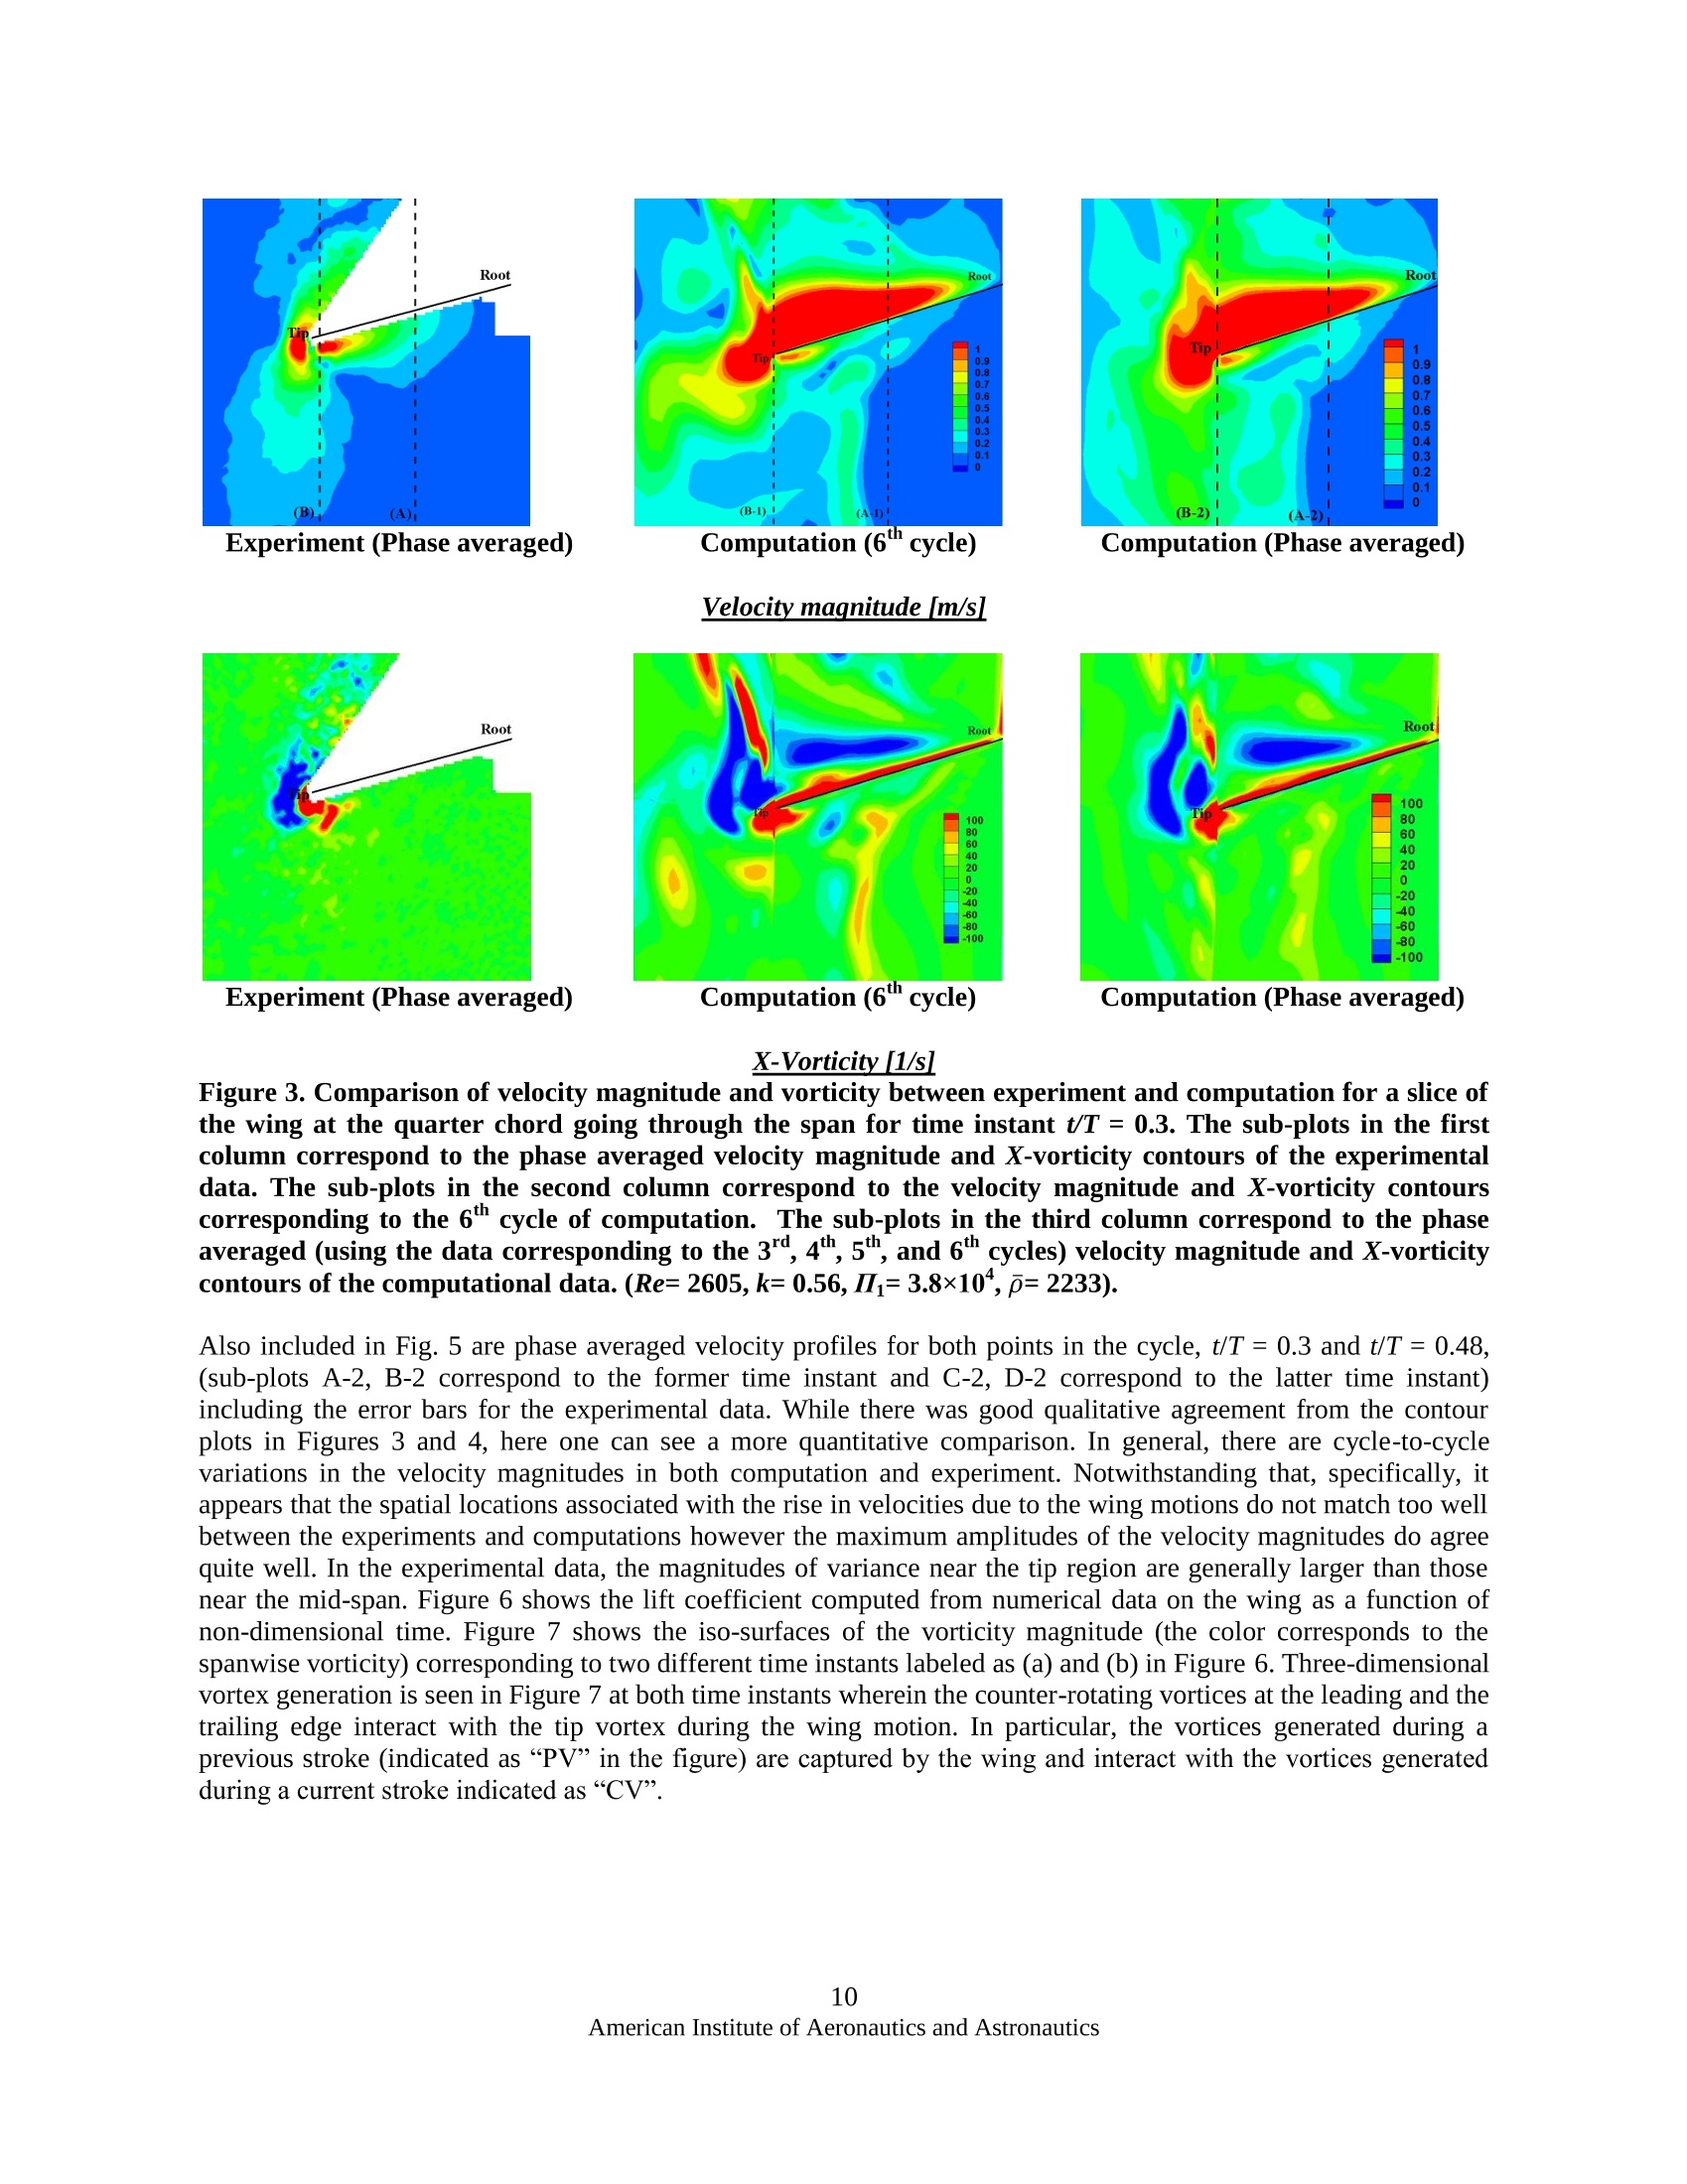
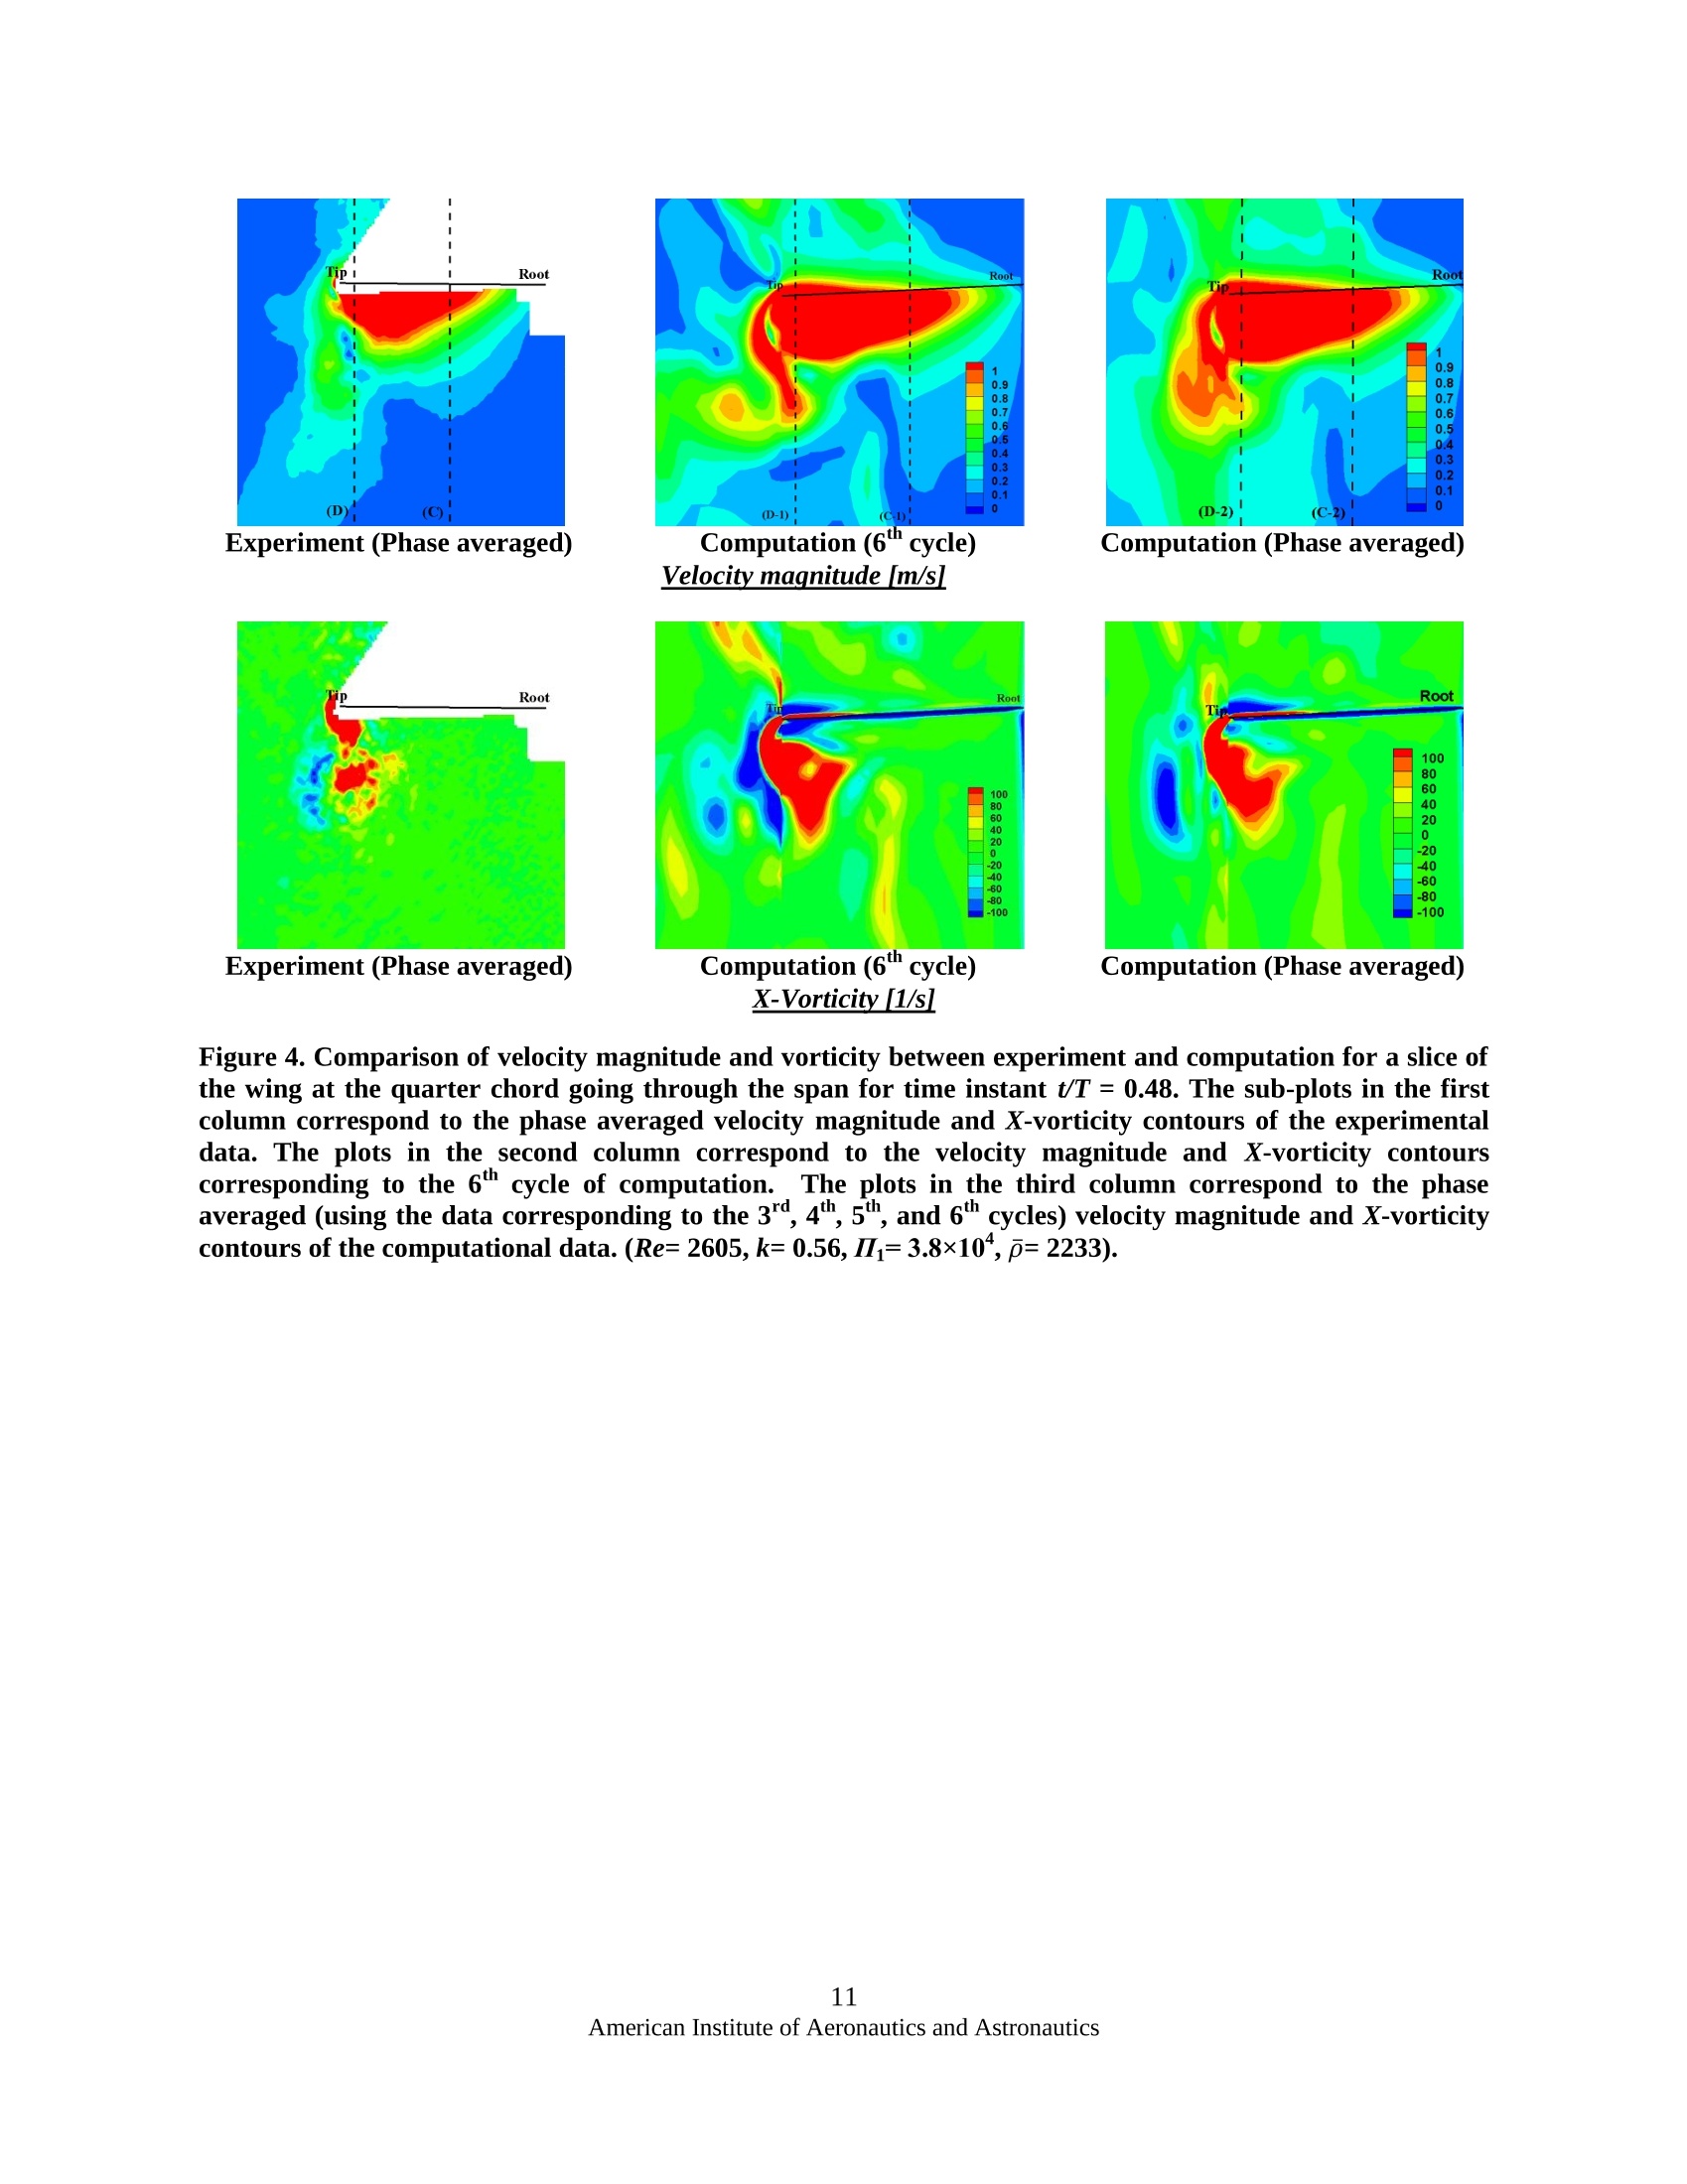
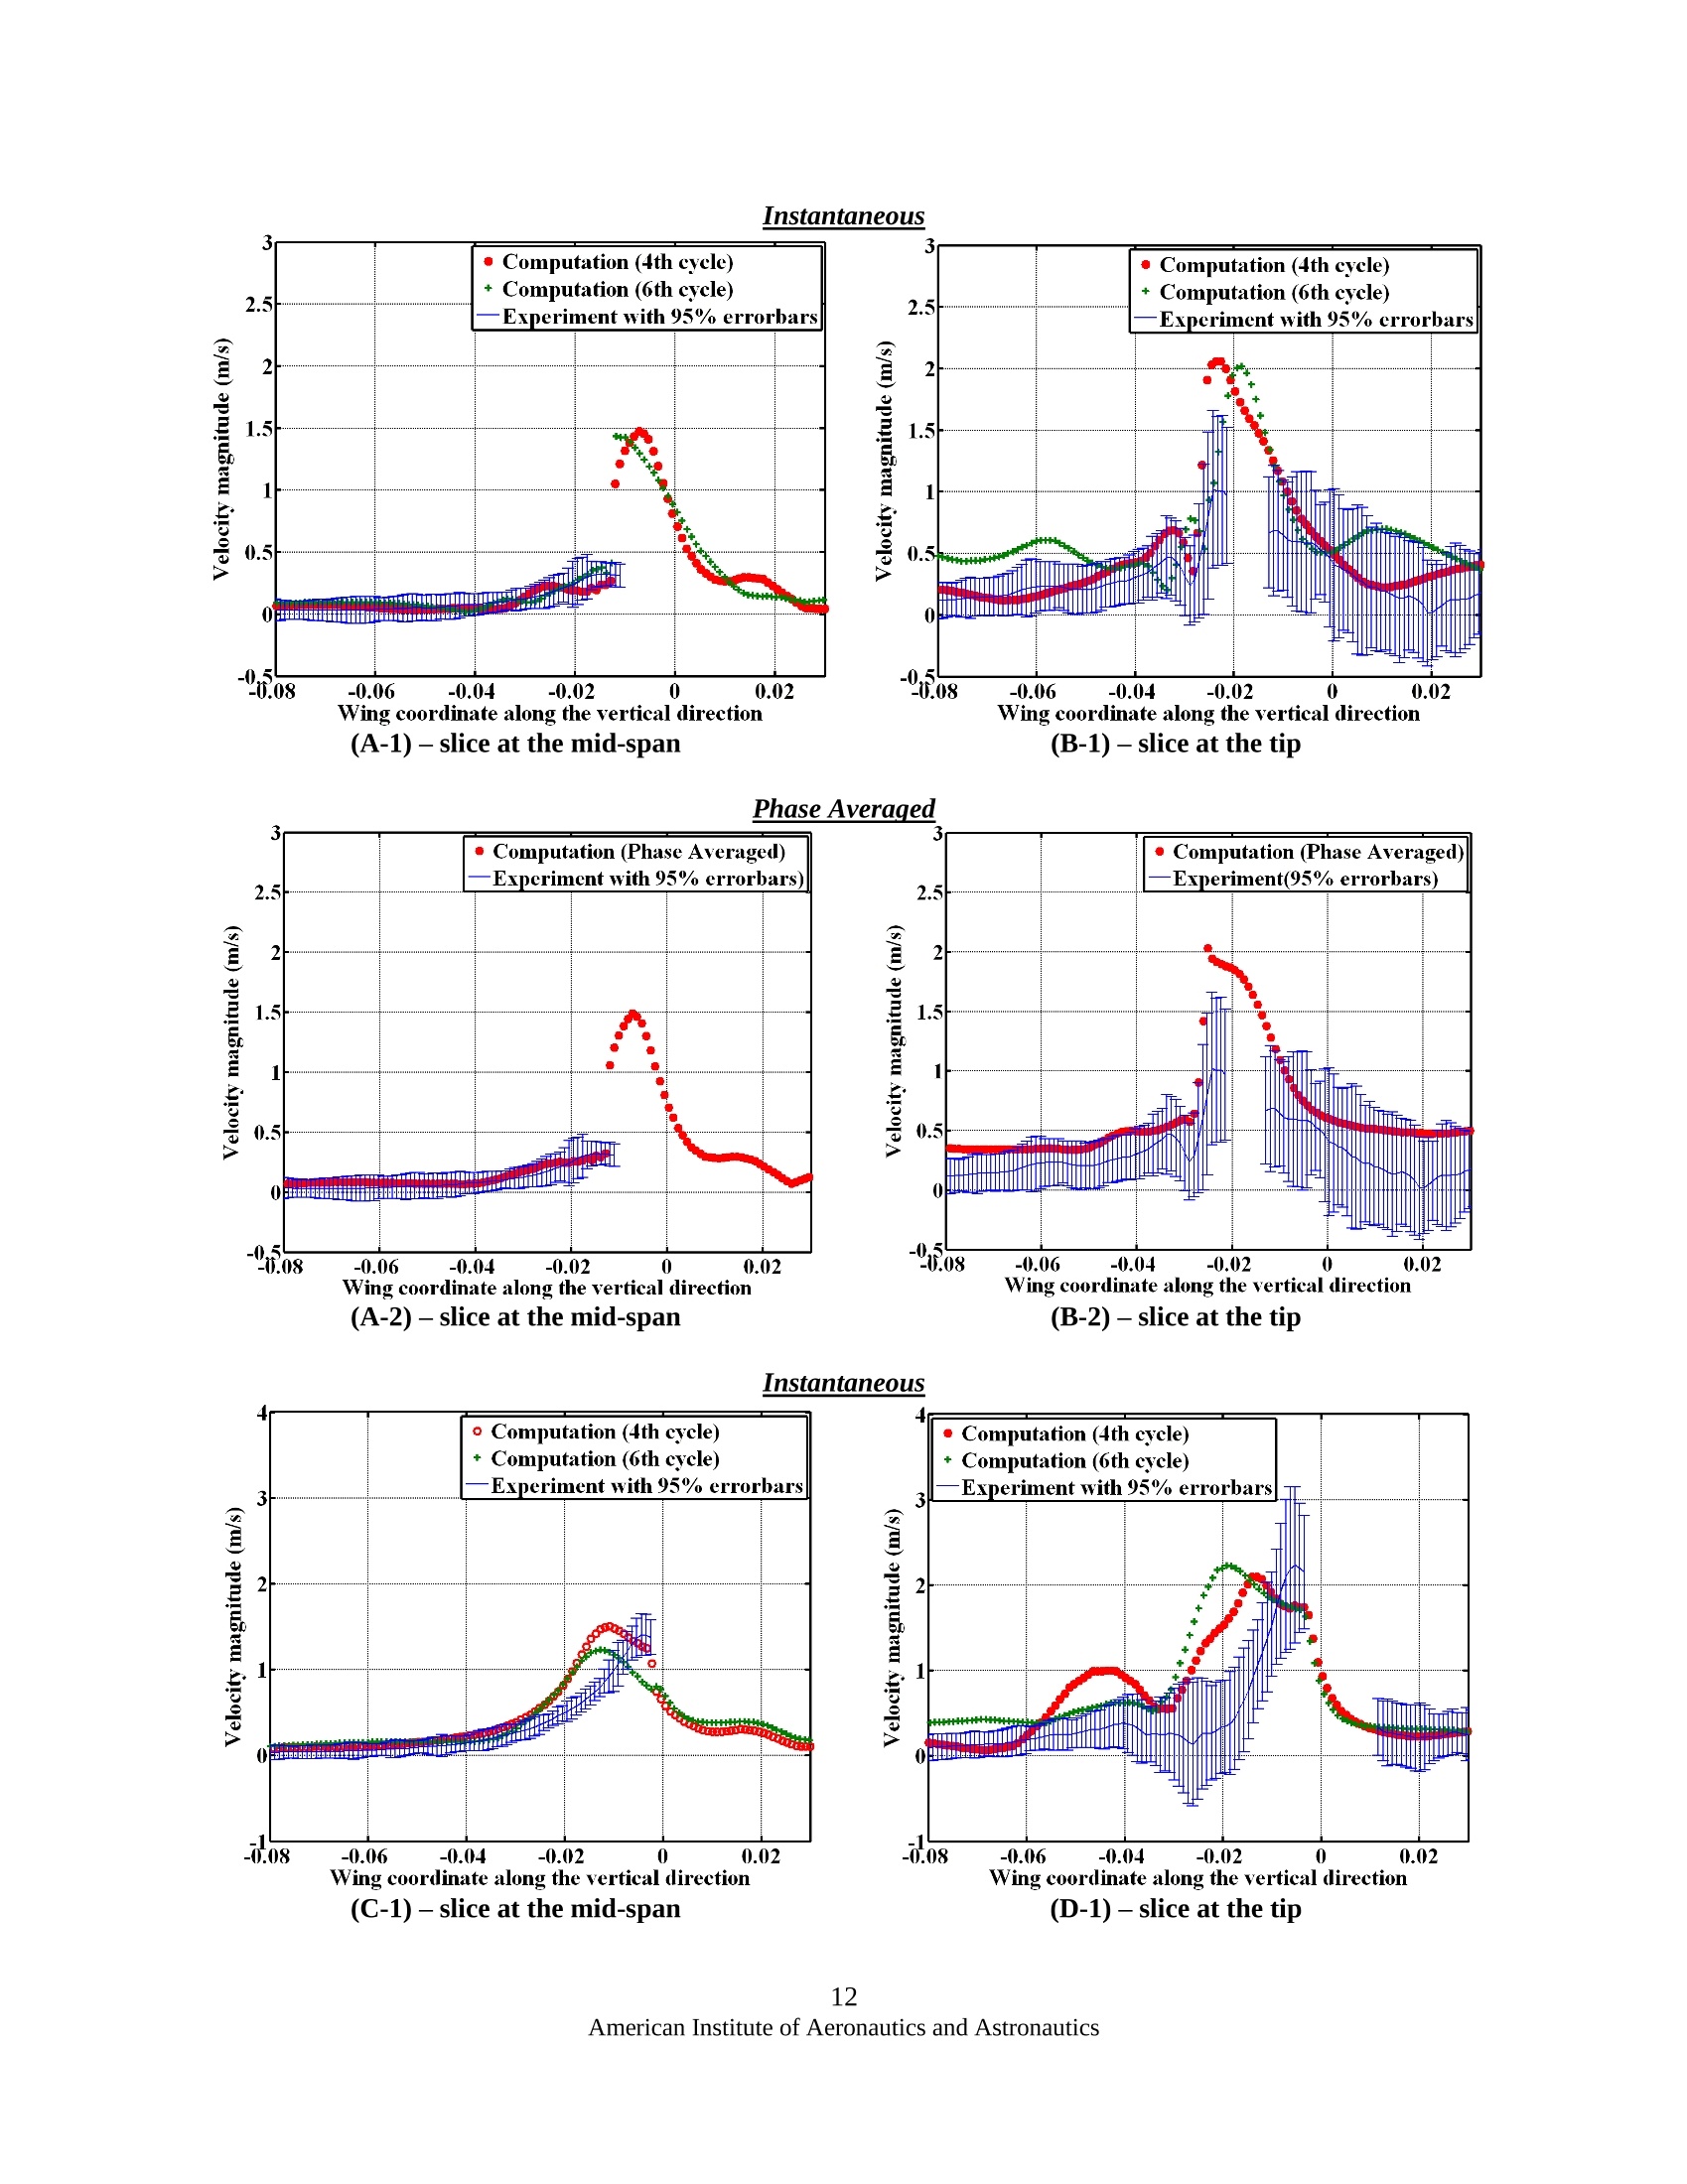
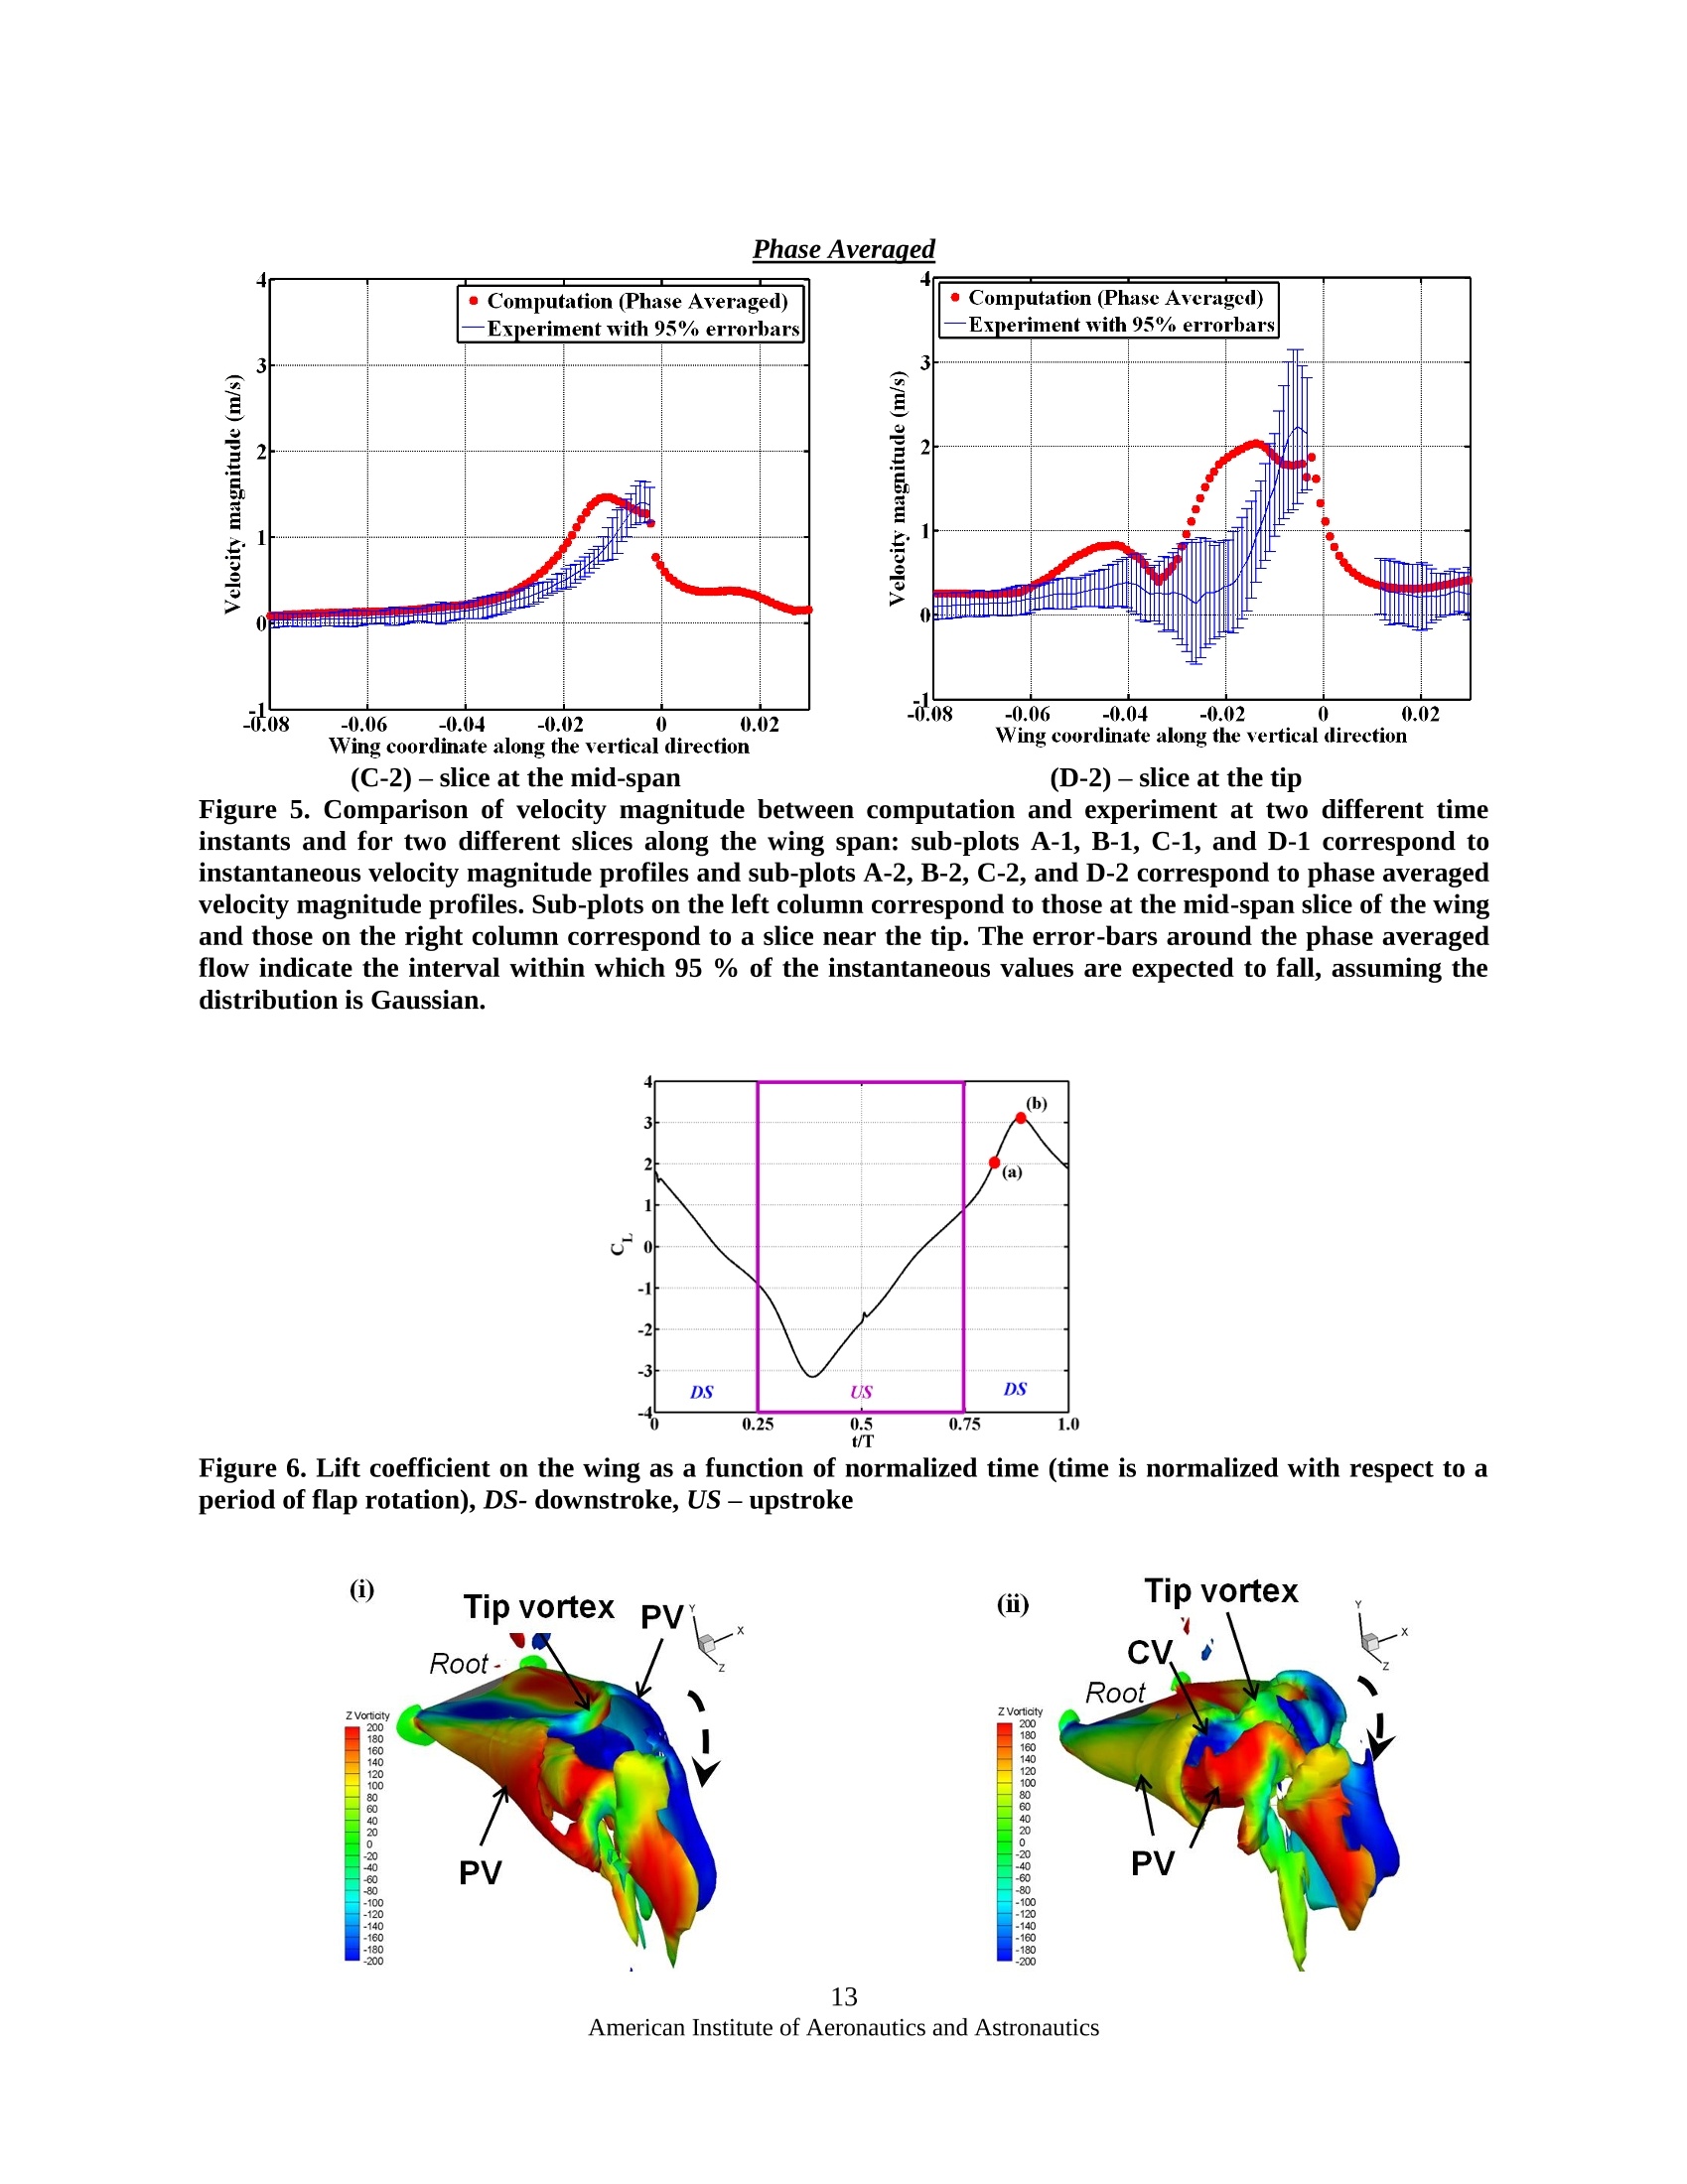
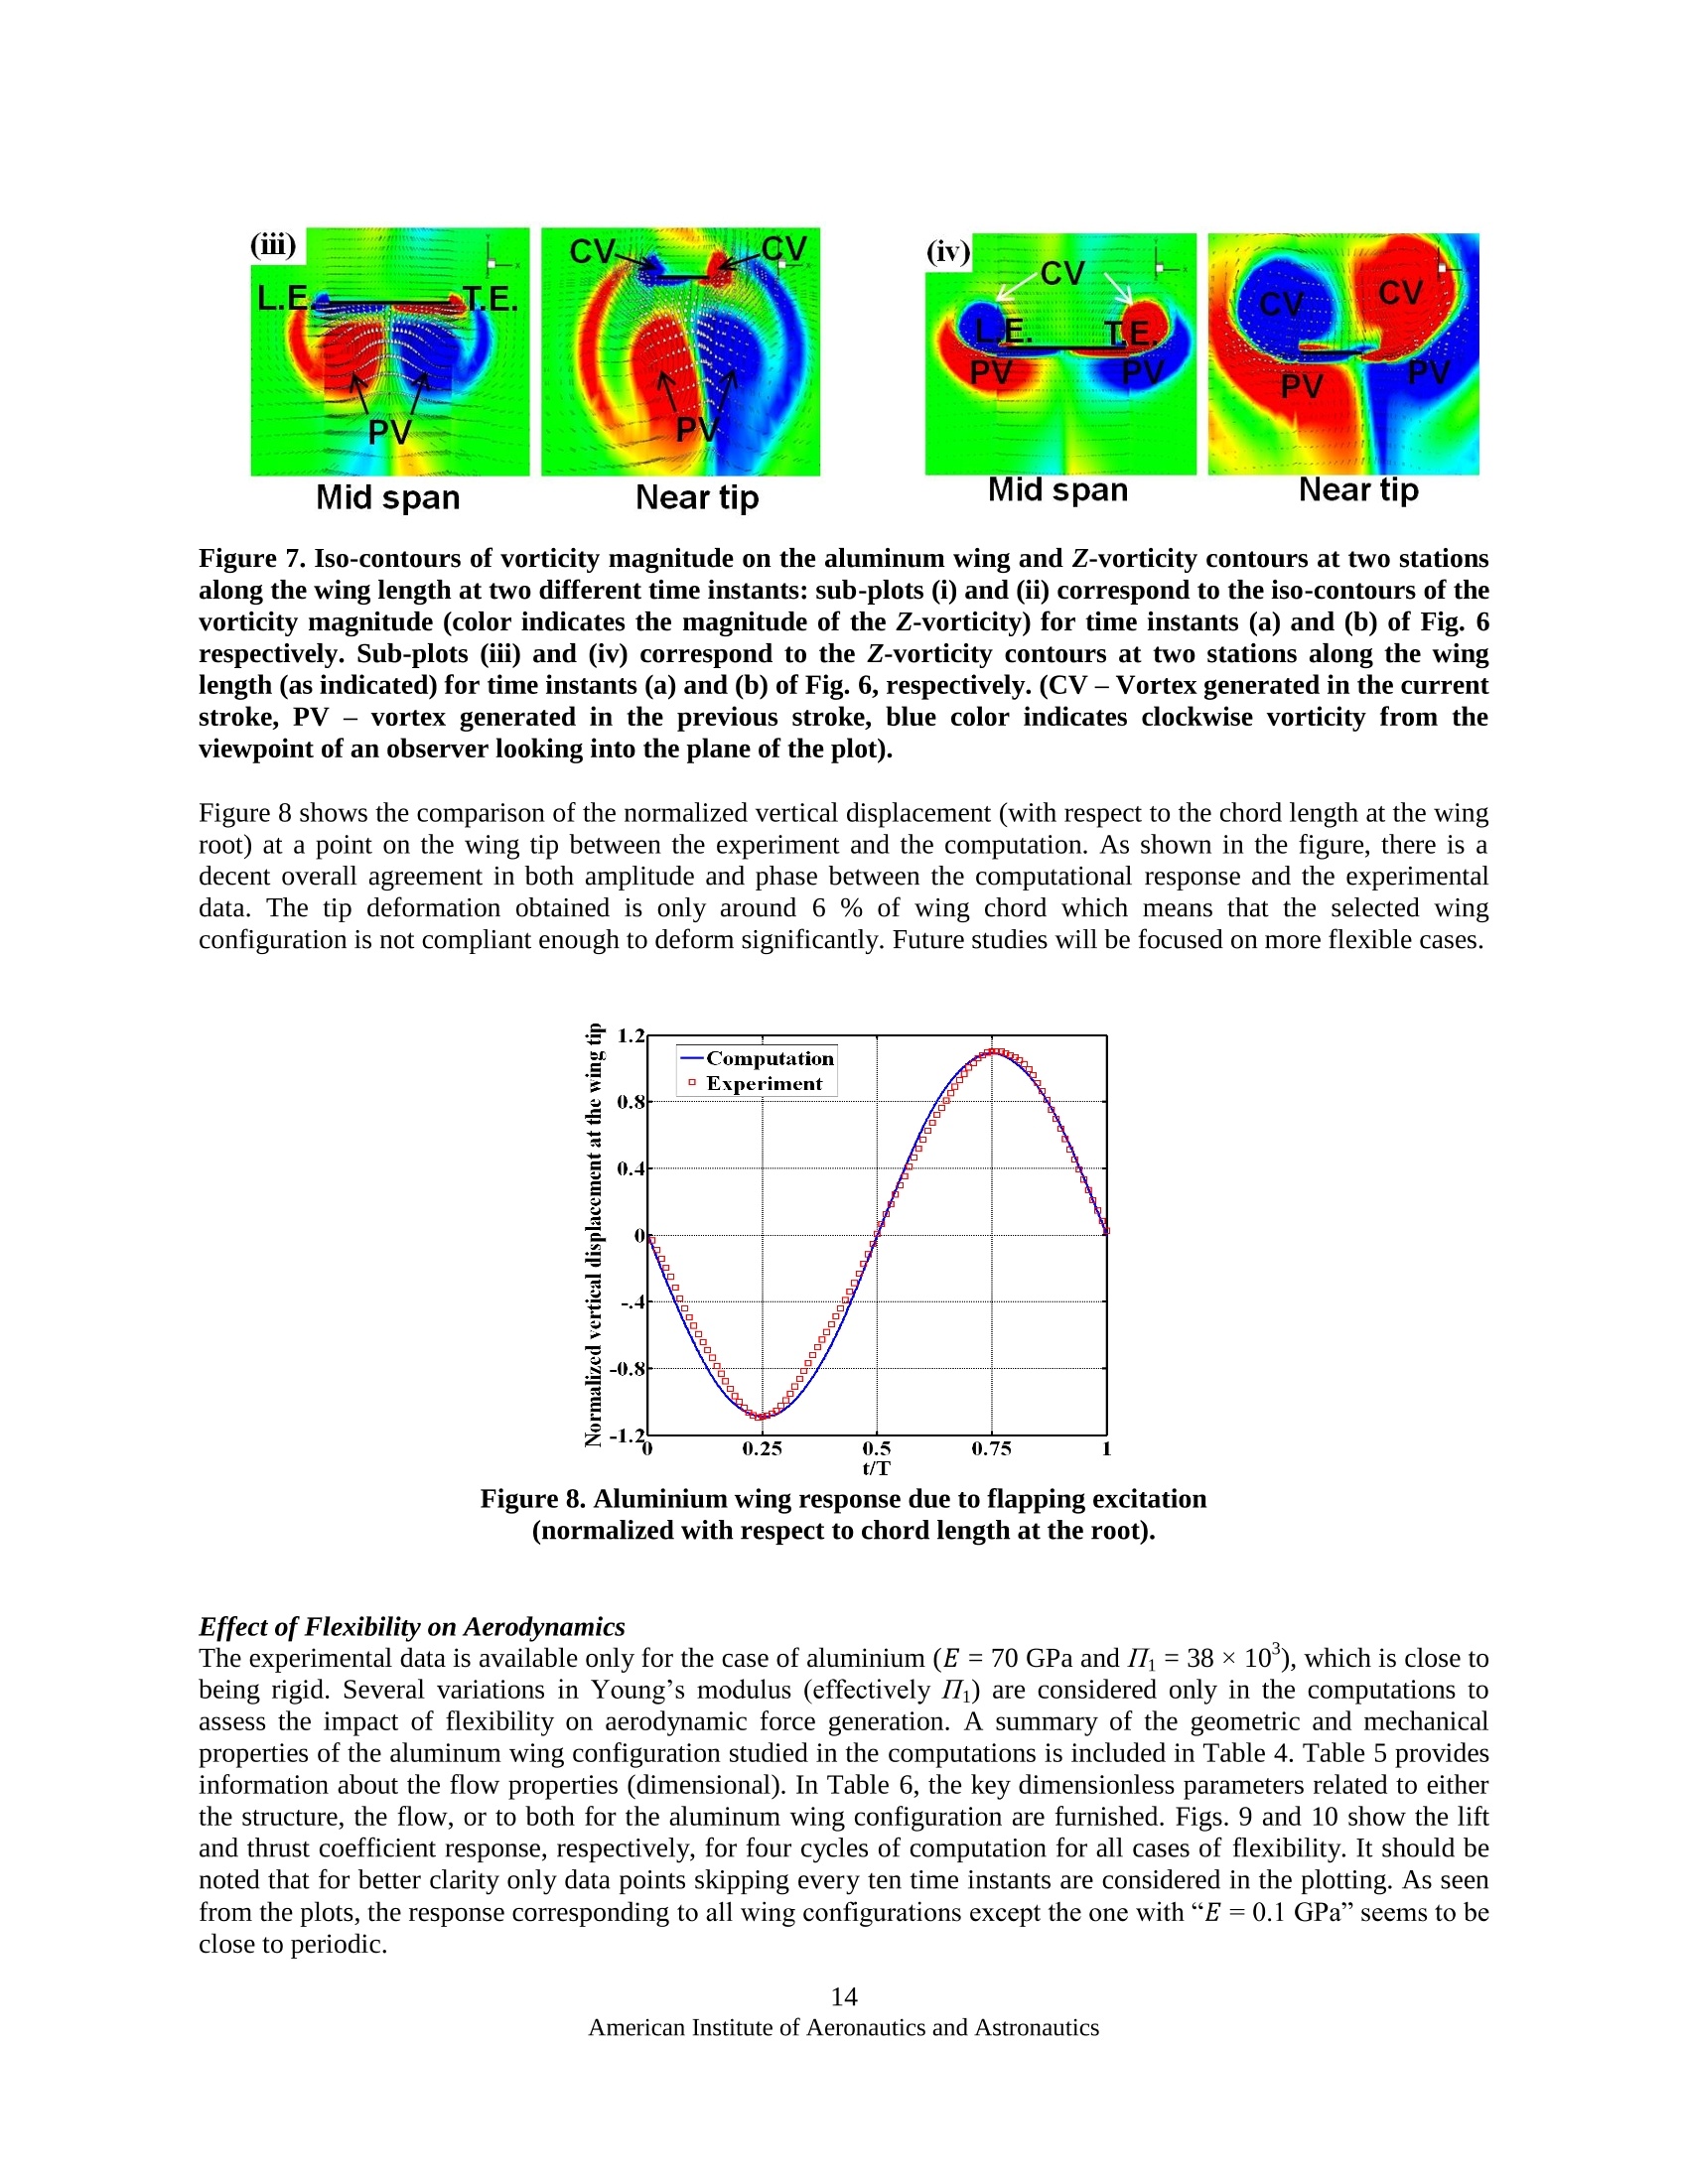
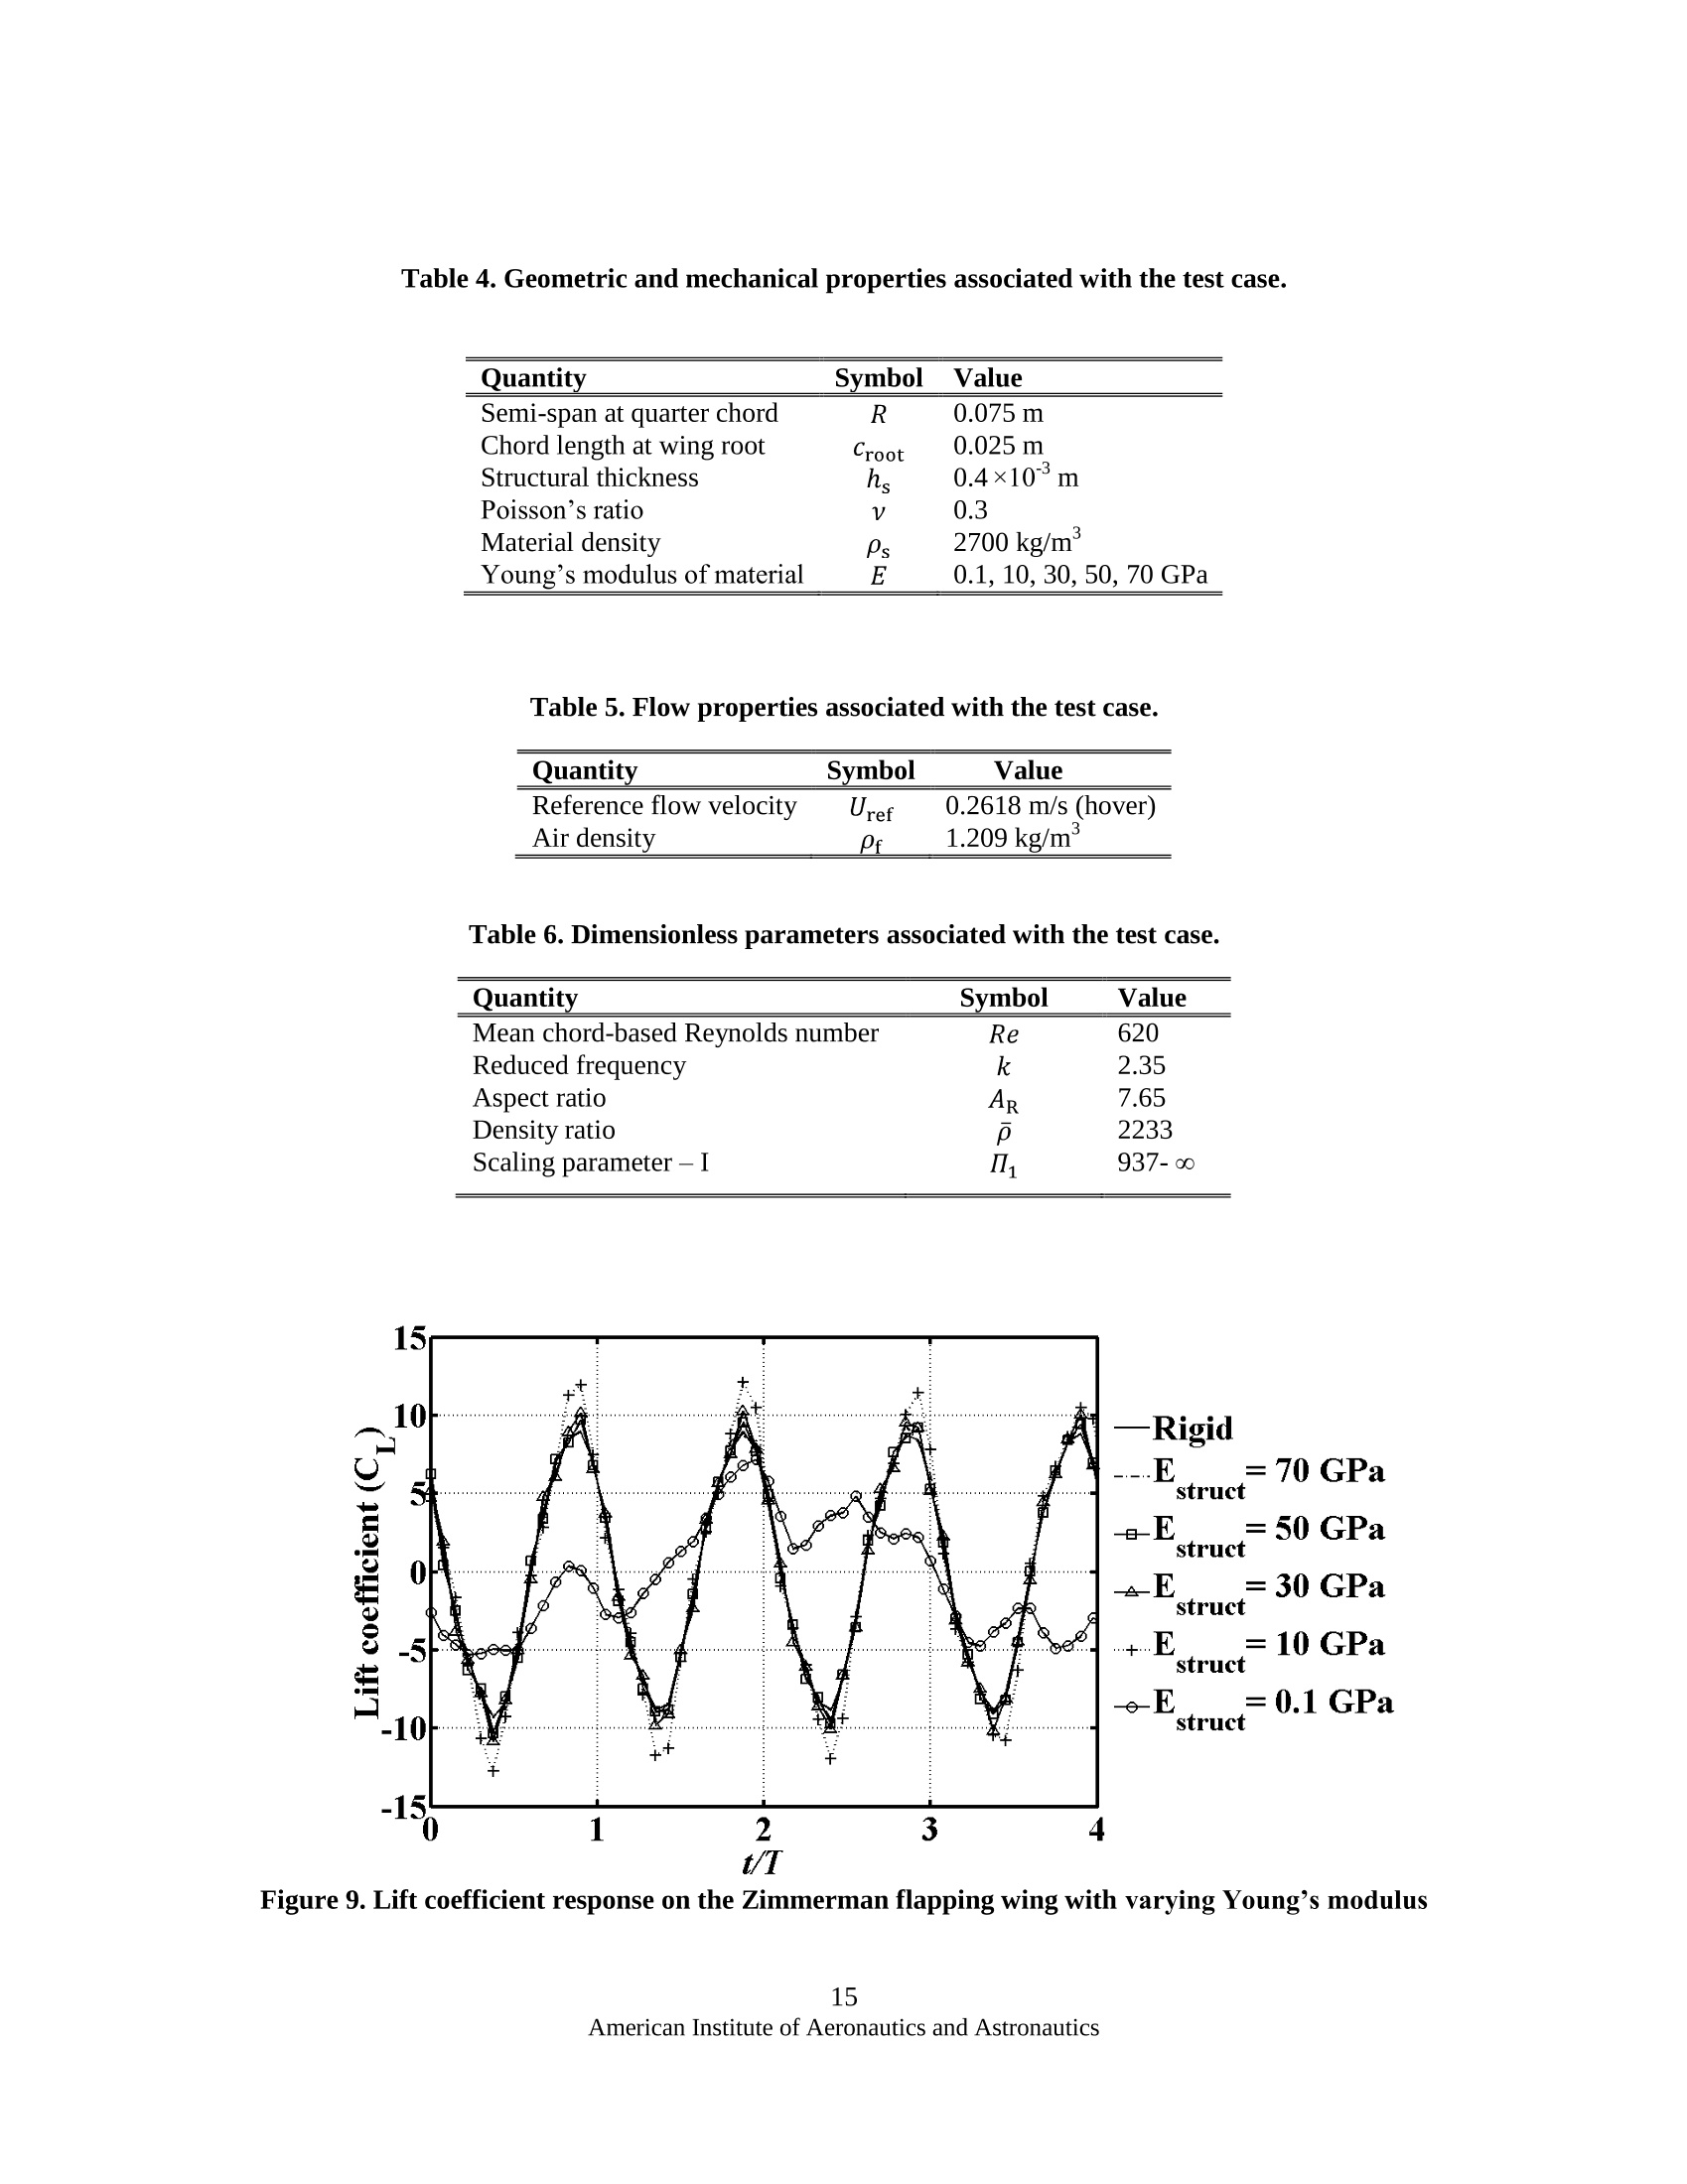
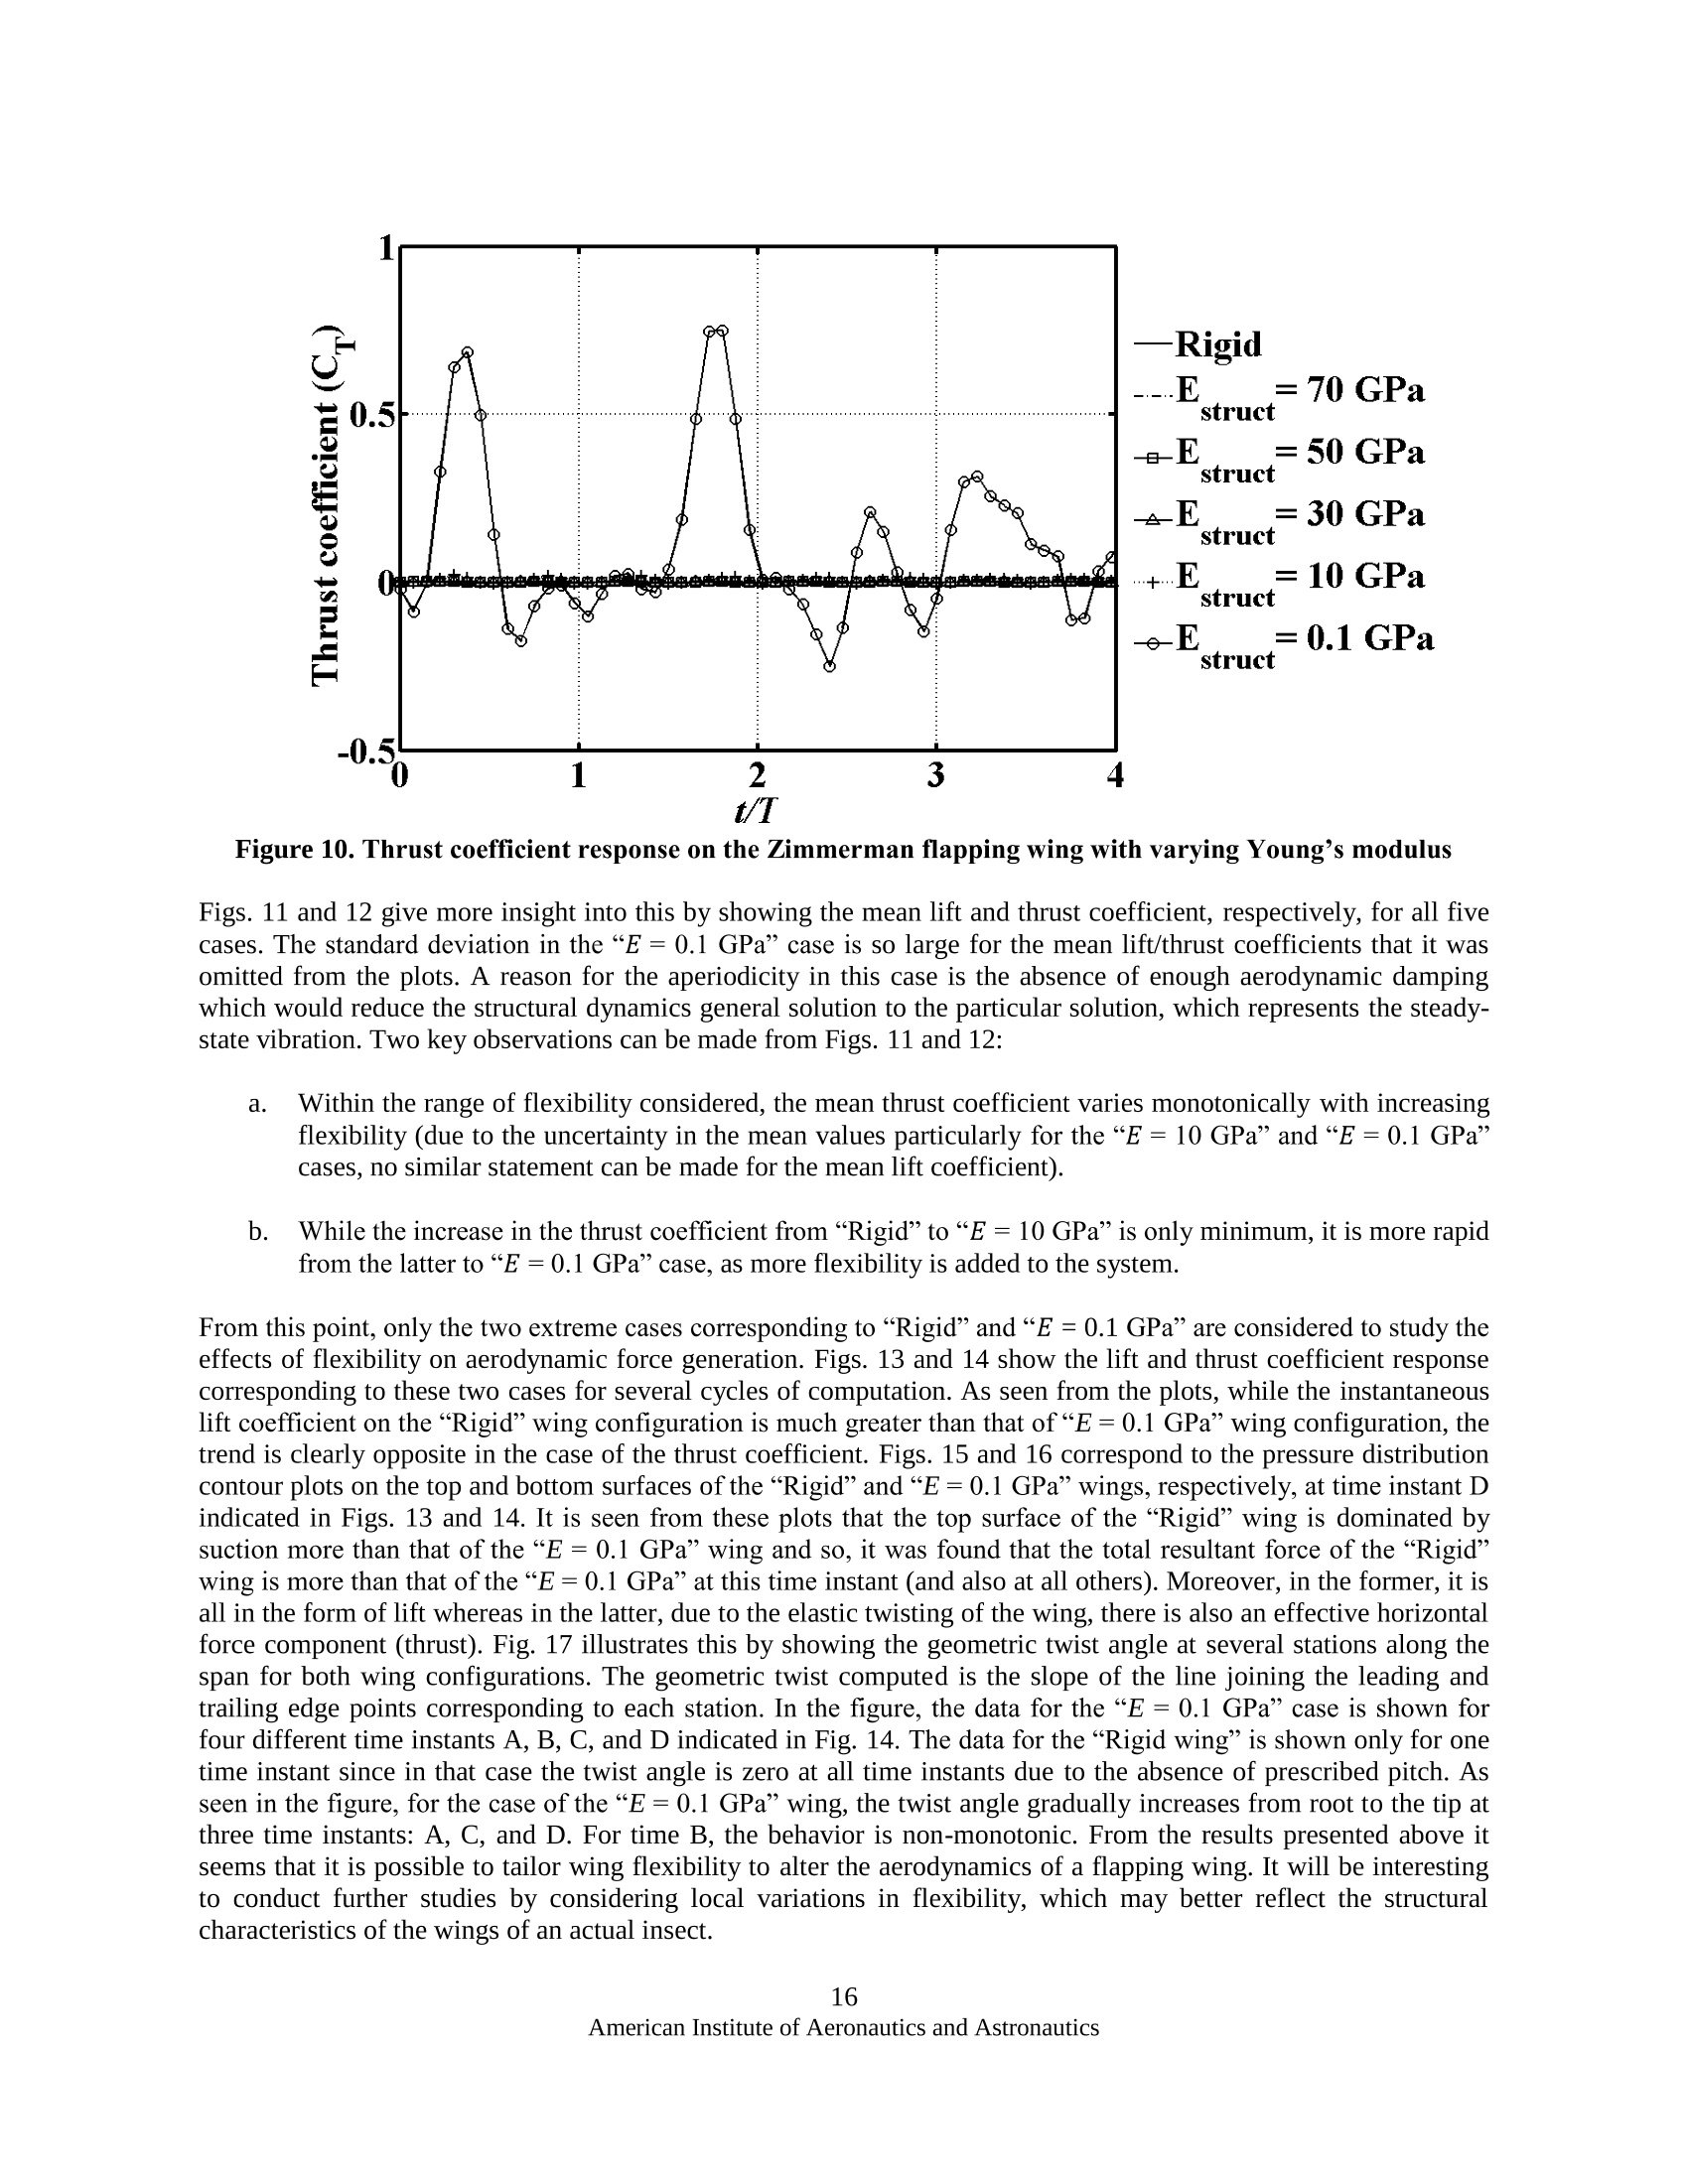
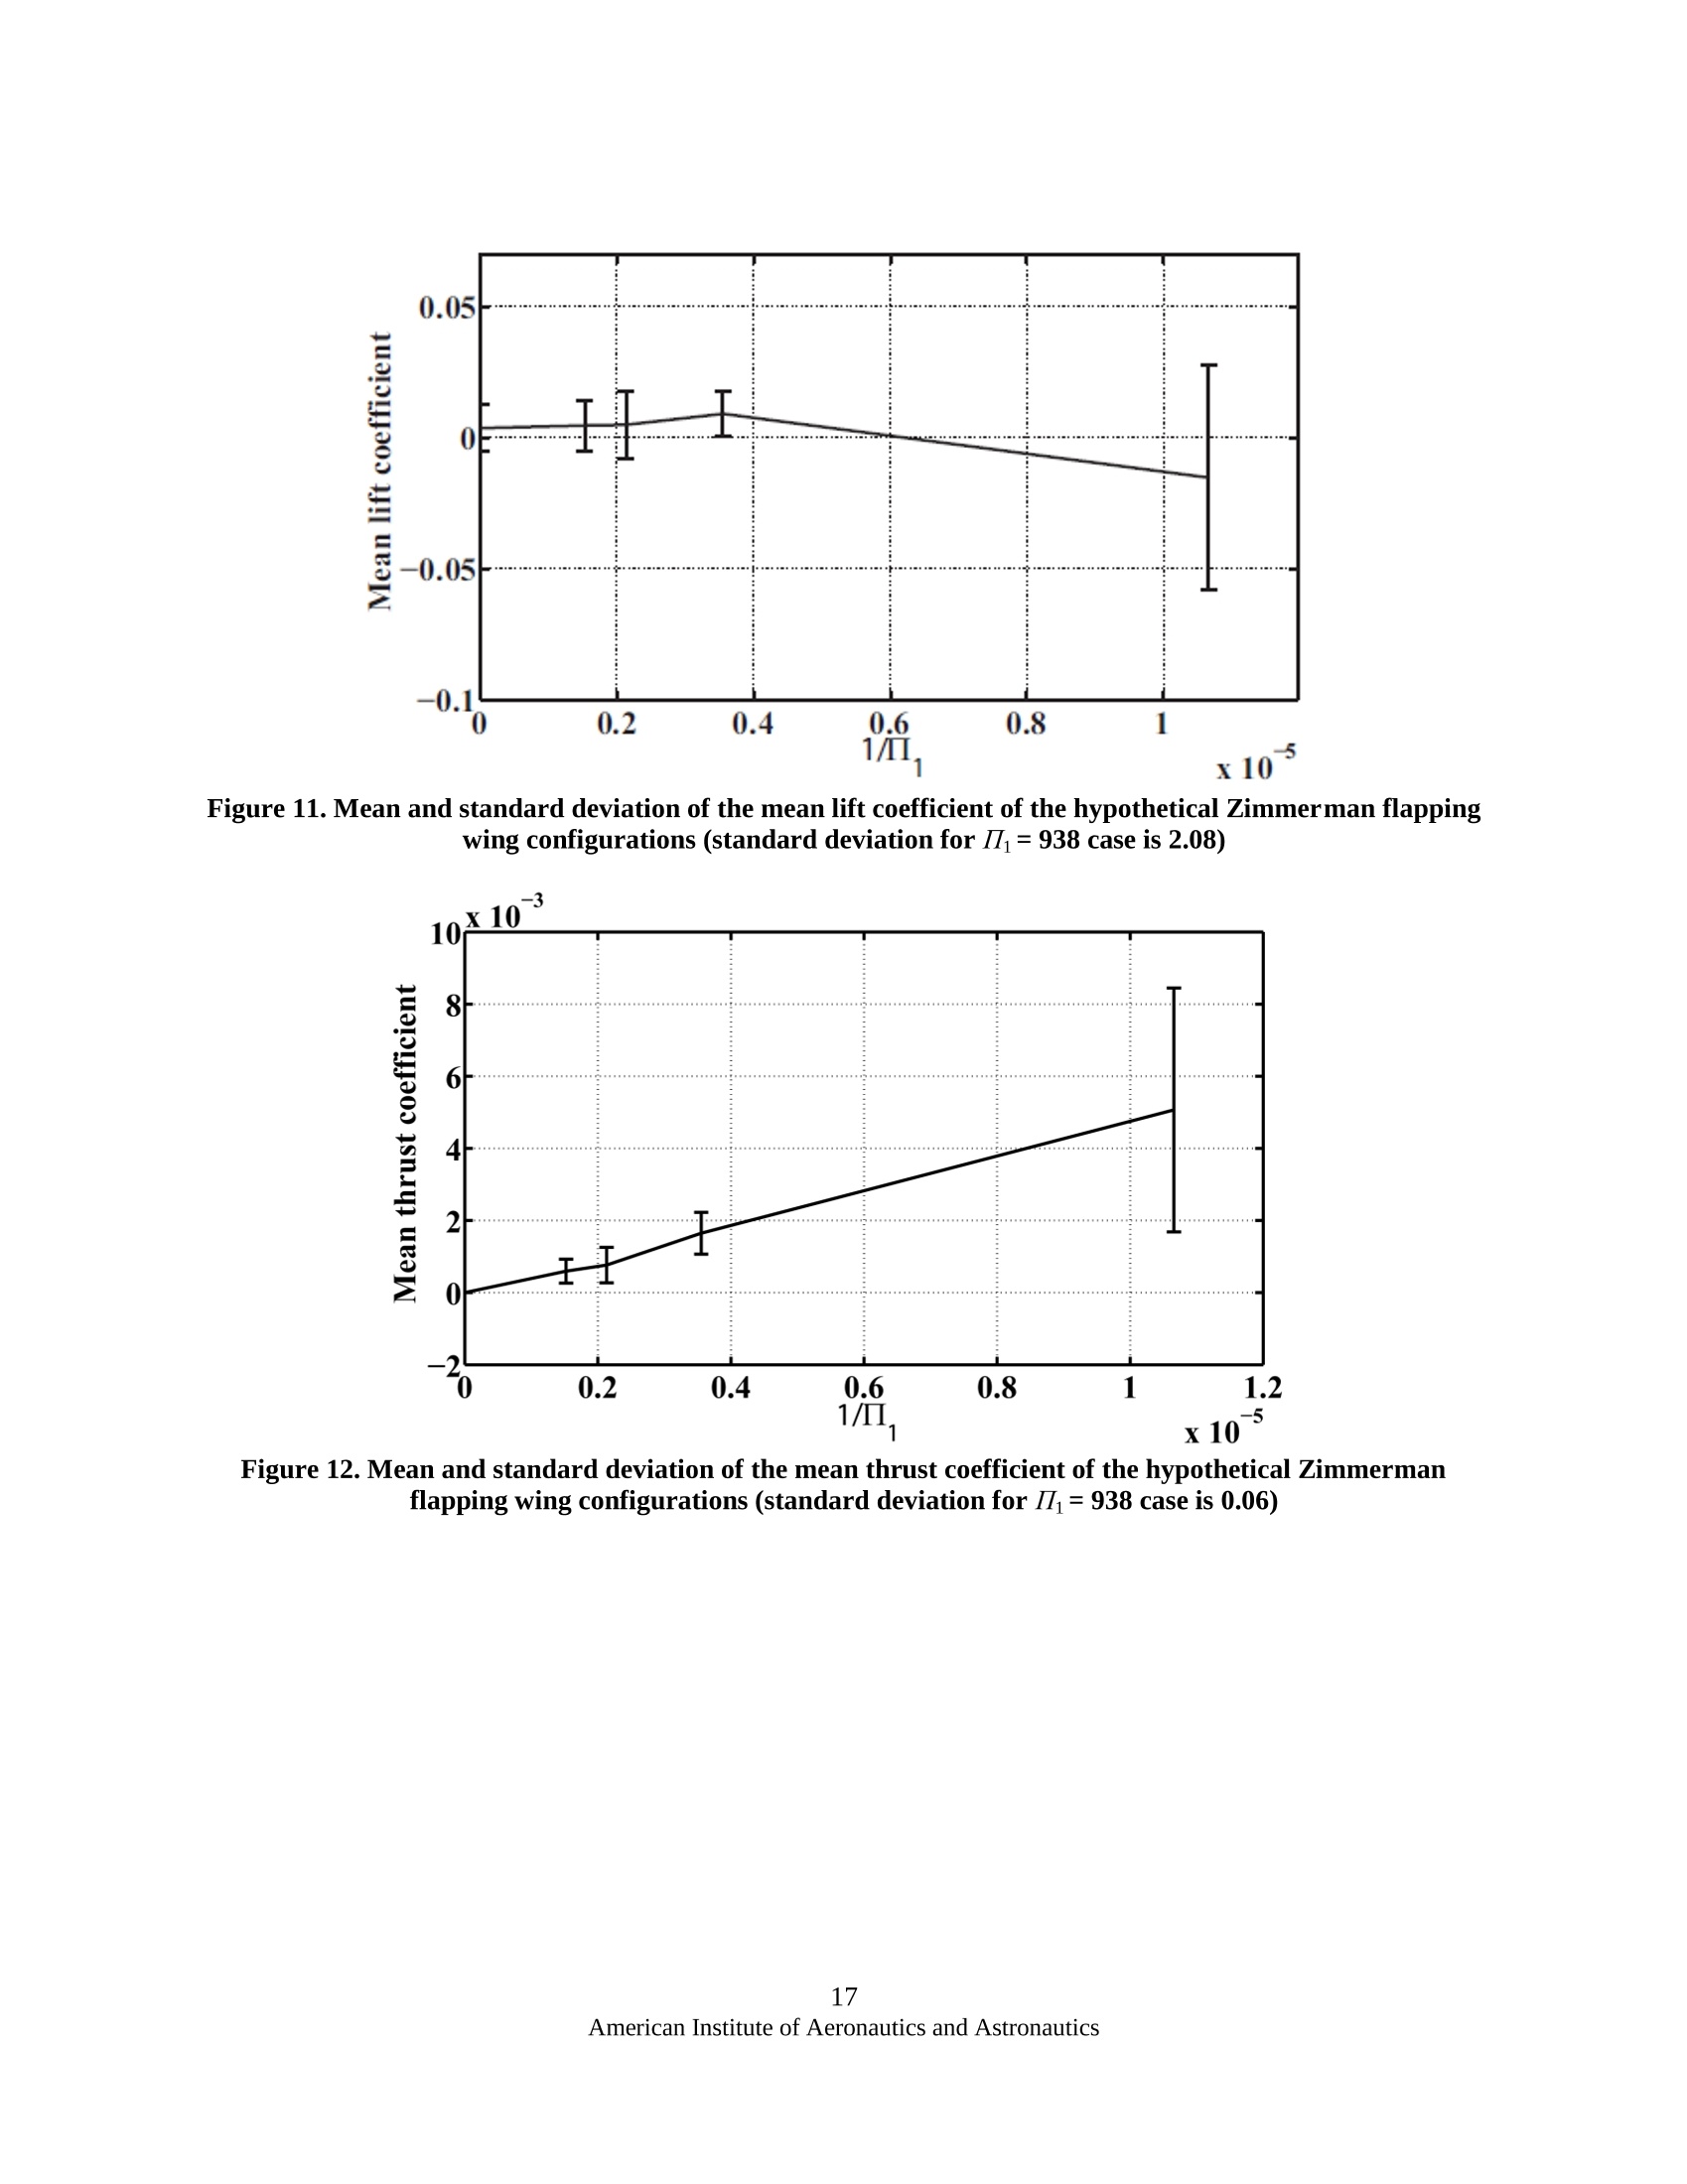
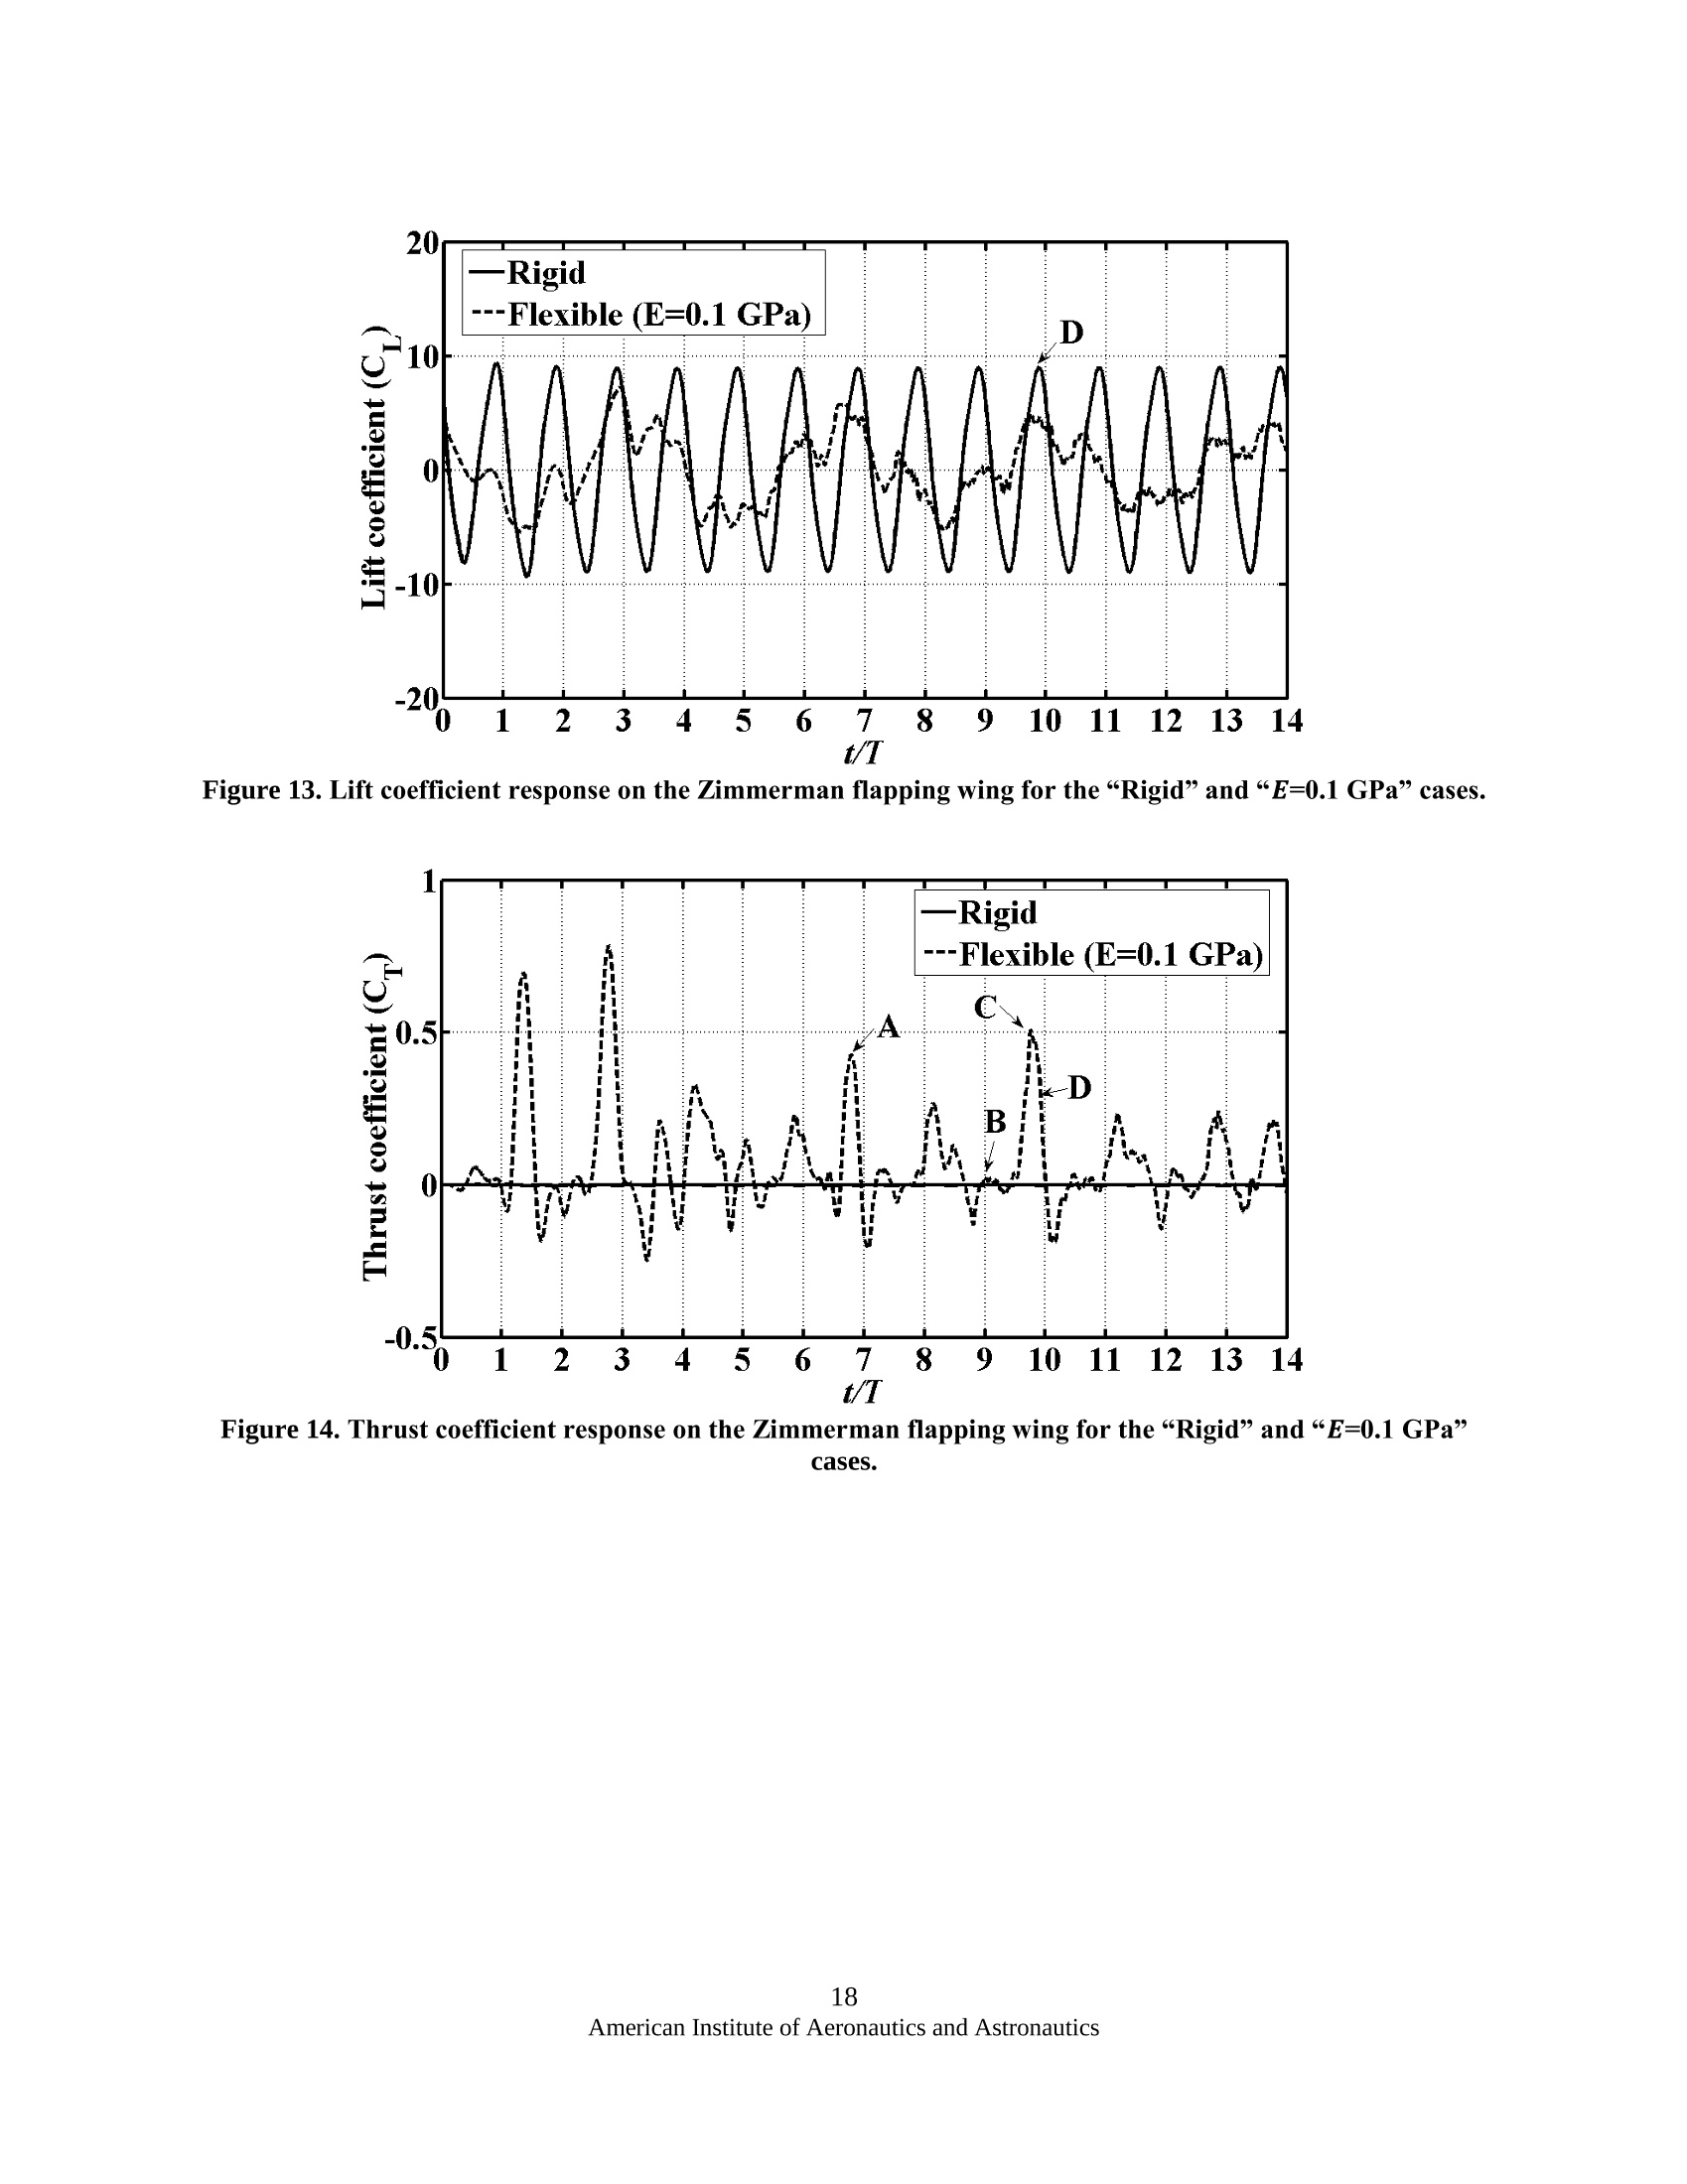
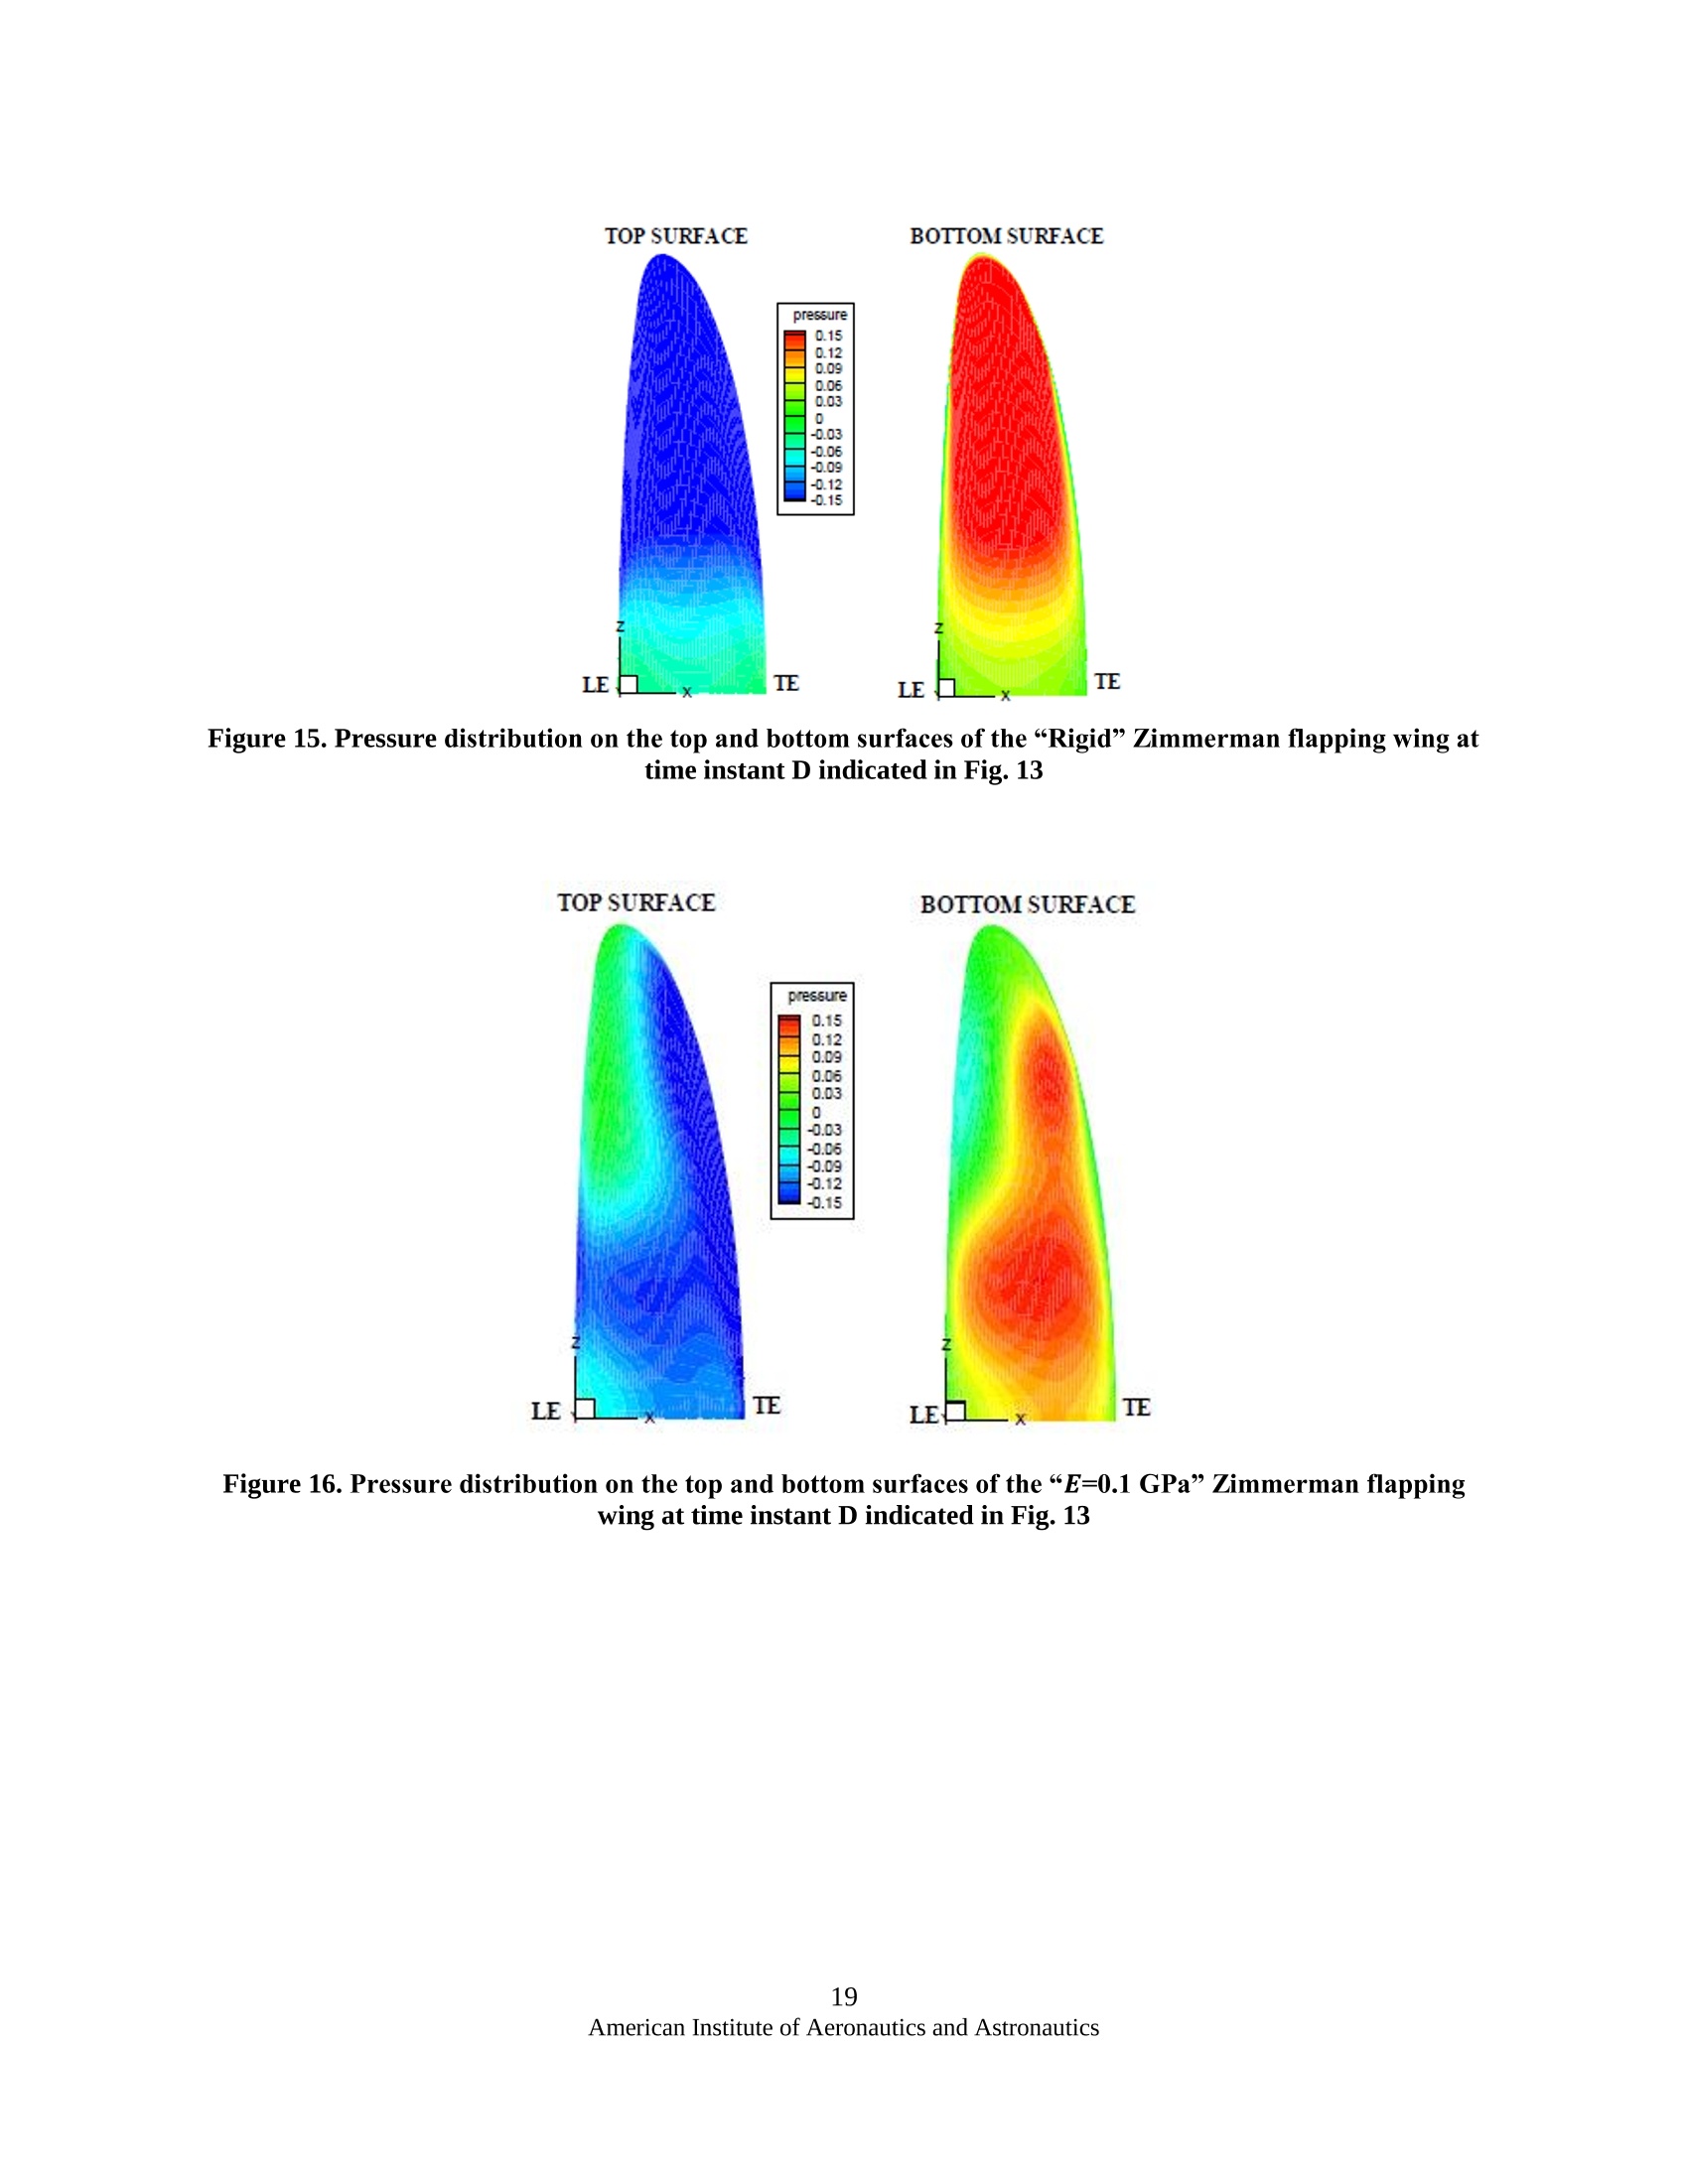
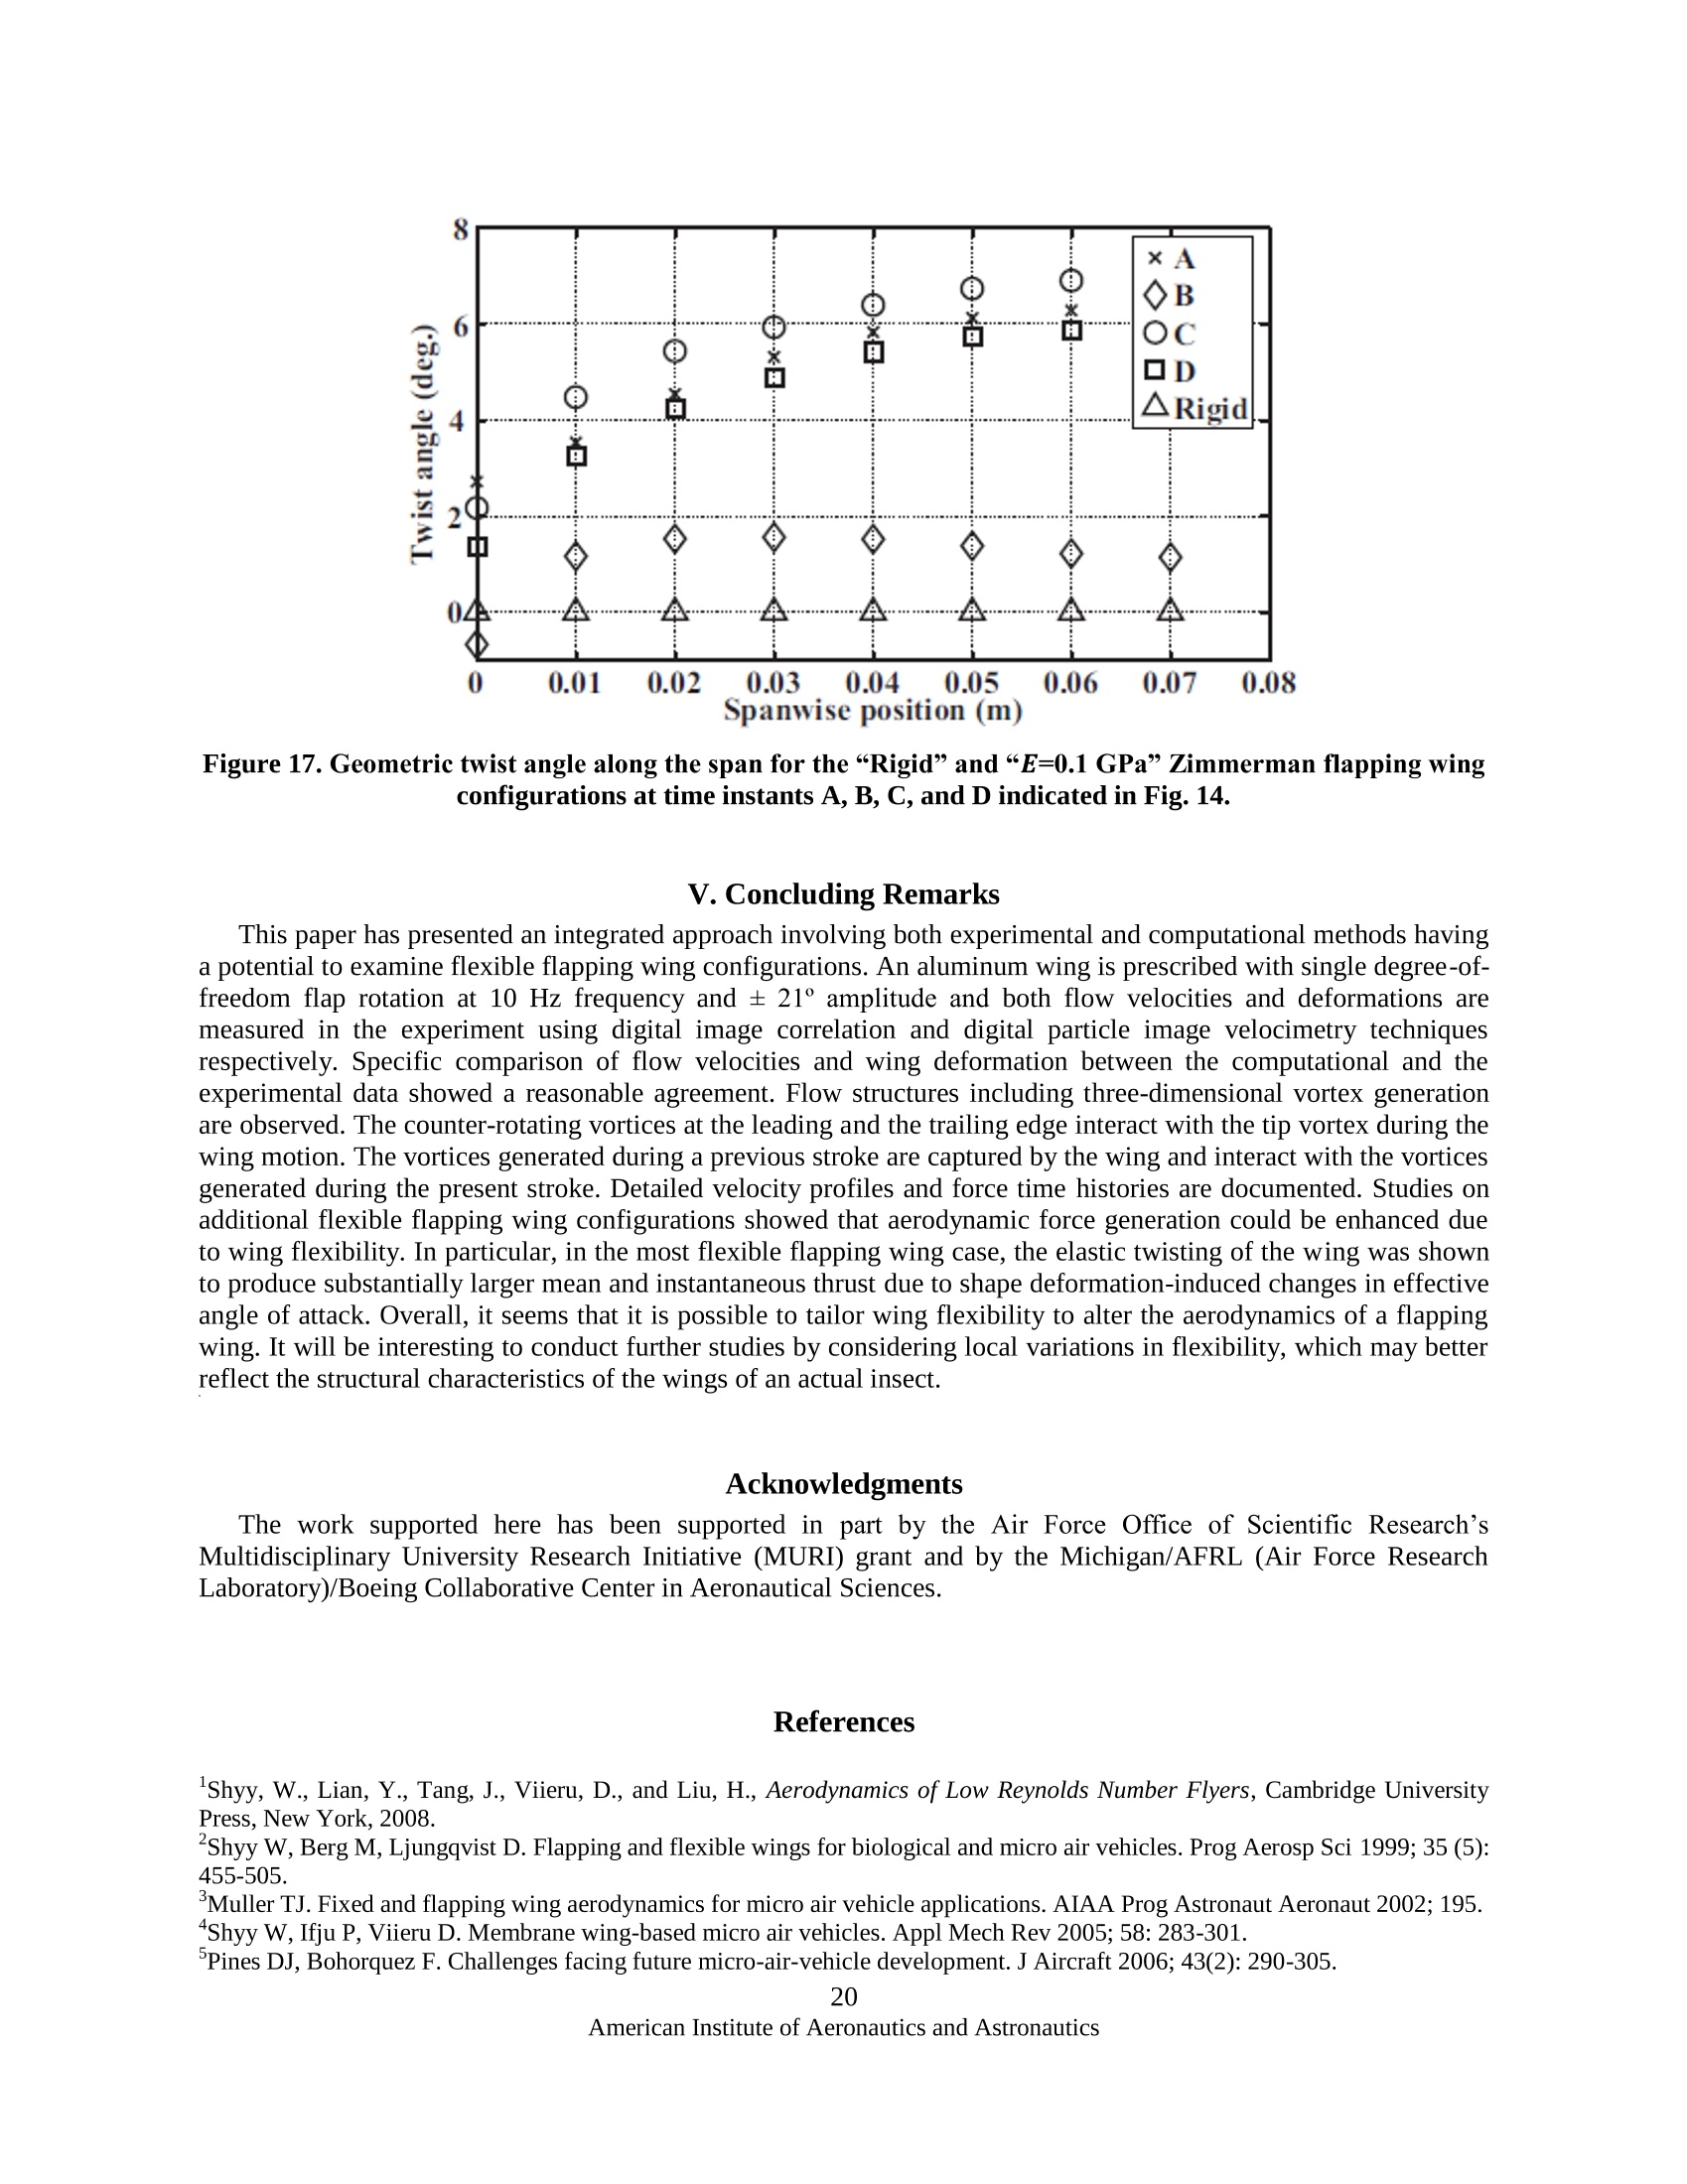
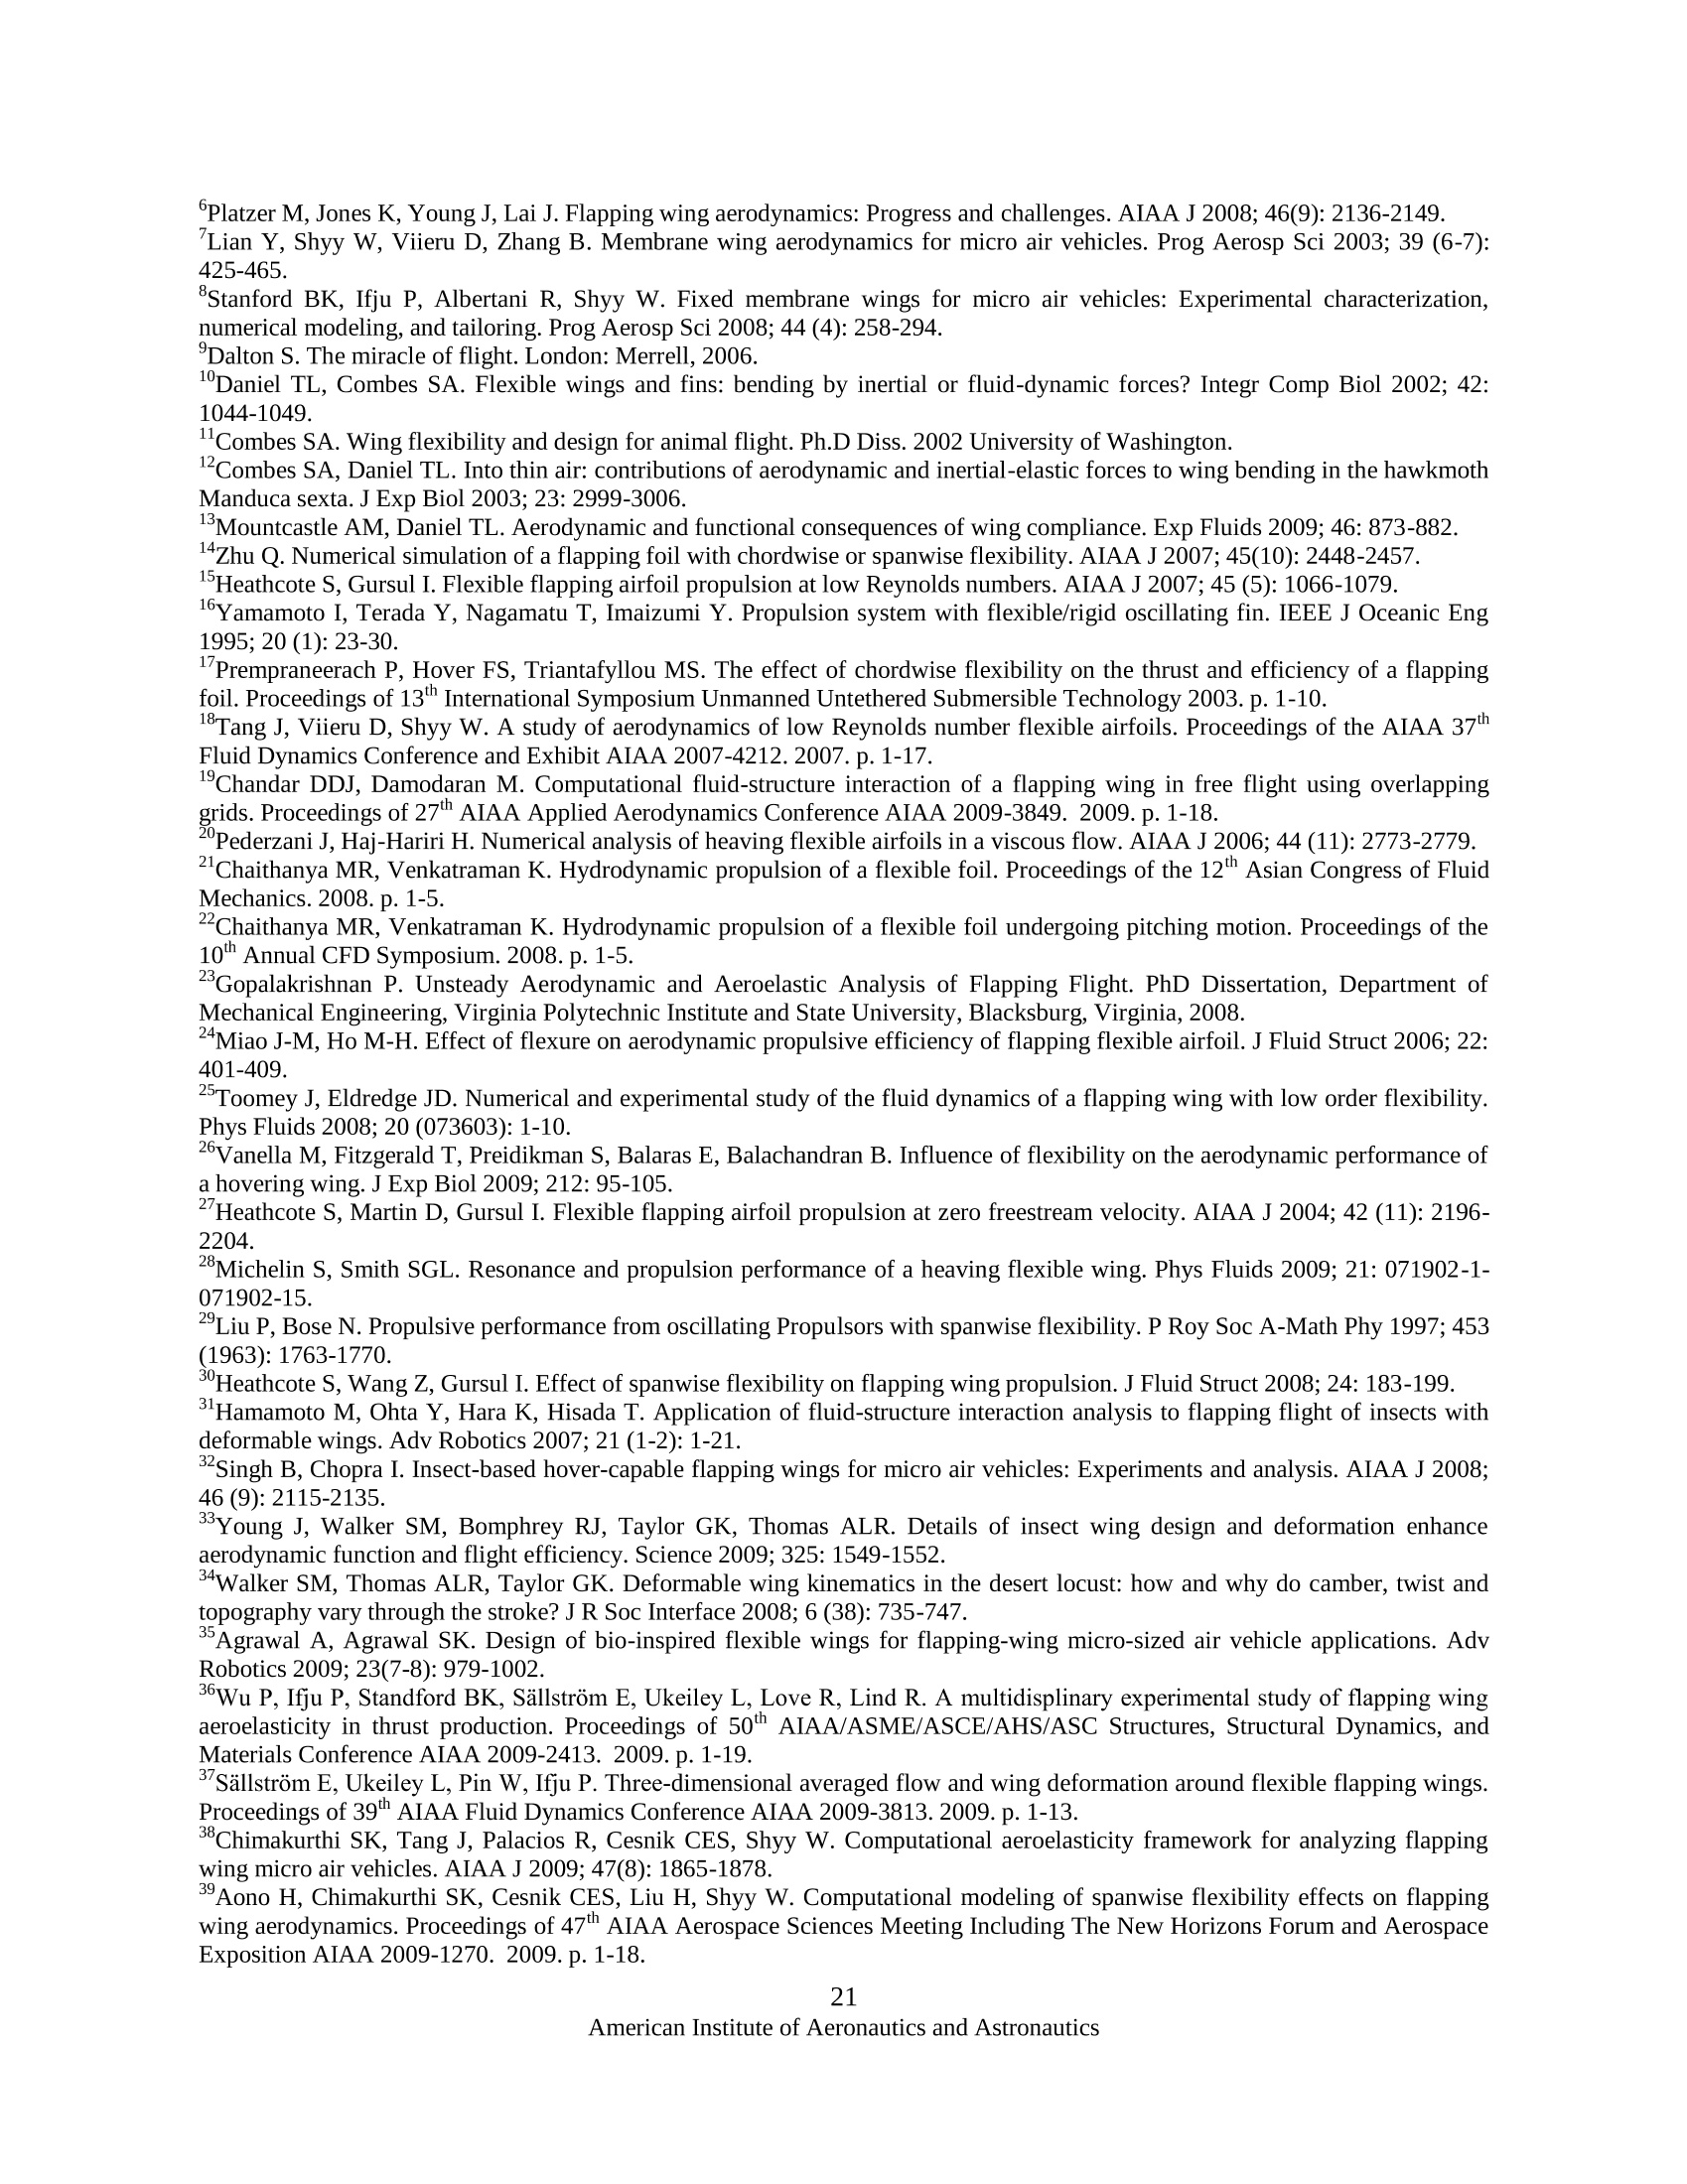
AIAA 2010-55448th AIAA Aerospace Sciences Meeting Including the New Horizons Forum and Aerospace Exposition4- 7 January 2010, Orlando, Florida Instantaneous A Computational and Experimental Study of FlexibleFlapping Wing Aerodynamics Hikaru Aono *, Satish Kumar Chimakurthi2*, Pin Wu**. Erik Sallstrom+**, Bret K. Stanford5**, Carlos E. S. Cesnik *, Peter Ifju7**, Lawrence Ukeiley8**, Wei Shyy9**University of Michigan, Ann Arbor, MI, 48109, U. S. A. ** University of Florida, Florida,FL, 32611, U. S. A. To gain some more understanding of the flapping wing aerodynamics and aeroelasticity associated withbiological flyers and micro air vehicles (MAVs), a combined computational and experimental study of a wellcharacterized flapping wing structure was conducted. In particular, the coupling between aerodynamics andstructural dynamics plays an important role in such flyers but to date has not been adequately addressed. Anaeroelasticity framework based on a co-rotational shell finite element solver with a Navier-Stokes solver isdeveloped. Experimentally, a customized digital image correlation system measures the wing deformation, aload sensor attached to the flapping mechanism records the forces produced by the flapping motion, and astereo digital particle image velocimetry measures the flow velocities. Computational efforts with insight intothe fluid physics are reported. Relevant fluid physics are documented including the counter-rotating vorticesat the leading and the trailing edge which interact with the tip vortex during the wing motion. Overall, goodcorrelations between experiment and computation are attained. Furthermore, studies on hypothetical flexibleflapping wing configurations showed that wing flexibility can be tailored to alter the aerodynamics of aflapping wing. Nomenclature ( Postdoctoral Research Fellow, Aerospace Engineering, ao noh@umich.edu, Member AIAA. ) ( Postdoctoral Research Fellow, Aerospace Engineering, sa tishkc@umich.edu, Member AIAA. ) ( 'Graduate Student, Mechanical and Aerospace Engineering, d iccidwp@ufl.edu, Member AIAA. ) ( “Graduate Student, Mechanical and Aerospace Engineering, eriksallstrom@gmail.com, Member AIAA. ) Currently National Research Council Postdoctoral Fellow, AFRL, bstan@ufl.edu, Member AIAA. ( Professor, Aerospace Engineering, cesnik@umich.edu, Associate Fellow AIAA. ) Professor, Mechanical and Aerospace Engineering, ifju@ufl.edu. Assistant Professor, Mechanical and Aerospace Engineering, ukeiley@ufl.edu, Associate Fellow AIAA Clarence L. “Kelly”Johnson Collegiate Professor and Chair, weishyy@umich.edu, Fellow AIAA. I. Introduction icro Air Vehicles (MAVs) have the potential to revolutionize our sensing andM information gatheringcapabilities in areas such as environmental monitoring and homeland security. Numerous vehicle concepts,including fixed wing, rotary wing, and flapping wing, have been proposed . As the size of a vehicle becomessmaller than a few centimeters, fixed wing designs encounter fundamental challenges in lift generation and flightcontrol. There are merits and challenges associated with rotary and flapping wing designs. Fundamentally, due to theReynolds number effect, the aerodynamic characteristics such as the lift, drag and thrust of a flight vehicle changeconsiderably between MAVs and conventional manned air vehicles 1. And, since MAVs are of light weight and flyat low speeds, they are sensitive to wind gusts. Furthermore, their wing structures are often flexible and tend todeform during flight. Consequently, the fluid and structural dynamics of these flyers are closely linked to each other.Because of the common characteristics shared by MAVs and biological flyers, the aerospace and biological sciencecommunities are now activenOW a&ly communicating and collaborating. Much can be shared between researchers withdifferent training and background including biological insight, mathematical models, physical interpretation,experimental techniques, and design concepts. Research in the aeroelasticity of flapping wings has substantially increased recently though a full understandingis still lacking. For example, investigations by Daniel and Combes suggested that aerodynamic loads are relativelyunimportant in determining the bending patterns in oscillating wings. Subsequently, experimental investigations byCombes and Combes and Daniel’ found that the overall bending patterns of a Hawkmoth wing are quite similarwhen flapped (single degree-of-freedom flap rotation) in air and helium, despite a 85% reduction in fluid density inthe latter, suggesting that the contribution of aerodynamic forces is relatively minor compared to the contribution ofinertial-elastic forces due to flapping motion. However, they mentioned that realistic wing kinematics might includerapid rotation at the stroke reversal that may lead to increased aerodynamic forces due to unsteady aerodynamicmechanisms. Also, static bending tests by Combes and Daniel,12 showed anisotropy of wing structures in a varietyof insect species. More recently, Mountcastle and Daniel investigated the influence of wing compliance on themean advective flows (indicative of induced flow velocity) using PIV techniques. Their results demonstrated thatflexible wings yield mean advective flows with substantially greater magnitudes and orientations more beneficial tolift than those of stiff wings. Zhul4 performed a fully coupled fluid-structure interaction analyses to investigate a chordwise flexible airfoilprescribed with pure plunge motion. To clarify the role of inertia on the deformation, the wing was studied in bothwater and air. Results showed that when the wing is immersed in air, the chordwise flexibility reduces both thethrust and the propulsion efficiency. However, when the wing is immersed in water, it increases the efficiency.Further, he performed numerical investigations on a thin flapping foil prescribed with pure plunge motion in forwardflight in different both air and water. The results showed that when the wing was immersed in air, the spanwiseflexibility (through equivalent plunge and pitch flexibility) increased the thrust without an efficiency reduction andwhen the same wing was immersed in water, the spanwise flexibility reduced both the thrust and efficiency.Heathcote and Gursul, Yamamoto et al., Prempraneerach et al., Tang et al., and Chandar and Domadran9presented studies on both rigid and partially chordwise flexible airfoils prescribed with both pure plunge and/orcombined plunge/pitch motions in water and showed that flexible wings may be more efficient than the rigid ones.In particular, Pederzani and Haj-Hariri’ suggested that lighter plunging airfoils are capable of generating morethrust than heavier ones and are more efficient. They performed computational analyses on a rigid wing from whicha portion was cut out and covered with a very thin and flexible material (latex) and showed that due to a snappingmotion (i.e. non zero velocity in the direction opposite to that of the following stroke) of the latex at the beginning of each stroke, the strength of the vortices that are shed is higher in lighter wing structures, leading to the generation ofmore thrust. Furthermore, such structures require less input power in order to be snapped than heavier ones.Chaithanya and Venkatraman21,22 investigated the influence of inertial effects due to prescribed motion on the thrustcoefficient and propulsive efficiency of a plunging/pitching thin plate using inviscid flow theory and beamequations. Their results demonstrate that flexible airfoils with inertial effects yield more thrust than those withoutinertial effects. This is due to the increase in the fluid loading in the former which subsequently lead to an increasein the deformation. Due to their shape, deformed airfoils produce a force component along the forward velocitydirection². Gopalakrishnan²analyzed the effects of elastic cambering of a rectangular membrane flapping wing onaerodynamics in the forward flight using a linear elastic membrane solver coupled with an unsteady LES method.Different membrane pre-stresses were investigated to give a desired camber in response to the aerodynamic loading.The results showed that the camber introduced by the wing flexibility increased the thrust and lift productionconsiderably. Analysis of flow structures revealed that the LEV stayed attached on the top surface of the wing,followed the camber, and covered a major part of the wing, which resulted in high force production. On the otherhand, for rigid wings (which were also considered) the leading edge vortex lifted off from the surface resulting inlow force production. Miao and Ho²4 prescribed a time-dependent flexible deformation profile to an airfoil in pure plunge andinvestigated the effect of flexure amplitude on the unsteady aerodynamic characteristics for various combinations ofReynolds number and reduced frequency. For a specific combination of Reynolds number, reduced frequency, andplunge amplitude, the results showed that thrust-indicative wake structures are observed behind the trailing edge ofthe airfoil for airfoils with flexure amplitudes of 0.0-0.5 of the chord length. It was shown that, this wake structureevolved into a drag-indicative form as the flexure amplitude of the airfoil was increased to 0.6 and 0.7 of the chordlength. Studies conducted under various combinations of Reynolds number and reduced frequency showed that thepropulsive efficiency of a chordwise flexible airfoil in pure plunge is influenced primarily by the value of thereduced frequency rather than by that of the Reynolds number. Toomey and Eldredgeperformed numerical andexperimental investigations to understand the role of flexibility in flapping wing flight using two rigid ellipticalsections connected by a hinge with torsion spring. The section at the leading edge was prescribed with fruit fly-likehovering wing kinematics, while the trailing edge section responded passively due to the fluid dynamic andinertial/elastic forces. It was found that the lift force and wing deflection are primarily controlled by the nature of thewing rotation. Faster wing rotation, for example, led to larger peak deflection and lift generation. Advanced rotationalso led to a shift in the instant of peak wing deflection which increased the mean lift. In contrast to the rotationalkinematics, the translational kinematics were shown to have very little impact on spring deflection or force. And,while the former was shown to be nearly independent of Reynolds number, the latter was shown to increase withincreasing Reynolds number. Vanella et a1.2 conducted numerical investigations on a similar structure and found that approximately 30%increase in lift is realized when the wing is excited by a non-linear resonance at 1/3 of its natural frequency. For allReynolds numbers considered, the wake capture mechanism was enhanced due to a stronger flow around the wing atstroke reversal, resulting from a stronger vortex at the trailing edge. Heathcote et al. investigated the effect ofchordwise flexibility on aerodynamic performance of an airfoil in pure plunge under hovering conditions. Becausethe trailing edge is a major source of shedding of vorticity at zero freestream velocity, they showed that theamplitude and phase angle of the motion of the trailing edge affect the strength and spacing of the vortices, and thetime averaged velocity of the induced jet. Direct force measurements confirmed that at high plunge frequencies, thethrust coefficient of the airfoil with intermediate stiffness is highest, although the least stiff airfoil can generatelarger thrust at low frequencies. It was suggested that there is an optimum airfoil stiffness for a given plungefrequency and amplitude. Similar conclusions were made in another study28 wherein, the influence of resonance onthe performance of a chordwise flexible airfoil prescribed with pure plunge motion at its leading edge was studied. Itwas shown that while the mean thrust could increase with an increase in flexibility, above a certain threshold thewing is too flexible to communicate momentum to the flow. Further, too much flexibility led to a net drag and henceonly a suitable amount of flexibility was desirable for thrust generation. Numerical simulations were performed by Liu and Bose for a 3-D pitching and plunging wing in forward flight.Their results showed that the phase of the flexing motion of the wing relative to the prescribed heave motion plays akey role in determining thrust and efficiency characteristics of the fin. Heathcote et al. conducted water-tunnelstudies to study the effect of spanwise flexibility on the thrust, lift, and propulsive efficiency of a plunging flexiblewing configuration in forward flight. Hamamoto et al. conducted a fluid-structure interaction analysis on a deformable dragonfly wing in hover andexamined the advantages and disadvantages of flexibility. They tested three types of flapping flight: a flexible wingdriven by dragonfly flapping motion, a rigid wing (stiffened version of the original flexible dragonfly wing) driven by dragonfly flapping motion, and a rigid wing driven by modified flapping based on tip motion of the flexiblewing. They found that the flexible wing with nearly the same average energy consumption generated almost thesame amount of lift force as the rigid wing with modified flapping motion, which realized the same angle of attackat the aerodynamically dominant sections of the wing. However, the rigid wing required 19% more peak torque and34% more peak power, indicating the usefulness of wing flexibility. Singh and Chopradeveloped an exper ntalapparatus with a bio-inspired flapping mechanism to measure the thrust generated for a number of wing designs.The key conclusions that stemmed from this study were that the inertial loads constituted the major portion of thetotal loads acting on the flapping wings tested on the mechanism and that for all the wings tested, the thrust droppedat higher frequencies. Further, the author found that at such frequencies, the light-weight and highly flexible wingsused in the study exhibited significant aeroelastic effects. Young et al. conducted numerical investigations on atethered desert locust called Schistocerca gregaria. Results demonstrated that time-varying wing twist and camberwere essential for the maintenance of attached flow. The authors emphasized that while high-lift aerodynamics wastypically associated with massive flow separation and large LEVs, when high lift was not required, attached flowaerodynamics could offer greater efficiency. Their results further showed that, in designing robust lightweight wingsthat could support efficient attached flow, it was important to build a wing that undergoes appropriate aeroelasticwing deformation through the course of a wing beat. Agrawal and Agrawal investigated the benefits of insect wing flexibility on flapping wing aerodynamics basedon experiments and numerical simulations. They compared the performance of two synthetic wings: (i) a flexiblewing based on a bio-inspired design of the hawkmoth (Manduca sexta) wing and (ii) a rigid wing of similargeometry. The results demonstrated that more thrust was generated by the bio-inspired flexible wing compared tothe rigid wing in all wing kinematic patterns considered. They emphasized that the results provided motivation forexploring the advantages of passive deformation through wing flexibility and that coupled fluid-structuresimulations of flexible flapping wings were required to gain a fundamental understanding of the physics and toguide optimal flapping wing MAV designs. Wu et al. and Sallstrom et al. presented a multidisciplinary experimental endeavor correlating flapping wingMAVs aeroelasticity and thrust production by quantifying and comparing elasticity, dynamic responses, and air flowpatterns of six different pairs of MAV wings (in each one, the membrane skin was reinforced with different leadingedge and batten configurations) of the Zimmerman planform (two ellipses meeting at the quarter chord) withvarying elastic properties. In their experiment, single degree-of-freedom flapping motion was prescribed to thewings in both air and vacuum. Amongst many conclusions, they found that, within the range of flexibilityconsidered, more flexible wings are more thrust-effective at lower frequencies whereas stiffer wings are moreeffective at higher frequencies. They hypothesized that flexible wings may have a certain actuation frequency forpeak thrust production and the performance would degrade once that frequency is passed. These studies as well as the investigations of Heathcote et a1.27,30, Chimakurthi et al., Aono et al. 39, and Tanget al.18 offer consistent findings. It seems like the spanwise flexibility increases aerodynamic forces by creatinghigher effective angles of attack via spanwise deformation. However, apart from affecting the overall aerodynamicforce generation, the chordwise flexibility can redistribute lift versus thrust by changing the projection angle of thewing with respect to the freestream by changing airfoil via camber deformation, for example. Of course, similarbehavior may be observed in spanwise flexible with passive twist deformation along the wing span. Overall, bothspanwise and chordwise flexibility need to be considered together in order to optimize the aerodynamic performanceunder different flight speed and environment uncertainty such as wing gust. In order to analyze plate/shell-like structures flapping in incompressible, viscous flow within the low Reynoldsnumber regime, a newly developed aeroelasticity framework" is used. It is based on a partitioned solution of flowand structural solvers capable of supporting implicit coupling38,39. The key features of the present aeroelasrk are discussed ISSticityframewoCSin the next section. The computational analyses are assessed with experimental resultsunder clearly characterized conditions. Specifically, we highlight our ongoing efforts geared towards developing anintegrated computational and experimental approach to perform aeroelastic analyses of flapping wings withinvarious configurations. Experimentally, a customized digital image correlation system measures the wingdeformation, a load sensor attached to the flapping mechanism records the forces produced by the flapping motion,and a stereo digital particle image velocimetry captures the flow structure around the wings. Detailed comparisonsbetween experimental and computational efforts with insight into the fluid physics are reported. Furthermore, theimpact of wing flexibility on flapping wing aerodynamics is presented. II. Numerical Framework for High-Fidelity Flapping Wing Simulations In this section, a brief description of the fluid and structural dynamics approaches for the aeroelastic analysis offlapping wing is presented. From these, an aeroelastic framework is developed for the analysis of low Re flows andtheir interactions with flexible flapping wings. A. Computational Fluid Dynamics Modeling (STREAM) The governing equations of fluid are the unsteady, incompressible 3-D Navier-Stokes equations and thecontinuity equation, which are expressed in vector form as follows: V·U=0. where pr is the fluid density, u is the dynamic viscosity coefficient,U=(U V W) is the velocity vector of thefluid, t is the time,X=(X Y Z) is the position vector of the fluid based on the inertial frame, V is the gradientoperator with respect to X, and p is the pressure, respectively. The flapping wing velocity is chosen as the velocity scale, then the resulting non-dimensional form of the NSequations is: where the over-bar designates the dimensionless variable. This form of the equation separates the reducedfrequency (k=nfcm/Uref) and the Reynolds number (Re = (prLrefUref)/p), making it convenient to study theeffects of these parameters. The numerical solution is obtained using a pressure-based algorithm, with an employment of combined Cartesianand contravariant velocity variables to facilitate strong conservation law formulations and consistent finite-volumetreatment. The convection terms are discretized using a second-order upwind scheme, while the pressure and viscousterms with a second-order central difference scheme. For the time integration, an implicit Euler scheme is employed.A moving grid technique employing the master-slave concept is used to re-mesh the multi-block structured gridfor fluid-structure interaction problems. The geometric conservation law (GCL) originally proposed by Thomas andLombard was incorporated to compute the cell volumes in the moving boundary problem consistently andeliminate artificial mass sources. The specific implementation and implications of the GCL in the context of thepresent solution algorithm have been discussed by Shyy et a1.42. B. Structural Dynamics Solution (UM/NLAMS) The nonlinear structural dynamics solution is based on a flexible multi-body type finite element analysis of aflapping wing using triangular shell elements. It relies on the use of a body-fixed floating frame of reference todescribe the prescribed rigid body motion and on a co-rotational (CR) framework to account for geometricnonlinearities. The solution is implemented in the “University of Michigan’s Nonlinear Membrane Shell Solver”(UM/NLAMS), written in Fortran 90. The CR formulation has generated a great amount of interest in the lastdecade. The idea of this approach is to decompose the motion into rigid body and pure deformational parts throughthe use of a local frame at each finite element which translates and rotates with the element. The element's internalforce components are first calculated relative to the co-rotational frame and are then transformed to a global frameusing the co-rotational transformation matrix. The co-rotational frame transformation eliminates the element rigidbody motion so that a linear deformation theory can be used. Hence, the main advantage of the CR formulation is itseffectiveness for problems with small strains but large rotations. The elastic stiffness matrix for the shell element inthis work will be obtained as a superposition of the stiffnesses corresponding to that of the optimal membraneelement (OPT) and a discrete Kirchhoff triangle (DKT) plate bending element. Full details of the structuraldynamics solution are available in Chimakurthi et al. C. Aeroelastic Coupling The aeroelastic coupled solution is based on a time-domain partitioned solution process in which the nonlinearpartial differential equations modeling the dynamic behavior of both fluid and structure are solved independentlywith boundary information (aerodynamic loads and structural displacements) being shared between each otheralternately. A dedicated interface module was developed to enable communication between the flow and thestructure at the 3-D wetted surface (fluid-structure interface). In the interface module, both the fluid and the structural modules are called one after the other according to the coupling method adopted for the problem. Thecoupling algorithm is determined by the capability of the individual simulation code. More details about thecoupling aspects can be found in Chimakurthi et a1.38,40 and Aono et a1.39 III. Experimental Setup for Flapping Wing Experiments A. Flapping Mechanism and Tested Wings A single-degree-of-freedom flapping mechanism is designed and built for this study, as shown in Figure 1 (thesame mechanism as the one used in reference, but the wings shown in the figure are different from the aluminumwings tested). The design is created based on a Maxon motor system that includes a 15 W brushless DC motorEC16, a 57/13 reduction ratio planetary gear head, a 256 counts-per-turn encoder and an EPOS 24 controller. Thissystem provides precise control of the motor system: the sensor provides position and velocity feedback to thecontroller that actively regulates the motor. Utilizing the high precision pre-assembled planetary gear head ratherthan constructing a custom gear transmission is also advantageous. The final output range of the motor shaft is:speed 0 to 45 revolutions per second (RPS) and nominal torque 0 to 21 Nmm. The rotation output from the motor is first transformed into a reciprocating motion with a crank-slidermechanism; then a bar linkage mechanism realizes the flapping motion at the wing mount. A detailed schematicdescription of the flapping kinematics is presented in Figure 1. The geometric relationship between motor rotation(angle 日) and flap angle a is expressed in the equations in the figure, where a is the flap angle; 0 is the motorrotational angle; x is the vertical displacement from the center point when the wings are horizontally positioned. Therest of the parameters are selected so that a± 21° amplitude is maintained. The experiments are performed at 10 Hzflapping frequency. The wing planform is of a 7.65 aspect ratio and has a Zimmerman shape, i.e. is formed by two ellipses whichintersect at the quarter-chord point. The wing length is 75 mm and the root chord length is 25 mm. The wings aremanufactured with CNC machine to achieve the exact contour and avoid stresses that may cause warping. Aftermachining, the wing surface is primed with flat white coating for the background and speckled with black dots forDIC measurements. Another coating (Rhodamine) is applied for reducing blooming of the laser sheet hitting thewing during PIV measurements. The final weight of a single wing is 1.685 ±0.005 grams. The flatness is examinedwith DIC and bounded within -0.05~0.05 mm. The wing is mounted to the mechanism at a 5×5 mm’ square regionat the crossing of the leading edge and root. This region of the wing is assumed not to deform during the flappingmotion (therefore serving as the reference for calculating the wing deformation and also the boundary condition). B. Deformation Measurement with DIC The kinematics and deformation of the flapping wings are measured with a high speed digital image correlationsystem (see Figure 2). DIC is a well-developed non-contact measurement technique used to capture full-fielddisplacement and deformation of surfaces via stereo-triangulation. A random speckle pattern is applied to theflapping wing, which is then digitized into wing surface coordinates with stereo triangulation. The full-fielddisplacements of the wing during the flapping motion are computed with temporal matching, by minimizing a crosscorrelation function between discrete regions of speckle patterns on a deformed wing surface and an undeformedone. The DIC system (Correlated Solutions Inc., South Carolina, USA) used in this study consists of two Phantomhigh speed cameras that can store 2800 pictures of 800 pixels by 600 pixels resolution in its flash memory at amaximum rate of 4800 frames per second. The exposure time was 150 us and the frame rate was set to obtain 100frames per cycle. For example, in the 10 Hz case therefore, the frame rate is 1000 fps. Figure 1. Flapping mechanism and its schematics. Figure 2. Digital image correlation (DIC) experimental setup Only the left wing is measured with DIC for the kinematics and deformation. The two DIC cameras aresymmetrically placed facing the wings at mid-plane. Field of view on both cameras is adjusted to fit and fill theframe. Then the cameras are calibrated and used to measure the full-field deformation and kinematics of the flappingwing. A reference image at the mid-plane of stroke is taken beforehand. The data structure contains coordinates ofall points on the measurement surface. During post processing, the structural deformation is separated from rigidbody kinematics by comparing the undeformed reference data to the deformed wing at the same flap angle. Theerrors of DIC are induced during the calibration phase and the uncertainty will remain the same after calibration. If a camera pair is carefully calibrated, the system uncertainty is under ±0.1 mm in the current setup (except occasionallythe speckle pattern introduces other error). C. Airflow Measurement with Particle Image Velocimetry Particle image velocimetry, a mature technique used to measure the velocity of particles (assumed to follow theairflow) in the flow of interestl 13, is applied to examine the airflow around a flapping wing. The flow fieldmeasurement area is defined by the confluence of the position and dimension of a laser sheet, along with thecamera’s field of view. Images are captured at each laser flash so that the particle spatial displacement can beextracted by correlating two images taken within a small time interval. One LaVision Imager pro X 4M cameracapable of capturing up to 7 image pairs per second with a pixel resolution of 2048×2048 is used. The camera ismounted perpendicular to the wing root, measuring a plane in the wing span direction at 7 Hz frame rate. A lasersheet is generated from a Litron Nano L PIV Pulsed Nd:YAG Laser System (max energy 135 mJ/pulse, 532 nm) andis directed at the target from below. The air is seeded by a LaVision Aerosol Generator, with olive oil, an modalradius of approximately 0.25 microns. Davis 7 (software from LaVision) is used to control the PIV system andprocess the data. The measurements are made in the test section of a sealed open jet wind tunnel. Snapshots of thevelocity field are acquired at 3 different chord locations (0.25, 0.5 and 0.75 of the chord length at the root).. Themeasurement area is 121 ×121 mm , enclosing the wing at the upper right corner. The PIV images are captured at up to 7 Hz, with the snapshots skipped that the system does not have time toprocess. 2500 images are captured at each location and flapping frequency. The images are processed using a multi-pass algorithm with shrinking interrogation size to produce velocity vectors. The region next to the wing and thearea where the laser is shaded by the wing are masked out. The raw images are then processed to find the wingangle. The wing angle is then fit to a sine wave to extract the phase of the wing in each snapshot. The snapshots arethen divided into 50 bins, with the bins equally spaced in time within the flapping cycle. Phase averages are thenproduced by averaging each bin. The wing angle variation within a bin varies between approximately +0.5° to ±2.5°,and each bin contains on the average 50 snapshots. IV. Results and Discussions Preliminary tests have been conducted on an elliptic isotropic wing using the computational aeroelasticityframework involving UM/NLAMS and STREAM and the experimental setup described above. A brief descriptionof the test along with results is presented below: Aeroelastic response for a Zimmerman aluminum wing prescribed with pure single DOF flap rotation The aeroelastic response was computed for an isotropic Zimmerman aluminum wing flapping in incompressible,viscous flow under hovering conditions at 10 Hz. A summary of the geometric and mechanical properties of thealuminum wing configuration studied in the experiment and computations is included in Table 1. Table 2 providesinformation about the flow properties (dimensional). In Table 3, the key dimensionless parameters related to eitherthe structure, the flow, or to both for the aluminum wing configuration are furnished. The dimensionless parametersp and Il are defined in Shyy et al.. An O-type structured multi-block grid around the Zimmerman wing of aspectratio 7.65 is used for the computational fluid dynamics (CFD) simulations. The finite element mesh configurationdeveloped in UM/NLAMS has triangular shell finite elements. A 5 mm x5 mm square region near the root at theleading edge is constrained in all degrees of freedom (with respect to the global frame) in the structural solver, sincethe flapping mechanism in the experiment is used to actuate that region on the wing. A total of 480 elements (275nodes) are used in the finite element discretization. To assess the independence of the numerical solution to CFD grid refinement, a grid convergence study wasperformed and a suitable grid (approximately total 0.7 million cells) was subsequently chosen. A time step of 1.5x10°s (and hence approximately 650 time-steps per period of computation) was used for the computations. Theconvergence criterion for the aeroelastic convergence was chosen as a check on the Euclidean norm of the entiresolution vector computed in two consecutive fluid-structure sub-iterations. Table 1. Geometric and mechanical properties associated with the test case. Quantity Symbol Value Semi-span at quarter chord R 0.075m Chord length at wing root Croot 0.025m Structural thickness hs 0.4×10m Poisson's ratio V 0.3 Material density Ps 2700kg/m² Young’s modulus of material E 70.0 GPa Table 2. Flow properties associated with the test case. Quantity Symbol Value Reference flow velocity Uref 1.0995 m/s (hover) Air density Pf 1.209kg/m² Table 3. Dimensionless parameters associated with the test case. Quantity Symbol Value Mean chord-based Reynolds number Re 2605 Reduced frequency k 0.56 Aspect ratio AR 7.65 Density ratio p 2233 Scaling parameter-I I1 3.8×10+ It may be noted that the wing is defined in the X-Z plane wherein, the X-axis goes through the wing chord andthe Z-axis going through the wing length. Figures 3 and 4 show a comparison of the velocity magnitude andvorticity between computation and the experiment for two different points in the flapping cycle (t/T=0.3 and 0.48,where T is the period of prescribed flap rotation) respectively. The flow field in these plots is shown on a slice that iscut at the quarter chord station going through the span. The experimental data could not be obtained in the regionnear the wing that is outside the laser sheet (appears as a white cone-like region above the wing in the experimentalvelocity magnitude and vorticity contours). As seen from the plots, there is a good overall agreement in the flow structure between the computation and theexperiment at both points in the flapping cycle. However, the vorticity is weaker and more fragmented in theexperiment than in the computation and the magnitude of velocity is larger than the experimental one. Also, ingeneral, there is more discrepancy near the wing tip than in the rest of the wing. This is confirmed from thecomparison of the velocity distributions between the computation and the experiment shown in Figure 5. Each ofthose sub-plots is obtained by considering a line of points vertically above and below the wing obtained byintersecting a slice going through the quarter chord all along the span and another slice at either a section near themid-span or the tip that goes through the entire chord. For example, the sub-plots (A-1) and (B-1) of Figure 5 showsuch velocity magnitude distributions corresponding to a line of points obtained by intersecting the chordwise sliceat mid-span and tip respectively one after the other with the slice going through the span at the quarter chord, bothfor the time instant t/T=0.3. Then, the sub-plots (C-1) and (D-1) of Figure 5 correspond to the same line of pointsbut now for time instant t/T=0.48. Experiment (Phase averaged) Computation (6"cycle) Computation (Phase averaged) Velocity magnitude /m/s] Experiment (Phase averaged) Computation (6" cycle) Computation (Phase averaged) X-Vorticity /1/s] Figure 3. Comparison of velocity magnitude and vorticity between experiment and computation for a slice ofthe wing at the quarter chord going through the span for time instant t/T=0.3. The sub-plots in the firstcolumn correspond to the phase averaged velocity magnitude and X-vorticity contours of the experimentaldata. The sub-plots in the second column correspond to the velocity magnitude and X-vorticity contourscorresponding to the 6" cycle of computation. The sub-plots in the third column correspond to the phaseaveraged (using the data corresponding to the 3", 4*, 5, and 6" cycles) velocity magnitude and X-vorticitycontours of the computational data. (Re=2605,k=0.56,II=3.8×10*,p=2233). Also included in Fig.5 are phase averaged velocity profiles for both points in the cycle, t/T=0.3 and t/T=0.48,(sub-plots A-2, B-2 correspond to the former time instant and C-2, D-2 correspond to the latter time instant)including the error bars for the experimental data. While there was good qualitative agreement from the contourplots in Figures 3 and 4, here one can see a more quantitative comparison. In general, there are cycle-to-cyclevariations in the velocity magnitudes in both computation and experiment. Notwithstanding that, specifically, itappears that the spatial locations associated with the rise in velocities due to the wing motions do not match too wellbetween the experiments and computations however the maximum amplitudes of the velocity magnitudes do agreequite well. In the experimental data, the magnitudes of variance near the tip region are generally larger than thosenear the mid-span. Figure 6 shows the lift coefficient computed from numerical data on the wing as a function ofnon-dimensional time. Figure 7 shows the iso-surfaces of the vorticity magnitude (the color corresponds to thespanwise vorticity) corresponding to two different time instants labeled as (a) and (b) in Figure 6. Three-dimensionalvortex generation is seen in Figure 7 at both time instants wherein the counter-rotating vortices at the leading and thetrailing edge interact with the tip vortex during the wing motion. In particular, the vortices generated during aprevious stroke (indicated as “PV” in the figure) are captured by the wing and interact with the vortices generatedduring a current stroke indicated as“CV”. Experiment (Phase averaged) Computationn ((66""cycle)Velocity magnitude [m/sl Computation (Phase averaged) Root Rool Experiment (Phase averaged) Computation (6" cycle)X-Vorticity/1/sl Computation (Phase averaged) Figure 4. Comparison of velocity magnitude and vorticity between experiment and computation for a slice ofthe wing at the quarter chord going through the span for time instant t/T=0.48. The sub-plots in the firstcolumn correspond to the phase averaged velocity magnitude and X-vorticity contours of the experimentaldata. The plots in the second column correspond to the velocity magnitude and X-vorticity contourscorresponding to the 6" cycle of computation1.. The plots in the third column correspond to the phaseaveraged (using the data corresponding to the 3d, 4*, 5, and 6" cycles) velocity magnitude and X-vorticitycontours of the computational data. (Re=2605,k=0.56,II=3.8×10*,p=2233). Instantaneous (D-2)-slice at the tip Figure 5. Comparison of velocity magnitude between computation and experiment at two different timeinstants and for two different slices along the wing span: sub-plots A-1, B-1, C-1, and D-1 correspond toinstantaneous velocity magnitude profiles and sub-plots A-2, B-2, C-2, and D-2 correspond to phase averagedvelocity magnitude profiles. Sub-plots on the left column correspond to those at the mid-span slice of the wingand those on the right column correspond to a slice near the tip. The error-bars around the phase averagedflow indicate the interval within which 95 % of the instantaneous values are expected to fall, assuming thedistribution is Gaussian. Figure 6. Lift coefficient on the wing as a function of normalized time (time is normalized with respect to aperiod of flap rotation), DS-downstroke, US-upstroke 13 Figure 7. Iso-contours of vorticity magnitude on the aluminum wing and Z-vorticity contours at two stationsalong the wing length at two different time instants: sub-plots (i) and (ii) correspond to the iso-contours of thevorticity magnitude (color indicates the magnitude of the Z-vorticity) for time instants (a) and (b) of Fig. 6respectively. Sub-plots (iii) and (iv) correspond to the Z-vorticity contours at two stations along the winglength (as indicated) for time instants (a) and (b) of Fig. 6,respectively.(CV -Vortex generated in the currentstroke, PV - vortex generated in the previous stroke, blue color indicates clockwise vorticity from theviewpoint of an observer looking into the plane of the plot). Figure 8 shows the comparison of the normalized vertical displacement (with respect to the chord length at the wingroot) at a point on the wing tip between the experiment and the computation. As shown in the figure, there is adecent overall agreement in both amplitude and phase between the computational response and the experimentaldata. The tip deformation obtained is only around 6 % of wing chord which means that the selected wingconfiguration is not compliant enough to deform significantly. Future studies will be focused on more flexible cases. Figure 8. Aluminium wing response due to flapping excitation(normalized with respect to chord length at the root). Effect of Flexibility on Aerodynamics The experimental data is available only for the case of aluminium (E=70 GPa and II=38×10), which is close tobeing rigid. Several variations in Young’s modulus (effectively IZ) are considered only in the computations toassess the impact of flexibility on aerodynamic force generation. A summary of the geometric and mechanicalproperties of the aluminum wing configuration studied in the computations is included in Table 4. Table 5 providesinformation about the flow properties (dimensional). In Table 6, the key dimensionless parameters related to eitherthe structure, the flow, or to both for the aluminum wing configuration are furnished. Figs. 9 and 10 show the liftand thrust coefficient response, respectively, for four cycles of computation for all cases of flexibility. It should benoted that for better clarity only data points skipping every ten time instants are considered in the plotting. As seenfrom the plots, the response corresponding to all wing configurations except the one with“E =0.1 GPa” seems to beclose to periodic. Table 4. Geometric and mechanical properties associated with the test case. Quantity Symbol Value Semi-span at quarter chord R 0.075m Chord length at wing root Croot 0.025m Structural thickness hs 0.4×10°m Poisson's ratio V 0.3 Material density Ps 2700 kg/m² Young's modulus of material E 0.1,10,30,50,70 GPa Table 5. Flow properties associated with the test case. Quantity Symbol Value Reference flow velocity Air density Uref 0.2618 m/s (hover) 1.209 kg/m' Pf Table 6. Dimensionless parameters associated with the test case. Quantity Symbol Value Mean chord-based Reynolds number Re 620 Reduced frequency k 2.35 Aspect ratio AR 7.65 Density ratio p 2233 Scaling parameter-I I1 937-00 Figure 9. Lift coefficient response on the Zimmerman flapping wing with varying Young's modulus Figure 10. Thrust coefficient response on the Zimmerman flapping wing with varying Young’s modulus Figs. 11 and 12 give more insight into this by showing the mean lift and thrust coefficient, respectively, for all fivecases. The standard deviation in the“E =0.1 GPa” case is so large for the mean lift/thrust coefficients that it wasomitted from the plots. A reason for the aperiodicity in this case is the absence of enough aerodynamic dampingwhich would reduce the structural dynamics general solution to the particular solution, which represents the steady-state vibration. Two key observations can be made from Figs. 11 and 12: a. Within the range of flexibility considered, the mean thrust coefficient varies monotonically with increasingflexibility (due to the uncertainty in the mean values particularly for the “E =10 GPa”and“E=0.1 GPa”cases, no similar statement can be made for the mean lift coefficient). b. While the increase in the thrust coefficient from“Rigid”to“E=10 GPa”is only minimum, it is more rapidfrom the latter to“E =0.1 GPa”case, as more flexibility is added to the system. From this point, only the two extreme cases corresponding to“Rigid”and“E=0.1 GPa” are considered to study theeffects of flexibility on aerodynamic force generation. Figs. 13 and 14 show the lift and thrust coefficient responsecorresponding to these two cases for several cycles of computation. As seen from the plots, while the instantaneouslift coefficient on the “Rigid” wing configuration is much greater than that of“E=0.1 GPa” wing configuration, thetrend is clearly opposite in the case of the thrust coefficient. Figs. 15 and 16 correspond to the pressure distributioncontour plots on the top and bottom surfaces of the “Rigid"and“E=0.1 GPa”wings, respectively, at time instant Dindicated in Figs. 13 and 14. It is seen from these plots that the top surface of the “Rigid”wing is dominated bysuction more than that of the “E=0.1 GPa”wing and so, it was found that the total resultant force of the“Rigid”wing is more than that of the “E=0.1 GPa”at this time instant (and also at all others). Moreover, in the former, it isall in the form of lift whereas in the latter, due to the elastic twisting of the wing, there is also an effective horizontalforce component (thrust). Fig. 17 illustrates this by showing the geometric twist angle at several stations along thespan for both wing configurations. The geometric twist computed is the slope of the line joining the leading andtrailing edge points corresponding to each station. In the figure, the data for the“E =0.1 GPa” case is shown forfour different time instants A, B, C, and D indicated in Fig. 14. The data for the “Rigid wing”is shown only for onetime instant since in that case the twist angle is zero at all time instants due to the absence of prescribed pitch. Asseen in the figure, for the case of the “E =0.1 GPa” wing, the twist angle gradually increases from root to thet tip athree time instants: A, C, and D. For time B, the behavior is non-monotonic. From the results presented above itseems that it is possible to tailor wing flexibility to alter the aerodynamics of a flapping wing. It will be interestingto conduct further studies by considering local variations in flexibility, which may better reflect the structuralcharacteristics of the wings of an actual insect. Figure 11. Mean and standard deviation of the mean lift coefficient of the hypothetical Zimmer man flappingwing configurations (standard deviation for Il = 938 case is 2.08) Figure 12. Mean and standard deviation of the mean thrust coefficient of the hypothetical Zimmermanflapping wing configurations (standard deviation for Il =938 case is 0.06) Figure 13. Lift coefficient response on the Zimmerman flapping wing for the “Rigid”and“E=0.1 GPa”cases. Figure 14. Thrust coefficient response on the Zimmerman flapping wing for the “Rigid”and“E=0.1GPa”cases. Figure 15. Pressure distribution on the top and bottom surfaces of the “Rigid”Zimmerman flapping wing attime instant D indicated in Fig. 13 LE Figure 16. Pressure distribution on the top and bottom surfaces of the “E=0.1 GPa” Zimmerman flappingwing at time instant D indicated in Fig. 13 Figure 17. Geometric twist angle along the span for the “Rigid"and“E=0.1 GPa” Zimmerman flapping wingconfigurations at time instants A, B, C, and D indicated in Fig. 14. V. Concluding Remarks This paper has presented an integrated approach involving both experimental and computational methods havinga potential to examine flexible flapping wing configurations. An aluminum wing is prescribed with single degree-of-freedom flap rotation at 10 Hz frequency and ± 21° amplitude and both flow velocities and deformations aremeasured in the experiment using digital image correlation and digital particle image velocimetry techniquesrespectively. Specific comparison of flow velocities and wing deformation between the computational and theexperimental data showed a reasonable agreement. Flow structures including three-dimensional vortex generationare observed. The counter-rotating vortices at the leading and the trailing edge interact with the tip vortex during thewing motion. The vortices generated during a previous stroke are captured by the wing and interact with the vorticesgenerated during the present stroke. Detailed velocity profiles and force time histories are documented. Studies onadditional flexible flapping wing configurations showed that aerodynamic force generation could be enhanced dueto wing flexibility. In particular, in the most flexible flapping wing case, the elastic twisting of the wing was shownto produce substantially larger mean and instantaneous thrust due to shape deformation-induced changes in effectiveangle of attack. Overall, it seems that it is possible to tailor wing flexibility to alter the aerodynamics of a flappingwing. It will be interesting to conduct further studies by considering local variations in flexibility, which may betterreflect the structural characteristics of the wings of an actual insect. Acknowledgments The work supported here has been supported in part by the Air Force Office of Scientific Research’sMultidisciplinary University Research Initiative (MURI) grant and by the Michigan/AFRL (Air Force ResearchLaboratory)/Boeing Collaborative Center in Aeronautical Sciences. References ( Shyy, W., Lian, Y., Tang, J., Viieru, D., and Liu, H., Aerodynamics of Low Reynolds Number Flyers, Cambridge UniversityPress, New York,2008. ) ( Shyy W, Berg M, Ljungqvist D. Flapping and flexible wings for biological and micro air vehicles. Prog Aerosp Sci 1999; 35 (5):455-505. ) ( Muller TJ. Fixed and flapping wing aerodynamics for micro air vehicle applications. AIAA Prog Astronaut Aeronaut 2002; 195. ) ( Shyy W, Ifju P, Viieru D. Membrane wing-based micro air vehicles. Appl Mech Rev 2005; 58: 283-301. ) ( Pines DJ, Bohorquez F. Challenges facing future micro-air-vehicle development. J Aircraft 2006;43(2):290-305. ) ( Platzer M, Jones K, Young J , Lai J . Flapping wing aerodynamics: Progress and challenges. AIAA J 2008;46(9):2136-2149.Lian Y, Shyy W, Viieru D, Zhang B. Membrane wing aerodynamics for micro air vehicles. Prog Aerosp Sci 2003; 39 (6-7):425-465. ) Stanford BK, Ifju P, Albertani R, Shyy W. Fixed membrane wings for micro air vehicles: Experimental characterization,numerical modeling, and tailoring. Prog Aerosp Sci 2008; 44 (4):258-294. Dalton S. The miracle of flight. London: Merrell, 2006. ( Daniel TL, Combes SA. Flexible wings and fins: bending by inertial or f luid-dynamic forces? Integr Comp Biol 2002; 42: 1044-1049. ) Combes SA. Wing flexibility and design for animal flight. Ph.D Diss. 2002 University of Washington. ( Combes SA, Daniel TL. Into thin air: contributions of aerodynamic and inertial-elastic forces to wing bending in the hawkmoth Manduca sexta. J Exp Biol 2003;23:2999-3006. ) ( Mountcast l e AM, Daniel TL. Aerodynamic and functional consequences of wing compl i ance. Exp Fluids 2009; 46:873-882.Zhu Q. Numerical simulation of a flapping foil with chordwise or spanwise flexibility. AIAA J2007;45(10):2448-2457. ) ( Heathcote S, Gursul I. Flexible f lapping airfoil propulsion at low Reynolds numbers. AIAA J 2007; 45(5):1066-1079. ) ( Yamamoto I, Terada Y, Nagamatu T , Imaizumi Y. Propulsion system with flexible/rigid oscillating fin. IEEE J Oceanic Eng1995;20(1):23-30. ) ( Prempraneerach P, Hover FS, Triantafyllou MS. The effect of chordwise flexibility on the thrust and efficiency of a flapping foil . Proceedings of 13" International Symposium Unmanned Untethered Submersible Technology 2003.p.1-10. ) ( Tang J, Viieru D, Shyy W. A study of aerodynamics of low Reynolds number flexible airfoils. Proceedings of the AIAA 37 Fluid Dynamics Conference and Exhibit AIAA 2007-4212.2007.p.1-17. ) ( Chandar DDJ, Damodaran M. Computational fluid-structure interaction of a flapping wing in free flight using overlapping grids. Proceedings of 27 AIAA Applied Aerodynamics Conference AIAA 2009-3849.2009.p.1-18. ) ( Pederzani J, Haj-Hariri H. Numerical analysis of heaving flexible airfoils in a viscous flow. AIAA J 2006;44(11):2773-2779. 21 Chaithanya MR, Venkatraman K. Hydrodynamic propulsion of a flexible foil. Proceedings of the 12典 Asian Congress of Fluid Mechanics.2008.p.1-5. ) ( “Chaithanya MR, Venkatraman K. Hydrodynamic propulsion of a flexible foil undergoing pitching motion. Proceedings of the10* Annual CFD Symposium.2008.p. 1-5. ) ( Gopalakrishnan P. Unsteady Aerodynamic and Aeroelastic Analysis of Flapping Flight. PhD Dissertation, Department ofMechanical Engineering, Virginia Polytechnic Institute and State University, Blacksburg, Virginia, 2008. ) ( 24Miao J-M, Ho M-H. Effect of flexure on aerodynamic propulsive efficiency of flapping flexible airfoil. J Fluid Struct 2006; 22: 401-409. ) ( Toomey J, Eldredge JD. Numerical and experimental study of the fluid dynamics of a flapping wing with low order flexibility.Phys Fluids 2008;20(073603):1-10. ) ( 20Vanella M, Fitzgerald T, Preidikman S, Balaras E, Balachandran B. Influence of f lexibility on the aerodynamic performance ofa hovering wing. J Exp Biol 2009;212:95-105. ) ( Heathcote S, Martin D, Gursul I. Flexible flapping airfoil propulsion at zero freestream velocity. AIAA J 2004; 42 (11):2196- 2204. ) ( Michelin S, Smith SGL. Resonance and propulsion performance of a heav i ng flexible wing. Phys Fluids 2009; 21:071902-1- 071902-15. ) ( Liu P, Bose N. Propulsive performance from oscillating Propulsors with spanwise f lexibility. P Roy Soc A-Math Phy 1997;453 (1963):1763-1770. ) ( Heathcote S, Wang Z, Gursul I . Effect of spanwise flexibility on flapping wing propulsion. J Fluid Struct 2008;24:183-199. ) ( Hamamoto M, Ohta Y, Hara K, Hisada T. Application of fluid-structure interaction analysis to flapping flight of insects with deformable wings. Adv Robotics 2007; 21 (1-2): 1-21. ) ( Singh B, Chopra I . Insect-based hover-capable flapping wings for micro air vehicles: Experiments and analysis. AIAA J 2008; 46(9):2115-2135. ) ( Young J, Walker SM, Bomphrey RJ, Taylor GK, Thomas ALR. Details of insect wing design and deformation enhanceaerodynamic function and flight efficiency. Science 2009; 325: 1549-1552. ) 4Walker SM, Thomas ALR, Taylor GK. Deformable wing kinematics in the desert locust: how and why do camber, twist andtopography vary through the stroke? J R Soc Interface 2008; 6 (38):735-747. ( Agrawal A, Agrawal SK. Design of bio-inspired flexible wings for flapping-wing micro-sized air vehicle applications. Adv Robotics 2009;23(7-8):979-1002. ) 50Wu P, Ifju P, Standford BK, Sallstrom E, Ukeiley L, Love R, Lind R. A multidisplinary experimental study of flapping wingaeroelasticity in thrust production. Proceedings of 50* AIAA/ASME/ASCE/AHS/ASC Structures, Structural Dynamics, andMaterials Conference AIAA 2009-2413.2009.p.1-19. Sallstrom E, Ukeiley L, Pin W, Ifju P. Three-dimensional averaged flow and wing deformation around flexible flapping wings.上Proceedings of 39" AIAA Fluid Dynamics Conference AIAA 2009-3813.2009.p.1-13.2 5Chimakurthi SK, Tang J, Palacios R, Cesnik CES, Shyy W. Computational aeroelasticity framework for analyzing flappingwing micro air vehicles. AIAA J 2009;47(8): 1865-1878. Aono H, Chimakurthi SK, Cesnik CES, Liu H, Shyy W. Computational modeling of spanwise flexibility effects on flappingwing aerodynamics. Proceedings of 47" AIAA Aerospace Sciences Meeting Including The New Horizons Forum and AerospaceExposition AIAA 2009-1270. 2009.p.1-18. 40Chimakurthi, SK, Stanford, BK, Cesnik, CES, Shyy, W, Flapping wing CFD/CSD aeroelastic formulation based on a co-rotational shell finite element. 50th AIAA/ASME/ASCE Structural Dynamics and Materials Conference, Palm Springs,California, 3-7 May 2009. 4Battini, J, Pacoste, C. On the choice of local element frame for co-rotational triangular shell elements. Commun Numer MethEn 2004: 20:819-825. *Battini, JM. A modified co-rotational framework for triangular shell elements. Comput Method Appl M 2007; 196:1905-1914. +Crisfield, M, Galvanetto, U, Jelenic, G. Dynamics of 3-D co-rotational beams. Comput Mech 1997;20:507-519. “Devloo, P, Geradin, M, Fleury, R. A co-rotational formulation for the simulation of flexible mechanisms. Multibody Syst Dyn2000;4:267-295. 4Elkaranshawy, HA, Dokainish, MA. Co-rotational finite element analysis of planar flexible multibody systems. ComputerStruct 1995; 54:881-890. 40Thomas, PD, Lombard, K. Geometric conservation law and its application to flow computations on moving grids. AIAA J1979;17(10):1030-1037. Shyy, W, Udaykumar, HS, Rao, MM, Smith, RW. Computational fluid dynamics with moving boundaries, Dover, New York,2007. American Institute of Aeronautics and AstronauticsCopyright C by the authors. Published by the American Institute of Aeronautics and Astronautics, Inc., with permission. merican Institute of Aeronautics and Astronautics
确定


还剩20页未读,是否继续阅读?

产品配置单


北京欧兰科技发展有限公司为您提供《空气流体中速度矢量场检测方案(粒子图像测速)》,该方案主要用于其他中速度矢量场检测,参考标准--,《空气流体中速度矢量场检测方案(粒子图像测速)》用到的仪器有德国LaVision PIV/PLIF粒子成像测速场仪、Imager SX PIV相机
推荐专场


相关方案
更多
该厂商其他方案
更多