


方案详情
文
In current wing design, multiple flaps are incorporated into the trailing edge to allow mixing of
high and low pressure sides to reduce flow separation. These flaps reduce the efficiency by
adding weight and complexity to the aircraft. A single hinged flap would reduce these
inefficiencies but is more susceptible to flow separation. Active flow control is a means by
which the fluid flow over a body is deliberately altered and can be altered such that it becomes
less likely to separate from the object. By energizing the flow, the degree of separation of the
flow can be controlled, and this inherently controls lift. Dielectric barrier discharge (DBD)
plasma actuators are a form of active flow control. These actuators are created by
asymmetrically aligning two electrodes and adding a dielectric layer between the electrodes.
When the electrodes are electrically connected, ionized air (plasma) travels from the exposed
electrode towards the covered electrode. Collisions occur between the plasma and neutral air
over the body, and momentum is transferred to the neutral air, effectively energizing it. The
purpose of this study is to examine the lift enhancement and flow control authority that multiple
DBD plasma actuators have on a high-lift airfoil when compared to the flow exhibited by noncontrolled
and single DBD plasma actuator controlled cases. Electrodes were mounted onto a
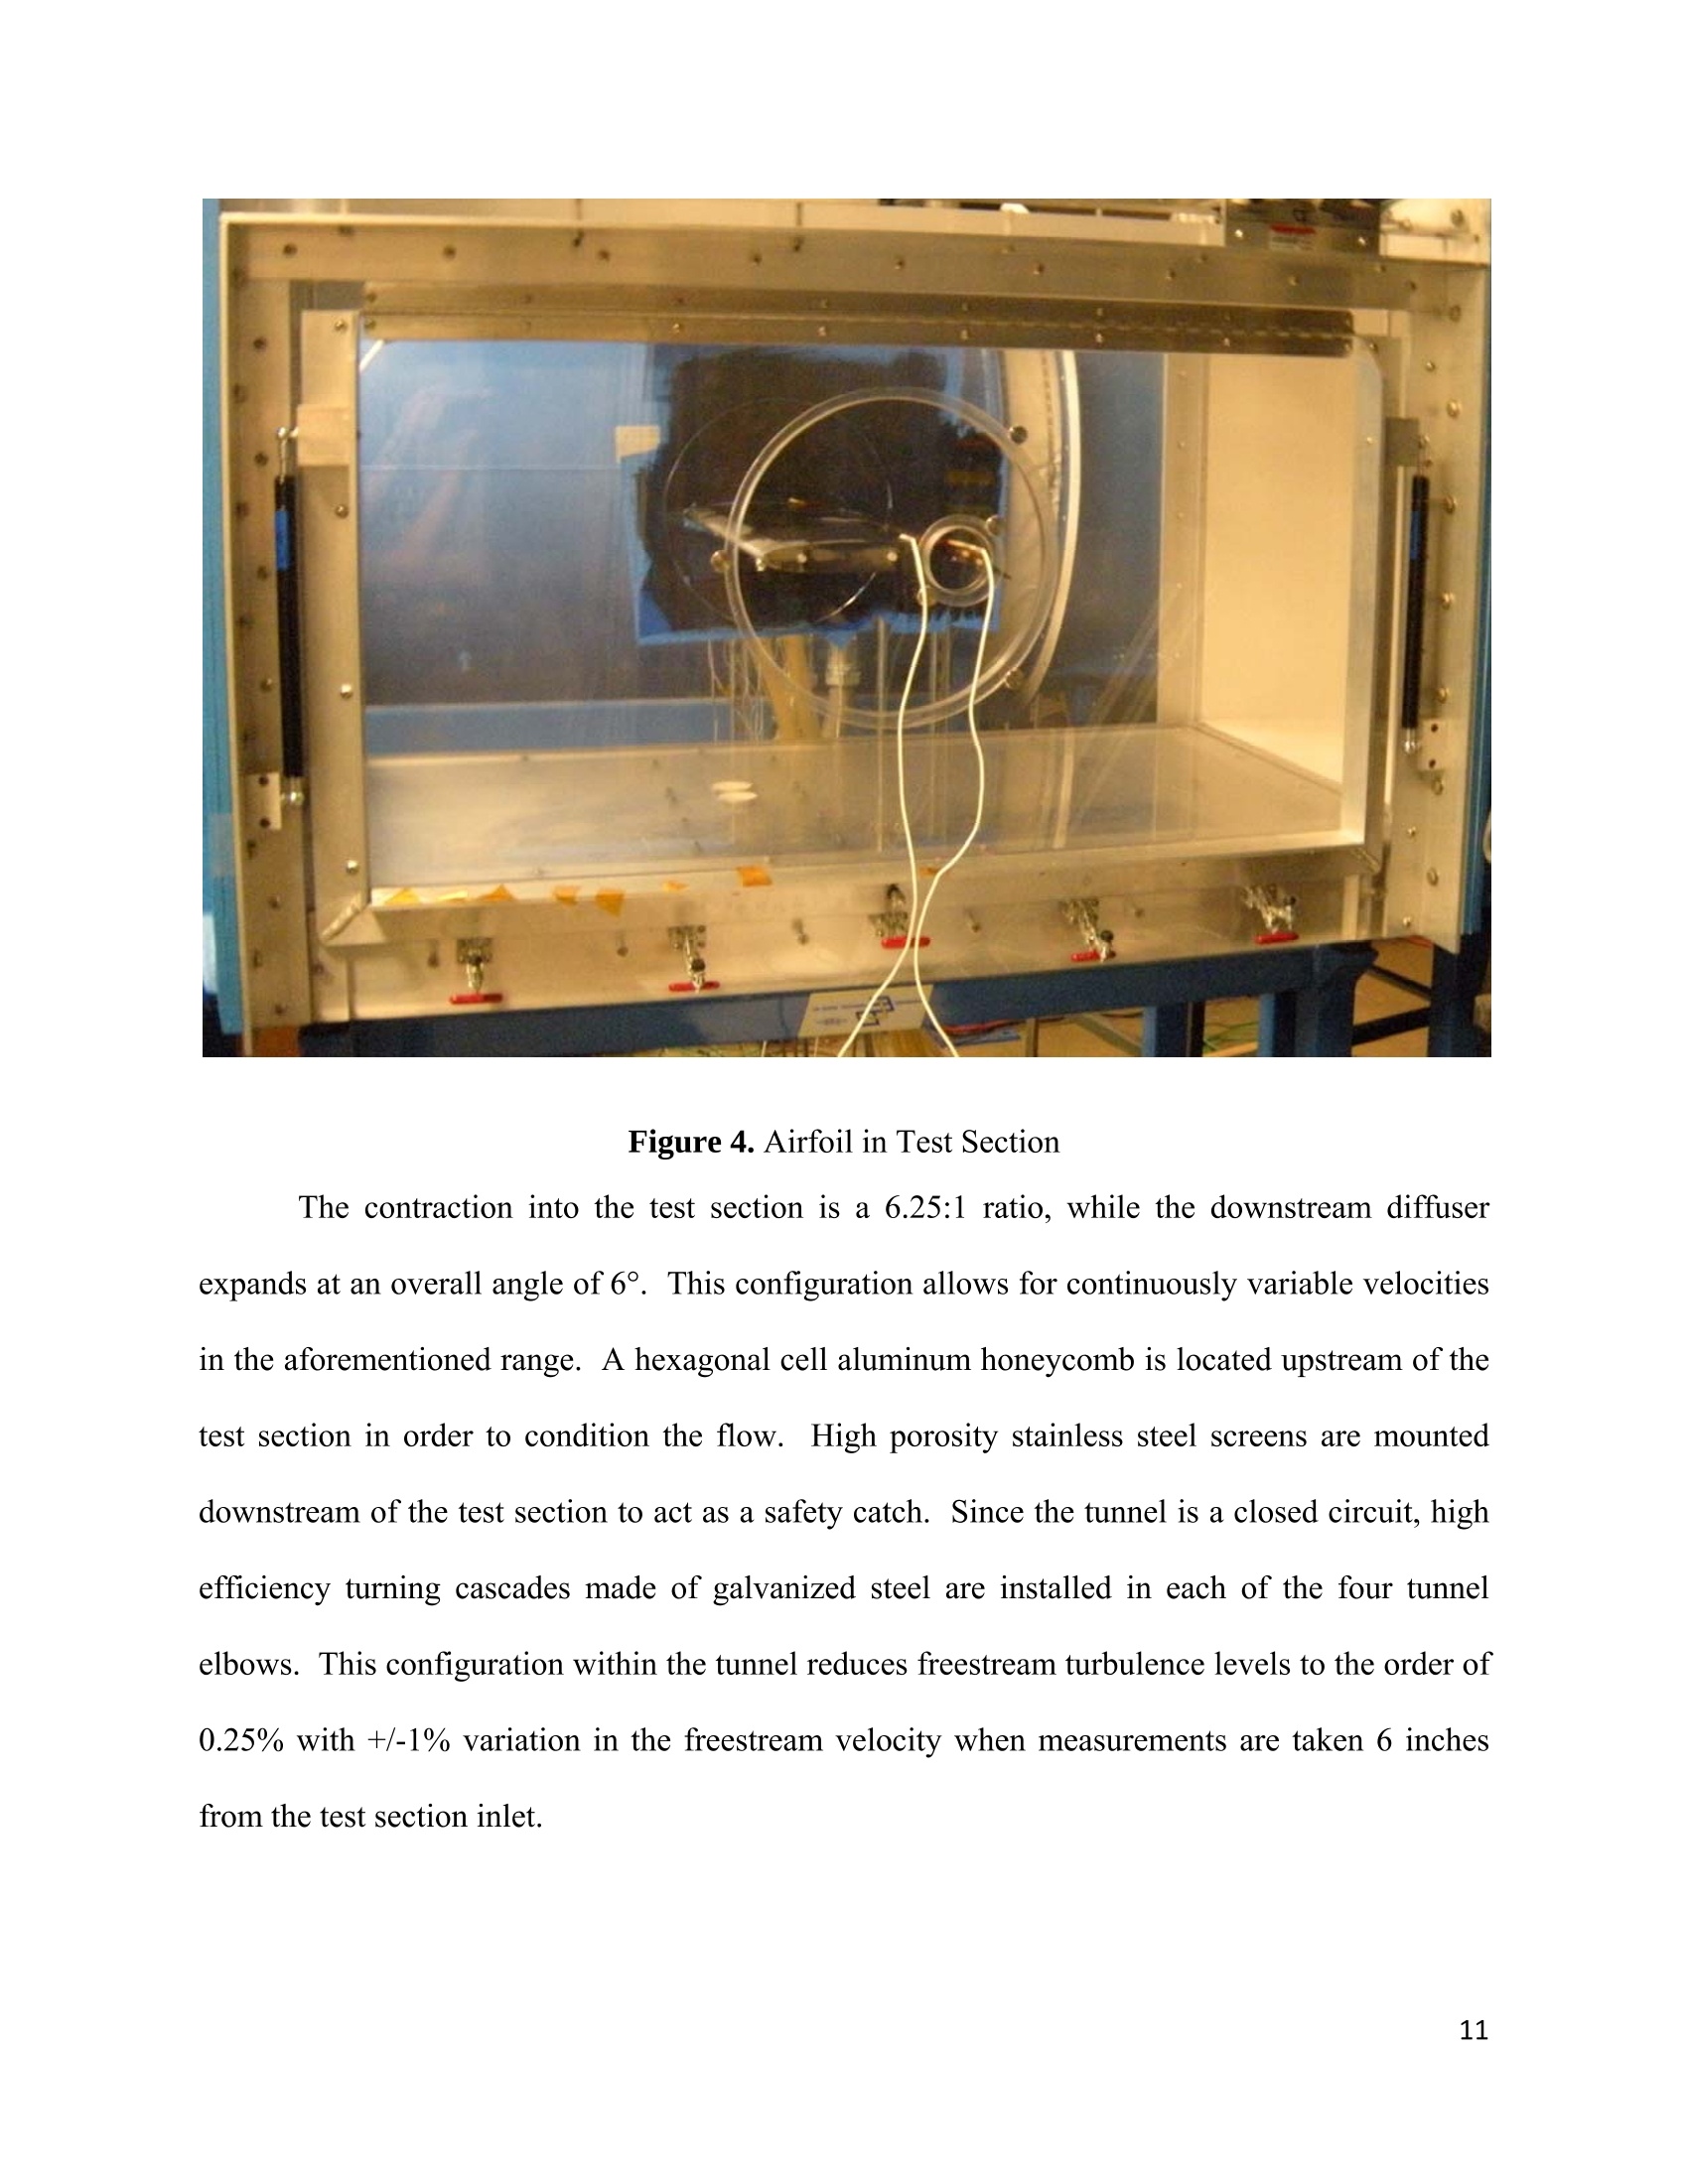
simplified NASA Energy Efficient Transport airfoil near the flap. The airfoil was tested in a
closed, recirculating wind tunnel operating at a Reynolds number of 240,000, 20° flap deflection
angle and 0° degree angle of incidence. The actuators were independently powered in order to
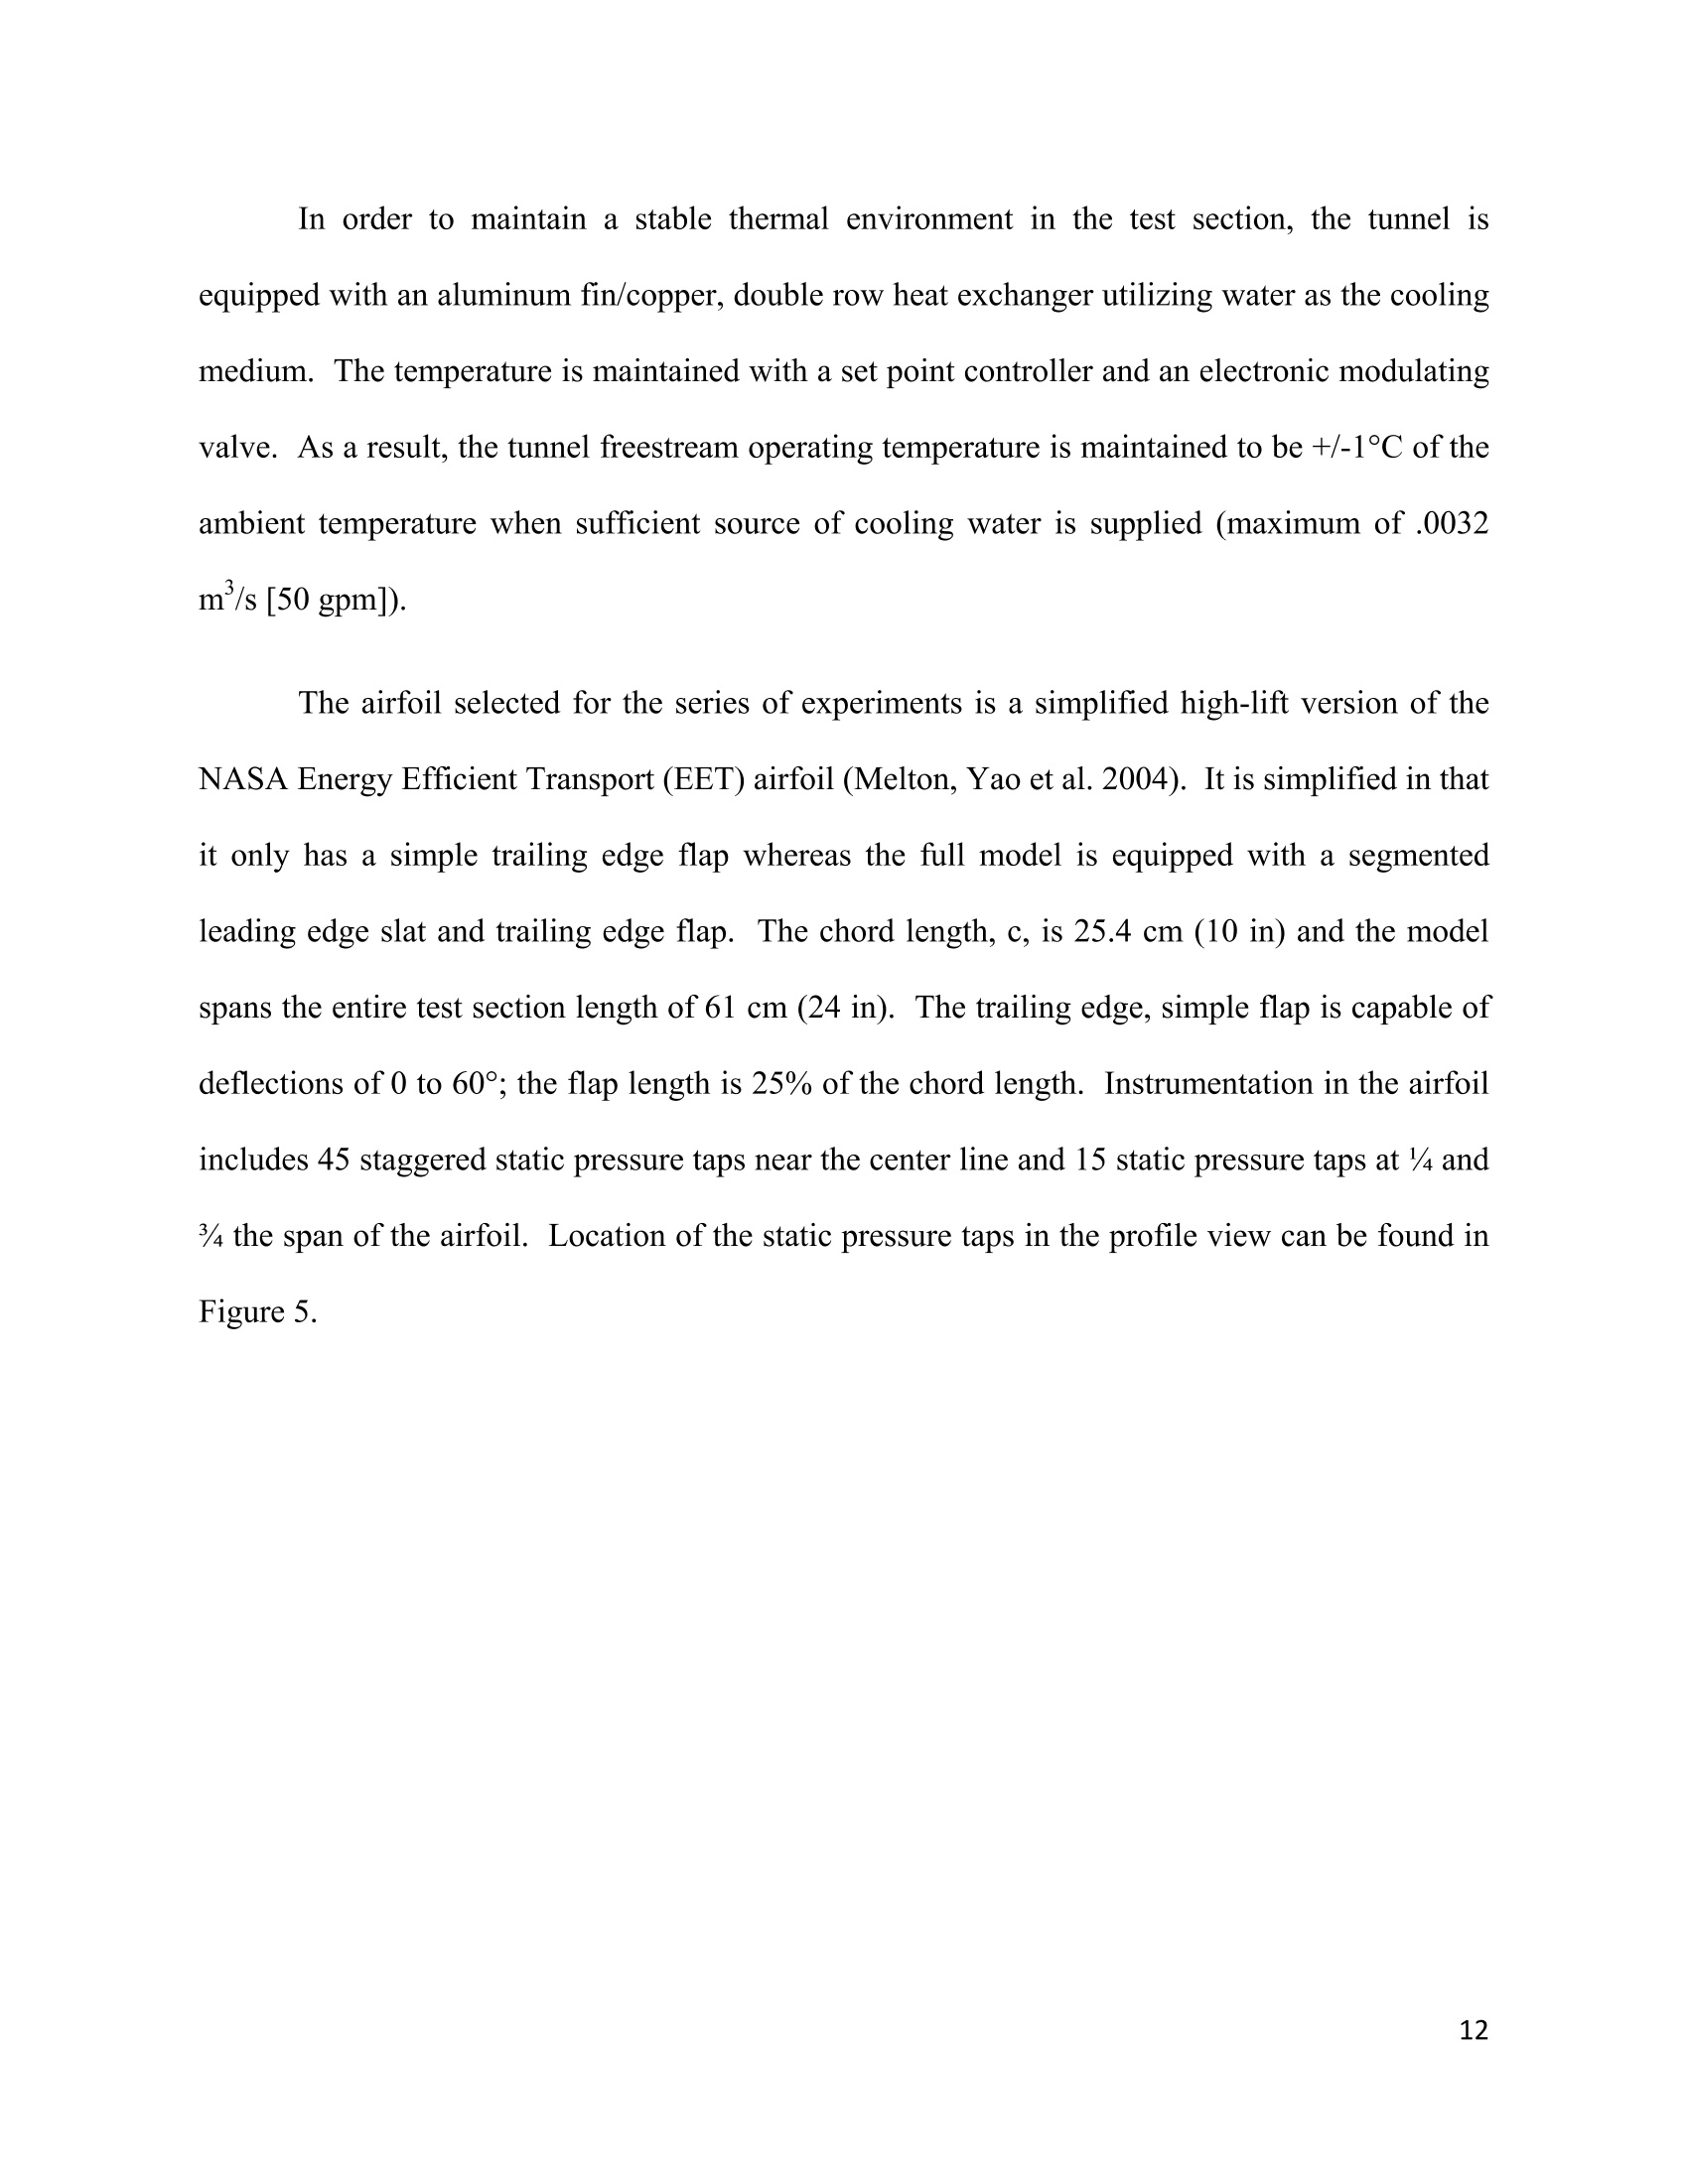
determine the most effective input parameters. Using multiple actuators operated in-phase has
increased the lift and has delayed flow separation on the trailing edge flap when compared to
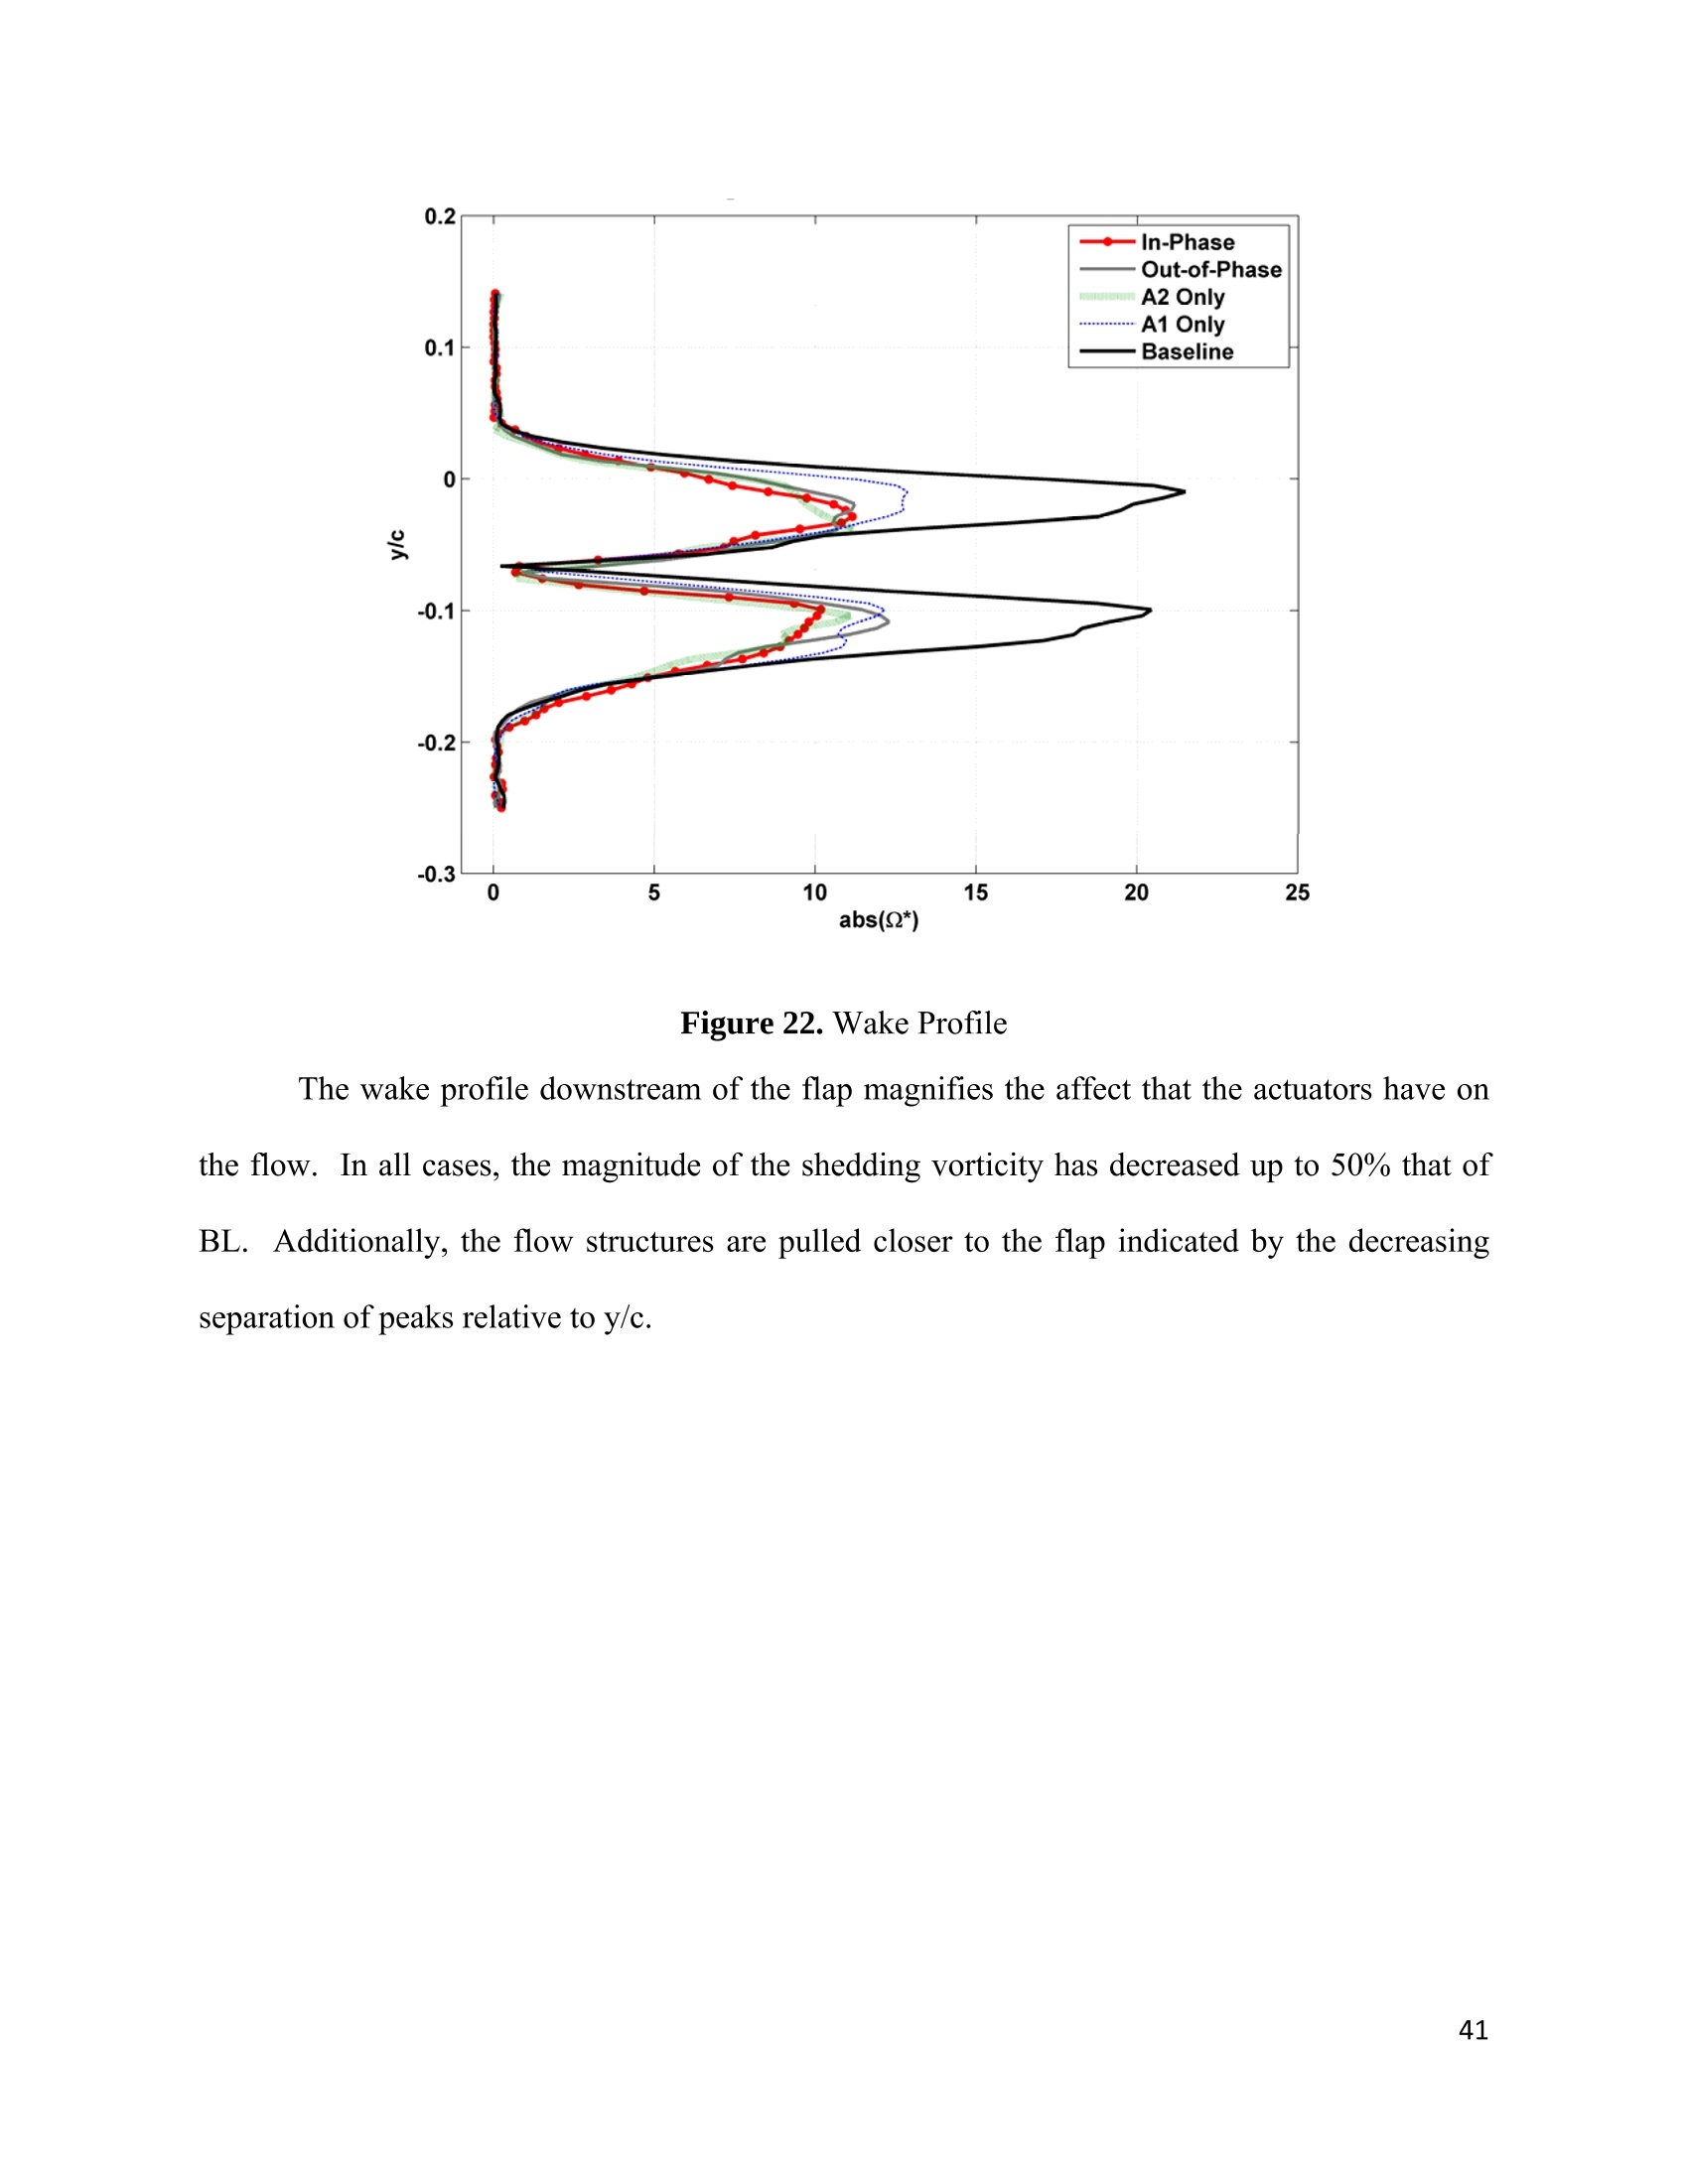
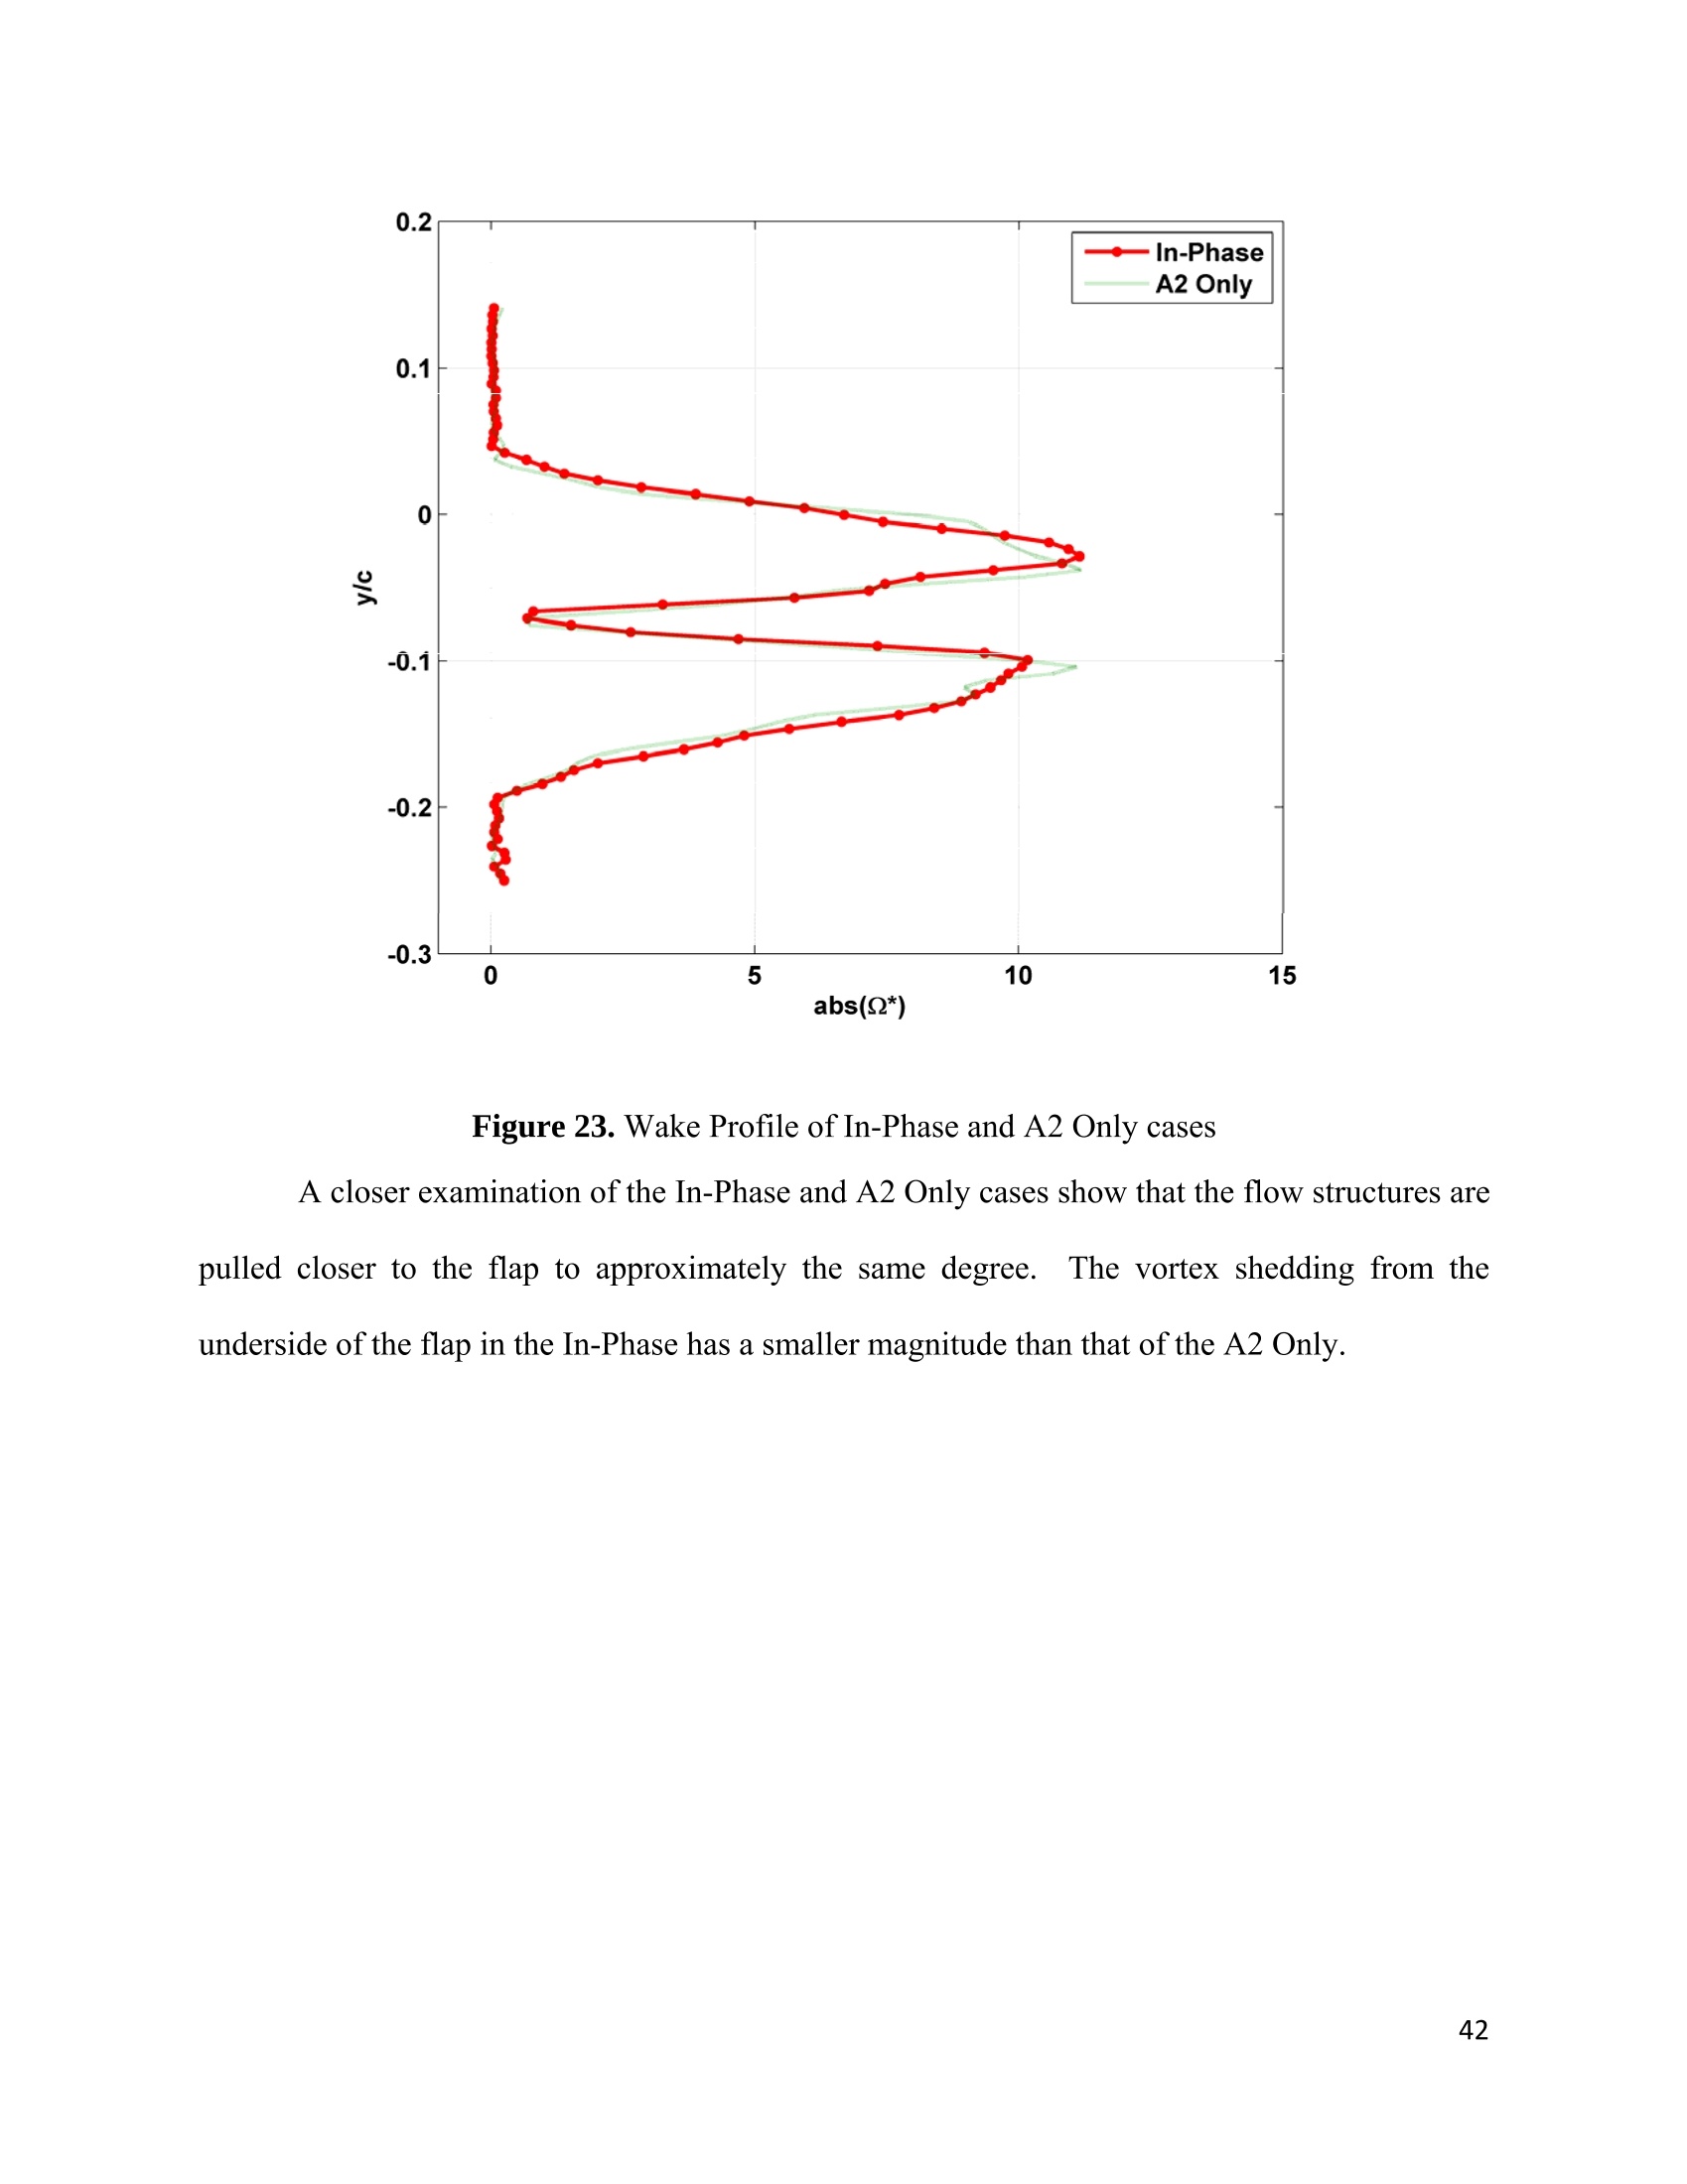
baseline and single actuation cases.
方案详情

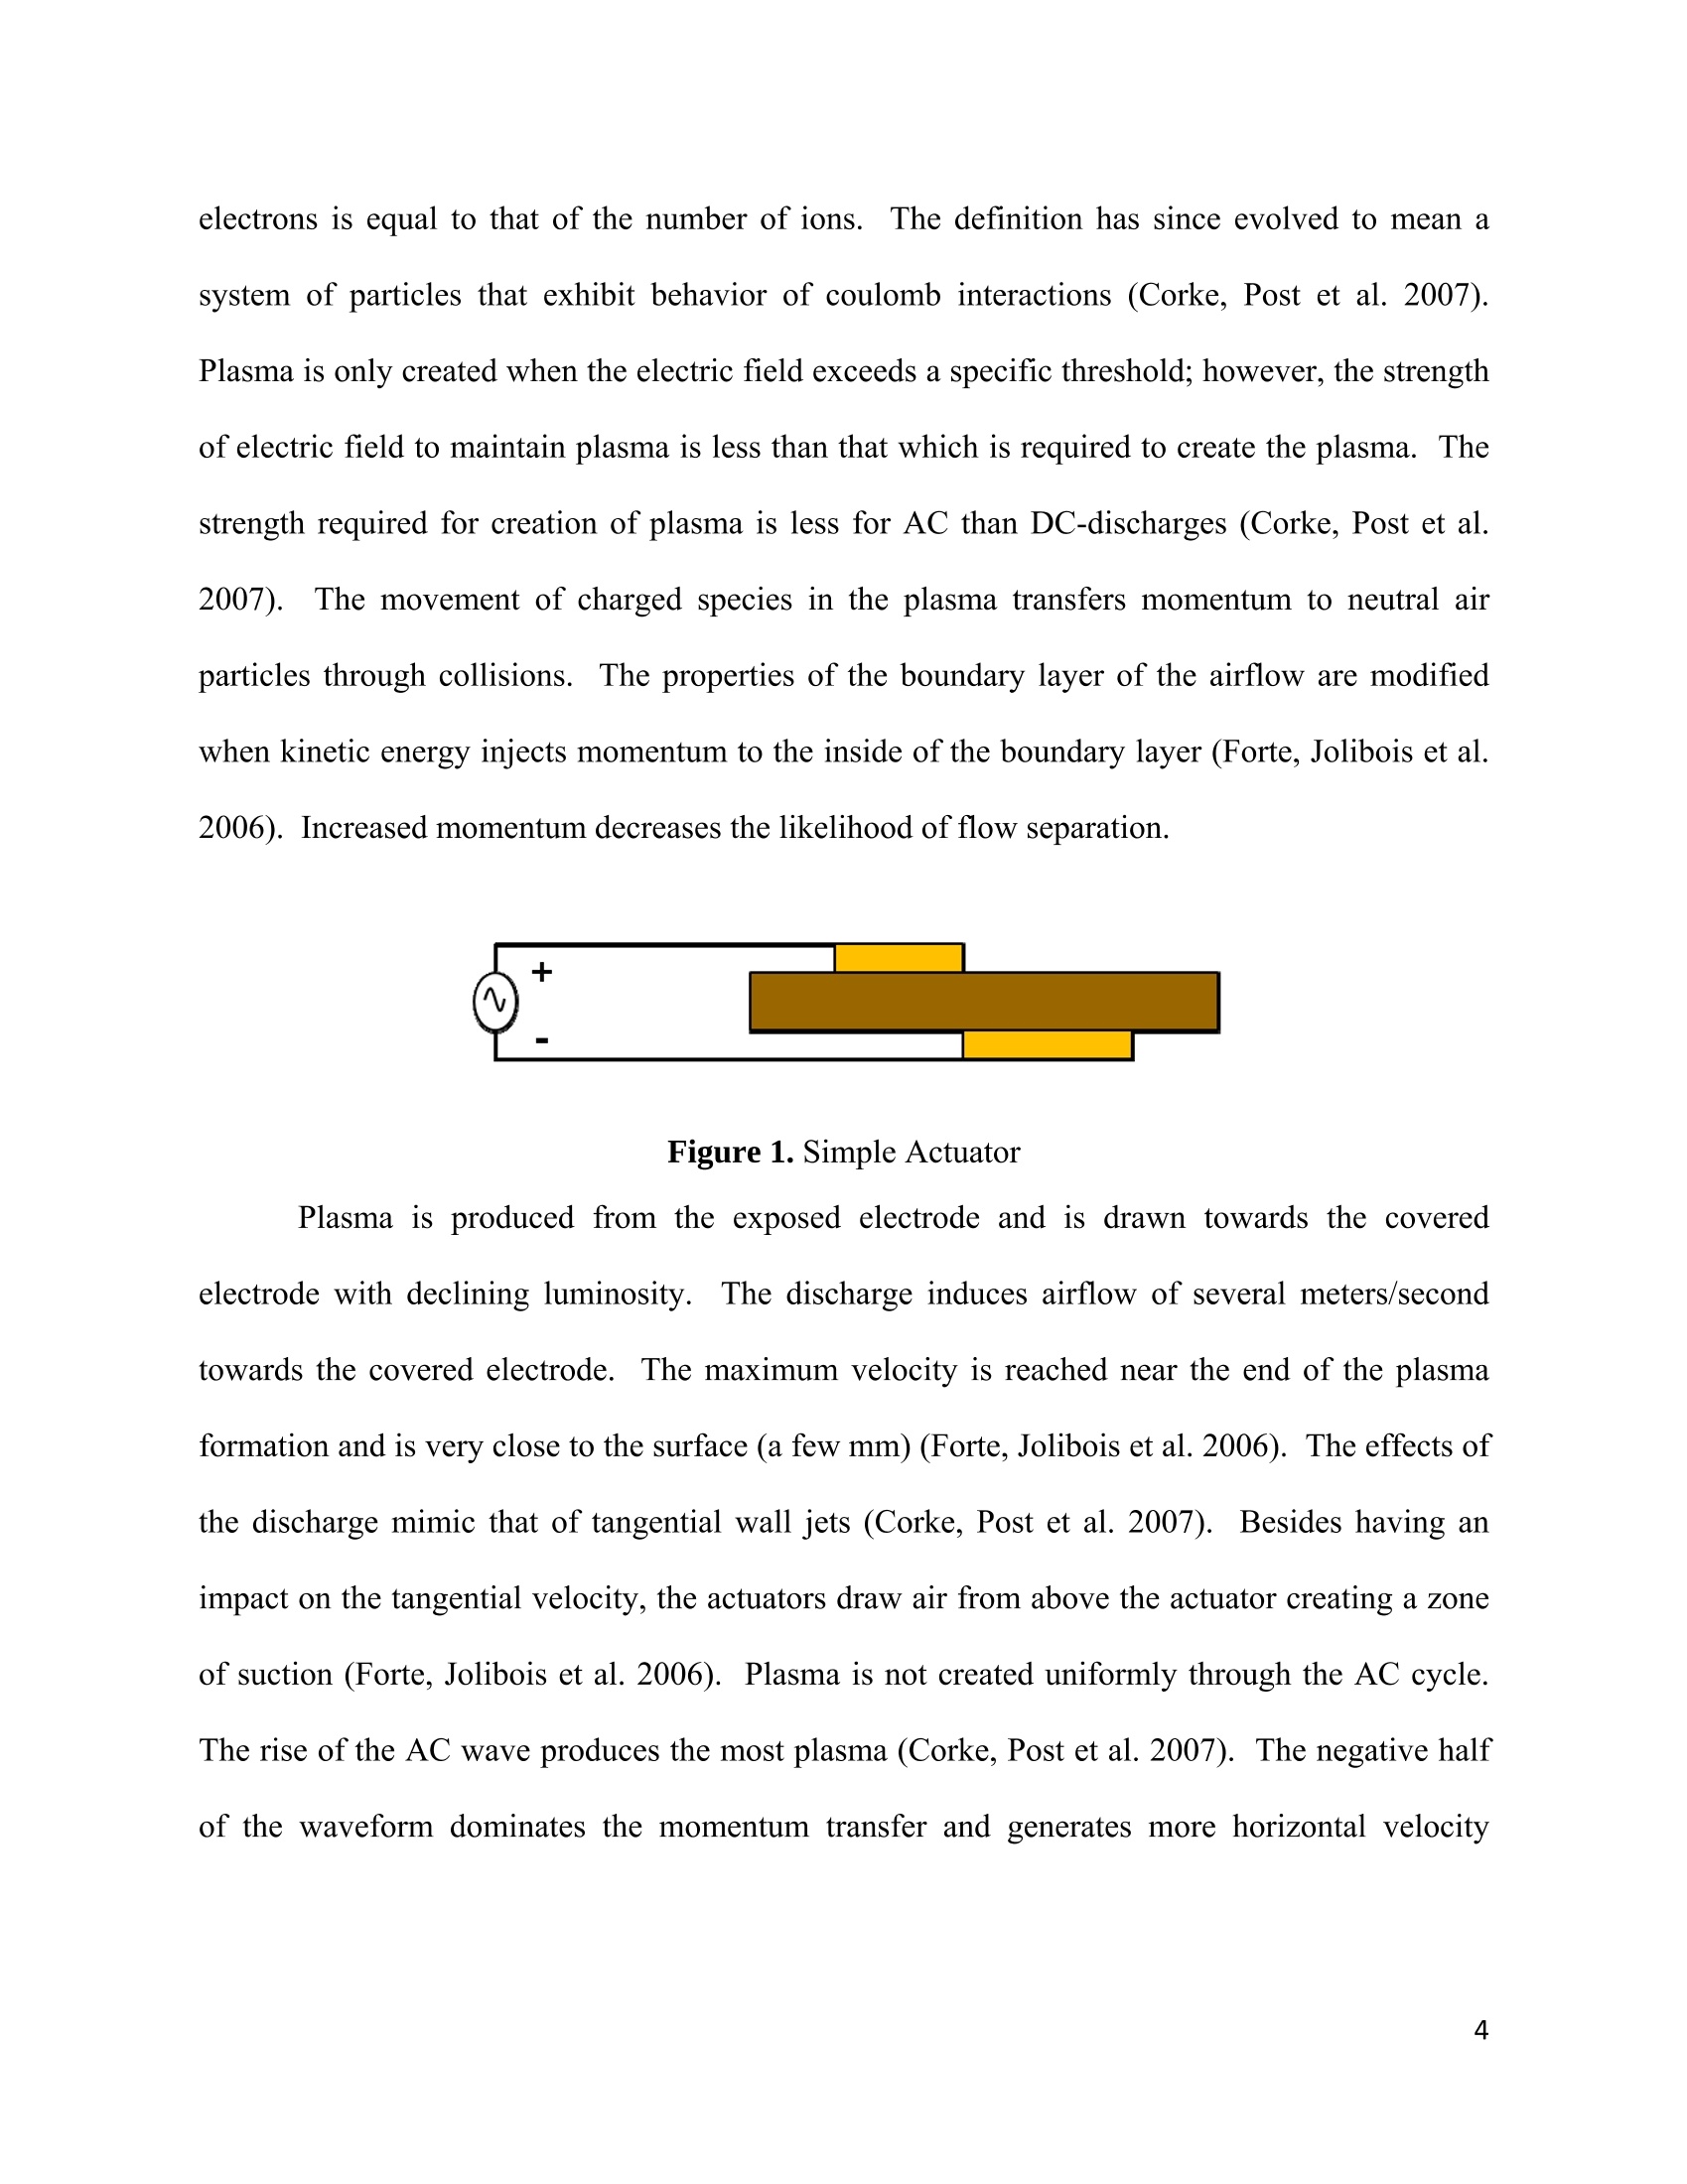
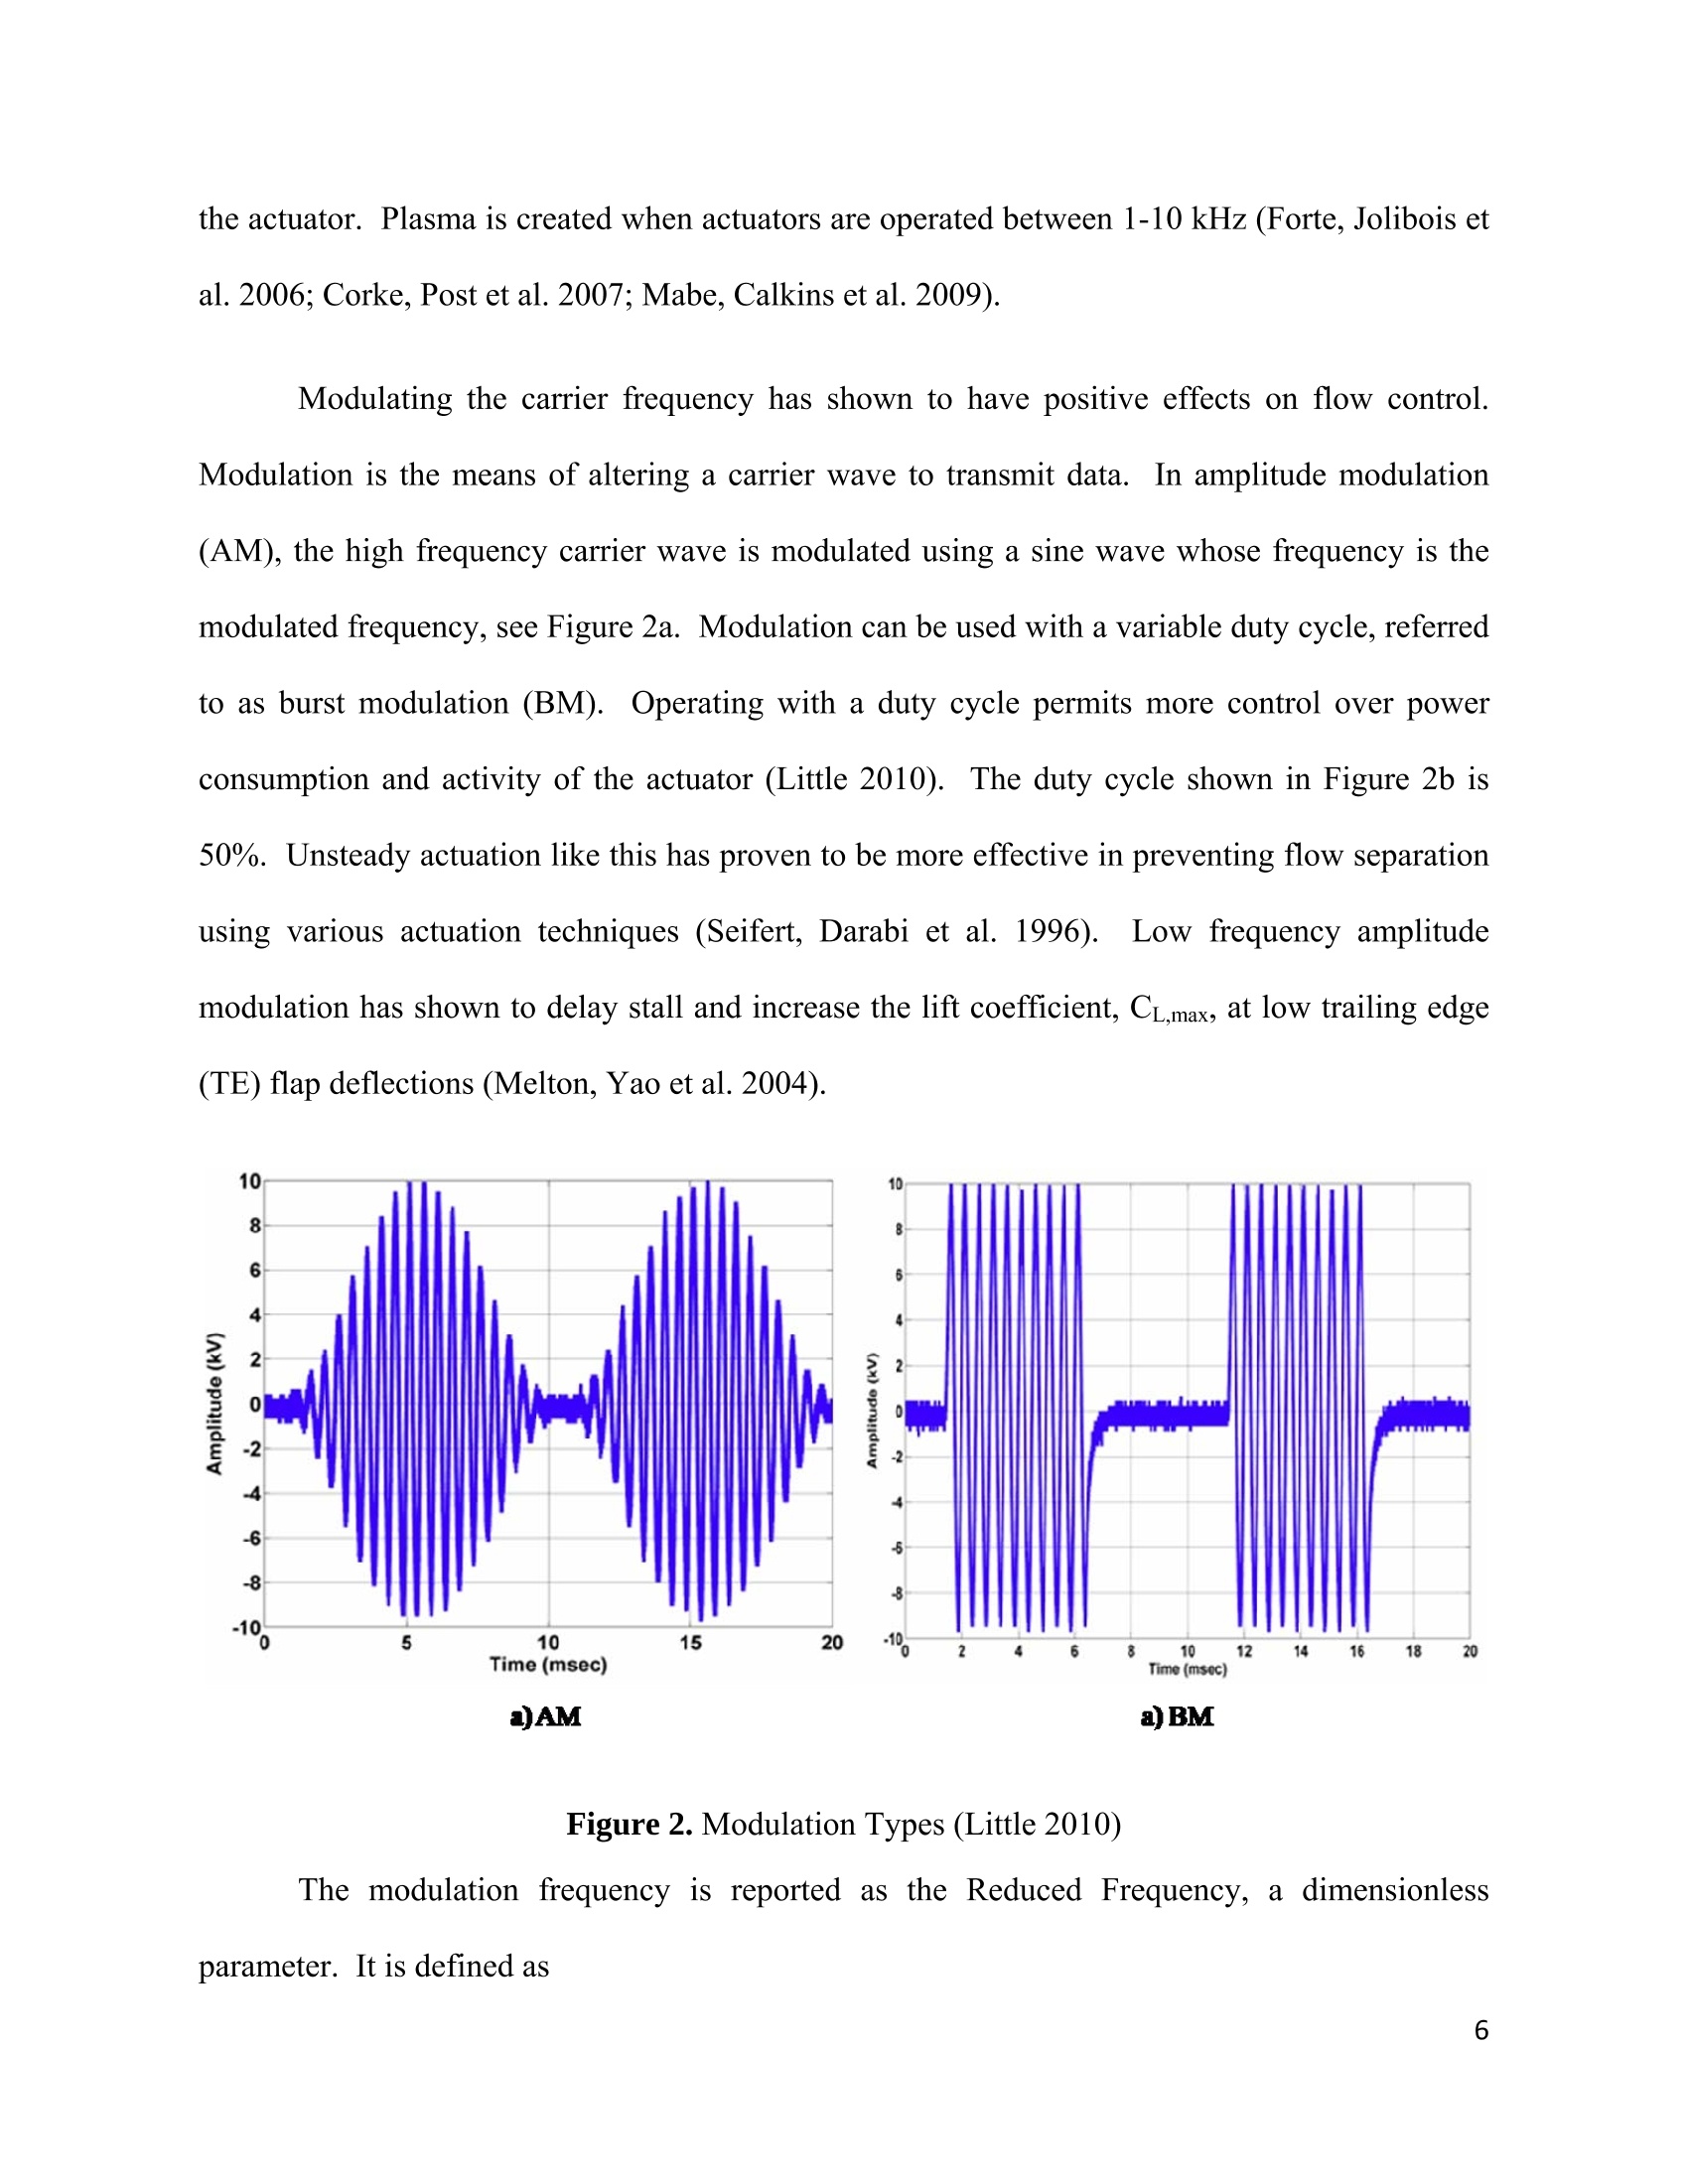
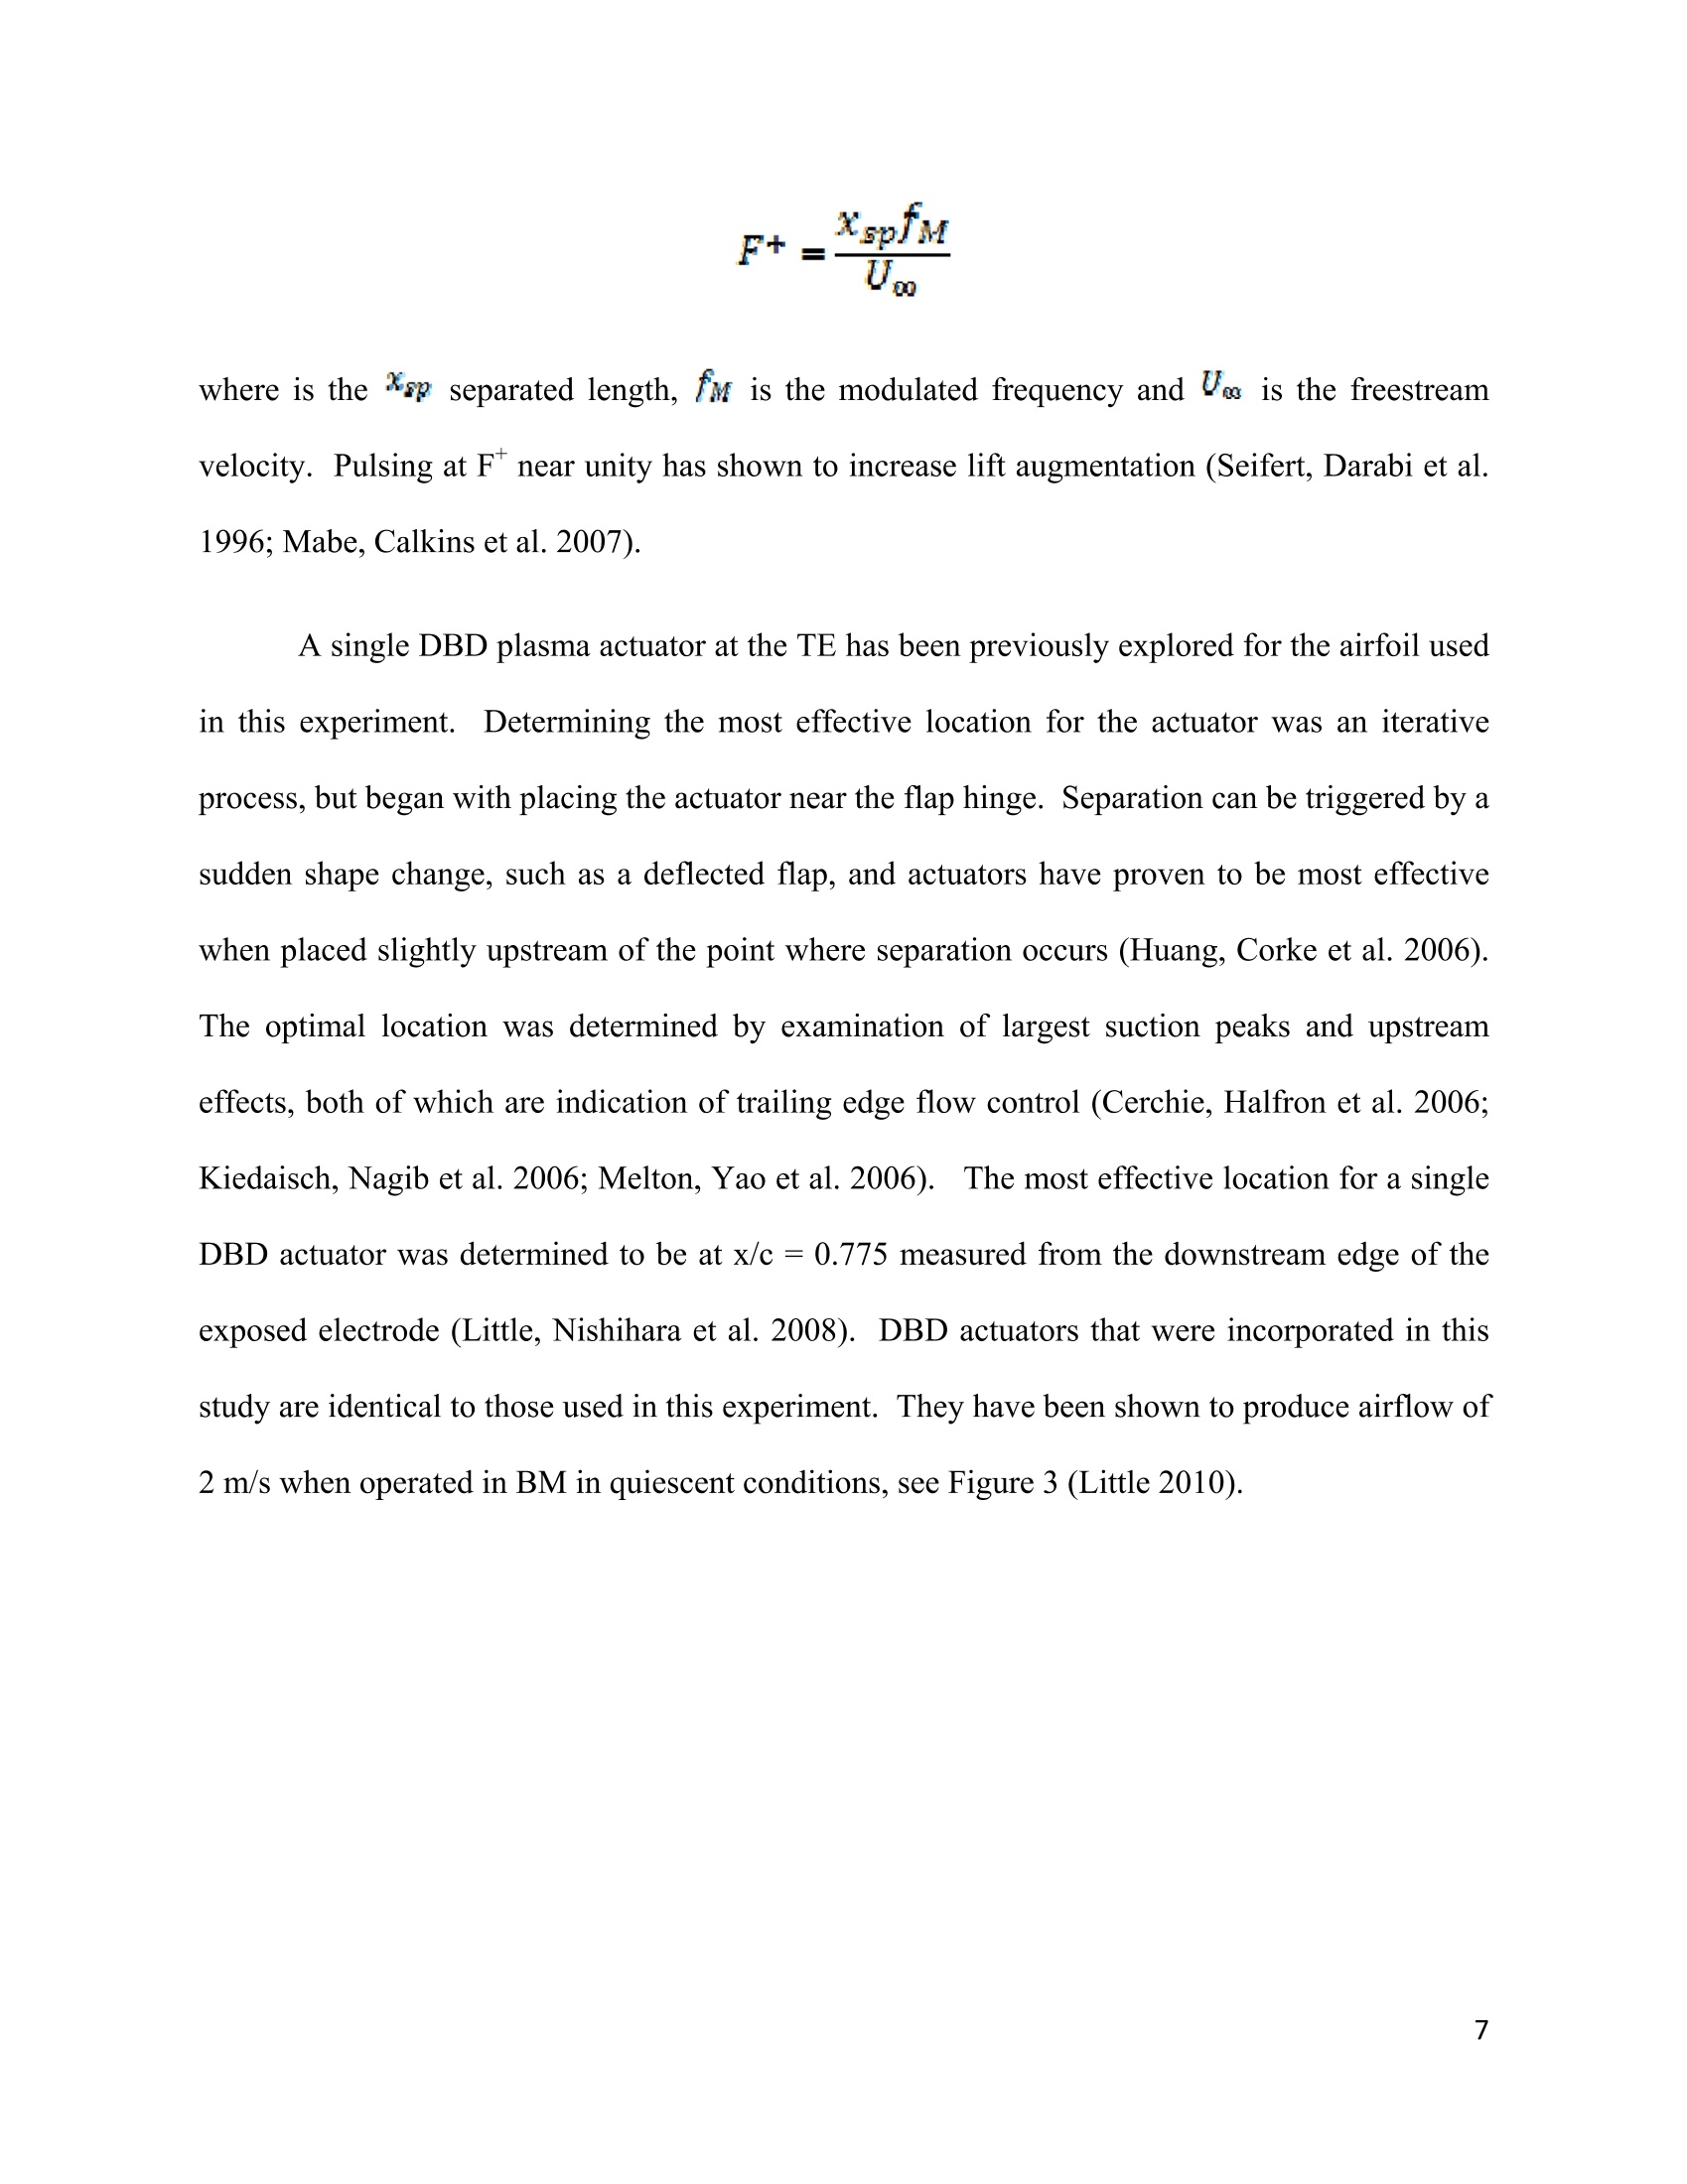
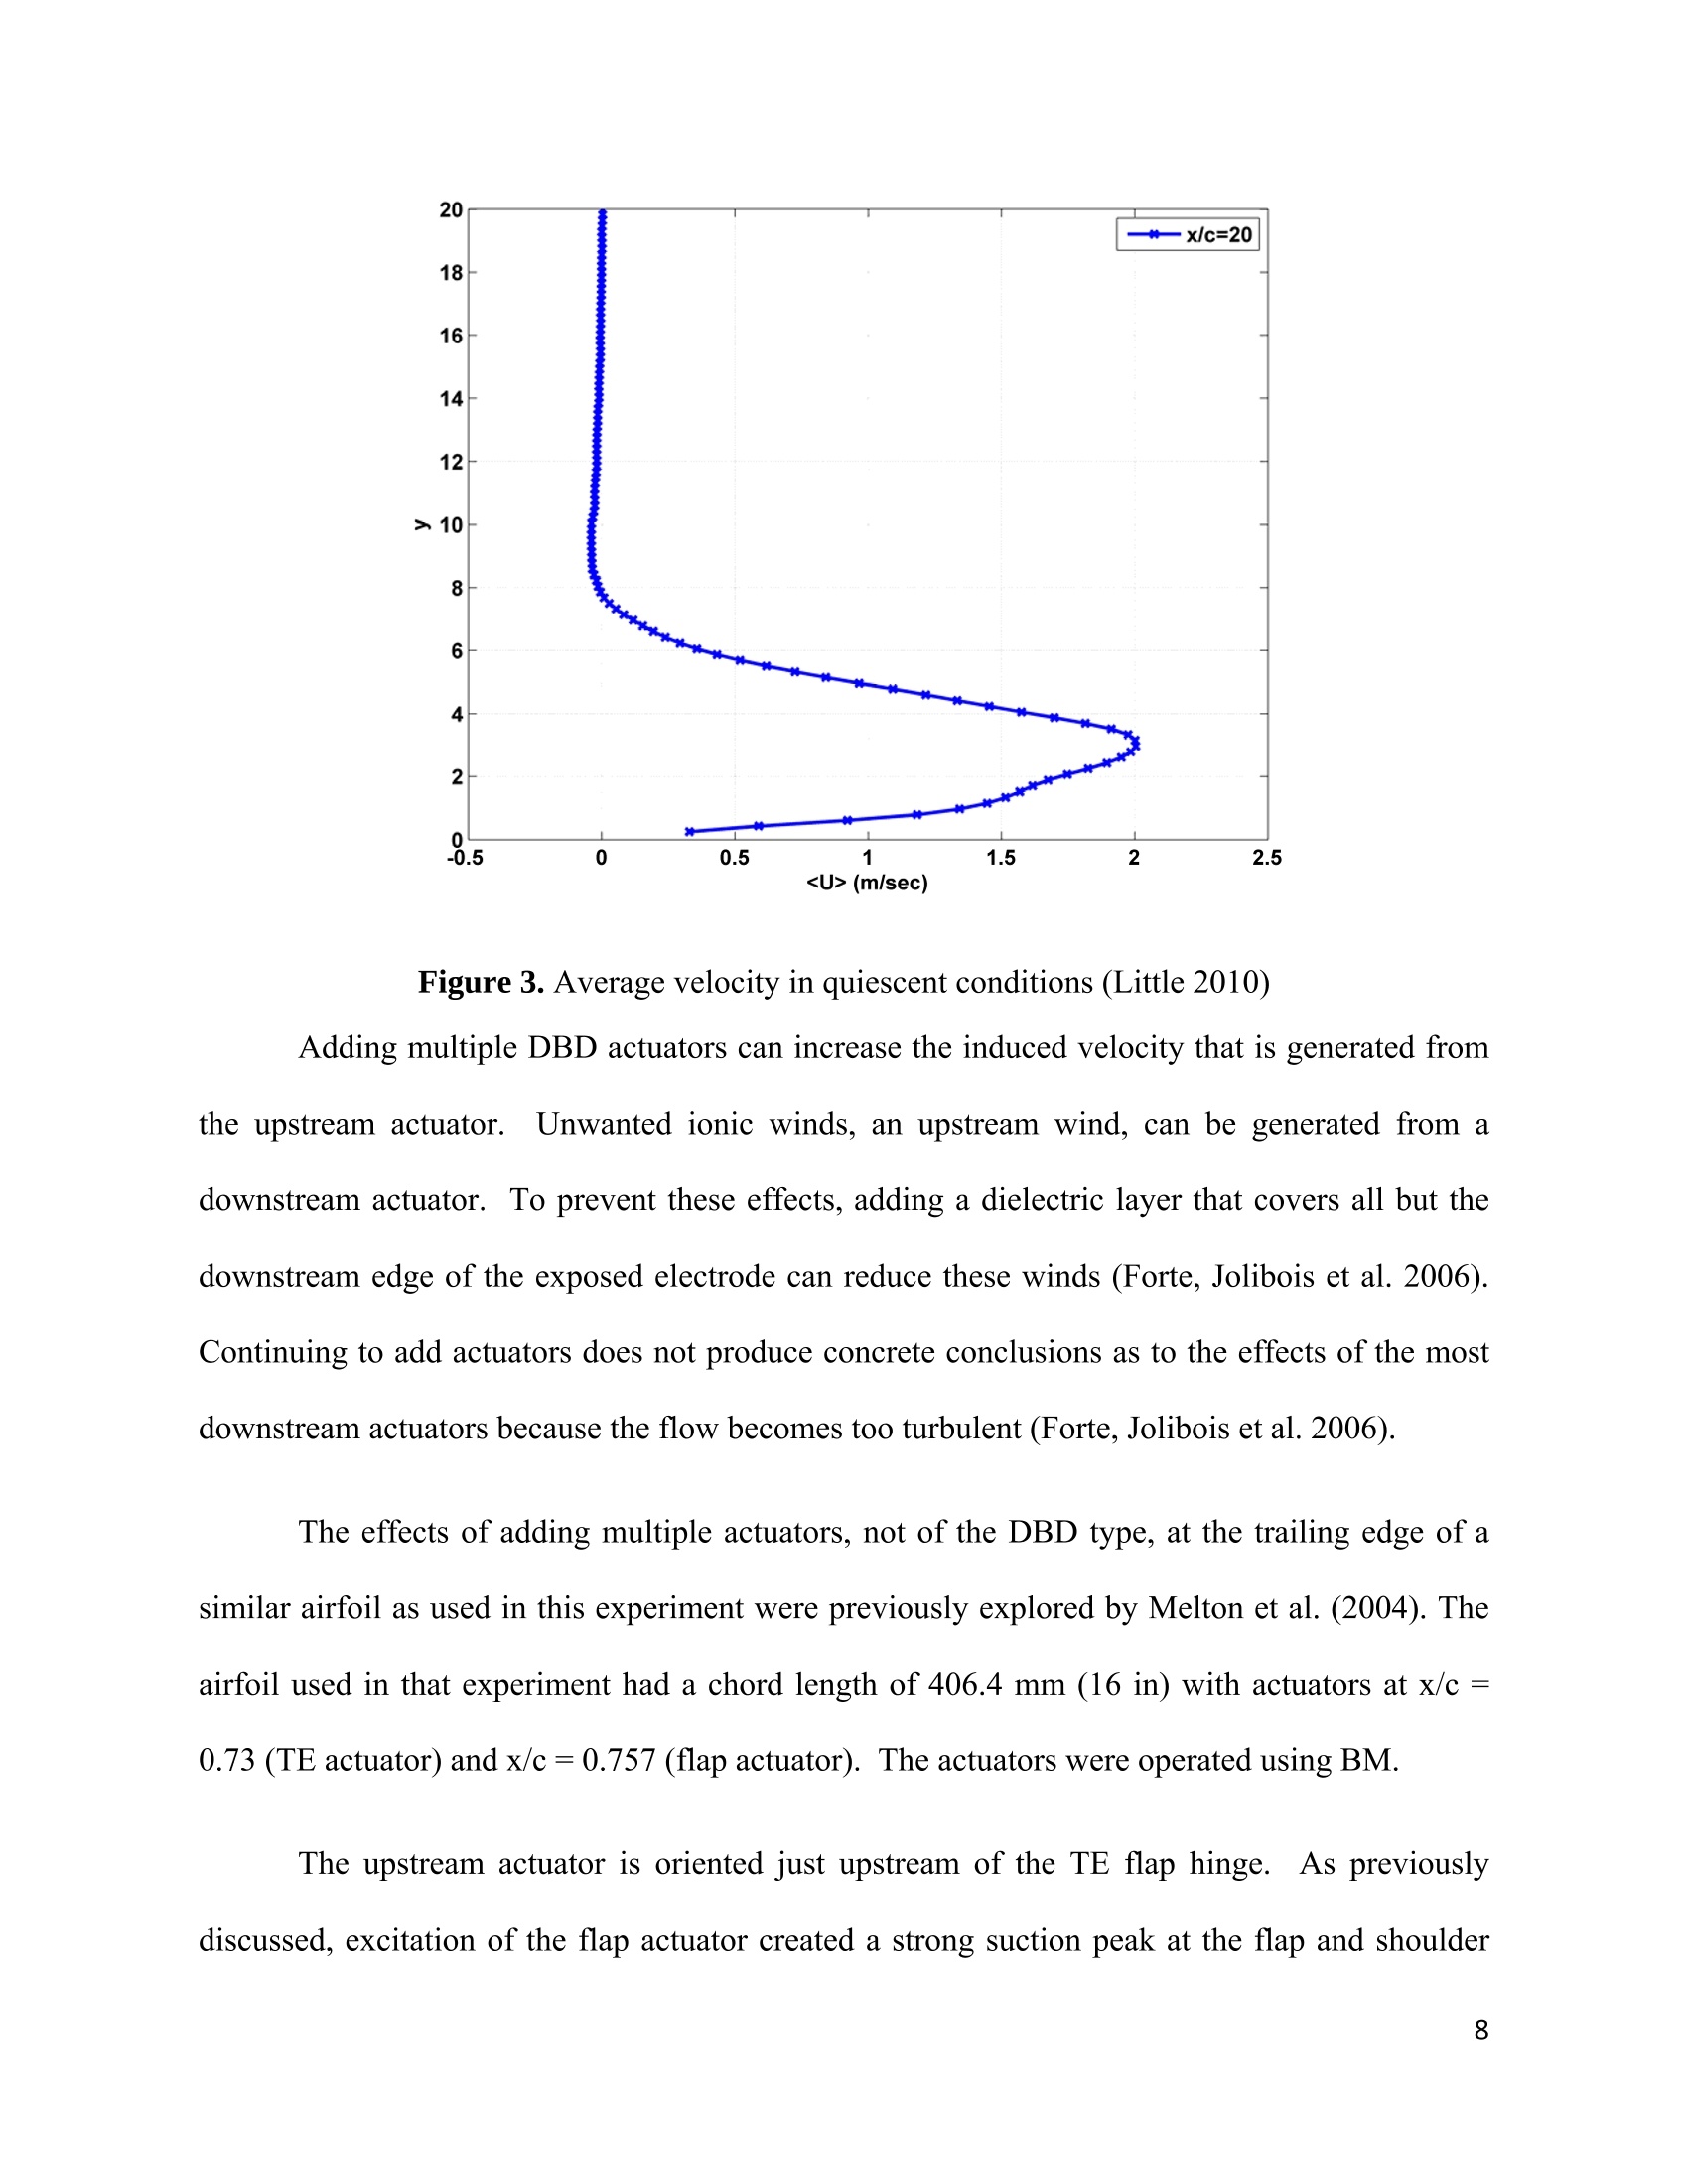
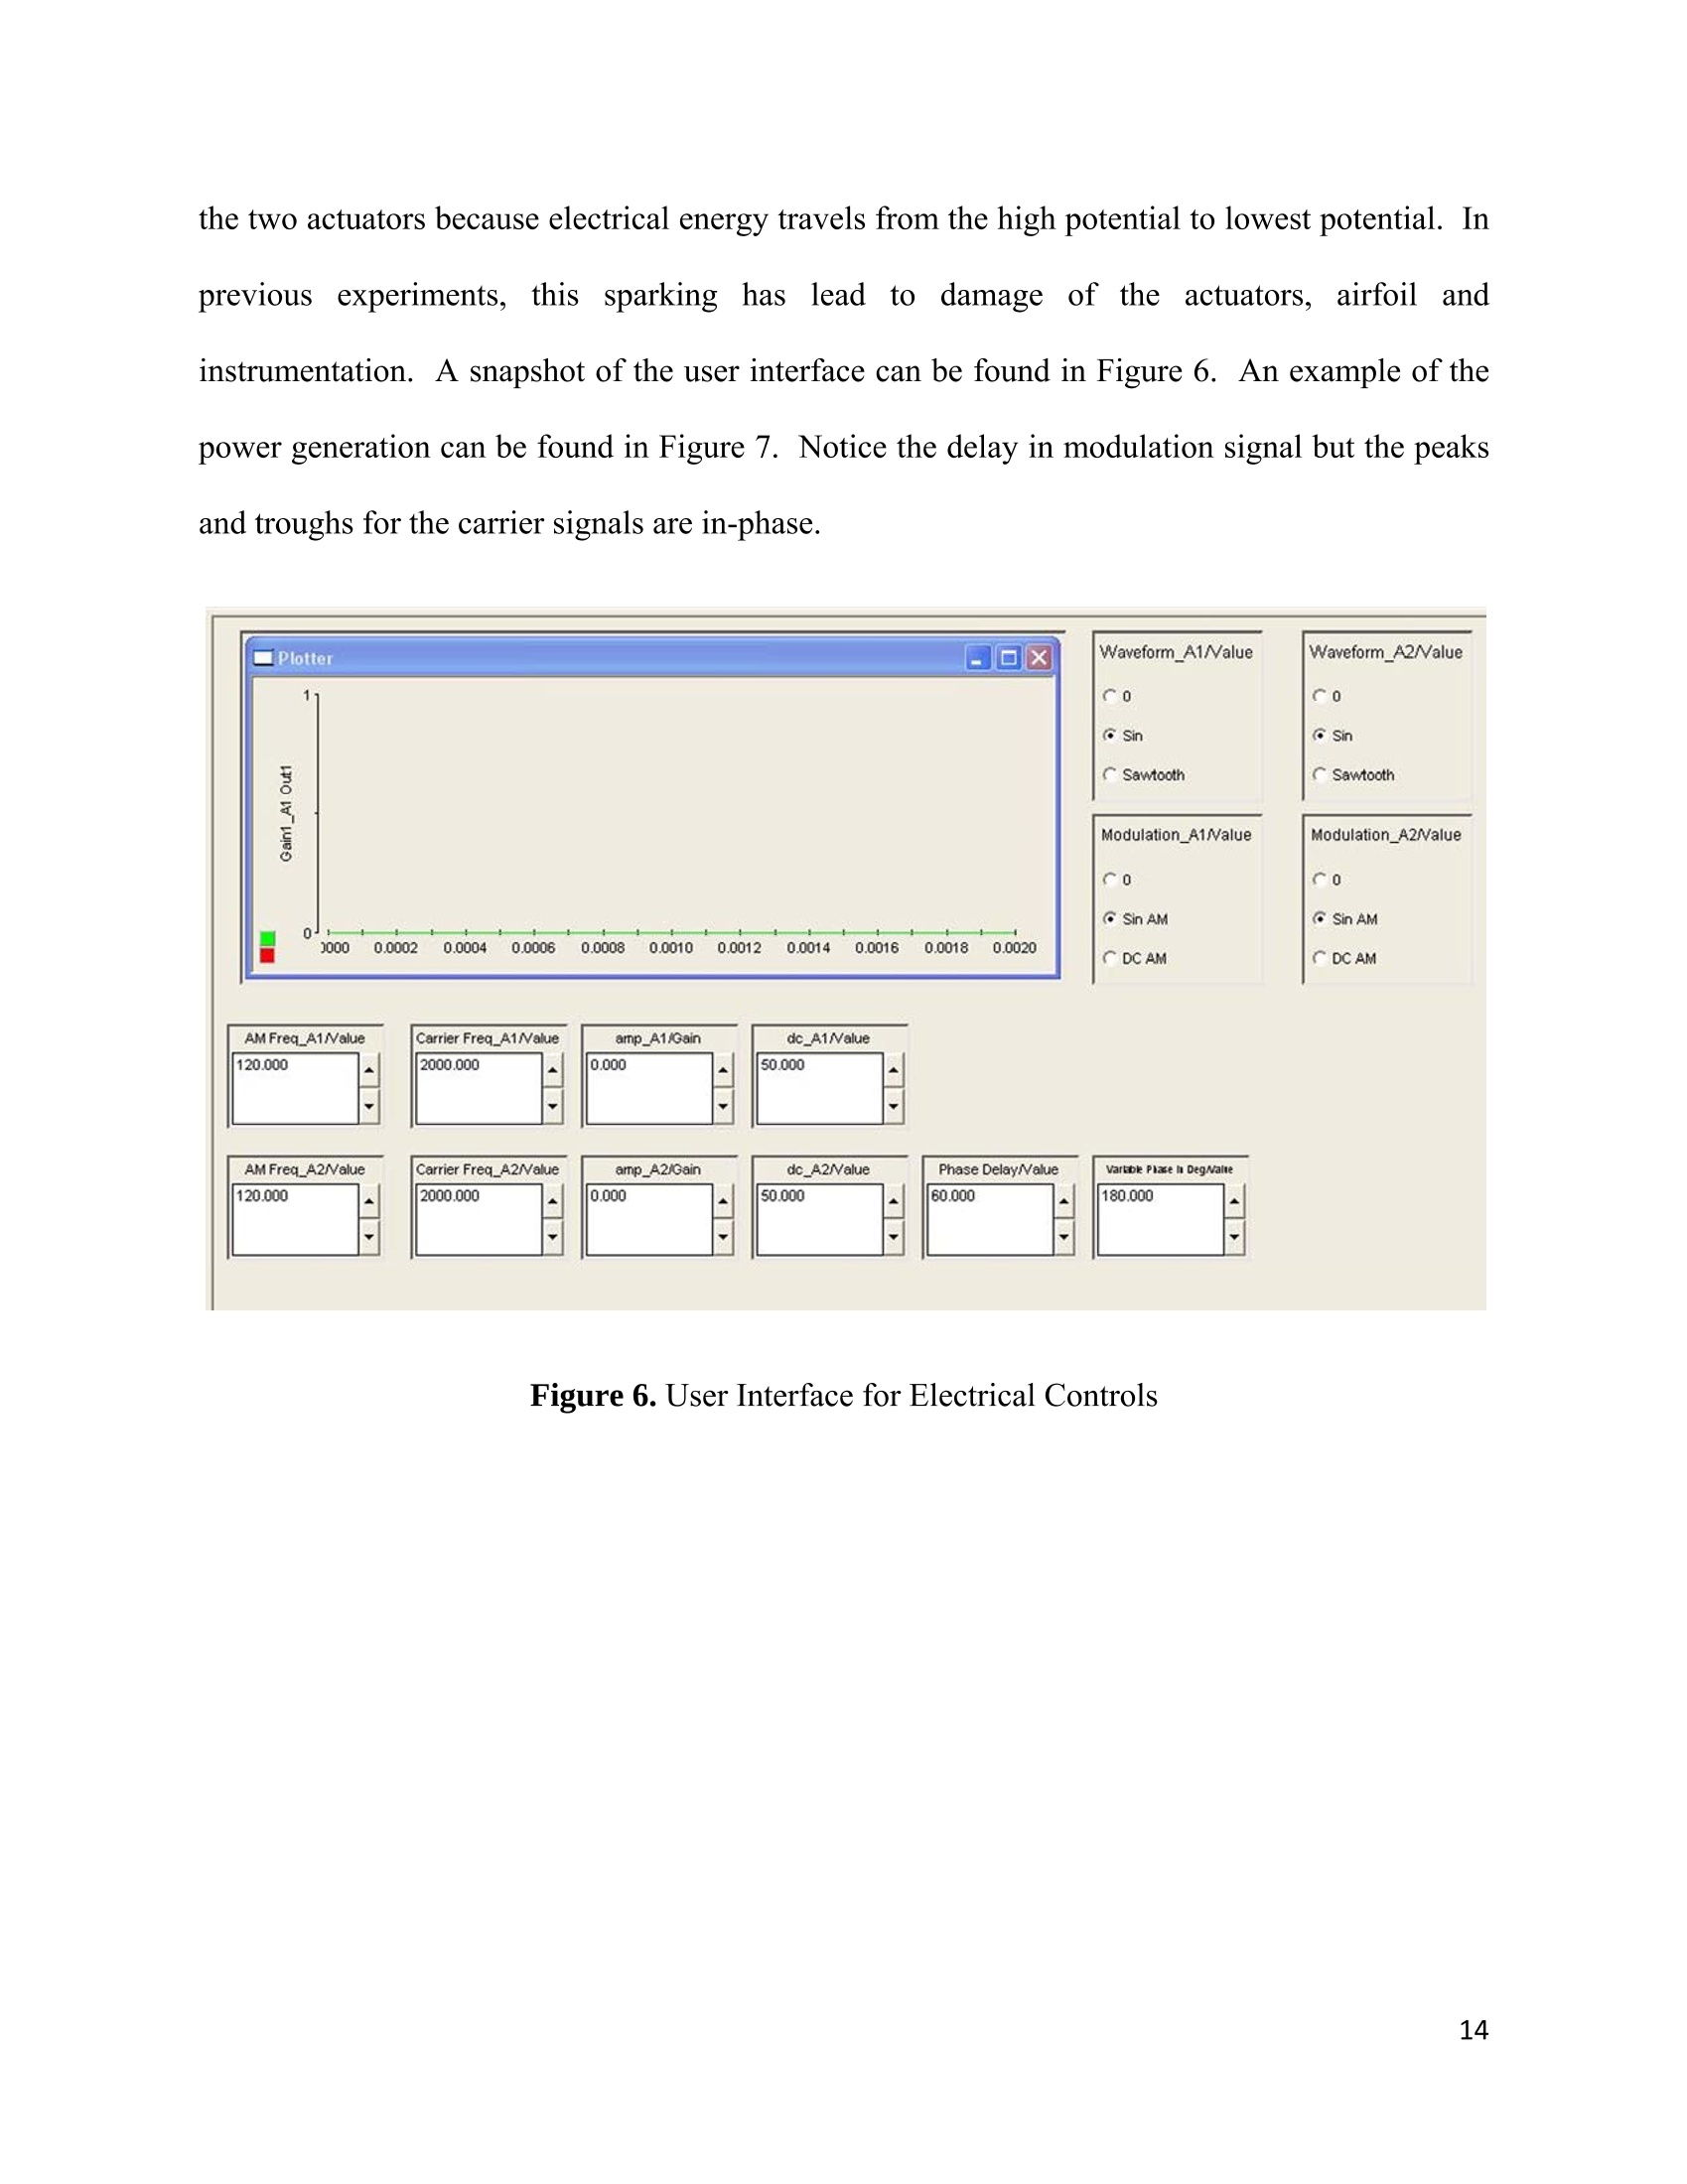
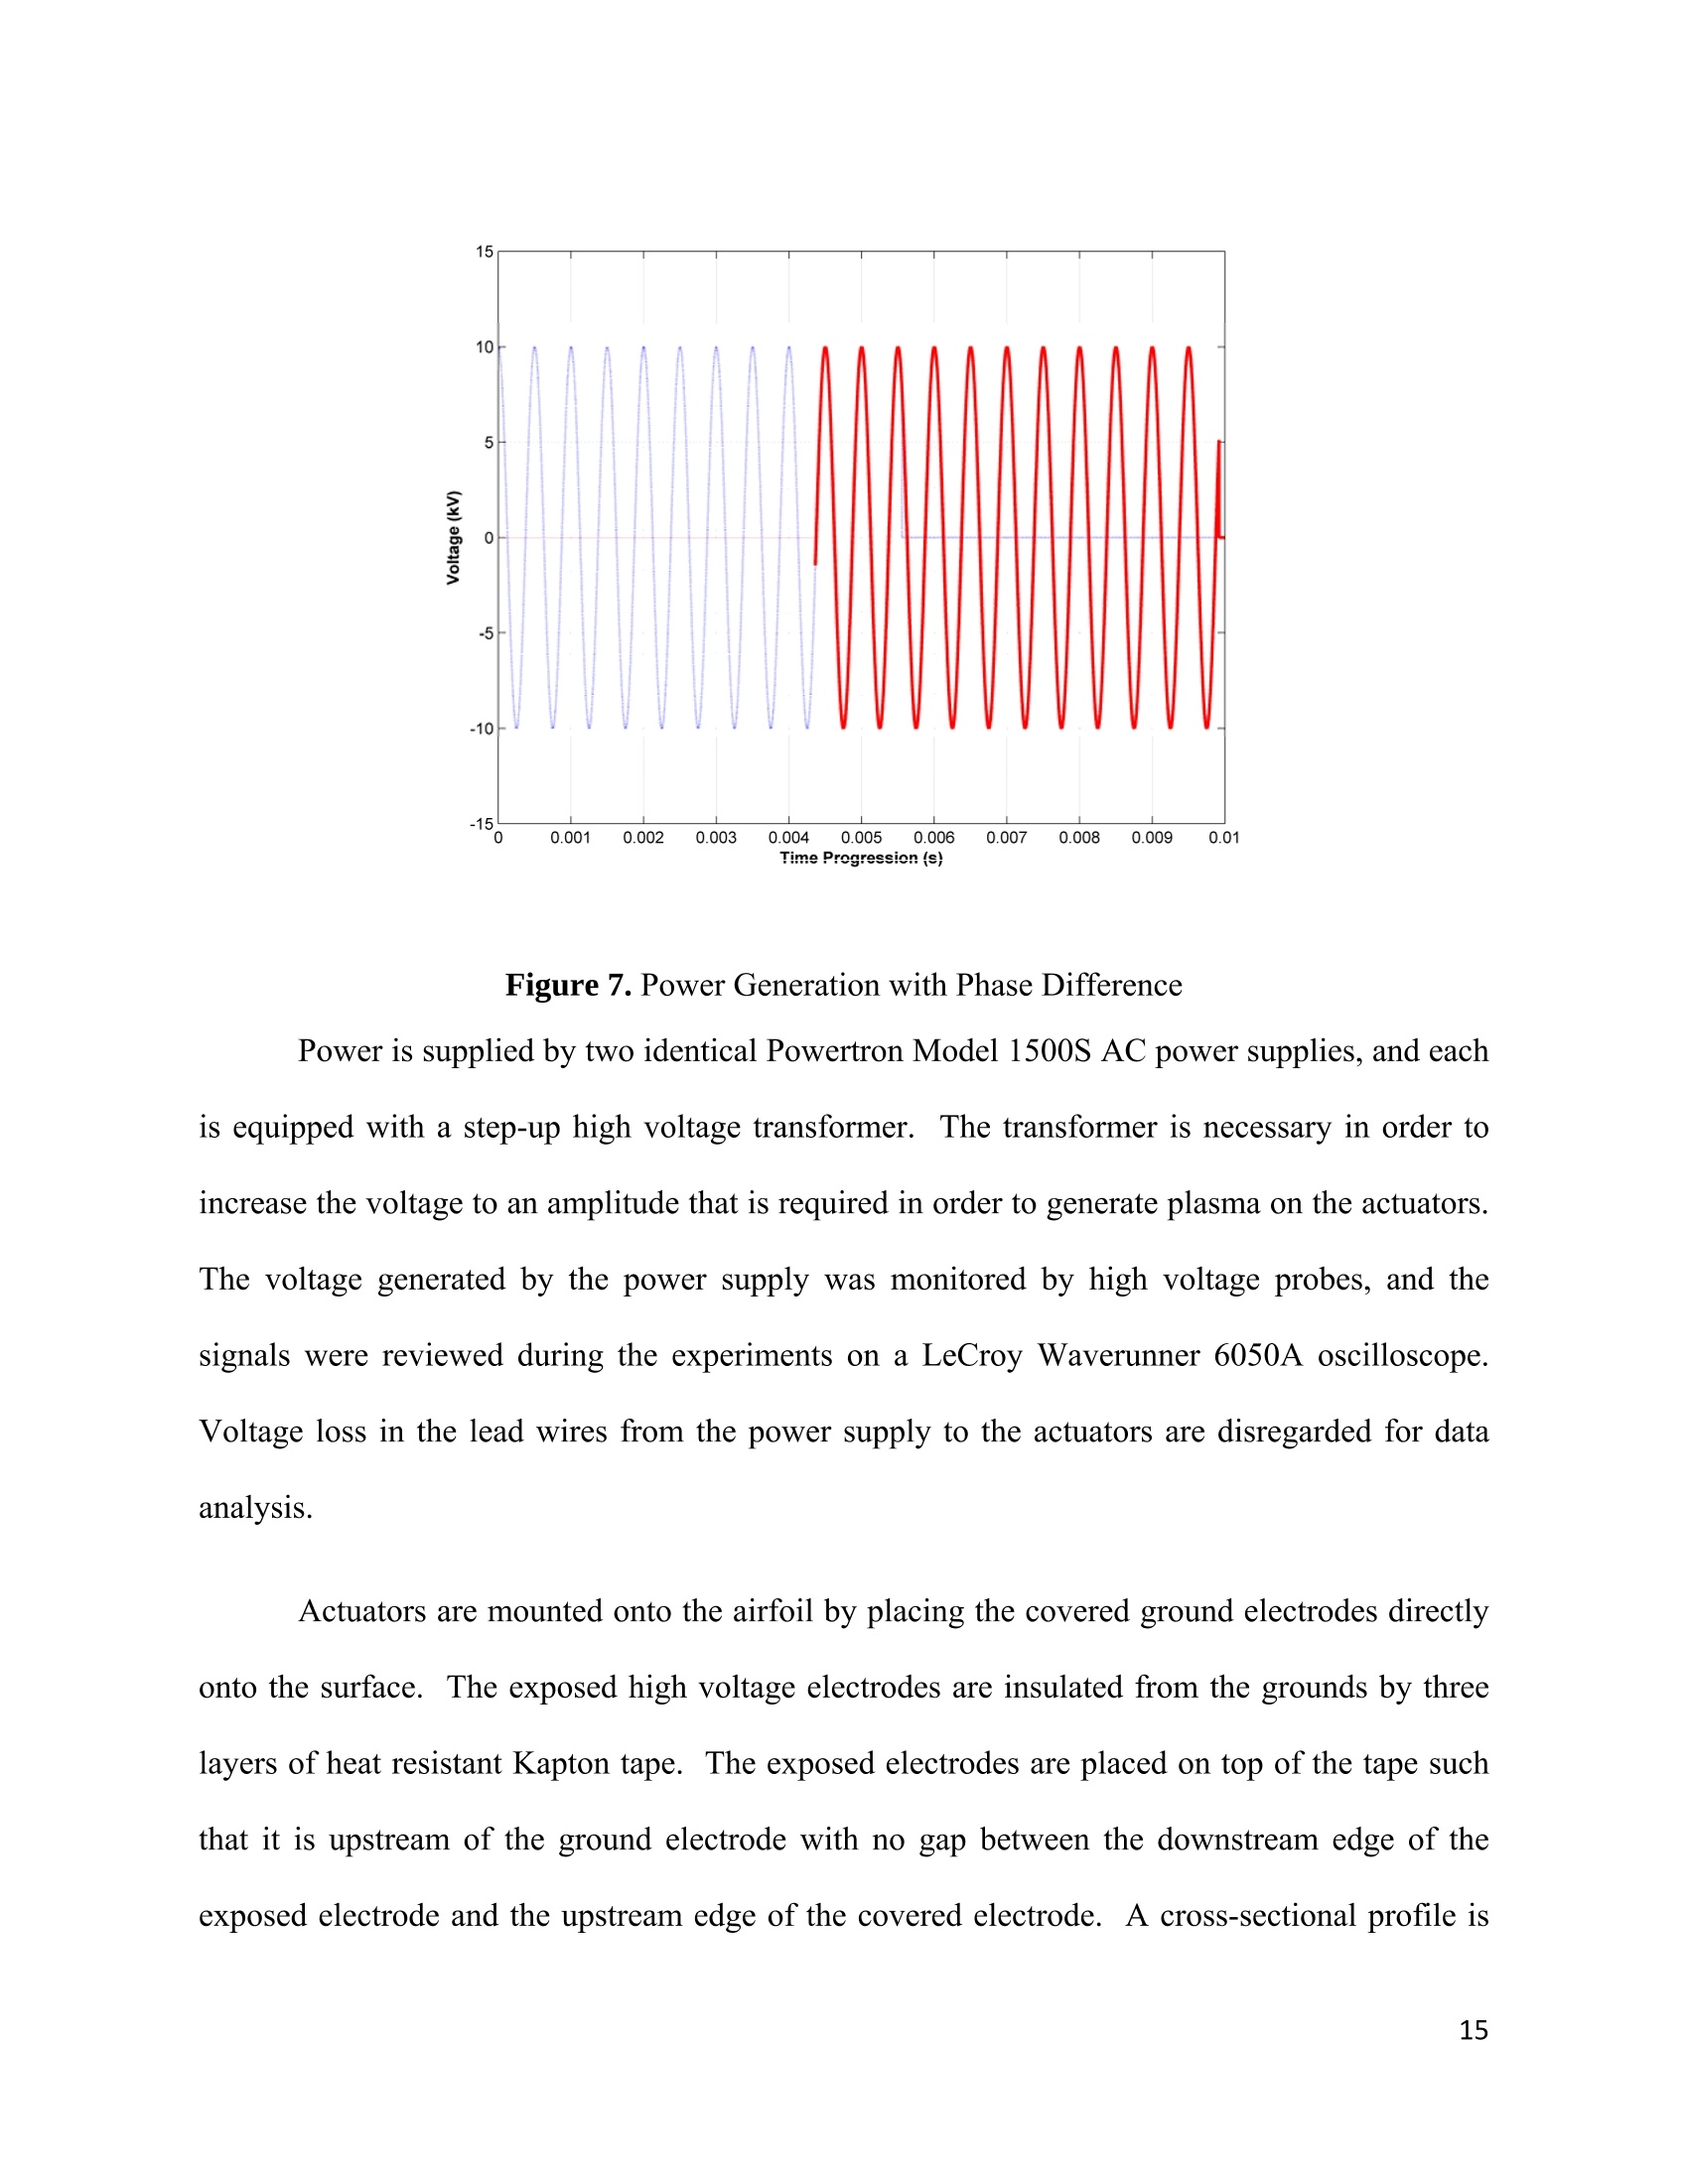
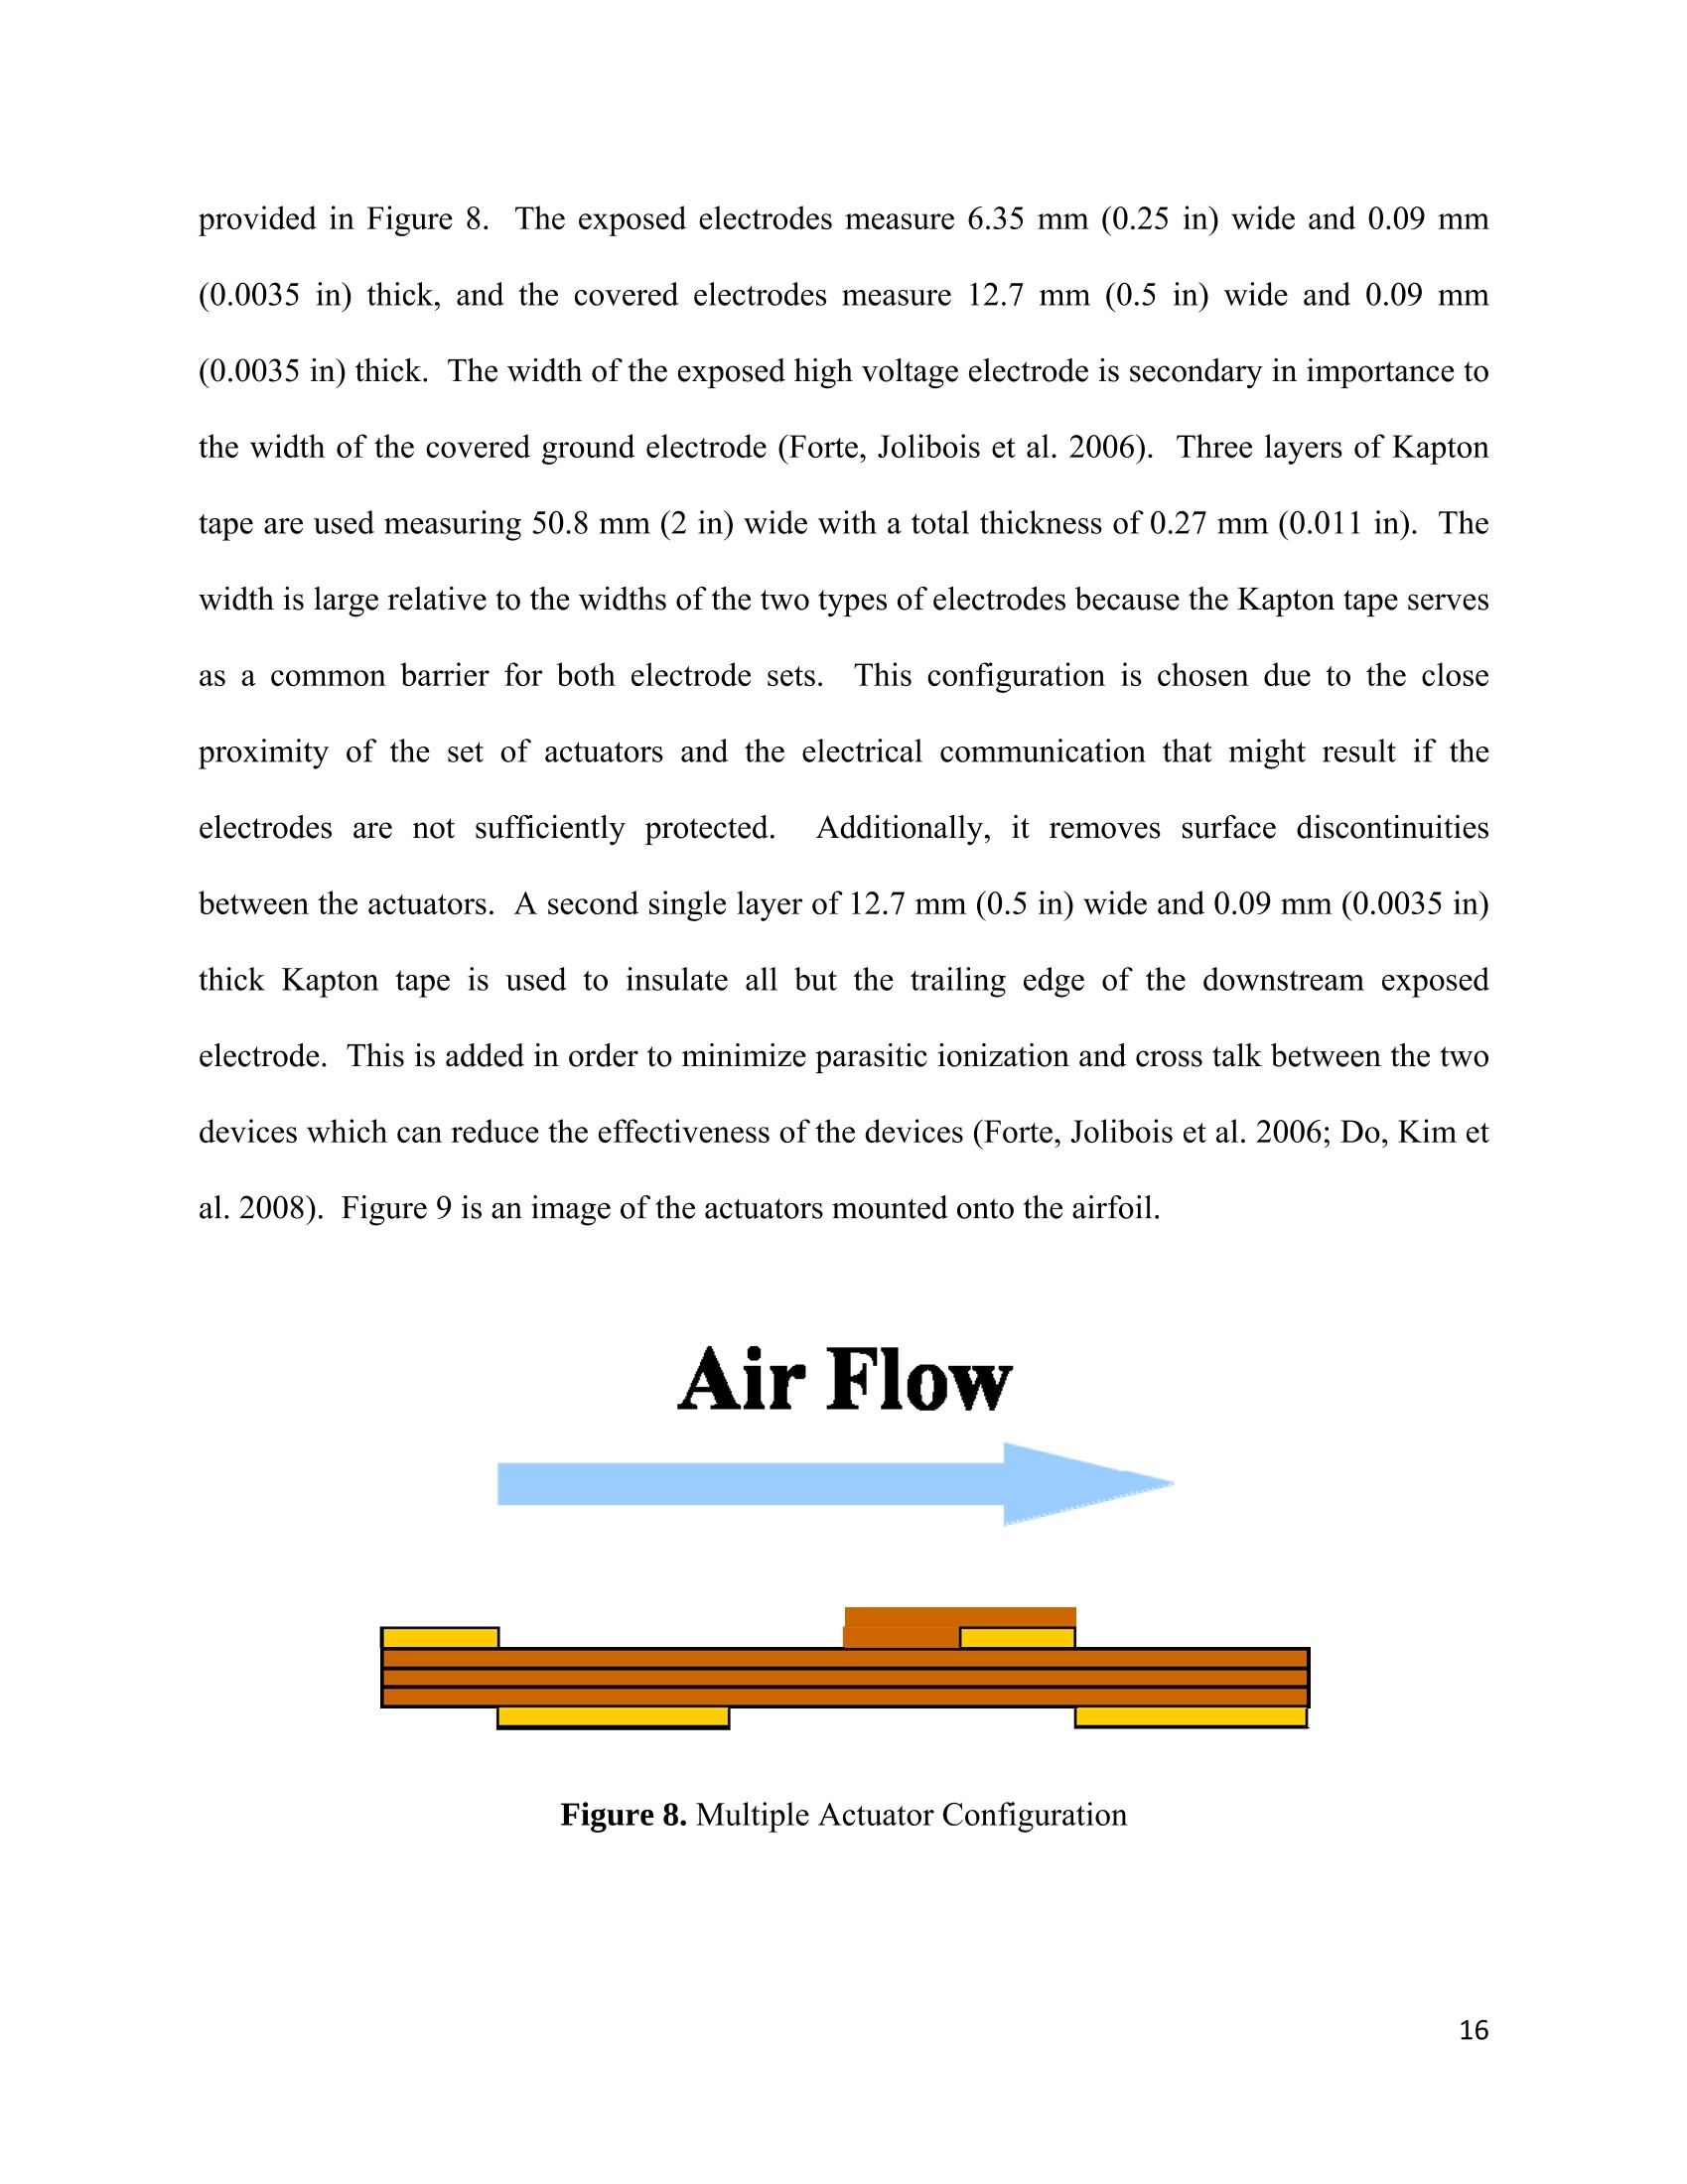
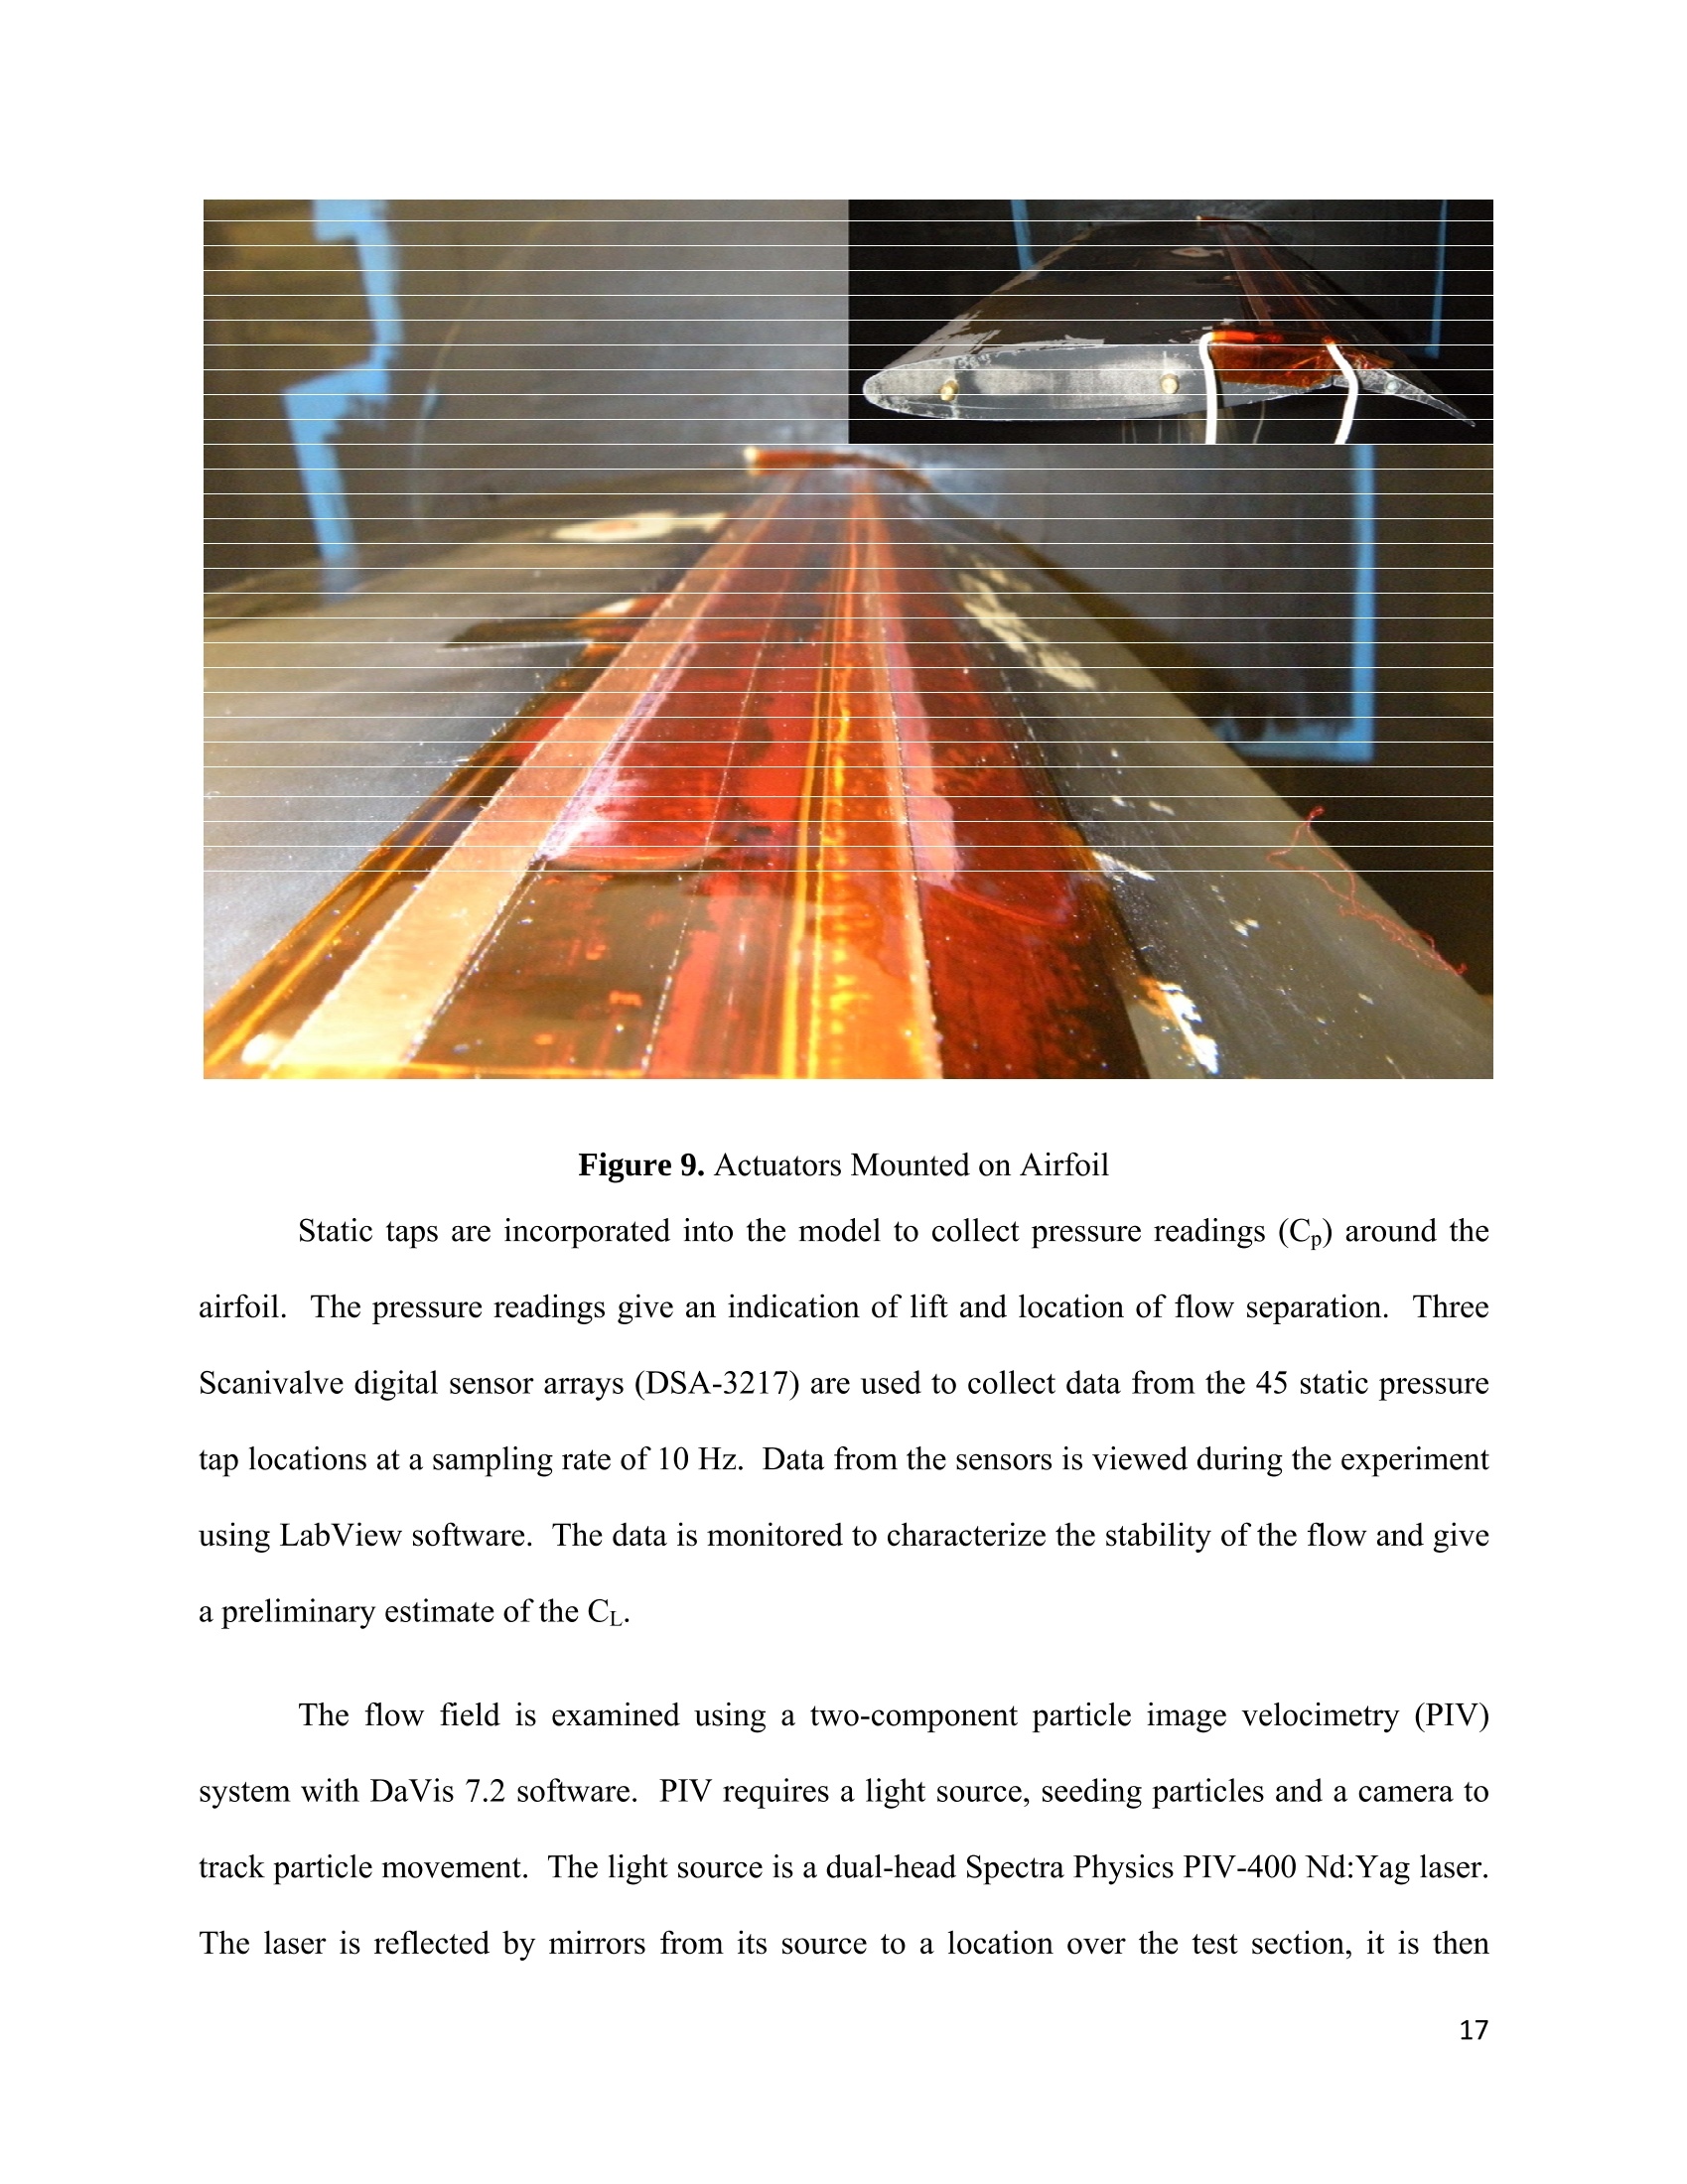
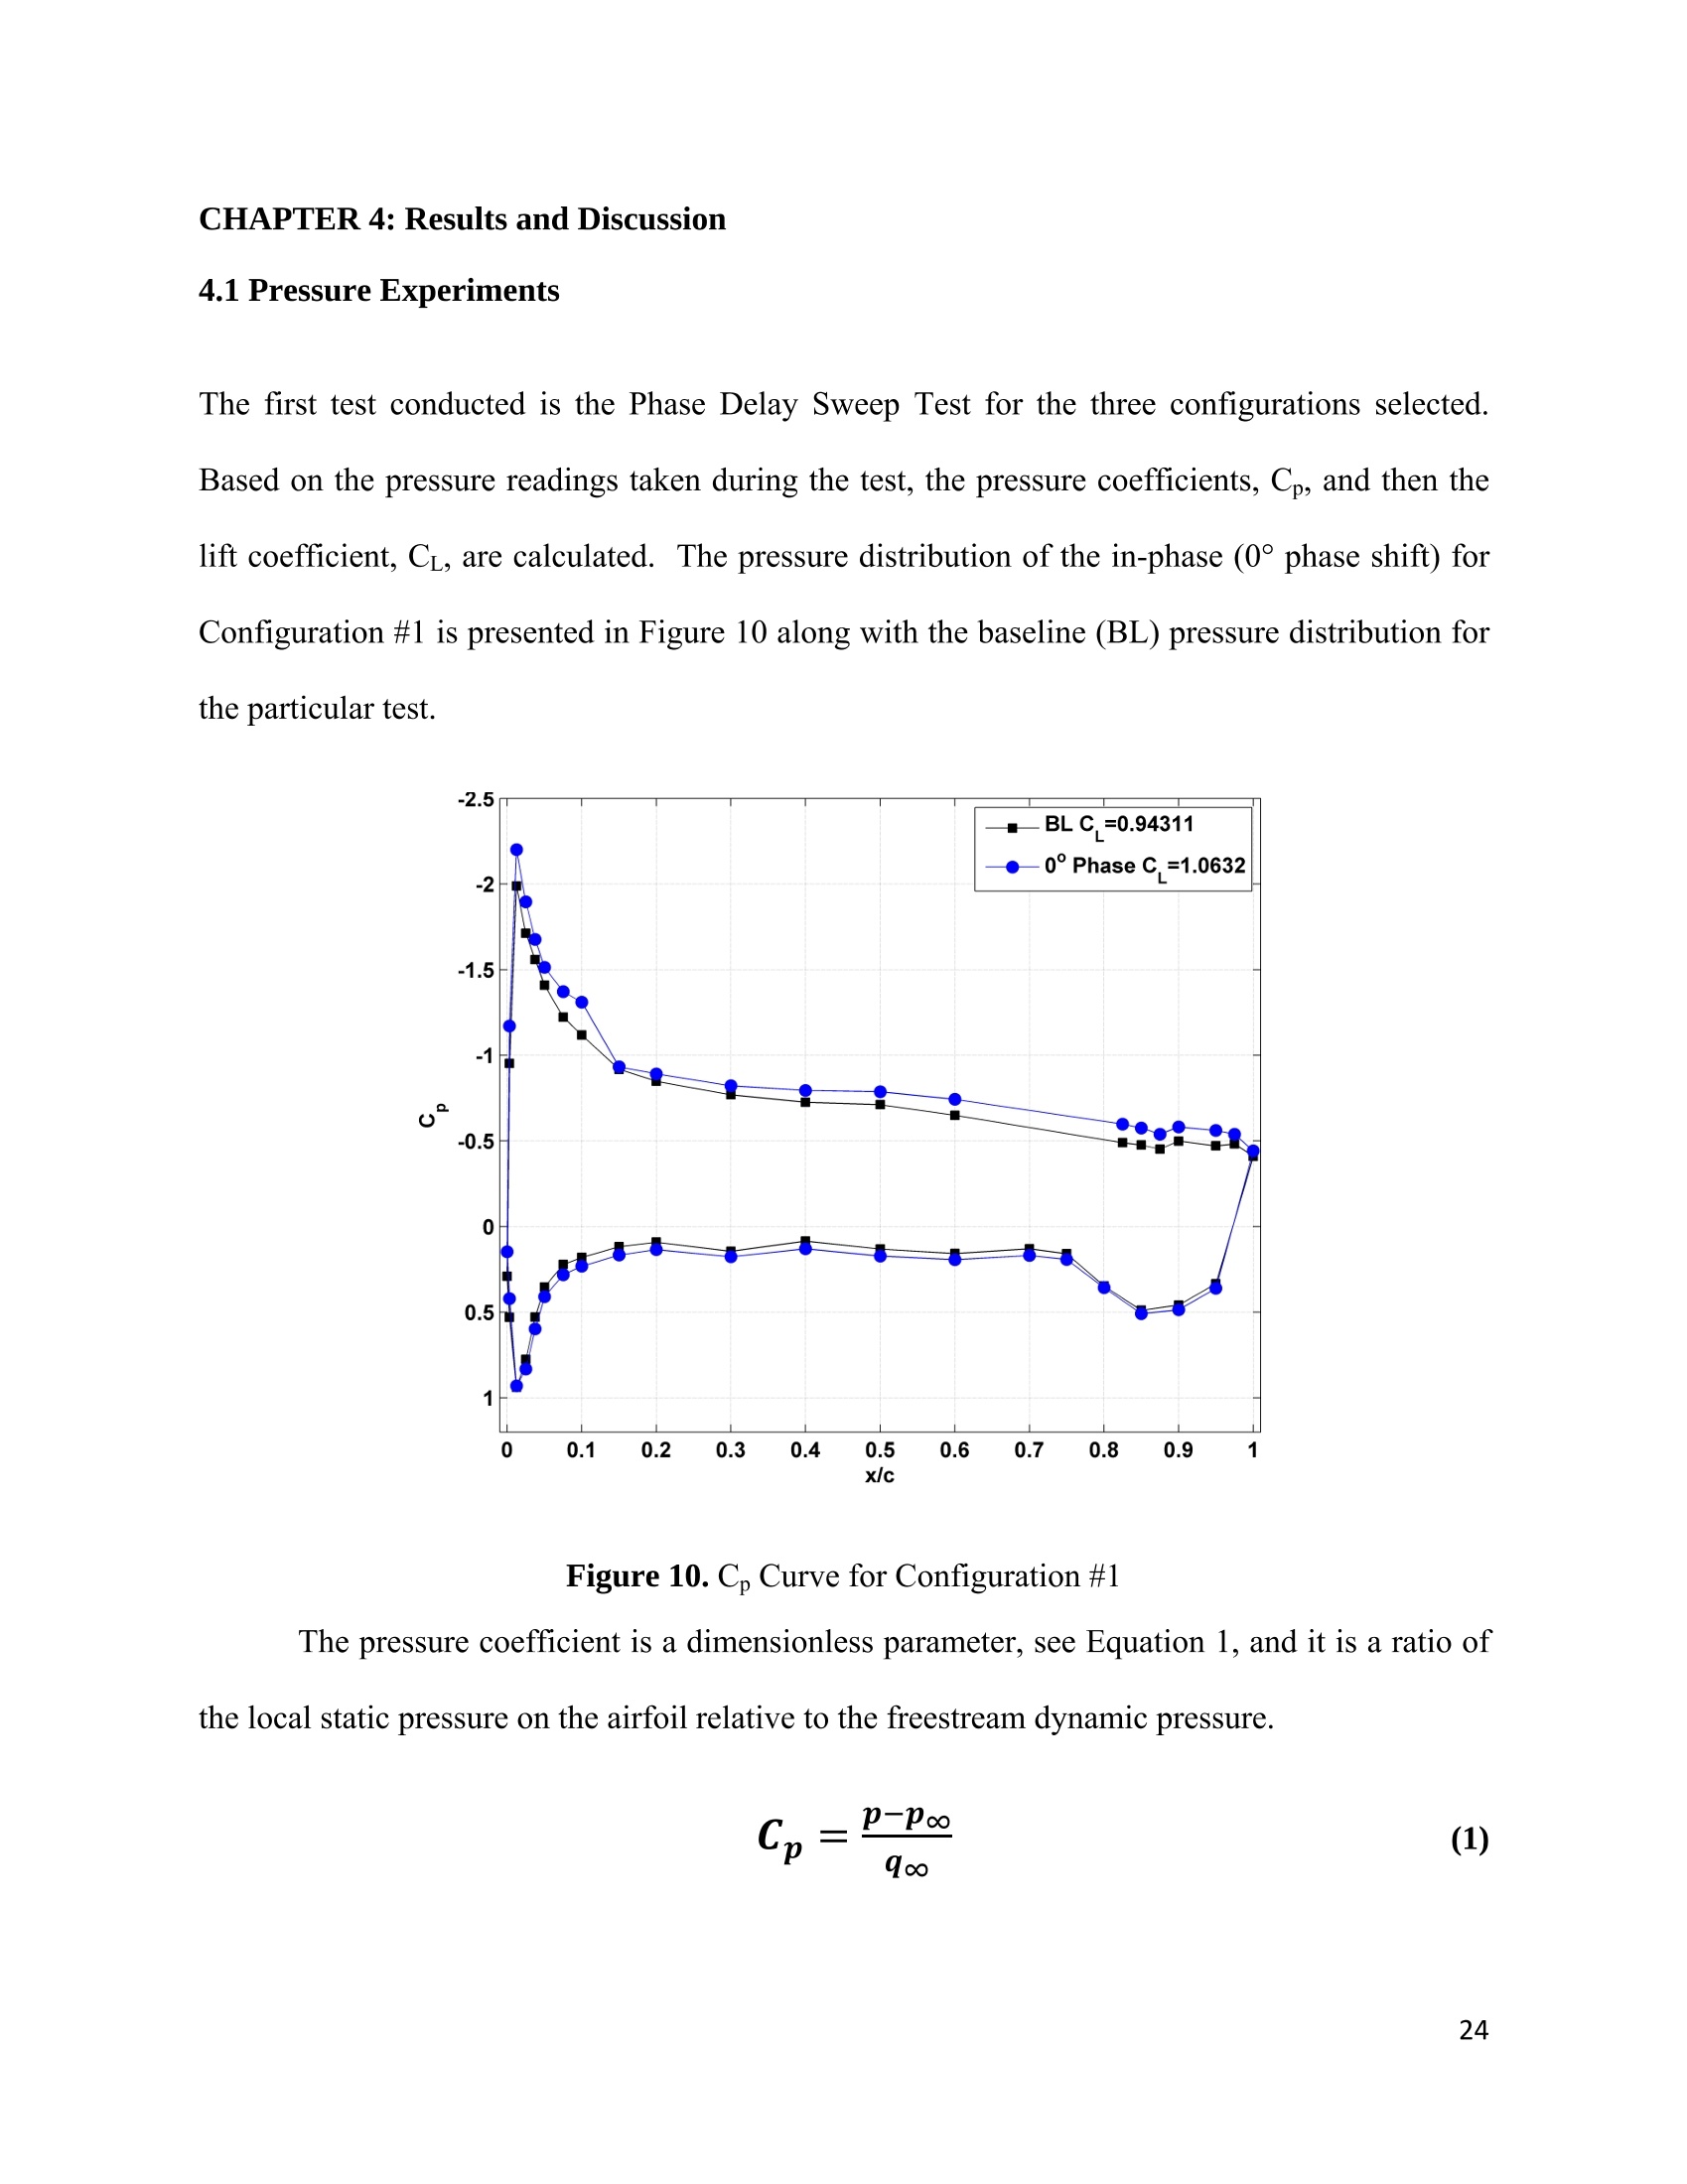
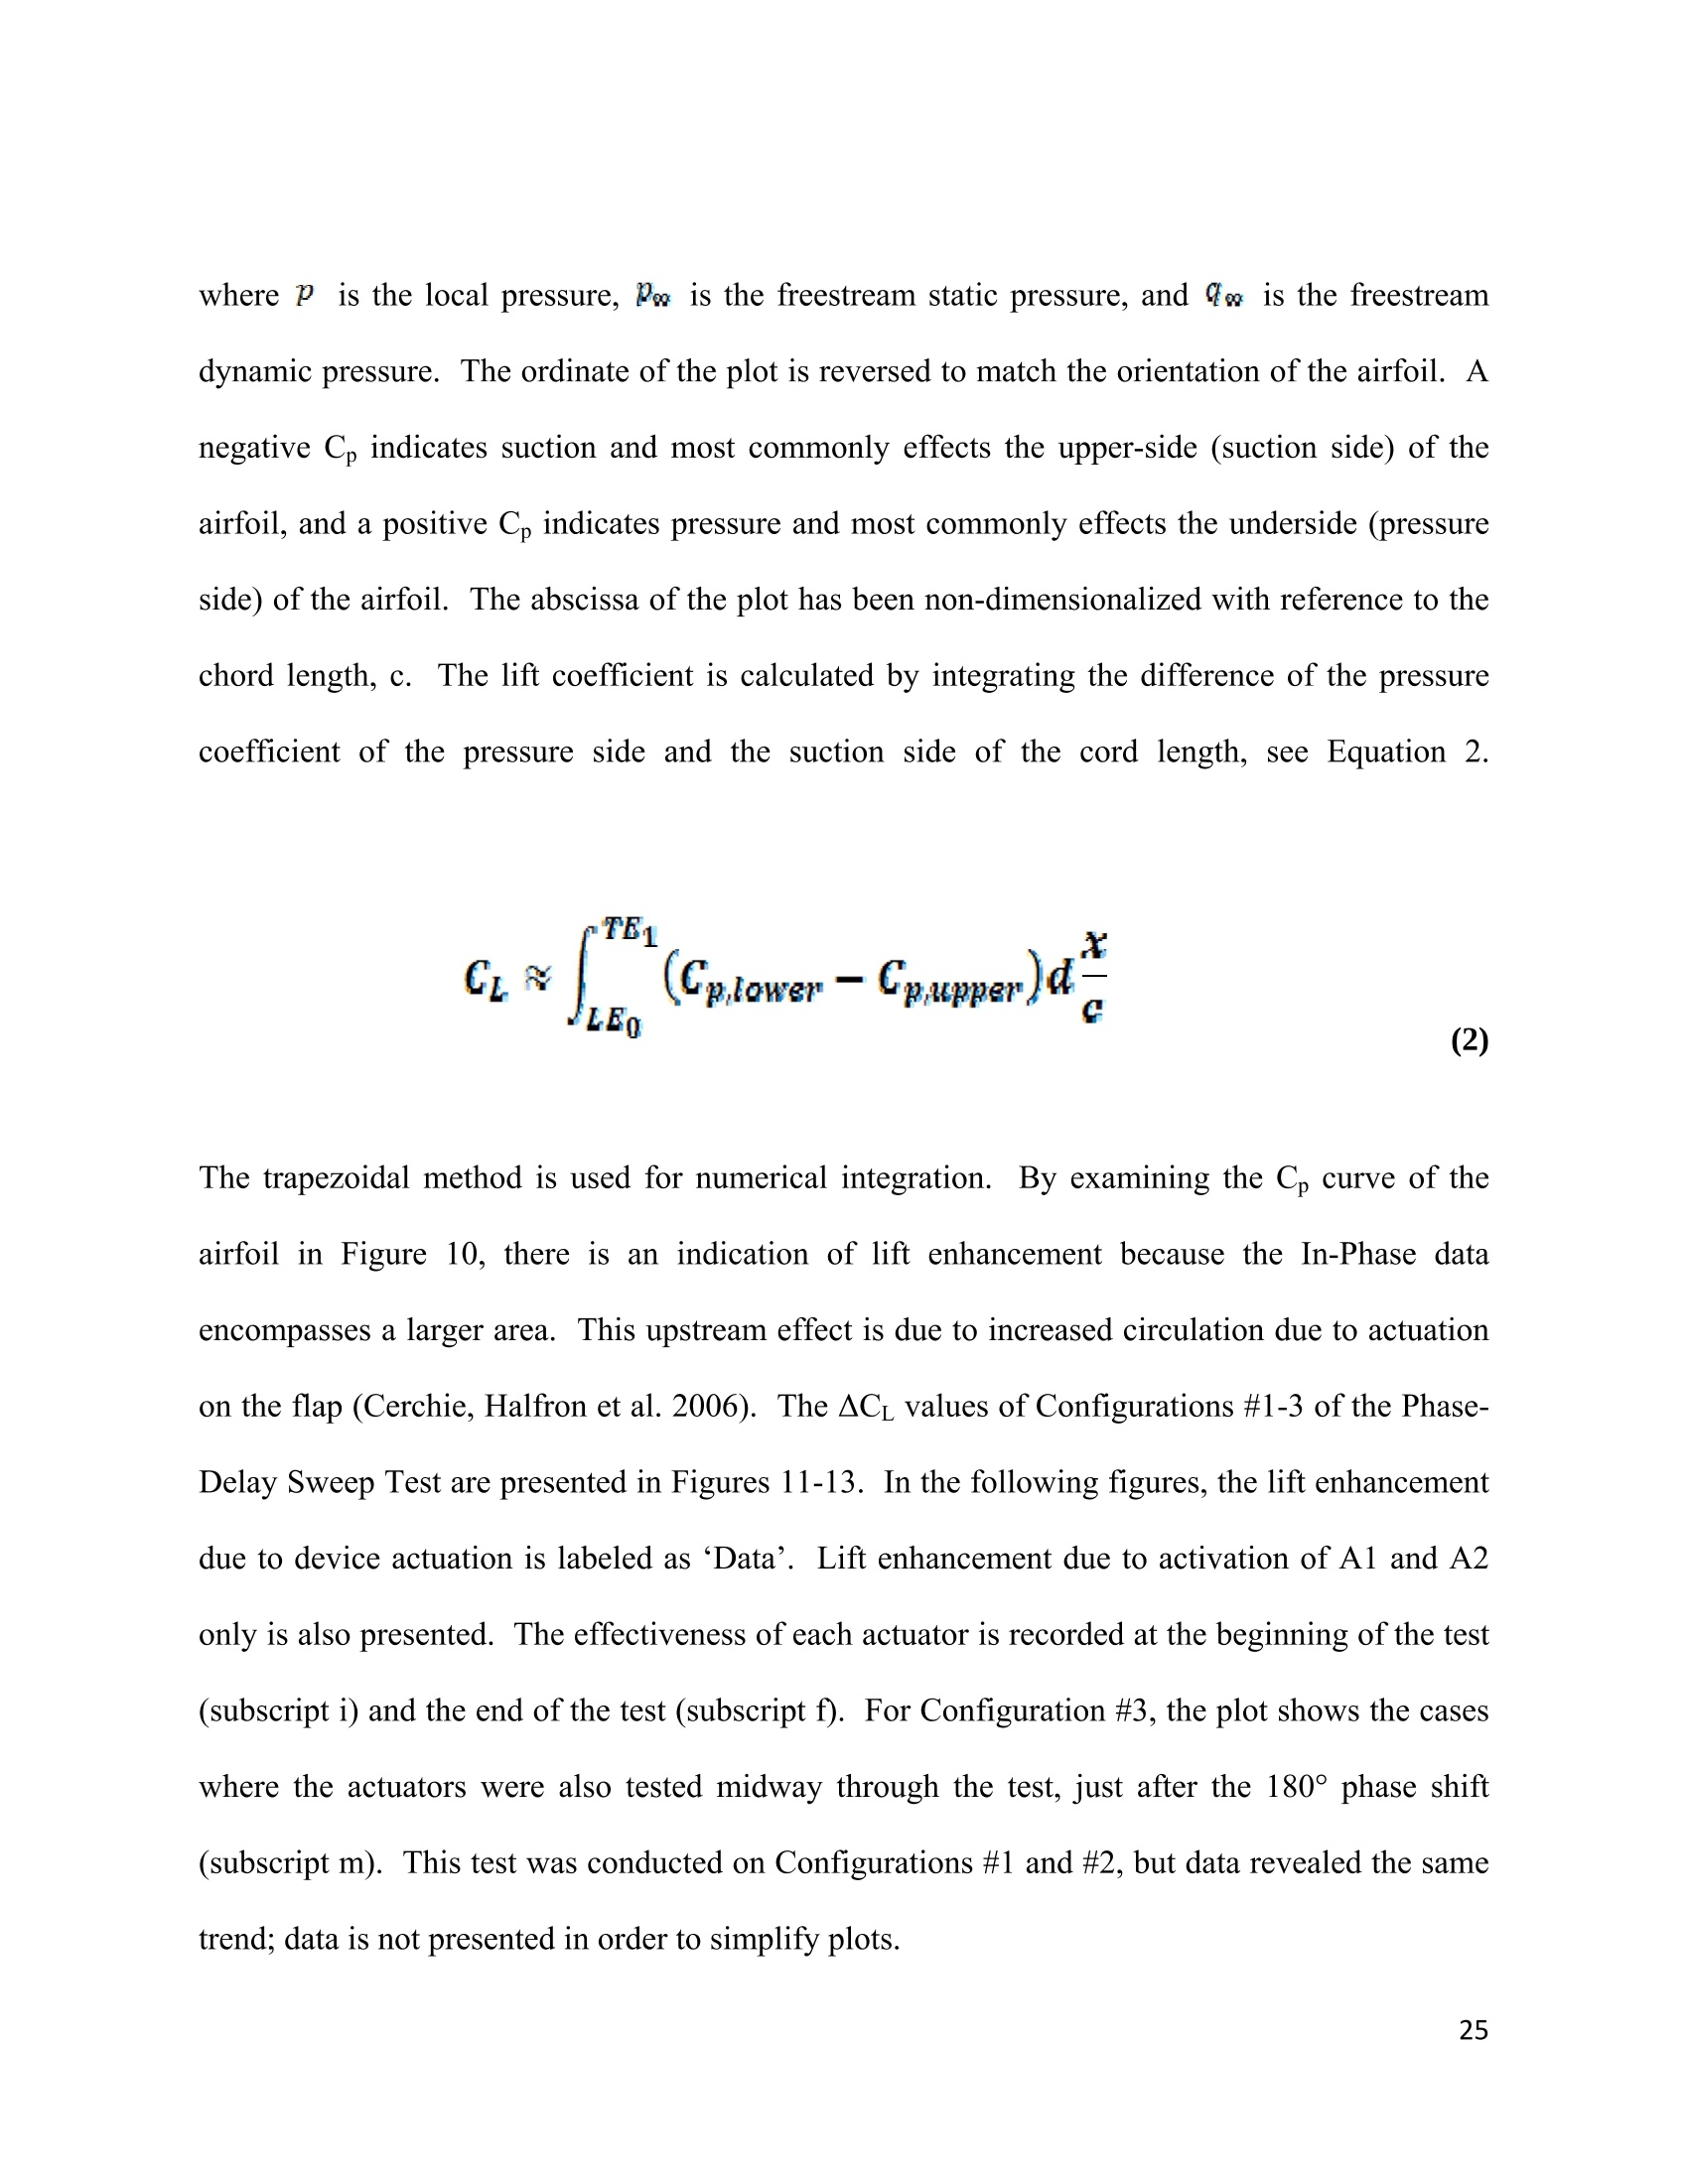
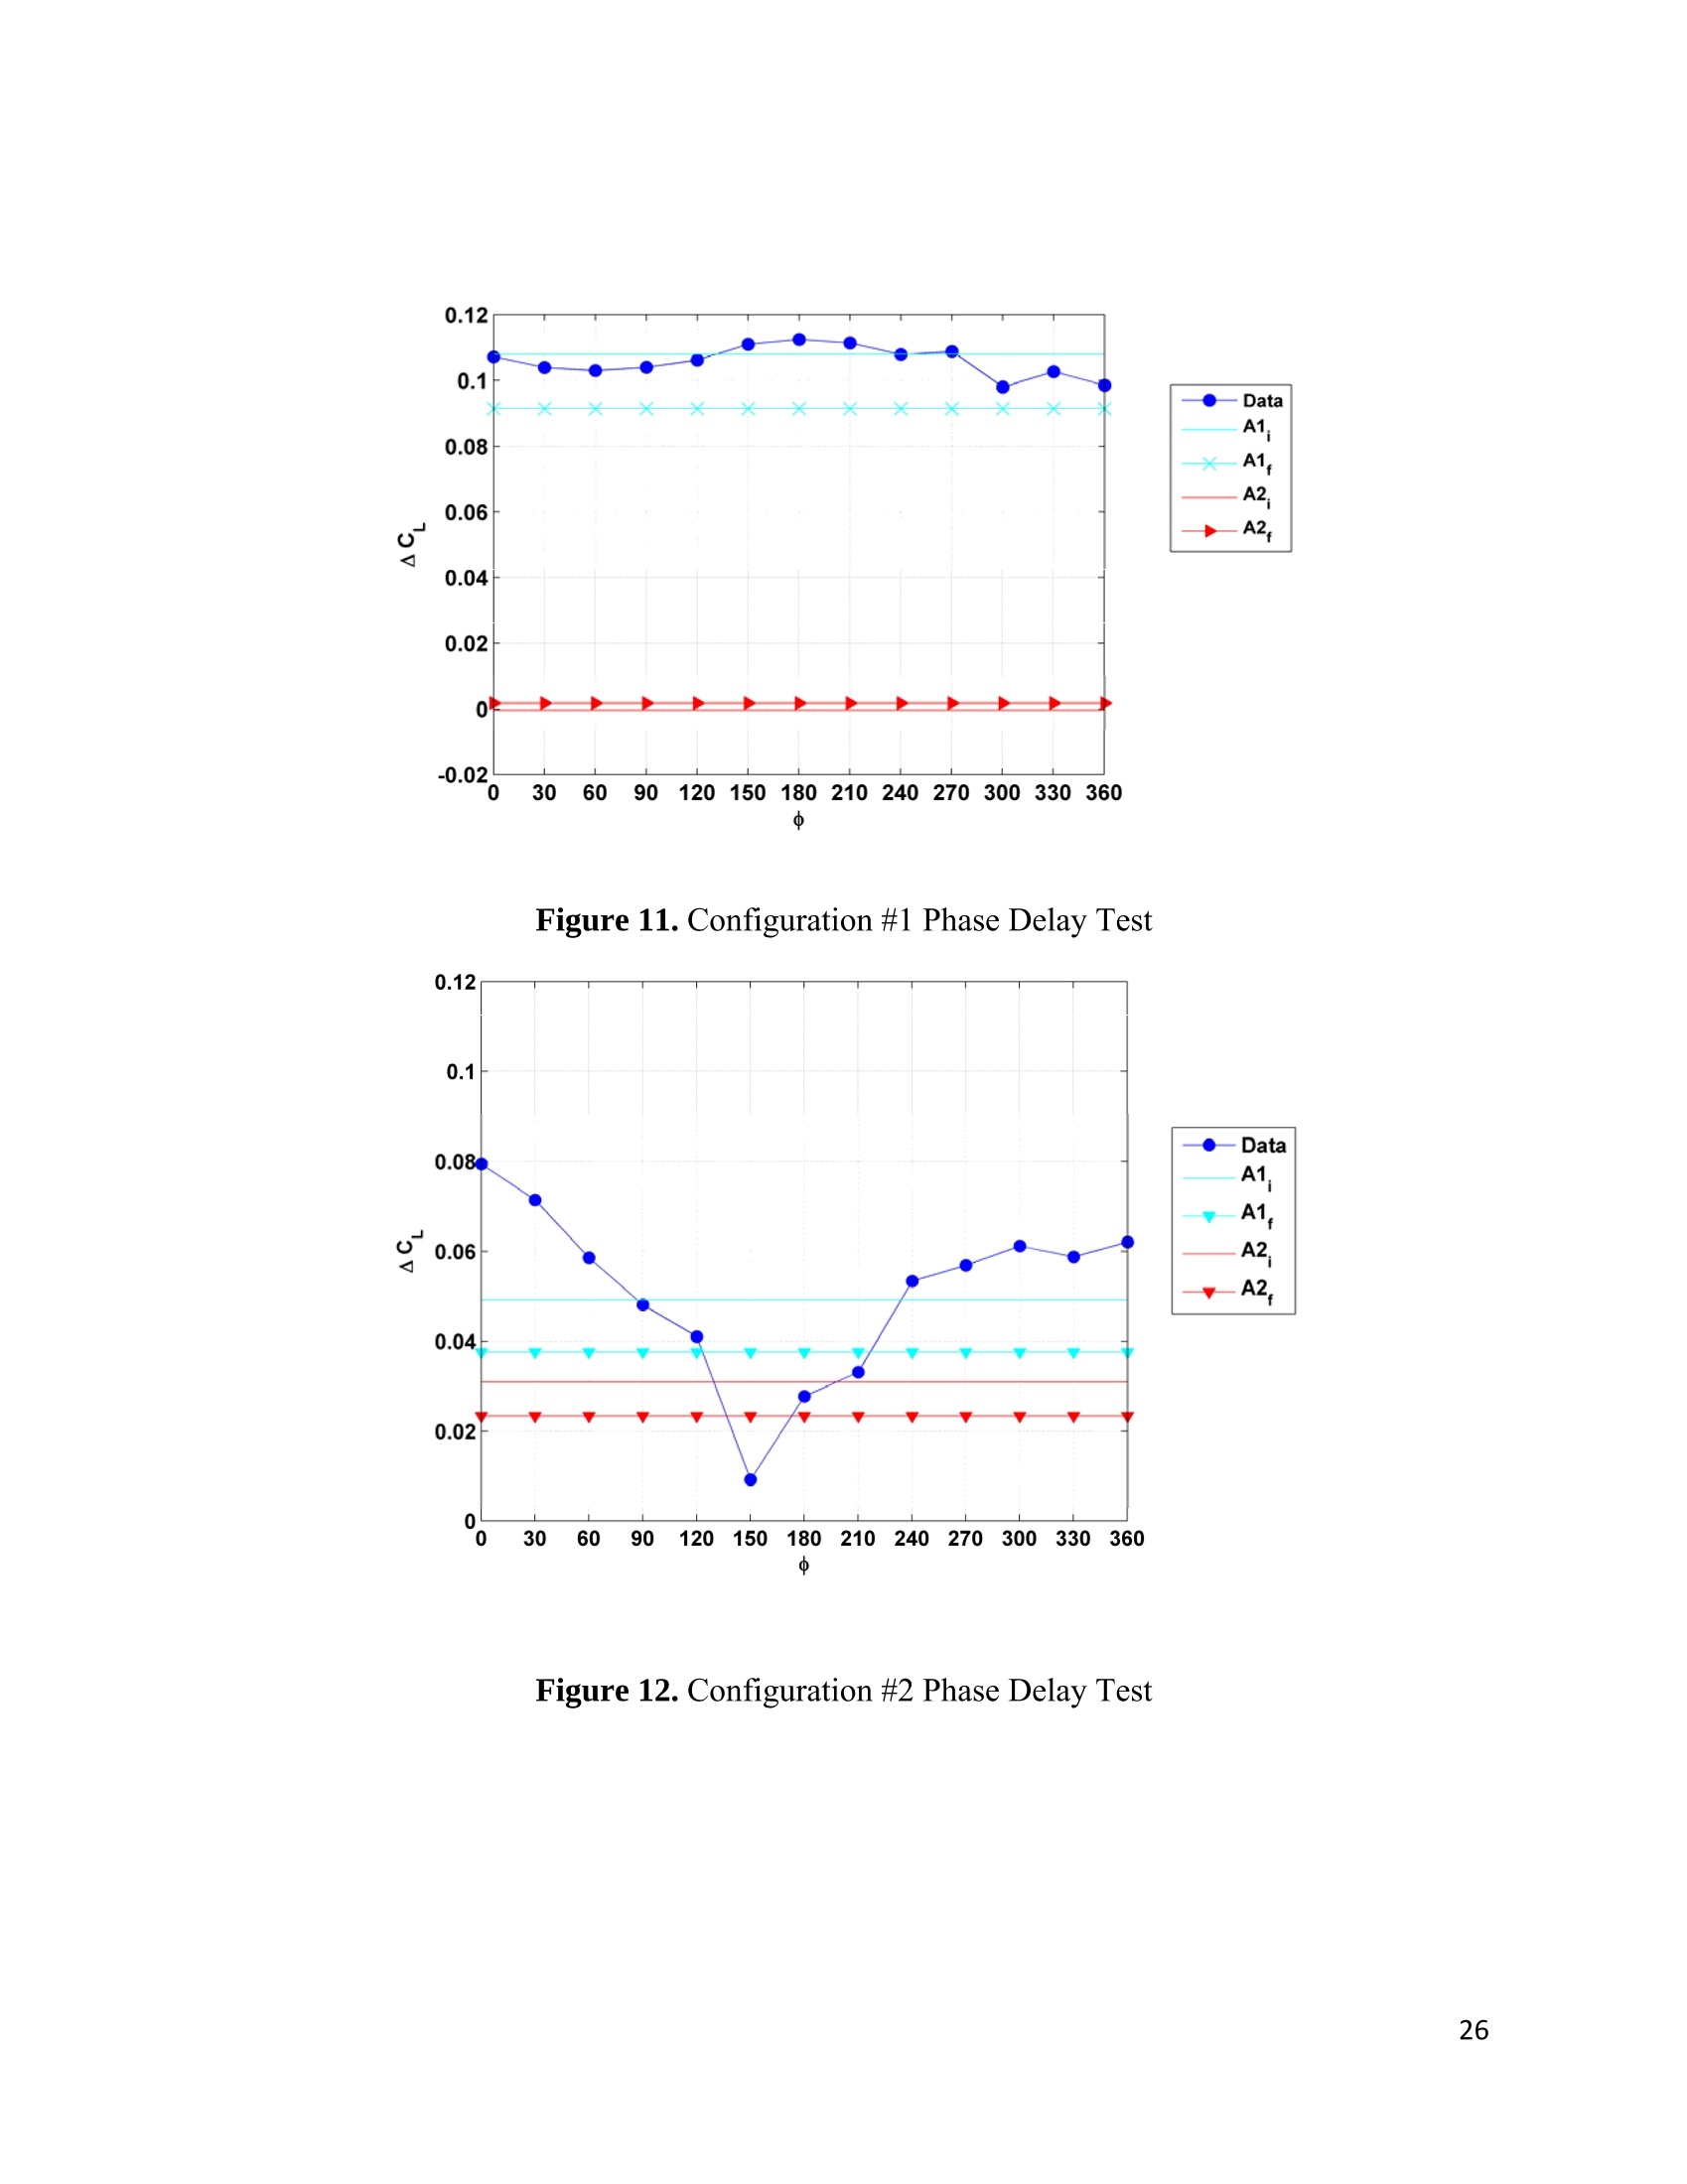
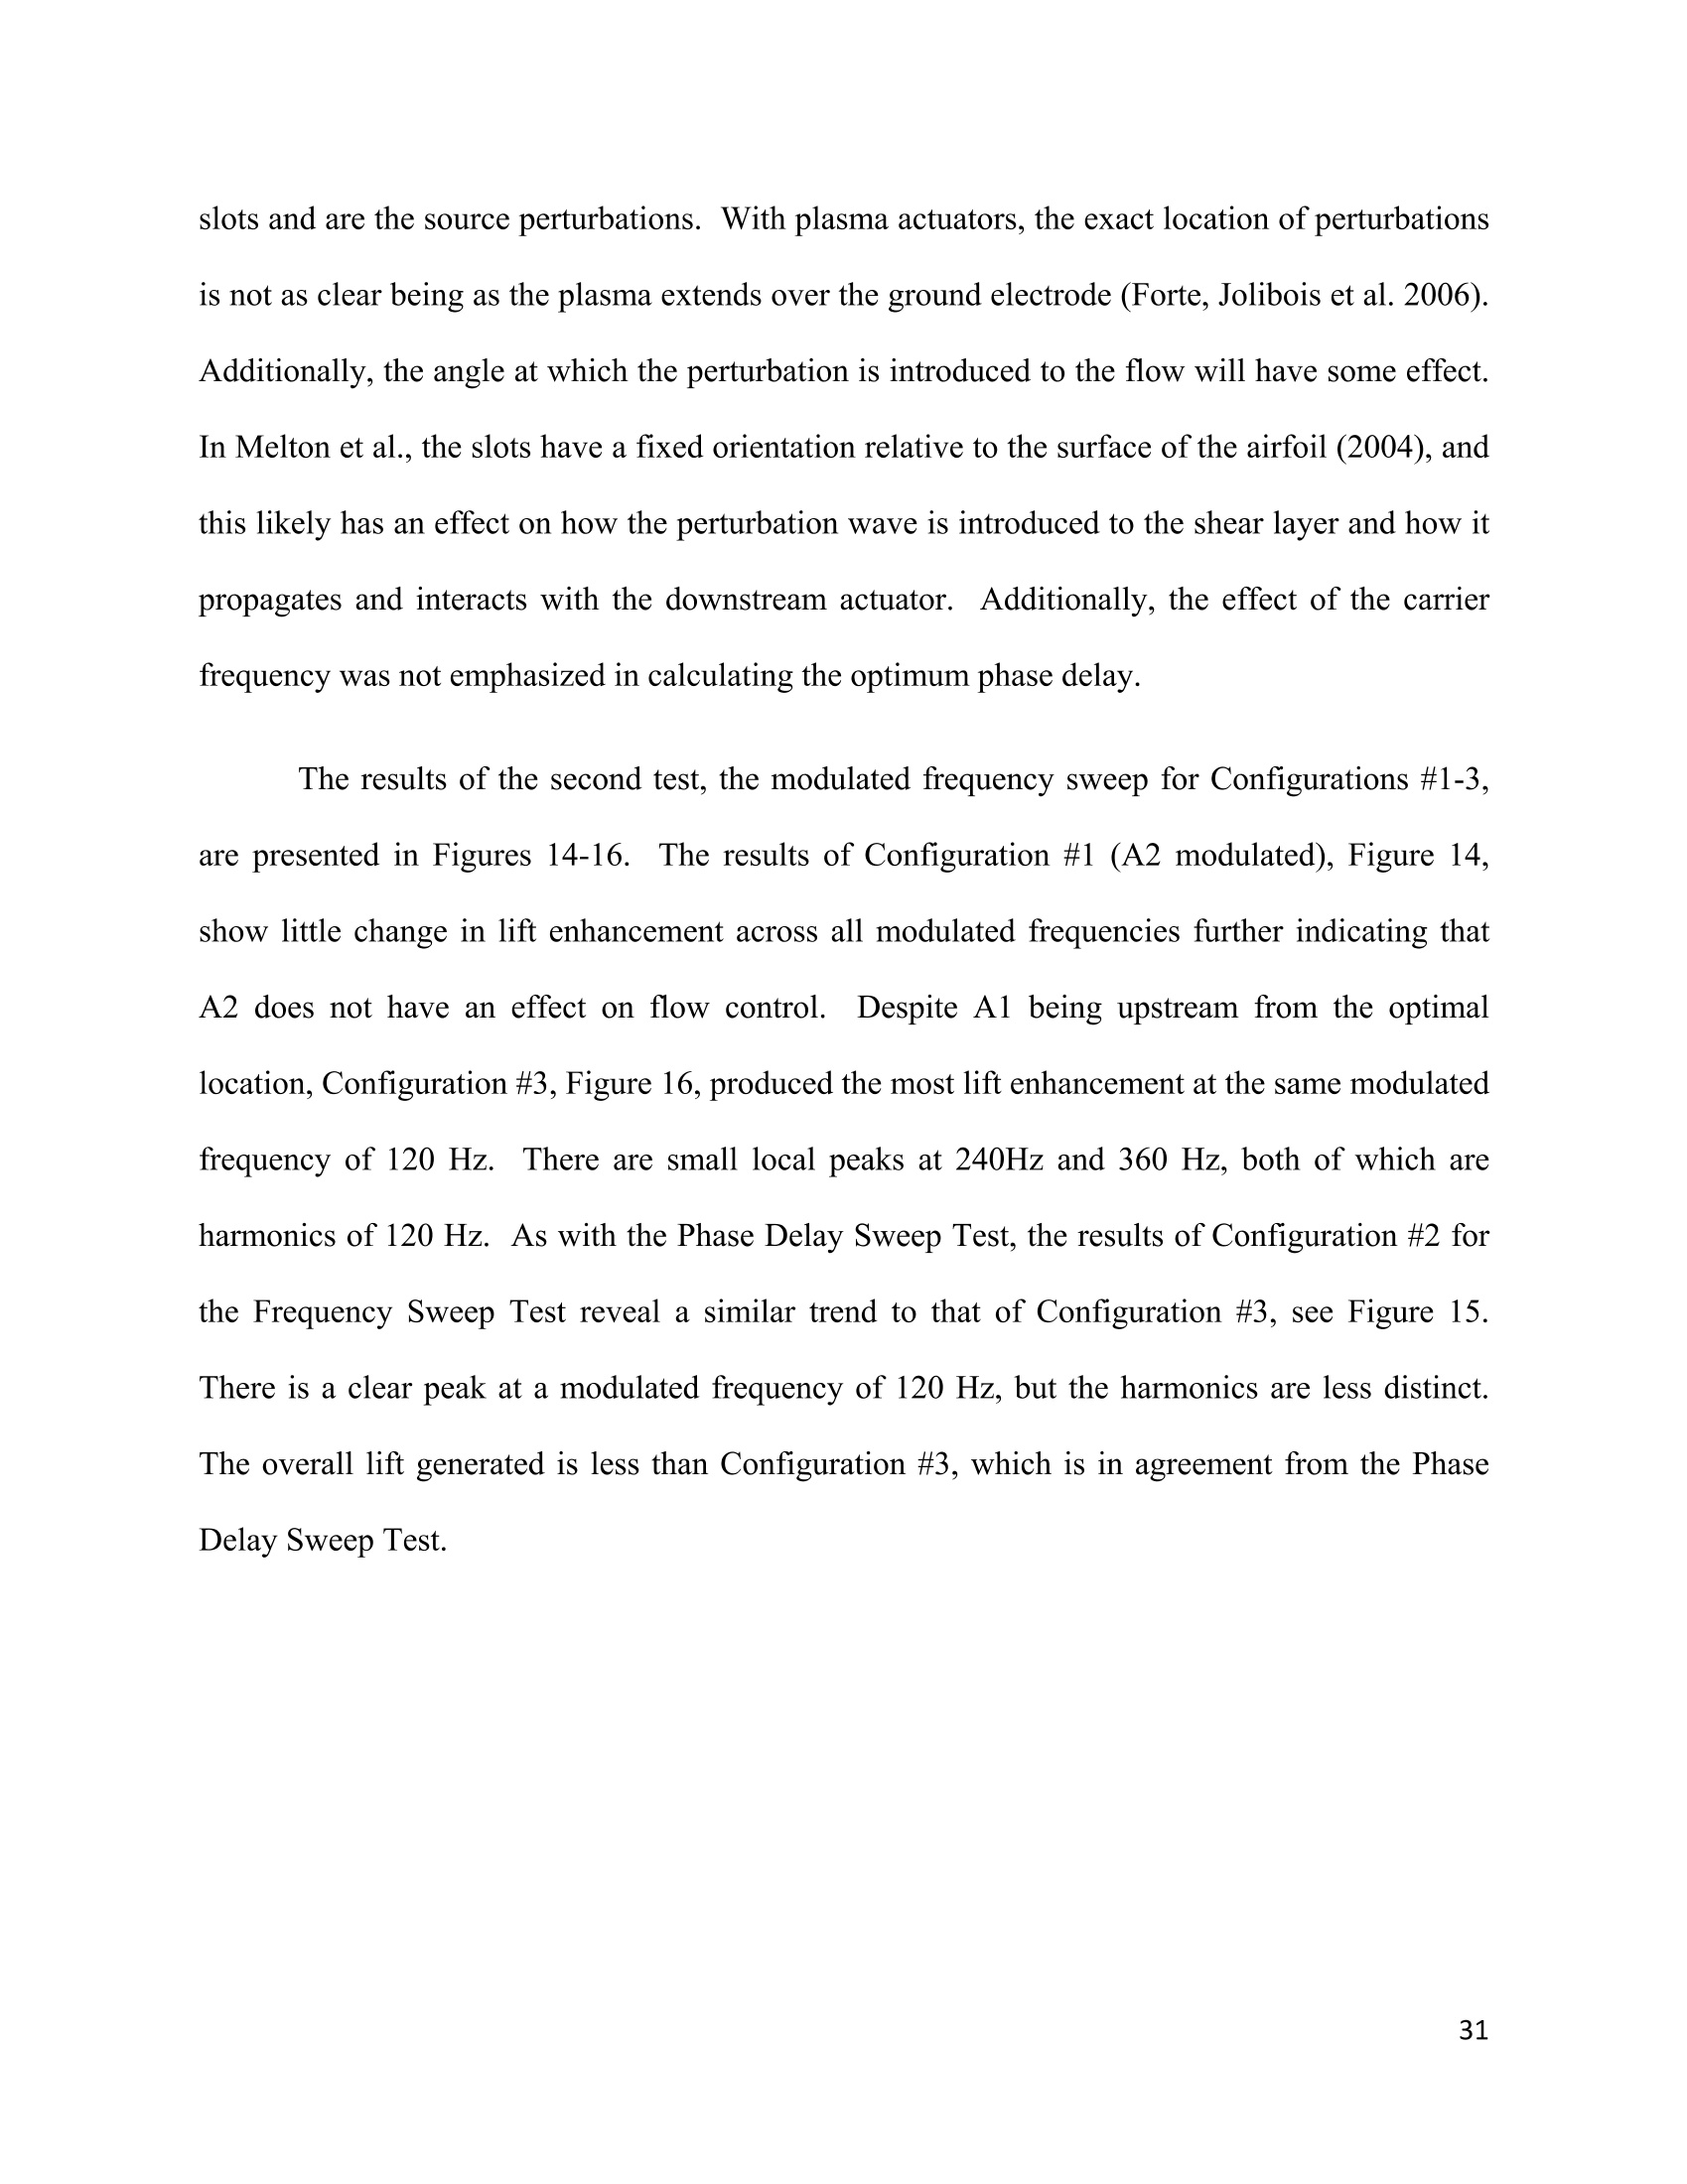
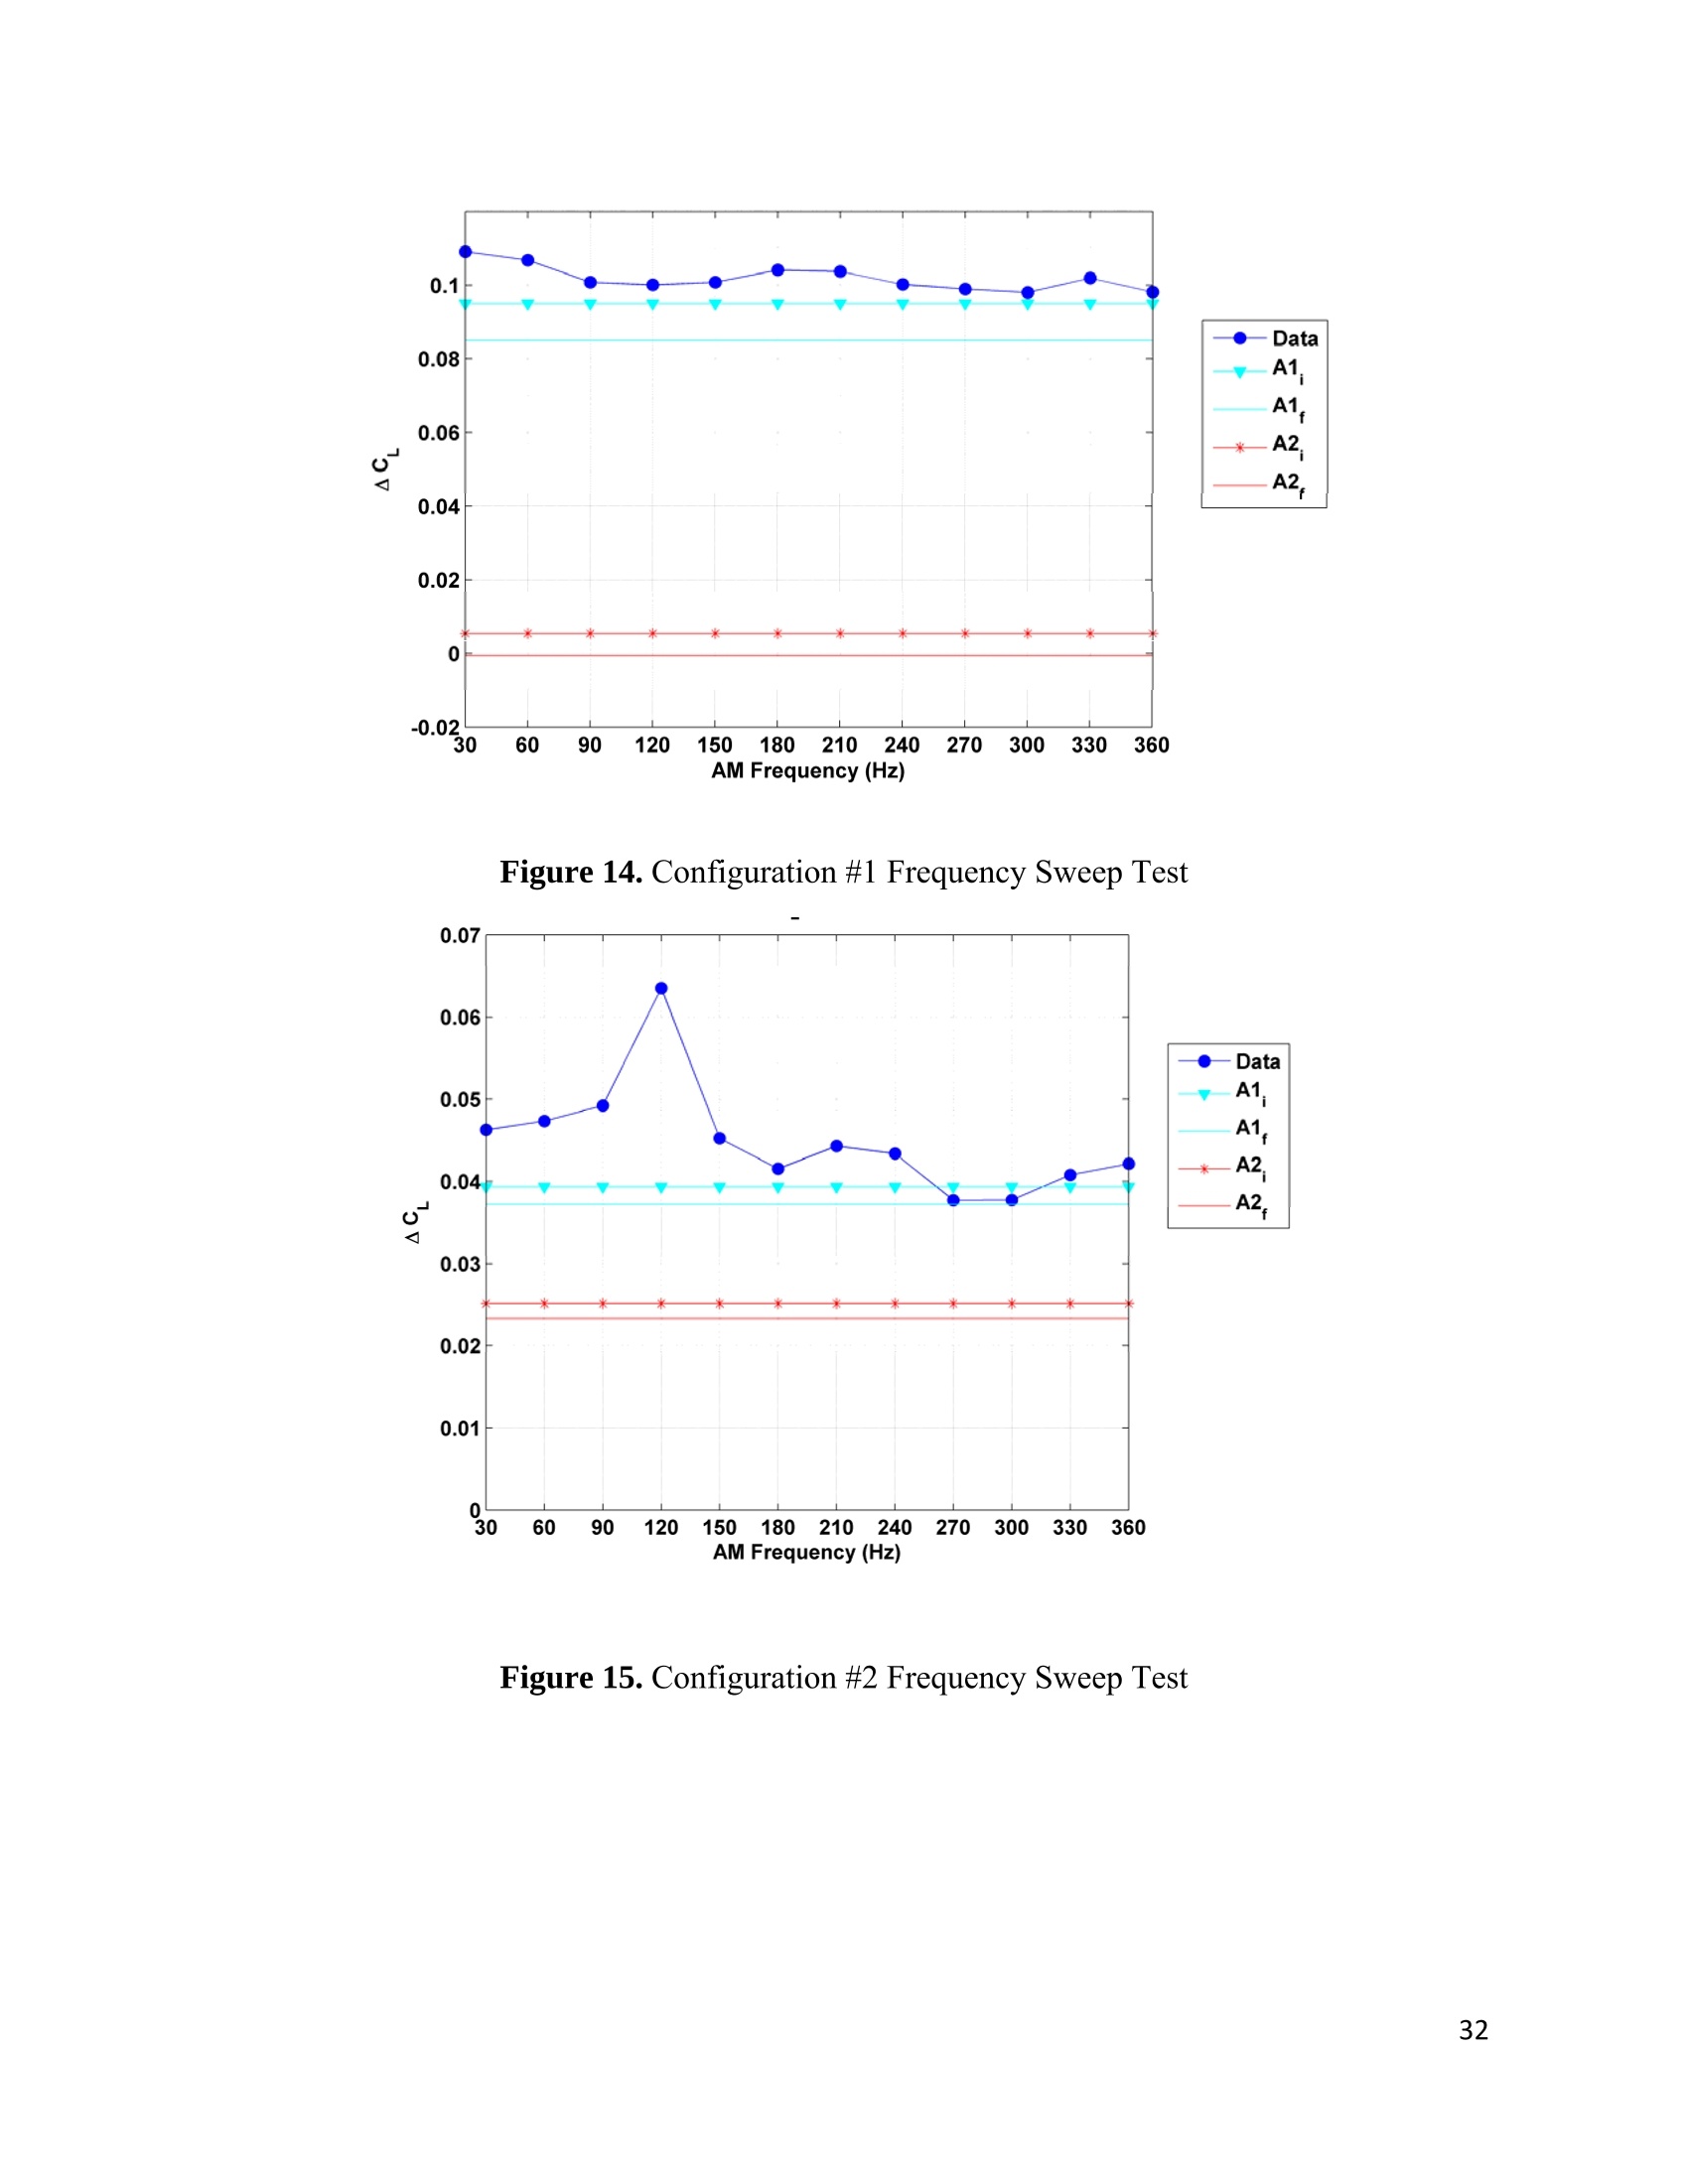
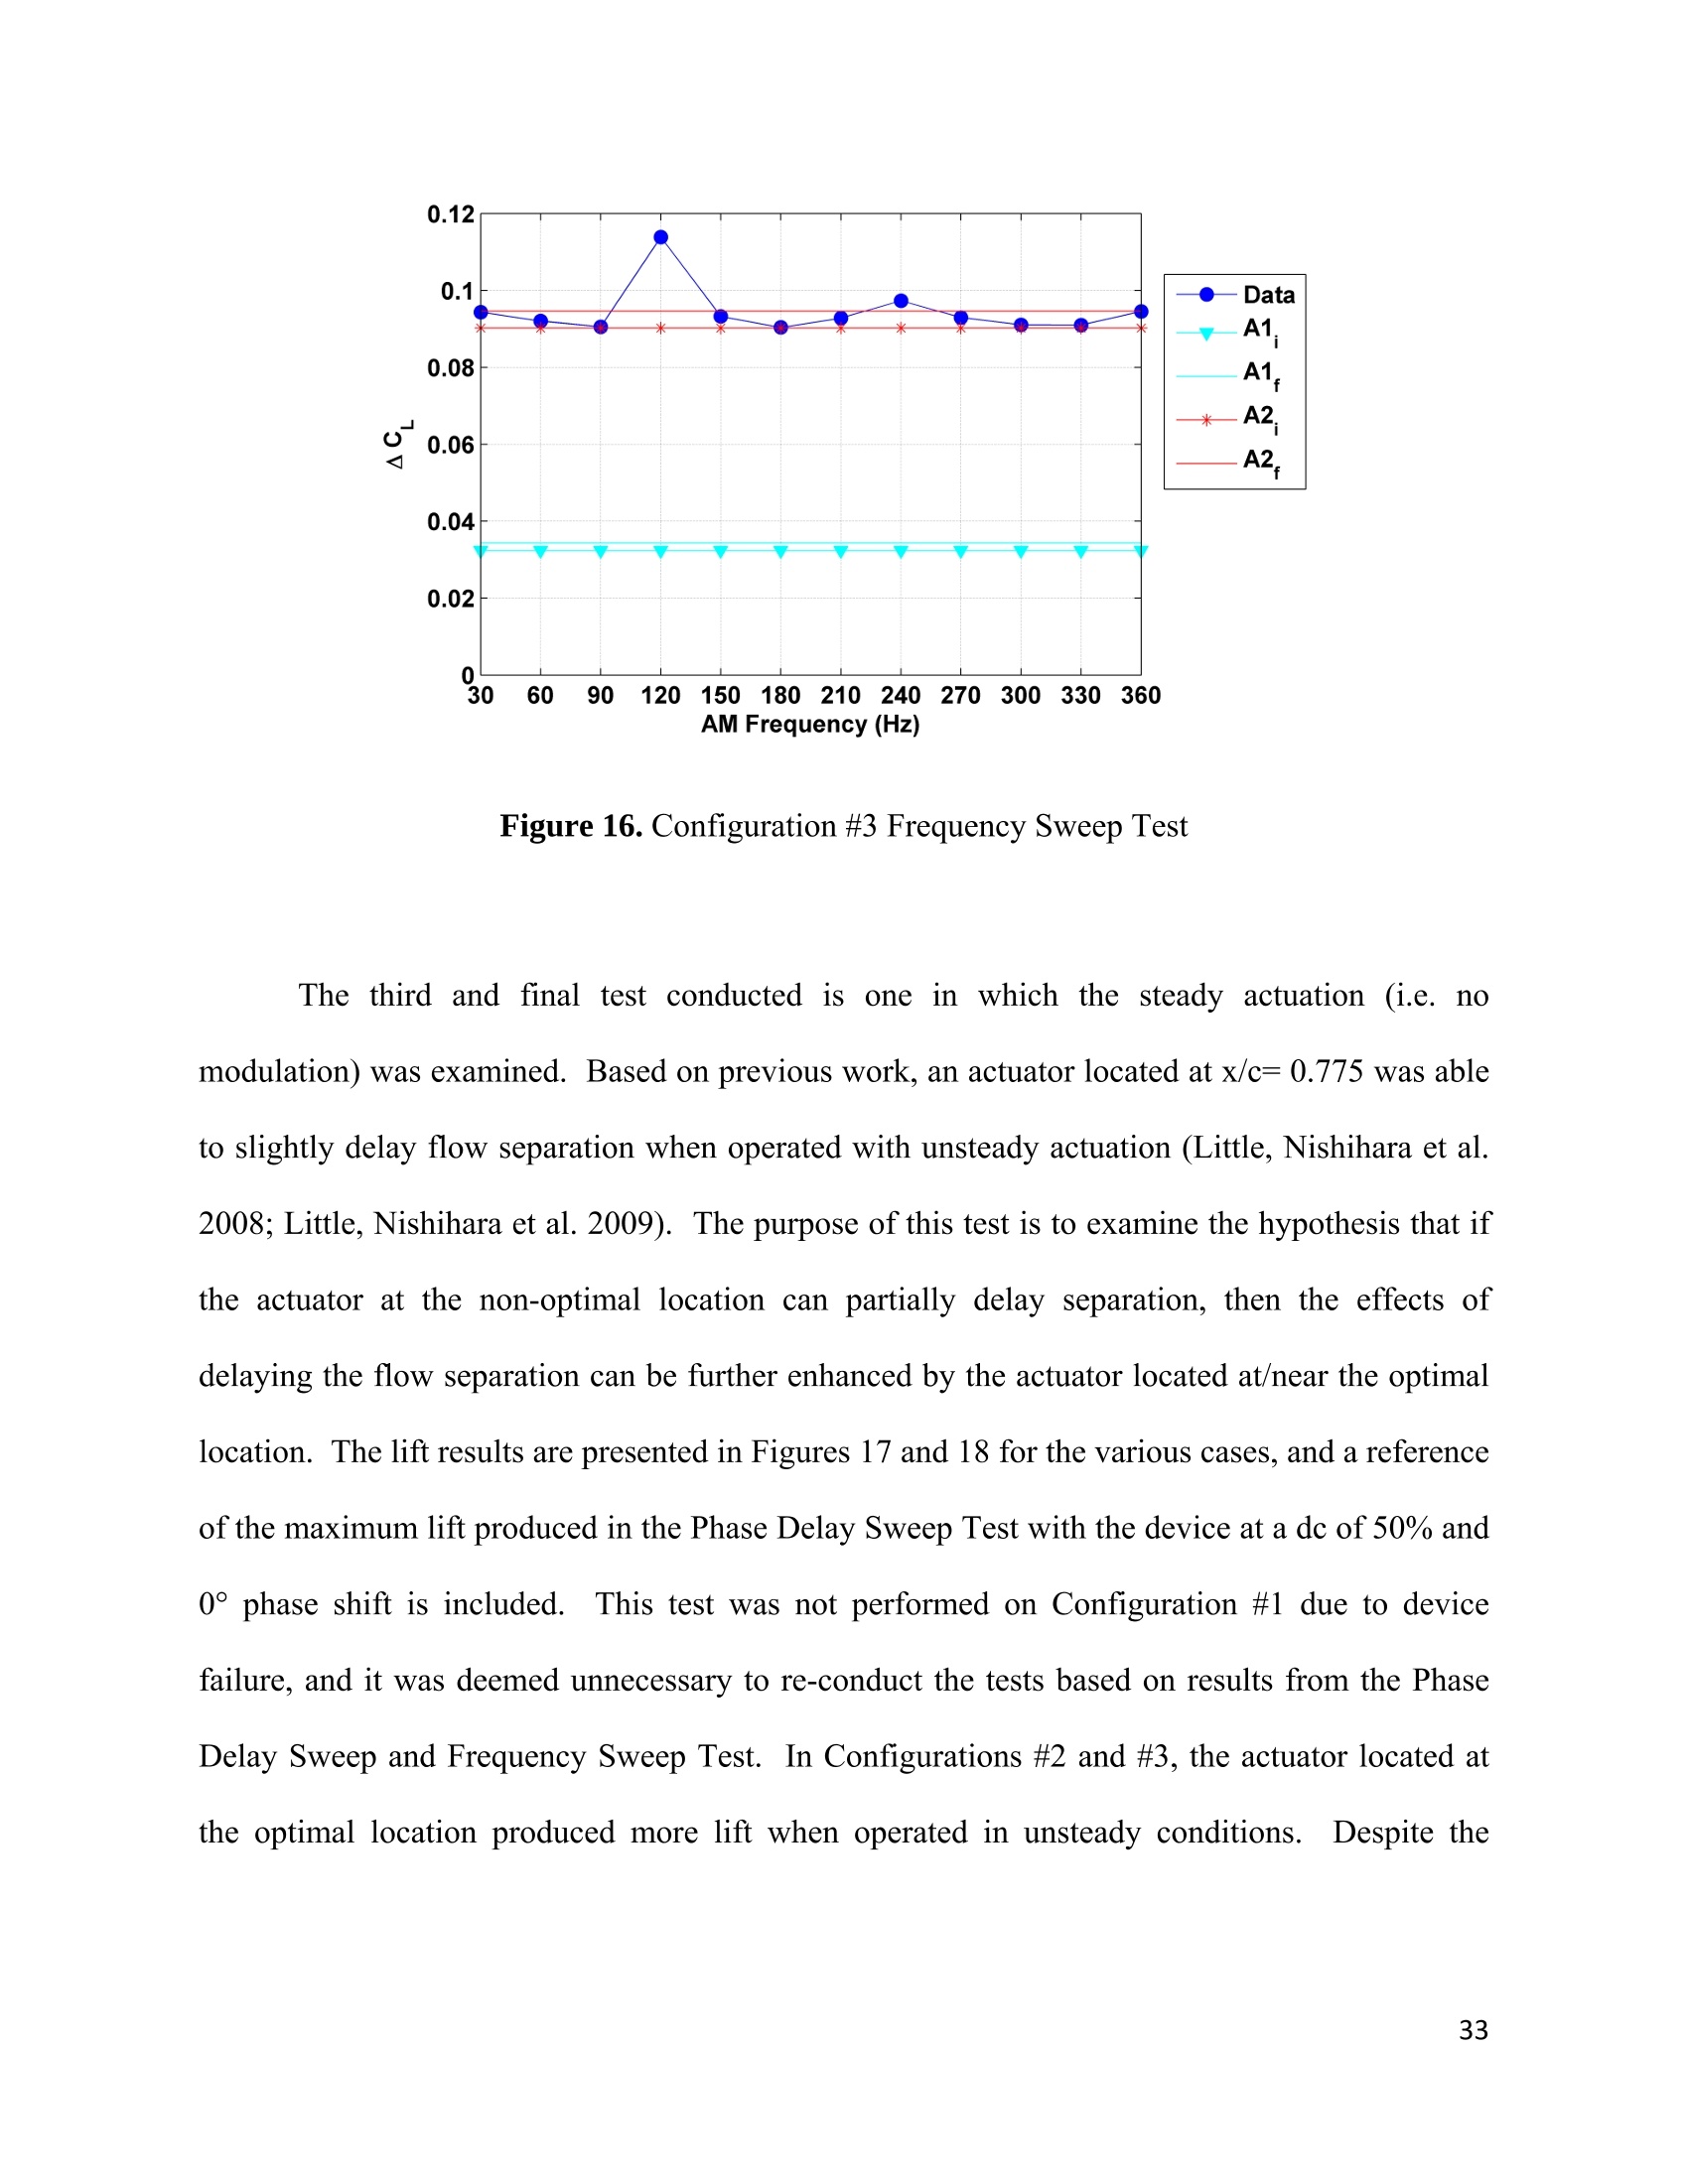
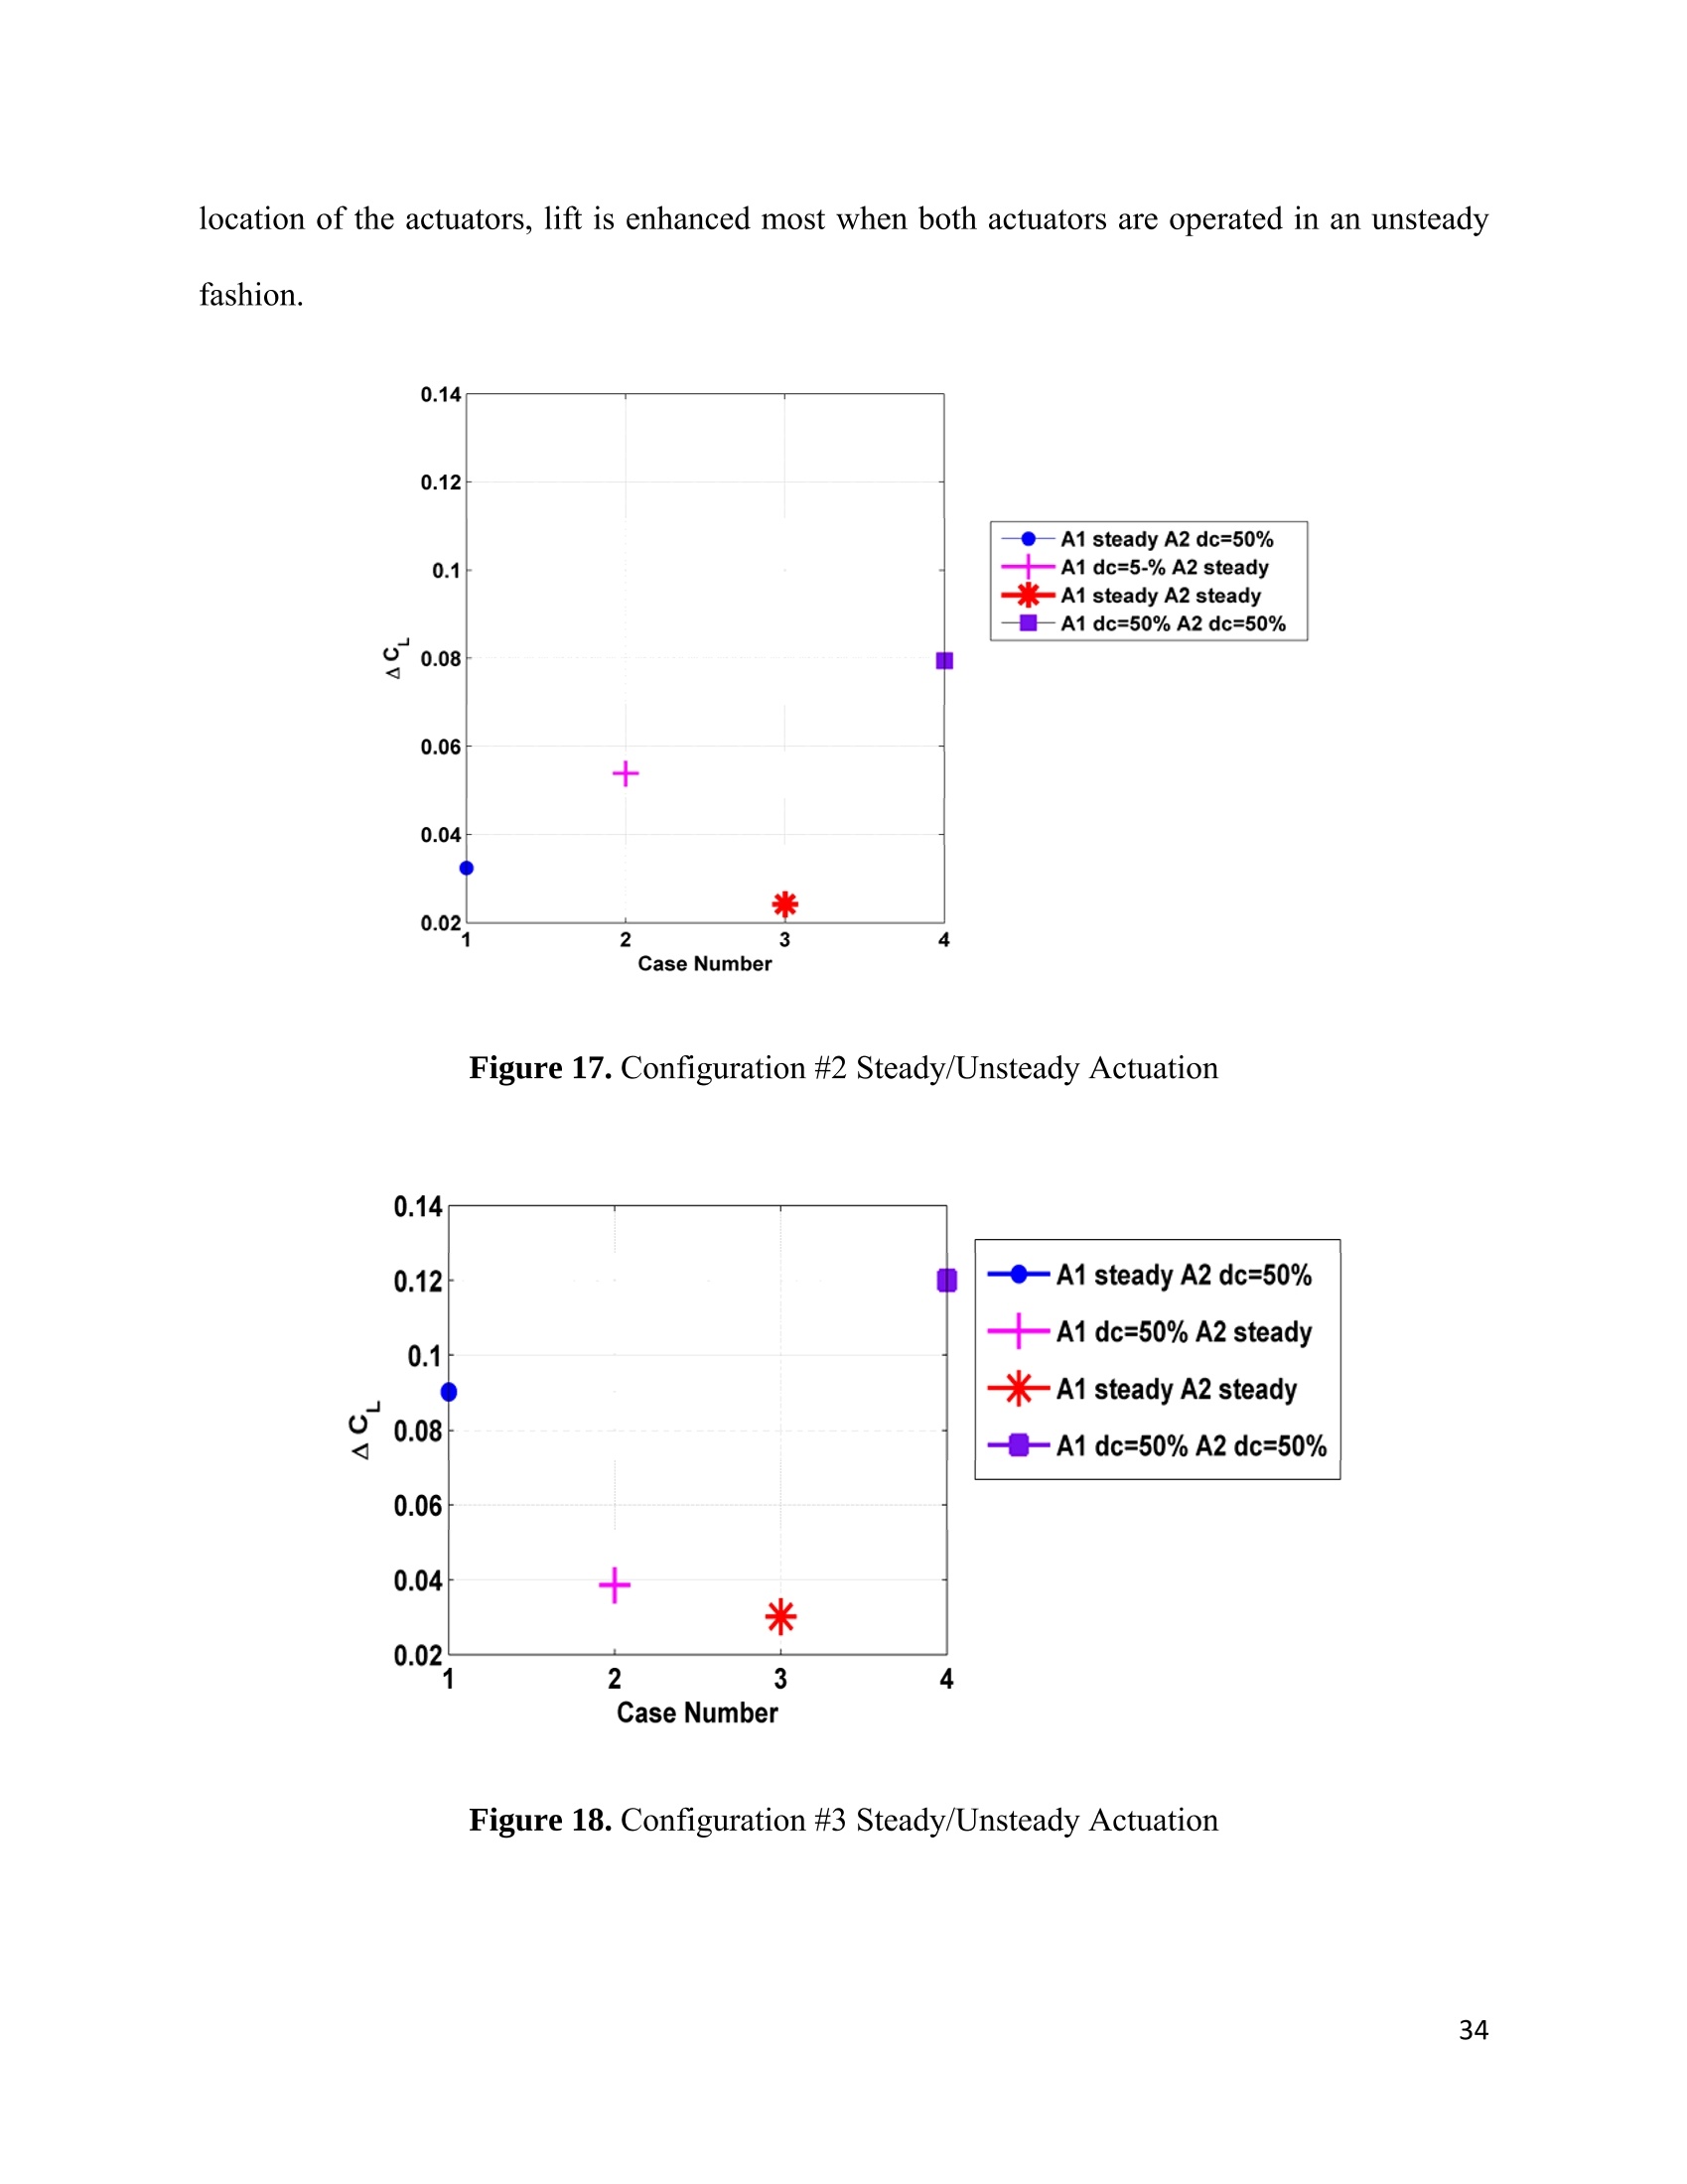
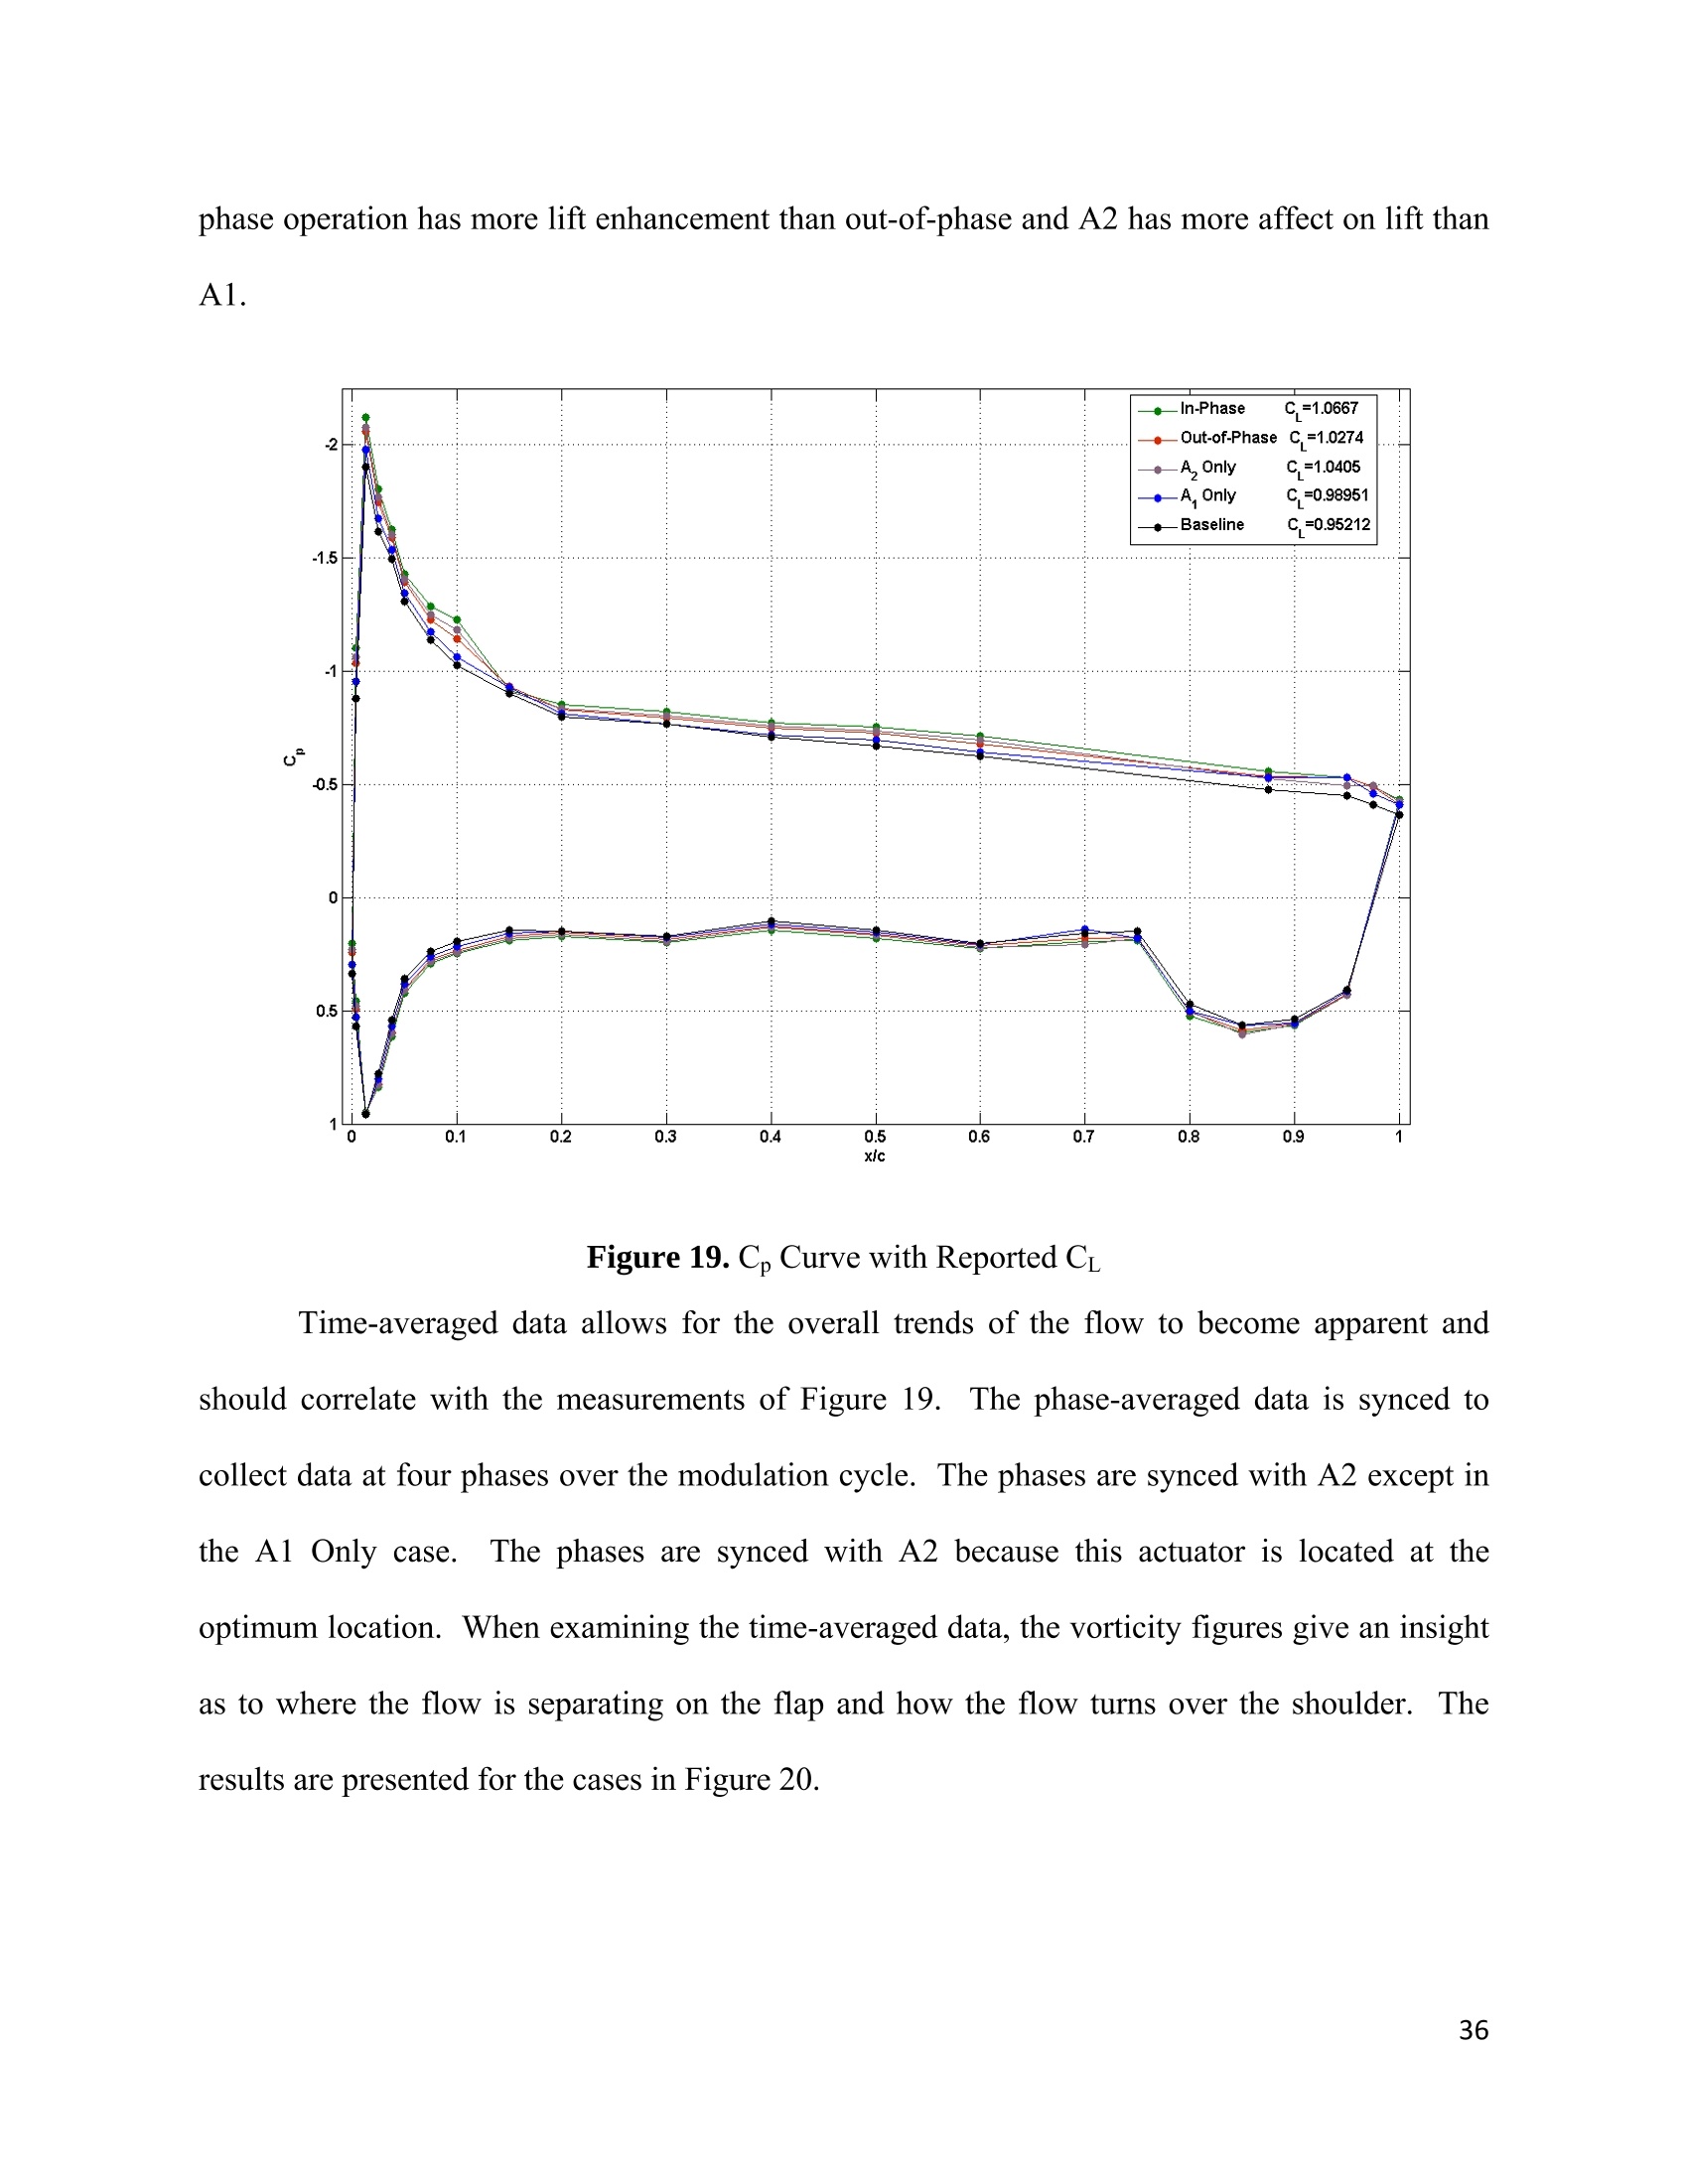
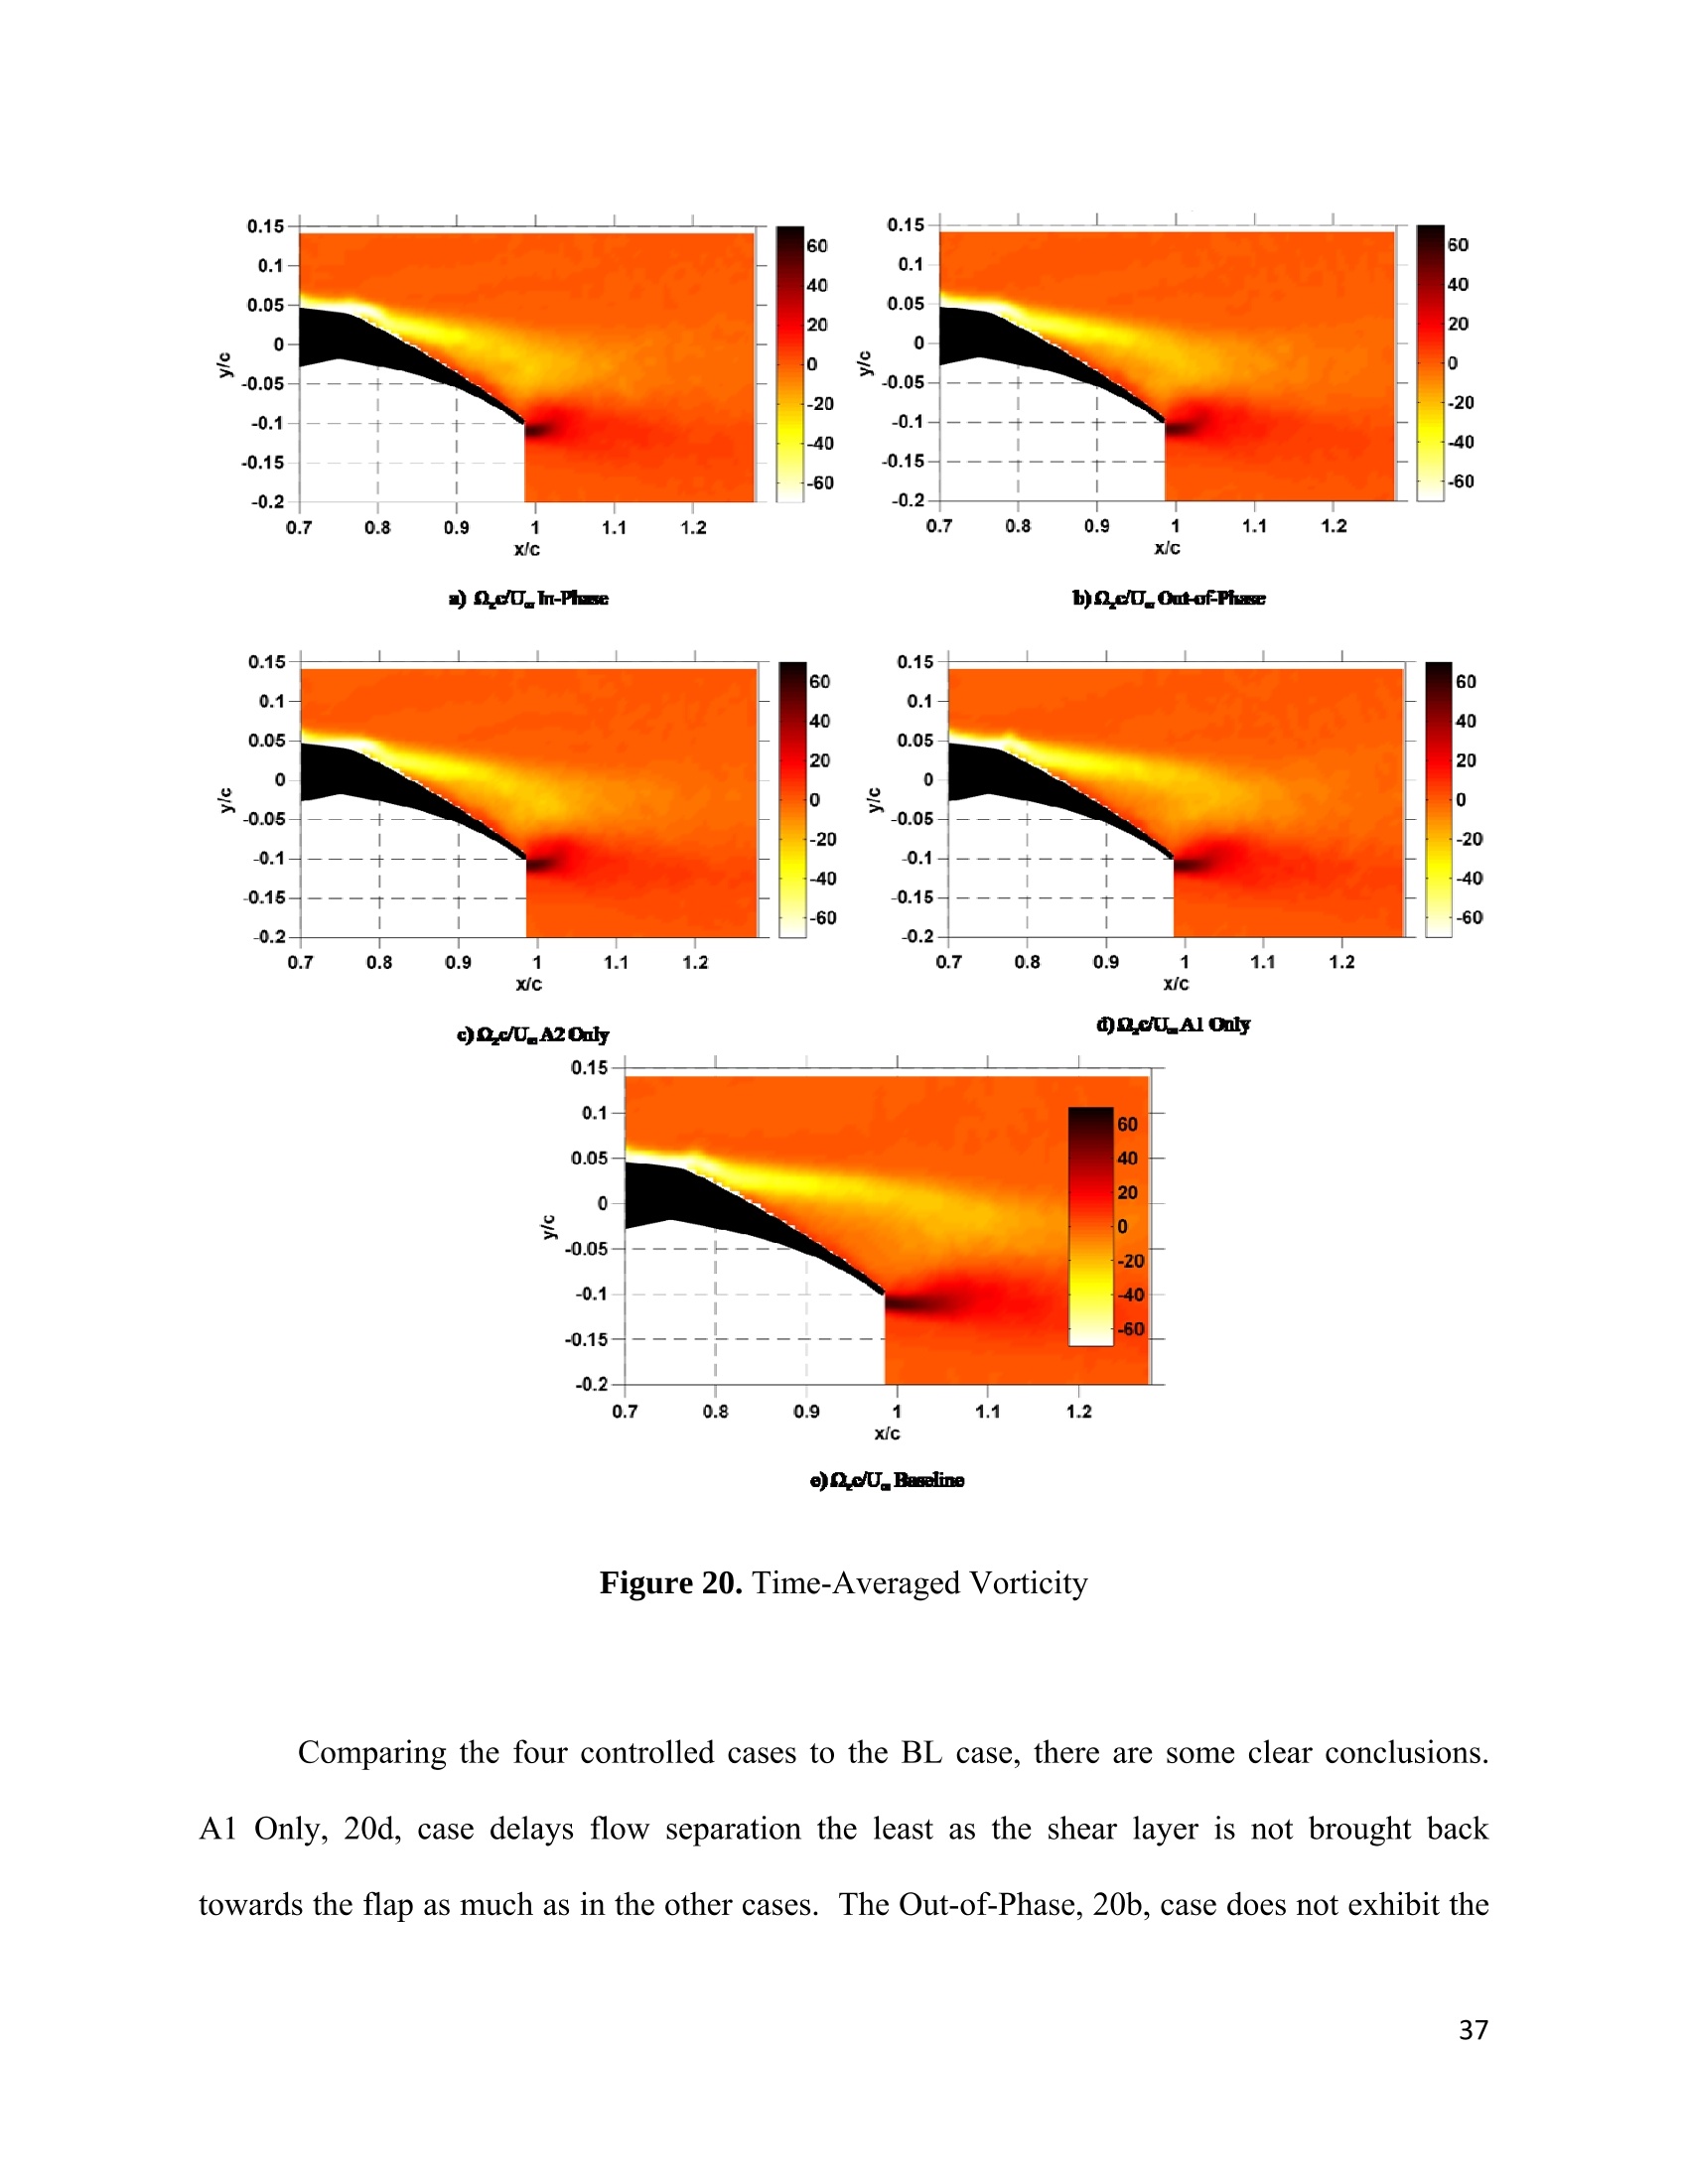
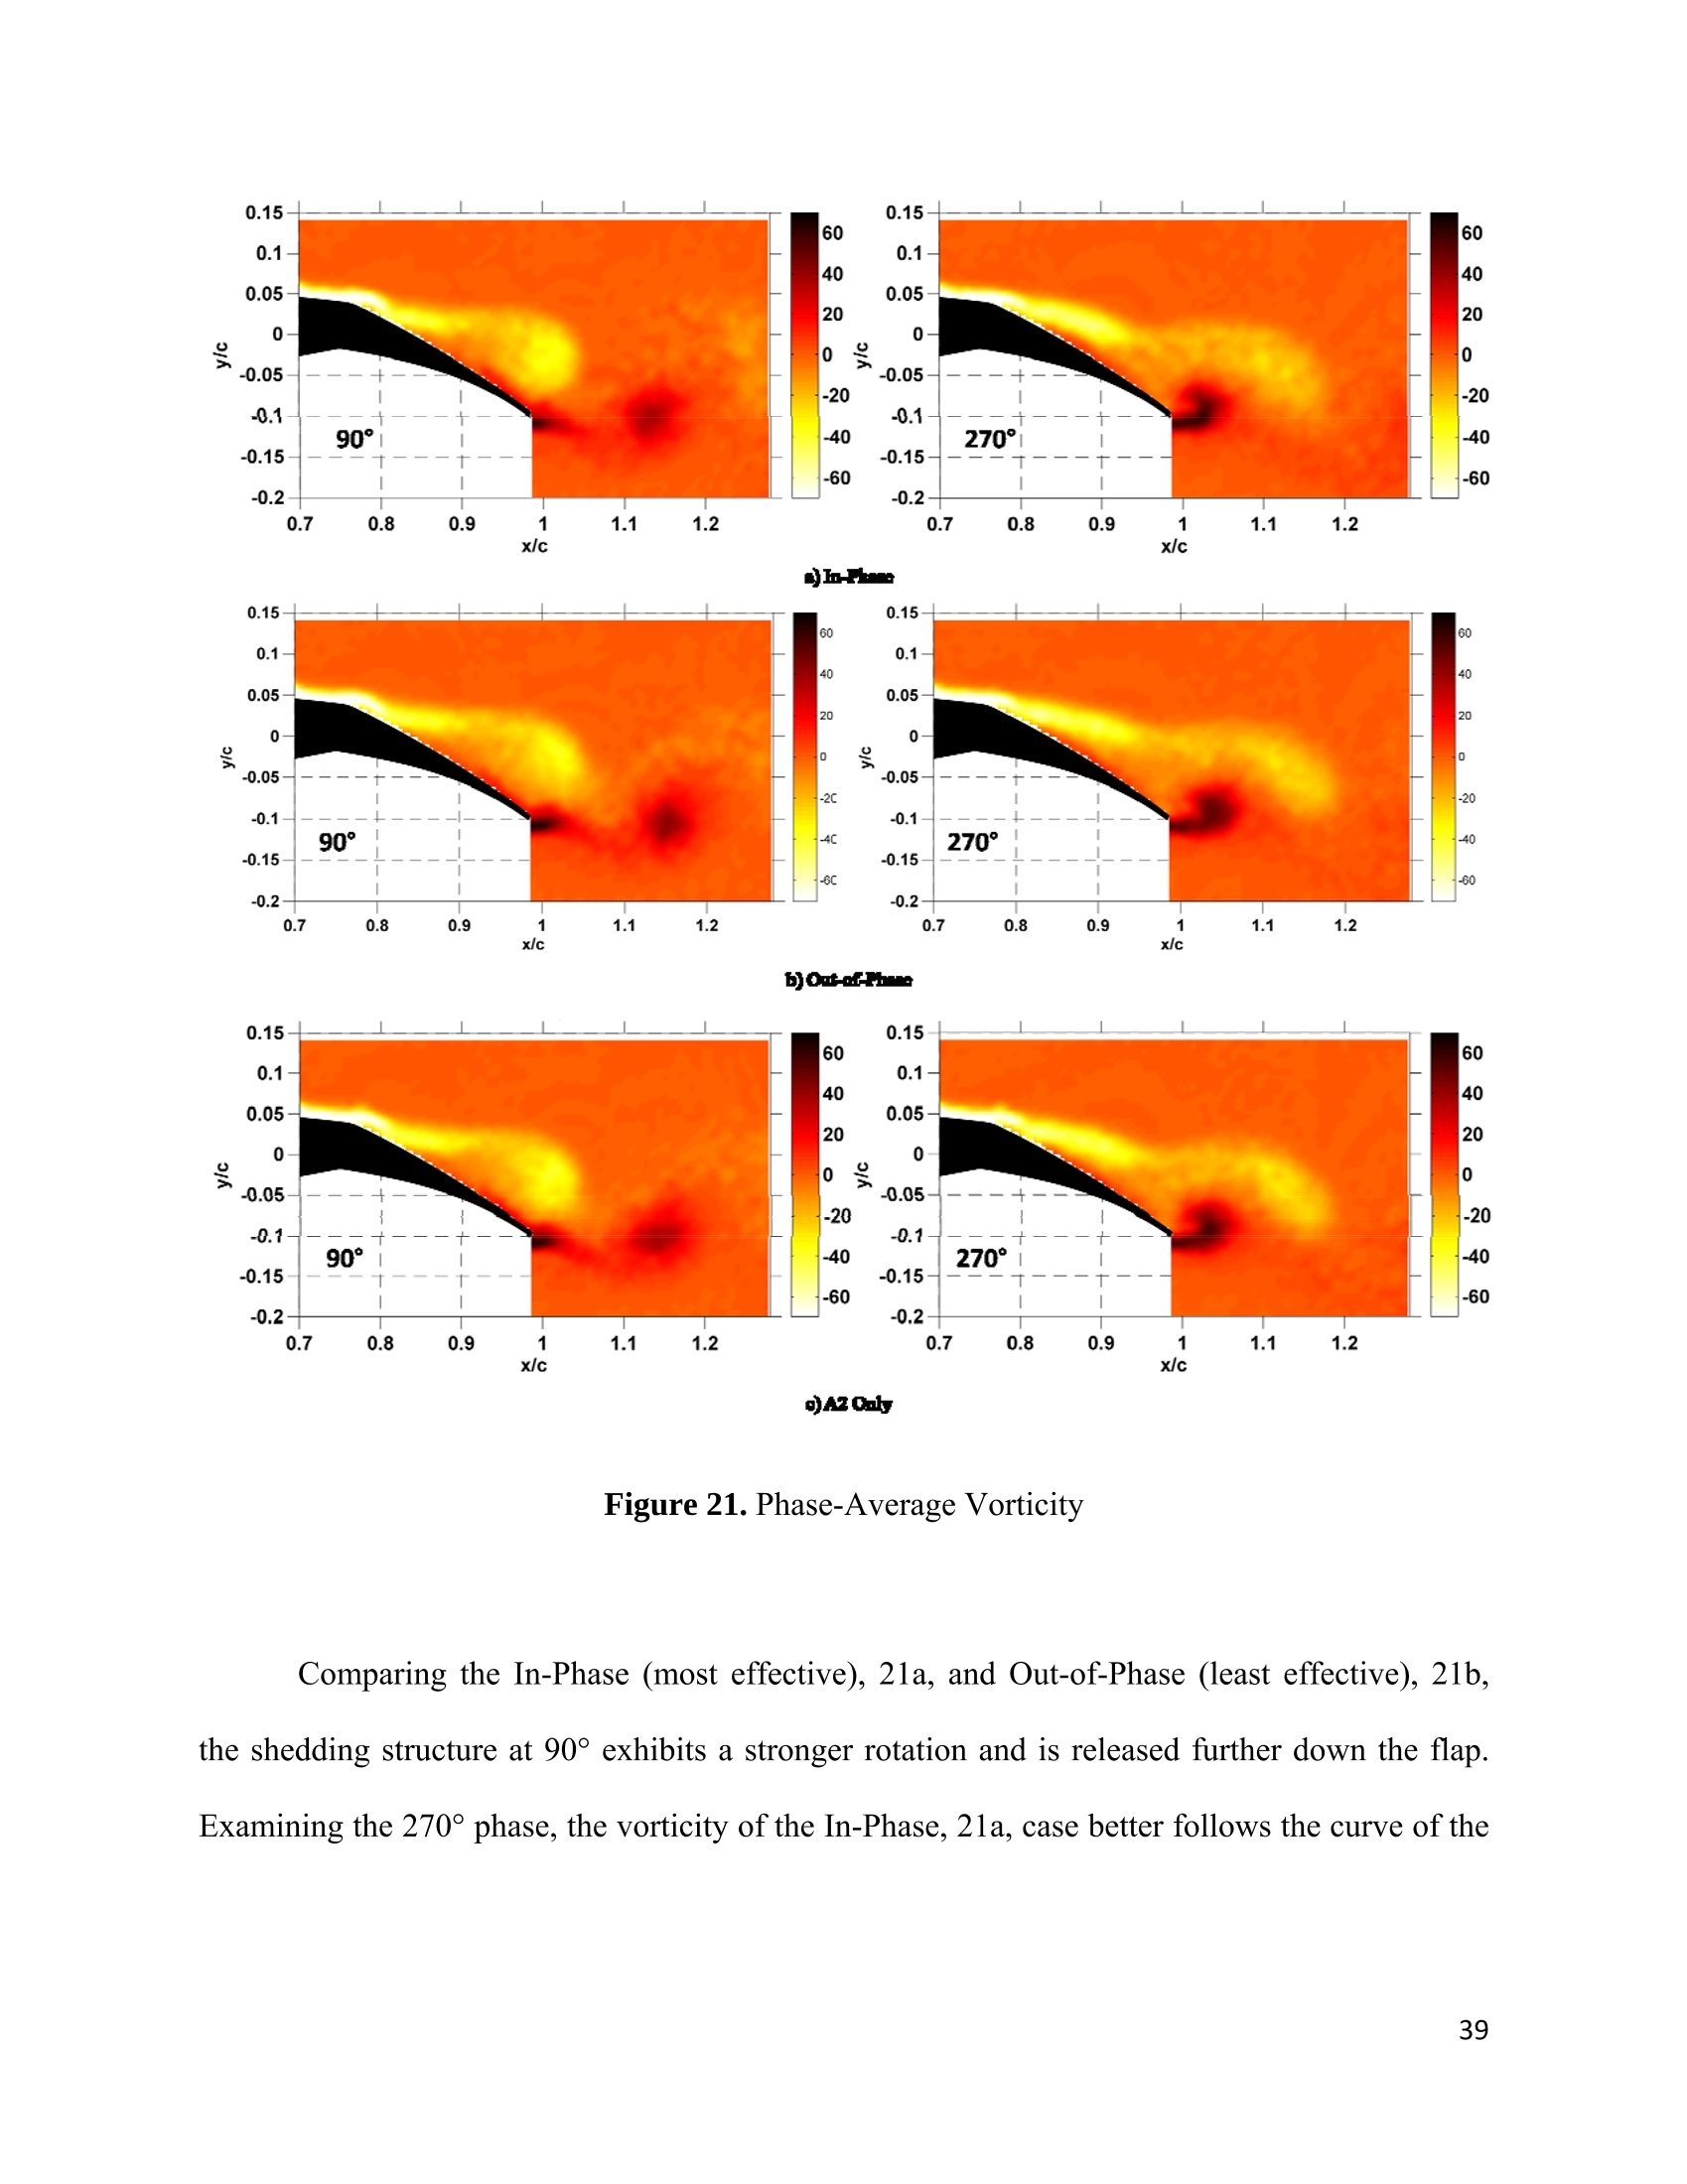
Control of Flow Separation from theDeflected Flap of a High-Lift Airfoil using Multiple Dielectric Barrier Discharge (DBD) Plasma Actuators A THESIS Present in Partial Fulfillment of the Requirements for Graduation with Distinction in the Department of Mechanical Engineering at The Ohio State University By Kristine L.McElligott ********* The Ohio State University May 2010 ABSTRACT In current wing design, multiple flaps are incorporated into the trailing edge to allow mixing ofhigh and low pressure sides to reduce flow separation. These flaps reduce the efficiency byadding weight and complexity to the aircraft.A single hinged flap would reduce theseinefficiencies but is more susceptible to flow separation. Active flow control is a means bywhich the fluid flow over a body is deliberately altered and can be altered such that it becomesless likely to separate from the object. By energizing the flow, the degree of separation of theflow can be controlled, and this inherently controls lift.t. lDielectric barrier discharge (DBD)plasma aaccttuators are aform of active flow control. Theseactuatorsisarecreatedbyasymmetrically aligning two electrodes and adding a dielectric layer between the electrodes.When the electrodes are electrically connected, ionized air (plasma) travels from the exposedelectrode towards the covered electrode. Collisions occur between the plasma and neutral airover the body, and momentum is transferred to the neutral air, effectively energizing it. Thepurpose of this study is to examine the lift enhancement and flow control authority that multipleDBD plasma actuators have on a high-lift airfoil when compared to the flow exhibited by non-controlled and single DBD plasma actuator controlled cases.Electrodes were mounted onto asimplified NASA Energy Efficient Transport airfoil near the flap. The airfoil was tested in aclosed, recirculating wind tunnel operating at a Reynolds number of 240,000, 20° flap deflectionangle and 0°degree angle of incidence. The actuators were independently powered in order todetermine the most effective input parameters.Using multiple actuators operated in-phase hasincreased the lift and has delayed flow separation on the trailing edge flap when compared tobaseline and single actuation cases. ACKNOWLEDGMENTS I would first like to acknowledge Prof. Mo Samimy for allotting me the opportunity to conductundergraduate research. In addition to his constant support and guidance, he always welcomedmy inquiries regarding details pertaining to my research. I owe a debt of gratitude to Jesse Littlefor his supervision and mentorship throughout my research process.I would like to thankProfessor Gregory for his participation on my review committee and Professor Guezennec for hisadvice in an effort to prepare me for my oral defense of my thesis. Last, but certainly not least, Iwould also like to thank the other graduate and undergraduate students at the Gas Dynamics andTurbulence Laboratory for their support. TABLE OF CONTENTS ABSTRACT..... .l ACKNOWLEDGMENTS. ii List of Figures ........ iv List of Tables .......iv List of Equations.......iv Nomenclature ....... ..V CHAPTER 1: Introduction.m.mi 1 .CHAPTER 2: Background..... .3 CHAPTER 3: Experimental Facility and Methodology........ .10 3.1Experimental Facility and Set-up.... .10 3.2 Data Instrumentation and Acquisition....... 13 3.3 Experimental Procedure ...... .18 .CHAPTER 4: Results and Discussion........ 24 4.1 Pressure Experiments ..... .24 4.2 PIV Experiment.....35 CHAPTER 5: Conclusions and Future Work........ .43 REFERENCES. .45 List of Figures Figure 1. Simple Actuator....... .4 Figure 2. Modulation Types (Little 2010).. .6 Figure 3. Average velocity in quiescent conditions (Little 2010)... .8 Figure 4. Airfoil in Test Section ...... Figure 5. Location of Static Pressure Taps .... Figure 6. User Interface for Electrical Controls... Figure 7. Power Generation with Phase Difference..巧 Figure 8. Multiple Actuator Configuration...... .16 Figure 9. Actuators Mounted on Airfoil.L... Figure 10. C, Curve for Configuration #1 ..... Figure 11. Configuration #1 Phase Delay Test....m1 Figure 12. Configuration#2 Phase Delay Test..... Figure 13. Configuration #3 Phase Delay Test..... Figure 14. Configuration #1 Frequency Sweep Test .. Figure 15. Configuration #2 Frequency Sweep Test .. Figure 16. Configuration #3 Frequency Sweep Test .. Figure 17. Configuration #2 Steady/Unsteady Actuation.. Figure 18. Configuration #3 Steady/Unsteady Actuation...... Figure 19. C, Curve with Reported CL..…... .36 Figure 20. Time-Averaged Vorticity ........ 33 Figure 21. Phase-Average Vorticity........ Figure 22. Wake Profile...... .41 Figure 23. Wake Profile of In-Phase and A2 Only cases.. 42 List of Tables Table 1. Actuator Locations for Tested Configurations....... Table 2. Configuration Experiment Results..... List of Equations (1) Cp... (2) CL.. (3) Uncertainty.... (4) Velocity of Wave. 2 3 (5)Number of Wavelengths..3 Nomenclature BL = baseline cGCdFNp = airfoil model chord = lift coefficient = pressure coefficient = distance between actuators =reduced frequency (XspfM/U..) == mmo(dulation frequency =wavelength ratio =static pressure =freestream static pressure = freestream dynamic pressure =average streamwise velocity U.. = freestream velocity =length of separated region = normalized streamwise coordinate y/c = normalized vertical coordinate 入 = wavelength of perturbation Q* = normalized spanwise vorticity (Qc/U.) =spanwise component of vorticity AC = alternating current AFC = active flow control BM = burst mode DBD =dielectric barrier discharge DC =direct current = duty cycle =leading edge PIV =particle image velocimetry TE =trailing edge CHAPTER 1: Introduction In order for an aircraft to take-off, it must have sufficient speed (controlled by thrust force from theengines) and lift (controlled by pressure forces on the body and wings of the aircraft). Maximum speedbefore take-off is restricted by the length of the runway and engine capabilities.With relatively shortrunways at some airports and on aircraft carriers, it has become necessary to more fully examine thescience behind lift and possible augmentation. Lift generated by the wings for a given speed of the aircraft is dependent upon the shape andprojected area of the wing.r. IInr current wing designs in mid-size and large commercial and militaryaircraft, the wings have multiple flaps that effectively change the wing shape and increase the projectedarea during landing and take-off, where lift must be carefully monitored and controlled.The wingchanges such that flaps extend from the trailing edge of the wing and deflect downward. This extensionand deflection on the trailing edge of the wing creates a profile that appears to be almost a continuouscurve. This curve appears continuous because it is comprised of multiple sets of flaps that are controlledby mechanisms in the main body of the wing. However, there are small gaps between the various flapswhich allow high pressure air from the lower side of the wing to mix with lower pressure air on the upperside.. This mixing energizes the flow on the upper side of the wing and is critical in the performancebecause it prevents the flow separation over the flaps. These multi-element wing designs increase the weight of the wing and therefore reduce theoverall efficiency of the wing. It has been suggested that replacing the multi-element flap with a single-hinged flap will reduce the complexity while increasing the efficiency of the wing. However, severe flowseparation is imminent due to the lack of momentum transfer from the high pressure side to the lowpressure side.Active Flow Control (AFC) is a subject which has been utilized for providing thenecessary mass, momentum and/or energy to prevent flow separation. The success of AFC in any flow system is dependent on suitable actuation systems..One such device is the dielectric barrier discharge(DBD) plasma actuator. The remainder of this work is dedicated to understanding the mechanismsbehind DBD plasma actuators and how effective they are when used in preventing flow separation along atest airfoil, and more specifically, the impact ofusing multiple actuators for flow control. Flow separation over airfoils can significantly reduce the lift, increase drag and create vortices,which introduce instability and possibly danger to the flight control of the aircraft.In a worst casescenario, flow separation can cause unrecoverable stall, which is characterized by a complete loss of liftoften accompanied by total aircraft failure. The flaps operated by mechanical systems previouslydescribed are successful for increasing lift without a significant flow separation penalty. However, theextension and retraction of the flaps during takeoff and landing are accomplished by motors and linkagesystems within the main wing. These mechanisms add significant weight and mechanical complexity tothe wing thereby reducing fuel efficiency. The replacement of a multi-flap wing system with a single flapusing active flow control to avoid or at least to minimize flow separation offers many advantages and hasmotivated significant work (Kiedaisch, Nagib et al. 2006; Melton, Schaeffler et al. 2007; Mabe, Calkins etal. 2009). Research on airfoils that replace multiple flaps with one hinged flap is currently being conductedat The Gas Dynamics and Turbulence Laboratory (GDTL) located at The Ohio State University Airport(Littleet al. 2008 and 2009). The hinged single flap reduces the complexity of the wing, but increases thechance for flow separation on the flap at large flap defection angles since it does not permit mixingbetween the upper and lower sides.To eliminate, or at least reduce the size and effects of flowseparation, the air flowing over the wing near the surface must be energized so that it may negotiate theeffects of viscosity and an adverse pressure gradient encountered along the flap. This energy transfer isaccomplished by dielectric barrier discharge (DBD) plasma actuators. The following document providesa detailed explanation of theories and testing facilities used to conduct experiments on a simplified airfoilin an attempt to increase control authority. CHAPTER2: Background Flow separation control is a form of AFC and is the means of creating tailored perturbations inair flow over a body in attempts to deliberately change the flow structures and tendencies. AFCis incorporated into an area of study that is focused on replacing multi-element wings of aircraft(commercial, military, etc.) with a more simple design such as reducing trailing edge elements toa singular flap. In traditional wings, the slats between the elements allow for mixing of air of thehigh pressure side and the low pressure side. This mixing transports energy to the low pressureside and inhibits flow separation.V. With a single hinge, mixing is eliminated, and the flow alongthe top of the wing is unable to negotiate the adverse pressure difference along the flap, and flowseparation occurs. Flow separation can lead to increased drag, reduction of lift and early on-setof stall. Active control of flow separation has shown the capability to increase lift and reducedrag (Greenblatt and Wygnanski 2000).Actuators, an important component of AFC, have beenincorporated into airfoils and have been shown to prevent flow separation downstream of theactuator, which can also increase circulation. An increase in circulation decreases the pressureon the upper surface and ultimately leads to an increase in lift (Cerchie, Halfron et al. 2006). The interest in Dielectric Barrier Discharge (DBD) Actuators has grown in the pastdecade, but the exploration in AFC by means of ionized air has been investigated as early as the1990s (Corke, Post et al.2007). Plasma actuators specifically are attractive because they havestationary parts, are easily installed and are lightweight relative to the mass of the airfoil (Mabe,Calkins et al. 2009). DBD plasma actuators are constructed by asymmetrically aligning twoelectrodes; the electrodes are separated by an insulating dielectric layer, see Figure 1.Anelectric field is created when an AC voltage is applied to the electrodes (Corke, Post et al. 2007).Plasma traditionally has been defined as a region of a gas discharge in which the number of electrons is equal to that of the number of ions.The definition has since evolved to mean asystem of particles that exhibit behavior of coulomb interactions (Corke, Post et al. 2007).Plasma is only created when the electric field exceeds a specific threshold; however, the strengthof electric field to maintain plasma is less than that which is required to create the plasma. Thestrength required for creation of plasma is less for AC than DC-discharges (Corke, Post et al.2007).The movement of charged species in the plasma transfers momentum to neutral airparticles through collisions.The properties of the boundary layer of the airflow are modifiedwhen kinetic energy injects momentum to the inside of the boundary layer (Forte, Jolibois et al.2006). Increased momentum decreases the likelihood of flow separation. Figure 1. Simple Actuator Plasma is produced from the exposed electrode and is drawn towards the coveredelectrode with declining luminosity.The discharge induces airflow of several meters/secondtowards the covered electrode.The maximum velocity is reached near the end of the plasmaformation and is very close to the surface (a few mm) (Forte, Jolibois et al. 2006). The effects ofthe discharge mimic that of tangential wall jets (Corke, Post et al. 2007). Besides having animpact on the tangential velocity, the actuators draw air from above the actuator creating a zoneof suction (Forte, Jolibois et al. 2006). Plasma is not created uniformly through the AC cycle.The rise of the AC wave produces the most plasma (Corke, Post et al. 2007). The negative halfof the waveform dominates the momentum transfer and generates more horizontal velocity (Forte, Jolibois et al. 2006). The momentum that the actuators impart on the airflow is low thuslimiting its uses in high-speed airflow applications (Mabe, Calkins et al. 2009). Single DBD actuators, when incorporated on airfoils, have shown to increase stall angle,reduce drag and reduce flow separation at low Reynolds numbers (Corke, Post et al. 2007). Withthese preliminary findings, it’s important to understand how geometry and electrical parametersinfluence the effect of DBD actuators have on airflow over an airfoil. Geometry is another important factor in the performance of DBD plasma actuators.Themaximum velocity of the plasma has a parabolic relationship relative to the gap length betweenthe asymmetrically aligned electrodes..Actuators oriented asymmetrically produce a highervelocity than when actuators are symmetrically oriented (Forte, Jolibois et al. 2006).A gaplength of 0 mm between the downstream edge of the exposed electrode and the upstream edge ofcovered electrode encourages unity plasma. 'The electric field between the two electrodes isstrongest when the dielectric layer is thinnest, but a thin dielectric layer is more susceptible todamage due to excessive heat (Forte, Jolibois et al. 2006)).. This damage greatly reduces themechanical efficiency. Additionally, a thin dielectric layer is more susceptible to failure due toincreased likelihood of arching between the electrodes and metallic components on the airfoil. The velocity of the plasma and the extent to which the plasma covers the coveredelectrode varies proportionally with the applied voltage (Forte, Jolibois et al. 2006; Corke, Postet al. 2007). Despite the additional plasma, the power requirement and safety concerns greatlyincrease with increasing voltage. Since the required power to create plasma is lower for AC, thefrequency of waveform and how the waveform is modulated contribute to the effectiveness of the actuator. Plasma is created when actuators are operated between 1-10 kHz (Forte, Jolibois etal.2006; Corke, Post et al. 2007; Mabe, Calkins et al.2009). Modulating the carrier frequency has shown to have positive effects on flow control.Modulation is the means of altering a carrier wave to transmit data. In amplitude modulation(AM), the high frequency carrier wave is modulated using a sine wave whose frequency is themodulated frequency, see Figure 2a. Modulation can be used with a variable duty cycle, referredto as burst modulation (BM). Operating with a duty cycle permits more control over powerconsumption and activity of the actuator (Little 2010). The duty cycle shown in Figure 2b is50%. Unsteady actuation like this has proven to be more effective in preventing flow separationusing various actuation techniques (Seifert, Darabi et al. 1996).). L1ow frequency amplitudemodulation has shown to delay stall and increase the lift coefficient, CL,max, at low trailing edge(TE) flap deflections (Melton, Yao et al. 2004). aAM a)BM Figure 2. Modulation Types (Little 2010) The modulation frequency is reported as the Reduced Frequency, a dimensionlessparameter. It is defined as where is the p separated length, fm is the modulated frequency and is the freestreamvelocity. Pulsing at Fnear unity has shown to increase lift augmentation (Seifert, Darabi et al.1996;Mabe, Calkins et al. 2007). A single DBD plasma actuator at the TE has been previously explored for the airfoil usedin this experiment. Dletermining the most effective location for the actuator was an iterativeprocess, but began with placing the actuator near the flap hinge. Separation can be triggered by asudden shape change, such as a deflected flap, and actuators have proven to be most effectivewhen placed slightly upstream of the point where separation occurs (Huang, Corke et al. 2006).The optimal location was determined by examination of largest suction peaks and upstreameffects, both of which are indication of trailing edge flow control (Cerchie, Halfron et al. 2006;Kiedaisch, Nagib et al. 2006; Melton, Yao et al. 2006).The most effective location for a singleDBD actuator was determined to be at x/c = 0.775 measured from the downstream edge of theexposed electrode (Little, Nishihara et al. 2008). DBD actuators that were incorporated in thisstudy are identical to those used in this experiment. They have been shown to produce airflow of2 m/s when operated in BM in quiescent conditions, see Figure 3 (Little 2010). Figure 3. Average velocity in quiescent conditions (Little2010) Adding multiple DBD actuators can increase the induced velocity that is generated fromthe upstream actuator.Unwanted ionic winds, an upstream wind, can be generated from adownstream actuatorr.. TTo prevent these effects, adding a dielectric layer that covers all but thedownstream edge of the exposed electrode can reduce these winds (Forte, Jolibois et al. 2006).Continuing to add actuators does not produce concrete conclusions as to the effects of the mostdownstream actuators because the flow becomes too turbulent (Forte, Jolibois et al. 2006). The effects of adding multiple actuators, not of the DBD type, at the trailing edge of asimilar airfoil as used in this experiment were previously explored by Melton et al. (2004). Theairfoil used in that experiment had a chord length of 406.4 mm (16 in) with actuators at x/c =0.73 (TE actuator) and x/c =0.757 (flap actuator). The actuators were operated using BM. The upstream actuator is oriented just upstream of the TE flap hinge. As previouslydiscussed, excitation of the flap actuator created a strong suction peak at the flap and shoulder and created an area of more positive pressure downstream of the slot. An increase in lift anddelay in flow separation were a result of these effects.The maximum lift improvements foractuation occurred when the TE flap was deflected 20-25°(Melton, Yao et al. 2004). The flapactuator was shown to have more effect on the airflow than the TE actuator when actuators wereoperated independently.y.WVhen the actuators were operated in conjunction with each other thephase delay of modulation frequency of the actuators in BM were tested. Melton determined thatactuators were most effective in increasing lift and delaying separation when the phase delay waswithin 30° relative to in-phase, and lift and flow separation control was weakest when actuatorswere operated out-of-phase (Melton, Yao et al. 2004). CHAPTER 3: Experimental Facility and Methodology 3.1 Experimental Facility and Set-up Experiments were conducted in a Gottingen-type, closed,recirculating wind tunnel. The tunnelis operated by an axial fan powered by a 200 hp AC induction Motor.The wind tunnel iscapable of reaching speeds from 3 to 90 m/s (7 to 200 mph) in the test section. This study onlyrequires speeds near 15 m/s (34 mph). The tunnel is equipped with an optically accessible 61 x 61 x 122 cm(2x2x 4 ft’) testsection. The walls of the test section are 2.54 cm (1 in) thick and are made of super abrasionresistant acrylic. Each side wall has a 30.5 cm (12 in) diameter port. The ports are located 30.5cm (12in) from the test section floor and 61 cm (24 in) downstream of the test section entrance.The purpose of the ports is to hold the airfoil in place during testing and align the model atvarious angles of attack, Figure 4. Figure 4. Airfoil in Test Section The contraction into the test section is a 6.25:1 ratio, while the downstream diffuserexpands at an overall angle of 6°. This configuration allows for continuously variable velocitiesin the aforementioned range. A hexagonal cell aluminum honeycomb is located upstream of thetest section in order to condition the flow. High porosity stainless steel screens are mounteddownstream of the test section to act as a safety catch. Since the tunnel is a closed circuit, highefficiency turning cascades made of galvanized steel are installed in each of the four tunnelelbows. This configuration within the tunnel reduces freestream turbulence levels to the order of0.25% with +/-1% variation in the freestream velocity when measurements are taken 6 inchesfrom the test section inlet. In order to maintain a stable thermal environment in the test section, the tunnel isequipped with an aluminum fin/copper, double row heat exchanger utilizing water as the coolingmedium. The temperature is maintained with a set point controller and an electronic modulatingvalve. As a result, the tunnel freestream operating temperature is maintained to be +/-1°℃ of theambient temperature when sufficient source of cooling water is supplied (maximum of .0032m’/s [50 gpm]). The airfoil selected for the series of experiments is a simplified high-lift version of theNASA Energy Efficient Transport (EET) airfoil (Melton, Yao et al. 2004). It is simplified in thatit only has a simple trailing edge flap whereas the full model is equipped with a segmentedleading edge slat and trailing edge flap. The chord length, c, is 25.4 cm (10 in) and the modelspans the entire test section length of 61 cm (24 in). The trailing edge, simple flap is capable ofdeflections of 0 to 60°; the flap length is 25% of the chord length. Instrumentation in the airfoilincludes 45 staggered static pressure taps near the center line and 15 static pressure taps at 4 and34 the span of the airfoil. Location of the static pressure taps in the profile view can be found inFigure 5. Figure 5. Location of Static Pressure Taps 3.2 Data Instrumentation and Acquisition Actuators are independently powered in order to determine the most beneficial input parameters.The input signal is generated and controlled by a dSpace DSP 1103 board. The user interfacepermits control of the electrical potential gain, the duty cycle, carrier frequency, modulationfrequency and a phase delay for one of the actuator's control frame. Additionally, aacompensated phase shift is added to ensure that while the signals have a modulated phase shift,the peaks and troughs of their carrier signals coincide. This is a critical component since if oneactuator is at a high potential and the second is at a low potential, sparking will occur between the two actuators because electrical energy travels from the high potential to lowest potential. Inprevious experiments, thissparking hass lead tto damage of the actuators,airfoil1andinstrumentation. A snapshot of the user interface can be found in Figure 6. An example of thepower generation can be found in Figure 7. Notice the delay in modulation signal but the peaksand troughs for the carrier signals are in-phase. Figure 6. User Interface for Electrical Controls Figure 7. Power Generation with Phase Difference Power is supplied by two identical Powertron Model 1500S AC power supplies, and eachis equipped with a step-up high voltage transformer.The transformer is necessary in order toincrease the voltage to an amplitude that is required in order to generate plasma on the actuators.The voltage generated by the power supply was monitored by high voltage probes, and thesignals were reviewed during the experiments on a LeCroy Waverunner 6050A oscilloscope.Voltage loss in the lead wires from the power supply to the actuators are disregarded for dataanalysis. Actuators are mounted onto the airfoil by placing the covered ground electrodes directlyonto the surface. The exposed high voltage electrodes are insulated from the grounds by threelayers of heat resistant Kapton tape.. The exposed electrodes are placed on top of the tape suchthat it is upstream of the ground electrode with no gap between the downstream edge of theexposed electrode and the upstream edge of the covered electrode. A cross-sectional profile is provided in Figure 8.The exposed electrodes measure 6.35 mm (0.25 in) wide and 0.09 mm(0.0035 in) thick, and the covered electrodes measure 12.7 mm (0.5 in) wide and 0.09 mm(0.0035 in) thick. The width of the exposed high voltage electrode is secondary in importance tothe width of the covered ground electrode (Forte, Jolibois et al. 2006). Three layers of Kaptontape are used measuring 50.8 mm (2 in) wide with a total thickness of 0.27 mm (0.011 in). Thewidth is large relative to the widths of the two types of electrodes because the Kapton tape servesas a common barrier for both electrode sets.This configuration is chosen due to the closeproximity of the set of actuators and the electrical communication that might result if theelectrodes are not sufficiently protected. Additionally, it removes surface discontinuitiesbetween the actuators. A second single layer of 12.7 mm (0.5 in) wide and 0.09 mm (0.0035 in)thick Kapton tape is used to insulate all but the trailing edge of the downstream exposedelectrode. This is added in order to minimize parasitic ionization and cross talk between the twodevices which can reduce the effectiveness of the devices (Forte, Jolibois et al. 2006; Do, Kim etal. 2008). Figure 9 is an image of the actuators mounted onto the airfoil. Figure 8.Multiple Actuator Configuration Figure 9. Actuators Mounted on Airfoil Static taps are incorporated into the model to collect pressure readings (Cp) around theairfoil. The pressure readings give an indication of lift and location of flow separation. ThreeScanivalve digital sensor arrays (DSA-3217) are used to collect data from the 45 static pressuretap locations at a sampling rate of 10 Hz. Data from the sensors is viewed during the experimentusing LabView software. The data is monitored to characterize the stability of the flow and givea preliminary estimate of the CL. The flow field is examined using a two-component particle image velocimetry (PIV)system with DaVis 7.2 software. PIV requires a light source, seeding particles and a camera totrack particle movement. The light source is a dual-head Spectra Physics PIV-400 Nd:Yag laser.The laser is reflected by mirrors from its source to a location over the test section, it is then manipulated by a set of spherical and cylindrical lenses to form a thin laser sheet which lies in aplane parallel to the flow near the model centerline. The laser pulse has a width of 9ns, whichfreezes the flow in time so that an image can be taken. The short pulse length is required inorder to prevent streaking (Dabiri 2009). The pulse length is sufficient for supersonic flows, butthe flow used for this experiment is safely in the subsonic flow region (Ganapathisubramani,Clemens et al.2006). A 6-jet atomizer introduces olive oil seed particles upstream of the testsection. The atomizer reduces a liquid into a spray of particles with diameters of approximately1 um. The camera chosen to collect the images is a LaVision 14 bit 2048 by 2048 pixel ImagerPro-X CCD camera with a Nikon zoom lens. An additional Vivitar 2x teleconvertor is used toincrease spatial resolution. Ideally, the camera is oriented perpendicular to the light source(Dabiri 2009), but the wall plugs and electric leads create optical obstructions.The camera isoriented downstream at an angle of approximately 13° relative to the perpendicular datum. Thetime separation between two laser pulses for correlating particle movement is 45 us for thecamera setup and flow conditions surveyed. Adaptive window, multi-pass processing with finalwindow size of 32x32 pixels is used to correlate the two image frames using 50% overlap. Acorrection algorithm is applied for the non-orthogonal camera angle, and post processingremoves spurious; vveectors that fall outside of an unrealistic velocity range and applies asmoothing filter to the calculated velocity field. All data that is below the airfoil is eliminatedfrom post-processing since the laser sheet cannot penetrate the airfoil.This also decreasesprocessing time. 3.3 Experimental Procedure The experiments on the airfoil were tested at a Reynolds number of240,000±1,000.Thedimensionless Reynolds number represents various aspects of the fluid flow and environmentsuch as the temperature in the test section, tunnel speed, atmospheric pressure, chord length,dynamic viscosity and gas constant of the working fluid. The Reynolds number of 240,000 is fora tunnel speed of approximately 15 m/s (34 mph)..TThis is a relatively low speed for thecapabilities of the wind tunnel and the pressure sensors.The static pressure sensors and flow inthe wind tunnel require 10-20 minutes to reach thermal steady-state so that reliable experimentscan be conducted.. The angle of incidence, the angle at which the flow encounters the leadingedge of the airfoil, is set to be 0°. The trailing edge flap is deflected to 20°. A flap deflection of30° would have inherently produced more lift, but because of the increase in adverse pressuregradient, it would have been more difficult to control separation. The initial purpose of thisstudy was to first determine if multiple actuators were able to re-attach the flow to some degreebefore examining the limitations of multiple actuators. Based on previous studies conducted on this airfoil, both sets of actuators were poweredwith a carrier frequency of 2000 Hz and a modulated frequency of 120 Hz (Little, Nishihara etal. 2008; Little, Nishihara et al. 2009).The modulating frequency coincides with the naturalfrequency of vortex shedding from the flap in these conditions (F*=0.5), which has previouslybeen most successful for lift enhancement (Little, Nishihara et al. 2008; Little, Nishihara et al.2009). The voltage applied is 18 kV peak to peak. In previous experiments involving thisairfoil and a single actuator, the actuator was powered with 20 kV peak to peak (Little, Nishiharaet al. 2008; Little, Nishihara et al. 2009), but due to the close proximity of the actuators, thevoltage was decreased for safety. Unsteady actuation has proven to be more effective inpreventing flow separation for various actuators and flow systems (Seifert, Darabi et al. 1996). The carrier signal is modulated with a duty cycle of 50% based on previous work (Little,Nishihara et al. 2008; Little, Nishihara et al.2009). Control authority is most effective for a single actuator located at x/c=0.775, where x ismeasured relative to the downstream edge of the exposed electrode (Little, Nishihara et al.2008). The actuator location is defined in this manner because this is the location of maximumbody force production by the plasma (Enloe, McLaughlin et al. 2004). The location of x/c=0.775is henceforth referenced as optimal location. Based on this knowledge, the multiple actuatorswere adjusted relative to this parameter. The term‘A1’refers to the upstream actuator and ‘A2'refers to the downstream actuator. In the first configuration tested, A1 is placed at the optimallocation and A2 at x/c=0.875.This configuration is selected because it is hypothesized thatplacing an actuator downstream of the optimal location will continue to re-attach the flow if theseparation point is delayed by A1. This allows for a nominal space size of 6.35 mm (0.25 in)between the downstream edge of the covered upstream actuator and the upstream edge of theexposed downstream actuator. Having the actuators closer together will affect control authority,but it comes at a greater risk of electrical communication between the actuators and ultimatefailure of the device.. The second configuration tested was one in which the optimal location isbetween the two actuators.. A1 is located at x/c=0.725 and A2 is located at x/c=0.825..1Thisconfiguration is chosen because it was unclear if the location of A2 in the previous configurationis too far downstream to re-attach a highly separated flow. The final configuration tested is onein which A1 is located upstream of the optimal location at x/c=0.675 while A2 is located at theoptimal location. It is hypothesized that locating a second actuator upstream of the optimallocation could ‘pre-condition’the flow over the airfoil and the actuator at the optimal locationwill have a greater success of re-attaching the flow if correct phase matching can be obtained. The configurations are summarized in Table 1; actuators located at the optimal location havebeen marked for emphasis. In all configurations, the device covers some pressure taps in thevicinity of the flap. These taps must be removed from analysis because creating holes in theactuators in order for pressure readings to be taken would render the actuator inept. Table: 1. Actuator Locations; ffor TestedConfigurations A1 Locationx/c A2 Locationx/c Configuration #1 0.775 0.875 Configuration #2 0.725 0.825 Configuration #3 0.675 0.775 The first set of experiments was run in order to determine which configuration producedthe most lift.:. An increase in lift is an indication of an increase in control authority. Datacollected by the static pressure taps are integrated to determine the lift. Tests are run in the samesequence.The first step is to ensure that each actuator is operating properly individually andconcurrently. Proper operation is characterized by production of plasma and no discharge orsparking between the separated actuators. The second step is to take a baseline case tocharacterize the lift of the airfoil at the given operating conditions. Additionally, A1 and A2 areoperated independently to define lift due to each actuator. The first test is a Phase Delay Sweep Test.The modulation phase delay between theactuators is varied between 0° and 360° in increments of 30°. Due to unsteadiness that may ariseduring the experiments due to the covered pressure taps and experiments being conducted daysapart, baseline cases are taken between each increment. As a result, the change in lift coefficient,ACL, is reported, not the overall lift, CL. After the phase delay of 180° test is conducted, the actuators are operated independently in an effort to characterize the stability of the actuators overtime.This test is also conducted after the phase delay of 360° test.The purpose of the phasedelay test is not only to determine the optimal delay between the signals, but also to find if thereis a delay that is detrimental to lift when compared to a single actuator at the optimal locationand even the non-controlled case. The second test is a Frequency Sweep test. The modulated frequency of the actuator notat the optimal location is altered from 30 Hz to 360 Hz in increments of 30 Hz. Only the actuatornot located at the optimal location is altered since the best operating conditions are alreadyknown at x/c=0.775 (Little, Nishihara et al.2008;Little, Nishihara et al. 2009). For the secondconfiguration, the modulated frequency of A2 is altered because if A1 is capable of maintainingan attached flow up to A2, the separation length changes for the configuration and the optimummodulating frequency may change for A2.A baseline is taken between each increment in thesame fashion as the first test. The device is operated with the carrier and modulated signals in-phase in BM. The third and final test conducted to determine the most effective configuration is a DutyCycle Test. Three cases are run in addition to the baseline: A1 steady and A2 at 50% dc, A1 at50% dc and A2 steady, and both actuators at steady operation. Both are operated with a carrierfrequency of 2000 Hz and modulated at 120Hz. Steady operation is defined as a Duty Cycleequal to 100%. For a single actuator, 50% dc proved to be the most effective (Little, Nishiharaet al. 2008; Little, Nishihara et al. 2009), but since the flow structures will have changed due to asecond actuator, perhaps a steady operation will prove to be more effective. The second set of experiments is a PIV test using the most effective configurations asdetermined by the first set of experiments.PIV experiments are limited due to time constraintsand size of data files associated with the tests.PIV test runs incorporate the parameters thaproduced the maximum lift from the phase delay test, incorporating the parameters that producedthe minimum lift from the phase delay test,operating A1 only, operating A2 only and a baseline.Data includes time-averaged and phase-averaged sets. The time-averaged data can indicate howwell the flow is attaching in an average sense while the phase-average data can give a temporalsense of vortex shedding. CHAPTER 4:Results and Discussion 4.1 Pressure Experiments The first test conducted is the Phase Delay Sweep Test for the three configurations selected.Based on the pressure readings taken during the test, the pressure coefficients, Cp, and then thelift coefficient, CL, are calculated. The pressure distribution of the in-phase (0°phase shift) forConfiguration #1 is presented in Figure 10 along with the baseline (BL) pressure distribution forthe particular test. Figure 10. Cp Curve for Configuration #1 The pressure coefficient is a dimensionless parameter, see Equation 1, and it is a ratio ofthe local static pressure on the airfoil relative to the freestream dynamic pressure. where P is the local pressure, Pe is the freestream static pressure, and Go is the freestreamdynamic pressure. The ordinate of the plot is reversed to match the orientation of the airfoil. Anegative Cp indicates suction and most commonly effects the upper-side (suction side) of theairfoil, and a positive Cp indicates pressure and most commonly effects the underside (pressureside) of the airfoil. The abscissa of the plot has been non-dimensionalized with reference to thechord length, c. The lift coefficient is calculated by integrating the difference of the pressurecoefficient of the pressure side and the suction side of the cord length, see Equation 2. The trapezoidal method is used for numerical integration. By examining the Cp curve of theairfoil in Figure 10, there is an indication of lift enhancement because the In-Phase dataencompasses a larger area. This upstream effect is due to increased circulation due to actuationon the flap (Cerchie, Halfron et al. 2006). The ACL values of Configurations #1-3 of the Phase-Delay Sweep Test are presented in Figures 11-13. In the following figures, the lift enhancementdue to device actuation is labeled as ‘Data’. Lift enhancement due to activation of A1 and A2only is also presented. The effectiveness of each actuator is recorded at the beginning of the test(subscript i) and the end of the test (subscript f). For Configuration #3, the plot shows the caseswhere the actuators were also tested midway through the test, just after the 180° phase shift(subscript m). This test was conducted on Configurations #1 and #2, but data revealed the sametrend; data is not presented in order to simplify plots. Data MM.1 Figure 11. Configuration #1 Phase Delay Test Figure 12. Configuration #2 Phase Delay Test -Data A1. A1 A1, A2. A2 _A2. Figure 13. Configuration #3 Phase Delay Test Based on the calculated values of CL and the standard deviation based on forty samplestaken, the uncertainty/repeatability error associated with the lift coefficient for these experimentsis ±0.002. The uncertainty is calculated using Equation 3 below. where is the confidence interval at 95%, is the sample mean, is the standarddeviation for an experimental test quantity, and is the number of samples. There is anadditional, and potentially more relevant, error band associated with the lack of data due to thecoverage of pressure taps between x/c=0.60 and x/c=0.825. As a result, the lift that iscalculated is likely to be an underestimation of the actual lift because when flow is reattached, alocal suction peak occurs at the point of reattachment (Melton, Yao et al.2004). A suction peak correlates to a more negative Cp value at the location of attachment, and based on the calculationof lift (Equation 2), a higher CL would result. The results of the Configuration #1 Phase-Delay Sweep test greatly differ from those ofConfigurations #2 and #3, see Figures 11-13. There is very little variation in lift enhancement inrelation to phase delay changes. Examining the independent actuator effects, A1 produces liftenhancement on the same order as when both devices are activated; A2 does not produce liftenhancement. Based on these results, it is postulated that A1 does not move the separation pointfar enough downstream for A2 to further re-attach the flow. Lift enhancement is a result of A1only. In Figure 13, there is a clear bell curve shape to the data.The actuators have more liftenhancement when they are in-phase at 0° and 360° than at other delays. The in-phase tests at 0°and 360° were approximately 60 minutes apart, and the actuator control authority appears todegrade of this timeframe. This is most obvious when comparing the 0° and 360°cases whichshould provide identical results. It can also be seen by examining the singular actuatorperformance at various portions of the run. The reduction in actuator effectiveness over time hasnot been studied in detail, but it is expected based on literature (Greenblatt, Goksel et al.2008).Most importantly, this plot shows that combined actuators in-phase produce slightly greater liftthan any single actuator can produce. Actuators operating out-of-phase (roughly between 120°-270°) have detrimental effects on lift when compared to the A2 only operating condition. The results of Configuration #2 yield similar results to that of Configuration #3 yet withslightly less control authority, see Figure12. The bell curve re-enforces the result that the deviceis more effective when operated in-phase, and when it is operated out-of-phase, it can be detrimental to lift. This configuration is more detrimental to lift when out-of-phase as the deviceis less effective than when each actuator is operated independently. Despite the similar results toConfiguration #3, this configuration produces less overall lift enhancement.The maximum liftchange from baseline is 0.08 while it is 0.12 for Configuration #3. As introduced in Chapter 3, this airfoil is a simplified high-lift version of that used byMelton et al. in NASA experiments (2004).The purpose of these experiments was to alsoexamine flow separation by means of AFC, but piezoelectric actuators in mechanical slots wereutilized as the means of actuation.The mechanisms on how the flow is influenced bypiezoelectric differ from those of the DBD actuator.r. Melton examined the effect that a phasedelay between the two actuators would have when actuators are located near the hinge of thetrailing edge flap. Parameters of Melton’s work are similar to those of this experiment: lowfrequency excitation modulation, Re=240,000, and a flap deflection of 20°. However, the airfoilof Melton’s experiment had a chord length of 406.4 mm (16 in), and the actuators, while near thetrailing edge hinge, were located at x/c=0.73 and x/c=0.757. The airfoil used by Melton et al.is also equipped with a leading edge droop (2004) and results were published at 6° and 12° angleof attack. Despite the different methods, the results of Melton’s experiments show similar trendsas the results for the phase delay tests conducted in this experiment. Melton found the actuatorswere slightly more effective when operated near in-phase (within 30° of in-phase) (2004). Theeffect of the actuators in enhancing lift disintegrated as the angle of attack increased from 6° to12°. This is attributed to that as the angle of attack increases, the flow separation occurs furtherupstream and the actuators lose their effect on delaying flow separation over the flap. Due to a physical separation of the actuators, some finite period of time exists for theperturbation wave that is created by Al to reach A2.. Using the superposition principle, if the perturbation wave created by A2 is created in-phase with that of the perturbation created by A1,the effect of the flow disruption would increase. Based on the results of Figure 13 in conjunctionwith the work of Melton, the phase-delay is near zero, but a resolution of 30° may be too large toidentify this optimal phase delay. Similarly, the most detrimental phase delay to lift is not likelyto be exactly 180°, but very near it. The optimal phase difference for Melton’s study is estimated using F, the modulationfrequency, the physical separation of the actuators and the convective velocity. By definition,the velocity of the waveform generated by the actuator is equal to the product of the frequencyand the wavelength, see Equation 4.The convective velocity in the shear layer is estimated at60% of the freestream, and the frequency of the perturbation is the modulating frequency. Theresulting value of lambda (x/c =0.3) compares favorably with PIV data. The wavelength of theperturbation is then compared to the physical separation of the actuators, see Equation 5. This isthen correlated to a phase separation. In the case of Melton, it is found to be ~30°. where Uiis the convective velocity, fw is the low frequency modulation and ais thewavelength of the perturbation; dis the physical separation between the actuators, Nis theproportional constant of the wavelengths.Applying this theory to the data collected in thisexperiment leads to an optimal phase delay of~120°. This is clearly not in agreement with thecollected data. This leadss to examining how the variables are defined, in particular theseparation between actuators. In the case of Melton work, the actuators are physical and distinct slots and are the source perturbations. With plasma actuators, the exact location of perturbationsis not as clear being as the plasma extends over the ground electrode (Forte, Jolibois et al. 2006).Additionally, the angle at which the perturbation is introduced to the flow will have some effect.In Melton et al., the slots have a fixed orientation relative to the surface of the airfoil (2004), andthis likely has an effect on how the perturbation wave is introduced to the shear layer and how itpropagates and interacts with the downstream actuator.. Additionally, the effect of the carrierfrequency was not emphasized in calculating the optimum phase delay. The results of the second test, the modulated frequency sweep for Configurations #1-3,are presented in Figures 14-16.. The results of Configuration #1 (A2 modulated), Figure 14,show little change in lift enhancement across all modulated frequencies further indicating thatA2 does not have an effect on flow control. IDespite A1 being upstream from the optimallocation, Configuration #3, Figure 16, produced the most lift enhancement at the same modulatedfrequency of 120 Hz..There are small local peaks at 240Hz and 360 Hz, both of which areharmonics of 120 Hz. As with the Phase Delay Sweep Test, the results of Configuration #2 forthe Frequency Sweep Test reveal a similar trend to that of Configuration #3, see Figure 15.There is a clear peak at a modulated frequency of 120 Hz, but the harmonics are less distinct.The overall lift generated is less than Configuration #3, which is in agreement from the PhaseDelay Sweep Test. Figure 14. Configuration #1 Frequency Sweep Test -Data A1. M Figure 15. Configuration #2 Frequency Sweep Test Figure 16. Configuration #3 Frequency Sweep Test The third and fina1l test conducted is one in which the steady actuation (i.e. nomodulation) was examined. Based on previous work, an actuator located at x/c=0.775 was ableto slightly delay flow separation when operated with unsteady actuation (Little, Nishihara et al.2008; Little, Nishihara et al.2009). The purpose of this test is to examine the hypothesis that ifthe actuator at the non-optimal location can partially delay separation, then the effects ofdelaying the flow separation can be further enhanced by the actuator located at/near the optimallocation. The lift results are presented in Figures 17 and 18 for the various cases,and a referenceof the maximum lift produced in the Phase Delay Sweep Test with the device at a dc of 50% and0° phase shift is included. This test was not performed on Configuration #1 due to devicefailure, and it was deemed unnecessary to re-conduct the tests based on results from the PhaseDelay Sweep and Frequency Sweep Test. In Configurations #2 and #3, the actuator located atthe optimal location produced more lift when operated in unsteady conditions3..D1espite the location of the actuators, lift is enhanced most when both actuators are operated in an unsteadyfashion. Figure 17. Configuration #2 Steady/Unsteady Actuation Figure 18. Configuration #3 Steady/Unsteady Actuation Based on the results of the first experiment, which examined the parameters of phasedelay between actuators, modulation frequency and steadiness of actuation, the most effectivedevice configuration can be determined. One of the actuators should be located at the optimallocation (x/c =0.775) based on a greater lift enhancement produced by Configuration #3 (A2located at x/c=0.775) relative to Configuration #2 (actuators straddled the flap).. The otheractuator should be located upstream based on the lack of effectiveness of the second actuator inConfiguration #1 (x/c =0.875) when compared to Configuration #3 (x/c=0.675). The resultsare summarized in Table 2; the optimal configuration is highlighted for emphasis. Table 2. Configuration Experiment Results Actuator 1Locationx/c Actuator2Locationx/c PhaseDelay ModulatedFrequency Duty Cycle Maximum Lift Enhancement(ACL) Configuration #1 0.775 0.875 180° 120 Hz N/A 0.1125 Configuration #2 0.725 0.825 0° 120 Hz 50% 0.0794 Configuration #3 0.675 0.775 O° 120 Hz 50% 0.1200 4.2 PIV Experiment A PIV experiment was conducted on Configuration #3 in order to characterize the flow velocityand flow structure in a time-averaged and phased-averaged sense for the following cases: In-Phase operation, Out-of-Phase operation, A2 only, A1 only and BL. The carrier frequency of2000 Hz was modulated at 120 Hz with unsteady actuation (dc of 50%). Since the experimenttook place in a small time frame (within 3 hours), the overall lift, CL, is reported, not ACL as wasreported in the pressure tests.The pressure coefficients, Cp, and the lift coefficient, CL, arepresented in Figure19. Trends remain the same as the pressure tests further confirming that in- phase operation has more lift enhancement than out-of-phase and A2 has more affect on lift than A1. Figure 19. Cp Curve with Reported C Time-averaged data allows for the overall trends of the flow to become apparent andshould correlate with the measurementss ooff FFiigguurree 1199.. The phase-averaged data is sync 0collect data at four phases over the modulation cycle. The phases are synced with A2 except inthe A1 Only case.The phases are synced with A2 because this actuator is located at theoptimum location. When examining the time-averaged data, the vorticity figures give an insightas to where the flow is separating on the flap and how the flow turns over the shoulder.Theresults are presented for the cases in Figure 20. 60 40 20 0 -20 -40 -60 b).cU.Out-of-Phase 40 -20 -40 -60 DcU Al Only c)acU.A2Only o)Q.oU.Baseline Figure 20.Time-Averaged Vorticity Comparing the four controlled cases to the BL case, there are some clear conclusions.A1 Only, 20d, case delays flow separation the least as the shear layer is not brought backtowards the flap as much as in the other cases. The Out-of-Phase, 20b, case does not exhibit the degree of reattachment that can be found in the In-Phase, 20a, and A2 Only, 20c, cases. The InPhase and A2 Only cases move the point of flow separation further down the flap relative to theBL. Beyond this, it is difficult to distinguish the differences between the two cases. The shear layer development over the flap for these tests is similar to those as reported byMelton et al. (2004). Melton showed that the in-phase and downstream actuator only produced avorticity with very similar shapes. The shear layer is pulled closer to the flap than in thebaseline, the upstream actuator only, and the out-of-phase cases. IIt is unclear as to if the flowseparation point moved further downstream with actuation for the cases tested by Melton (2004). As the shear layers between the In-Phase and A2 cases are difficult to differentiate, thephase-averaged flow structures for 90° and 270° are presented in Figure 21. Additionally, theOut-of-Phase case, the least effective control, is presented. 0)A2 Only Figure 21. Phase-Average Vorticity Comparing the In-Phase (most effective), 21a, and Out-of-Phase (least effective), 21b,the shedding structure at 90° exhibits a stronger rotation and is released further down the flap.Examining the 270° phase, the vorticity of the In-Phase, 21a, case better follows the curve of the flap and the vortex that is shed from the pressure side is of a greater magnitude, smaller in size,and is drawn closer to the flap. Upon examination of the phase-averaged vorticity of the In-Phase, 21a, and A2 Only,21c, cases, there is no substantial difference in flow structure formation between the two cases.However, based on Figure 19, there is an influence from A1 that differentiates the flow in thetwo cases because the In-Phase produced more lift than the A2 which can be seen at the leadingedge. If we refer to flow around airfoils with a blunt trailing edge, very slight turning of the flowgenerates an increase in circulation that has an effect all the way up to the LE even in theabsence of separation (Cerchie, Halfron et al. 2006). Based on a higher peak in LE in Cp curvein Figure 19, there is greater circulation in In-Phase case when compared to A2 Only, so the flowfollows the flap curvature slightly more for the In-Phase case. Another means of comparison is to examine the wake profile downstream of the end ofthe flap. After examining profiles at distinct x/c locations, x/c=1.1 was the closest location to theflap that shows differentiation between the vorticity of In-Phase and A2 Only. The wake profilefor all cases is shown in Figure 22, and a closer examination of the In-Phase and A2 Only casesis show in Figure 23. The absolute value of the vorticity is reported. Recall that sheddingvorticity from the suction side is negative and shedding vorticity from the underside of the flap ispositive. Figure 22. Wake Profile The wake profile downstream of the flap magnifies the affect that the actuators have onthe flow. In all cases, the magnitude of the shedding vorticity has decreased up to 50% that ofBL. Additionally, the flow structures are pulled closer to the flap indicated by the decreasingseparation of peaks relative to y/c. Figure 23. Wake Profile of In-Phase and A2 Only cases A closer examination of the In-Phase and A2 Only cases show that the flow structures arepulled closer to the flap to approximately the same degree.The vortex shedding from theunderside of the flap in the In-Phase has a smaller magnitude than that of the A2 Only. CHAPTER 5: Conclusions and Future Work Dielectric Barrier Discharge plasma actuators have been used to actively control flow over high-lift airfoils and have been shown to increase control authority by augmenting lift and delayingseparation of flow over the shoulder of a simple deflected flap. This study was an exploration inthe effectiveness of multiple DBD plasma actuators on a simplified NASA EET high-lift airfoilwhen operated at Re=240,000, 20° flap deflection and 0° angle of attack. Previous work of Littlehas shown that a single actuator at x/c=0.775 is capable of slightly delaying flow separation(2010). The location of the actuators has an effect on the degree of lift enhancement and flowcontrol. It was found that the most effective configuration incorporated an actuator at theoptimal location as determined by Little (2008) with a second actuator located upstream atx/c=0.675.The actuators were operated with unsteady actuation (BM), which reduces powerrequirements and resulted in higher lift than steady actuation. Experimental results suggest thatthe actuators be operated in-phase with each other, but theoretically, there should be some phasedelay due to physical separation. When the device was operated in-phase, the flow stillseparated on the flap, but the shear layer was pulled closer to the flap when compared to abaseline case (uncontrolled). The wake ofthe in-phase multiple actuator is very similar to that ofjust a single actuator located at x/c=0.775, but there is a larger suction peak at the leading edgefor the in-phase actuation. This suction peak is a result of increased circulation around the airfoiland more flow turning over the flap shoulder which indicates an increase in control authority.Based on this result, minimal effects at the trailing edge can have a larger effect on the lift of theairfoil due to increased circulation. Experiments were limited due to the size, strength and instrumentation of the airfoil. Alarger airfoil would be advantageous to better understanding the effects of separation distancehas on actuators.. A larger airfoil would scale down the required separation distance betweenactuators relative to the chord length of the airfoil. A more robust airfoil would permit higherspeed tests that better simulate lift-off conditions. The current airfoil incorporates static pressuretaps for measurements, but taps located between x/c=0.6 and x/c=0.825 were covered by theactuators.. As a result, the lift reported is an underestimation because actuation increases theattachment of the flow and increases suction peaks along the trailing edge flap (Melton, Yao etal. 2004). The use of hot-film sensors would allow for detection of flow separation in this area,and they would not disrupt plasma generation (Poggie, Tilmann et al. 2010). The actuators couldbe optimized such that the electrodes and dielectric layer are more capable of operating under ahigher voltage input (Thomas, Corke et al.2009). REFERENCES Cerchie, D., E. Halfron, et al. (2006). Some Circulation and Separation Control Experiments. Applicationsof Circulation Control Technology. R. Joslin and G. Jones. Reston, VA, AIAA Inc.214:113-165. Corke, T., M. Post, et al. (2007). "SDBD plasma enhanced aerodynamics: concepts, optimization andapplications." Progress in Aerospace Sciences 43(8):193-217. Dabiri, D.(2009). "Digital Particle Image Thermometry/Velocimetry: A Review." Experiments in Fluids46(2):191-241. Do, H., W. Kim, et al. (2008). "Cross-talk in multiple dielectric barrier discharge actuators." AppliedPhysics Letters 92(7):071504-071504-071503. Enloe, C. L., T. E. McLaughlin, et al. (2004). "Mechanisms and Responses of a Single Dielectric BarrierPlasma Actuator: Geometric Effects." AIAA Journal 42(3):595-604. Forte, M., J. Jolibois, et al.(2006)."Optimization of a Dielectric Barrier Discharge Actuator by Stationaryand Non-stationary Measurements of the Induced Flow Velocity-Application to." 3rd AIAA Flow Control2006-2863:10. Ganapathisubramani, B., N. T.Clemens, et al. (2006). "Large-Scale Motions in a Supersonic TurbulentBoundary Layer."Journal of Fluid Mechanics 556:271-282. Greenblatt, D., B. Goksel, et al. (2008)."Dielectric Barrier Discharge Flow Control at Very Low FlightReynolds Numbers." AIAA Journal 46(6): 1528-1541. Greenblatt, D. and I. J. Wygnanski (2000). "The control of flow separation by periodic excitation."Progress in Aerospace Sciences 36(7): 487-545. Huang, J., T. C. Corke, et al. (2006)."Unsteady Plasma Actuators for Separation Control of Low-PressureTurbine Blades." AIAA Journal 44(7): 1477-1487. Kiedaisch, J., H. Nagib, et al. (2006). Active Flow Control Applied to High-Lift Airfoils Utilizing SimpleFlaps. AIAA 3rd Flow Control Conference. AIAA Paper. Little, J. (2010)."High-Lift Airfoil Separation Control with Dielectric Barrier Discharge Plasma ActuatorsDissertation." Little, J., M. Nishihara, et al. (2008). Separation Control from the Flap of a High-Lift Airfoil using DBDPlasma Actuation. AIAA 4th Flow Control Conference. AIAA Paper: 19. Little, J., M. Nishihara, et al. (2009). Separation Control from the Flap of a High-Lift Airfoil using DBDPlasma Actuators. AIAA 47th Aerospace Sciences Meeting. AIAA Paper: 17. Mabe, J., F. Calkins, et al. (2009). "Single Dielectric Barrier Discharge Plasma Actuators for ImprovedAirfoi Performance." Journal of Aircraft 46(3):847-855. Mabe, J. H., F. T. Calkins, et al. (2007). "On the Use of Single Dielectric Barrier Discharge PlasmaActuators for Improving the Performance of Airfoils." 37th AIAA 2007-3972: 17. Melton, L. P., N. W. Schaeffler, et al. (2007). "High-Lift System for a Supercritical Airfoil: Simplified byActive Flow Control."45th AIAA 2007-707:20. Melton, L. P., C.-S. Yao, et al.(2006). "Active Control of Separation from the Flap of a SupercriticalAirfoil." AIAA Journal 44(1):34-41. Melton, L. P., C. S. Yao, et al. (2004)."Application of Excitation from Multiple Locations on a SimplifiedHigh-Lift System." AIAA 2004-2324: 14. Poggie, J., C. Tilmann, et al. (2010). Closed-Loop Stall Control on a Morphing Airfoil Using Hot-FilmSensors and DBD Actuators. AIAA 48th Aerospace Sciences Meeting. AIAA Paper: 1-19. Seifert, A., A. Darabi, et al. (1996). "Delay of Airfoil Stall by Periodic Excitation." Journal of Aircraft 33(4):691-698. Thomas, F., T. Corke, et al. (2009). "Optimization of Dielectric Barrier Discharge Plasma Actuators forActive Aerodynamic Flow Control." AIAA Journal 47(9): 2169-2178. ii ii
确定


还剩50页未读,是否继续阅读?

产品配置单

北京欧兰科技发展有限公司为您提供《离子体中制动器控制高升力翼型下弯襟翼的流动分离检测方案(粒子图像测速)》,该方案主要用于其他中制动器控制高升力翼型下弯襟翼的流动分离检测,参考标准--,《离子体中制动器控制高升力翼型下弯襟翼的流动分离检测方案(粒子图像测速)》用到的仪器有德国LaVision PIV/PLIF粒子成像测速场仪
推荐专场


相关方案
更多
该厂商其他方案
更多