


方案详情
文
相位多普勒干涉测量术探测区域和粒子粒径比值小于一(第二部分 该技术的应用)。采用最新型的DPSSL激光器取代传统的氩离子激光器,具有光束相干性好,干涉条纹对比度强,测量精度和数据有效率高,调试简单快捷的突出优点。
方案详情

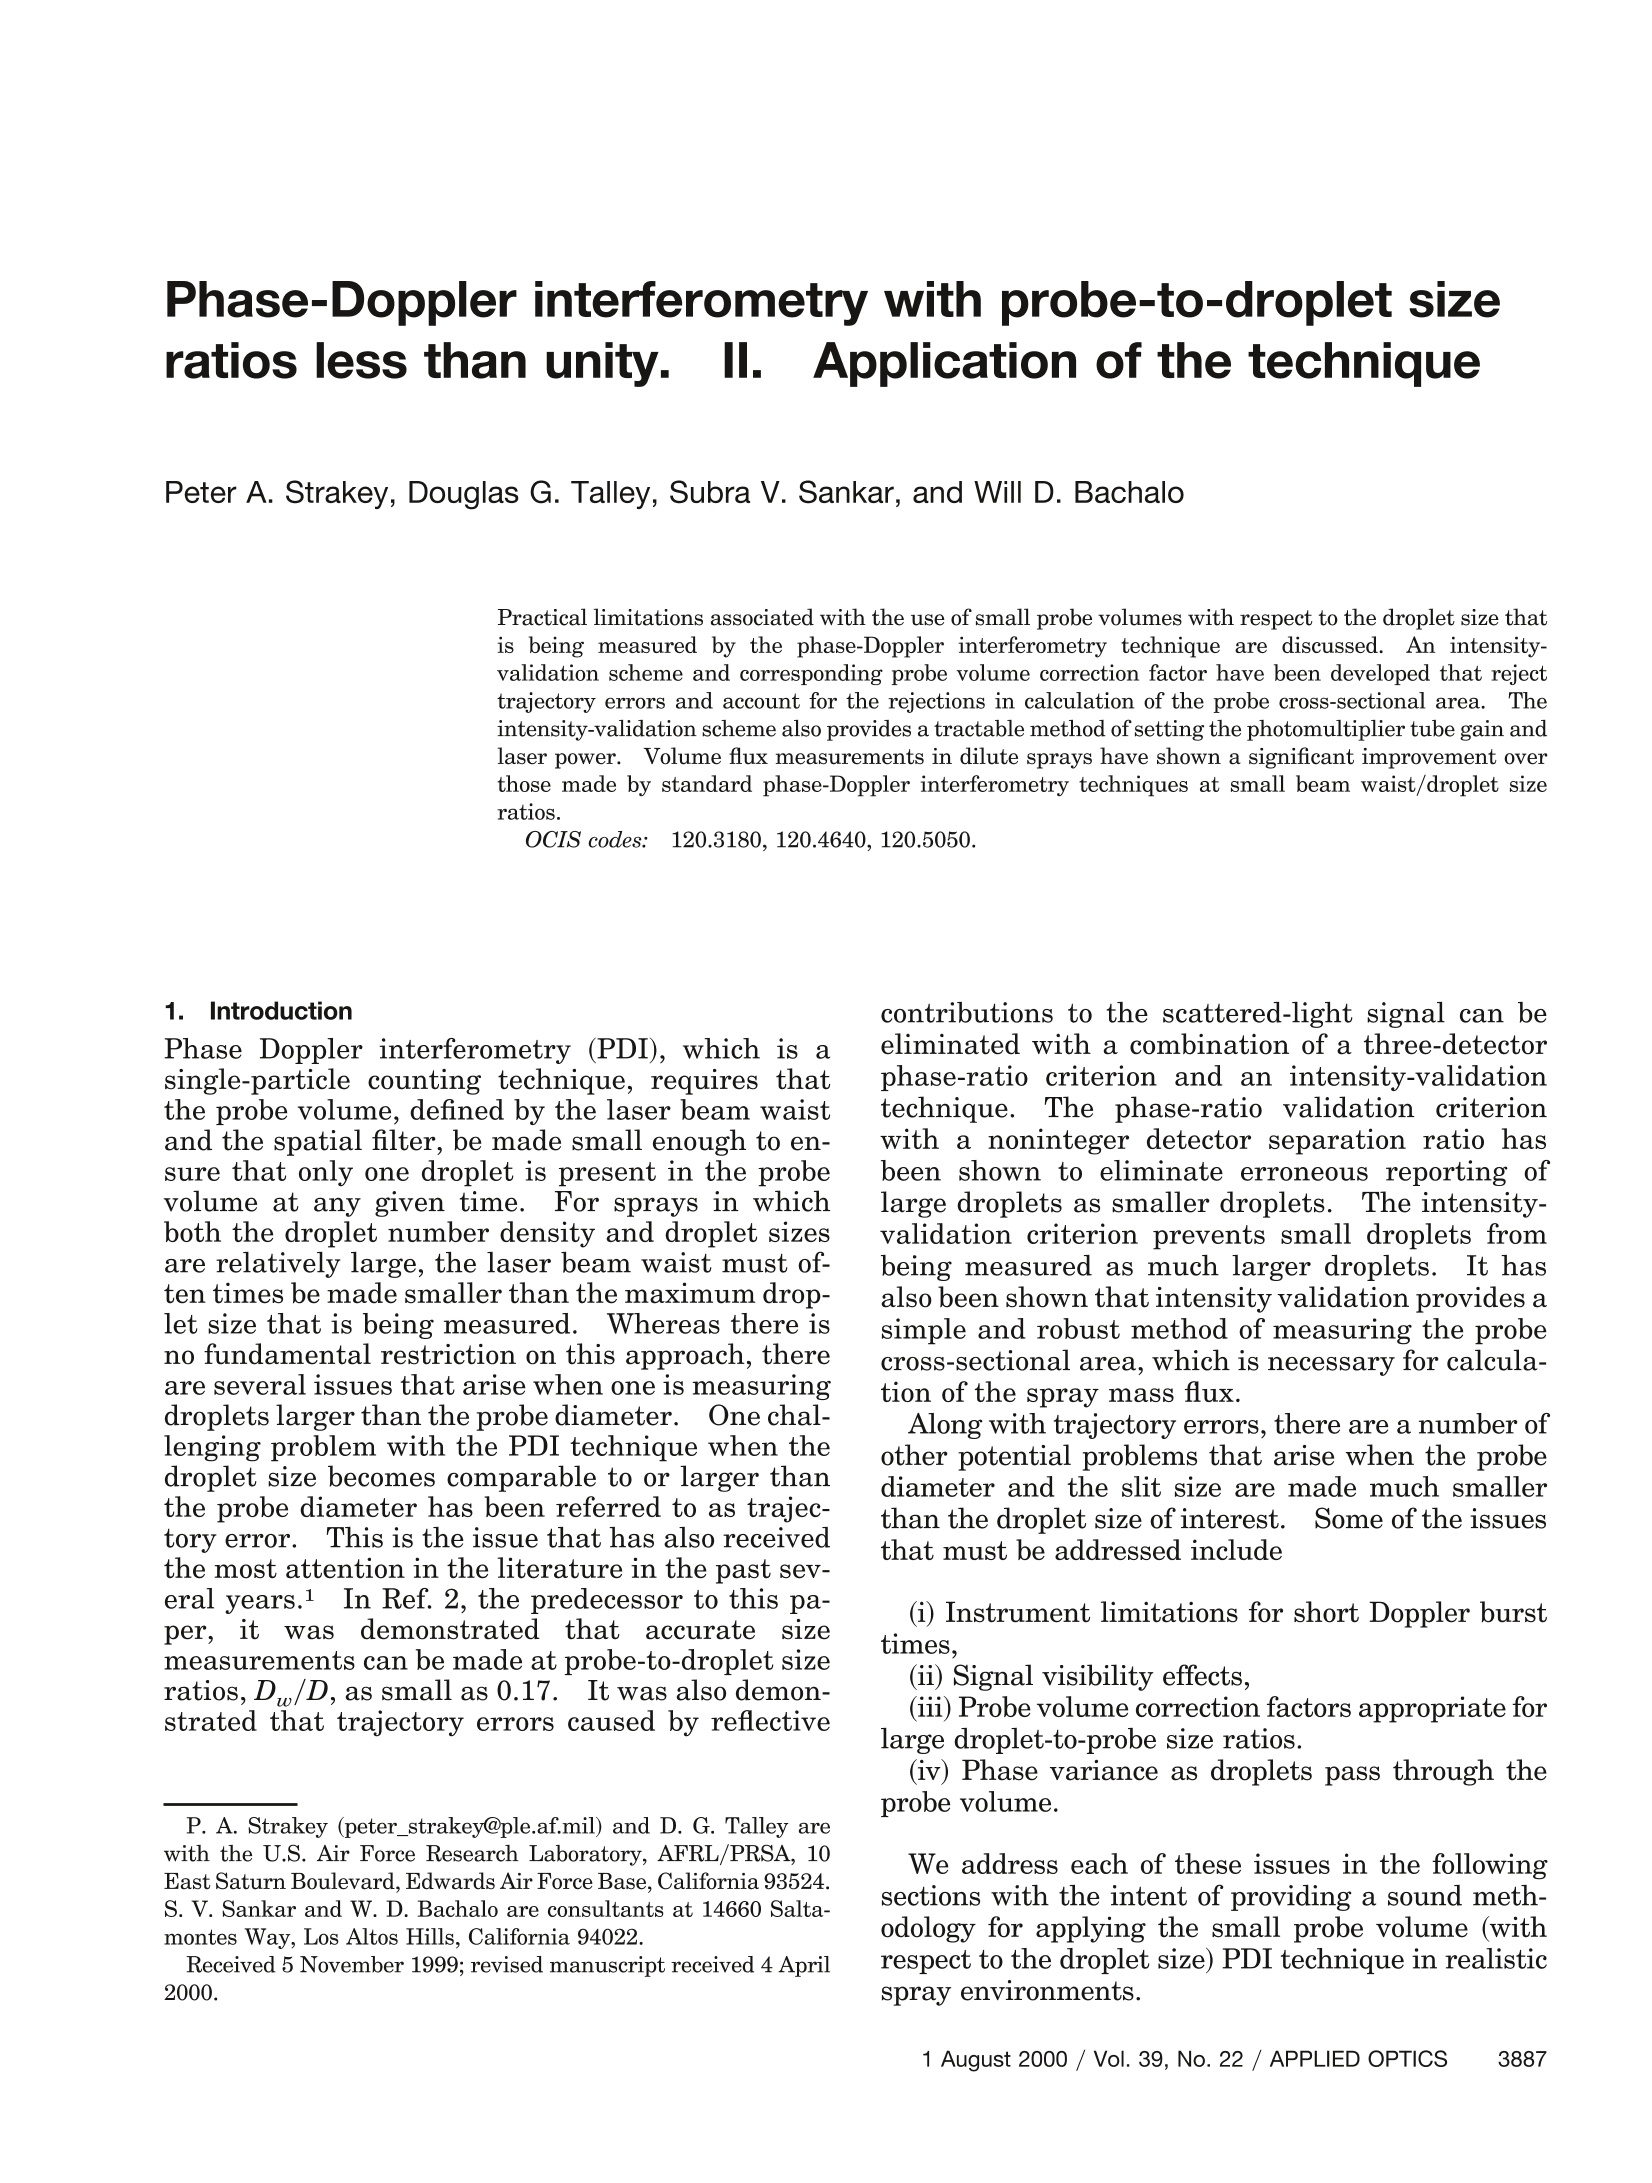
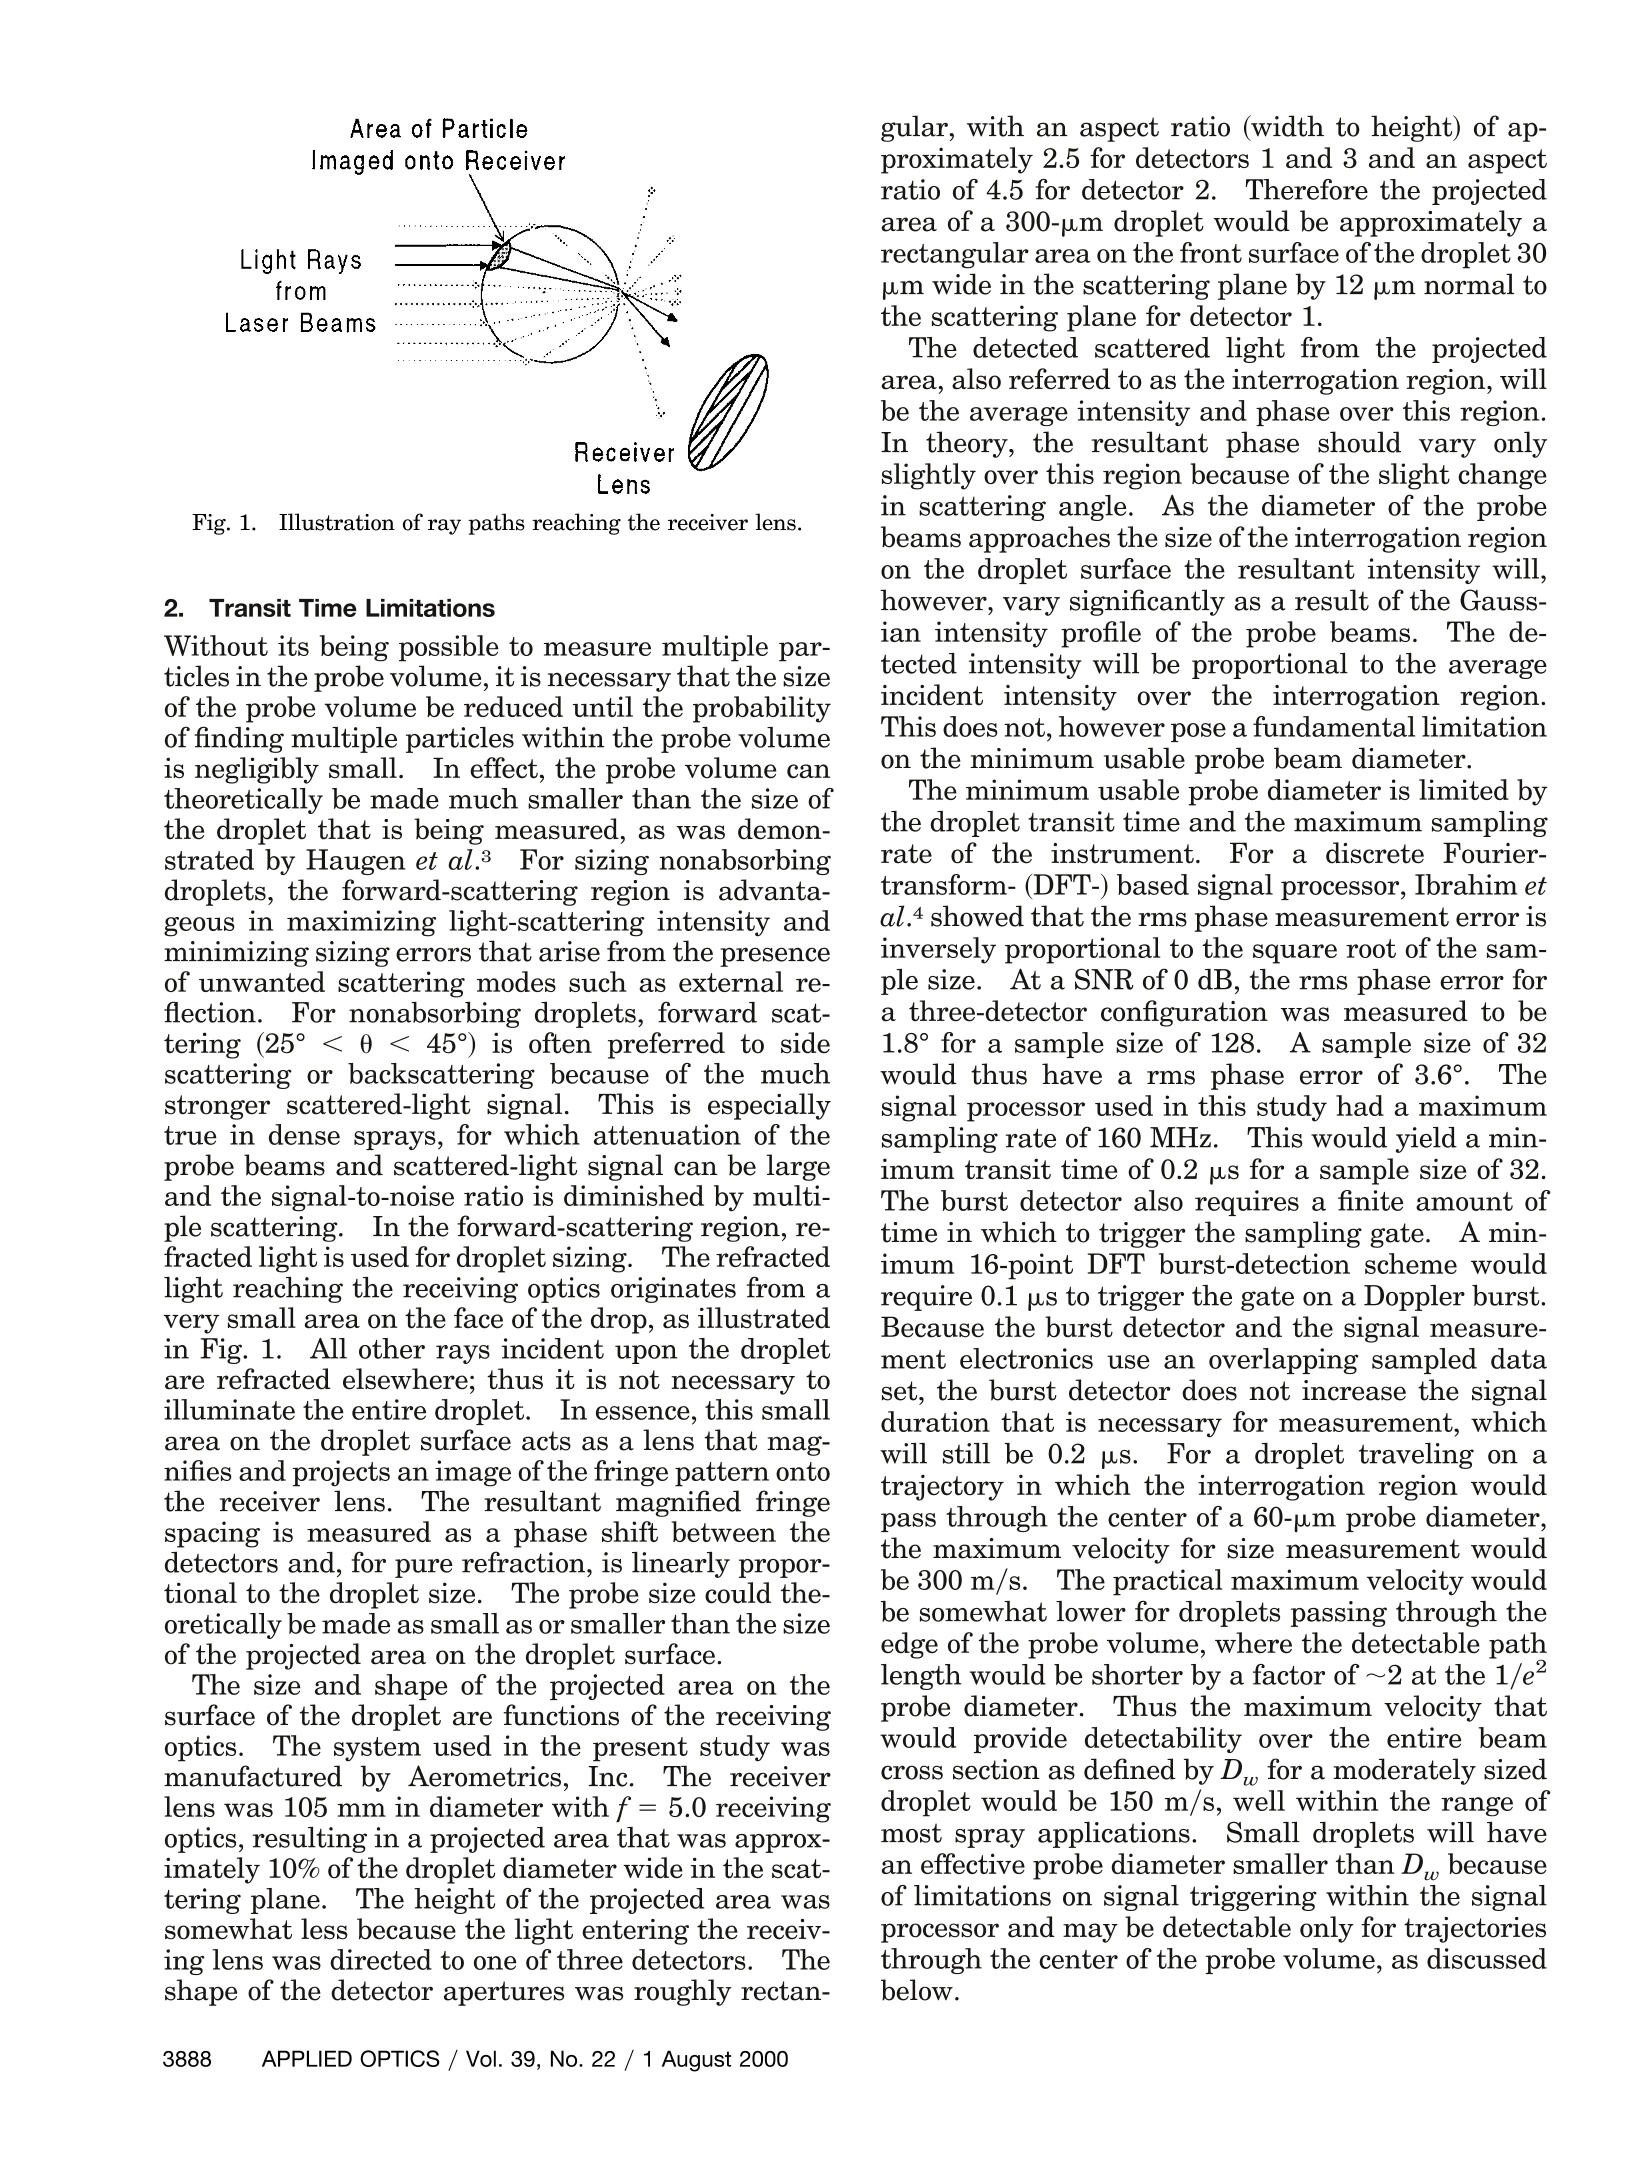
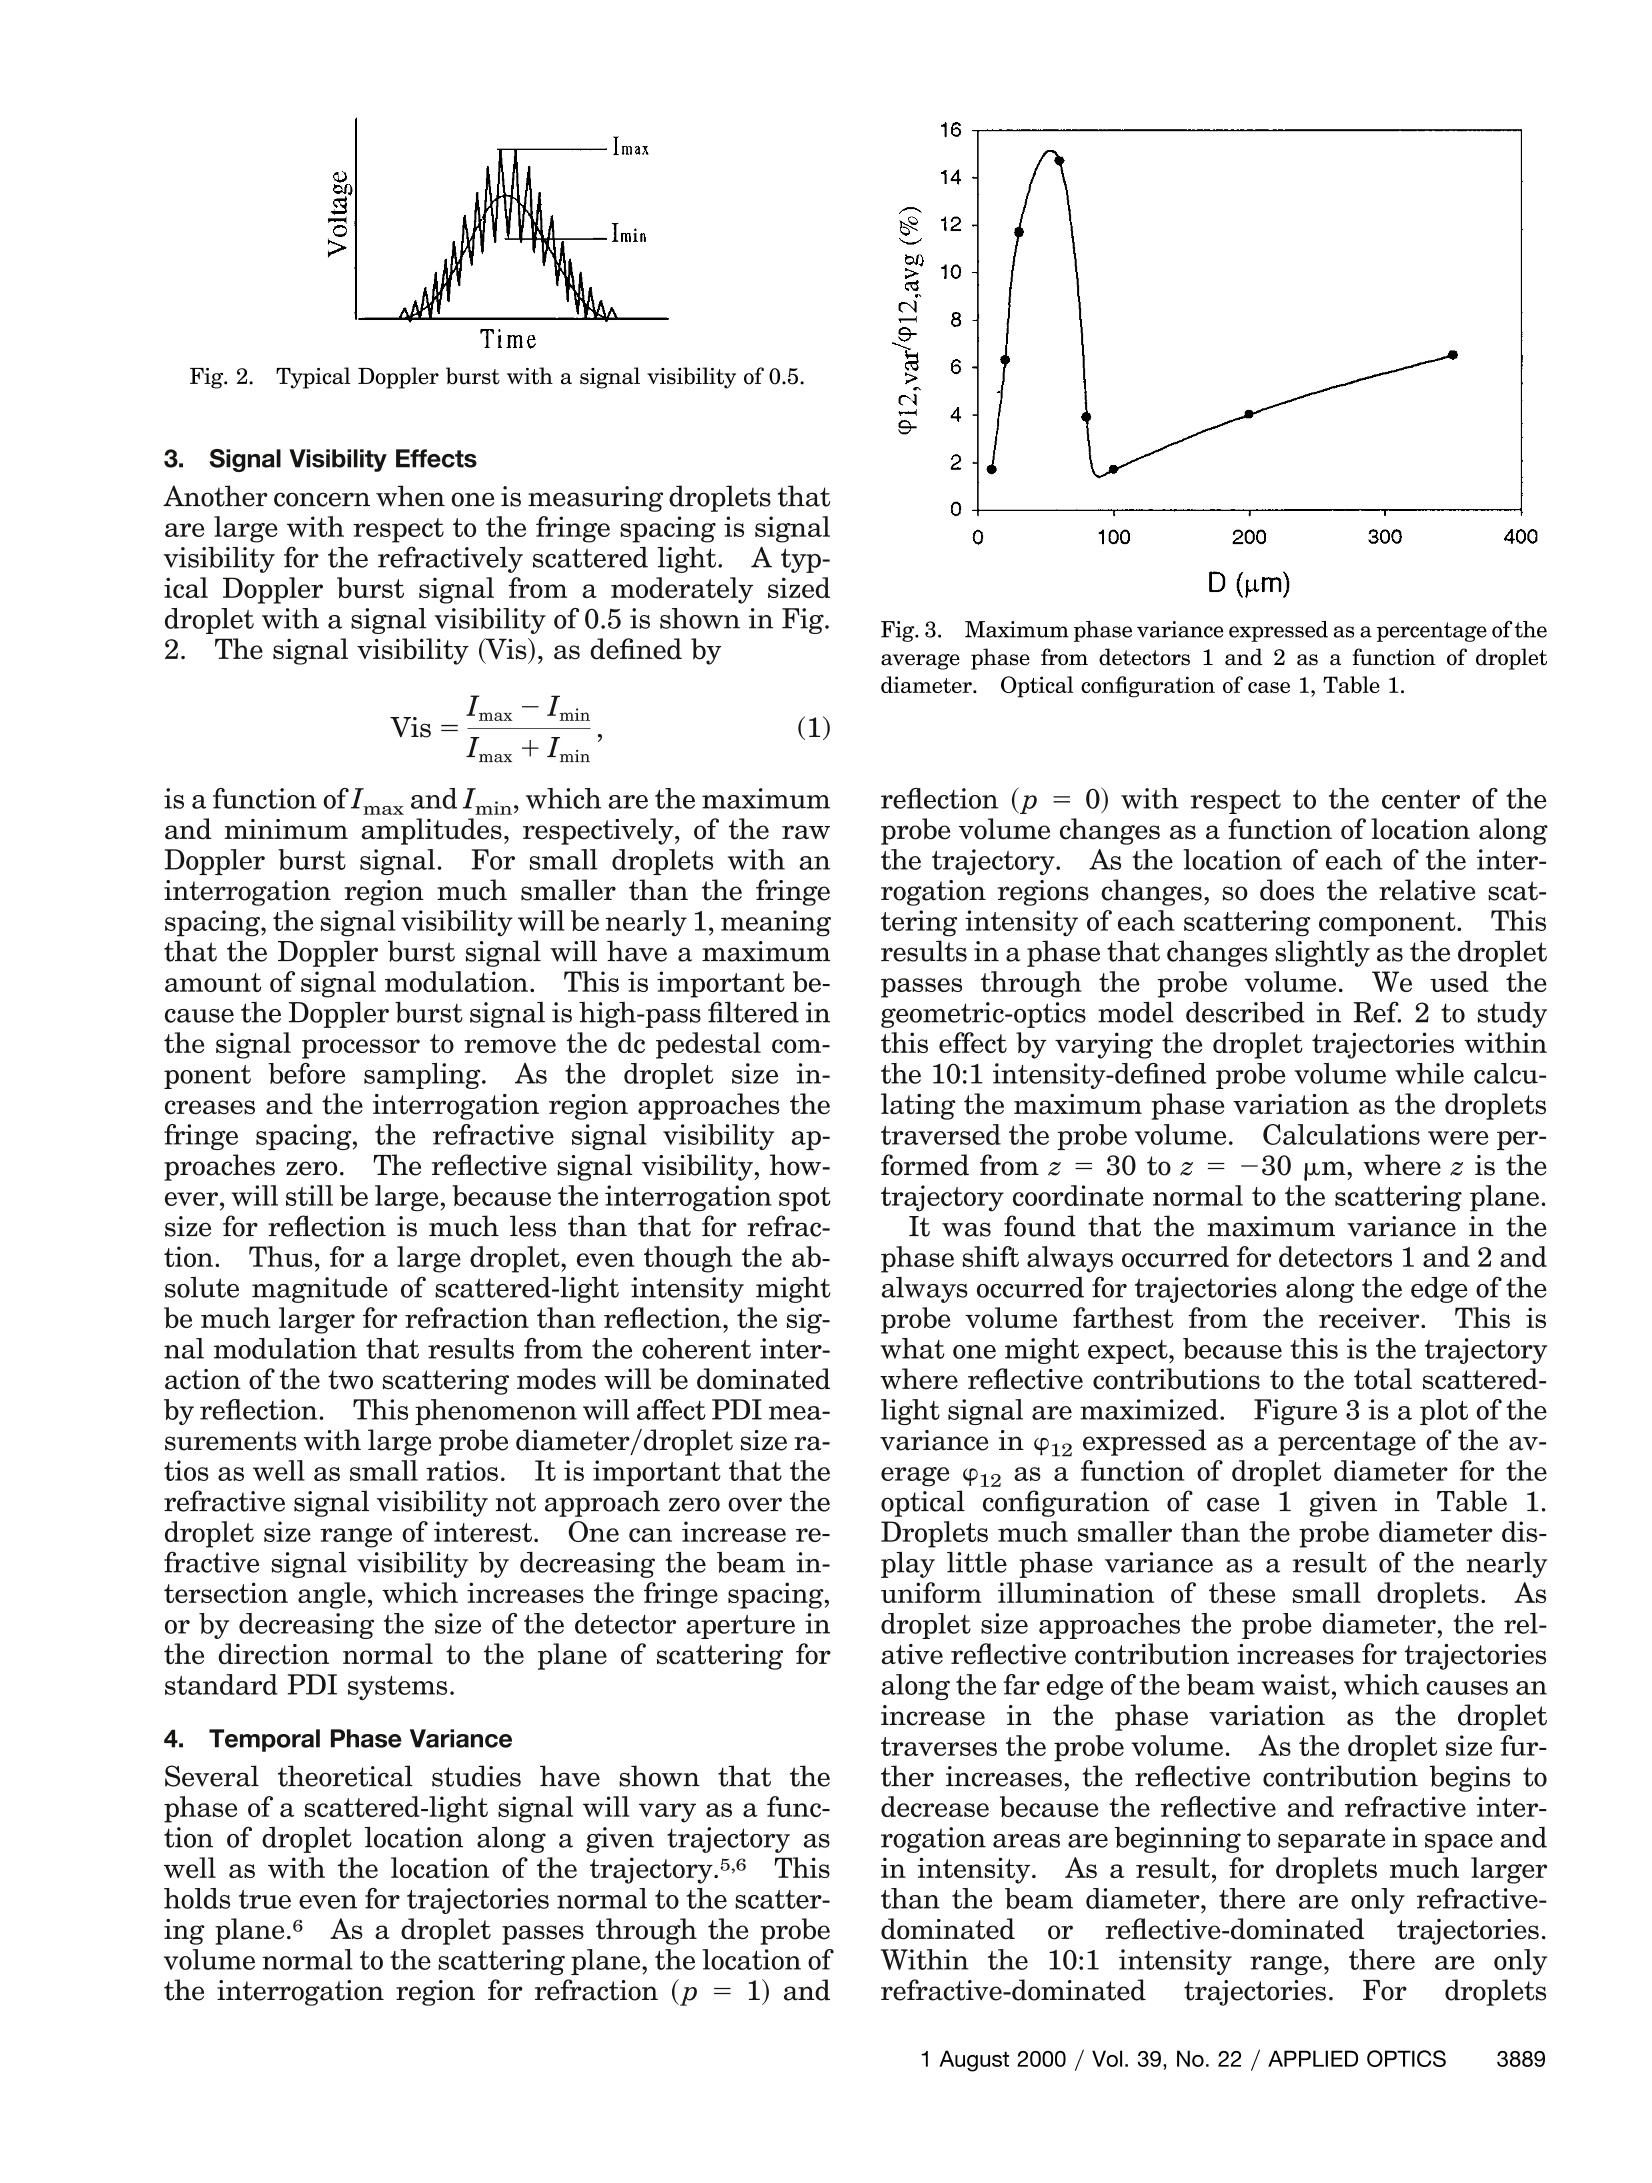
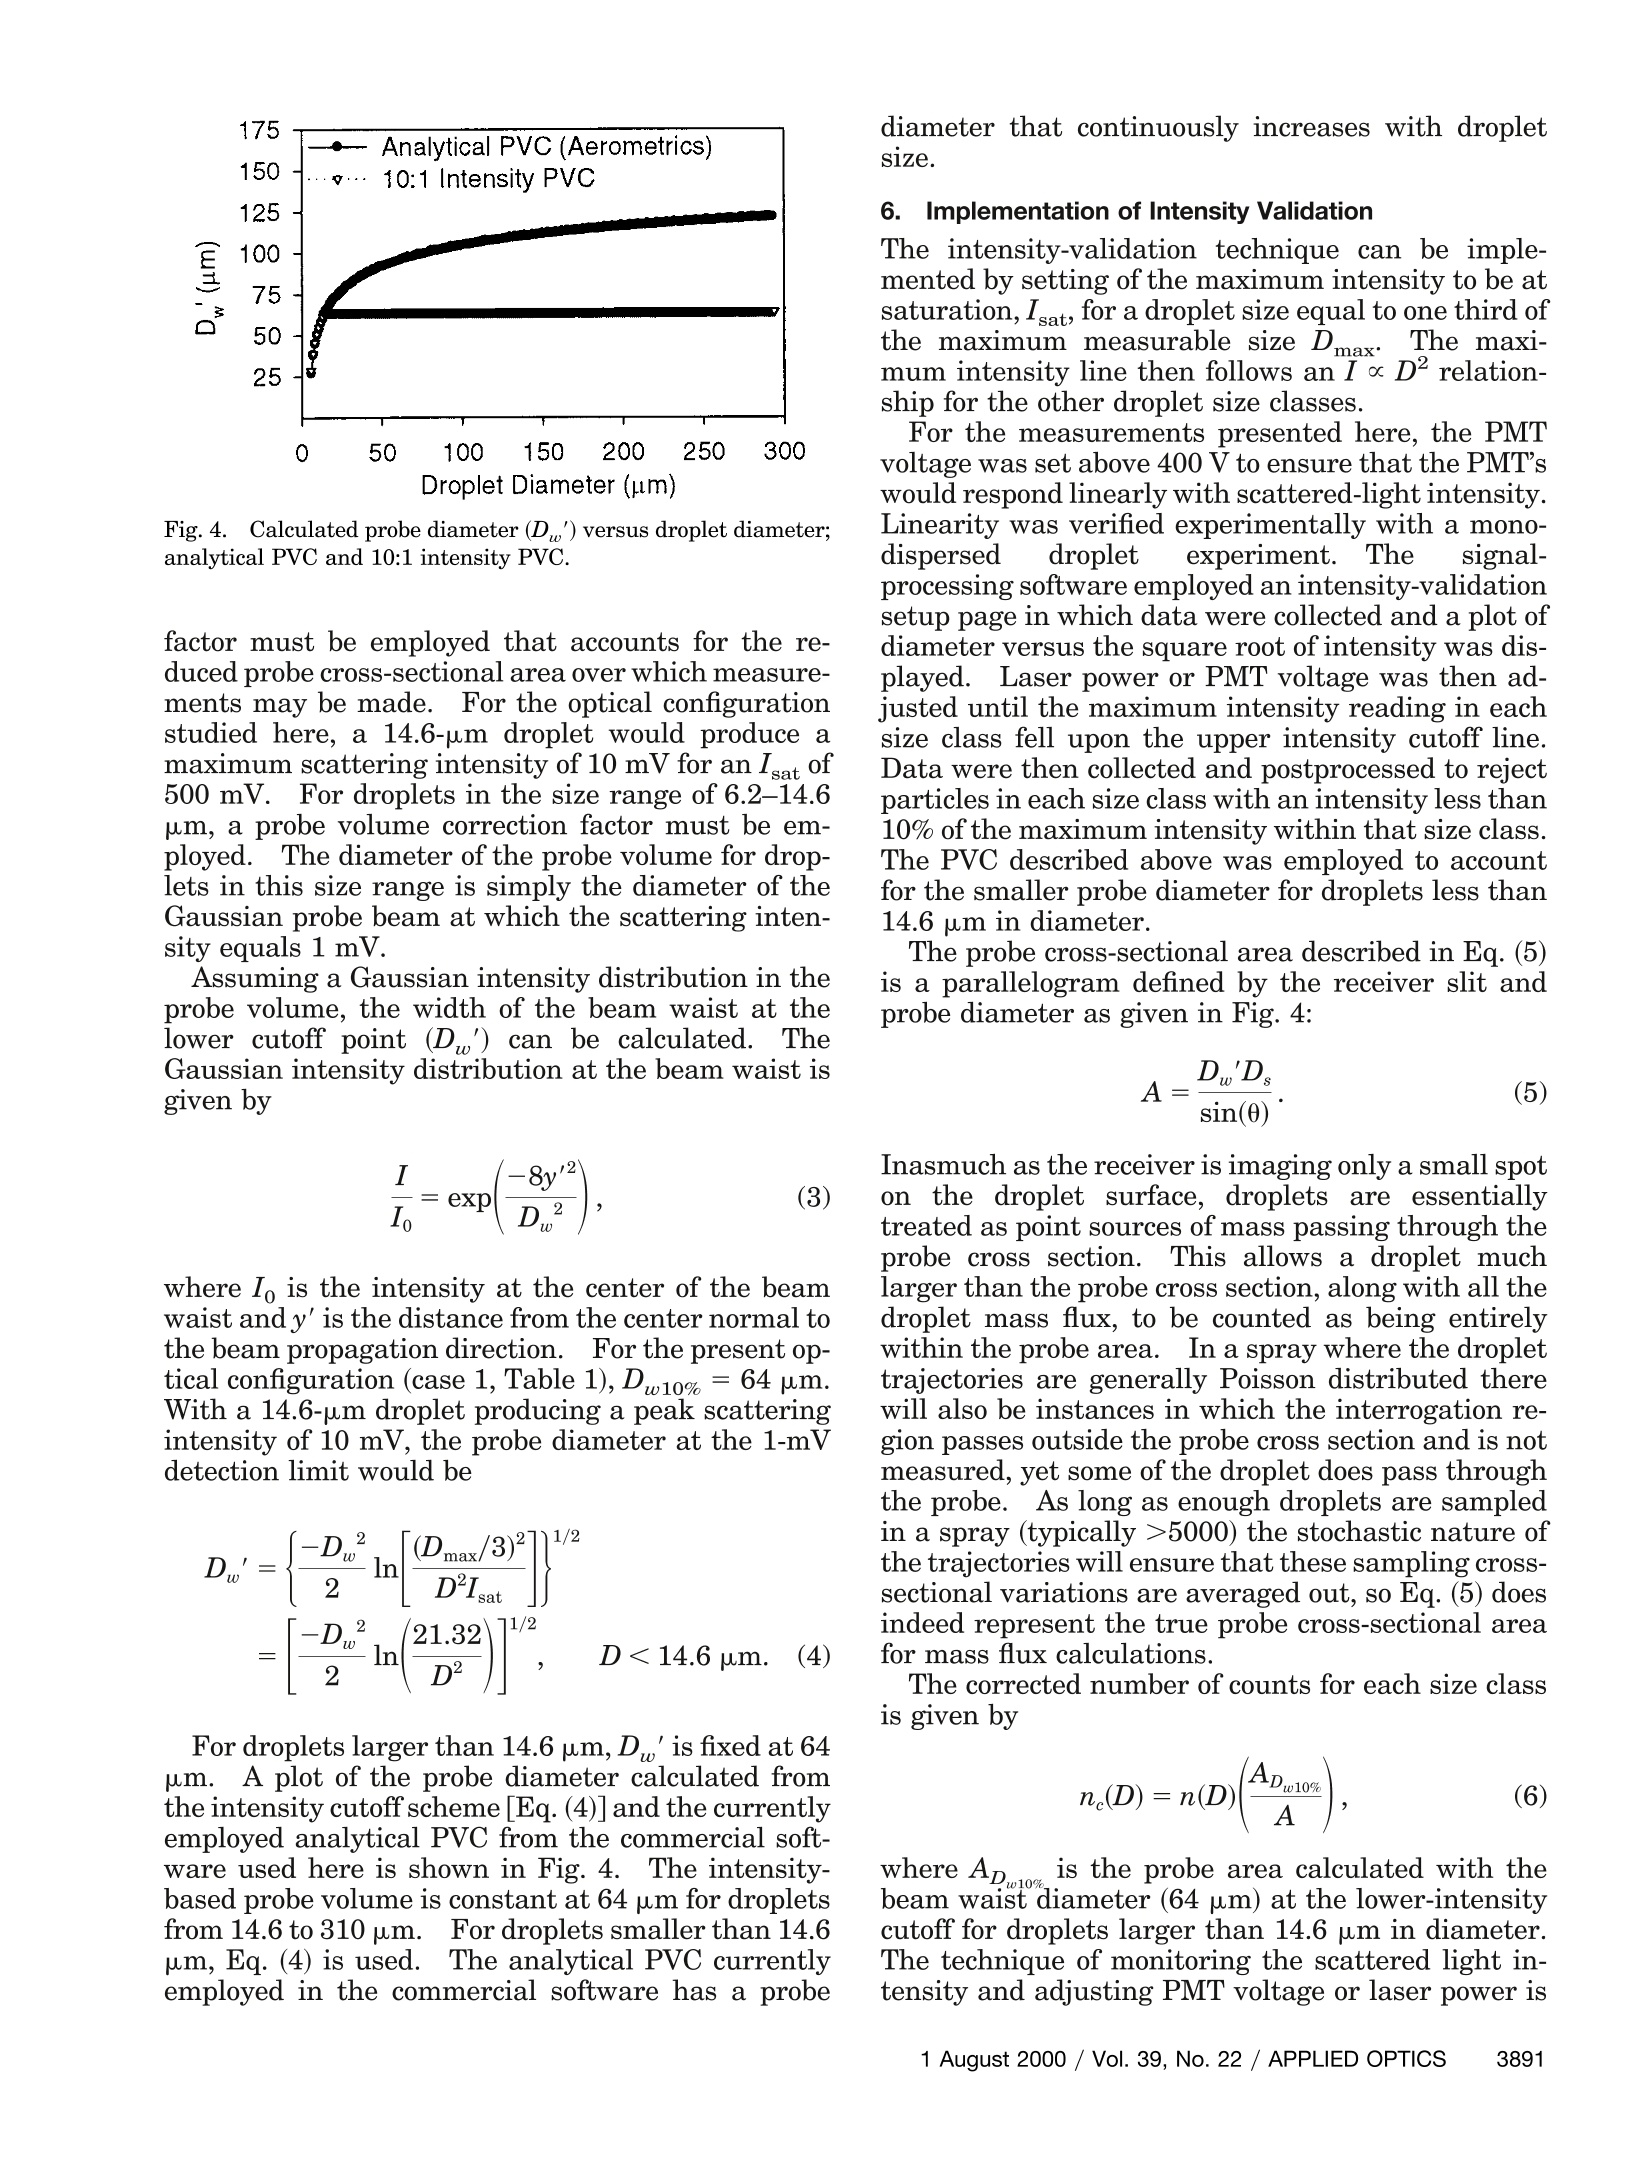
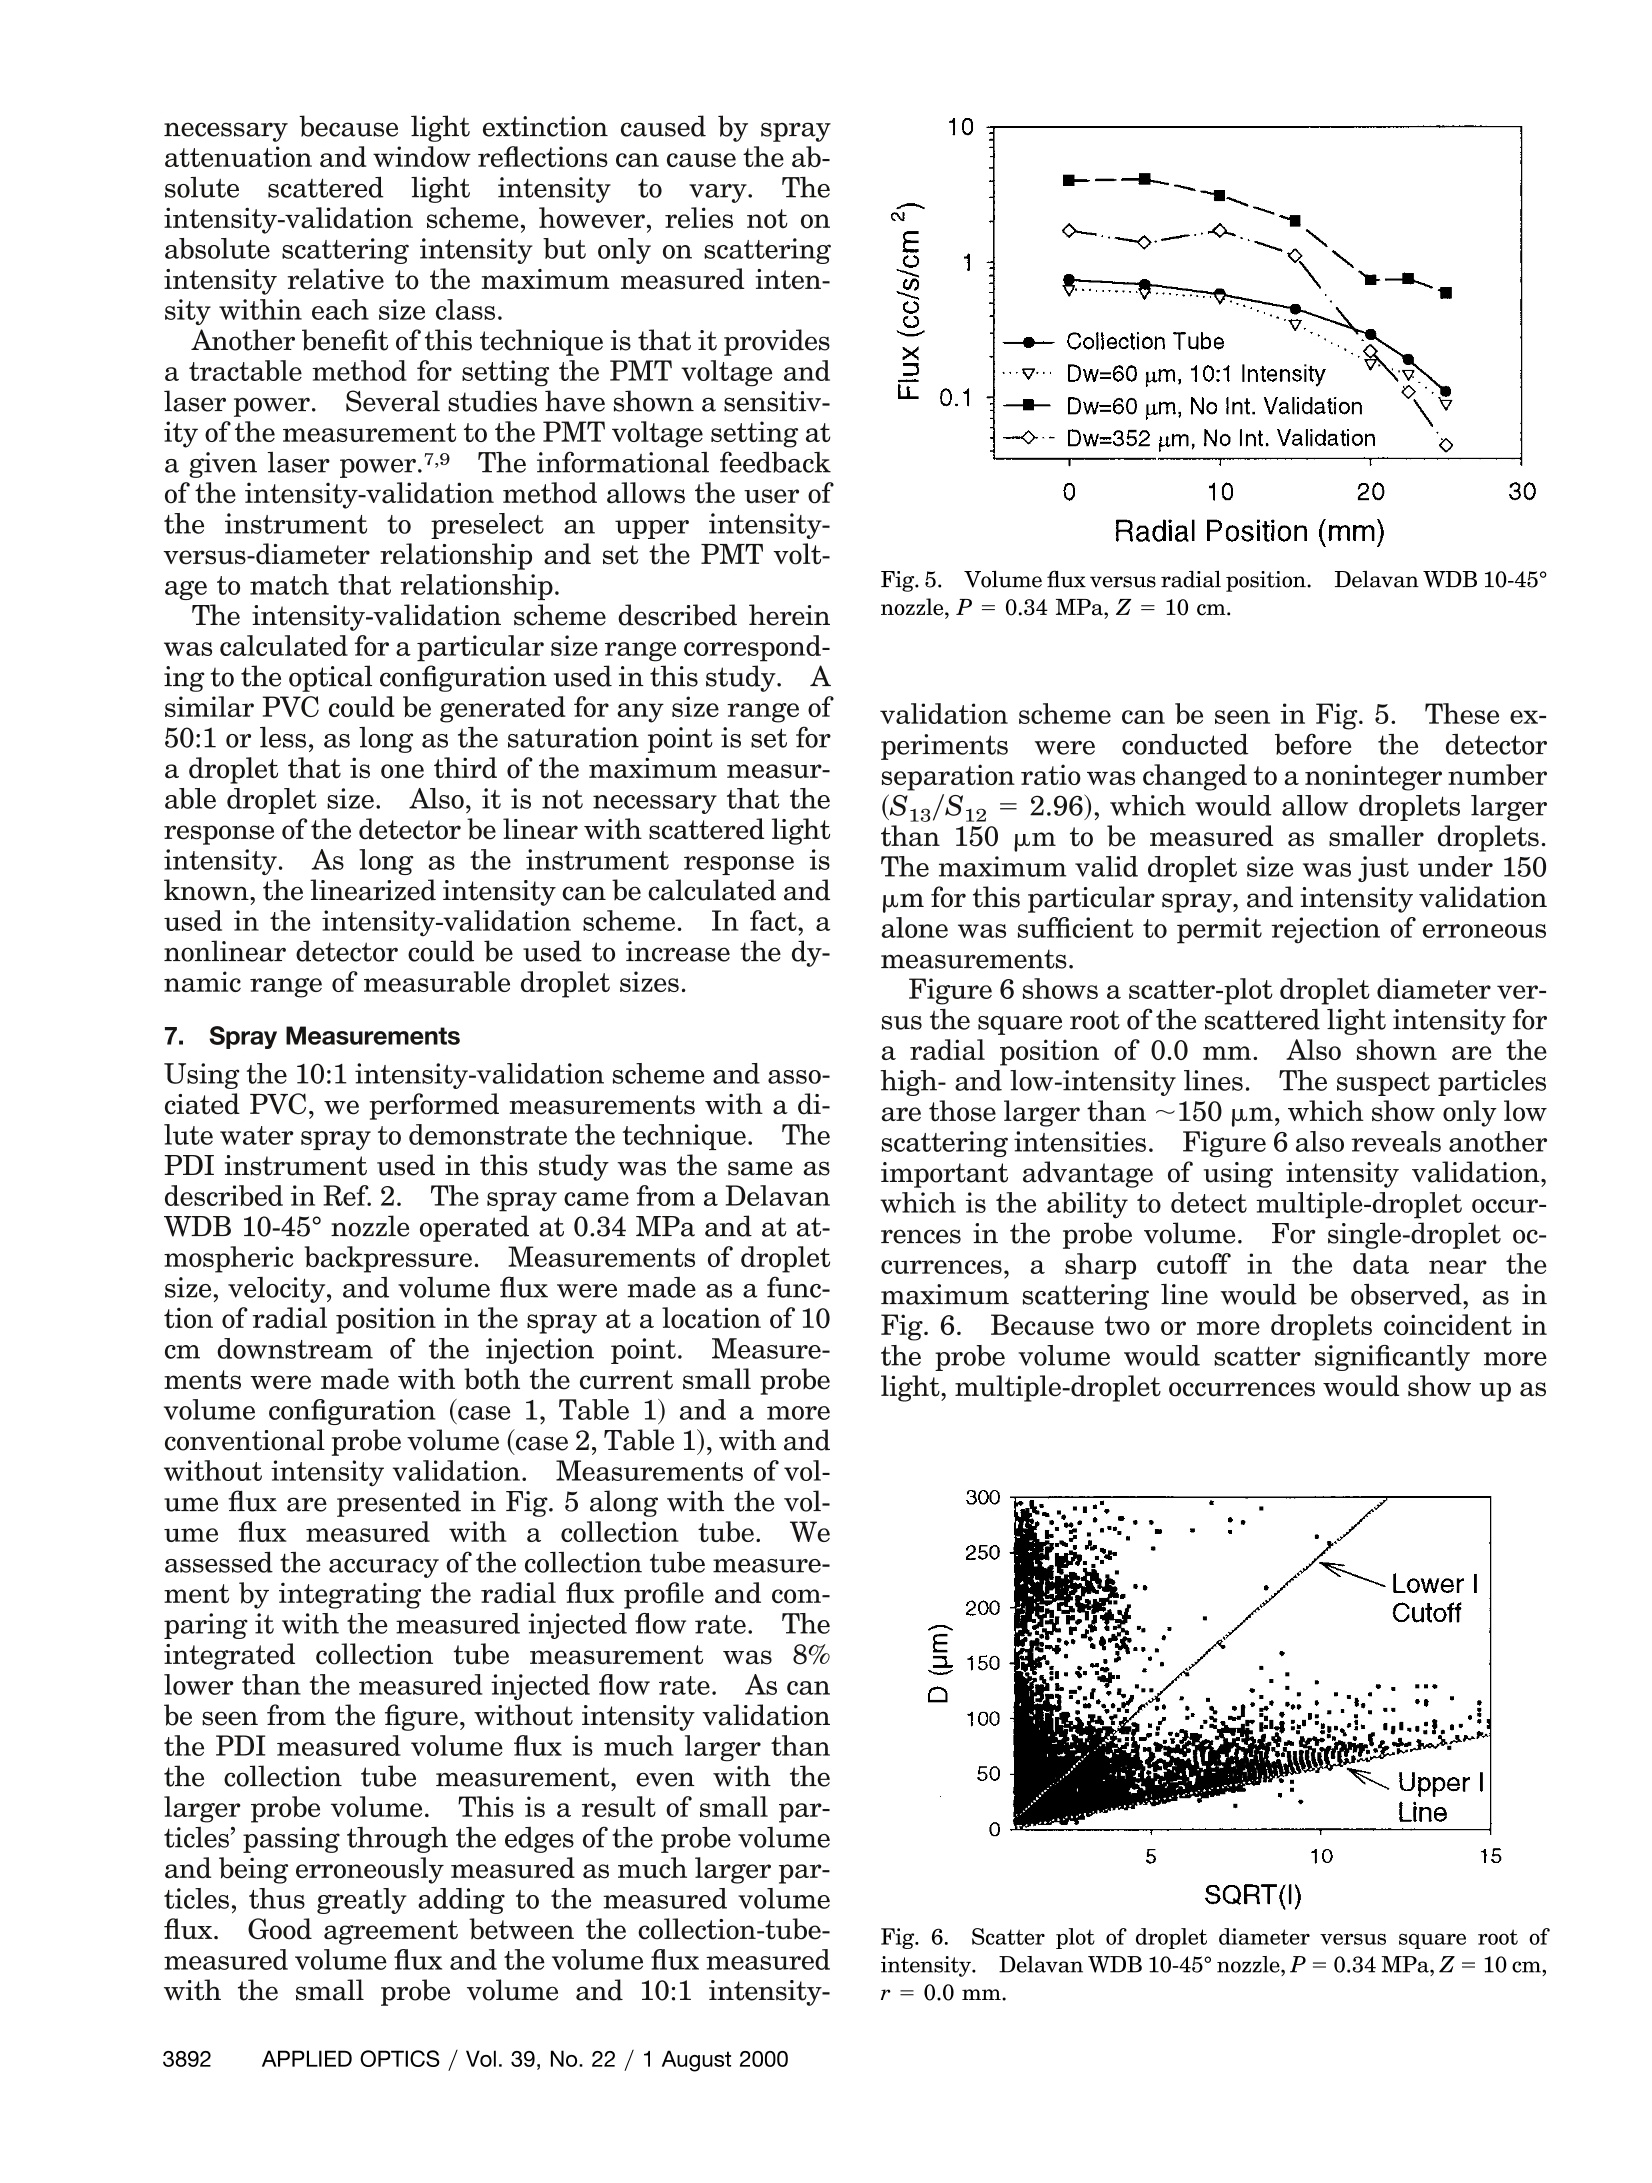
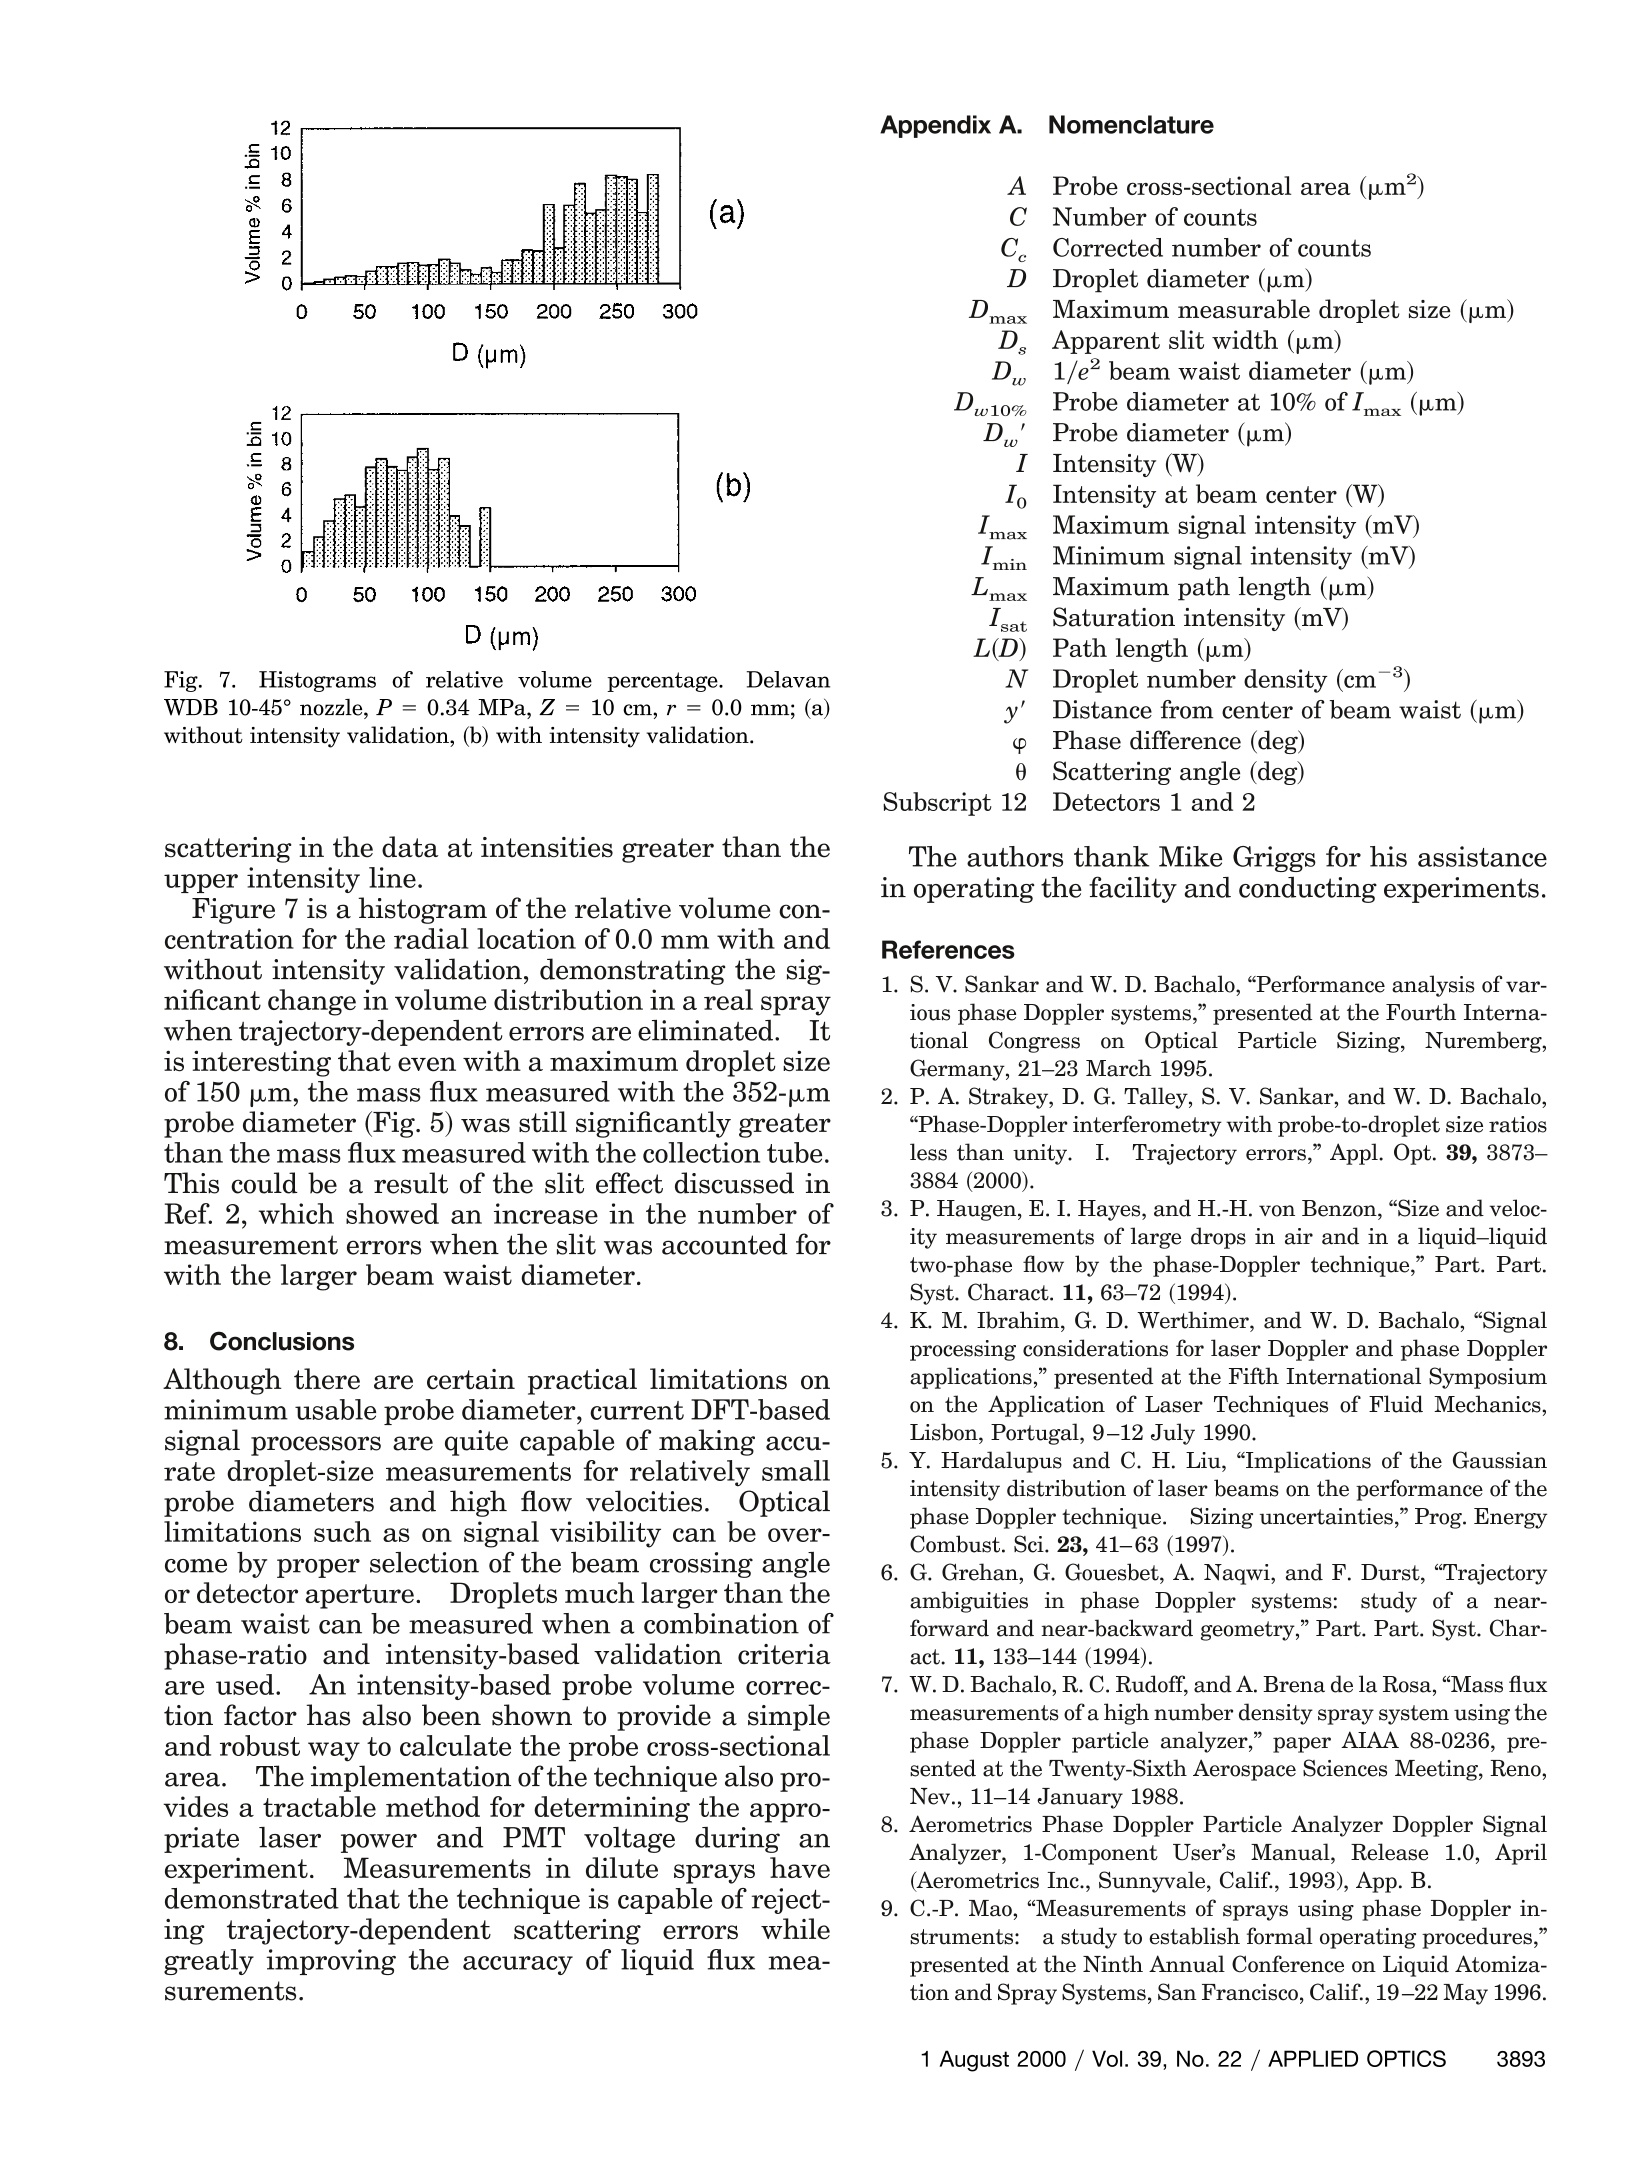
Phase-Doppler interferometry with probe-to-droplet sizeratios less than unity. ll.Application of the technique Peter A. Strakey, Douglas G. Talley, Subra V. Sankar, and Will D. Bachalo Practical limitations associated with the use of small probe volumes with respect to the droplet size thatis being measured by the phase-Doppler interferometry technique are discussed. An intensity-validation scheme and corresponding probe volume correction factor have been developed that rejecttrajectory errors and account for the rejections in calculation of the probe cross-sectional area.Theintensity-validation scheme also provides a tractable method of setting the photomultiplier tube gain andlaser power. Volume flux measurements in dilute sprays have shown a significant improvement overthose made by standard phase-Doppler interferometry techniques at small beam waist/droplet sizeratios. OCIS codes: 120.3180,120.4640,120.5050. 1..Introduction Phase Doppler interferometry (PDI), which is asingle-particle counting technique, requires thatthe probe volume, defined by the laser beam waistand the spatial filter, be made small enough to en-sure that only one droplet is present in the probevolume at any given time. For sprays in whichboth the droplet number density and droplet sizesare relatively large, the laser beam waist must of-ten times be made smaller than the maximum drop-let size that is being measured.. Whereas there isno fundamental restriction on this approach, thereare several issues that arise when one is measuringdroplets larger than the probe diameter. One chal-lenging problem with the PDI technique when thedroplet size becomes comparable to or larger thanthe probe diameter has been referred to as trajec-tory error. This is the issue that has also receivedthe most attention in the literature in the past sev-eral years. In Ref. 2, the predecessor to this pa-per,iit was demonstrated1that accurateessizemeasurements can be made at probe-to-droplet sizeratios,D,,/D, as small as 0.17. It was also demon-strated that trajectory errors caused by reflective ( P . A. Strakey ( p eter _ strakey@ple.af.mil) a n d D. G. Ta l ley are with the U.S. Air Force Research Laboratory, AFRL/PRSA, 10 East Saturn Boulevard, Edwards Air Force Base, California 93524.S. V. Sankar and W.D. Ba c halo are consultants at 14 6 60 Salta- montes Way, Los Altos Hills, C alifornia 94022. ) ( Received 5 November 1999;revised manuscript received 4 April 2000. ) contributions to the scattered-light signal can beeliminated with a combination of a three-detectorphase-ratio criterion and an intensity-validationtechnique.The phase-ratio validation criterionwith a noninteger detector separation ratio hasbeen shown to eliminate erroneous reporting oflarge droplets as smaller droplets. The intensity-validation criterion prevents small droplets frombeing measured as much larger droplets.It hasalso been shown that intensity validation provides asimple and robust method of measuring the probecross-sectional area, which is necessary for calcula-tion of the spray mass flux. Along with trajectory errors, there are a number ofother potential problems that arise when the probediameter and the slit size are made much smallerthan the droplet size of interest. Some of the issuesthat must be addressed include (i) Instrument limitations for short Doppler bursttimes. (ii) Signal visibility effects, (iii) Probe volume correction factors appropriate forlarge droplet-to-probe size ratios. (iv) Phase variance as droplets pass through theprobe volume. We address each of these issues in the followingsections with the intent of providing a sound meth-odology for applying the small probe volume (withrespect to the droplet size) PDI technique in realisticspray environments. Fig. 1...,Illustration of ray paths reaching the receiver lens. 2.Transit Time Limitations Without its being possible to measure multiple par-ticles in the probe volume, it is necessary that the sizeof the probe volume be reduced until the probabilityof finding multiple particles within the probe volumeis negligibly small. In effect, the probe volume cantheoretically be made much smaller than the size ofthe droplet that is being measured, as was demon-strated by Haugen et al.3For sizing nonabsorbingdroplets, the forward-scattering region is advanta-geous in maximizing light-scattering intensity andminimizing sizing errors that arise from the presenceof unwanted scattering modes such as external re-flection.For nonabsorbing droplets, forward scattering (25°< 0<45°) is often preferred to sidescattering or backscattering because of the muchstronger scattered-light signal. This is especiallytrue in dense sprays, for which attenuation of theprobe beams and scattered-light signal can be largeand the signal-to-noise ratio is diminished by multi-plescattering.IIn the forward-scattering region, re-fracted light is used for droplet sizing. The refractedlight reaching the receiving optics originates from avery small area on the face of the drop, as illustratedin Fig. 1. All other rays incident upon the dropletare refracted elsewhere; thus it is not necessary toilluminate the entire droplet. In essence, this smallarea on the droplet surface acts as a lens that mag-nifies and projects an image of the fringe pattern ontothe receiver lens.The resultant magnified fringespacing is measured as a phase shift between thedetectors and, for pure refraction, is linearly propor-tional to the droplet size. The probe size could the-oretically be made as small as or smaller than the sizeof the projected area on the droplet surface. The size and shape of the projected area on thesurface of the droplet are functions of the receivingopticss.. The system used in the present study wasmanufactured by Aerometrics, Inc. The receiverlens was 105 mm in diameter with f= 5.0 receivingoptics, resulting in a projected area that was approx-imately 10% of the droplet diameter wide in the scat-tering plane. The height of the projected area wassomewhat less because the light entering the receiv-ing lens was directed to one of three detectors. Theshape of the detector apertures was roughly rectan- gular, with an aspect ratio (width to height) of ap-proximately 2.5 for detectors 1 and 3 and an aspectratio of 4.5 for detector 2. Therefore the projectedarea of a 300-um droplet would be approximately arectangular area on the front surface of the droplet 30um wide in the scattering plane by 12 um normal tothe scattering plane for detector 1. The detected scattered light from the projectedarea, also referred to as the interrogation region, willbe the average intensity and phase over this region.In theory, the resultant phase should vary onlyslightly over this region because of the slight changein scattering angle. As the diameter of the probebeams approaches the size of the interrogation regionon the droplet surface the resultant intensity will,however, vary significantly as a result of the Gauss-ian intensity profile of the probe beams. The de-tected intensity will be proportional to the averageincident intensity over the interrogation region.This does not,however pose a fundamental limitationon the minimum usable probe beam diameter. The minimum usable probe diameter is limited bythe droplet transit time and the maximum samplingrate of the instrument. IFor a discrete Fourier-transform-(DFT-) based signal processor, Ibrahim etal.4showed that the rms phase measurement error isinversely proportional to the square root of the sam-ple size.At a SNR of 0 dB, the rms phase error fora three-detector configuration was measured to be1.8° for a sample size of 128.. A sample size of 32would thus have a rms phase error of 3.6°. Thesignal processor used in this study had a maximumsampling rate of 160 MHz.This would yield a minimum transit time of 0.2 us for a sample size of 32.The burst detector also requires a finite amount oftime in which to trigger the sampling gate.. A min-imum 16-point DFT burst-detection scheme wouldrequire 0.1 us to trigger the gate on a Doppler burst.Because the burst detector and the signal measure-ment electronics use an overlapping sampled dataset, the burst detector does not increase the signalduration that is necessary for measurement, whichwill still be 0.2 us.For a droplet traveling on atrajectory in which the interrogation region wouldpass through the center of a 60-um probe diameter,the maximum velocity for size measurement wouldbe 300 m/s.. The practical maximum velocity wouldbe somewhat lower for droplets passing through theedge of the probe volume, where the detectable pathlength would be shorter by a factor of~2 at the 1/eprobe diameter. Thus the mnaaxxiimmumU velocity thatwould provide detectability over the entire beamcross section as defined by D. for a moderately sizeddroplet would be 150 m/s, well within the range ofmost spray applications.SSmall droplets will havean effective probe diameter smaller than D,, becauseof limitations on signal triggering within the signalprocessor and may be detectable only for trajectoriesthrough the center of the probe volume, as discussedbelow. Fig. 2.Typical Doppler burst with a signal visibility of 0.5. 3. Signal Visibility Effects Another concern when one is measuring droplets thatare large with respect to the fringe spacing is signalvisibility for the refractively scattered light. A typ-ical Doppler burst signal from a moderately sizeddroplet with a signal visibility of 0.5 is shown in Fig.2.The signal visibility (Vis), as defined by is a function of Imax and Imin, which are the maximumand minimum amplitudes, respectively, of the rawDoppler burst signal. For small droplets aninterrogation region much smaller than the fringespacing, the signal visibility will be nearly 1, meaningthat the Doppler burst signal will have a maximumamount of signal modulation. This is important be-cause the Doppler burst signal is high-pass filtered inthe signal processor to remove the dc pedestal com-ponent before sampling.As the droplet size in-creases and the interrogation region approaches thefringe spacing, the refractive signal visibility ap-proaches zero. The reflective signal visibility, how-ever, will still be large, because the interrogation spotsize for reflection is much less than that for refrac-tion. Thus, for a large droplet, even though the ab-solute magnitude of scattered-light intensity mightbe much larger for refraction than reflection, the signal modulation that results from the coherent inter-action of the two scattering modes will be dominatedby reflection. This phenomenon will affect PDI mea-surements with large probe diameter/droplet size ra-tios as well as small ratios.It is important that therefractive signal visibility not approach zero over thedroplet size range of interest. One can increase refractive signal visibility by decreasing the beam in-tersection angle, which increases the fringe spacing,or by decreasing the size of the detector aperture inthe direction normal to the plane of scattering forstandard PDI systems. 4..Temporal Phase Variance Several theoretical studies have shown that thephase of a scattered-light signal will vary as a func-tion of droplet location along a given trajectory aswell as with the location of the trajectory.5,6Thisholds true even for trajectories normal to the scatter-ing plane.As a droplet passes through the probevolume normal to the scattering plane, the location ofthe interrogation region for refraction (p =1) and Fig. 3. Maximum phase variance expressed as a percentage of theaverage phase from detectors 1 and 2 as a function of dropletdiameter.Optical configuration of case 1, Table 1. reflection (p=0) with respect to the center of theprobe volume changes as a function of location alongthe trajectory. As the location of each of the inter-rogation regions changes, so does the relative scat-tering intensity of each scattering component. Thisresults in a phase that changes slightly as the dropletpasses through the probe volume. We used thegeometric-optics model described in Ref. 2 to studythis effect by varying the droplet trajectories withinthe 10:1 intensity-defined probe volume while calcu-lating the maximum phase variation as the dropletstraversed the probe volume.九.Calculations were per-formed fromz=30 toz=-30 um, where z is thetrajectory coordinate normal to the scattering plane. It was found that the maximum variance in thephase shift always occurred for detectors 1 and 2 andalways occurred for trajectories along the edge of theprobe volume farthest from the receiver.This iswhat one might expect, because this is the trajectorywhere reflective contributions to the total scattered-light signal are maximized. Figure 3 is a plot of thevariance in p12 expressed as a percentage of the av-erage q12 as a function of droplet diameter for theoptical configuration of case 1 given in Table 1.Droplets much smaller than the probe diameter dis-play little phase variance as a result of the nearlyuniform illumination of these small droplets. Asdroplet size approaches the probe diameter, the rel-ative reflective contribution increases for trajectoriesalong the far edge of the beam waist, which causes anincrease in the phase variation as the droplettraverses the probe volume..As the droplet size fur-ther increases, the reflective contribution begins todecrease because the reflective and refractive inter-rogation areas are beginning to separate in space andin intensity. As a result, for droplets much largerthan the beam diameter, there are only refractive-dominatedorrreflective-dominatedttrajectories.Within the 10:1 intensity range,there are onlyrefractive-dominated trajectories. For droplets Table 1.1.Parameters of Optical Configuration for Experiments andModel Calculations Case Case Optical Parameter 1 2 Beam separation (mm) 21 20 Transmitter focal length (mm) 470 500 Receiver focal length (mm) 500 500 Scattering angle (deg) 30 30 Initial beam diameter (mm) 9.6 2.0 1/e beam waist diameter (um) 352 Slit width (um) 100 Receiver magnification 2.0 2.0 Receiver lens diameter (mm) 105 105 Laser wavelength (nm) 514.5 514.5 Fringe spacing (um) 11.52 12.87 S12 (mm) 23.34 23.34 S13 (mm) 69.00 69.00 S13/S12 (mm) 2.96 2.96 Sample rate (MHz) 160 4 Sample size 64 larger than ~100 um there is again an increase inphase variance, probably as a result of the large vari-ation in illumination intensity over the refractive in-terrogation region, which is approaching the beamwaist diameter. The effect of phase variance on the response of theinstrument is strongly dependent on the duration ofthe sampled Doppler burst and the droplet velocity.For a minimum sample time of 0.2 us and a dropletvelocity of 150 m/s, the maximum sampled pathlength would be 30 um,which is less than the 60-umpath length shown in Fig. 3. Inasmuch as the phasevariance is fairly linear with path length, the maxi-mum variation in 12 for a 60-um droplet would be(30um/60 pm)×15%, which is equal to 7.5%.Thissmall variation in phase over the sampled burstwould slightly decrease the SNR of the Fourier-transformed signal but would not cause a substantialmeasurement error. 5. Probe Volume Correction A..Conventional Probe Volume Correction It is well known that the cross-sectional area of theprobe volume varies with the particle diameter thatis being measured.7 This is due to the nature of theGaussian intensity distribution at the probe volumeand the fact that droplets much larger than the wave-length of light scatter light in proportion to thesquare of the droplet diameter. Larger particles willscatter more light and therefore be detected fartheraway from the center of the probe volume than willsmaller particles. A correction factor, commonly re-ferred to as the probe volume correction (PVC), isusually employed in commercial signal-processingsoftware and takes this into account. The softwareused in this study offered a PVC based on either ananalytical correction or a transit time correction thatmeasures the maximum path length for each particlesize class and assumes that this length is equal to the maximum probe diameter for that size class.Thecorrected number of counts in each size class is cal-culated as where L max is the maximum path length through theprobe volume, which occurs for the largest dropletsize class, and L(D) is the measured maximum pathlength for each size class.8This PVC does not, how-ever, take into account the decrease in the width ofthe probe volume when intensity validation is used toclip the edges of the probe volume to eliminatetrajectory-dependent scattering errors.5.A new PVCbased on the estimated diameter of the probe volumefor each size class at the minimum intensity cutoff istherefore needed. B. Signal Dynamic Range and Intensity-Based ProbeVolume Correction In a typical spray, the range of measured dropletsizes can be quite large. The PDI instrument usedin this study was capable of sizing droplets over adynamic size range of 50:1, with the limit being thedynamic range of the photomultiplier tubes (PMT's)and detection electronics.The dynamic range isbounded by signal saturation on the PMT’s and theminimum signal that can be measured at a fixedSNR.Ibrahim et al.4 have shown that a DFT-basedsignal processor is capable of making reliable phasemeasurements at a SNR as low as -10 dB. The useof a 10:1 intensity-validation criterion within eachsize class would produce an intensity dynamic rangeof 25,000:1.The signal processor used here was ca-pable only of measuring a scattered-light intensityrange of 1,000:1. One can overcome the dynamic range limitation bysetting the maximum intensity of a droplet as onethird of the maximum measurable droplet size to justsaturate the detector, ,I sIasta.t .FFor the optical config1-ration of case 1 in Table 1 and a droplet size range of50:1, the maximum droplet size, Dmax, is 310 pm forwater droplets in air.Droplets larger than Dmax/3will tend to saturate the instrument, with a droplet ofdiameter Dmax having a theoretical maximum scat-tering intensity of 9Isat. It is important that weknow not the intensity of these larger droplets butthat their scattering intensity is above 0.9Isat, whichis the 10:1 lower intensity cutoff for this size class.It should be pointed out that, although signal satu-ration does degrade the SNR, the affect on phasemeasurement accuracy is minimal because of thestrong signal and thus the high SNR. The smallest measurable droplet size of Dmax/50(for a 50:1 size range) would yield a maximum scat-tering intensity of 3"(1/50)"Imax.For the signal pro-cessor used here, the minimum measurable signalwas~0.5 mV, but the minimum signal required toproduce an instrument trigger was 1 mV. For drop-let sizes with a signal less than 1 mV within the probevolume defined by a 10:1 intensity range, a correction Fig. 4. Calculated probe diameter (D') versus droplet diameter;analytical PVC and 10:1 intensity PVC. factor must be employed that accounts for the re-duced probe cross-sectional area over which measure-ments may be made. For the optical configurationstudied here, a 14.6-um droplet would produce amaximum scattering intensity of 10 mV for an Isat of500 mV. For droplets in the size range of 6.2-14.6um, a probe volume correction factor must be em-ployed. The diameter of the probe volume for drop-lets in this size range is simply the diameter of theGaussian probe beam at which the scattering inten-sity equals 1mV. Assuming a Gaussian intensity distribution in theprobe volume, the width of the beam waist at thelower cutoff point (D') can be calculated. TheGaussian intensity distribution at the beam waist isgiven by where Io is the intensity at the center of the beamwaist and y'is the distance from the center normal tothe beam propagation direction. For the present op-tical configuration (case 1, Table 1), Dw10%=64 pm.With a 14.6-um droplet producing a peak scatteringintensity of 10 mV, the probe diameter at the 1-mVdetection limit would be For droplets larger than 14.6 um,D’is fixed at 64um. A plot of the probe diameter calculated fromthe intensity cutoff scheme [Eq. (4)]and the currentlyemployed analytical PVC from the commercial soft-ware used here is shown in Fig. 4. The intensity-based probe volume is constant at 64 um for dropletsfrom 14.6 to 310 um. .For droplets smaller than 14.6um, Eq. (4) is used.The analytical PVC currentlyemployed in the commercial software has a probe 6.Implementation of Intensity Validation The intensity-validation technique can be imple-mented by setting of the maximum intensity to be atsaturation,Isaty for a droplet size equal to one third ofthe maximum measurable size DmaxThe maxi-mum intensity line then follows an IDrelation-ship for the other droplet size classes. For the measurements presented here, the PMTvoltage was set above 400 V to ensure that the PMT'swould respond linearly with scattered-light intensity.Linearity was verified experimentally with a mono-dispersed droplet experiment.L.The signal·processing software employed an intensity-validationsetup page in which data were collected and a plot ofdiameter versus the square root of intensity was dis-played. Laser power or PMT voltage was then ad-justed until the maximum intensity reading in eachsize class fell upon the upper intensity cutoff lineData were then collected and postprocessed to rejectparticles in each size class with an intensity less than10% of the maximum intensity within that size class.The PVC described above was employed to accountfor the smaller probe diameter for droplets less than14.6 umin diameter. The probe cross-sectional area described in Eq. (5)is a parallelogram defined by the receiver slit andprobe diameter as given in Fig. 4: Inasmuch as the receiver is imaging only a small spoton the droplet surface, dropletss are essentiallytreated as point sources of mass passing through theprobe cross section. This allows a droplet muchlarger than the probe cross section, along with all thedroplet mass flux, to be counted as being entirelywithin the probe area. In a spray where the droplettrajectories are generally Poisson distributed therewill also be instances in which the interrogation re-gion passes outside the probe cross section and is notmeasured, yet some of the droplet does pass throughthe probe. As long as enough droplets are sampledin a spray (typically >5000) the stochastic nature ofthe trajectories will ensure that these sampling cross-sectional variations are averaged out, so Eq. (5) doesindeed represent the true probe cross-sectional areafor mass flux calculations. . The corrected number of counts for each size classis given by where Ap10 area(beam waist diameter (64 um) at the lower-intensitycutoff for droplets larger than 14.6 um in diameter.The technique of monitoring the scattered light in-tensity and adjusting PMT voltage or laser power is necessary because light extinction caused by sprayattenuation and window reflections can cause the ab-solutescattered lightintensityto vary.. Theintensity-validation scheme, however, relies not onabsolute scattering intensity but only on scatteringintensity relative to the maximum measured inten-sity within each size class. Another benefit of this technique is pthvatT iwt providesa tractable method for setting the PMT voltage andlaser power.Several studies have shown a sensitiv-ity of the measurement to the PMT voltage setting ata given laser power.79 The informational feedbackof the intensity-validation method allows the user ofthe instrument to preselect an upper intensity-versus-diameter relationship and set the PMT volt-age to match that relationship. The intensity-validation scheme described hereinwas calculated for a particular size range correspond-ing to the optical configuration used in this study. Asimilar PVC could be generated for any size range of50:1 or less, as long as the saturation point is set fora droplet that is one third of the maximum measur-able droplet size. Also, it is not necessary that theresponse of the detector be linear with scattered lightintensity. As long as the instrument response isknown, the linearized intensity can be calculated andused in the intensity-validation scheme. In fact, anonlinear detector could be used to increase the dy-namic range of measurable droplet sizes. 7.Spray Measurements Using the 10:1 intensity-validation scheme and asso-ciated PVC, we performed measurements with a di-lute water spray to demonstrate the technique..ThePDI instrument used in this study was the same asdescribed in Ref. 2. The spray came from a DelavanWDB 10-45°nozzle operated at 0.34 MPa and at at-mospheric backpressure. Measurements of dropletsize, velocity, and volume flux were made as a func-tion of radial position in the spray at a location of 10cm downstream of the injection point. Measure-ments were made with both the current small probevolume configuration (case 1, Table 1) and a moreconventional probe volume (case 2, Table 1), with andwithout intensity validation.Measurements of vol-ume flux are presented in Fig. 5 along with the vol-ume flux measured with a collection tube.Weassessed the accuracy of the collection tube measure-ment by integrating the radial flux profile and com-paring it with the measured injected flow rate..Theintegrated collection tube measurement was 8%lower than the measured injected flow rate..AAs canbe seen from the figure, without intensity validationthe PDI measured volume flux is much larger thanthe collection tube measurement, even with thelarger probe volume.This is a result of small par-ticles’ passing through the edges of the probe volumeand being erroneously measured as much larger par-ticles, thus greatly adding to the measured volumeflux.. Good agreement between the collection-tube-measured volume flux and the volume flux measuredwith the small probe volume and 10:1 intensity- Fig.5.5. Volume flux versus radial position. Delavan WDB 10-45°nozzle, P=0.34 MPa,Z=10 cm. validation scheme can be seen in Fig. 5. These ex-perimentswere conducted before the detectorseparation ratio was changed to a noninteger number(S13/S12=2.96), which would allow droplets largerthan 150 pm to be measured as smaller droplets.The maximum valid droplet size was just under 150um for this particular spray, and intensity validationalone was sufficient to permit rejection of erroneousmeasurements. Figure 6 shows a scatter-plot droplet diameter ver-sus the square root of the scattered light intensity fora radial position of9 .09 mm Alse shown.0 mm.isl wn are ehigh-and low-intensity lines. The suspect particlesare those larger than~150 um, which show only lowscattering intensities. Figure 6 also reveals anotherimportant advantage ofusing intensity validation,which is the ability to detect multiple-droplet occur-rences in the probe volume.For single-droplet oc-currences,a sharp cutoff in the data near themaximum scattering line would be observed, as inFig. 6. Because two or more droplets coincident inthe probe volume would scatter significantly morelight, multiple-droplet occurrences would show up as SQRT(I) Fig. 6. Scatter plot of droplet diameter versus square root ofintensity. Delavan WDB 10-45° nozzle,P=0.34MPa,Z=10 cm,r=0.0 mm. 8624 (a) 50 100 150D (um) 200 250 300 86 24 (b) 0 50 100 150 200 250 300 D(pm) Fig. 7. Histograms of relative volume percentage.DelavanWDB 10-45°nozzle,P=0.34 MPa, Z= 10 cm, r =0.0 mm; (a)without intensity validation, (b) with intensity validation. scattering in the data at intensities greater than theupper intensity line. Figure 7 is a histogram of the relative volume con-centration for the radial location of 0.0 mm with andwithout intensity validation, demonstrating the sig-nificant change in volume distribution in a real spraywhen trajectory-dependent errors are eliminated..Itis interesting that even with a maximum droplet sizeof 150 pm, the mass flux measured with the 352-umprobe diameter (Fig. 5) was still significantly greaterthan the mass flux measured with the collection tube.This could be a result of the slit effect discussed inRef. 2,which showed an increase in the number ofmeasurement errors when the slit was accounted forwith the larger beam waist diameter. 8. Conclusions Although there are certain practical limitations onminimum usable probe diameter, current DFT-basedsignal processors are quite capable of making accu-rate droplet-size measurements for relatively smallprobe diameters and high flow velocities. Opticallimitations such as on signal visibility can be over-come by proper selection of the beam crossing angleor detector aperture.Droplets much larger than thebeam waist can be measured when a combination ofphase-ratio and intensity-based validation criteriaare used. An intensity-based probe volume correc-tion factor has also been shown to provide a simpleand robust way to calculate the probe cross-sectionalarea.The implementation of the technique also pro-vides a tractable method for determining the appro-priate laser power and PMT voltage during anexperiment.C.Measurements in dilute sprays havedemonstrated that the technique is capable of reject-ing trajectory-dependent; scattering errors whilegreatly improving the accuracy of liquid flux mea-surements. The authors thank Mike Griggs for his assistancein operating the facility and conducting experiments. References ( 1. S . V. Sankar and W. D. Bachalo,“Performance ana l ysis of v ar- ious phase D oppler systems," presented at the F ourth Interna-tional Congress o n O p tical Pa rticle S izing, Nuremberg, Germany, 21-23 March 1995. ) ( 2. P. A. Strakey, D. G . Talley, S. V. Sankar, a nd W. D . Bachalo, “Phase-Doppler interferometry with probe-to-droplet size ratios less than unity. I. Trajectory errors,”Appl. O pt. 39, 3873- 3884 ( 2000). ) 3. P. Haugen, E. I. Hayes, and H.-H. von Benzon, “Size and veloc-ity measurements of large drops in air and in a liquid-liquidtwo-phase flow by the phase-Doppler technique,”Part. Part.Syst. Charact. 11, 63-72 (1994). 4. K. M. Ibrahim, G. D. Werthimer, and W. D. Bachalo,“Signalprocessing considerations for laser Doppler and phase Dopplerapplications,” presented at the Fifth International Symposiumon the Application of Laser Techniques of Fluid Mechanics,Lisbon, Portugal, 9-12 July 1990. 5. Y. Hardalupus and C. H. Liu,“Implications of the Gaussianintensity distribution of laser beams on the performance of thephase Doppler technique. Sizing uncertainties,”Prog. EnergyCombust. Sci.23, 41-63 (1997). 6. G. Grehan, G. Gouesbet, A. Naqwi, and F. Durst,“Trajectoryambiguities in phase Doppler systems:study ofa nearforward and near-backward geometry,"Part. Part. Syst. Char-act. 11, 133-144(1994). ( 7 . W.D . B a chalo,R. C. Rudoff, and A. B r ena de la Rosa,“M a ss fluxmeasurements of a high number density spray system using thephase Doppler p a rticle a nalyzer," paper AIAA 8 8 -0236, p r e- sented at the Twenty-Sixth Aerospace Sc i ences Meeting, Reno,Nev., 11-14 January 1988. ) 8. Aerometrics Phase Doppler Particle Analyzer Doppler SignalAnalyzer, 1-Component User’s Manual, Release 1.0, April(Aerometrics Inc., Sunnyvale, Calif., 1993), App. B. ( 9. C.-P. Mao,“Measurements of sprays using phase Doppler in - struments: a s tudy to establish formal operating procedures,”presented at the Ninth Annual Conference on L iquid Atomiza- tion and Spray S ystems, San Francisco, Calif., 19-22 May 1996. ) August / Vol. No. APPLIED OPTICS PPLIED OPTICS / Vol. No. August
确定
还剩5页未读,是否继续阅读?

产品配置单
北京欧兰科技发展有限公司为您提供《喷雾,液滴中液滴粒径,液滴运动速度检测方案(干涉仪)》,该方案主要用于其他中液滴粒径,液滴运动速度检测,参考标准--,《喷雾,液滴中液滴粒径,液滴运动速度检测方案(干涉仪)》用到的仪器有激光相位多普勒干涉仪LDV,PDI,PDPA,PDA

相关方案
更多
该厂商其他方案
更多